
Submitted:
05 August 2025
Posted:
05 August 2025
You are already at the latest version
Abstract
Diabetes mellitus is a chronic condition that often leads to peripheral neuropathy, characterized by pain, tingling, and reduced sensitivity in the lower limbs. These symptoms increase the risk of foot ulcers and amputations, mainly due to elevated plantar pressures from mechanical overload. Standard prevention methods include custom footwear or insoles designed to redistribute weight and accommodate foot de-formities. However, static insoles have limited effectiveness, as plantar pressure points shift over time, requiring frequent adjustments that increase both costs and waiting times. Moreover, static offloading may transfer stress to adjacent areas, potentially triggering new ulcerations. While prior research has introduced cellular metamaterials for dynamic plantar pressure redistribution, this study advances the field by developing a complete, application-oriented workflow for physical prototyping and mechanical validation of such structures. The proposed pipeline leverages Thermoplastic PolyU-rethane (TPU) material extrusion, enabling the fabrication of customized and test-ready prototypes suitable for gait simulation and potential in vivo trials. The cellular unit's compressive behaviour was assessed through theoretical force threshold estimations and experimental compression tests, leading to a data-driven optimization of the unit cell geometry and arrangement for effective dynamic offloading. This study reaches the mechanical validation of the cellular unit under static compression, laying the groundwork for future integration into full-scale orthotic devices and clinical evalua-tion. By bridging the gap between conceptual design and real-world implementation, this work offers a scalable and adaptable solution to improve diabetic foot ulcer pre-vention and supports the development of personalized, next-generation orthotic sys-tems.
Keywords:
negative stiffness
; lattice structures
; Thermoplastic PolyUrethane
; TPU
; midsoles
; Diabetes mellitus
1. Introduction
Diabetes mellitus is a chronic condition characterized by insufficient insulin production or resistance leads to hyperglycaemia, causing severe organ damage [1]. Without proper control, diabetes can lead to complications such as peripheral neuropathy and causing tingling, pain, and reduced sensitivity in the lower limbs, a major symptom of diabetic foot. Diabetic foot involves changes in the lower limbs, leading to ulcers and potential amputation caused by increased plantar pressure due to excessive mechanical load [2,3]. Thus, the prevention focuses on reducing plantar pressures by prescribing custom-made footwear or orthotics to accommodate foot deformities by redistributing loads[4,5]. Patient-customized cushioned insoles of different materials can redistribute the plantar pressures; however, this static unloading mechanism does not prove effective because the sites of high pressure tend to change over time thus implying frequent changes with consequent costs and timing. The static pressure relief mechanism also does not provide adequate control of pressures, as the areas most subject to repetitive stress are unloaded by transferring the load to other plantar zones, which in turn become at risk of ulceration. Within this scenario, the availability of dynamic unloading mechanism-based insoles that can adapt to changes in plantar pressures is a challenge to be pursued.
The aim of this paper is to propose a methodological approach for the design and characterization of novel cellular metamaterials, based on compliant mechanisms, for the fabrication of diabetic foot orthoses capable of redistributing plantar pressures. The paper presents, from both a methodological and experimental perspective, the tuning of the FFF process and the mechanical characterization of the bulk material. The mechanical behaviour of the unit cell is also investigated through an analytical model and compared with experimental results. Finally, the complete midsole design approach is developed, while the manufacturing of the full shoe incorporating the designed midsole, along with its characterization, is planned as part of future work.
2. Background
Through the rational design of size, shape and topology, components based on specific materials can achieve distinct and exotic mechanical properties. Such structures, when subjected to external stresses undergo structural changes that determine their mechanical response [6]. Deviations from normal elastic behaviour are embedded in the deformation modes encoded within their geometry. Among these structures, those capable of absorbing energy [7], play an important role; an adequate design allows energy to be stored during deformation by exploiting the bending of specific constituent segments. These yielding mechanisms, achieve movement without the use of kinematic torques, relying on the deformation of their parts. In several cases, the design of yielding mechanisms is based on elastic elements exhibiting 'snap-through' buckling behaviour. In the elastic regime, snap-through behaviour refers to a buckling type allowing the structure to pass abruptly from one configuration to another under external loads beyond critical values. The different morphologies assumed by yielding structures allow multiple states, including multistability conditions. Multistability refers to a structure's ability to reach and maintain stable positions different from its original position due to deformation energy accumulation during movement [8]. In the case of certain cellular metamaterials, such as hexagonal honeycomb cells, considerable energy is absorbed, often due to plastic deformation, making the absorbed energy unrecoverable and pre-venting reuse of the structure. Several studies have focused on designing monostable structures that exploit similar buckling concepts but remain in the elastic field, allowing them to return to their original shape once the load is removed. Recent literature presents innovative honeycomb cells with negative stiffness that provide high levels of initial stiffness, compressive strength, and energy absorption, in reversible manner [9]. Reversibility in the deformation of metamaterial structures is often achieved by exploiting the bistability of straight inclined beams or sine-shaped beams. This strategy is widely adopted as the deformation of such structures is elastic, allowing for recoverable energy absorption and a return to the original shape in the absence of loads. The curved-beam bistable mechanism exploits the bi-stability of transversely loaded sinusoidal beams; due to the yielding of the curved beams, the structure exhibits negative stiffness behaviour, programmable based on the geometric parameters of the beam[10]. Unlike elastic elements with a positive slope of the force-displacement curve, elements with negative stiffness show a reduction in force values as displacement increases, creating a region of negative stiffness. This behaviour can be exploited to achieve recoverable energy absorption in elastic systems, preventing forces above a given threshold from being transmitted to an isolated mass. Within this paper we aim at combining the concepts of cellular materials and the possible reversibility of compliant structures, through the design of a novel class of metamaterials with specific deformation and energy absorption capabilities. To address this, one strategy is to incorporate the curved beams with negative stiffness in configurations similar to traditional honeycombs thus combining high initial stiffness and reversible energy absorption, achieved by programming each cell to deform itself for specific force thresholds. In this context, the proposed geometric model has been validated and tested on the basic cellular structure and on its three-dimensional repetitions, laying the foundation for the development of smart customized midsoles capable of automatically redistributing the load when a localized pressure threshold is exceeded.
3. Materials and Methods
A methodological approach to the design and development of architected materials is proposed to embed the lattice structure with the intended mechanical and functional requirements. The proposed workflow, summarized in Figure 1, integrates geometric parametric design, material characterization, and functional modelling to guide the development of smart lattice-based midsoles from a unit cell model. The approach addresses key requirements such as the implementation of a reversible offload mechanism (i.e. negative stiffness behaviour) and its printability through Fused Filament Fabrication (FFF) Additive Manufacturing (AM) processes.
3.1. Geometric Modelling
Negative stiffness can be achieved by managing the shape of the structure elements and their geometric relationships, selecting from various options available in the literature [11,12,13] . For the purpose of this study, a cellular structure based on a honeycomb with sinusoidal curved elements was selected [14,15,16]. Depending on elements dimensions, this cellular structure can exhibit different mechanical behaviour (i.e. stable or bistable behaviour). Figure 2 shows the unit cell. The highlighted parameters define the overall dimensions of the structure and refer to the parameters listed in Table 1. The geometric parameters were selected based on the application, considering the results of analytical, numerical or experimental models, as described below. The minimum height H/2 considers the deformation of the beams in such a way that, once fully deformed, they do not come into contact with the horizontal supports, thus altering the behaviour and compression response of the cells.
3.2. Material
In general, the material can be selected by adopting methodological approaches which provides optimal solution for a specific design context [17]. In this work, Thermoplastic PolyUrethane (TPU) material was selected for its properties between the characteristics of plastic and rubber such elasticity, abrasion resistance and weather resistance including exposure to UV light and moisture which make it suitable for applications such as midsoles. TPUs combine the mechanical performance of rubber with the processability of thermoplastics, effectively bridging the gap between rubber and plastics [18]. This enables TPU to be widely employed in Fused Filament Fabrication (FFF) [19]. To integrate the information provided by the manufacturers, FFF parameter tuning and mechanical characterization tests were carried out, ensuring that the entire AM process was appropriate for the fabrication of the proposed structures.
3.2.1. Process Tuning
In the context of FFF, tuning refers to the process of optimizing various parameters, such as temperature, print speed retraction and flow rate, to achieve the best possible print quality and performance. Because of its elastic properties and its FFF printability, the use of TPU material has been widely characterized in literature [20,21,22]. Nevertheless, every specific TPU needs a fine tuning to outperform in a specific 3D printer. Temperature and printing speed play a fundamental role in the delamination and integrity of the parts. To ensure proper adhesion between layers, it is advisable to increase the temperature; optimal results have been obtained with a temperature of 5°C higher than the recommended value [22]. Although not all TPU filaments have the same ideal printing temperature, in several cases, the best results were obtained with a nozzle temperature of 230°C [23]. In the specific case of TPU, optimal results were achieved by maintaining a slow and constant printing speed. Given the nature of the material, it is suggested to keep a speed around 15-20 mm/s [23], but even at 30 mm/s, good quality was obtained while reducing printing times [22]. To address the problem of stringing (i.e. "strings" of filament between parts of a print, caused by excess material oozing from the nozzle during travel moves), it is recommended to reduce the retraction speed while increasing the retraction distance to prevent unwanted material oozing. In general, reducing the retraction speed proportionally improves the final quality; to achieve these results, a speed of 25 mm/s has been found optimal [20]. Adhesion to print bed, particularly of the first layers, is a crucial step. To obtain better prints, setting the print bed to a moderate temperature between 40-60°C is sufficient [23]. Another parameter to consider for improving print quality, especially in elastic materials, is the extrusion flow parameter. The tuning of this parameter is necessary to avoid under-extrusion. This value is expressed as a percentage and determines the amount of extruded material; increasing it, means increasing the volume of filament introduced into the nozzle, thereby increasing the extruded material and the possibility of adhesion between layers. To precisely identify the Flow value to be set, it is necessary to follow a systematic calibration procedure to ensure an optimal volumetric flow rate for the printer used [24]. The first, five measurements of the filament diameter on the filament cross-section, approximately 10 cm apart from each other, are collected by using a caliper. From the obtained values the average diameter is calculated, and the actual filament diameter is then set in the slicing software. The actual thickness of the printed walls was subsequently compared to the nominal values. For this purpose, a test cube (Figure 3) consisting of 2 walls and 0% infill was printed. The values for layer height, temperature, and printing speed were kept (Table 2). Once the printing of the test cube is completed, its walls are measured on all sides, and the FLOW is calculated using the formula . A Sovol SV04 FFF printer was used for the fabrication process.
3.2.2. Mechanical Characterization
Hardness test
The ISO 868:2003 standard provides guidelines for determining the indentation hardness properties of plastic materials. According to this standard, two types of durometers, type A and type D, are employed to measure Shore A and Shore D hardness, respectively. Each durometer, consists of a pressure foot, approximately 3 mm in diameter, at the centre of which is located the indenter, a hardened steel rod with a diameter of about 1.25 mm. The adopted specimen is depicted in Figure 4a. The testing procedure involves placing the specimen on a hard, horizontal surface, holding the durometer vertically, and applying the pressure foot onto the specimen as quickly as possible while keeping it parallel to the surface. Once a stable contact between the foot and the specimen is achieved, the measurement is taken within 1 second. Five measurements at different positions allow for calculating the average hardness value.
Tensile test
To determine key mechanical properties such as the material’s elastic modulus, tensile tests were performed. Along with hardness measurements, tensile testing is one of the most common mechanical tests used to characterize material behaviour. The ISO 527-2:2012 and ISO 527-1:2019 standards specify the general principles for determining the tensile properties of plastic materials under defined conditions and describe the methods for conducting these tests as well as the resulting stress-strain curves along with the relevant parameters. The printed specimens, shaped like a “dog bone,” were designed according to the standard dimensions, with a gauge length of L0 = 20 mm (Figure 4b). Three specimens were printed for tensile testing.
Tensile tests were executed on an MTS Acumen 3 Electrodynamic Test System equipped with a 3 kN load cell and an MTS 634.31 F extensometer. The speed rate was 1 mm/min, the data acquisition rate was set to 20 Hz, and the gauge length was 20 mm. Stress-strain curves were plotted and Young’s modulus, ultimate tensile strength (UTS), and strain at break () were calculated.
3.3. Cell Mechanical Property Modeling
An analytical model of the unit cell (or half-cell) can be employed to establish the key parameters required for modelling the cell behaviour in accordance with the specific application and its functional requirements (i.e., compliant reversible mechanism, threshold force and corresponding deformation). Such modelling approach is also essential for identifying the interdependencies among geometric parameters governing the deformation mechanisms, thereby supporting the design of a focused and effective experimental campaign, which is necessary to validate and/or refine the analytical model. Other models not employed in the present study, such as finite element models, can be used to analyse the mechanical behaviour of the cell.
3.3.1. Analytical Model
The curved-beam mechanism design is inspired by buckled straight-beam mechanisms, where a straight beam is compressed to buckle into stable positions on either side. Modelling these buckling modes is essential for accurately representing the curved-beam mechanism. As highlighted in the literature, the parameter governing the force-displacement behaviour is =h/t. A possible model for a single beam is
where F is the normalized force, f is the force, is the normalized displacement, the displacement, the elastic modulus and the moment of inertia [10] (see Figure 2 and Table 1 for the meaning of the other parameters).
The double beam arrangement allows the structure to support twice as much force as a single beam and enhances its effectiveness in energy absorption. The force threshold compared to a single beam is increased, and complex buckling modes are prevented, ensuring negative stiffness [14]. Consequently, the double beam configuration is selected for the present work and the formula updated with a scale factor of 2. Thus, the analytical model of the half-cell can be expressed by the following equation:
Depending on the value of , Equation 4 exhibits the trend shown in Figure 5Error! Reference source not found.. This function can exhibit both a maximum and a minimum, which can be identified by setting the first derivative of Equation 4 equal to zero. This occurs when the normalized displacement is:
In this context, the negative value corresponds to the maximum normalized force , while the positive value indicates the minimum normalized force , as computed using Equation 5.
By analysing Equations 5, and 6, for a perfectly elastic material with perfectly rigid boundary conditions, a value greater than indicates bistability, i.e., the minimum of Equations 1 and 5 is lower than zero. Similarly, for less than , the mechanism does not exhibit negative stiffness. Consequently, for the application considered in the present study, should ideally range between 1.15 and 2.31. However, for certain materials, experimental results show that the honeycomb structure does not exhibit bistability up to approximately [25]. Moreover, considering the selected material, i.e., TPU, the constitutive model is non-linear and the mechanical behaviour is strain-rate dependent. Phenomena such as softening, hysteresis (with different loading and unloading paths), stress relaxation under constant strain, creep, and residual strain—especially after the first cycle—are observed. Additionally, the mechanical response changes with the number of cycles, tending to stabilize after a few repetitions [18]. Some of these effects, under established conditions, could be accounted for by introducing an empirical correction coefficient in Equation 5, which should be experimentally determined and will be the objective of future works.
3.3.2. Unit Cell Experimental Tests
To establish the physical relation between force and displacement, the unit cell structure was subjected to compression testing using the MTS Acumen® Electrodynamic Test Systems machine. The tests were performed maintaining a speed of 10 mm/min and following a loading-unloading cycle with amplitude 2h (see Figure 2 (a)). To carry out the tests, the structures were positioned as in Figure 6 on a rigid support plane, centrally to the loading cylinder. To simulate the constraint conditions of adjacent cells and to prevent lateral deformation of the vertical walls, the structures were positioned within the two vertical rigid supports shown in Figure 6. The application of these constraints is necessary to achieve a mechanical response equivalent to that of multiple consecutive cells.
Based on the preliminary analysis of the analytical model and of the functional requirements, the chosen geometrical parameters for the experimental tests are reported in Table 3, by considering mm, mm, mm, mm, mm, .
3.3.3. Cell Parameters Dimensioning
Based on the described models and considering the functional requirements, it is possible to determine the cell's geometrical parameters using a trade-off approach. The choice of the dimensions for the double-beam cell, were set empirically by taking into account several aspects: (i) the intended deformation capability, (ii) the ability to respond to pressures like those expected for diabetic foot application, and (iii) the manufacturability through available technologies (FFF in the present study) [26].
Based on the desired behaviour, it is possible to set within the range of 1.15 to 2.31, considering that values of close to 1.15 lead to a smaller difference between and .
Equations 2 shows that the parameter h has a significant influence on the deformation at which the mechanism transitions to the negative stiffness regime. As a first approximation, this transition can be assumed to occur when , or alternatively, it can be calculated using through Equation 6. Consequently, once the deformation at which the regime change occurs is established, the value of h can be determined according to:
After choosing the h parameter, t can be calculated according to :
The critical pressure , at which load redistribution is necessary to avoid the effects of prolonged high plantar pressure in diabetic patients, is 200 kPa [26]. This pressure can be determined by the ratio between and the cell area:
By substituting Equations 3 and 4 into Equation 9, the critical pressure can be expressed as a function of the maximum normalized force and the relevant geometric and mechanical parameters:
Observing Equation 10, it can be seen that the parameter has no influence on the pressure threshold. The maximum normalized force depends solely on , is an intrinsic material property, and and have been previously defined. Consequently, the only parameter to be determined is L.
The other parameters have no significant influence on the results and can be selected based on manufacturing constraints or to minimize the overall cell dimensions. These results should be corrected by a coefficient derived from experimental data.
3.4. Midsole Development
Figure 7 illustrates the procedure for modelling the midsole, taking into consideration the manufacturing steps. Based on the above considerations and experimental results, a unit cell is modelled using the geometrical parameters reported in Table 4.
To decouple the stress between adjacent elements, the whole midsole can be modelled as a set of stripes of cells (Figure 7a). Techniques based on free-form deformation (FFD) adopting non-uniform rational basis splines (NURBS) allow conforming a regular lattice structure to the real sole shape [27] Figure 7b) shows the shape of the bottom surface of the insole, extended to its bounding box to avoid excessive deformation of the stripes during the FFD process and simplify the 3D printing process. The result of the FFD is shown in Figure 7c). The deformed stripes are then limited to the volume between the outer sole and the insole (Figure 7d). The stripes are rotated to avoid overhang and supports during the 3D printing process (Figure 7e). Before being inserted into the outer sole, the stripes shall be joined by some further curved layers. This is achieved by developing a specific fixture (Figure 7f) that is used for positioning the single stripes (Figure 7g) in the FFF 3D printer. At the end of the printing of the fixture, the process is paused, the stripes are positioned, and the process restarts following a specifically developed toolpath Figure 7h). Figure 8shows the proposed manufacturing process on flat stripes, which takes inspiration from a previous work [28]. Finally, the midsole can be inserted into the outer sole as shown in Figure 7i).
3.4.1. Final Testing
Due to the deformations that occur during the geometric modelling process to adapt the cell to a curved surface, the actual dimensions of the cell elements may slightly differ from those of the initial design. In addition to the objectives of the present study, it is therefore necessary to manufacture and test the proposed system under real-life conditions, such as during walking, to verify the actual behaviour of the midsole. This can be achieved by integrating one of the systems available in the literature for measuring foot plantar pressure [29].
4. Experimental Results
To evaluate the mechanical response of the proposed structures the results of the experimental test and analytical model are reported and compared in this section.
4.1. Material Characterization
4.1.1. Manufacturing Process Tuning
As part of the tuning procedure, five measurements of the filament diameter were taken (Table 5). The average value was subsequently computed and set as the actual filament diameter in the slicing software.
To calculate the optimized flow rate, the model shown of Figure 3 was manufactured using the process parameters listed in Table 2. Table 6 reports the measured wall thickness, which is compared to the nominal value (0.8 mm), resulting in a flow rate calculated as:
This value, approximated to 104%, was then used in the slicing settings for all subsequent tests.
4.1.2. Mechanical Characterization
To evaluate the mechanical response of the printed TPU material, hardness tests were conducted on cylindrical specimens. As shown in Figure 9, the tested sample consists of a vertically printed cylinder, for which measurements were taken on the bottom layer, the top layer.
The results of the measurements are reported in Table 7. According to hardness measurement standards, a Type A durometer is recommended when Shore D values are below 20, whereas a Type D durometer is more suitable for harder materials, when Shore A values exceed 90. Given the intermediate range of the measured values, both Shore A and Shore D hardness scales were applied to provide a complete characterization. Notably, the printing process appears to influence hardness slightly: the first printed layer (Bottom layer) resulted on average 5.8% softer than the last printed layer (Top layer). This difference is likely due to variations in surface conformation and thermal history during the printing process. The average Shore hardness values obtained for the TPU specimen were 84.5 HA (Shore A) and 37.2 HD (Shore D). These values confirm the material’s elastomeric behaviour, suitable for cushioning and energy absorption applications.
Figure 10 illustrates the stress–strain behaviour of the dog-bone specimens shown in Figure 4b, which were subjected to tensile testing.
The elastic modulus of the material was calculated as the slope of the fitting straight line in the strain range between 1 and 5%. By analysing the curves, it is possible to derive the mean values of the Young’s modulus (E), ultimate tensile strength, and elongation at break, which are 44.5 MPa, 4.9 MPa, and 20%, respectively.
4.2. Cell Mechanical Properties
Figure 11 illustrates the behaviour of the analytical model in terms of force and displacement, obtained combining Equations 2, 3, and 5 for the case studies considered, while Table 8 summarizes the main characteristics of the tested cells based on the analytical model. It can be observed that increasing leads to an increase in both and increase. Similarly, analyzing the relevant equations, an increase in also results in higher values of , and. Notably, is the only parameter that affects displacement, as greater values of lead to larger deformations (see Equation 2). As previously discussed, the bistability condition depends simultaneously on both and , through the parameter . Among the cases presented, only the configuration t2.0-Q3.0 does not result in bistability. Moreover, increasing , , and , results in a greater force amplitude.
Figure 12 illustrates the fabricated samples along with their deformation mechanism under compressive loading. As can be observed, lateral deformation occurs in the vertical walls despite the presence of rigid vertical supports. This represents one of the factors contributing to the discrepancy between the experimental results reported in Figure 13 and Table 9, and the analytical model. Although the experimental behaviour aligns with the numerical model, the measured maximum force,, is on average 47% lower than the theoretical prediction. Furthermore, bistability is not observed in any of the experimental configurations.
Other differences between the model and the experimental results are related to the constitutive model, which is assumed to be linear in the analytical approach. In contrast, TPU exhibits three different features [18]:
- -
- nonlinear large-strain elastomeric behaviour, as highlighted in Figure 10;
- -
- time dependence, i.e., the material behaves differently depending on the strain rate, as it possible to see from Figure 14, where higher test speed leads to higher force;
- -
- softening of the equilibrium paths observed during cyclic tests, i.e., the stress–strain curve in the second cycle is far more compliant than that observed in the first cycle and stable curves are typically observed after only 4 cycles [18].
Observing Figure 13 and Figure 14 it can be seen that the unloading paths exhibit a large hysteresis loop with residual strain. Additional recovery occurs over time after unloading, as reported in the literature.
Despite the differences between the analytical model and the experimental data, the analytical model adequately captures the influence of the geometrical parameters on the maximum force. Therefore, experimental data can be used to identify the parameter , while the maximum force can be derived from the numerical model by applying an appropriate correction factor.
5. Conclusions
This study aimed to investigate and validate the behavior of compliant mechanisms for the design of diabetic foot insoles capable of redistributing plantar pressures and reducing localized mechanical stress. The focus was on curved-beam-based deformation units, exploiting elastic instability under transverse loading. Analytical modeling and experimental testing were used to evaluate the effects of geometric parameters and to guide optimization strategies. While the concept of dynamic pressure redistribution through architected materials has been previously explored, our contribution lies in the development of an end-to-end workflow—from geometry optimization to physical prototyping—based on accessible and scalable Thermoplastic PolyUrethane (TPU) extrusion techniques. This pipeline enables the fabrication of customized, test-ready prototypes suitable for gait simulation and future clinical use. Experimental compression tests confirmed that the mechanical response of the cellular structures is highly tunable by adjusting material properties, printing parameters, and unit cell configurations. A significant sensitivity to test speed and manufacturing settings was observed, underscoring the importance of process control in real-world applications. The optimized structure demonstrated effective pressure redistribution across multiple load-bearing areas. Additionally, a 3D version of the unit cell was developed and showed performance comparable to its 2D counterpart. This lays the foundation for further refinement of the metamaterial architecture, including multi-layer or hybrid configurations. Future work should explore series cell arrangements, incorporate dynamic loading tests, and develop appropriate numerical and analytical models for the full 3D structure. Overall, this work bridges the gap between conceptual design and practical implementation, contributing a scalable, adaptable, and patient-specific solution for improving diabetic foot ulcer prevention.
Author Contributions
Conceptualization, GS. and F.U.; methodology, G.S.; validation, GS. and F.U.; formal analysis, GS. and F.U.; investigation, GS.; resources, G.S.; data curation, GS. and F.U.; writing—original draft preparation, GS. and F.U.; writing—review and editing, GS. and F.U.; visualization, GS. and F.U.; supervision, GS. and F.U.; project administration, GS. and F.U.; funding acquisition, GS. and F.U. All authors have read and agreed to the published version of the manuscript.
Funding
This work was partially funded by Progetti di Ricerca di Rilevante Interesse Nazionale PRIN 2022, funded under the National Recovery and Resilience Plan (NRRP), Mission 4 Component C2 Investment 1.1 by the European Union—Next-Generation EU project name “GOALS, Green Optimization by Additive-Manufactured Lightweight Structures”, grant number 20228PFA89, CUP master J53D23001980006, CUP C53D23001670006.
Institutional Review Board Statement
Not applicable.
Informed Consent Statement
Not applicable.
Data Availability Statement
The original contributions presented in this study are included in the article. Further inquiries can be directed to the corresponding author.
Acknowledgments
During the preparation of this manuscript/study, the authors used Copilot for improve readability and language of the work. The authors have reviewed and edited the output and take full responsibility for the content of this publication.
Conflicts of Interest
The authors declare no conflicts of interest.
References
- Tomic, D.; Shaw, J.E.; Magliano, D.J. The Burden and Risks of Emerging Complications of Diabetes Mellitus. Nat Rev Endocrinol 2022, 18, 525–539. [Google Scholar] [CrossRef]
- Crawford, F.; Inkster, M.; Kleijnen, J.; Fahey, T. Predicting Foot Ulcers in Patients with Diabetes: A Systematic Review and Meta-Analysis. QJM 2006, 100, 65–86. [Google Scholar] [CrossRef]
- Beulens, J.W.J.; Yauw, J.S.; Elders, P.J.M.; Feenstra, T.; Herings, R.; Slieker, R.C.; Moons, K.G.M.; Nijpels, G.; van der Heijden, A.A. Prognostic Models for Predicting the Risk of Foot Ulcer or Amputation in People with Type 2 Diabetes: A Systematic Review and External Validation Study. Diabetologia 2021, 64, 1550–1562. [Google Scholar] [CrossRef]
- Uccioli, L. Prevention of Diabetic Foot Ulceration: New Evidences for an Old Problem. Endocrine 2013, 44, 3–4. [Google Scholar] [CrossRef]
- Spolaor, F.; Guiotto, A.; Ciniglio, A.; Sawacha, Z. The Effect of Custom Insoles on Muscle Activity in Diabetic Individuals with Neuropathy. Applied Sciences 2023, 13, 2326. [Google Scholar] [CrossRef]
- Jiao, P.; Mueller, J.; Raney, J.R.; Zheng, X.; Alavi, A.H. Mechanical Metamaterials and Beyond. Nat Commun 2023, 14, 6004. [Google Scholar] [CrossRef]
- Azevedo Vasconcelos, A.C.; Schott, D.; Jovanova, J. Hybrid Mechanical Metamaterials: Advances of Multi-Functional Mechanical Metamaterials with Simultaneous Static and Dynamic Properties. Heliyon 2025, 11, e41985. [Google Scholar] [CrossRef]
- Xiu, H.; Liu, H.; Poli, A.; Wan, G.; Sun, K.; Arruda, E.M.; Mao, X.; Chen, Z. Topological Transformability and Reprogrammability of Multistable Mechanical Metamaterials. Proceedings of the National Academy of Sciences 2022, 119. [Google Scholar] [CrossRef]
- Correa, D.M.; Seepersad, C.C.; Haberman, M.R. Mechanical Design of Negative Stiffness Honeycomb Materials. Integr Mater Manuf Innov 2015, 4, 165–175. [Google Scholar] [CrossRef]
- Qiu, J.; Lang, J.H.; Slocum, A.H. A Curved-Beam Bistable Mechanism. Journal of Microelectromechanical Systems 2004, 13, 137–146. [Google Scholar] [CrossRef]
- Tan, X.; Cao, B.; Liu, X.; Zhu, S.; Chen, S.; Kadic, M.; Wang, B. Negative Stiffness Mechanical Metamaterials: A Review. Smart Mater Struct 2025, 34, 013001. [Google Scholar] [CrossRef]
- Correa, D.M.; Seepersad, C.C.; Haberman, M.R. Mechanical Design of Negative Stiffness Honeycomb Materials. Integr Mater Manuf Innov 2015, 4, 165–175. [Google Scholar] [CrossRef]
- Mehreganian, N.; Razi, S.; Fallah, A.S.; Sareh, P. Mechanical Performance of Negative-Stiffness Multistable Bi-Material Composites. Acta Mech 2024. [Google Scholar] [CrossRef]
- Mehreganian, N.; Razi, S.; Fallah, A.S.; Sareh, P. Mechanical Performance of Negative-Stiffness Multistable Bi-Material Composites. Acta Mech 2024. [Google Scholar] [CrossRef]
- Restrepo, D.; Mankame, N.D.; Zavattieri, P.D. Phase Transforming Cellular Materials. Extreme Mech Lett 2015, 4, 52–60. [Google Scholar] [CrossRef]
- Darwish, Y.; ElGawady, M.A. Numerical and Experimental Investigation of Negative Stiffness Beams and Honeycomb Structures. Eng Struct 2024, 301, 117163. [Google Scholar] [CrossRef]
- Ashby, M.F. Engineering Materials and Their Properties. In Materials Selection in Mechanical Design; Elsevier, 2011; pp. 31–56.
- Qi, H.J.; Boyce, M.C. Stress–Strain Behavior of Thermoplastic Polyurethanes. Mechanics of Materials 2005, 37, 817–839. [Google Scholar] [CrossRef]
- Desai, S.M.; Sonawane, R.Y.; More, A.P. Thermoplastic Polyurethane for Three-dimensional Printing Applications: A Review. Polym Adv Technol 2023, 34, 2061–2082. [Google Scholar] [CrossRef]
- Kechagias, J.D.; Vidakis, N.; Petousis, M. Parameter Effects and Process Modeling of FFF-TPU Mechanical Response. Materials and Manufacturing Processes 2023, 38, 341–351. [Google Scholar] [CrossRef]
- Garg, N.; Rastogi, V.; Kumar, P. Process Parameter Optimization on the Dimensional Accuracy of Additive Manufacture Thermoplastic Polyurethane (TPU) Using RSM. Mater Today Proc 2022, 62, 94–99. [Google Scholar] [CrossRef]
- Rodríguez, L.; Naya, G.; Bienvenido, R. Study for the Selection of 3D Printing Parameters for the Design of TPU Products. IOP Conf Ser Mater Sci Eng 2021, 1193, 012035. [Google Scholar] [CrossRef]
- B. O’Neill TPU Print Settings Explained.
- Flow Rate Calibration – Improve Print Accuracy.
- Debeau, D.A.; Seepersad, C.C.; Haberman, M.R. Impact Behavior of Negative Stiffness Honeycomb Materials. J Mater Res 2018, 33, 290–299. [Google Scholar] [CrossRef]
- Maharana, P.; Sonawane, J.; Belehalli, P.; Ananthasuresh, G.K. Self-Offloading Therapeutic Footwear Using Compliant Snap-through Arches. Wearable Technologies 2022, 3, e7. [Google Scholar] [CrossRef]
- Dal Fabbro, P.; Rosso, S.; Ceruti, A.; Boscolo Bozza, D.; Meneghello, R.; Concheri, G.; Savio, G. Analysis of a Preliminary Design Approach for Conformal Lattice Structures. Applied Sciences 2021, 11, 11449. [Google Scholar] [CrossRef]
- Savio, G.; Uccheddu, F. Shape Memory Waterbomb Origami by Polylactic Acid Fused Filament Fabrication for Biomedical Devices. In; 2025; pp. 154–161.
- Williams, B.A.; Cremaschi, S. Surrogate Model Selection for Design Space Approximation And Surrogate based Optimization. In; 2019; pp. 353–358.
Figure 1.
Methodological approach for design and characterization of negative stiffness lattice structures for diabetic midsoles.
Figure 1.
Methodological approach for design and characterization of negative stiffness lattice structures for diabetic midsoles.
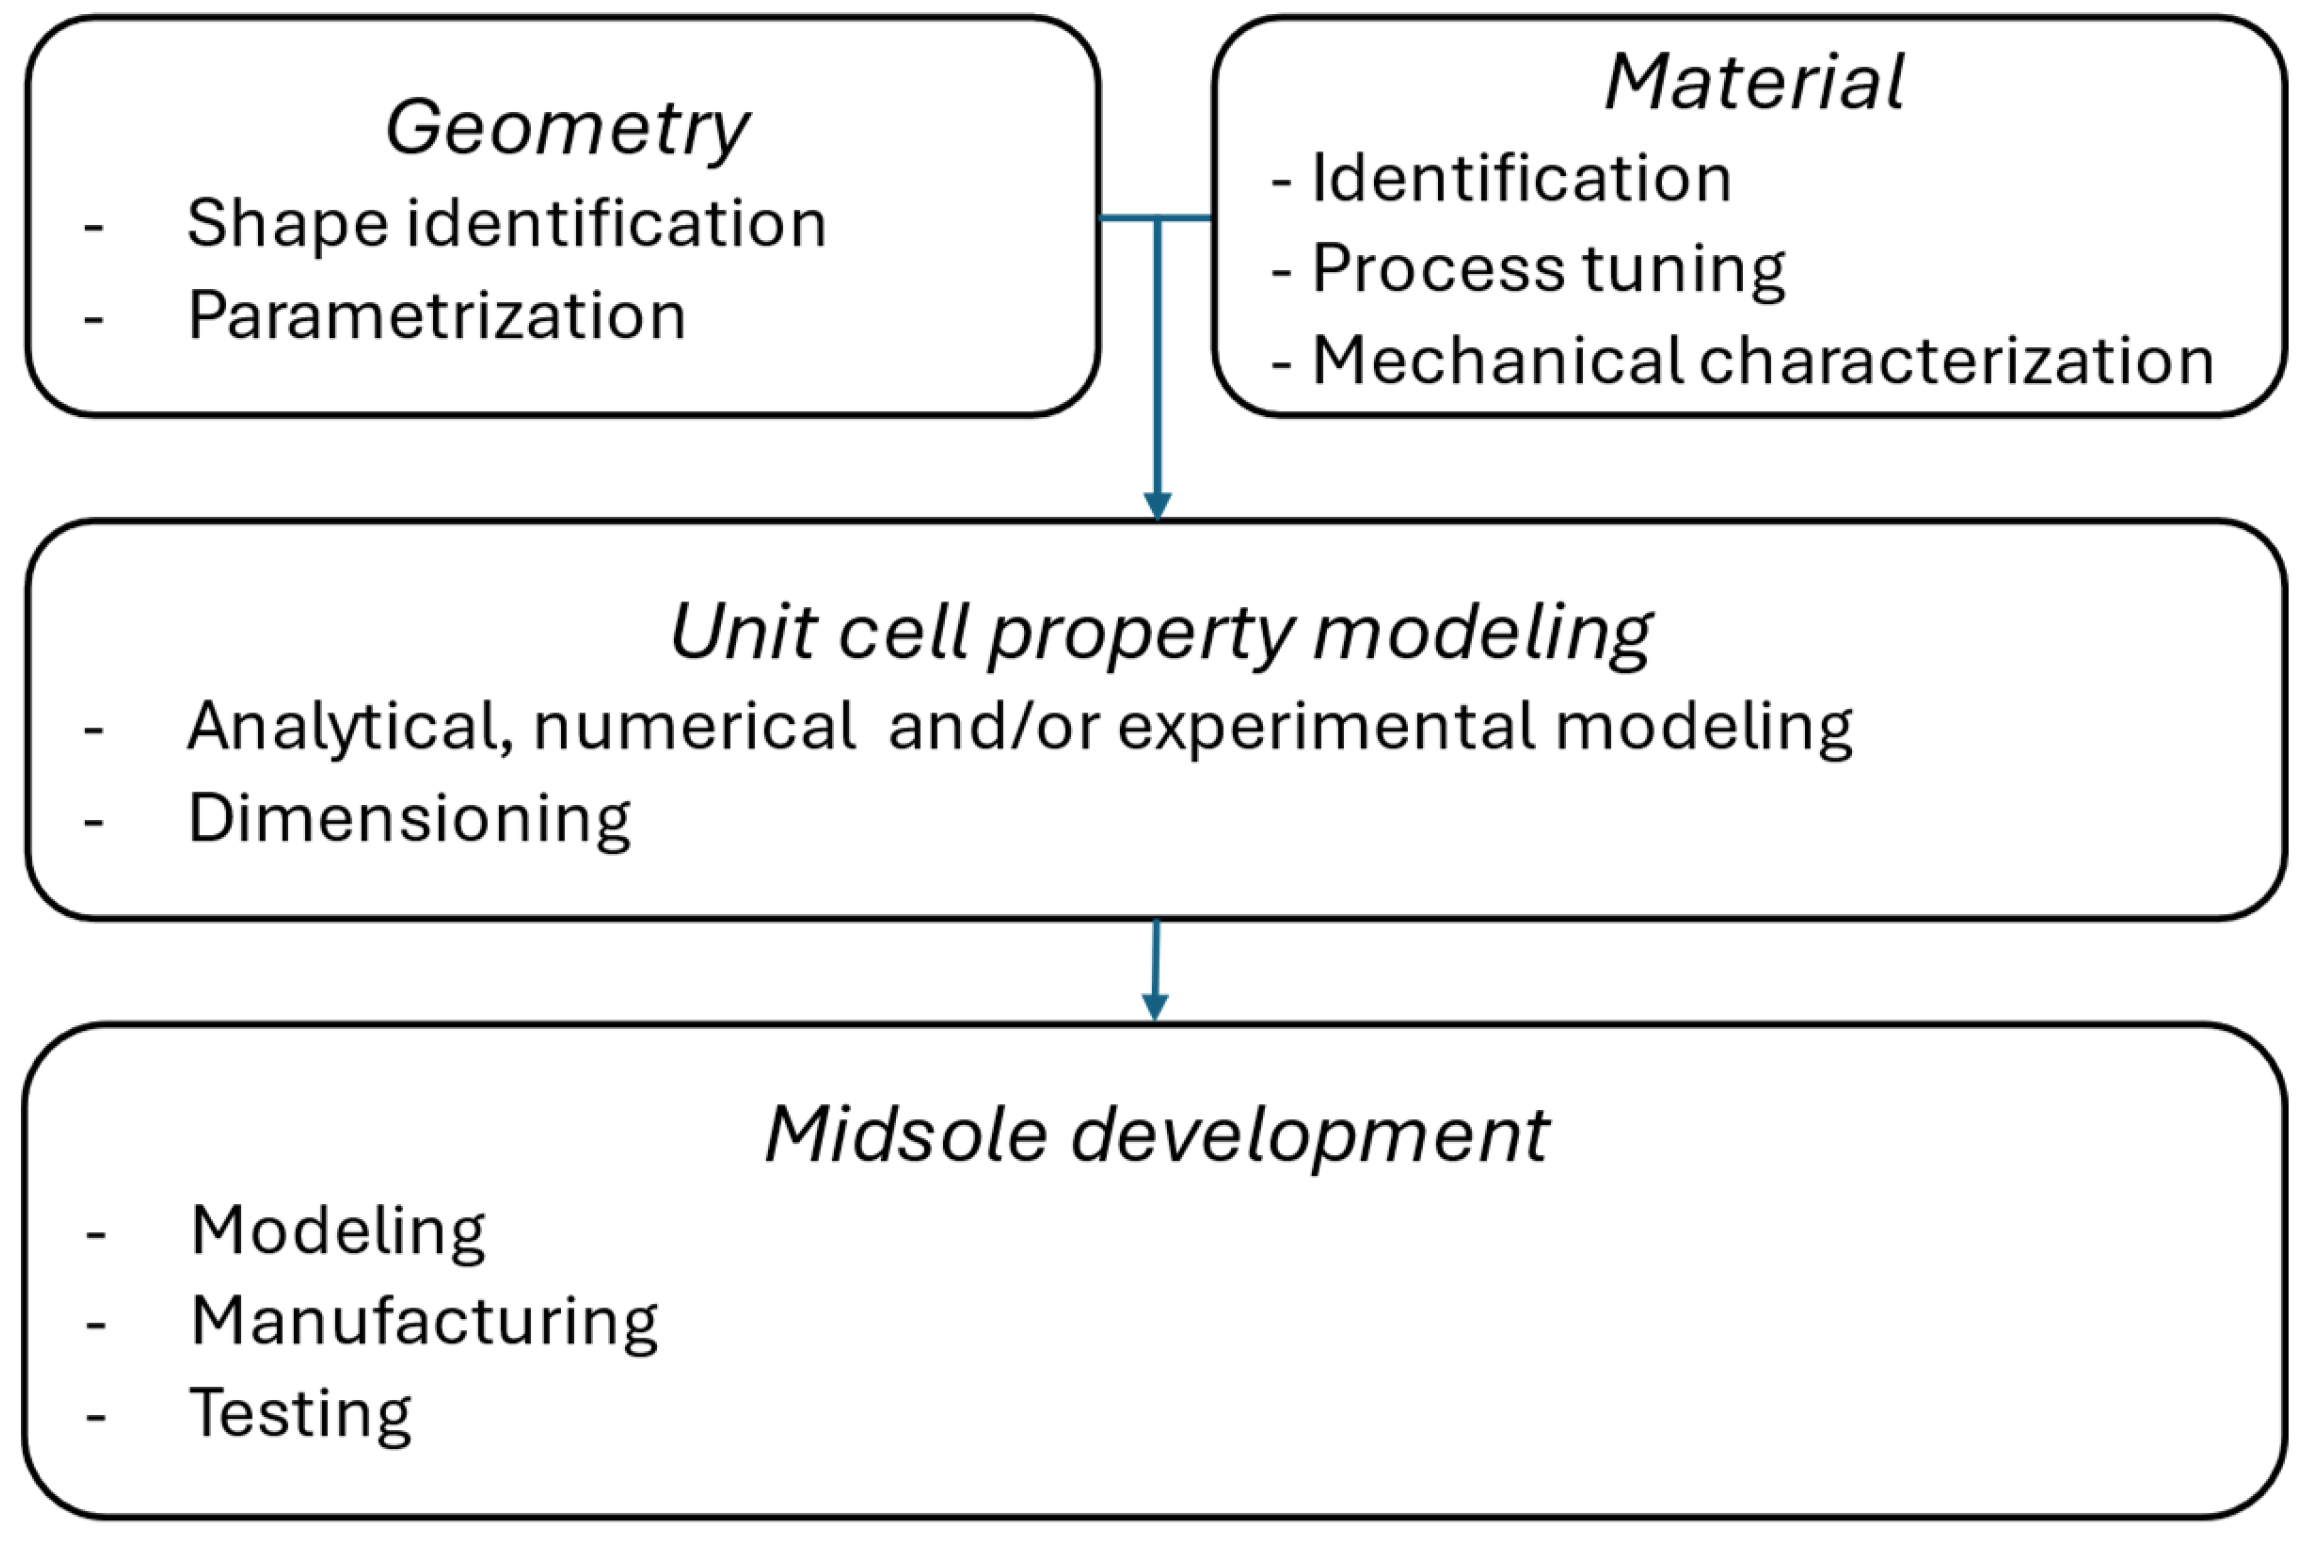
Figure 2.
Parameters adopted for modelling the double beam cell: a) a quarter of the single cell, b) the single cell, c) a group of 3x2 cells in axonometric view. The meaning of the parameters is summarized in Table 1.
Figure 2.
Parameters adopted for modelling the double beam cell: a) a quarter of the single cell, b) the single cell, c) a group of 3x2 cells in axonometric view. The meaning of the parameters is summarized in Table 1.
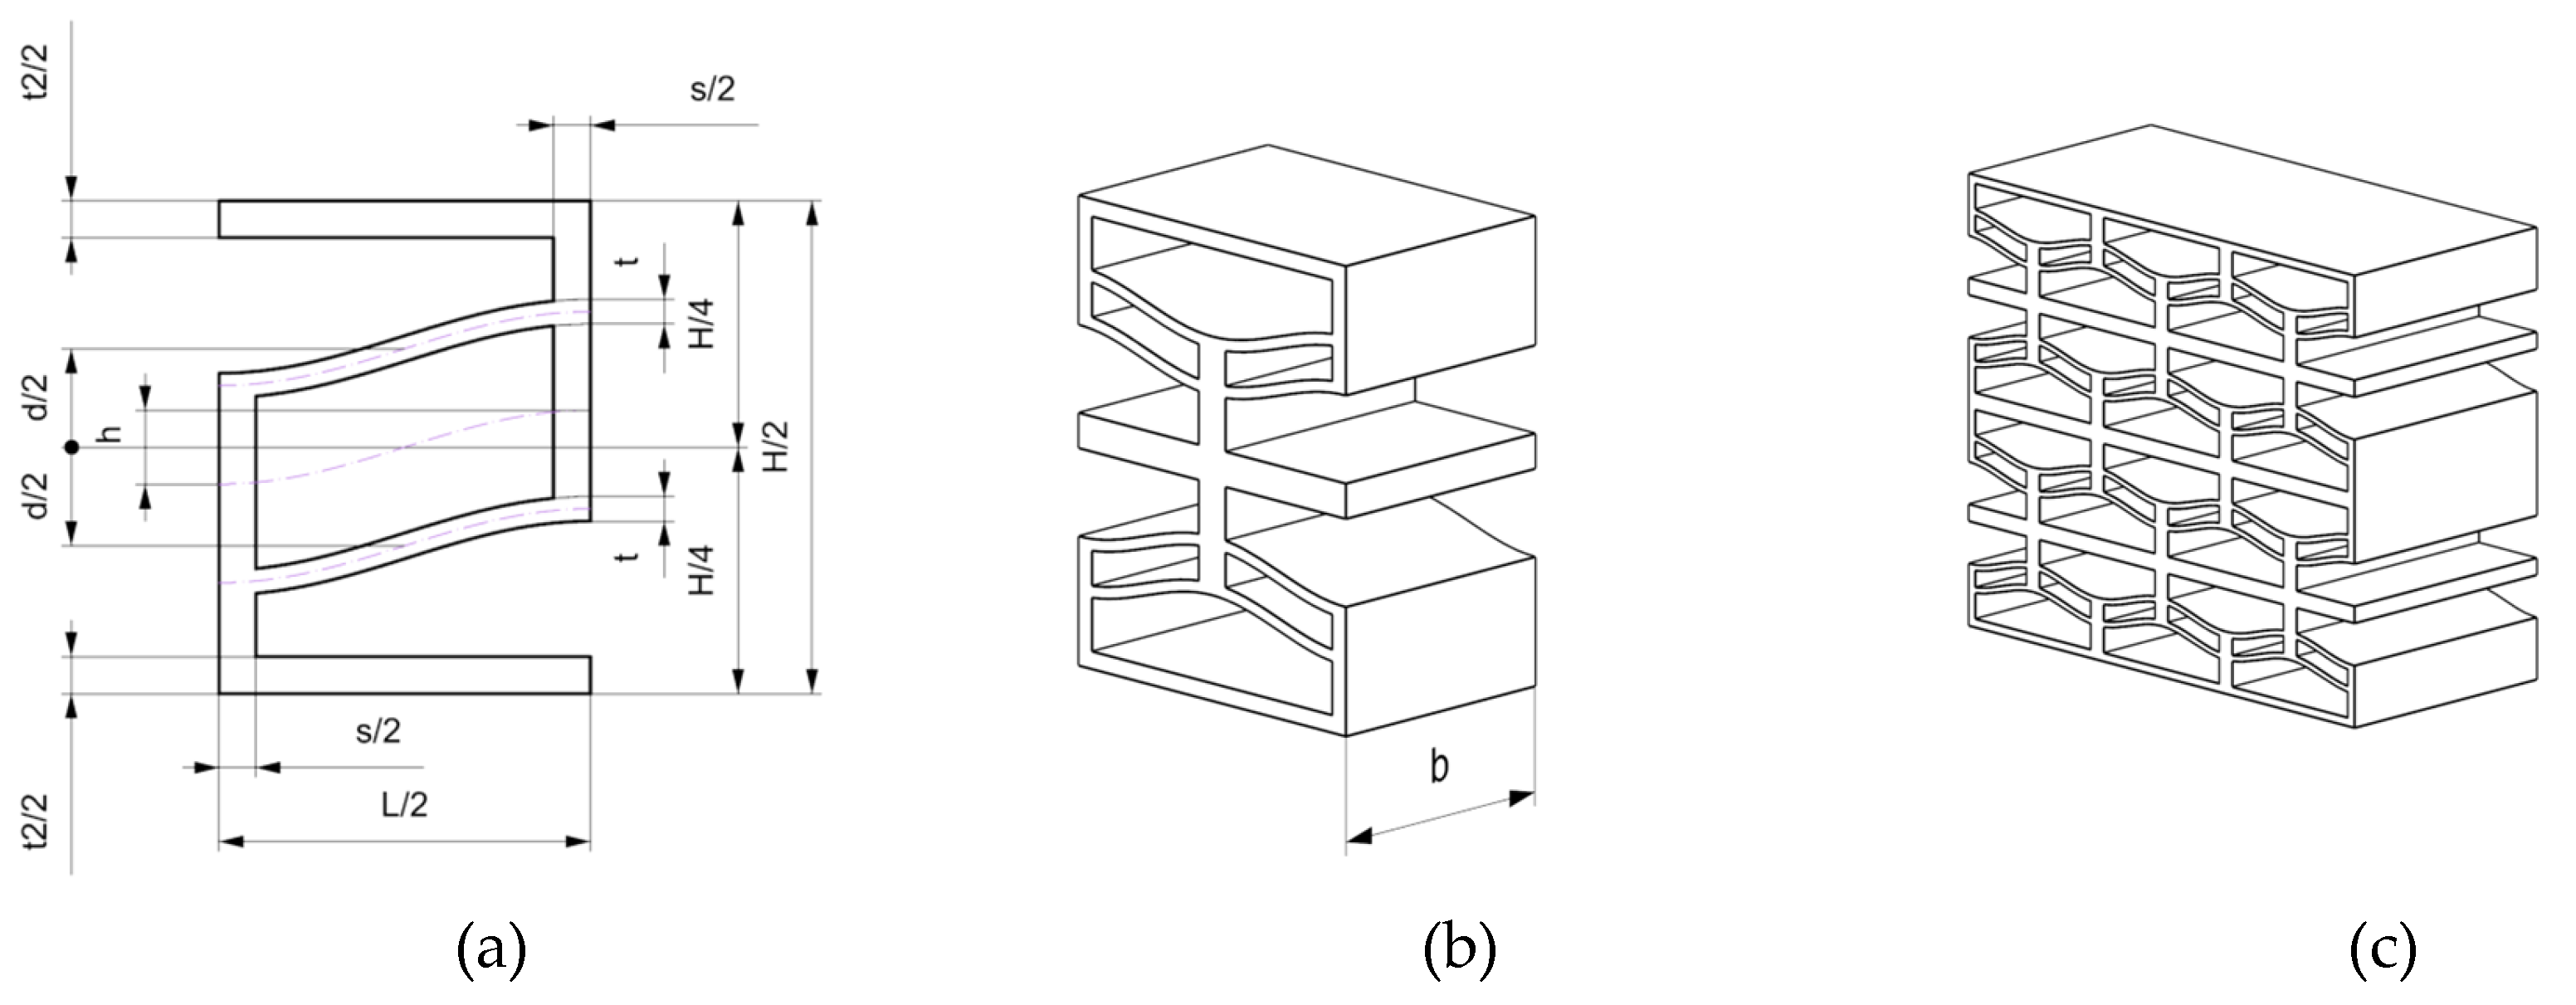
Figure 3.
Test cube for verifying the actual wall thickness.
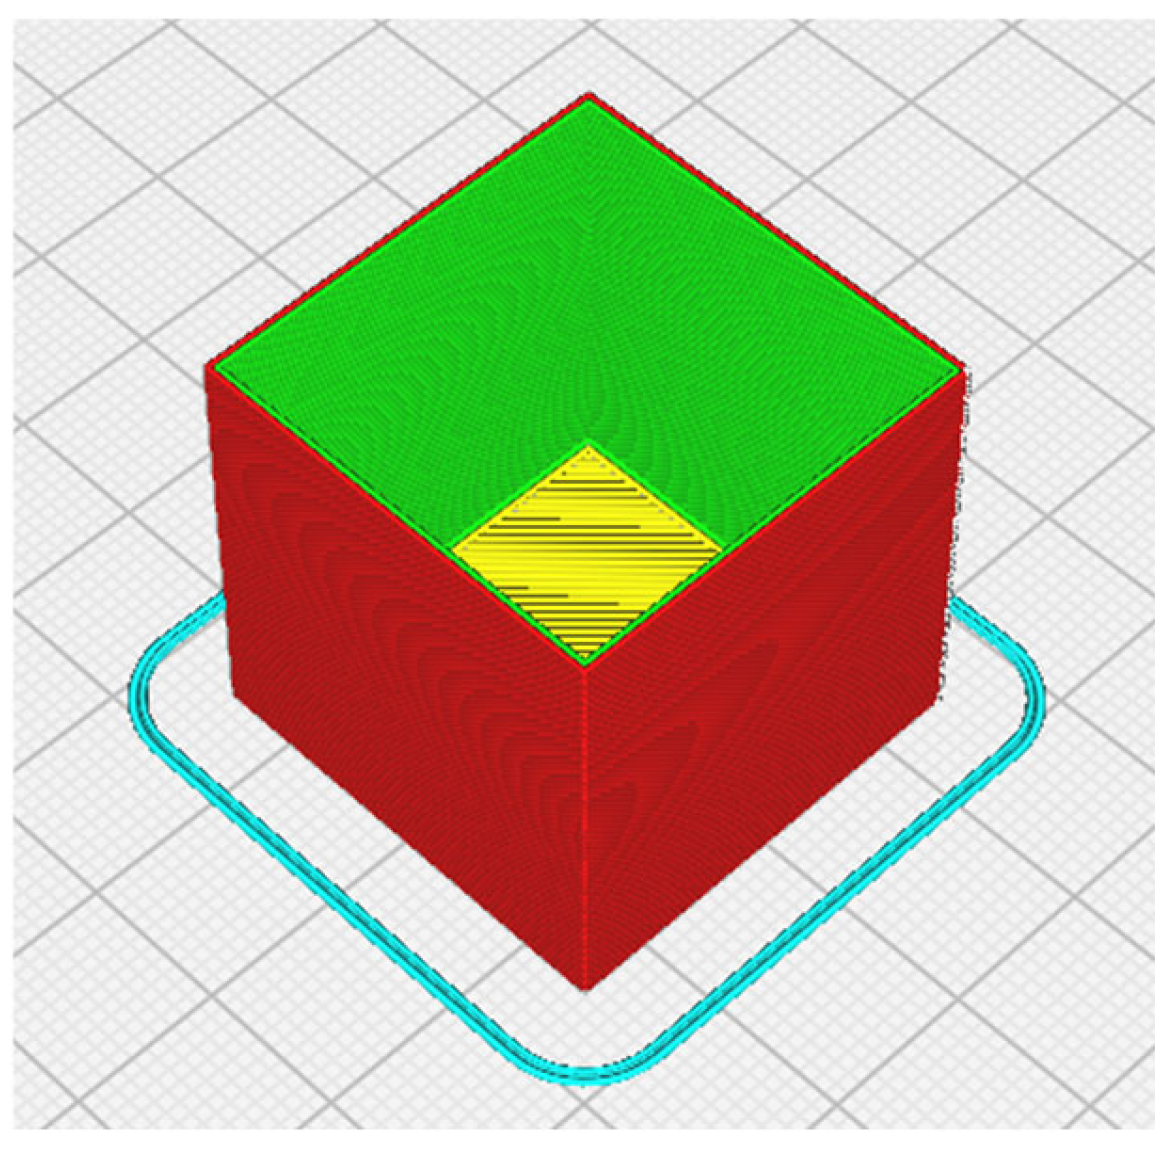
Figure 4.
Dimensions of the specimens: a) for hardness tests and b) for tensile tests. [ISO527-2:2012].
Figure 4.
Dimensions of the specimens: a) for hardness tests and b) for tensile tests. [ISO527-2:2012].
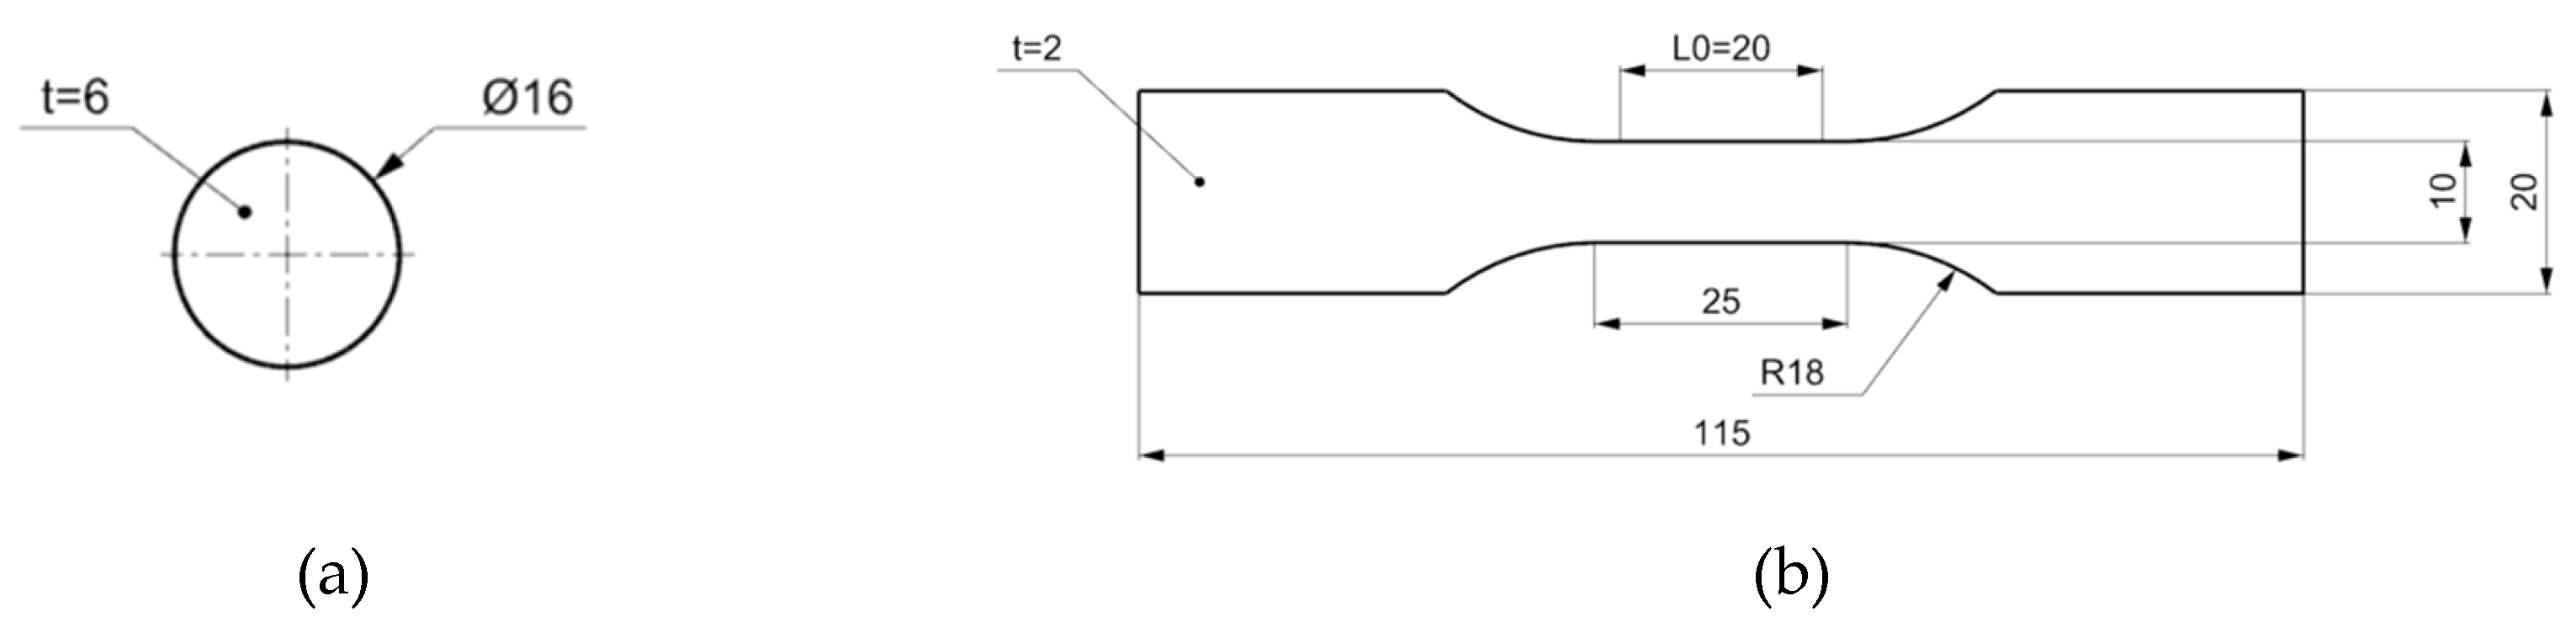
Figure 5.
Normalized force vs. normalized displacement graphs for selected values of Q.
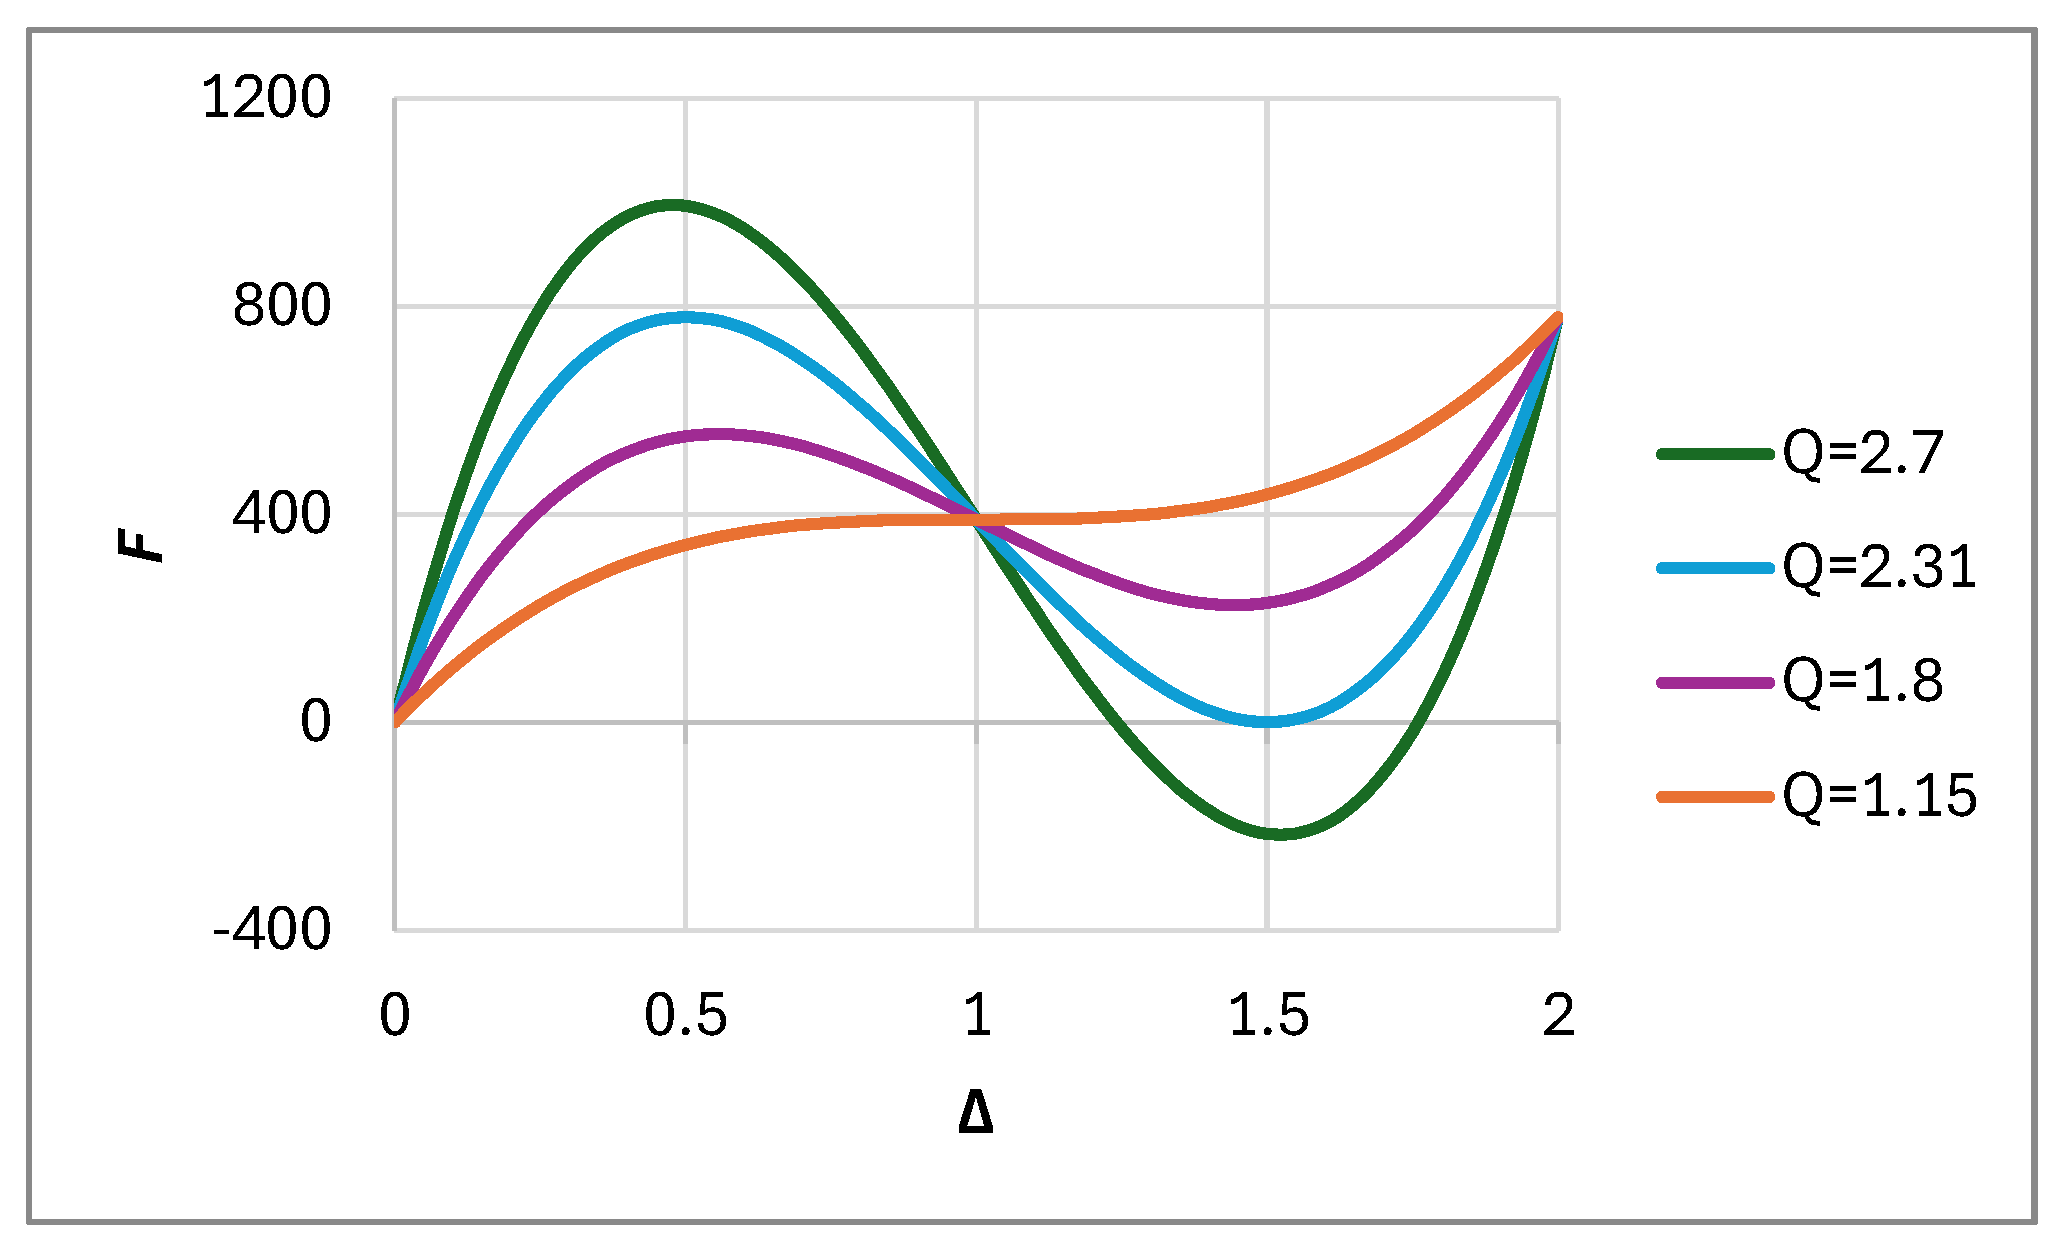
Figure 6.
Cell positioning during the compression test. The cell was placed on a rigid support plane, between two vertical rigid supports, centrally to the loading cylinder.
Figure 6.
Cell positioning during the compression test. The cell was placed on a rigid support plane, between two vertical rigid supports, centrally to the loading cylinder.
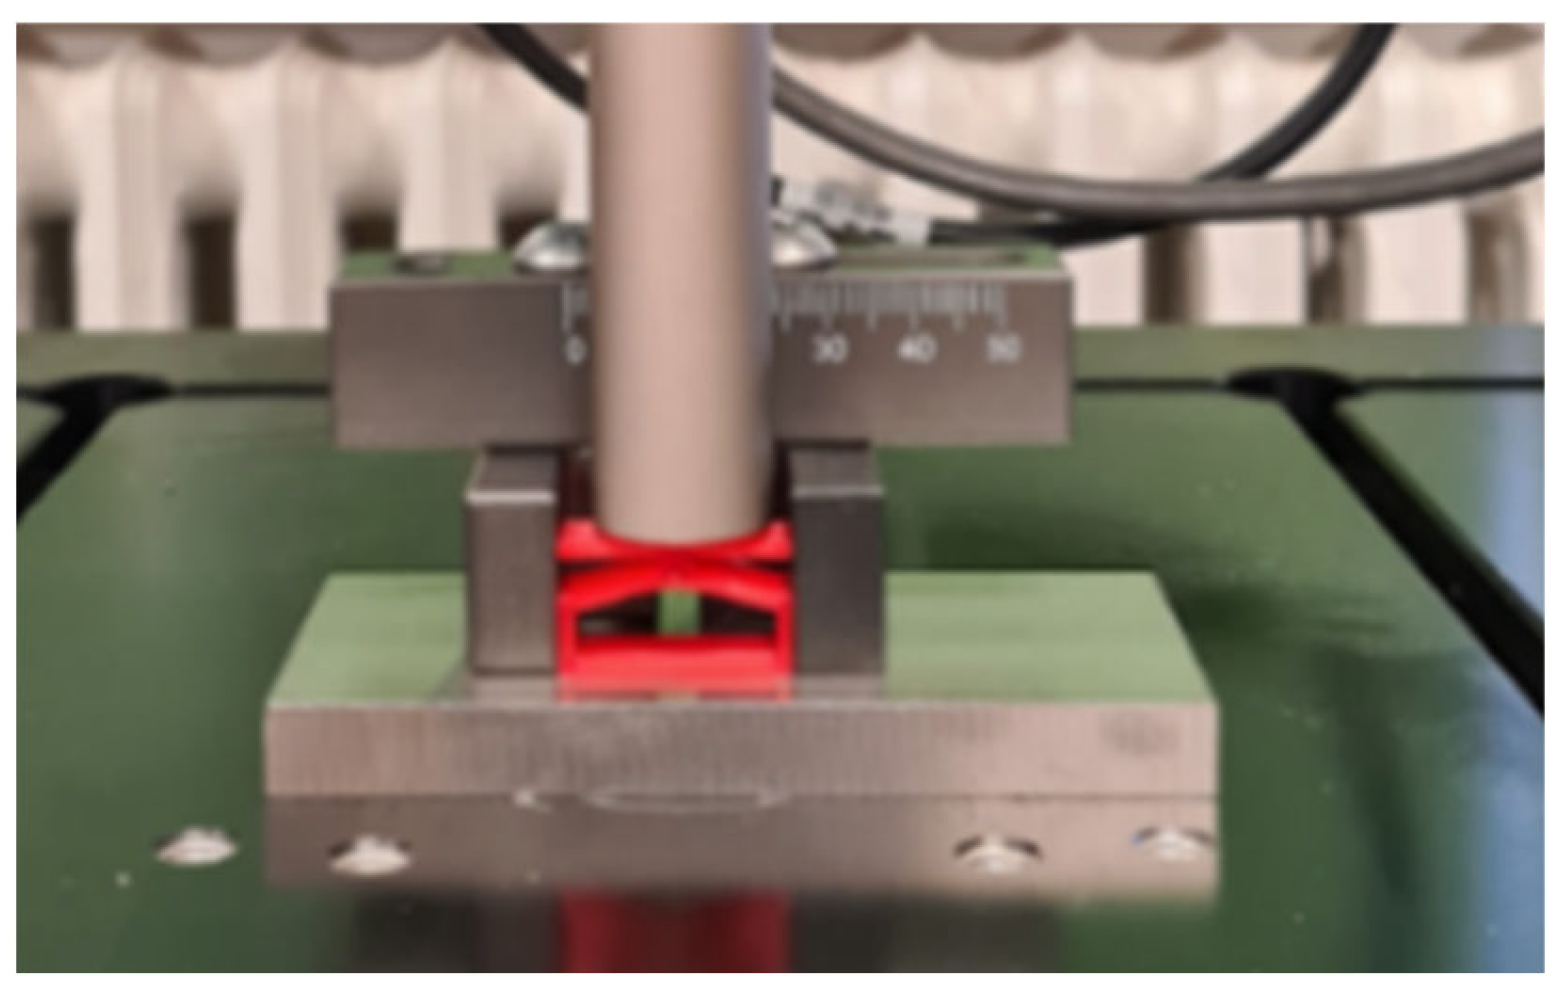
Figure 7.
Modelling and manufacturing procedure of the midsole.
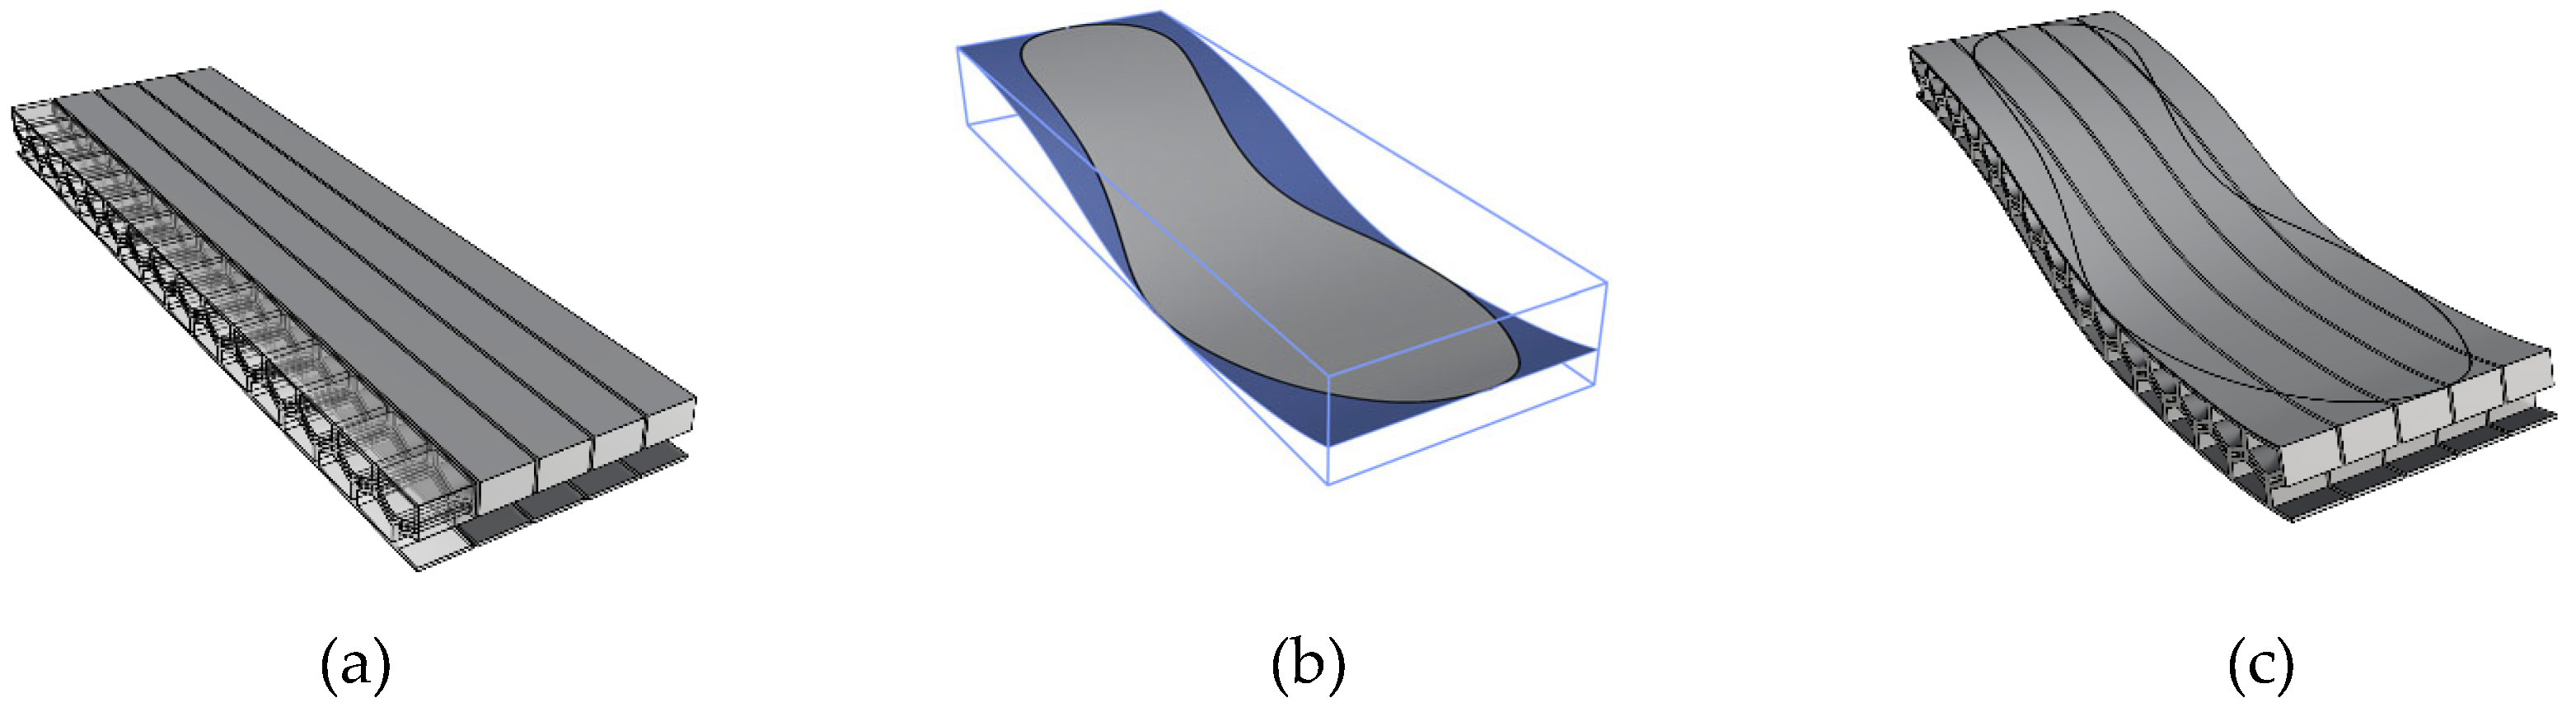
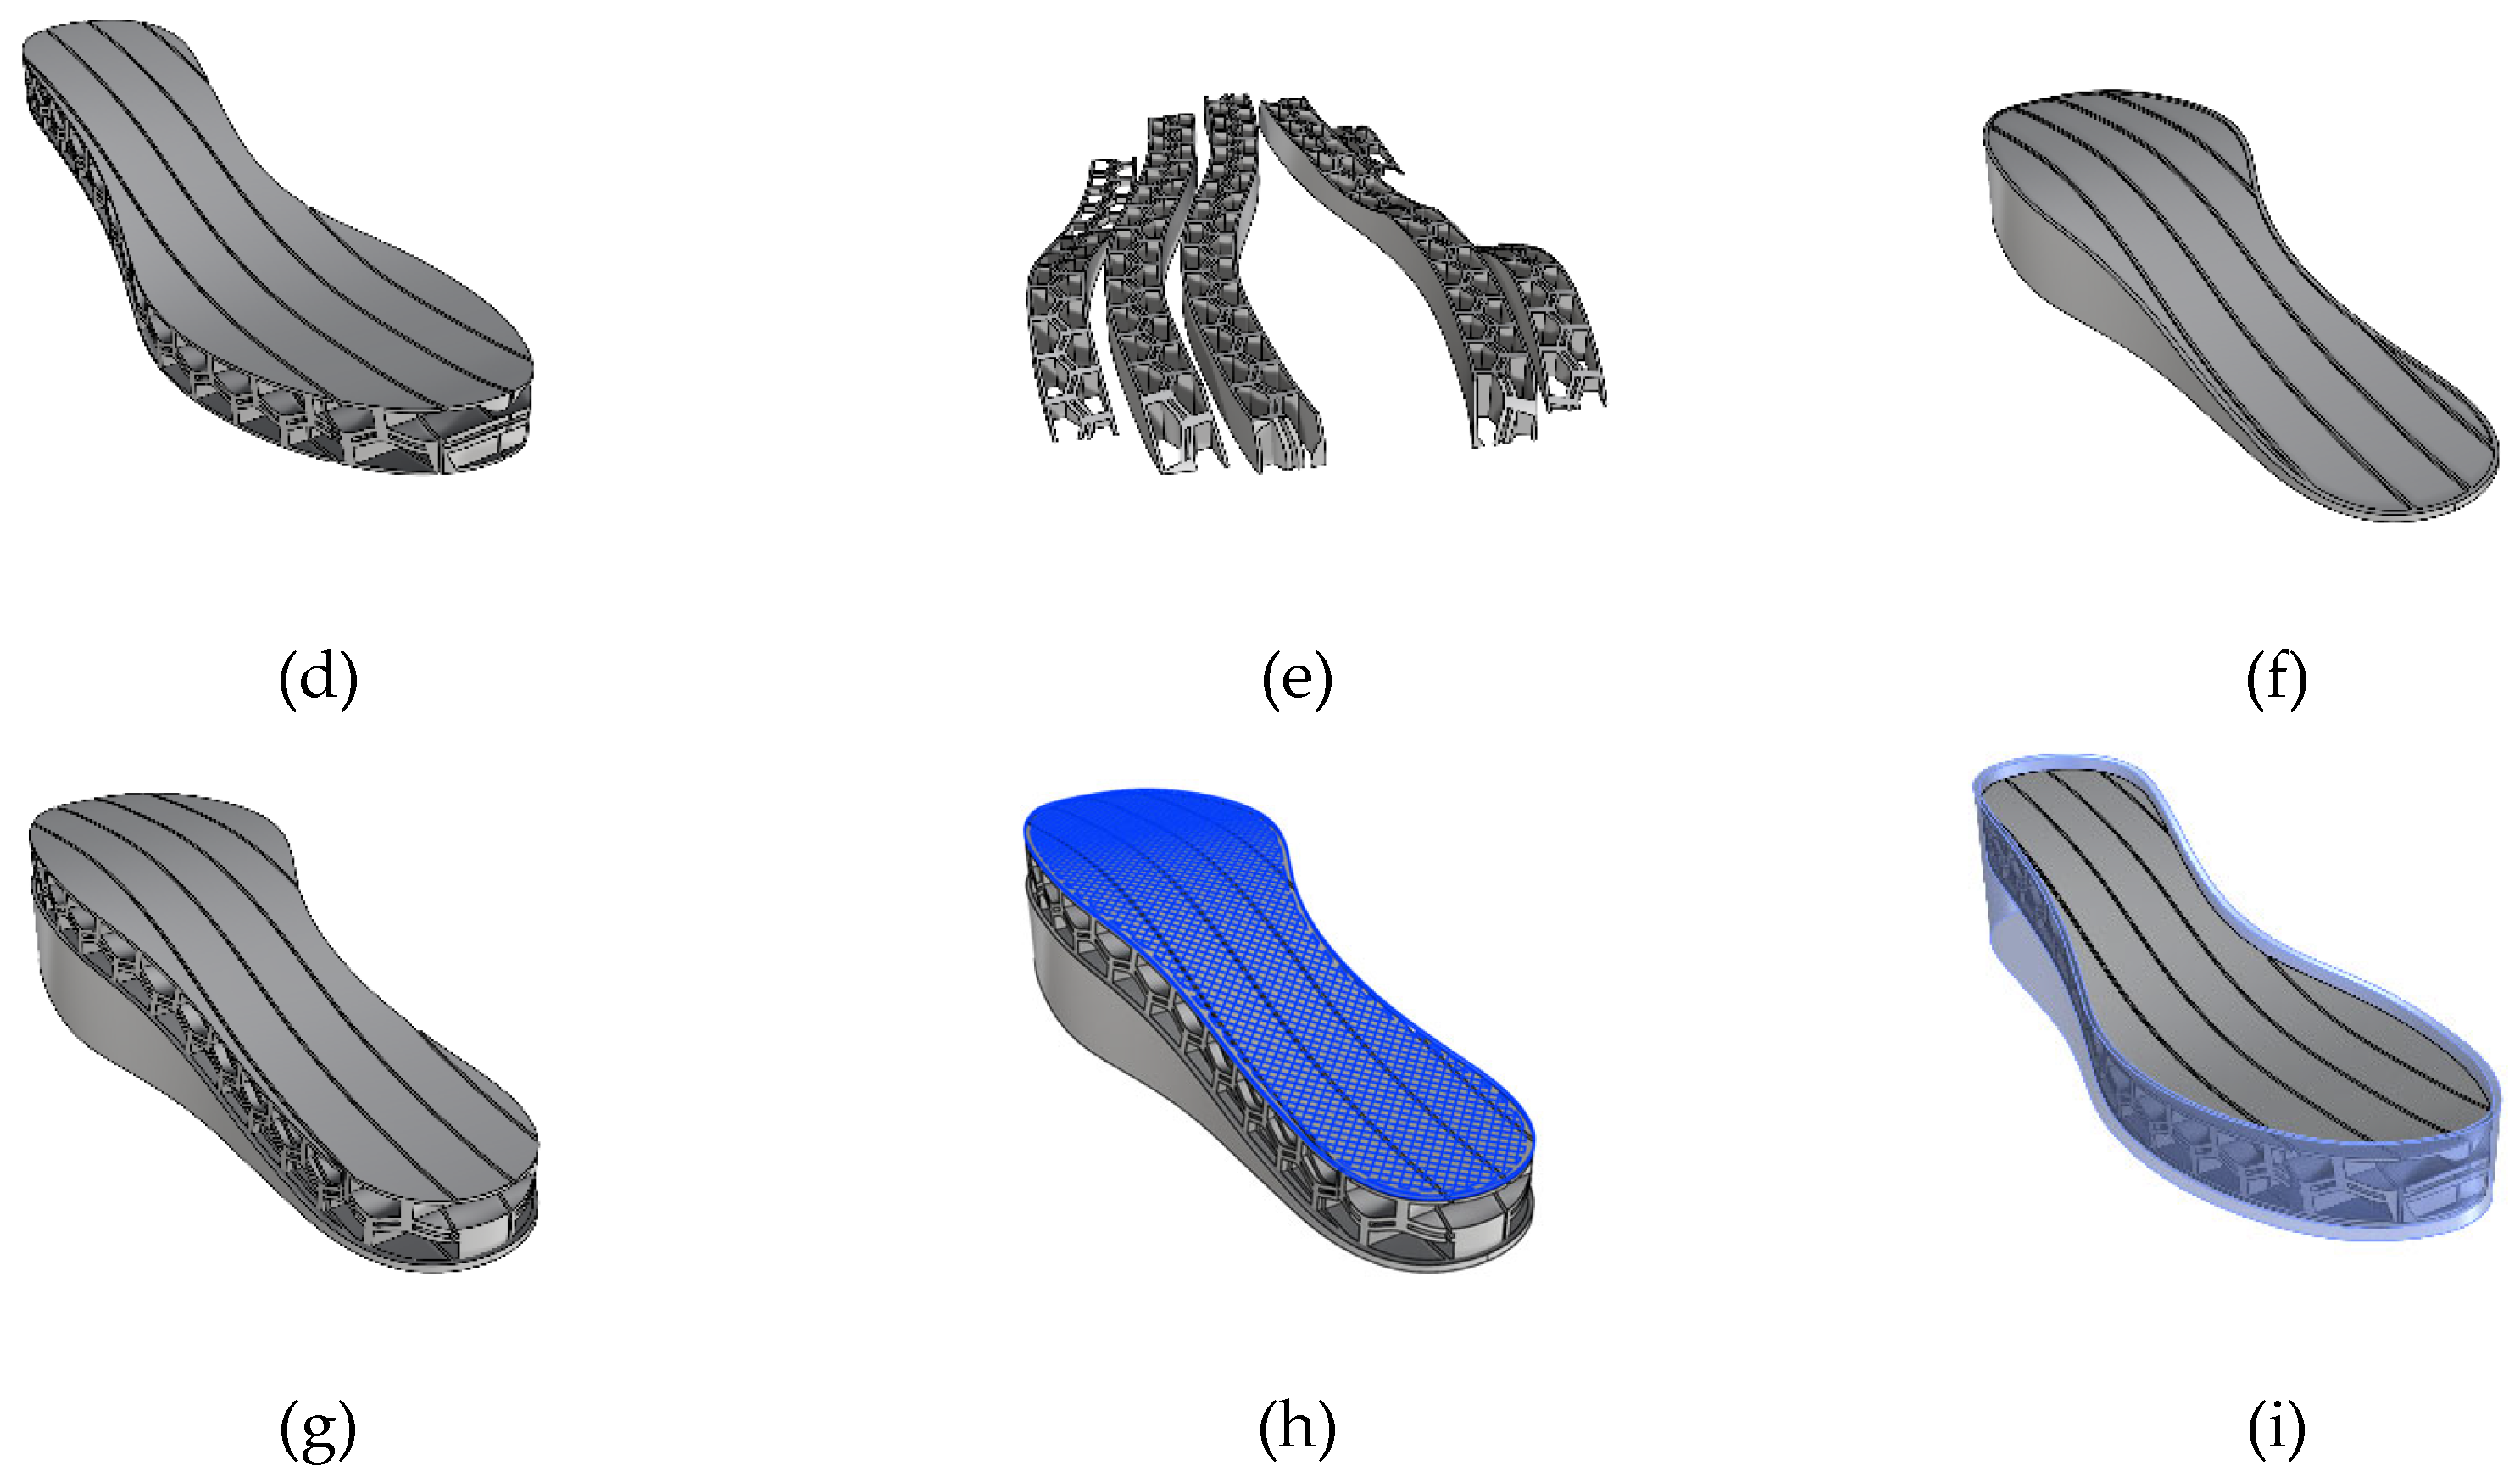
Figure 8.
Example of the stripes joining procedure.
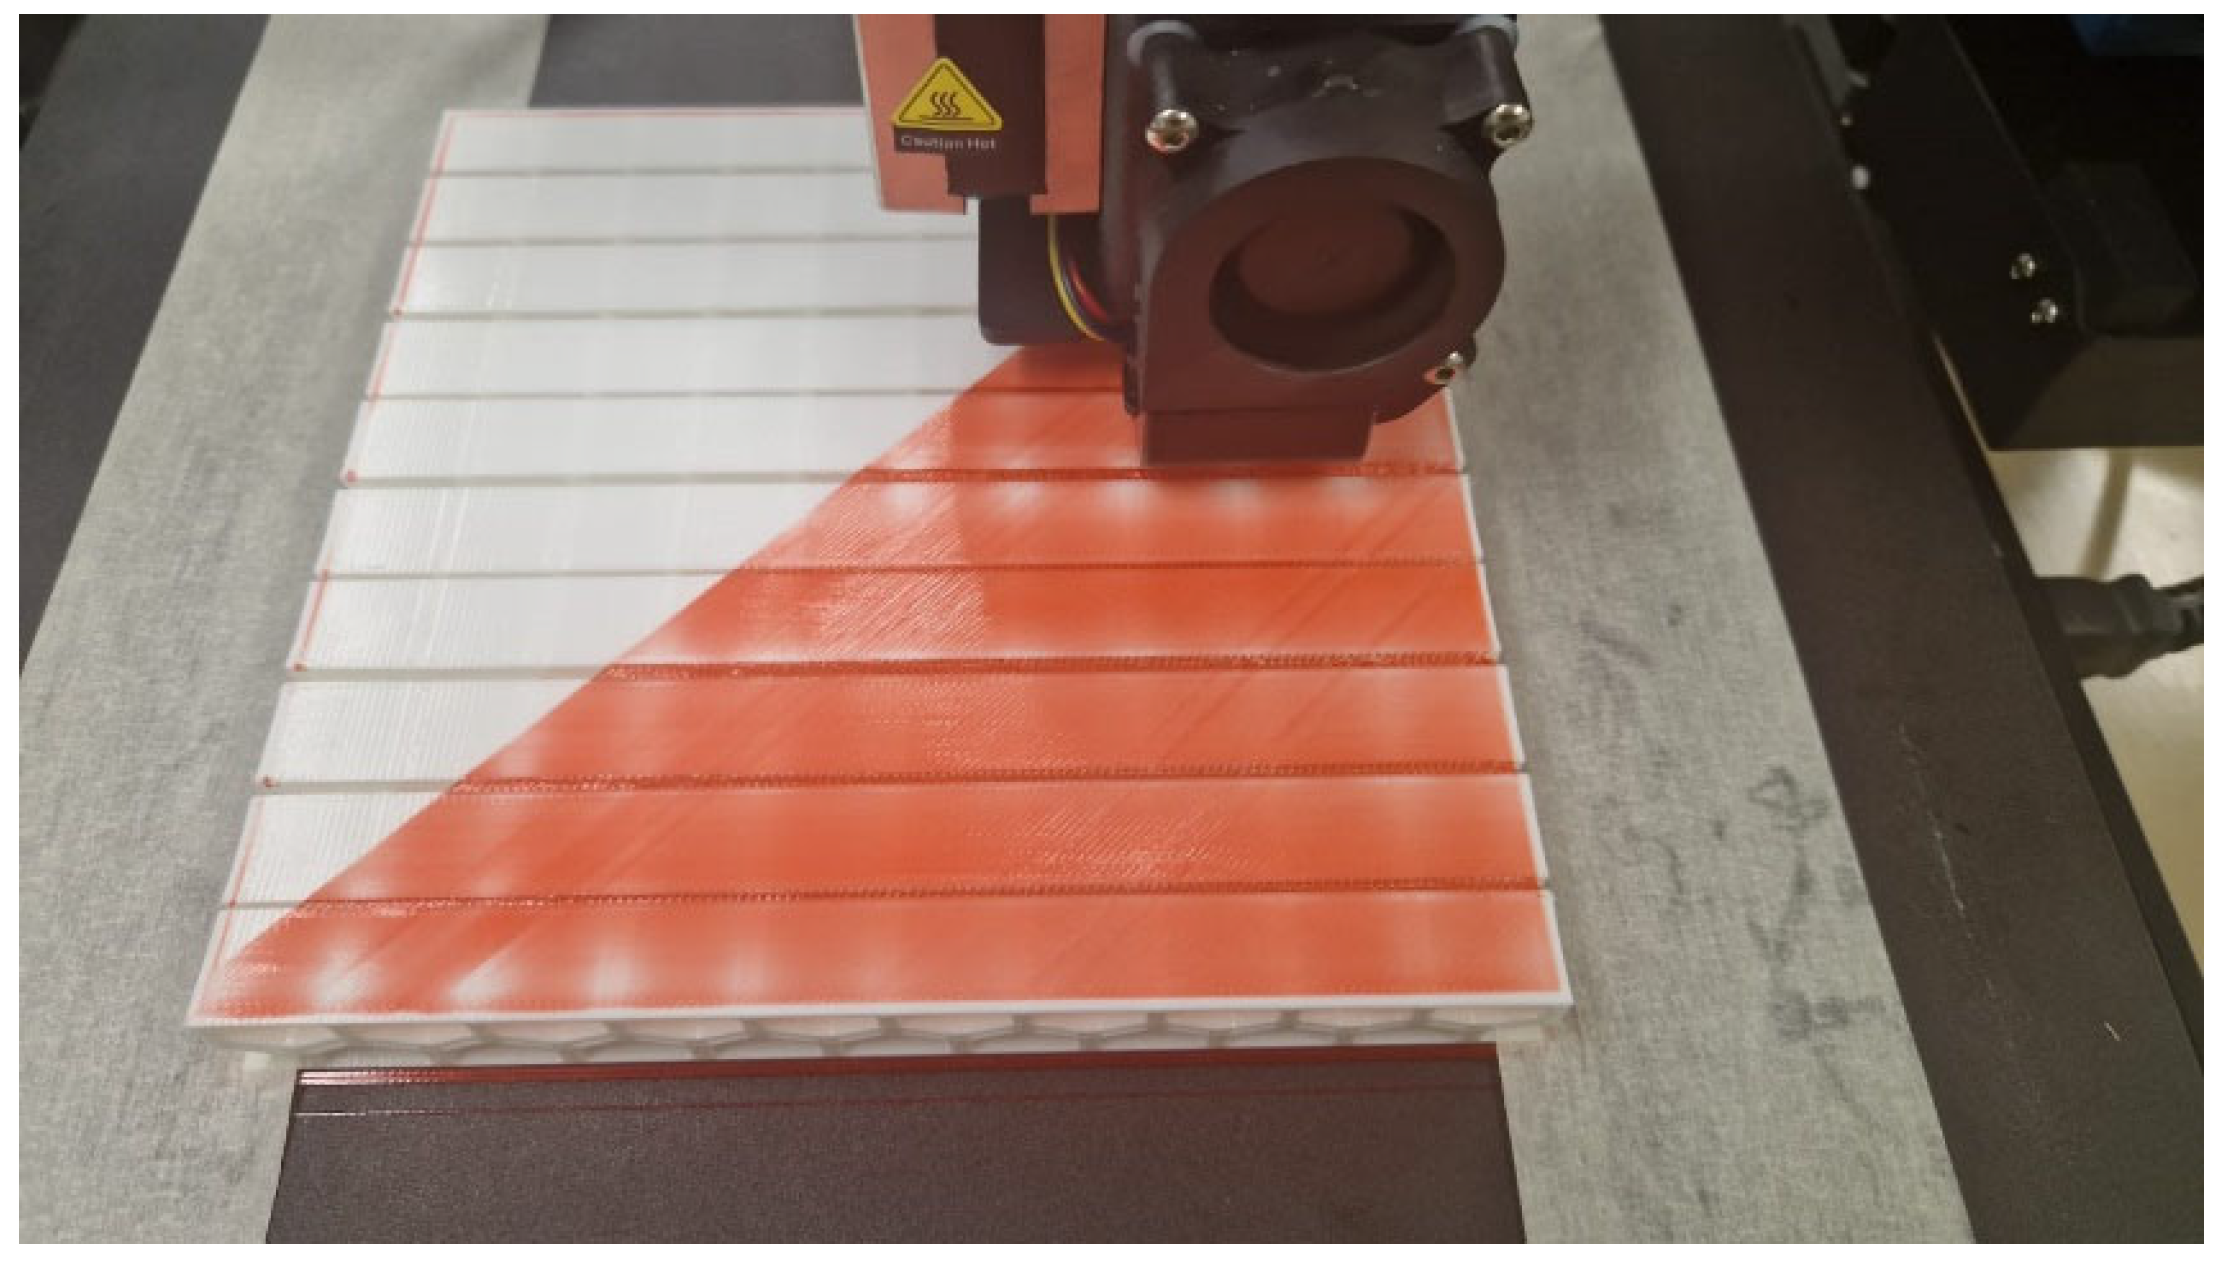
Figure 9.
Cylindrical TPU specimen for hardness testing. From left to right: Bottom layer, Top layer, and 3D view.
Figure 9.
Cylindrical TPU specimen for hardness testing. From left to right: Bottom layer, Top layer, and 3D view.
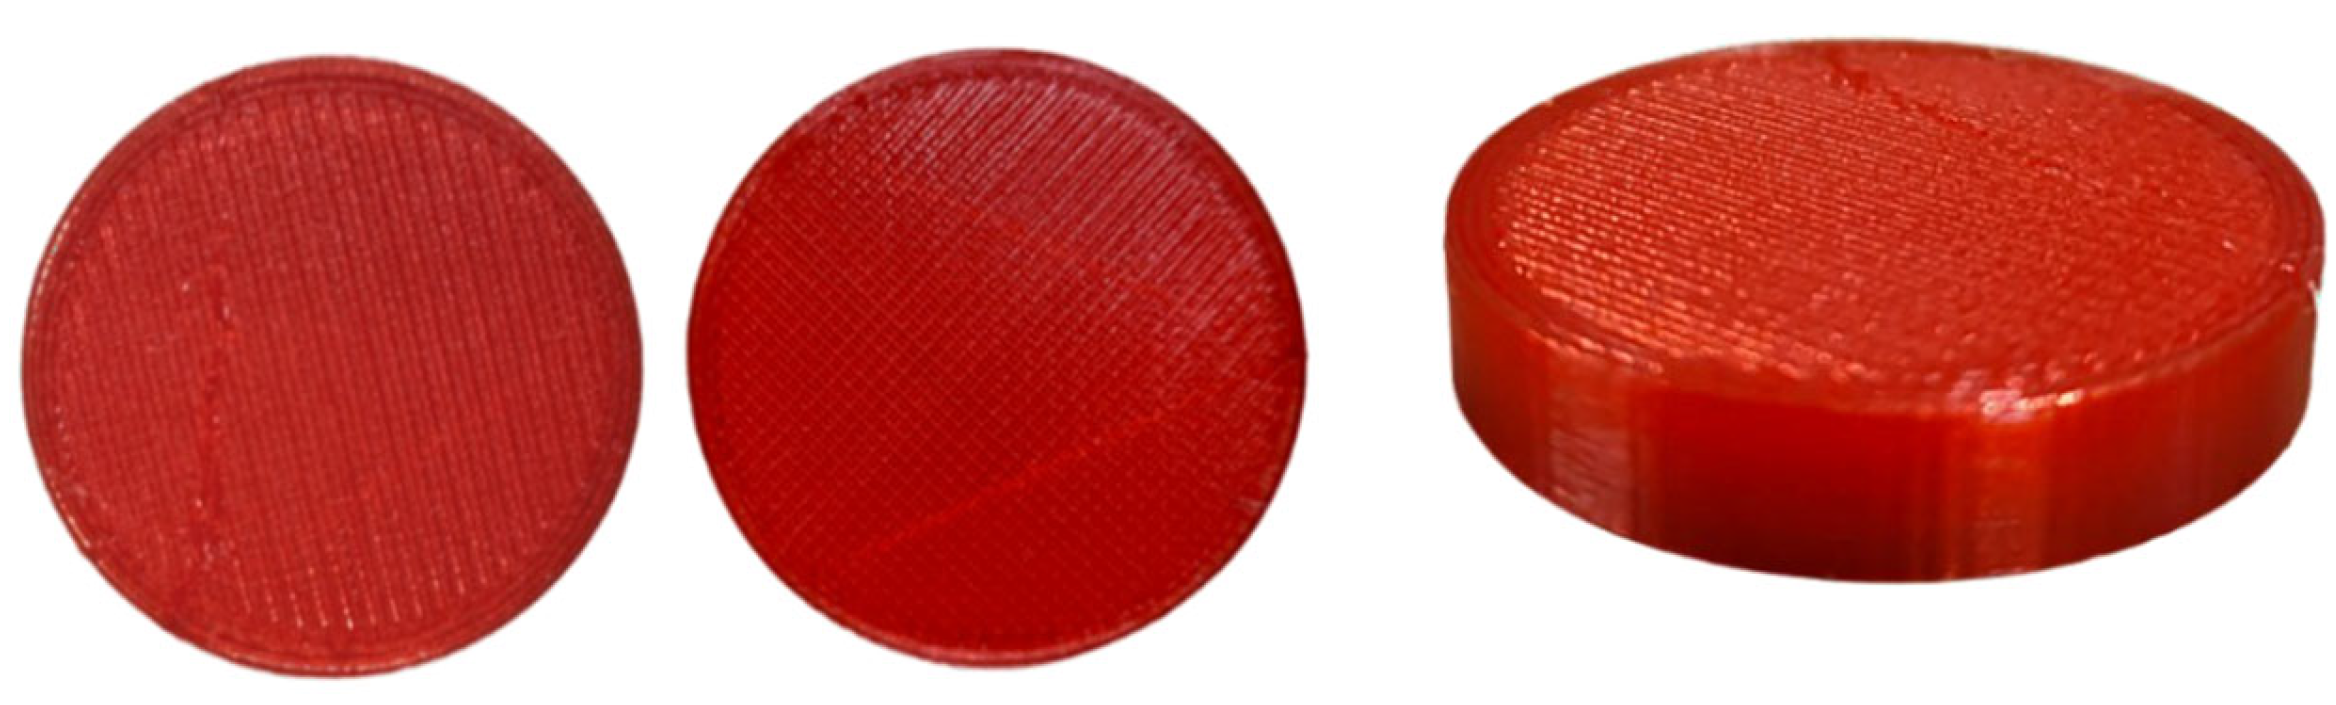
Figure 10.
Stress–strain curves resulting from tensile tests on the three TPU specimens.
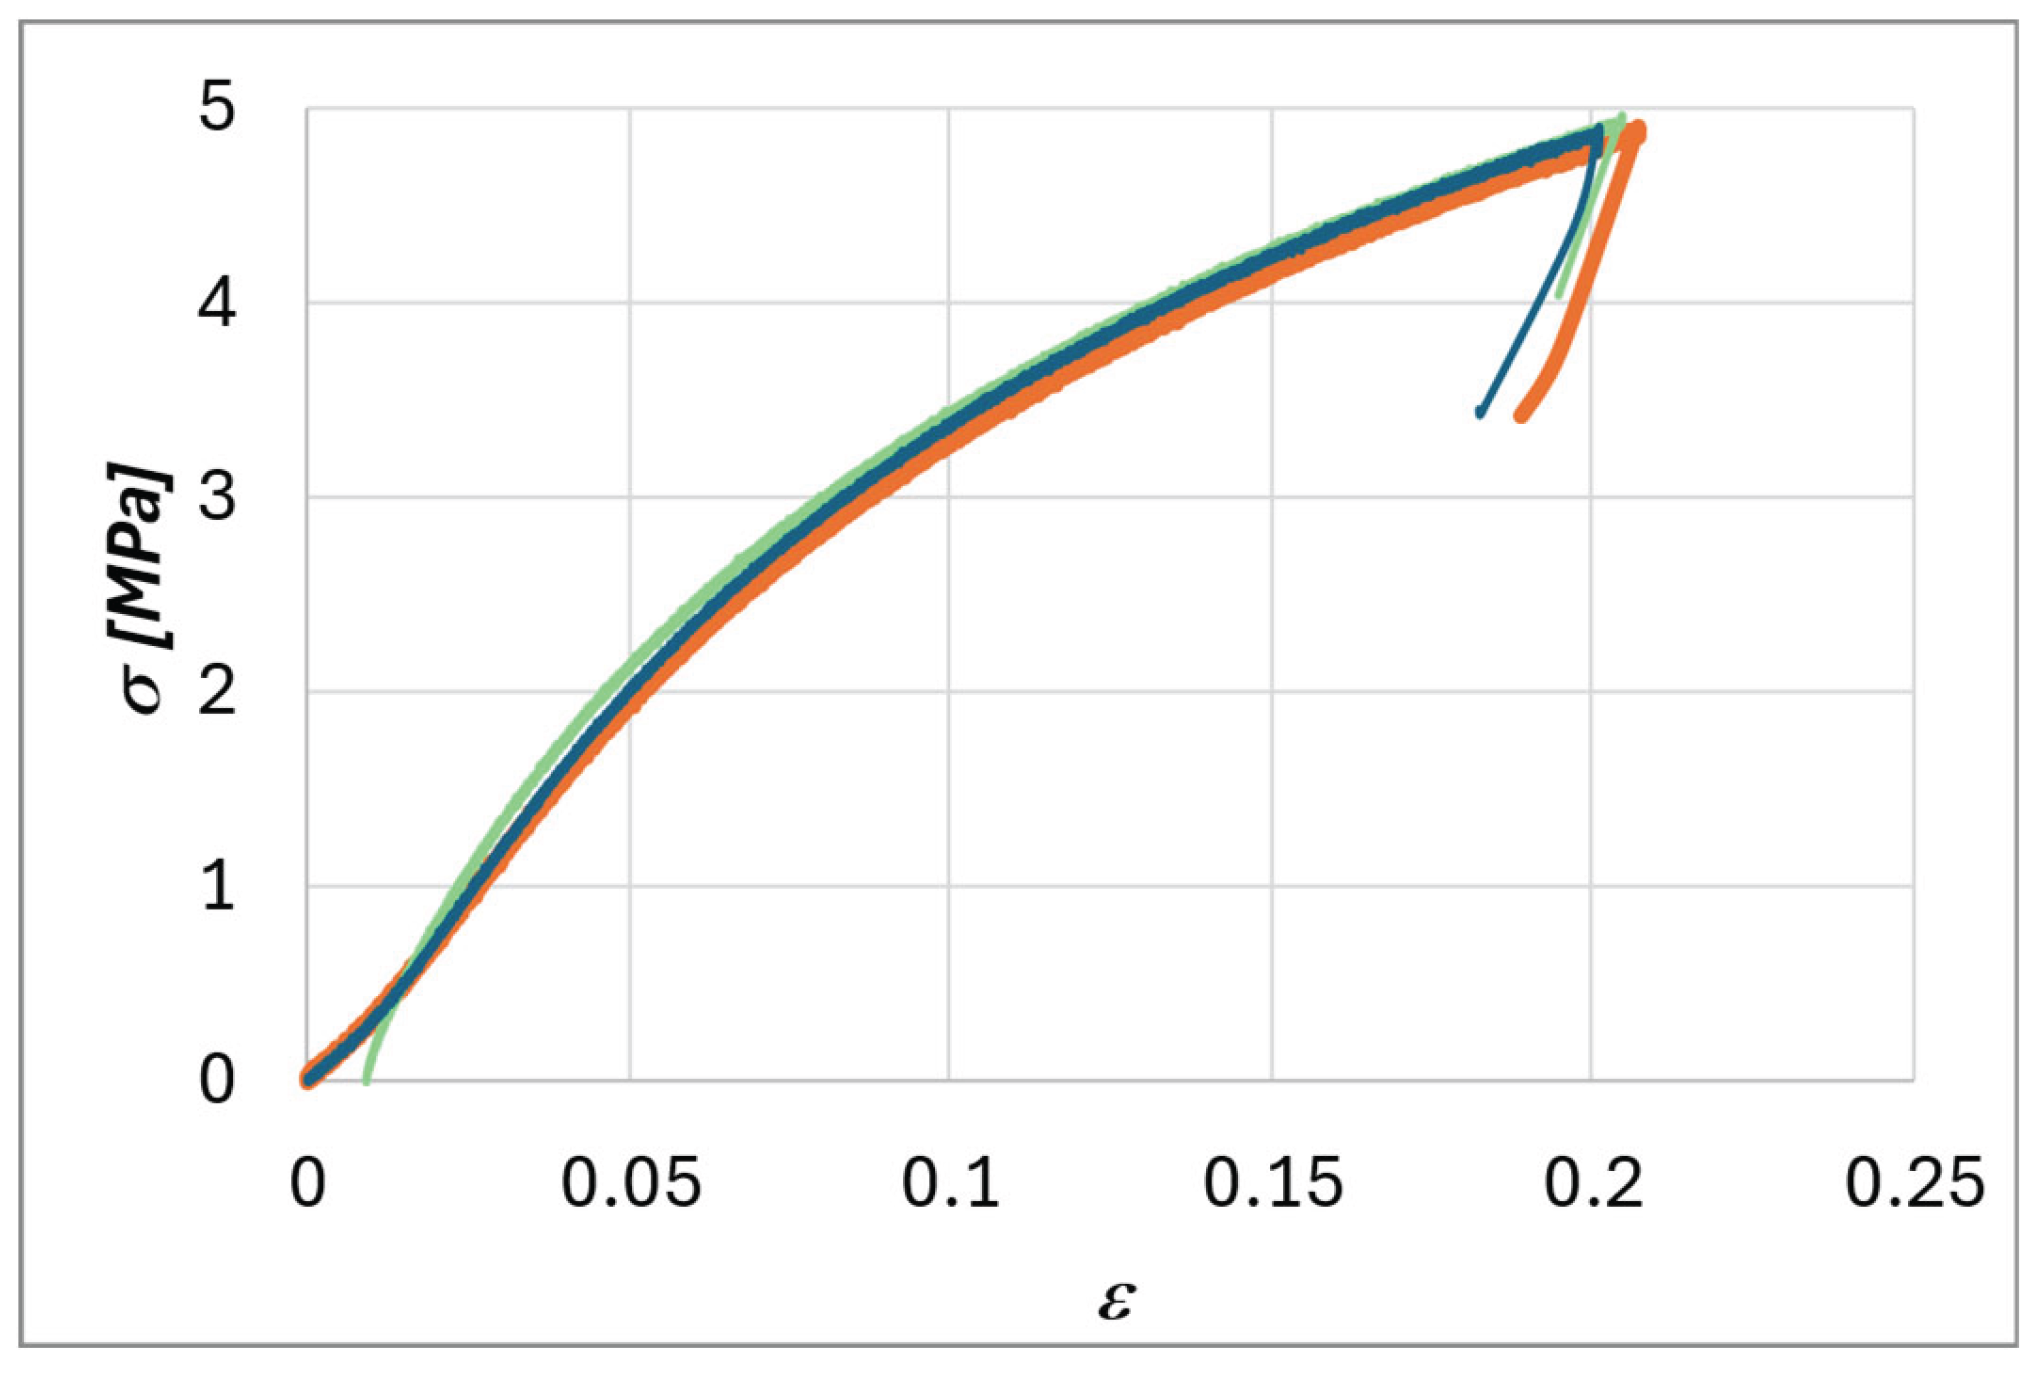
Figure 11.
Analytical models of the studied cells.
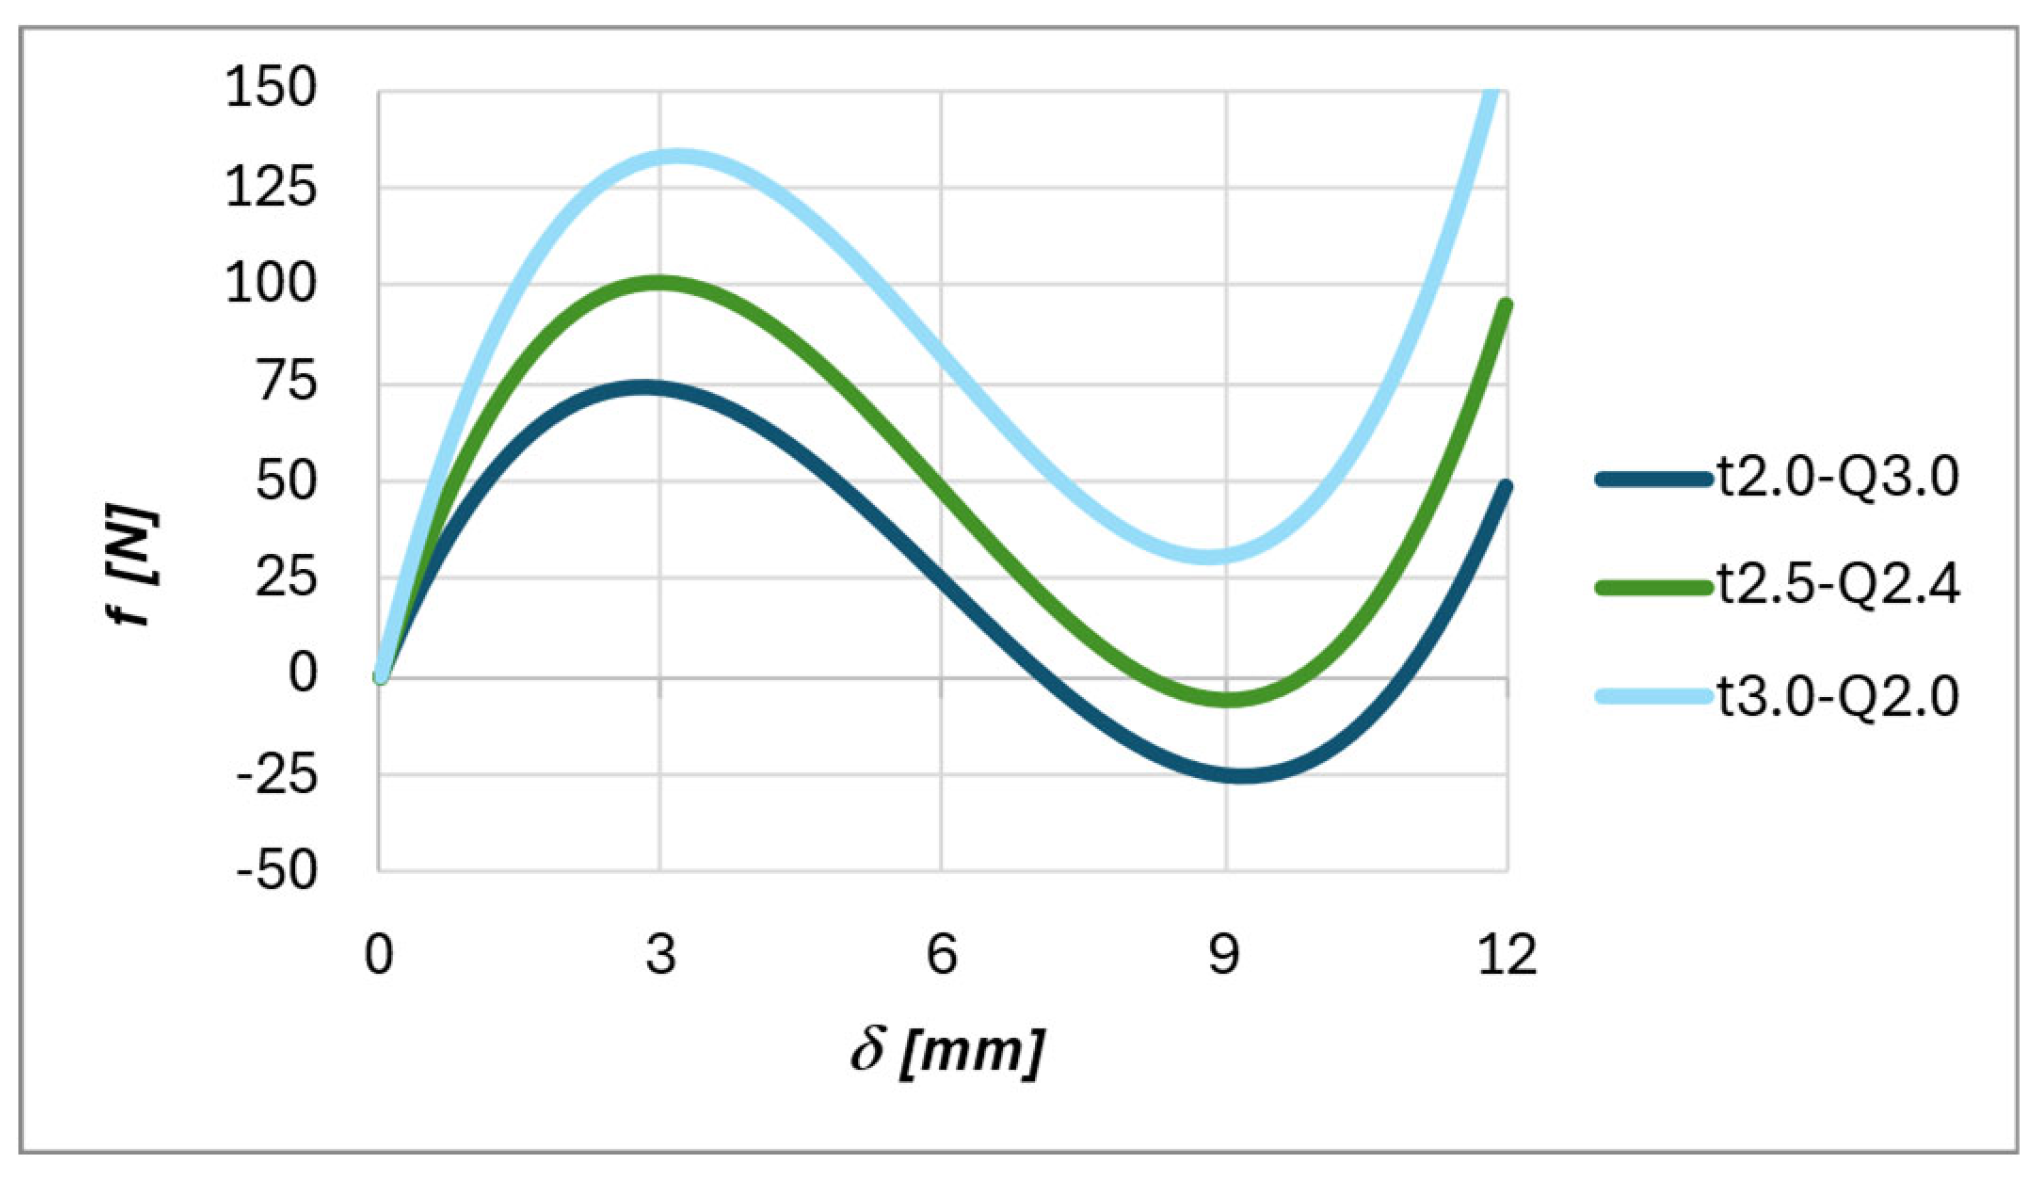
Figure 12.
Top: manufactured samples. Bottom: deformation mechanism of the samples under compression. From left to right: t2.0-Q3.0, t2.5-Q2.4, and t3.0-Q2.0.
Figure 12.
Top: manufactured samples. Bottom: deformation mechanism of the samples under compression. From left to right: t2.0-Q3.0, t2.5-Q2.4, and t3.0-Q2.0.
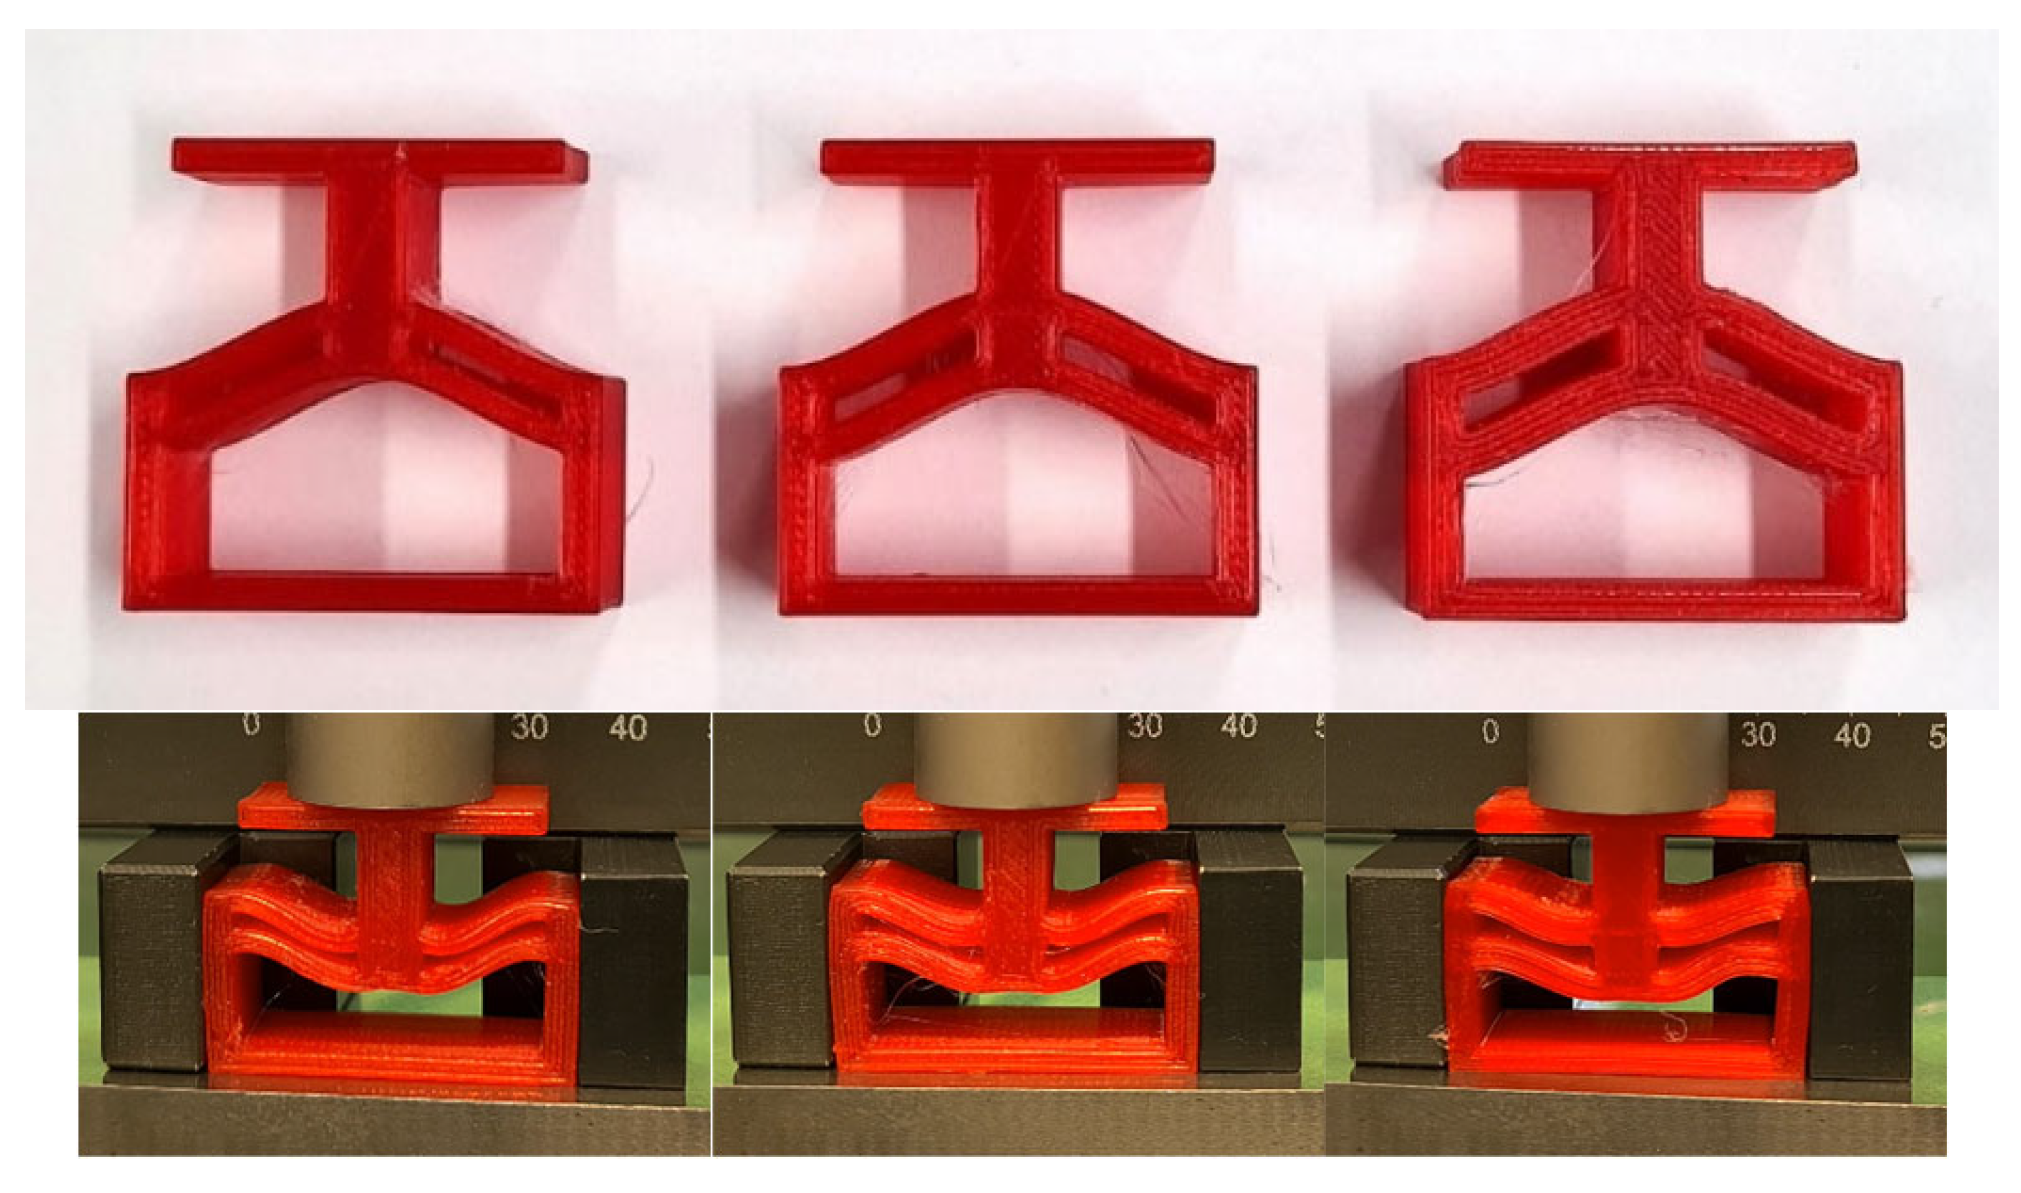
Figure 13.
Experimental results of the compression tests.
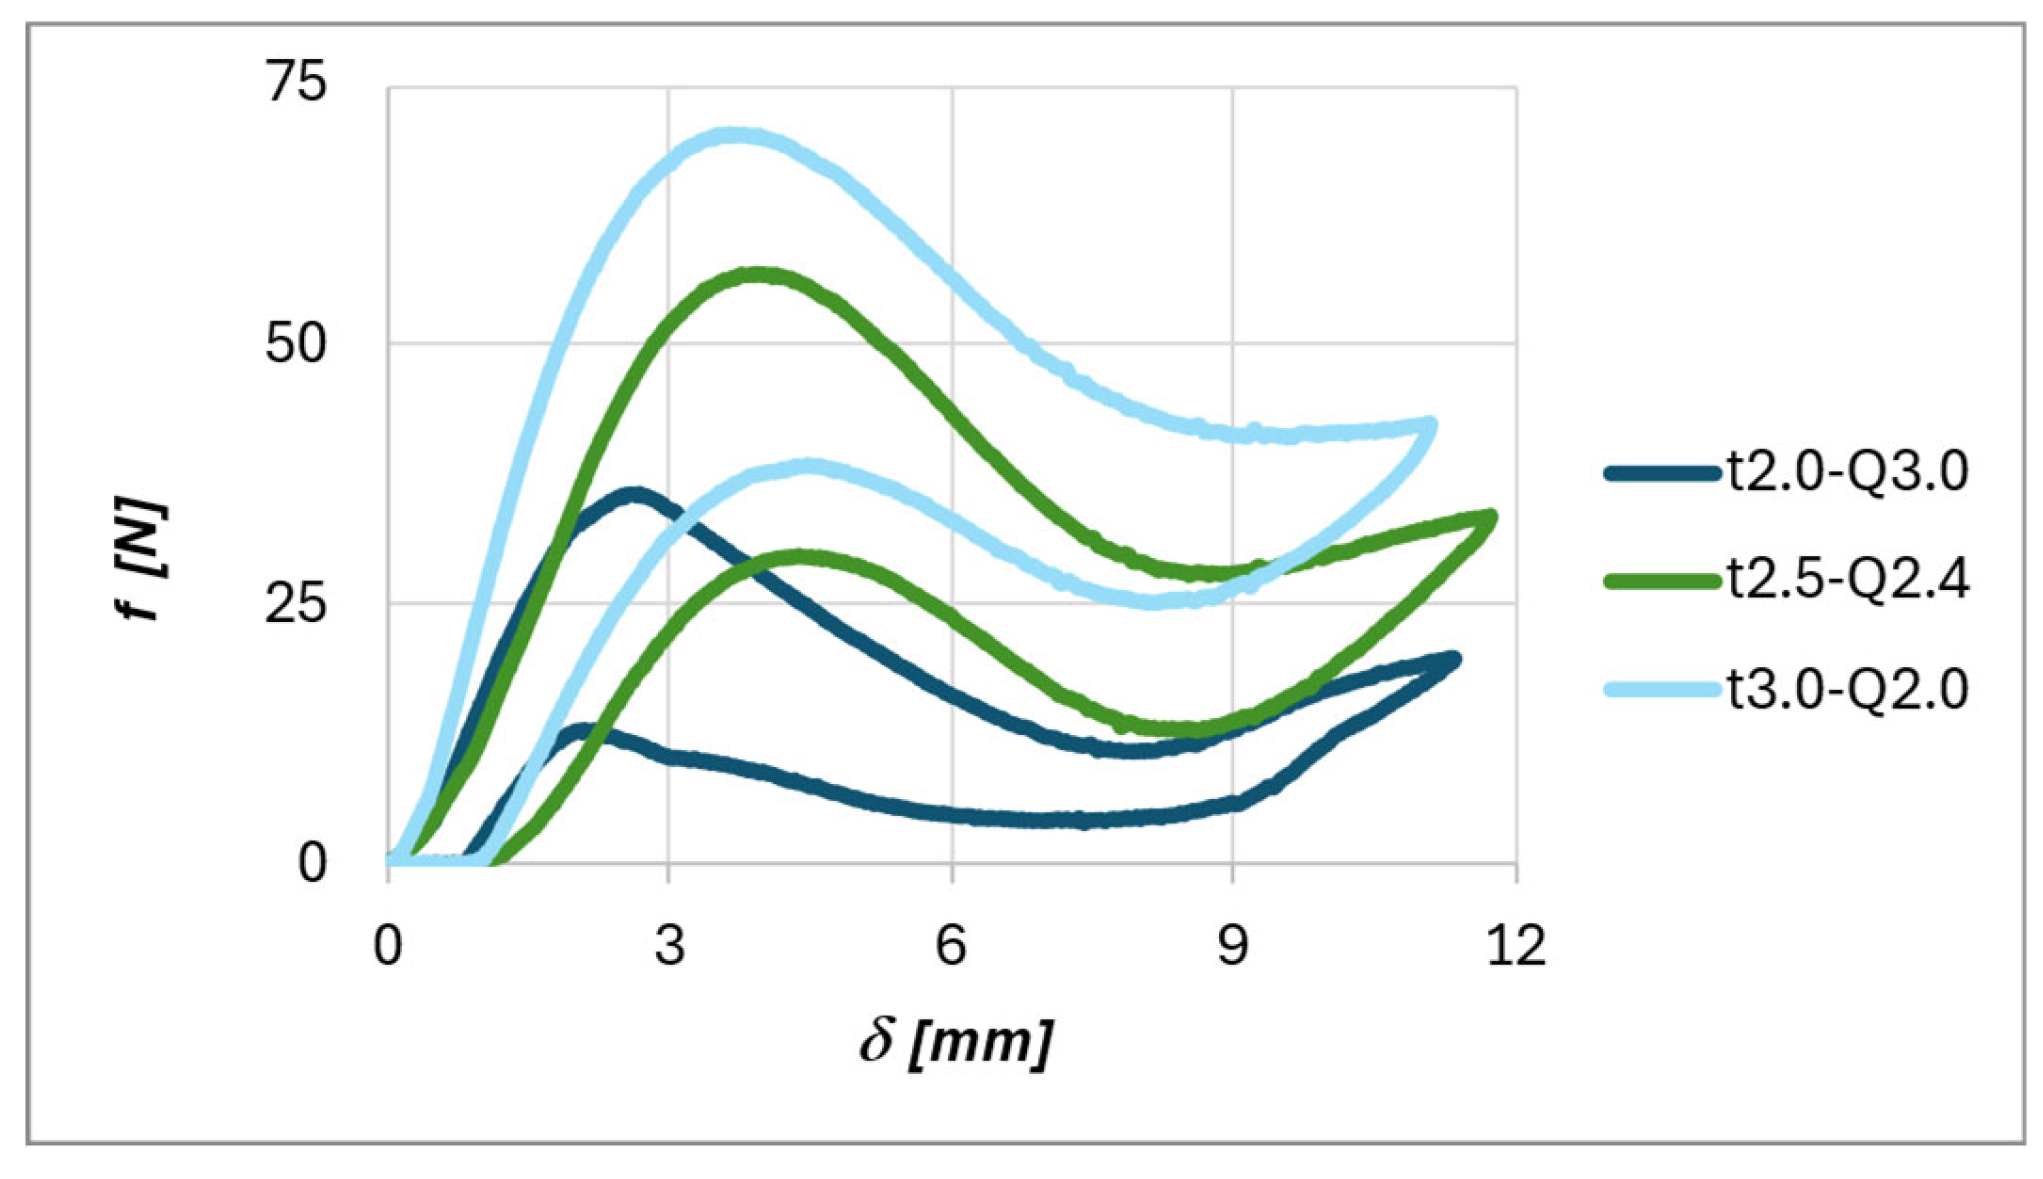
Figure 14.
Compression test of the t2.5-Q2.4 at different loading rate.
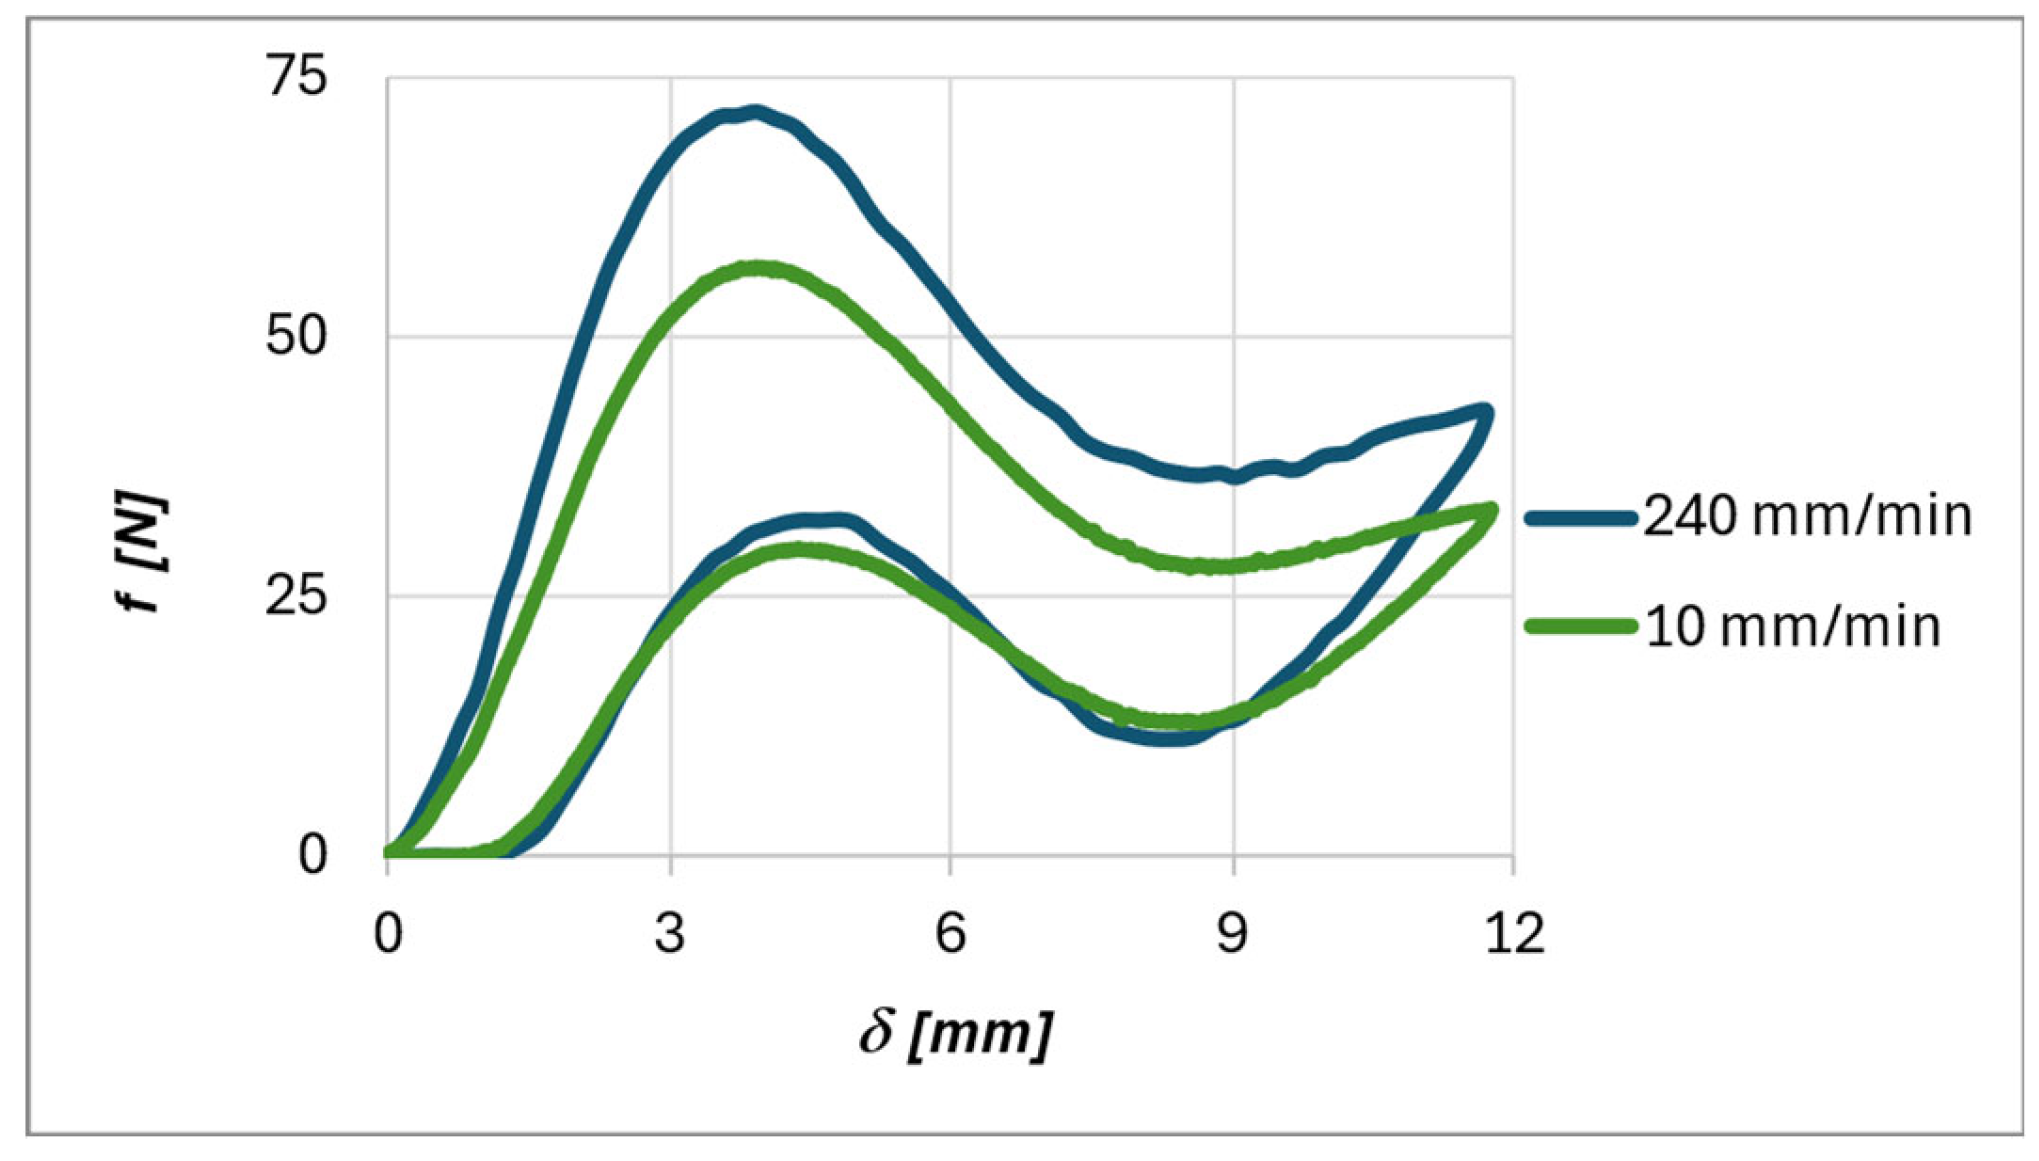

Table 1.
Meaning of the parameters in Figure 2.
| T | Curved beam thickness | h | Amplitude of the cosine curve |
| H | Unit cell height | d | Distance between the curved beams |
| t2 | Thickness of horizontal beams | s | Thickness of vertical supports |
| L | Cell size/Cosine wavelength | b | Depth of the cell |
Table 2.
Print parameters set to produce the test cube in Figure 3.
Table 2.
Print parameters set to produce the test cube in Figure 3.
| Layer Height | 0,1 mm |
| Line Width | 0,4 |
| Wall Line Count | 2 |
| Top Layers | 0 |
| Bottom Layers | 1 |
| Infill | 0 % |
| Print Speed | 30 mm/s |
| Printing Temperature | 230 °C |
| Build Plate Temperature | 50°C |
| Retraction Speed | 25 mm/s |
| Retraction Distance | 1 mm |
Table 3.
Geometrical parameters of double-beam structure.
| Test ID | [mm] | |
| t2.0-Q3.0 | 2.0 | 3.0 |
| t2.5-Q2.4 | 2.5 | 2.4 |
| t3.0-Q2.0 | 3.0 | 2.0 |
Table 4.
Geometrical parameters of the unit cell.
| Q | h [mm] | t [mm] | t2 [mm] | d[mm] | L [mm] | H/2[mm] | s [mm] | b [mm] |
| 2.31 | 3 | 1.3 | 2 | 2.6 | 17.5 | 18 | 2.6 | 15 |
Table 5.
Measured filament diameter values.
| 1 | 1,77 mm |
| 2 | 1,78 mm |
| 3 | 1,77 mm |
| 4 | 1,76 mm |
| 5 | 1,77 mm |
| Average value | 1,77 mm |
Table 6.
Results of the wall thickness measurements on the four sides of the test cube.
| 1 | 0,76 mm |
| 2 | 0,77 mm |
| 3 | 0,77 mm |
| 4 | 0,78 mm |
| Average value | 0,77 mm |
Table 7.
Hardness test results.
| Shore Hardness A/1s [HA ± 0.5] | Shore Hardness D/1s [HD ± 0.5] | ||||
| Top layer | 1 | 85.5 | Top layer | 1 | 38 |
| 2 | 85.5 | 2 | 37 | ||
| 3 | 86.5 | 3 | 39 | ||
| 4 | 88 | 4 | 40 | ||
| 5 | 87.5 | 5 | 38.5 | ||
| Mean | 86.6 | Mean | 38.5 | ||
| SD | 1.140 | SD | 1.118 | ||
| Bottom layer | 1 | 81.5 | Bottom layer | 1 | 35.5 |
| 2 | 81 | 2 | 35 | ||
| 3 | 83.5 | 3 | 35.5 | ||
| 4 | 84.5 | 4 | 37 | ||
| 5 | 82 | 5 | 36 | ||
| Mean | 82.5 | Mean | 35.8 | ||
| SD | 1.457 | SD | 0.678 | ||
Table 8.
Main characteristics of the tested cells based on analytical model.
| Test ID | ||||||||
| t2.0-Q3.0 | 0.467 | 1185.5 | 2.8 | 73.8 | 1.53 | -406.3 | 9.2 | -25.3 |
| t2.5-Q2.4 | 0.494 | 826.1 | 2.96 | 100.5 | 1.51 | -46.9 | 9.04 | -5.7 |
| t3.0-Q2.0 | 0.529 | 634.5 | 3.17 | 133.4 | 1.47 | 144.7 | 8.83 | 30.42 |
Table 9.
Main features of the experimentally tested cells. Parameters marked with a prime (') refer to the loading phase, whereas those marked with a double-prime ('') correspond to the unloading phase.
Table 9.
Main features of the experimentally tested cells. Parameters marked with a prime (') refer to the loading phase, whereas those marked with a double-prime ('') correspond to the unloading phase.
| Test ID | ||||||||
| t2.0-Q3.0 | 2.67 | 35.62 | 7.91 | 10.68 | 2.09 | 12.81 | 7.40 | 3.80 |
| t2.5-Q2.4 | 3.91 | 57.00 | 8.53 | 27.82 | 4.37 | 29.74 | 8.62 | 12.81 |
| t3.0-Q2.0 | 3.63 | 70.25 | 9.57 | 40.97 | 4.47 | 38.37 | 8.10 | 25.04 |
Disclaimer/Publisher’s Note: The statements, opinions and data contained in all publications are solely those of the individual author(s) and contributor(s) and not of MDPI and/or the editor(s). MDPI and/or the editor(s) disclaim responsibility for any injury to people or property resulting from any ideas, methods, instructions or products referred to in the content. |
© 2025 by the authors. Licensee MDPI, Basel, Switzerland. This article is an open access article distributed under the terms and conditions of the Creative Commons Attribution (CC BY) license (http://creativecommons.org/licenses/by/4.0/).
Copyright: This open access article is published under a Creative Commons CC BY 4.0 license, which permit the free download, distribution, and reuse, provided that the author and preprint are cited in any reuse.


