
Submitted:
17 February 2025
Posted:
18 February 2025
You are already at the latest version
Abstract
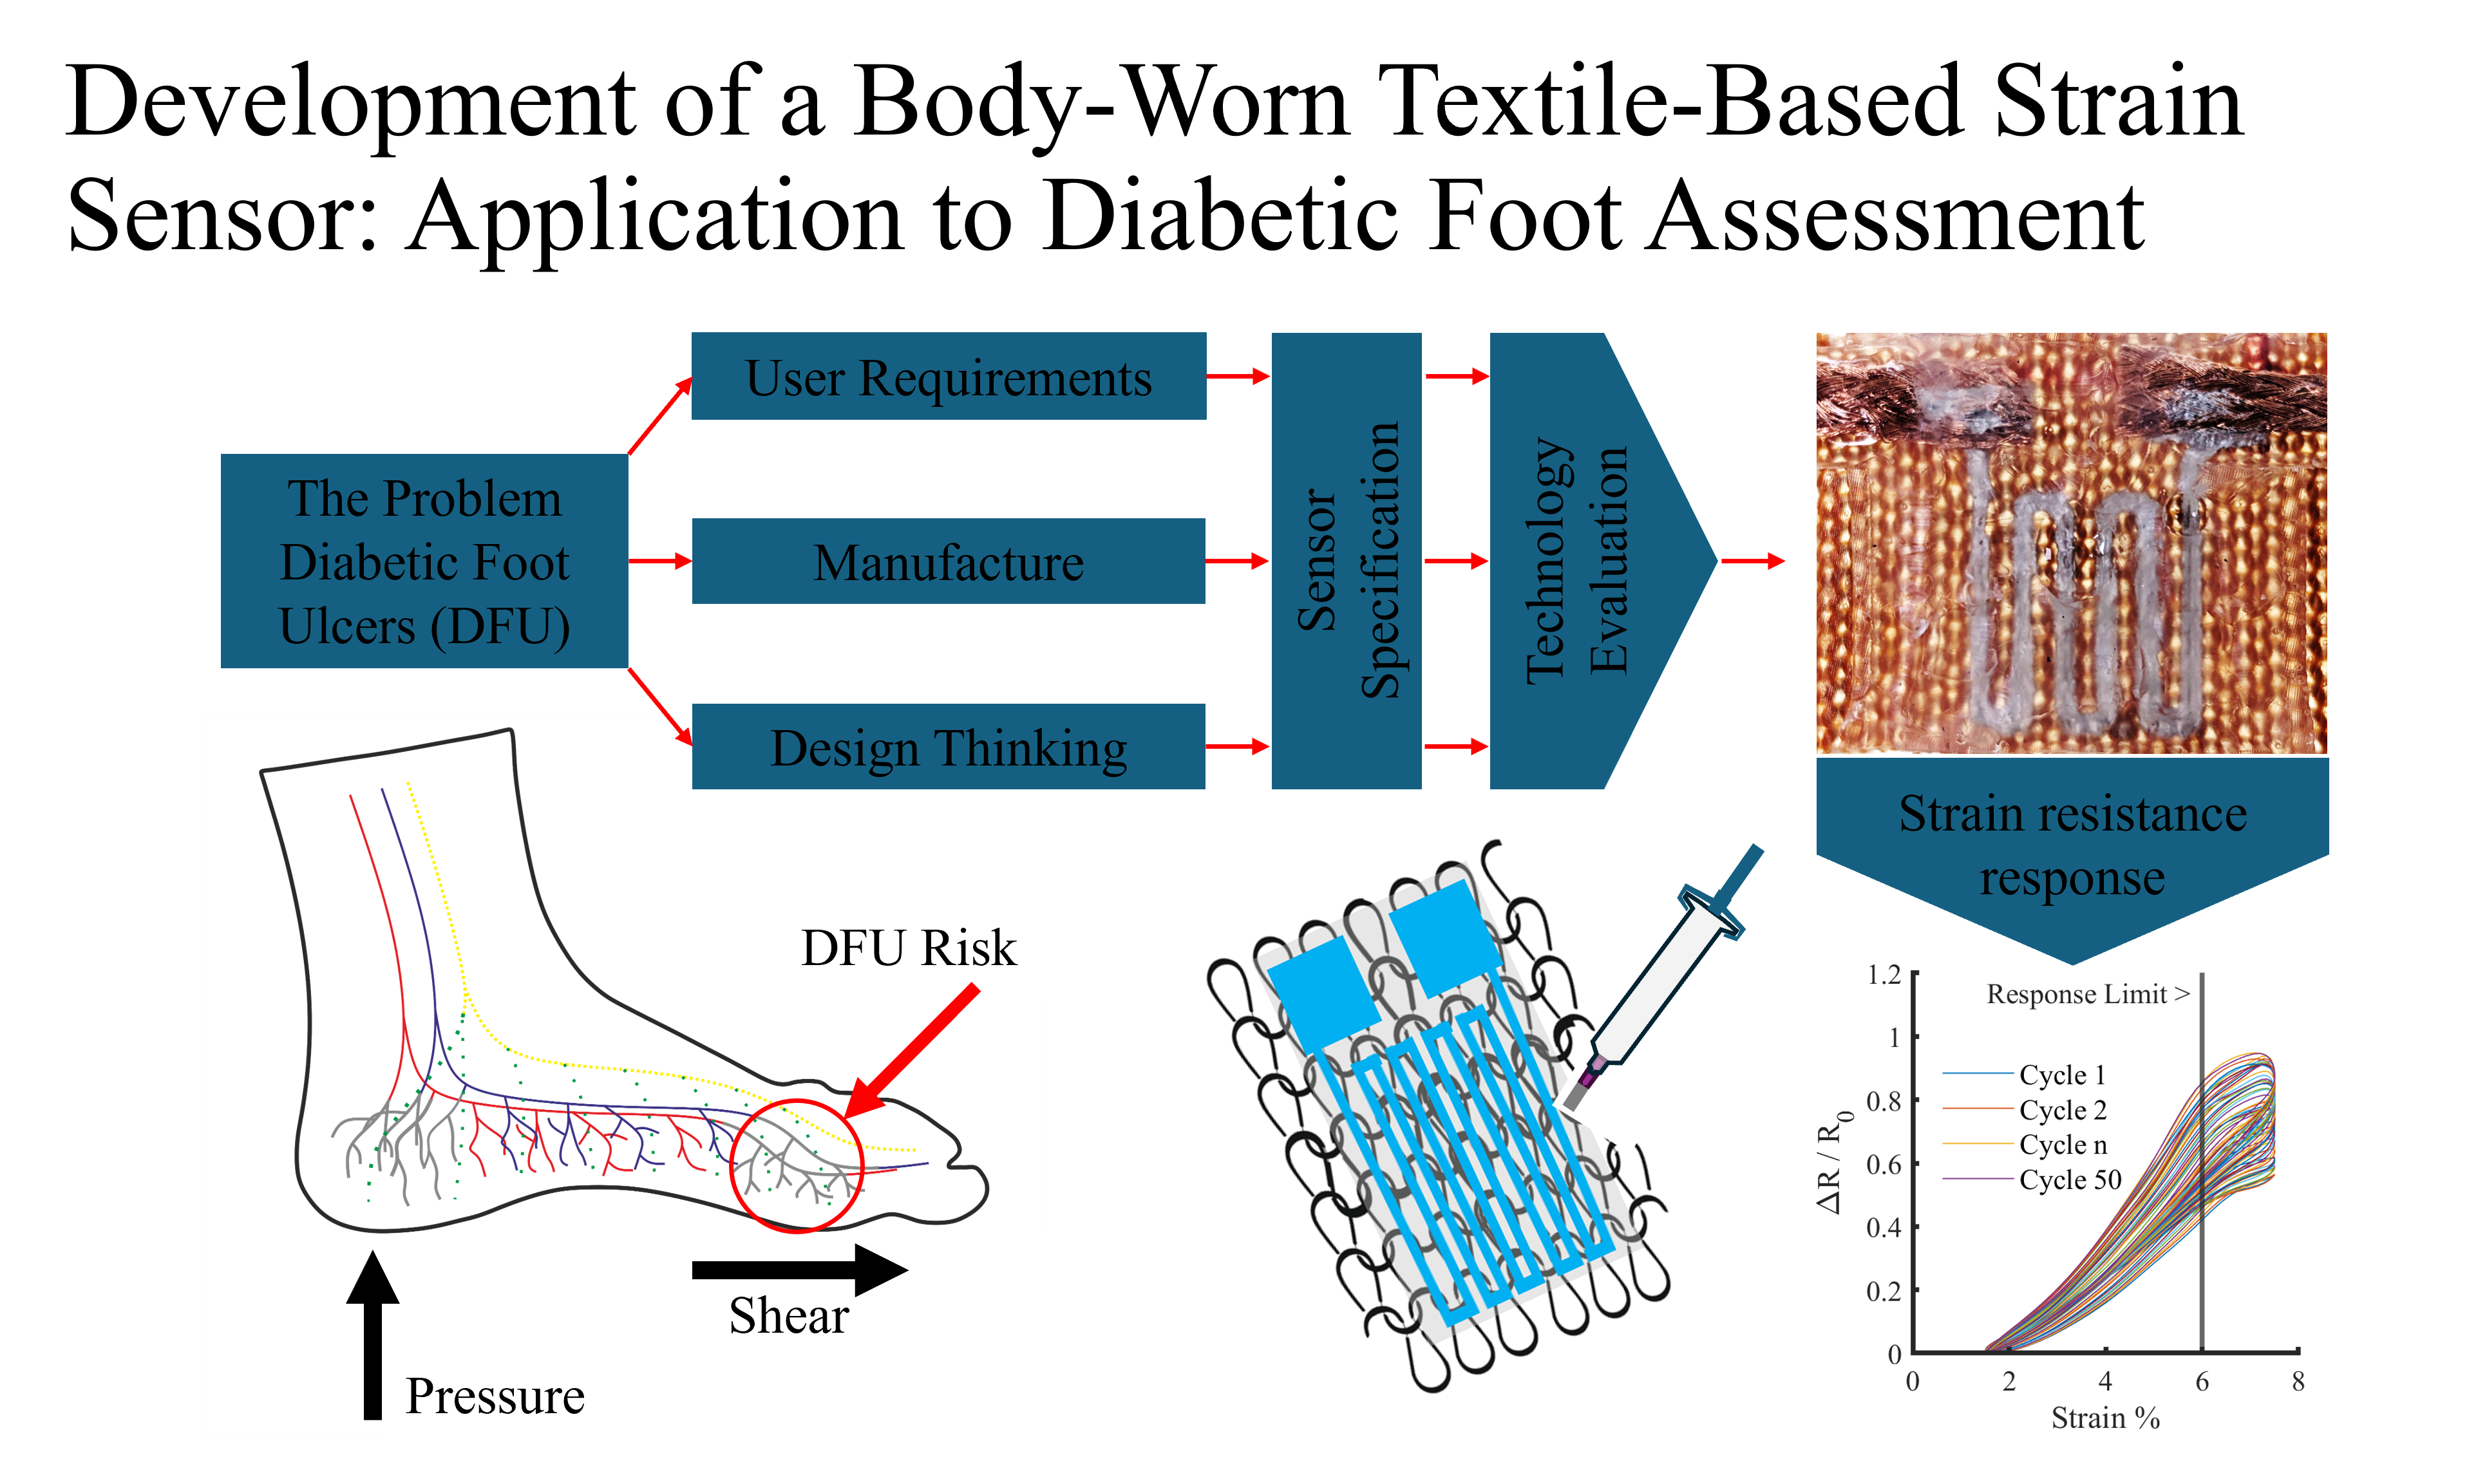
Using body-worn sensors in healthcare can bring yield clinically valuable information but risks affecting the interface under investigation. Diabetic foot ulcers (DFUs) are a significant health and economic burden, frequently leading to limb amputation with a severe impact on patient quality of life. Clinicians and patients urgently require information about foot condition to inform DFU prevention strategies, but the addition of sensors at the foot interface risks causing inappropriate loads and adverse clinical outcomes. This work proposes a novel strain-sensing technology that can be integrated unobtrusively within sock textiles at the foot interface.
Context-specific set of requirements were established to evaluate potential sensing modalities. A total of 12 load-sensing methods were identified, not limited to DFU sensing to investigate possible solutions. Candidate technologies we evaluated against the specification and selected a silver-based adhesive exhibiting strain-sensitive resistance.
Sensor development was undertaken through parametric experimental testing using a stretchable textile substrate. A characterisation process determined the sensor has a resolution of 0.013 $\Omega$ in a range of 0 - 430 $\Omega$ and a range of interest of 0 - 20 $\Omega$. The sensors demonstrated the capacity to cover an appropriate measurement range (0 - 12\% strain). Composite reinforcement increased strain capacity to 20\% during quasi-static testing.
After development, the final sensor design performance was asessed, integrating the sensing unit within a knitted structure produced using an industrial sock-knitting machine. The system was evaluated through a cyclic loading regime. A strain threshold of 6\% was determined with a peak sensitivity gradient of 0.3 \textpm 0.02. A dynamic drift of 0.039 to 0.045\% (total range) was identified over usage, with micro-tearing identified as the mechanism of action.
In conclusion, this study demonstrates a viable textile-based strain sensor capable of integration within knitted structures. It provides a promising first step towards developing a sock-based strain sensor to aid the prevention of DFU formation.
Keywords:
diabetic foot ulcer
; shear
; sensors
; wearables
1. Introduction
Globally, 18.6 million people are affected annually by Diabetic Foot Ulcers (DFUs) [1]. In the UK, DFUs affect up to 25% of people with diabetes in their lifetime, with less than 50% of patients alive and ulcer-free 12 months after a DFU diagnosis [2] and almost 60% of patients experiencing recurrence within three years [3,4]. The integration of sensors within the human-interface boundary creates a paradox known as the observer effect [5]. By attempting to measure an environment by introducing a sensor, the environment under ivestigation is altered [6]. In wearables, a synergy exists between environment, behaviour and the measurement of interest. In the case of physical human interaction, this can potentially significantly impact the response observed. In the specific case of wearables for assessing the interface between foot and shoe, occupying additional internal shoe volume may reduce the space naturally available increasing the pressure observed. This patient group is particularly susceptible to changes in the shoe environment. Within the literature, wearable sensing technologies have been implemented that could be used to monitor DFU-forming conditions. Including monitoring temperature [7], tribo-electric nano-generators [8], perspiration [9] and electrocardiogram [10] among others. However, the primary focus is on interaction forces due to their influence on (DFU) formation. Diabetes can cause tissue structural changes [11], including increased sensitivity to applied forces, resulting in tissue degradation and DFU formation [11,12]. Prolonged exposure to forces normal to the skin has been linked to the formation of pressure ulcers [13,14,15]. Over the last 20 years, work has identified a coupling between normal and shear forces in DFU formation [16,17]. Additionally, nerve damage can result in diabetic peripheral neuropathy, causing reduced patient pain sensitivity and, therefore, the ability to feel and react to an applied force [18]. This set of circumstances means sensors play a critical role in DFU prevention, demonstrated by the history of foot-based sensing systems aimed at DFU prevention.
Insoles have been implemented in assessing foot performance since the early 1990s with systems such as the Tekscan F-SCAN [MA, USA] and Novel Pedar [Munich, Germany] [19,20]. Since then, a range of force-sensitive resistor-based approaches have been produced [21,22,23]. Key issues affecting force-sensitive resistors include drift and part-to-part repeatability. Alternate pressure mapping methods developed include multimodel arrays [24], alternative piezoelectric materials [25], capacitive sensors [26] and fibre optic systems [27,28]. These systems measure the vertical pressure acting perpendicular or normally to the foot’s surface, negating the shear stress components acting parallel to the skin’s surface.
Within the literature, researchers have reported the development of insoles capable of detecting shear since the early 1980s [29,30,31]. In recent years, a range of technologies have been implemented within insoles to measure shear, such as inductive sensor arrays [32,33], magnetic [34,35], capacitive [36], and microelectromechanical [37]. During gait, up to bodyweight is placed through the foot, resulting in a challenging environment to introduce sensitive electronics. A proposed solution is the STAMPS insoles, where a cumulative measure is taken to help identify strain-prone plantar regions [38]. While some systems, such as STAMPS, focus on laboratory or clinic-based measurement for diagnosis or ongoing clinical engagement to identify at-risk areas, they do not provide real-time feedback. This paper therefore, focuses on real-time shear force measurement in daily life. Information would be fed back the wearer so that they can modify foot loading that would otherwise lead to DFU development. The form and method of feedback will not be investigated at this stage.
Not limited to diabetic patient measurement, in recent years, a range of methods have been developed for investigating shear, such as magnetic [39], inductive [33,40] sensors to measure plantar shear [41]. So far, the critical drawback of these methods has been the form factor and the ability to place said sensors within the human interface region. A more in-depth review of sensing technologies, including preliminary replication studies, is presented in Section 2.2, which assesses methods with respect to this application.
A fundamental limitation of insoles is they are limited to use within a shoe. Although it may not be clinically recommended, users often remove their shoes in the comfort of their homes [42]. A textile-based approach with sock-integrated sensors enables continuous tracking with users wearing the sensing technology as they wish. Additionally, insoles are not compatible with every shoe style due to the available volume within the shoe. Although some insoles are thin, they will occupy additional volume, potentially increasing pressure on the bridge of the foot. The increased tissue sensitivity in people with diabetes increases the importance of technologies within the human interface. Using a textile-based approach allows us to swap items already present in everyday life, avoiding the additional material and minimising the interference caused by the technology within the human interface region. In some instances, people with diabetes may be required to wear custom orthotic insoles and can not use an instrumented insole. The textile-based approach, therefore, increases the number of people who can benefit from monitoring. While a sensorised shoe could be implemented, significant design and performance constraints and requirements exist. Patient engagement with technology will determine how likely they are to use it daily. A shoe-based system would be limited in design, reducing the individual’s ability to choose a style, a major concern for patients [42].
One of the critical challenges faced in this research field is the direct measurement of shear, which typically requires the parallel movement of two planes [40,43,44]. This leads to inherent design challenges regarding system miniaturisation and robustness. Instead, the measurement of strain is proposed as a proxy for shear. In the case of measuring shear applied to a foot, it is assumed that shear leading to tissue deformation will simultaneously generate a strain response within a textile in contact with said soft tissue. Therefore, infering a shear force has been applied. This assumption was the primary mechanism of action taken forward for selecting and evaluating sensing modalities and materials in this research.
In this paper, a textile-based strain sensor in proposed where strain is taken as a proxy of shear at the skin in wearable devices. Section 2, sets out the specification of a strain sensor for use within the physical human interface to assess DFU risk. Currently available techniques are then reviewed with some replications before selecting the material taken forward in sensor development. The evaluation process included some preliminary testing and was specific to the application of this study; therefore, it was intentionally separated from the literature review. Section 3, sets out sensor development, including the manufacturing techniques and parametric assessment, to identify a design best suited for the application. Section 3.4, evaluates sensor performance and demonstrate repeatability both in sensor output and manufacture. Finally, Section 4, applies the sensor to a knitted substrate, consistent with the application, and demonstrate a sensor proof of concept.
2. Materials and Methods
2.1. Scope
This research focuses on measuring shear forces within a smart sock to inform interventions preventing DFU formation. Our approach is focused on the development of a system capable of integration within the existing industrial knitting machines used to fabricate socks at scale for the mass market. This focus led us to develop an application-specific scope for assessing the potential technologies available to solve this problem. The specification summarises the requirements (Table 1).
People with diabetes have an increased risk of developing peripheral arterial disease, which can inhibit blood flow and oxygen supply to the extremities [3]. Hyperglycemia can lead to the degradation of soft tissues in the extremities, leaving them more vulnerable to injury [11]. Where nerve endings are damaged, neuropathy can develop with reduced sensation [18]. Combined with the proximity of the sensing technology to the skin and any potential openings, the method’s biocompatibility is essential. While sealing from the environment can be undertaken, biocompatibility at failure must be considered to ensure no harmful materials are released where they could affect biological systems. Due to tissue sensitivity experienced by people with diabetes, even seams in socks can lead to DFU formation [42]. Thus, care must be taken in both material choices and ensuring the designs do not produce artefacts such as ridges within the sock material.
Although starting at a conceptual phase, the project focused on methods ready for translation and scale-up to higher Technology Readiness Levels (TRLs) without significant additional development. Accordingly, the approach focused on sensors fabricated from commercially available materials, as opposed to materials development, which brings potential time, cost and regulatory constraints. The overall technology should also be scalable and low-cost per unit to facilitate adoption within sock garments.
2.2. Technology Evaluation
During the initial investigations, the authors set out to implement or adapt pre-existing strain sensor methods published in the scientific literature [31,45], reviewing them against the specification (Table 1) for appropriateness. Various technologies and approaches were investigated, covering broader electrical interactions such as inductive, capacitive and resistive, followed by narrower material selection investigations such as carbon and silver-based approaches. Although optical fibre-based sensing in an established sensing method [46] it was excluded due to the fragility of fibres, plantar-foots high force environment (SID 1) and the lack of reinforcement in the textile substrate, marking optical fibres as inappropriate for the application. Magnetic approaches [47,48] were excluded due to the requirement to include hall-effect chips creating pressure points within the textile (SID 7). A graphical summary showing the sensor materials and methods that were explored is shown in Figure 1.
2.2.1. Self-Generating
Self-generating sensor methods focused on triboelectric nano-generators were evaluated. A fundamental mode of action is linear sliding, involving parallel anode-cathode pairs sliding against each other, which naturally lends itself to shear force detection. Several authors have demonstrated triboelectric generators in human interface applications [8,49,50,51]. While the technology is promising for future shear sensors, the production methods may not be suitable for scaled production (SID 3, 4) [50,52,53]. The ability to rapidly develop this technology and incorporate it within the selected textile was limited within the project timescales due to a lack of compatibility with the chosen industrial knitting machine (SID 5).
2.2.2. Capacitance
Capacitance-based sensors implemented through yarns were investigated. These can be implemented directly through knitting or as structures embroidered onto a textile surface. Similar efforts for other applications have investigated embroidery to produce pressure sensors in bedding [54] and chairs [55]. The possibility of implementing alternating rows within the knit structure itself was investigated. Fobelets et al. demonstrated the approach in their 2019 paper [56]. The requirement for compatibility with a mass-production knitting machine limited the ability to implement this method (SID 5) as it severed yarns when changing types, interrupting electrical pathway continuity. Manual reconnection of yarns would be impractical across large production volumes. Additionally, localisation (SID 6) requires the discrete distribution of sensing units across a sock, whereas the process set out by Foblets et al. provides a global response. Given the issues observed with capacitance-based approaches, a yarn-based inductance approach was excluded.
2.2.3. Resistive: Yarns
The authors could not source commercially available yarns with a resistive strain response. Within the e-textiles academic literature, custom yarns with a resistive response have been produced by layering conductive and nonconductive elements [57,58,59], surface coatings [60,61,62] and electro-spinning of PEDOT [63]. While each method demonstrates its ability to produce a resistance response under strain, they do not fit within the project specification. Namely using commercially available material without significant or expensive processing equipment (SID 3) [61]. Preliminary investigation identified that the commercially available conductive yarns would not be compatible with the required manufacturing processes (SID 5), due to needle gauge specifications [64]. Similarly, the development of a custom yarn lies outside the project’s scope (SID 3) and has been achieved by others in the literature [57,58,59,60,61,62,63]. Additive methods were sought to be implemented, including silicone-encapsulated conductive materials [65] and doping methods/techniques [66,67]. To narrow the scope of the investigation, two conductive materials were selected: carbon and silver.
2.2.4. Resistive: Carbon Particles
Carbon is well established within the sensor development community with variants such as nanotubes (CNTs) [68,69,70,71]., nano-fibres (CNFs), carbon grease [72], carbon black powder (CB)[65,72,73], inks [74] and graphene [75] well researched within the literature. Carbon grease was not investigated as wanted a solid sensor was required to mitigate the risk of leaking in the event of failure (SID 2). Although a potential solution, graphene requires high-cost equipment for its production (SID 3). Inks were not included as future work will require washing the sensor, and inks are more susceptible to washing off.
CNT have produced a repeatable compression response [68,69,70,76]. While an effective sensing response method, CNTs require extensive clean laboratory infrastructure due to their inherent toxicity. Carbon Nanotubes, therefore, fail to meet the biocompatibility requirements due to leaching if the sensor becomes damaged (SID 2). Additionally, the manufacturing environment produces scalability challenges during early development (SID 4).
CNF were implemented, achieving conductivity; however, carbon structures are known to inhibit the curing of platinum-based silicones such as Ecoflex 00-30 [Smooth-on Inc., PA, USA]. It was observed that achieving a mixing ratio suitable for conductivity resulted in cure inhibition. Therefore, the CNF-silicone paste was encased within silicone. When tested with a voltage divider setup, a voltage strain response was observed during tension-release cycles. However, due to the paste’s non-solid nature, relaxation within the structure outside the movement was observed, reducing the voltage detected (Figure 2). While the shearing of the CNF paste could produce a response, inconsistent results are likely once a normal force is applied. Importantly, with up to bodyweight being put through the foot during gait, there is a significant risk of rupture (SID 1, 2).
CB has been successfully implemented in the production of stretch sensors where the carbon black is set within silicone [65,72,73]. CB’s use in this application was investigated, and it is significantly safer and has a lower cost than CNTs. Attempts were made to recreate the work of Zhu et [65] and Muth et al. [72], who created sensors using a CB mixture embedded within a silicone substrate. CB can typically be sourced in three sizes: 20 nm, 50 nm and 75 nm. The initial investigation used 20 nm and 75 nm carbon black (CB) [SGL Carbon GmbH, Germany]. It was observed that 20 nm was not sufficiently conductive; the small particles lacked electrical continuity once mixed with silicone. Conductivity could only be achieved using high ratios of CB that inhibited silicone curing. Conversely, 75 nm produced a curable silicone but yielded high resistance (1-10 M range) with poor sensitivity, making it challenging to adopt as a sensor. Therefore, the 50 nm CB used by other researchers [65,74] was selected as the middle ground regarding property response. The 50 nm CB was taken forward as a potential solution. In parallel to the investigations discussed so far into yarn-based and carbon-based approaches, the possibility of a silver-based sensor was investigated.
2.2.5. Resistive: Silver Particles
Selected for its high conductivity and anti-bacterial properties, silver exhibits a higher conductivity when used as a sensing element. Three silver-based methods were investigated: inks, flakes and adhesives.
Silver conductive inks are typically used by doping a substrate [77]. Preliminary tests found the silver ink [Thermo Fisher Scientific, MA, USA] saturated the knitted base layer, providing excellent conductivity but little to no change detectable in resistance with strain. Therefore, it gives a poor ability for use as a sensor. With future development, silver inks could offer an excellent method for connecting sensors and electronics along the sock’s length. However, consideration would need to be taken regarding the washing and encapsulation of doped regions.
Another method reported within the literature involves using silver flakes suspended within a silicone substrate [78,79]. The silver flakes are typically coated in a lubricant for storage and dispensing, preventing the flakes from aggregating. The manufacturing process involves heating samples above 250°C to remove most of the lubricant [80]. Reaching similar levels for textiles such as Lycra (≈ 230–270°C) and nylon (≈ 255°C), commonly used in sock production. Matsuhisa et al. and Yoon et al. heated their samples to trigger the thermal decomposition of the lubricants at temperatures of 120 °C [78], 130°C [79] and 180°C [81]. While conductivity was achieved, it was only achieved at 250°C, which takes the temperature too close to the estimated melting point. The high mixing ratios required to achieve conductivity, related cost, and cure temperature meant that using silver flakes in their basic form fell outside the application scope (SID 4, 5).
Therefore, investigations focused on products that included silver flakes that could be cured at a lower temperature, selecting a silver adhesive [Dycotec DM-SAS-10010, Dycotec Materials Ltd., Calne, UK]. Designed to replace the solder in wearable technologies, the conductive adhesive provides the secure connection of components and the elasticity to absorb some movement that would typically cause fractures in a solder-based joint, leading to delamination or connection quality reduction. In its typical application, the changes in resistance would be minimal. A strain-dependent resistive response was identified, with the conductive adhesive selected for further investigation and evaluation of its suitability in sensor production. The conductive adhesive is supplied in a syringe, aiding manufacturing through 3D printing with a fine resolution.
2.2.6. Evaluation Summary
In Section 2.2, sensing technologies were evaluated against the specification (Table 1). Two potential candidates were identified to be taken forward: 50 nm CB and conductive adhesive. While the CB options provide an effective sensing method, it is a known carcinogen and poses risk to an already sensitive tissue boundary (SID 2). In contrast, silver has antimicrobial properties and low toxicity [82]. The conductive adhesive used in this study is commercially available and meets the higher TRL solutions (SID 3) and scalability requirements (SID 4). Thus, conductive adhesive was selected as the basis for this work. The sensor will follow the established strain gauge structure, providing sensitivity in an isolated direction of movement (Figure 3). The sensor will be manufactured through 3D printing with the supplied syringe connected to a pneumatic dispenser. A parametric design study was undertaken to identify the final design’s dimensional properties.
3. Sensor Development
The sensor development was undertaken in three stages: 1) the production of a manufacturing platform, 2) a preliminary investigation via parametric testing to identify the sensor’s form factor and 3) a secondary investigation focusing on improving sensor robustness.
3.1. Design and Manufacture
The sensor was manufactured using a 3-axis CNC linear stage with a G-code controller [WorkBee Z1+ CNC, Ooznest, Brentwood, UK], selected to provide a modular system with precise control (±0.1 mm accuracy) for repeatability in sensor production. The CNC platform was augmented with a precision syringe dispenser [Ultimus V High Precision Dispenser, Nordson, Westlake, OH, USA]. The dispenser was selected for precise control and trigger system, aiding automation and production repeatability. The CNC and dispenser were linked to enable automated dispensing via a G-code trigger mechanism, as shown in Figure 4.
While this project’s ultimate objective is to print sensors onto a knitted sock fabric, a woven lycra substrate was selected during development to speed the development process. A laser cutter [VLS3.60DT, Denford Ltd, Brighouse, UK] was used to cut uniform mm Lycra patch samples for printing. Each patch was secured using a laser-cut jig (5 mm acrylic) onto the CNC base plate. The CNC Z axis was then zeroed to the plate surface using a touch probe.
The sensors were designed in CAD [Solidworks, Dassault Systèmes, France] to facilitate parametric design adaptation. Designs were exported as DXF files and imported to a G-code generator [Cut2D, Vetric, Redditch, UK] for printing. Sensors were printed by loading pre-filled syringes of conductive adhesive into the dispenser, fitted with a 22 gauge (0.41 mm) leur dispensing tip [Adheisive Dispensing, Milton Keynes, UK]. An iterative process identified the optimum operating parameters for printing, dispensing at 4.5 PSI while the print head was moved at a constant 30 mm/min with a pass depth of 0.25 mm. Each sensor was made of parallel overlapping tracks. Sensors were cured for 30 minutes with cure temperature further investigated in Section 3.2.
3.2. Design Parametric Testing
The CNC manufacturing approach provided a repeatable basis for iterative design optimisation through parametric investigation. Three parameters were investigated to help improve sensor performance. First, the number of turns within the strain gauge style design is explored to enhance sensitivity to an applied strain. Tree, five and seven turns were selected, with an odd number chosen to produce polar endpoints for strain testing (Figure 5.a). Secondly, sensor length was investigated to understand the impact on perforamnce, with potential benefits linked to increased sensor area encompassing more potential strain. Lengths of 10, 20 and 30 mm were selected (Figure 5). The manufacturer quotes the conductive adhesive’s cure temperature as influencing stiffness [83]. The affect on performance was investigated, 80, 90 and 100°C were selected as the lower end of the recommended cure range of 80-120°C range. Greater elasticity may benefit performance; therefore, 75°C cure temperature, below the recommended levels, was selected to assess any difference. A base setup was chosen as the default case during parameterisation, from which a single variable would be altered. The sample consisted of a 30 mm long sensor with seven turns cured for 30 minutes at 80°C.
All samples were prepared using the manufacturing processes described in Section 3.1 and shown in Figure 4. Three samples were produced for each parametric variation, and five test repeats were taken for each sample (total N = 45). Preliminary testing produced dogbone samples of the conductive adhesive to undertake stress-strain testing according to BS EN ISO 527-3:2018. Due to the amount of conductive adhesive required and material cost, only two samples were tested for destruction to provide an estimate for the conductive adhesive’s elastic region. This provided the necessary data to identify appropriate test parameters, determined as 10% extension as the elastic limit for 80°C cured conductive adhesive.
Testing was undertaken on a single-axis universal load tester [Instron 5943, High Wycombe, UK] equipped with 250 N pneumatic jaws [Instron 2712-052] to safely secure samples and a 500 N load cell [Instron 2580-500N]. Quasi-static testing was undertaken between 0 and 10% of the sensor’s length at intervals of 1%. The samples were of different lengths, resulting in a different extension value. A 20-second pause was added between loading periods with a 40-second pause at the start, peak and end (Figure 6).
Data was collected using a data acquisition board [MAX31865, Adafruit, NY, USA] connected to a microcontroller [Arduino Mega, BCMI, WA, USA], which streamed data to a custom user interface [Processing IDE]. Data processing and analysis were undertaken in Matlab [v2024, MathWorks, MA, USA]. A data synchronisation signal marked the start and end of the load operation to align the independent datasets. A low-pass filter (f = 2 Hz) was applied to attenuate high-frequency noise from the data. Given the low speeds under investigation, a passband of two was selected. A moving average filter was applied using convolution to smooth the data using a window width of four. Following filtering the data was normalised against the change in resistance and starting resistance to give . Following the quasi-static loading regime, an average was taken for each window defined as the 20s or 40s static regions (Figure 6).
A one-sample Kolmogorov-Smirnov test highlighted that the data was not normally distributed. The Kruskal-Wallis test was applied to determine any significant difference between data sets (Figure 7.a). There was no significant difference between the results with P values of 0.597, 0.923 and 0.827 when comparing three and five, three and seven, and five and seven turns, respectively. The response curve shows that three and five turns produce a more consistent response with standard deviations of 0.561 and 0.384, respectively. Five turns were selected with the most consistent response.
Overall, the three samples returned similar results (Figure 7.b). The Kruskal-Wallis test was applied and found no significant difference between values with P = 0.761, 0.240 and 0.634 for 10 vs 20 mm, 10 vs 30 mm and 20 vs 30 mm, respectively. Given the lack of a significant difference in response between lengths, 10 mm was selected as it provides the highest sensor density potential on a given surface, leading to localisation across an array (SID 6).
The response is dependent on cure temperature and the associated stiffness change. Shown with a log scale on the Y-axis (Figure 7, there is a significant difference (P = 0.028) between the 75°C and 100°C datasets. The cure temperatures are paired, with a high similarity between 75°C and 80°C (P = 0.986) and 90°C and 100°C (P = 0.970). Although they did not reach statistical significance the 75°C and 90 °C (P = 0.090), 80°C and 90 °C (P = 0.191), and 80°C and 100°C (P = 0.070) there are visible differences. From these results a curing temperature of 75°C was selected. Together, these produce the following parameters for a base sensor design (Table 2).
3.3. Robustness Improvements
After parameteric testing, the sensor produced viable performance but exhibted signification variation between samples, with coefficients of variance of 0.62±0.045. Accordingly, two approaches were investigated to improve sensor robustness: increasing the conductive adhesive quantity and reinforcement using a secondary material. Increasing conductive adhesive while improving sensor robustness significantly increases conductivity, reducing the sensor operating range.
Three methods were identified to increase conductive adhesive, double-width (DW; Figure 8.a), expanding the trace width with a second pass; double-layered (DL, Figure 8.b) where two single-width sensor layers are stacked vertically; and a combination of the two which will be referred to as the Quad setup (Figure 8.c).
The same quasi-static test method and processing (Section 3.2) was used to assess robustness improvements, using a single sample tested across five repeats for each technique (n = 15; Figure 8.d). The addition of conductive adhesive reduced the sensitivity to strain with dropping from the 1-1.5 range compared to the peak of 2-3.5 observed during parametric testing. Although not significantly different (P = 0.440), the selection of DW vs DL appears to influence sensitivity at low strain levels, although the response is lost as strain increases. Interestingly, although there was no significant difference between DW and Quad (P = 0.312), a significant difference was observed between the DL and Quad samples (P = 0.020). The addition of conductive adhesive improved the coefficients of variance to 0.222 ±0.107 (DL), 0.257 ±0.133 (DW) and 0.296 ±0.111 (Quad). The Quad (Figure 9) was selected to be taken forward due to the superposition response of DW with a low strain response and DL with a high strain response. In the final sensor design, the corners were filleted to reduce the risk of crack propagation at turn points.
3.4. Lycra Performance Evaluation
Three phases of testing were used to characterise sensor performance. The first sought to investigate the influence of static drift and pressure on sensor performance. The second repeated the previously used quasi-static loading regime. Finally, sensor performance under cyclic loading conditions was investigated, the most representative of foot loading during gait.
Quasi-static testing of the final quad design highlighted no significant difference between sample responses in the Kruskal-Wallis test, with an average P value of 0.791 (Figure 10). The average percentage deviation from sample one of 11.38% demonstrates the repeatability achieved in sensor manufacturing and the improved robustness of the quad form factor.
Sensors such as force-sensitive resistors exhibit resistance drift when unloaded. The sensor response was, therefore, investigated. Three samples were left for 10 minutes without any applied load for the first test to identify a static drift, a common occurrence in resistance-based sensors. The test was repeated five times for each sample. The sensor exhibits a gradual negative drift of across the 10-minute interval, equating to 0.037% of the total range. This is due to a relaxation effect observed in the polyurethane substrate. A similar response would be seen if a silicone-based substrate was used.
In the assessment of gait and plantar loading, cyclic loading provides a representative test scenario. The sensor was evaluated over 50 cycles at 10 mm/min with three consecutive sets, representing a short walking burst. The initial investigation highlighted that cyclic strain between 0 and 10% resulted in an upward resistance drift at increasing rates (Figure 11).
3.5. Mechanism of Action
Although there is a return to baseline during unloading, when loading resumes the resistance response returns to the endpoint of the previous set (see Figure 11.b and Figure 11.c), suggesting a failure-related mechanism. The mechanism of action behind the gradual upward dynamic drift in resistance sensing response was investigated. Given that increasing the cure temperature increases conductive adhesive stiffness, it was hypothesised that this upward drift may relate to micro-fractures within the elastic polyurethane substrate of the conductive adhesive. A scanning electron microscope (SEM) was used to image lycra samples in relaxed and stretched states (Figure 12).
The SEM imaging shows a uniform surface with no evident deformation in its unstrained form (Figure 12.a and .b) even though the sample was tested before SEM and the drift response observed (Figure 11). This demonstrates the return to a baseline resistance observed when strain is removed (Figure 11). When the sample is clamped in a position of approximately 10% strain, surface changes are visible at 50× magnification (Figure 12.c). At increased magnification, there are clear strain patterns with the polyurethane substrate. More significantly, tears were observed within the substrate creating voids (Figure 12.d). These micro tears were observed down to lengths of 5.15 ±0.24 with widths of 1.68 ±0.09 (Figure 12.e). Similar mechanisms of action have been observed by Yoon et al. [79], who described "conductive bridges" surrounding cracks enabling the sensor to continue performing. Similarly, Shen et al. [84] observed crack formation in flexible sensor substrate above 10% strain.
3.6. Reinforcement of Sensing Element
Having identified a mechanism of action, sensor robustness improvemetns were sought . These started with reassessing the conductive adhesive’s cure temperature. The manufacturer recommendations are between 70°C and 120°C. However, with a known stiffness relationship and a goal of maximising elasticity, cure temperatures between 50°C and 80°C at 10°C intervals were investigated.
As shown in Figure 13.a and b, the lower curing temperatures improve the response, significantly reducing the drift compared to baseline. This suggests cure temperatures of 70°C and 80°C exhibit the response linked to micro-fractures (Figure 13.c and d). It is expected that the manufacturer sought stiffer connections for electronics where movement is kept minimal in comparison to the dynamic nature of this application. Although there is no significant difference between 50°C and 60°C, the lower cure temperature was selected for potential elastic capacity.
3.6.1. Knitted Substrate Implementation
To facilitate rapid prototype development and ensure a uniform substrate, a Lycra substrate was employed because it could be laser cut to produce identical samples. The approach was then translated to a knitted substrate, with sensor samples produced using the same methods as for Lycra, including dispensing rate and movement speed (Section 3). In addition, SEM was used to investigate how the conductive adhesive integrated with the different substrates, as shown in Figure 14. (Figure 14.a) highlights the smooth and uniform nature of the Lycra yarn and the low interstitial spaces between the filaments which preclude mechanical interlock forming, resulting in low conductive adhesive adhesion. Highlighted by the minimal coating found along the edge in the magnification (Figure 14.c). In contrast, the knitted natural fibres have protruding fibres that provide interstices distributed across the textile surface (Figure 14.b). These stray fibres and a higher visible surface roughness result in improved integration, with fibres acting to reinforce the conductive adhesive to form a composite. Similarly, where contact is made between the natural fibres and conductive adhesive, there is a higher level of ingress along the fibres (Figure 14.d). During preliminary sample testing, the natural fibres formed a composite structure with the conductive adhesive reinforcing the knitted yarns. This was observed in the need to strain the sample to 20% to achieve the same resistive response observed within the 0-10% range in the Lycra samples. Additionally, a reduction in drift was observed, it is hypothosised that composite structure reduced the frequency of micro-tears in addition to the improved adherance observed in Figure 14.d, improving overall robustness.
3.6.2. Sensor Encapsulation in Silicone
During use, the sensor requires protection from outside elements, such as sweat, that would create an electrical short. Therefore, the cured sensor were encapsulated within silicone. In addition, the encapsulating silicone can be selected to fine-tune the force response of the strain sensor (by selecting softer or stiffer silicones). A range of biocompatible commercial silicones were selected (Exoflex 00-20, 00-30 and 00-50) for assessment in this context.
The silicones reinforcing the sensor resulted in a statistically significant difference (P<0.05) in resistance response. Being the least stiff, the 00-20 silicone provided the least support for large resistances reported. The 00-50 silicone responded within a similar range as 00-30. However the 00-30 silicone was selected due to more consistent response trajectory between samples with an intersample standard deviation of 0.139, compared to 0.299 and 3.95 for the 00-50 and 00-20, respectively.
4. Final Sensor Design and Evaluation
This section evaluates performance of the finalised sensor following the development reported in Section 3.
The finalised design incorporates six turns, adding an additional turn (with respect to earlier prototypes) to achieve level termination typical of conventional strain gauge design, as shown in Figure 16. The sensor follows the "quad" design with a length of 10 mm. The sensor was reinforced with an encapsulating layer of Ecoflex 00-30. Testing was undertaken using a cyclic loading regime across 100 cycles, which was repeated three times for each of three samples using the same setup as Section 3.2. The sample was clamped within the pneumatic jaws at a distance of 10 mm, allowing the sensor to be entirely located between the jaws. This baseline start position is equal to a 0% strain. The strain was applied to the sensor at a rate of 10 mm/min, with strain moving between 1.5% and 7.5%. The pre-strain was added to represent the slight stretch present when wearing a textile garment. Data analysis extracted sensitivity, dynamic drift, and hysteresis metrics to assess sensor performance. An example data set can be seen in Figure 17 where the left axis (blue) represents the cyclic strain loading regime and the right axis (orange) represents the resistance measured across the sensor.
Although significantly reduced following the sensor development above, some drift remains in the sensor response, evident with an increase in the peak value across the 100 cycles (Figure 17.a). For this study drift is defined as the increase in resistance per cycle relative to the total measurable range (430 ). The three samples exhibited a dynamic drift of 0.039±0.014%, 0.045±0.021% and 0.045±0.019%, respectively. Relative to the chip’s measurable range (0-428), the sensor produces an output within the operating range of the data acquisition system for approximately 2275 (±562) cycles before the chip reaches saturation.
The final sensor, including encapsulation, operates with a reliable linear response in the 0-6% range (Figure 17). While lower than the response exhibited in preliminary testing, this is sufficient for the requirements of this application. Based on this strain limit, the sensor’s sensitivity was calculated with the linear best fit gradient of strain between 1.5% and 5%, where the response is linear (Figure 18.c).
An increase in sensitivity was observed in each of the three samples over the 100-cycle test regime (Figure 19.a); this is in keeping with the drift characteristic and the mechanism of action discussed in Section 3.5. Overall, the responses follow similar trajectories, converging at a sensitivity of approximately 0.3. However, there are significant differences between the average cyclces between sample 1 and sample 2&3 (P<0.05), with no significant difference between samples 2 and 3 (P = 0.607), highlighting the need for sensor-specific calibration.
Hysteresis was calculated using trapezoidal numerical integration [trapz, Matlab 2024b, MathWorks, MA, USA] of the response to determine the area within the hysteresis loop (Figure 19.b). The output was normalised against the upward loop to represent hysteresis as a percentage (Figure 19.c). Overall, the response follows a trajectory of a gradual increase followed by a plateau. The plateau occurs within the first 25-50 cycles, suggesting a ’bedding-in’ process. This is consistent with the related drift and sensitivity changes that manifest due to micro-fractures occurring over time.
5. Discussion
Developing strain sensors that convert mechanical strain to a measurable response is a promising solution to detecting a key causative component of DFU formation. Implementing a printed sensor using a conductive adhesive provides a practical solution for this application. A key novelty is the ability to apply the conductive adhesive repeatably to a knitted substrate. Integrating strain-sensing technology within a knitted garment, such as a sock, provides the potential for an unobtrusive monitoring method appropriate to this sensitive environment. The proof-of-concept sensor evaluation highlights commercially available conductive adhesive as a promising sensing material. While some dynamic drift was observed under cyclic loading, this is common in flexible stretch sensors. Similar performance and characteristics are reported in other textile-based sensors. For example, Li et al. [85] observed a gradual increase in over 500 cycle test regimes. Similarly, Yoon et al. [79] used sensors based on silver flakes and nano-particles encapsulated within silicone rubber and experienced dynamic drift during cyclic testing due to microfractures or "conductive bridges".
Reflecting on the specifications identified in collaboration with patient and clinical engagement (Section 3) and set out in Table 1, the developed soft sensor meets the specification criteria. The sensor does not exhibit fracture under load, with silicone reinforcement for added protection (SID 1). The silicone enclosure is safe for skin contact, and silver is naturally anti-microbial in the case of failure (SID 2). During development, commercially available materials were pioritiesed for investigation, selecting the commercially available conductive adhesive (SID 3). While the 3D printing method may not be suitable for conductive adhesive mass production, other processes, such as screen printing, could be implemented. Therefore, the conductive adhesive has sufficient scope for mass production processes with further development (SID 4). The conductive adhesive’s integration was successfully demonstrated within a knitted substrate produced on the industrial knitting machine (SID 5); future work will investigate the integration of electronics and data acquisition. Through 3D printing and parametric design choices, a sensor small enough to make an array with future development was produced, allowing for strain localisation (SID 6). Finally, with print layers of 0.25 mm, the sensor has a low profile, with the ridges produced by the strain gauge design filled with silicone to provide a continuous surface (SID 7).
It should be noted that there are some limitations due to unknown factors in the application, such as the expected strain. It was identified that the sensor can work repeatably and reliably up to 6% strain during dynamic movement. Future work will evaluate how this relates to plantar strain characteristics which are currently not well reported or understood in the literature. This sensing approach has the potential to help better understand plantar strain regimes in healthy and diabetic foot contexts, and thus advance technology for instrumentation to aid DFU prevention.
6. Conclusions
In the first half, this article presents the conceptualisation and development of a strain sensor for use in e-textiles and DFU prevention. Given the application, the limited number of appropriate sensing methodologies provided focus, guiding the research. Development highlighted good single-sensor repeatability was observed with no sigificant difference observed between repeat testing. The sensor has an estimated life-span of 2275(±562) cycles. The sensor proposed in this paper provides a promising first step towards a new wearable systems for the prevention of DFUs, meeting the specification set out in this work (Table 1). With further development this techonology has potential to significant impact patient quality of life while reducing healthcare sector expendature. Outside of healthcare the technology offers potential benefit to other fields including but not limited to general shoe fit, informing accessories shearing such as backpack straps and sports performance monitoring.
Author Contributions
Conceptualisation, N.D.Reeves, K.Bradbury, I. Yoldi and P.Culmer; methodology, R.P. Turnbull and P.Culmer; software, R.P. Turnbull; validation, R.P. Turnbull; formal analysis, R.P. Turnbull; investigation, R.P. Turnbull.; resources, J. Corser, G. Orlando and P. Venkatraman; data curation, R.P. Turnbull and P.Culmer; writing—original draft preparation, R.P. Turnbull; writing—review and editing, R.P. Turnbull, J. Corser, I. Yoldi, G. Orlando, P. Venkatraman, K.Bradbury, N.D.Reeves and P.Culmer; visualisation, R.P. Turnbull; supervision, N.D.Reeves, K.Bradbury, I. Yoldi and P.Culmer; funding acquisition, N.D.Reeves, K.Bradbury, I. Yoldi and P.Culmer All authors have read and agreed to the published version of the manuscript.
Funding
This research was funded by EPSRC grant number EP/X001059/1, Digital Health: ’Socksess’ - Smart Sensing Socks For Monitoring Diabetic Feet And Preventing Ulceration.
Acknowledgments
The authors would like to thank James Roscoe, Technician at Manchester Fashion Institute, Man. Met. University for his support in textile production. This study is supported by the National Institute for Health and Care Research ARC Wessex. The views expressed in this publication are those of the author(s) and not necessarily those of the National Institute for Health and Care Research or the Department of Health and Social Care.
Conflicts of Interest
The authors declare no conflicts of interest. The funders had no role in the design of the study, in the collection, analyses, or interpretation of data, in the writing of the manuscript, or in the decision to publish the results.
Abbreviations
The following abbreviations are used in this manuscript:
| CB | Carbon Black |
| CNF | Carbon Nano-Fibres |
| CNT | Carbon Nano-Tubes |
| DFU | Diabetic Foot Ulcer |
| DL | Double Layer |
| DW | Double Width |
| TRL | Technology Readiness Level |
References
- Armstrong, D.G.; Tan, T.W.; Boulton, A.J.M.; Bus, S.A. Diabetic Foot Ulcers: A Review. JAMA 2023, 330, 62–75. [Google Scholar] [CrossRef] [PubMed]
- NDFC. National Diabetes Foot Care Audit 2018 to 2023. https://digital.nhs.uk/data-and-information/publications/statistical/national-diabetes-footcare-audit/2018-2023, 2023.
- Tresierra-Ayala, M.A.; García Rojas, A. Association between Peripheral Arterial Disease and Diabetic Foot Ulcers in Patients with Diabetes Mellitus Type 2. Medicina Universitaria 2017, 19, 123–126. [Google Scholar] [CrossRef]
- Dubský, M.; Jirkovská, A.; Bem, R.; Fejfarová, V.; Skibová, J.; Schaper, N.C.; Lipsky, B.A. Risk Factors for Recurrence of Diabetic Foot Ulcers: Prospective Follow-up Analysis in the Eurodiale Subgroup. International Wound Journal 2013, 10, 555–561. [Google Scholar] [CrossRef] [PubMed]
- Dirac, P. The Principles of Quantum Mechanics; Comparative Pathobiology - Studies in the Postmodern Theory of Education, Clarendon Press, 1981.
- Baclawski, K. The Observer Effect. In Proceedings of the 2018 IEEE Conference on Cognitive and Computational Aspects of Situation Management (CogSIMA); 2018; pp. 83–89. [Google Scholar] [CrossRef]
- Reyzelman, A.M.; Koelewyn, K.; Murphy, M.; Shen, X.; Yu, E.; Pillai, R.; Fu, J.; Scholten, H.J.; Ma, R. Continuous Temperature-Monitoring Socks for Home Use in Patients With Diabetes: Observational Study. J Med Internet Res 2018, 20, e12460. [Google Scholar] [CrossRef]
- Tao Huang.; Cheng Wang.; Hao Yu.; Hongzhi Wang.; Qinghong Zhang.; Meifang Zhu. Human Walking-Driven Wearable All-Fiber Triboelectric Nanogenerator Containing Electrospun Polyvinylidene Fluoride Piezoelectric Nanofibers | Elsevier Enhanced Reader, 2015. [CrossRef]
- Jia, J.; Xu, C.; Pan, S.; Xia, S.; Wei, P.; Noh, H.Y.; Zhang, P.; Jiang, X. Conductive Thread-Based Textile Sensor for Continuous Perspiration Level Monitoring. Sensors (Basel, Switzerland) 2018, 18. [Google Scholar] [CrossRef]
- Le, K.; Narayana, H.; Servati, A.; Bahi, A.; Soltanian, S.; Servati, P.; Ko, F.K. Electronic Textiles for Electrocardiogram Monitoring: A Review on the Structure–Property and Performance Evaluation from Fiber to Fabric. Textile Research Journal 2022. [Google Scholar] [CrossRef]
- White, S.; McCullough, M.B.A.; Akangah, P.M. The Structural Effects of Diabetes on Soft Tissues: A Systematic Review. CRB 2021, 49. [Google Scholar] [CrossRef]
- Zhou, J.; Xu, B.; Chen, W. Influence of Hallux Valgus Deformity on Forefoot Pressure Distribution of Chinese Diabetic Patients. Int J Diabetes Dev Ctries 2015, 35, 129–134. [Google Scholar] [CrossRef]
- Veves, A.; Murray, H.J.; Young, M.J.; Boulton, A.J.M. The Risk of Foot Ulceration in Diabetic Patients with High Foot Pressure: A Prospective Study. Diabetologia 1992, 35, 660–663. [Google Scholar] [CrossRef]
- Chatwin, K.E.; Abbott, C.A.; Boulton, A.J.; Bowling, F.L.; Reeves, N.D. The Role of Foot Pressure Measurement in the Prediction and Prevention of Diabetic Foot Ulceration—A Comprehensive Review. Diabetes/Metabolism Research and Reviews 2019, 36, e3258. [Google Scholar] [CrossRef]
- Luger, E.; Nissan, M.; Karpf, A.; Steinberg, E.; Dekel, S. Dynamic Pressures on the Diabetic Foot. Foot Ankle Int. 2001, 22, 715–719. [Google Scholar] [CrossRef] [PubMed]
- Perry, J.E.; Hall, J.O.; Davis, B.L. Simultaneous Measurement of Plantar Pressure and Shear Forces in Diabetic Individuals. Gait & Posture 2002, 15, 101–107. [Google Scholar] [CrossRef]
- Jones, A.D.; De Siqueira, J.; Nixon, J.E.; Siddle, H.J.; Culmer, P.R.; Russell, D.A. Plantar Shear Stress in the Diabetic Foot: A Systematic Review and Meta-analysis. Diabet Med 2022, 39, e14661. [Google Scholar] [CrossRef] [PubMed]
- Hicks, C.W.; Selvin, E. Epidemiology of Peripheral Neuropathy and Lower Extremity Disease in Diabetes. Current diabetes reports 2019, 19, 86. [Google Scholar] [CrossRef]
- Pitei, D.L.; Ison, K.; Edmonds, M.E.; Lord, M. Time-Dependent Behaviour of a Force-Sensitive Resistor Plantar Pressure Measurement Insole. Proceedings of the Institution of Mechanical Engineers, Part H: Journal of Engineering in Medicine 1996, 210, 121–125. [Google Scholar] [CrossRef]
- Hsiao, H.; Guan, J.; Weatherly, M. Accuracy and Precision of Two In-Shoe Pressure Measurement Systems. Ergonomics 2002, 45, 537–555. [Google Scholar] [CrossRef]
- Chen, B.; Ma, H.; Qin, L.Y.; Guan, X.; Chan, K.M.; Law, S.W.; Qin, L.; Liao, W.H. Design of a Lower Extremity Exoskeleton for Motion Assistance in Paralyzed Individuals. In Proceedings of the 2015 IEEE International Conference on Robotics and Biomimetics, IEEE-ROBIO 2015, 2015. [CrossRef]
- Anas, M.N. An Instrumented Insole System for Gait Monitoring and Analysis. International Journal of Online and Biomedical Engineering (iJOE) 2014, 10, 30–34. [Google Scholar] [CrossRef]
- Dabiri, F.; Vahdatpour, A.; Noshadi, H.; Hagopian, H.; Sarrafzadeh, M. Electronic Orthotics Shoe: Preventing Ulceration in Diabetic Patients. In Proceedings of the 2008 30th Annual International Conference of the IEEE Engineering in Medicine and Biology Society; 2008; pp. 771–774. [Google Scholar] [CrossRef]
- McKnight, M.; Tabor, J.; Agcayazi, T.; Fleming, A.; Ghosh, T.K.; Huang, H.; Bozkurt, A. Fully Textile Insole Seam-Line for Multimodal Sensor Mapping. IEEE Sensors Journal 2020, 20, 10145–10153. [Google Scholar] [CrossRef]
- Tan, Y.; Ivanov, K.; Mei, Z.; Li, H.; Li, H.; Lubich, L.; Wang, C.; Wang, L. A Soft Wearable and Fully-Textile Piezoresistive Sensor for Plantar Pressure Capturing. Micromachines 2021, 12, 110. [Google Scholar] [CrossRef]
- Aqueveque, P.; Osorio, R.; Pastene, F.; Saavedra, F.; Pino, E. Capacitive Sensors Array for Plantar Pressure Measurement Insole Fabricated with Flexible PCB. In Proceedings of the 2018 40th Annual International Conference of the IEEE Engineering in Medicine and Biology Society (EMBC); 2018; pp. 4393–4396. [Google Scholar] [CrossRef]
- Guignier, C.; Camillieri, B.; Schmid, M.; Rossi, R.M.; Bueno, M.A. E-Knitted Textile with Polymer Optical Fibers for Friction and Pressure Monitoring in Socks. Sensors 2019, 19. [Google Scholar] [CrossRef]
- Leal-Junior, A.G.; Frizera, A.; Avellar, L.M.; Marques, C.; Pontes, M.J. Polymer Optical Fiber for In-Shoe Monitoring of Ground Reaction Forces During the Gait. IEEE Sensors Journal 2018, 18, 2362–2368. [Google Scholar] [CrossRef]
- Pollard, J.P.; Le Quesne, L.P. Method of Healing Diabetic Forefoot Ulcers. Br Med J (Clin Res Ed) 1983, 286, 436–437. [Google Scholar] [CrossRef] [PubMed]
- Wang, L.; Jones, D.; Chapman, G.J.; Siddle, H.J.; Russell, D.A.; Alazmani, A.; Culmer, P. A Review of Wearable Sensor Systems to Monitor Plantar Loading in the Assessment of Diabetic Foot Ulcers. IEEE Trans Biomed Eng 2020, 67, 1989–2004. [Google Scholar] [CrossRef] [PubMed]
- Castro-Martins, P.; Marques, A.; Coelho, L.; Vaz, M.; Baptista, J.S. In-Shoe Plantar Pressure Measurement Technologies for the Diabetic Foot: A Systematic Review. Heliyon 2024, 10. [Google Scholar] [CrossRef] [PubMed]
- Du, L.; Zhu, X.; Zhe, J. An Inductive Sensor for Real-Time Measurement of Plantar Normal and Shear Forces Distribution. IEEE Transactions on Biomedical Engineering 2015, 62, 1316–1323. [Google Scholar] [CrossRef]
- Wang, L.; Jones, D.; Chapman, G.J.; Siddle, H.J.; Russell, D.A.; Alazmani, A.; Culmer, P. Design of a Digital Triaxial Force Sensor for Plantar Load Measurements. In Proceedings of the 2019 IEEE SENSORS; 2019; pp. 1–4. [Google Scholar] [CrossRef]
- Lord, M.; Hosein, R. A Study of In-Shoe Plantar Shear in Patients with Diabetic Neuropathy. Clinical Biomechanics 2000, 15, 278–283. [Google Scholar] [CrossRef]
- Mori, T.; Hamatani, M.; Noguchi, H.; Oe, M.; Sanada, H. Insole-Type Simultaneous Measurement System of Plantar Pressure and Shear Force During Gait for Diabetic Patients. Journal of Robotics and Mechatronics 2012, 24, 766–772. [Google Scholar] [CrossRef]
- Tang, J.; Bader, D.L.; Moser, D.; Parker, D.J.; Forghany, S.; Nester, C.J.; Jiang, L. A Wearable Insole System to Measure Plantar Pressure and Shear for People with Diabetes. Sensors 2023, 23, 3126. [Google Scholar] [CrossRef]
- Amemiya, A.; Noguchi, H.; Oe, M.; Takehara, K.; Ohashi, Y.; Suzuki, R.; Yamauchi, T.; Kadowaki, T.; Sanada, H.; Mori, T. Factors Associated with Callus Formation in the Plantar Region through Gait Measurement in Patients with Diabetic Neuropathy: An Observational Case-Control Study. Sensors 2020, 20, 4863. [Google Scholar] [CrossRef]
- Jones, A.D.; Crossland, S.R.; Nixon, J.E.; Siddle, H.J.; Russell, D.A.; Culmer, P.R. STrain Analysis and Mapping of the Plantar Surface (STAMPS) – A Novel Technique of Plantar Load Analysis during Gait, 2023. [CrossRef]
- Wang, H.; De Boer, G.; Kow, J.; Alazmani, A.; Ghajari, M.; Hewson, R.; Culmer, P. Design Methodology for Magnetic Field-Based Soft Tri-Axis Tactile Sensors. Sensors 2016, 16, 1356. [Google Scholar] [CrossRef]
- Wang, H.; Jones, D.; de Boer, G.; Kow, J.; Beccai, L.; Alazmani, A.; Culmer, P. Design and Characterization of Tri-Axis Soft Inductive Tactile Sensors. IEEE Sensors Journal 2018, 18, 7793–7801. [Google Scholar] [CrossRef]
- Rajala, S.n.K.; Lekkala, J. Plantar Shear Stress Measurements — A Review. Clinical Biomechanics 2014, 29, 475–483. [Google Scholar] [CrossRef]
- Corser, J.; Yoldi, I.; Reeves, N.D.; Culmer, P.; Venkatraman, P.; Orlando, G.; Turnbull, R.; Boakes, P.; Woodin, E.; Lightup, R.; et al. Beyond Sensors and Alerts: Smart Wearables for Diabetic Foot Ulcer Prevention Need to Be Part of a Wider Behaviour Change Intervention. Journal Medical Internet Research 2025. [Google Scholar]
- Viry, L.; Levi, A.; Totaro, M.; Mondini, A.; Mattoli, V.; Mazzolai, B.; Beccai, L. Flexible Three-Axial Force Sensor for Soft and Highly Sensitive Artificial Touch. Advanced Materials 2014, 26, 2659–2664. [Google Scholar] [CrossRef]
- Lee, H.K.; Chung, J.; Chang, S.I.; Yoon, E. Real-Time Measurement of the Three-Axis Contact Force Distribution Using a Flexible Capacitive Polymer Tactile Sensor. J. Micromech. Microeng. 2011, 21, 035010. [Google Scholar] [CrossRef]
- Santos, V.M.; Gomes, B.B.; Neto, M.A.; Amaro, A.M. A Systematic Review of Insole Sensor Technology: Recent Studies and Future Directions. Applied Sciences 2024, 14, 6085. [Google Scholar] [CrossRef]
- Bahin, L.; Tourlonias, M.; Bueno, M.A.; Sharma, K.; Rossi, R.M. Smart Textiles with Polymer Optical Fibre Implementation for In-Situ Measurements of Compression and Bending. SSRN. [CrossRef]
- Zhou, Y.; Zhu, W.; Zhang, L.; Gong, J.; Zhao, D.; Liu, M.; Lin, L.; Meng, Q.; Thompson, R.; Sun, Y. Magnetic Properties of Smart Textile Fabrics through a Coating Method with NdFeB Flake-like Microparticles. Journal of Engineered Fibers and Fabrics 2019, 14, 0–7. [Google Scholar] [CrossRef]
- Lewis, E. Design Potentials of Magnetic Yarns. IRE Transactions on Broadcast and Television Receivers 2016. [Google Scholar] [CrossRef]
- Yang, P.K.; Lin, L.; Yi, F.; Li, X.; Pradel, K.C.; Zi, Y.; Wu, C.I.; He, J.H.; Zhang, Y.; Wang, Z.L. A Flexible, Stretchable and Shape-Adaptive Approach for Versatile Energy Conversion and Self-Powered Biomedical Monitoring. Advanced Materials 2015, 27, 3817–3824. [Google Scholar] [CrossRef]
- Xu, H.; Tao, J.; Liu, Y.; Mo, Y.; Bao, R.; Pan, C. Fully Fibrous Large-Area Tailorable Triboelectric Nanogenerator Based on Solution Blow Spinning Technology for Energy Harvesting and Self-Powered Sensing. Small 2022, 18, 2202477. [Google Scholar] [CrossRef]
- Fan, W.; He, Q.; Meng, K.; Tan, X.; Zhou, Z.; Zhang, G.; Yang, J.; Wang, Z.L. Machine-Knitted Washable Sensor Array Textile for Precise Epidermal Physiological Signal Monitoring. Science Advances 2020, 6, eaay2840. [Google Scholar] [CrossRef] [PubMed]
- Mokhtari, F.; Cheng, Z.; Raad, R.; Xi, J.; Foroughi, J. Piezofibers to Smart Textiles: A Review on Recent Advances and Future Outlook for Wearable Technology. Journal of Materials Chemistry 2020. [Google Scholar] [CrossRef]
- Zhang, W.; Diao, D.; Sun, K.; Fan, X.; Wang, P. Study on Friction-Electrification Coupling in Sliding-Mode Triboelectric Nanogenerator. Nano Energy 2018, 48, 456–463. [Google Scholar] [CrossRef]
- Hudec, R.; Matúška, S.; Kamencay, P.; Benco, M. A Smart IoT System for Detecting the Position of a Lying Person Using a Novel Textile Pressure Sensor. Sensors 2021, 21, 206. [Google Scholar] [CrossRef]
- Gleskova, H.; Ishaku, A.; Bednar, T.; Hudec, R. Optimization of All-Textile Capacitive Sensor Array for Smart Chair. IEEE Access 2022, 10, 48615–48621. [Google Scholar] [CrossRef]
- Fobelets, K.; Thielemans, K.; Mathivanan, A.; Papavassiliou, C. Characterization of Knitted Coils for E-Textiles. IEEE Sensors J. 2019, 19, 7835–7840. [Google Scholar] [CrossRef]
- Tajitsu, Y. Development of E-Textile Sewn Together with Embroidered Fabric Having Motion-Sensing Function Using Piezoelectric Braided Cord for Embroidery. IEEE Transactions on Dielectrics and Electrical Insulation 2020, 27, 1644–1649. [Google Scholar] [CrossRef]
- Tajitsu, Y.; Takarada, J.; Hikichi, T.; Sugii, R.; Takatani, K.; Yanagimoto, H.; Nakanishi, R.; Shiomi, S.; Kitamoto, D.; Nakiri, T.; et al. Application of Piezoelectric PLLA Braided Cord as Wearable Sensor to Realize Monitoring System for Indoor Dogs with Less Physical or Mental Stress. Micromachines 2023, 14, 143. [Google Scholar] [CrossRef]
- Uno, M.O.; Morita, S.; Omori, M.; Yoshimura, K. Pressure Sensor Yarns with a Sheath-Core Structure Using Multi-Fiber Polymer. Sensors and Actuators A: Physical 2022, 337, 113440. [Google Scholar] [CrossRef]
- Zhao, J.; Fu, Y.; Xiao, Y.; Dong, Y.; Wang, X.; Lin, L. A Naturally Integrated Smart Textile for Wearable Electronics Applications. Advanced materials and technologies 2020. [Google Scholar] [CrossRef]
- Souri, H.; Bhattacharyya, D. Wearable Strain Sensors Based on Electrically Conductive Natural Fiber Yarns. Materials & Design 2018, 154, 217–227. [Google Scholar] [CrossRef]
- Lian, Y.; Yu, H.; Wang, M.; Yang, X.; Zhang, H. Ultrasensitive Wearable Pressure Sensors Based on Silver Nanowire-Coated Fabrics. Nanoscale Res Lett 2020, 15, 70. [Google Scholar] [CrossRef] [PubMed]
- Seyedin, S.; Razal, J.M.; Innis, P.C.; Jeiranikhameneh, A.; Beirne, S.; Wallace, G.G. Knitted Strain Sensor Textiles of Highly Conductive All-Polymeric Fibers. ACS Appl. Mater. Interfaces 2015, 7, 21150–21158. [Google Scholar] [CrossRef] [PubMed]
- Santoni SPA. Sangiacomo Star-D: Sangiacomo Electronic Knitting Machine, 2025.
- Zhu, Y.; Assadian, M.; Ramezani, M.; Aw, K.C. Printing of Soft Stretch Sensor from Carbon Black Composites. In Proceedings of the EUROSENSORS 2018. MDPI; 2018. [Google Scholar] [CrossRef]
- Honnet, C.; Perner-Wilson, H.; Teyssier, M.; Fruchard, B.; Steimle, J.; Baptista, A.C.; Strohmeier, P. PolySense: Augmenting Textiles with Electrical Functionality Using In-Situ Polymerization. Conference on Human Factors in Computing Systems - Proceedings, 2020. [Google Scholar] [CrossRef]
- Souri, H.; Bhattacharyya, D. Highly Stretchable and Wearable Strain Sensors Using Conductive Wool Yarns with Controllable Sensitivity. Sensors and Actuators A: Physical 2019, 285, 142–148. [Google Scholar] [CrossRef]
- Anike, J.C.; Le, H.H.; Brodeur, G.E.; Kadavan, M.M.; Abot, J.L. Piezoresistive Response of Integrated CNT Yarns under Compression and Tension: The Effect of Lateral Constraint. C 2017, 3, 14. [Google Scholar] [CrossRef]
- Wiranata, A.; Ohsugi, Y.; Minaminosono, A.; Mao, Z.; Kurata, H.; Hosoya, N.; Maeda, S. A DIY Fabrication Approach of Stretchable Sensors Using Carbon Nano Tube Powder for Wearable Device. Front. Robot. AI 2021, 8, 773056. [Google Scholar] [CrossRef]
- Dong, T.; Gu, Y.; Liu, T.; Pecht, M. Resistive and Capacitive Strain Sensors Based on Customized Compliant Electrode: Comparison and Their Wearable Applications. Sensors and Actuators A: Physical 2021, 326, 112720. [Google Scholar] [CrossRef]
- Xu, P.; Wang, S.; Lin, A.; Min, H.K.; Zhou, Z.; Dou, W.; Sun, Y.; Huang, X.; Tran, H.; Liu, X. Conductive and Elastic Bottlebrush Elastomers for Ultrasoft Electronics. Nat Commun 2023, 14, 623. [Google Scholar] [CrossRef]
- Muth, J.T.; Vogt, D.M.; Truby, R.L.; Mengüç, Y.; Kolesky, D.B.; Wood, R.J.; Lewis, J.A. Embedded 3D Printing of Strain Sensors within Highly Stretchable Elastomers. Advanced Materials 2014, 26, 6307–6312. [Google Scholar] [CrossRef]
- Shintake, J.; Piskarev, Y.; Jeong, S.H.; Floreano, D. Ultrastretchable Strain Sensors Using Carbon Black-Filled Elastomer Composites and Comparison of Capacitive Versus Resistive Sensors. Advanced Materials Technologies 2018, 3, 1700284. [Google Scholar] [CrossRef]
- Cholleti, E.R.; Stringer, J.; Assadian, M.; Battmann, V.; Bowen, C.; Aw, K. Highly Stretchable Capacitive Sensor with Printed Carbon Black Electrodes on Barium Titanate Elastomer Composite. Sensors 2019, 19, 42. [Google Scholar] [CrossRef] [PubMed]
- Song, P.; Wang, G.; Zhang, Y. Preparation and Performance of Graphene/Carbon Black Silicone Rubber Composites Used for Highly Sensitive and Flexible Strain Sensors. Sensors and Actuators A: Physical 2021, 323, 112659. [Google Scholar] [CrossRef]
- Giffney, T.; Bejanin, E.; Kurian, A.S.; Travas-Sejdic, J.; Aw, K. Highly Stretchable Printed Strain Sensors Using Multi-Walled Carbon Nanotube/Silicone Rubber Composites. Sensors and Actuators A: Physical 2017, 259, 44–49. [Google Scholar] [CrossRef]
- Matsuhisa, N.; Kaltenbrunner, M.; Yokota, T.; Jinno, H.; Kuribara, K.; Sekitani, T.; Someya, T. Printable Elastic Conductors with a High Conductivity for Electronic Textile Applications. Nat Commun 2015, 6, 7461. [Google Scholar] [CrossRef]
- Matsuhisa, N.; Inoue, D.; Zalar, P.; Jin, H.; Matsuba, Y.; Itoh, A.; Yokota, T.; Hashizume, D.; Someya, T. Printable Elastic Conductors by in Situ Formation of Silver Nanoparticles from Silver Flakes. Nature Mater 2017, 16, 834–840. [Google Scholar] [CrossRef]
- Yoon, I.S.; Kim, S.H.; Oh, Y.; Ju, B.K.; Hong, J.M. Ag Flake/Silicone Rubber Composite with High Stability and Stretching Speed Insensitive Resistance via Conductive Bridge Formation. Sci Rep 2020, 10, 5036. [Google Scholar] [CrossRef]
- Lu, D.; Wong, C.P. Thermal Decomposition of Silver Flake Lubricants. Journal of Thermal Analysis and Calorimetry 2000, 61, 3–12. [Google Scholar] [CrossRef]
- Zhang, R.; Lin, W.; Moon, K.s.; Wong, C.P. Fast Preparation of Printable Highly Conductive Polymer Nanocomposites by Thermal Decomposition of Silver Carboxylate and Sintering of Silver Nanoparticles. ACS Appl. Mater. Interfaces 2010, 2, 2637–2645. [Google Scholar] [CrossRef]
- Clement, J.L.; Jarrett, P.S. Antibacterial Silver. Met Based Drugs 1994, 1, 467–482. [Google Scholar] [CrossRef]
- DM-SAS-10010.
- Shen, H.; Ke, H.; Feng, J.; Jiang, C.; Wei, Q.; Wang, Q. Highly Sensitive and Stretchable C-MWCNTs/PPy Embedded Multidirectional Strain Sensor Based on Double Elastic Fabric for Human Motion Detection. Nanomaterials (Basel, Switzerland) 2021, 11. [Google Scholar] [CrossRef]
- Li, Y.; Miao, X.; Chen, J.Y.; Jiang, G.; Liu, Q. Sensing Performance of Knitted Strain Sensor on Two-Dimensional and Three-Dimensional Surfaces. Materials & Design 2021, 197, 109273. [Google Scholar] [CrossRef]
Figure 1.
An illustration showing the routes and phases of exploration for viable sensing approaches, together with decision points on exclusion/selection.
Figure 1.
An illustration showing the routes and phases of exploration for viable sensing approaches, together with decision points on exclusion/selection.
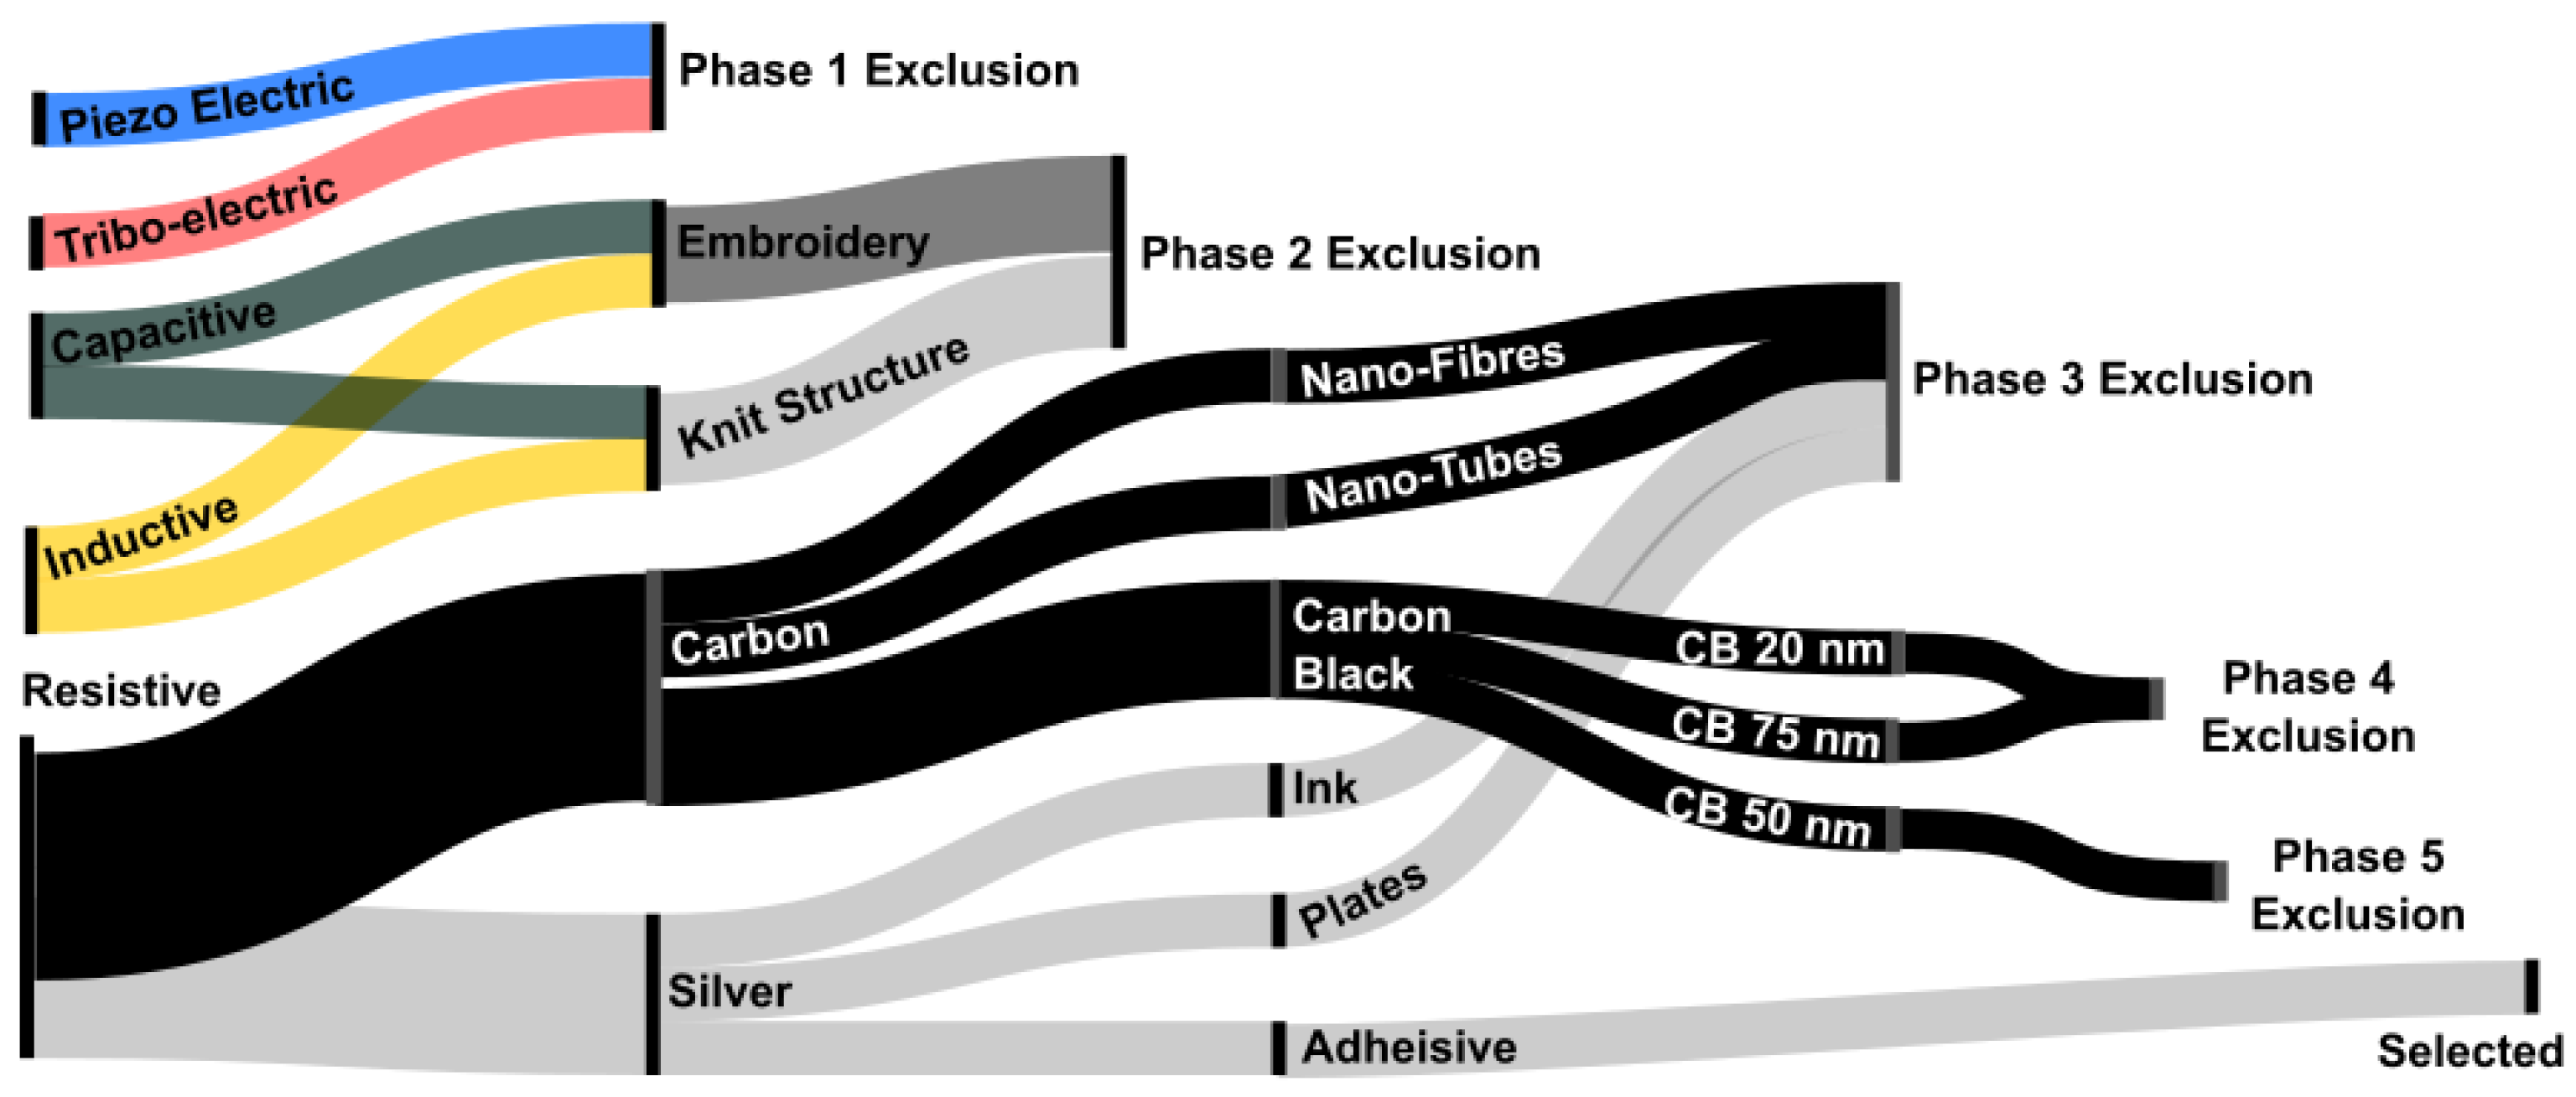
Figure 2.
Carbon Nano-Fibres (CNFs) a) embedded in Ecoflex 00-30 and b) Voltage response with relaxation regions.
Figure 2.
Carbon Nano-Fibres (CNFs) a) embedded in Ecoflex 00-30 and b) Voltage response with relaxation regions.
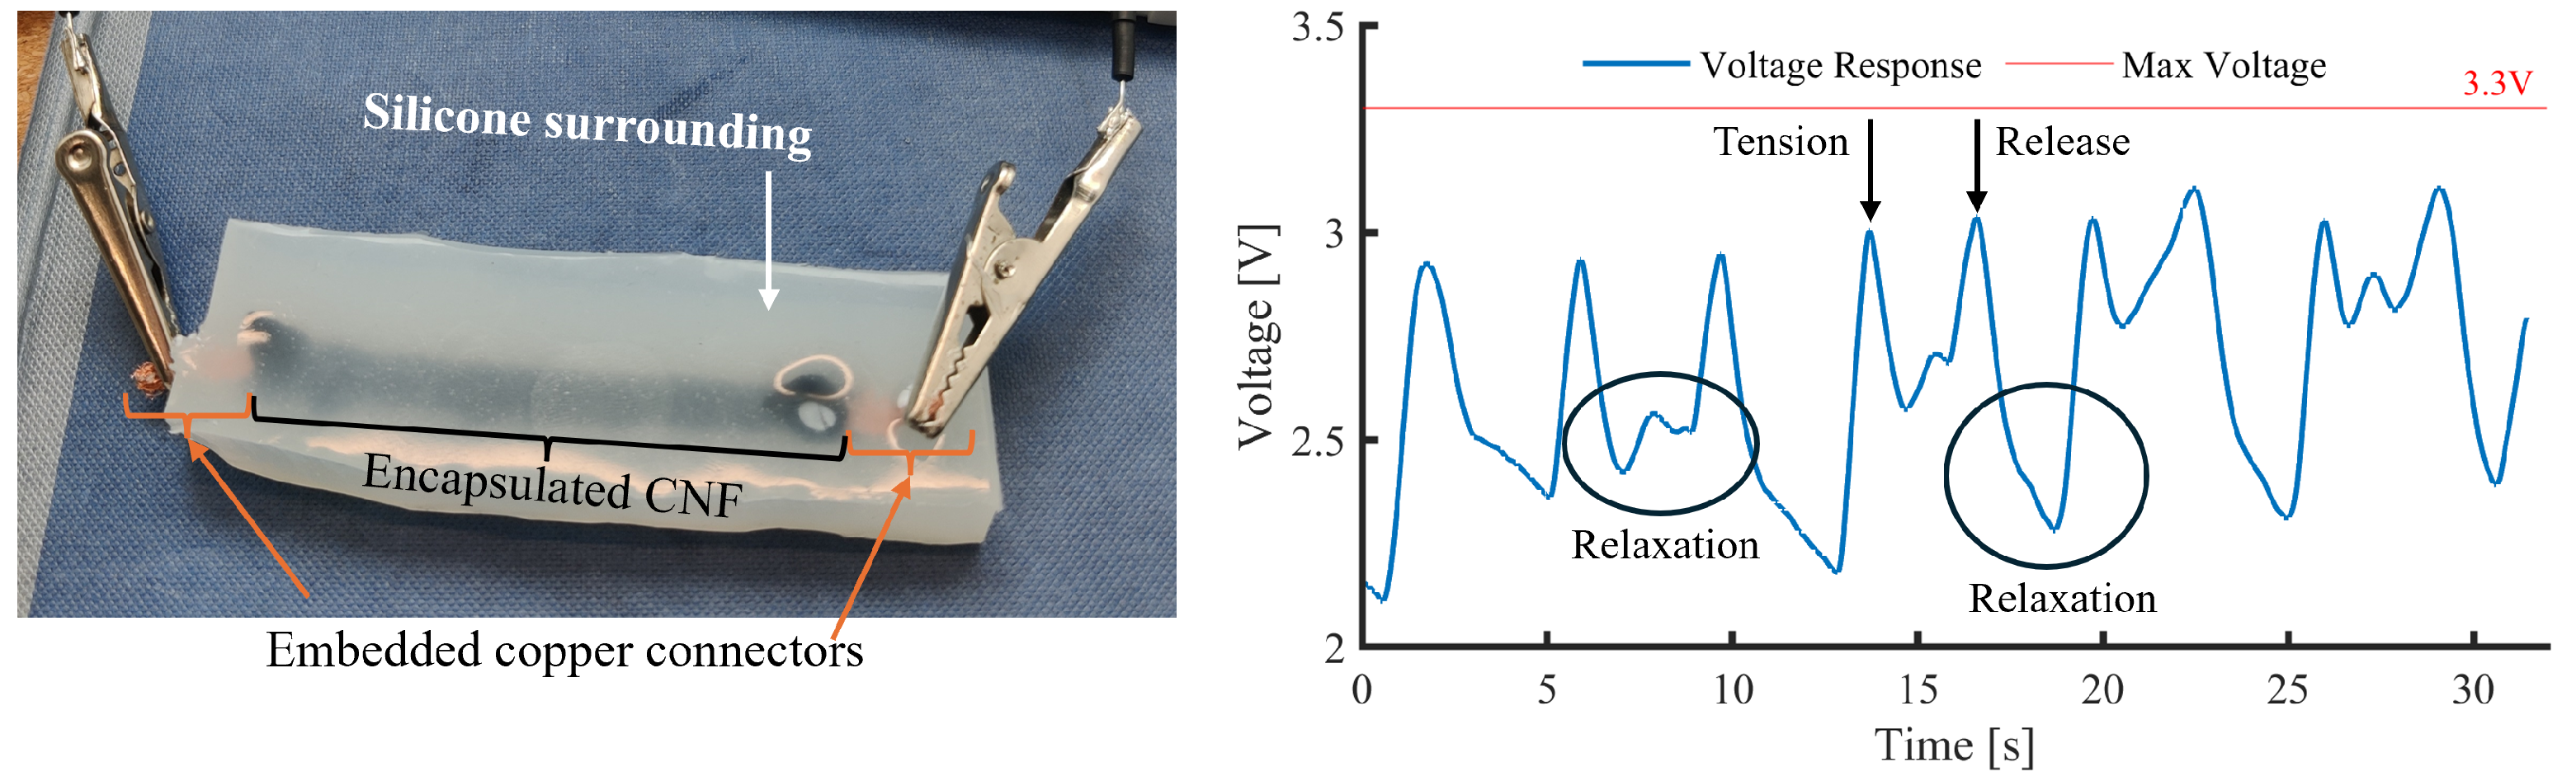
Figure 3.
Sensor concept using commercially available silver-based conductive adhesive as the stretch element.
Figure 3.
Sensor concept using commercially available silver-based conductive adhesive as the stretch element.
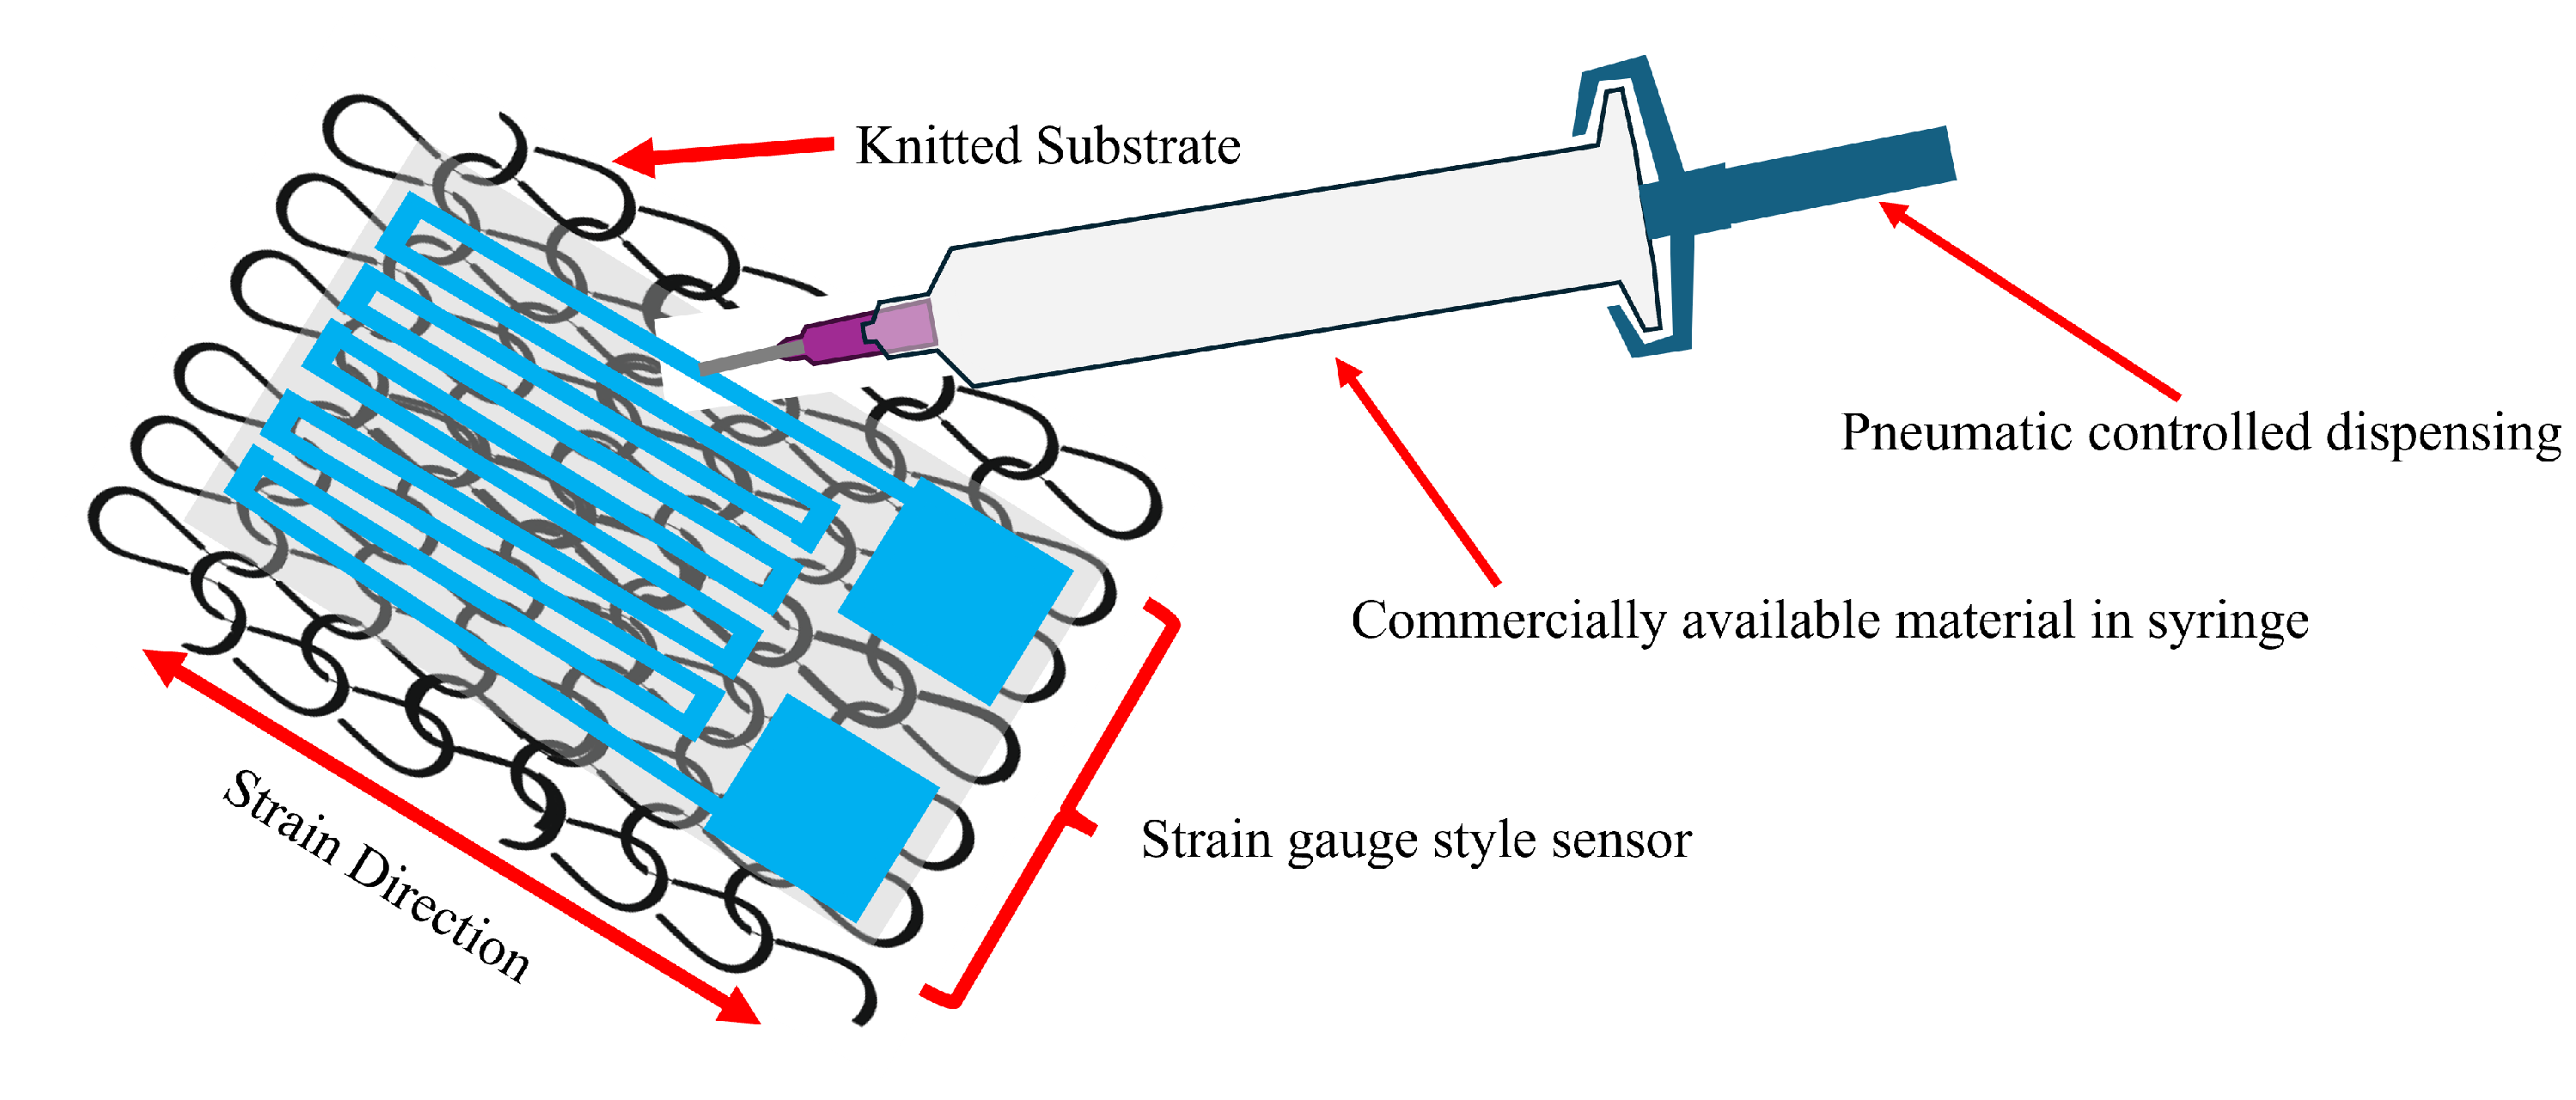
Figure 4.
Sensing manufacturing platform integrating a WorkBee CNC with a Nordson dispenser.
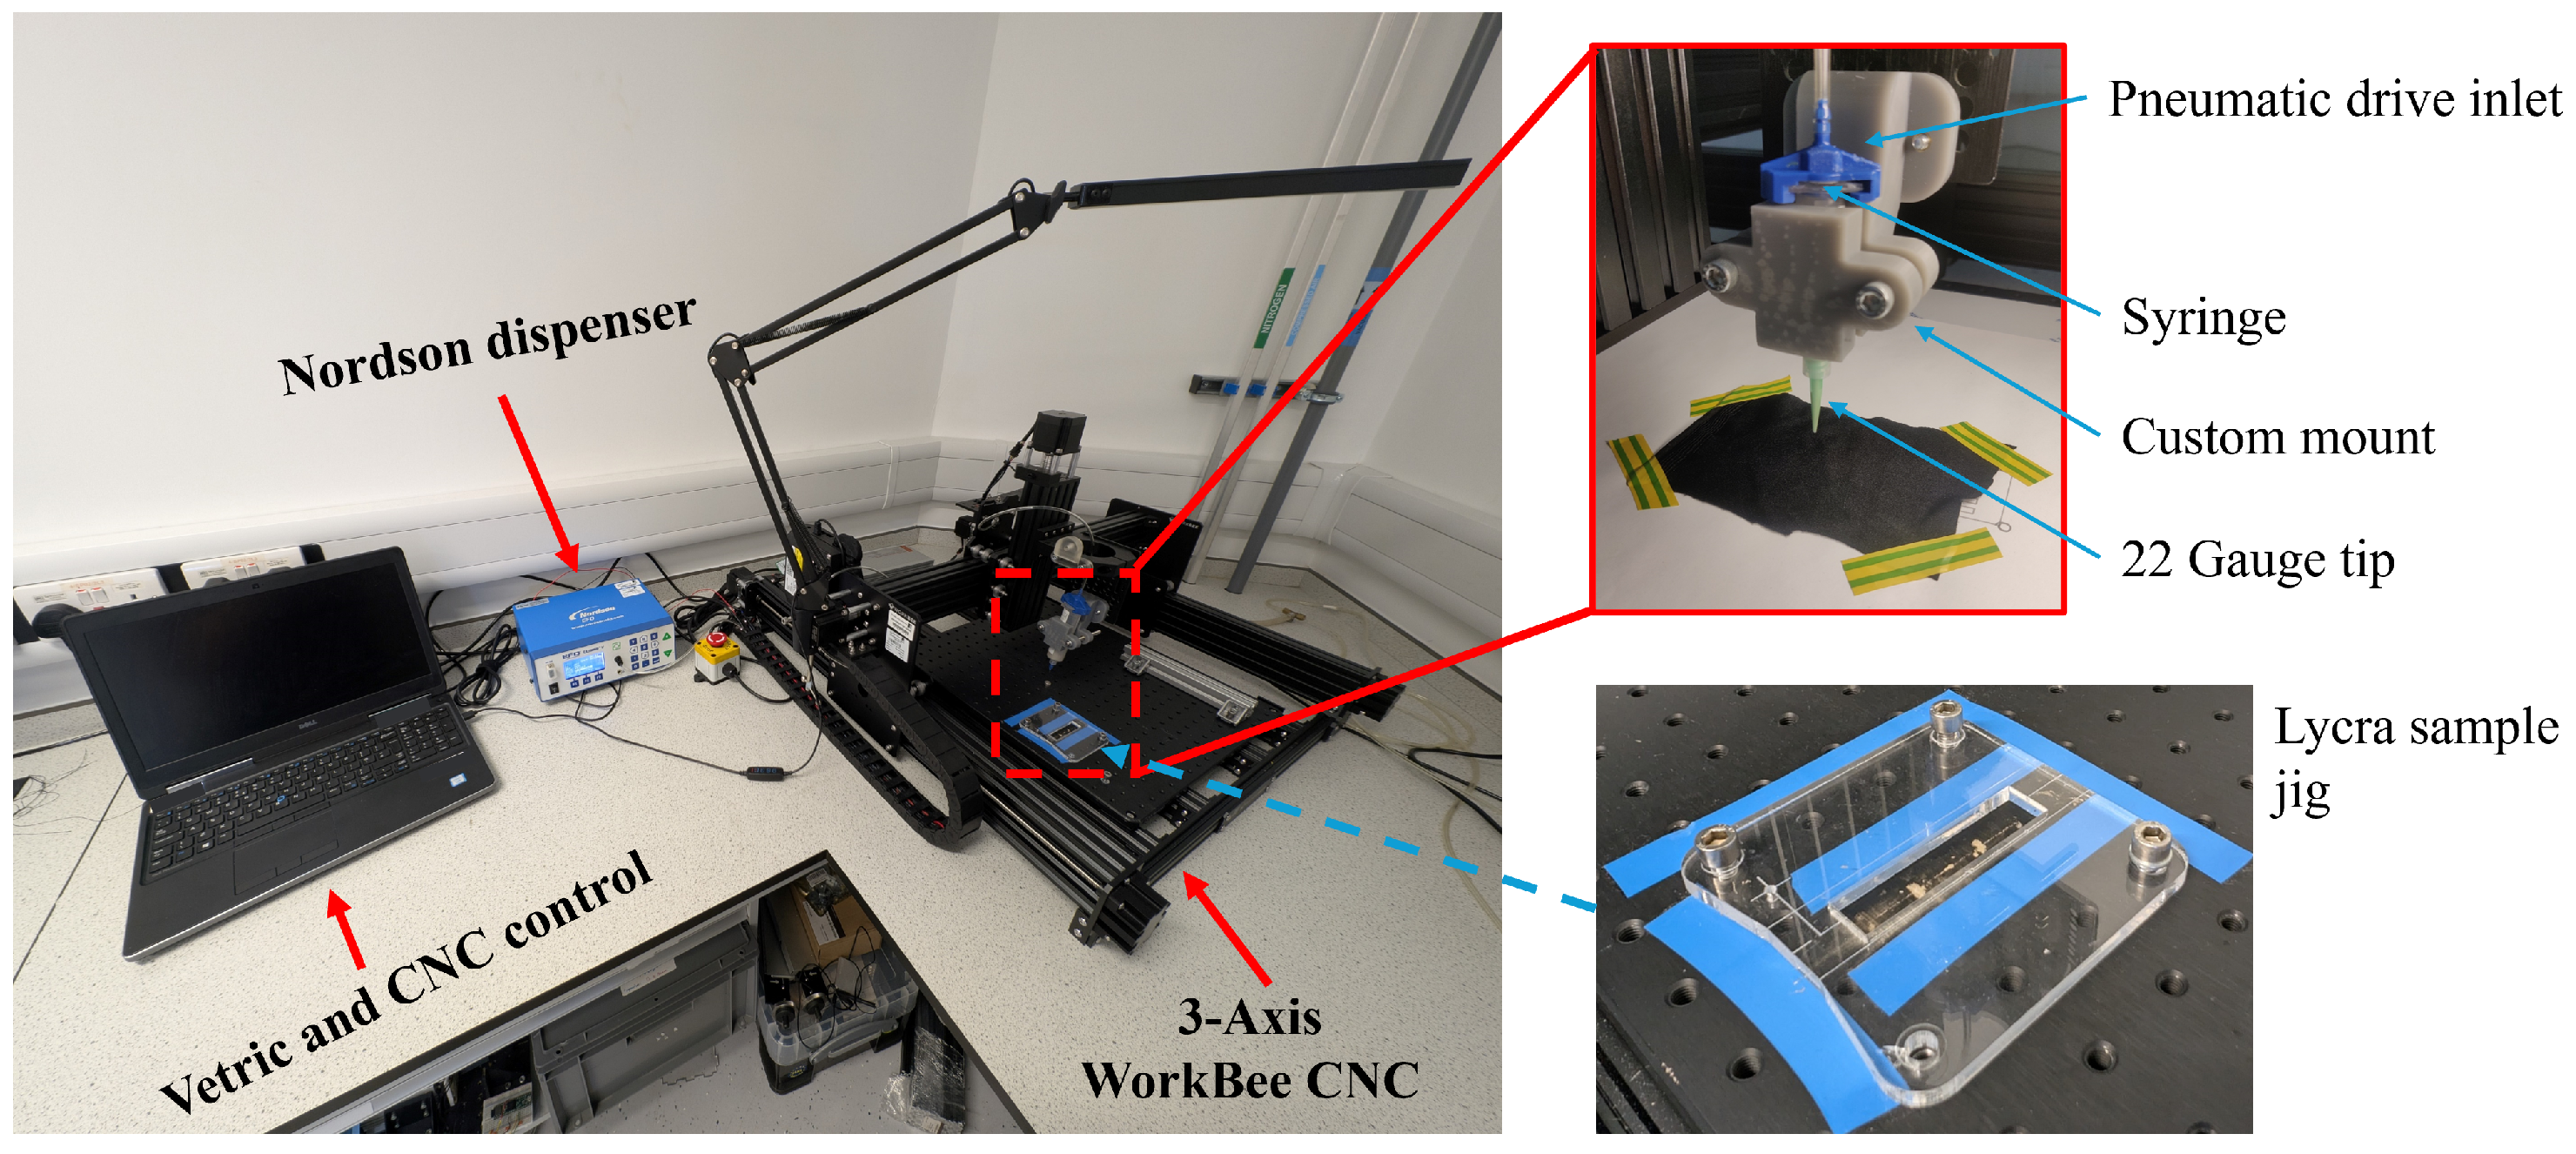
Figure 5.
Parameters under investigation a) turns and b) length. The red box highlights the default sample.
Figure 5.
Parameters under investigation a) turns and b) length. The red box highlights the default sample.
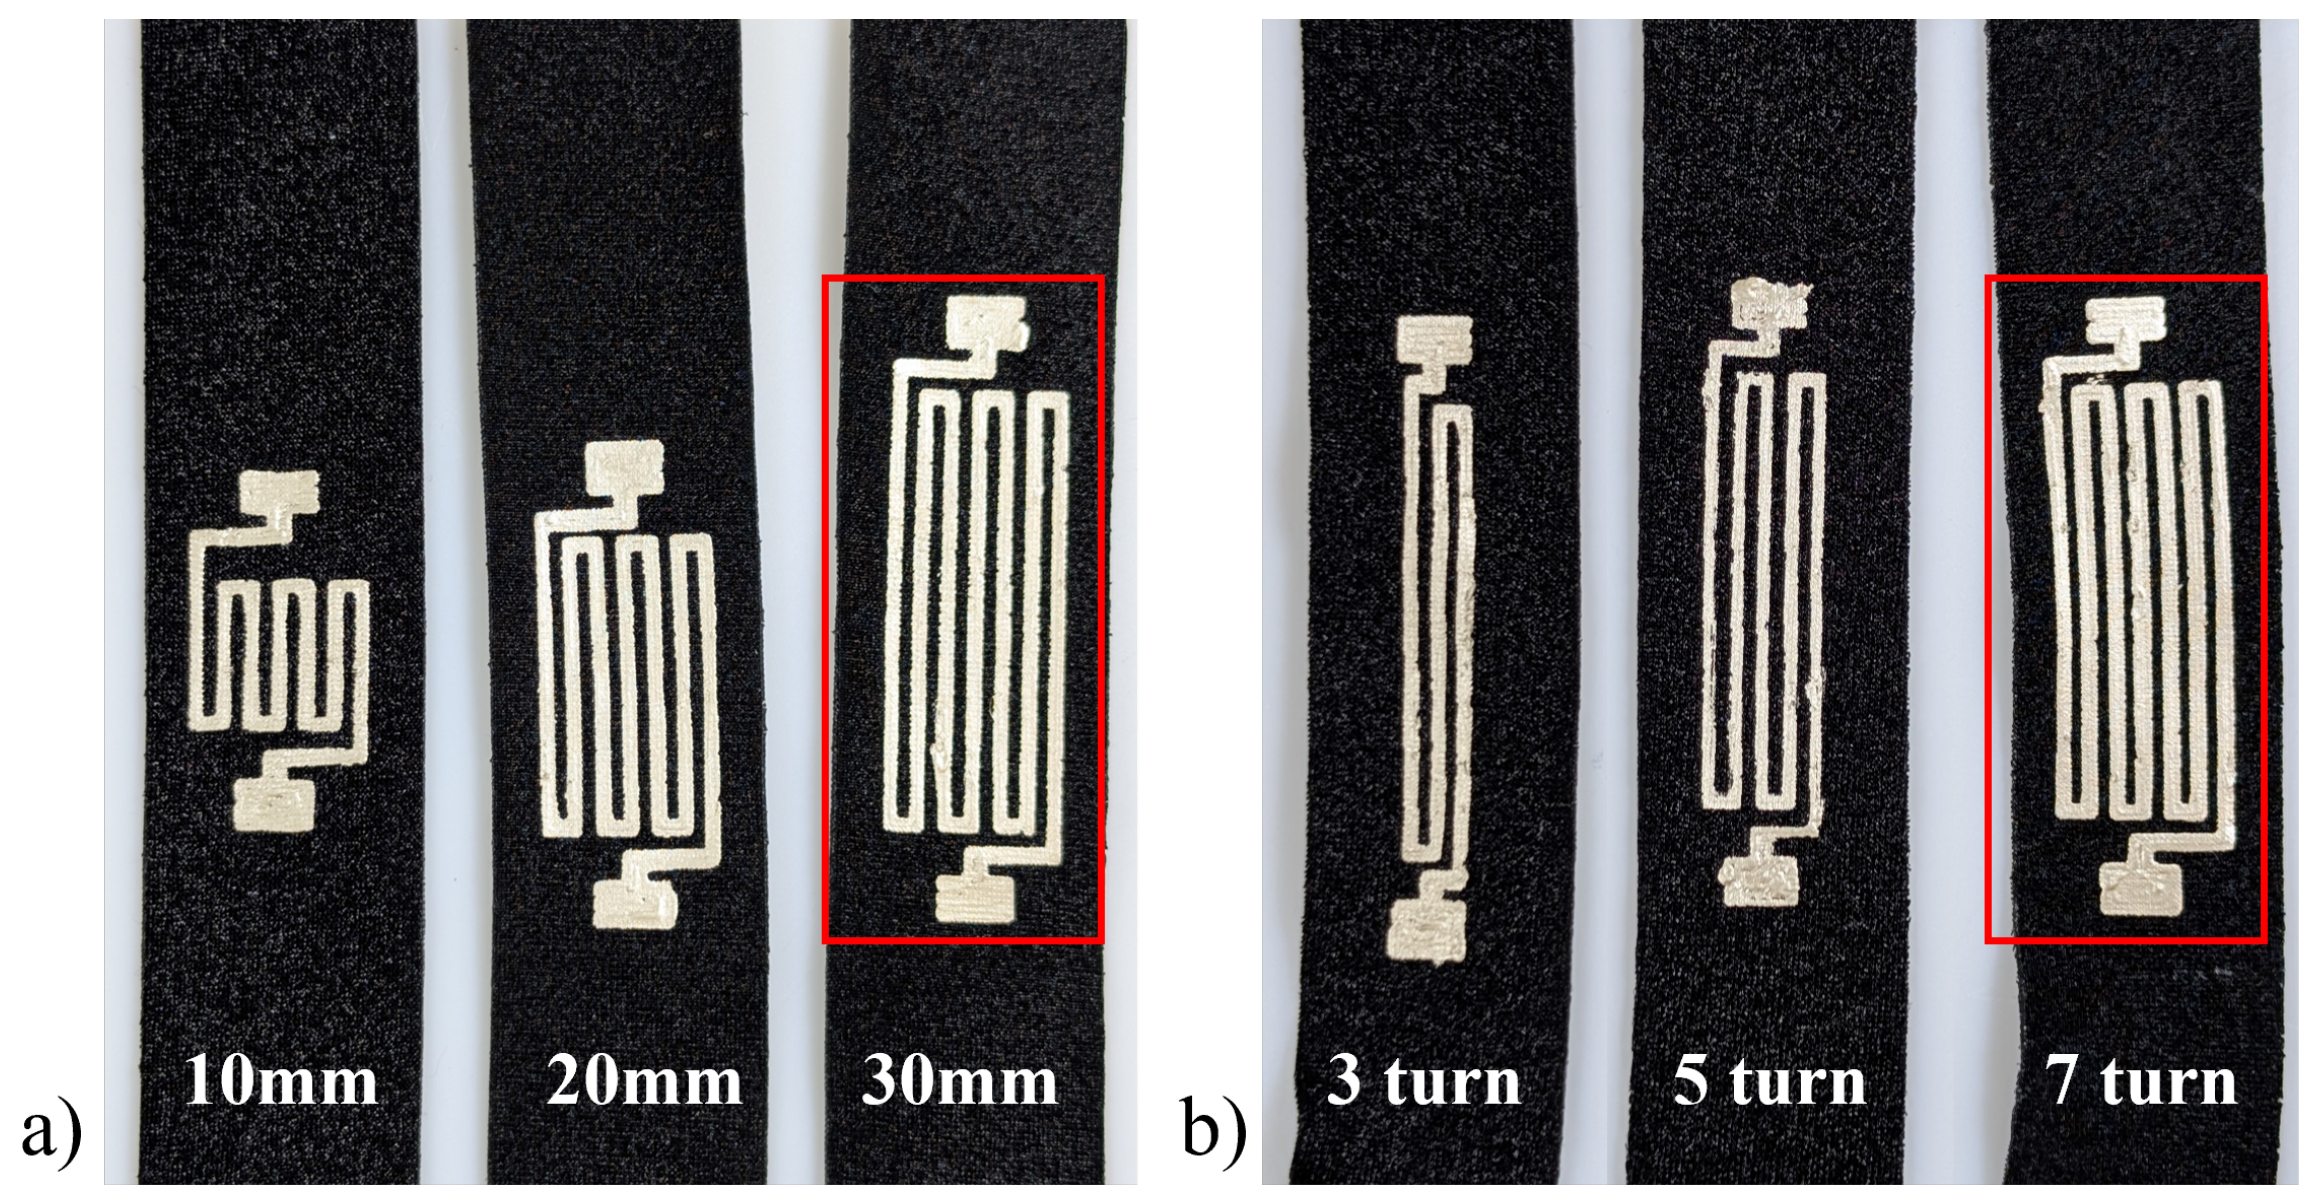
Figure 6.
Quasi static loading regime implemented on the single tower instron.
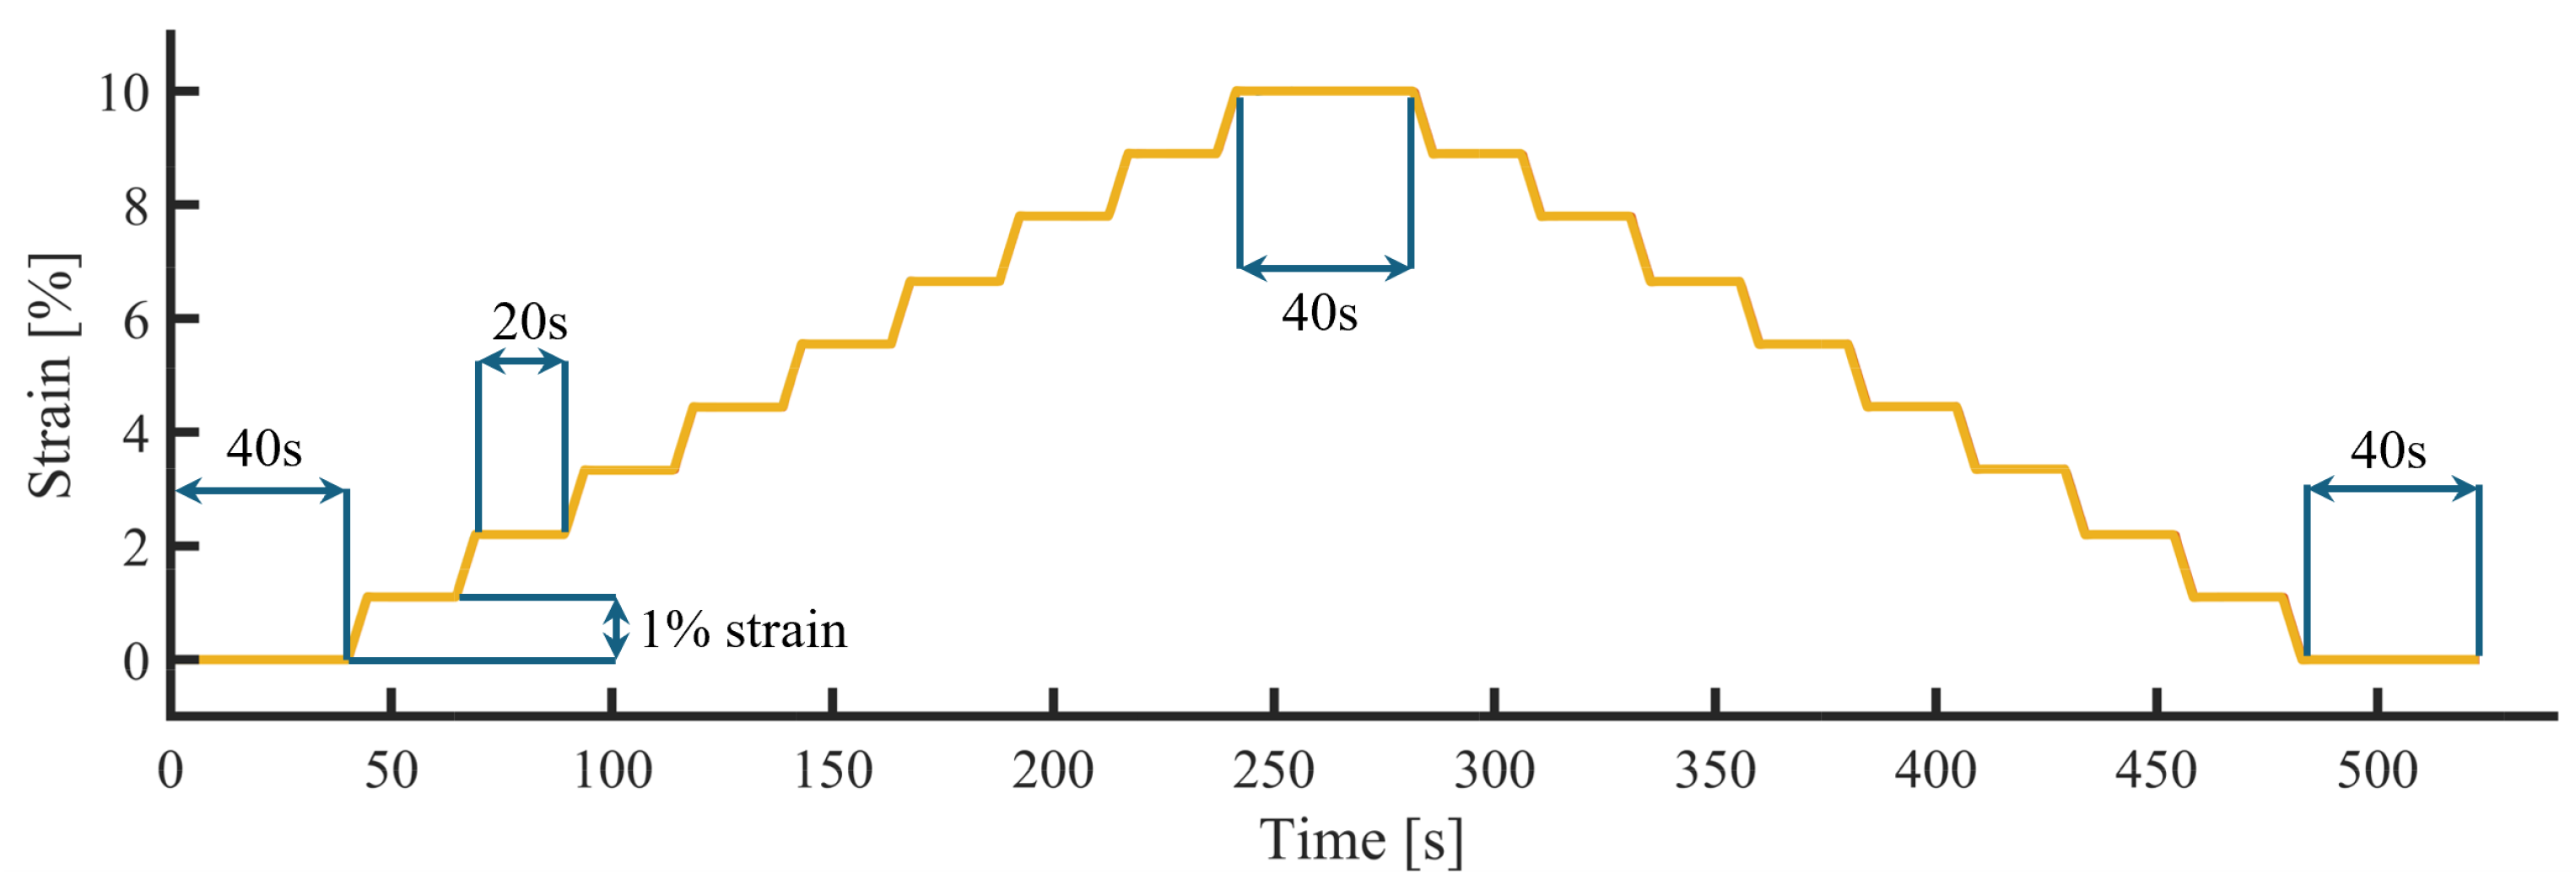
Figure 7.
Sensor parameterisation: a) Turns: three, five, seven, b) Lengths: 10 mm, 20 mm, 30 mm and c) Cure temperature 75°C, 80°C, 90°C, 100°C
Figure 7.
Sensor parameterisation: a) Turns: three, five, seven, b) Lengths: 10 mm, 20 mm, 30 mm and c) Cure temperature 75°C, 80°C, 90°C, 100°C
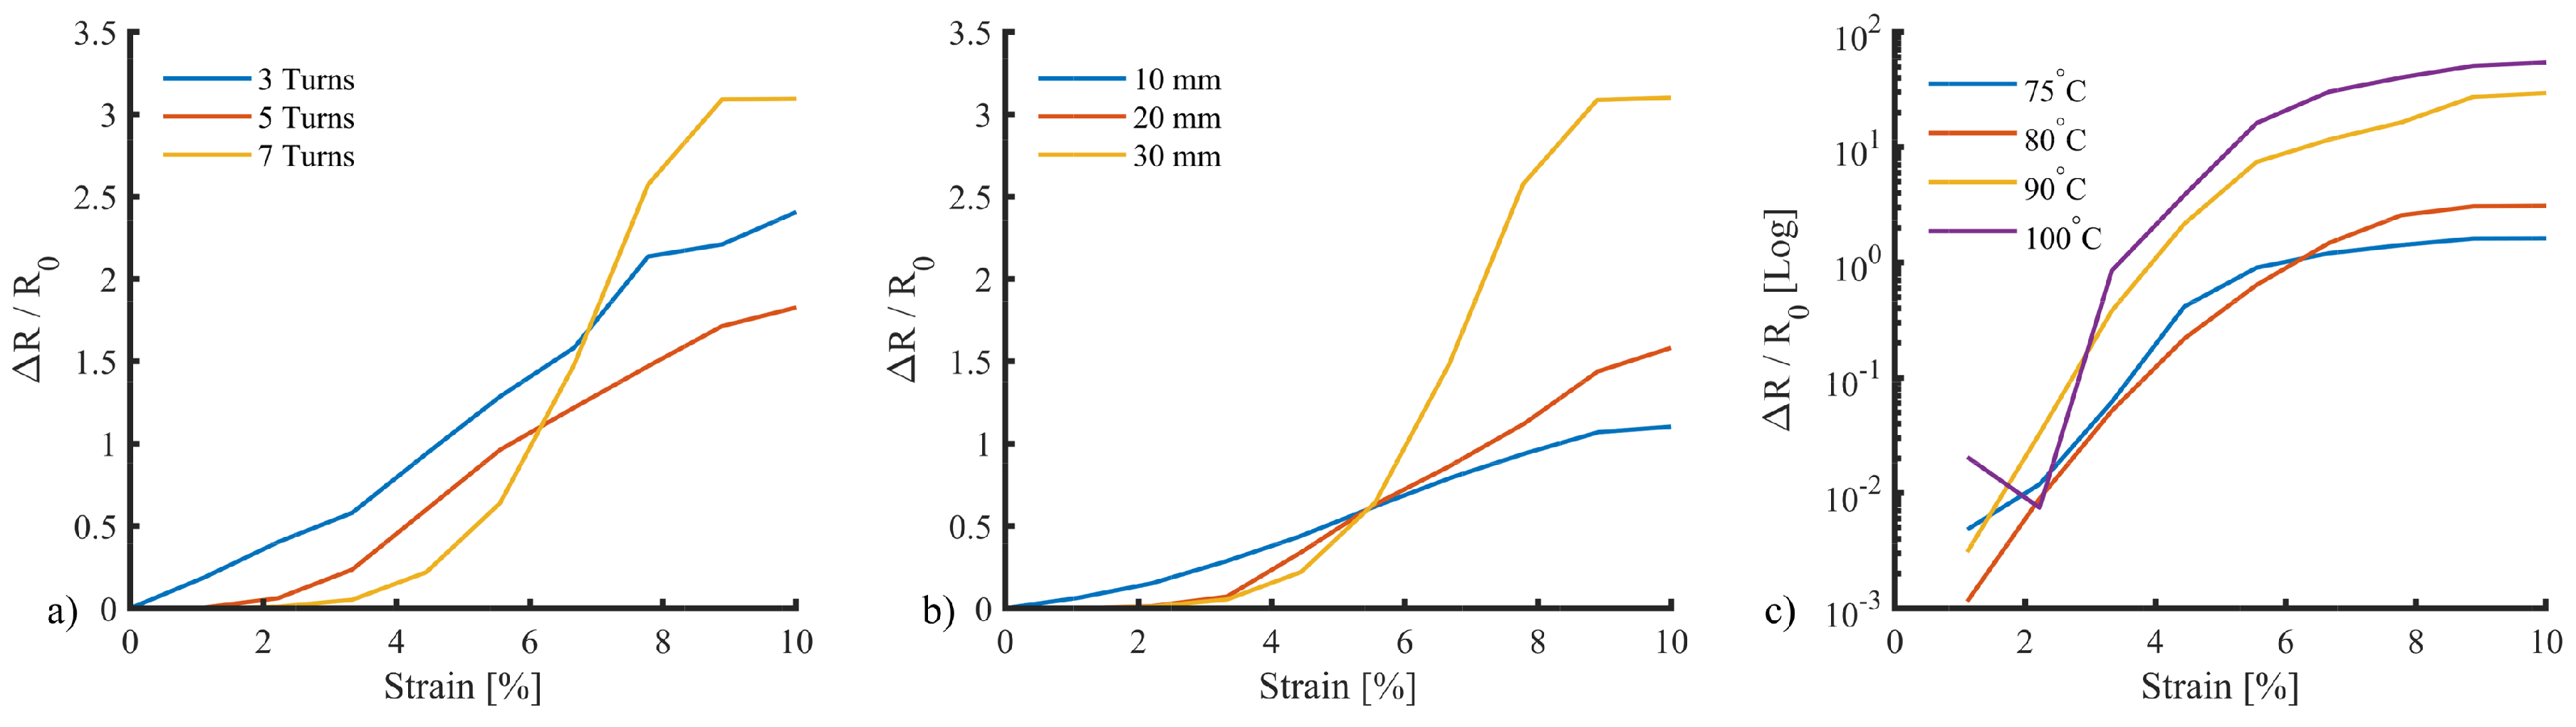
Figure 8.
Robustness Improvements: a) Double Width (DW), b) Double Layered (DL), c) Quad and, d) Resistance response.
Figure 8.
Robustness Improvements: a) Double Width (DW), b) Double Layered (DL), c) Quad and, d) Resistance response.
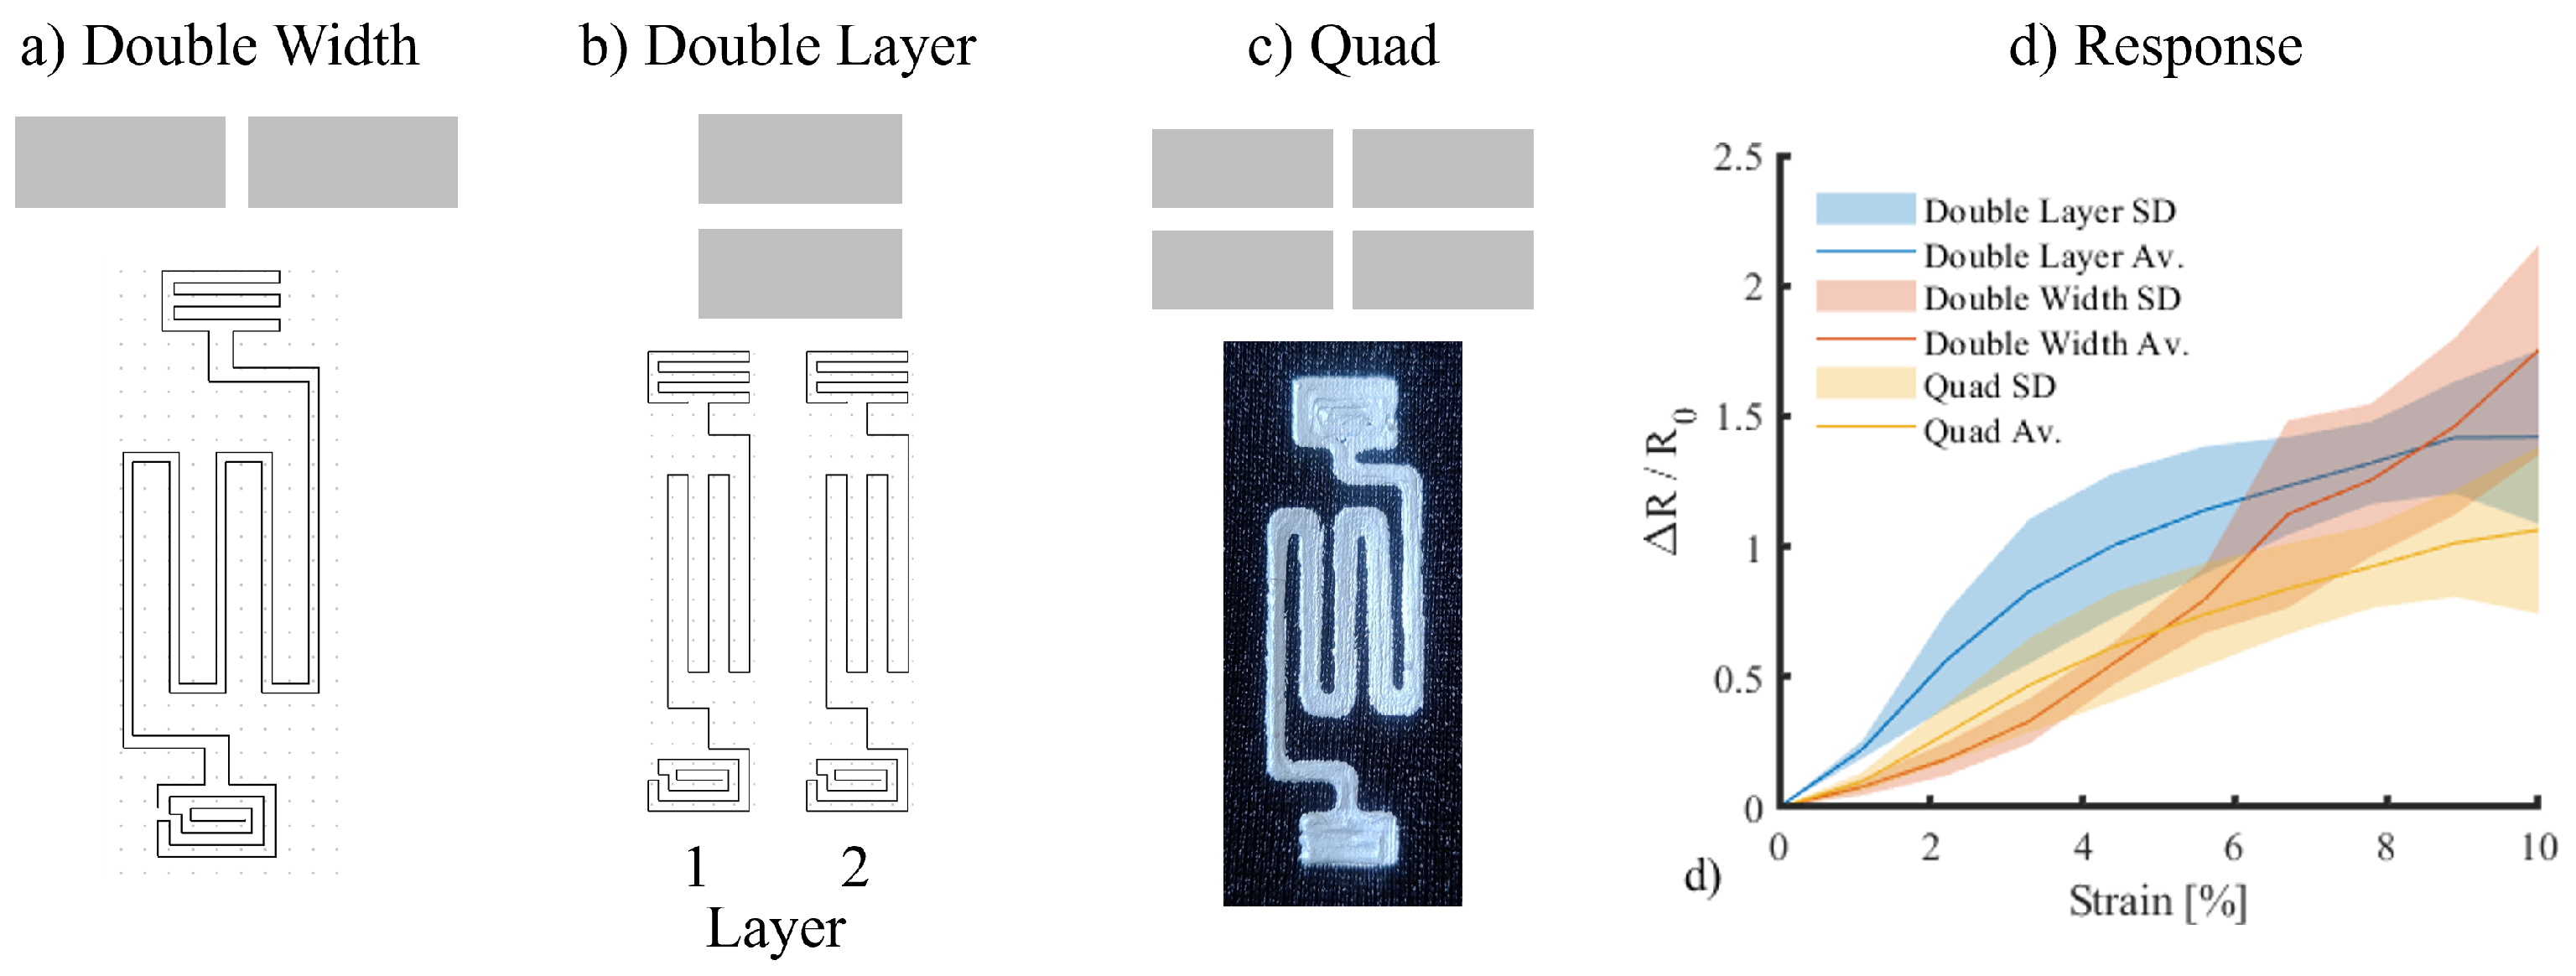
Figure 9.
Final sensor using a quad design highlighting print path (Left) and printed sensor (right).
Figure 9.
Final sensor using a quad design highlighting print path (Left) and printed sensor (right).
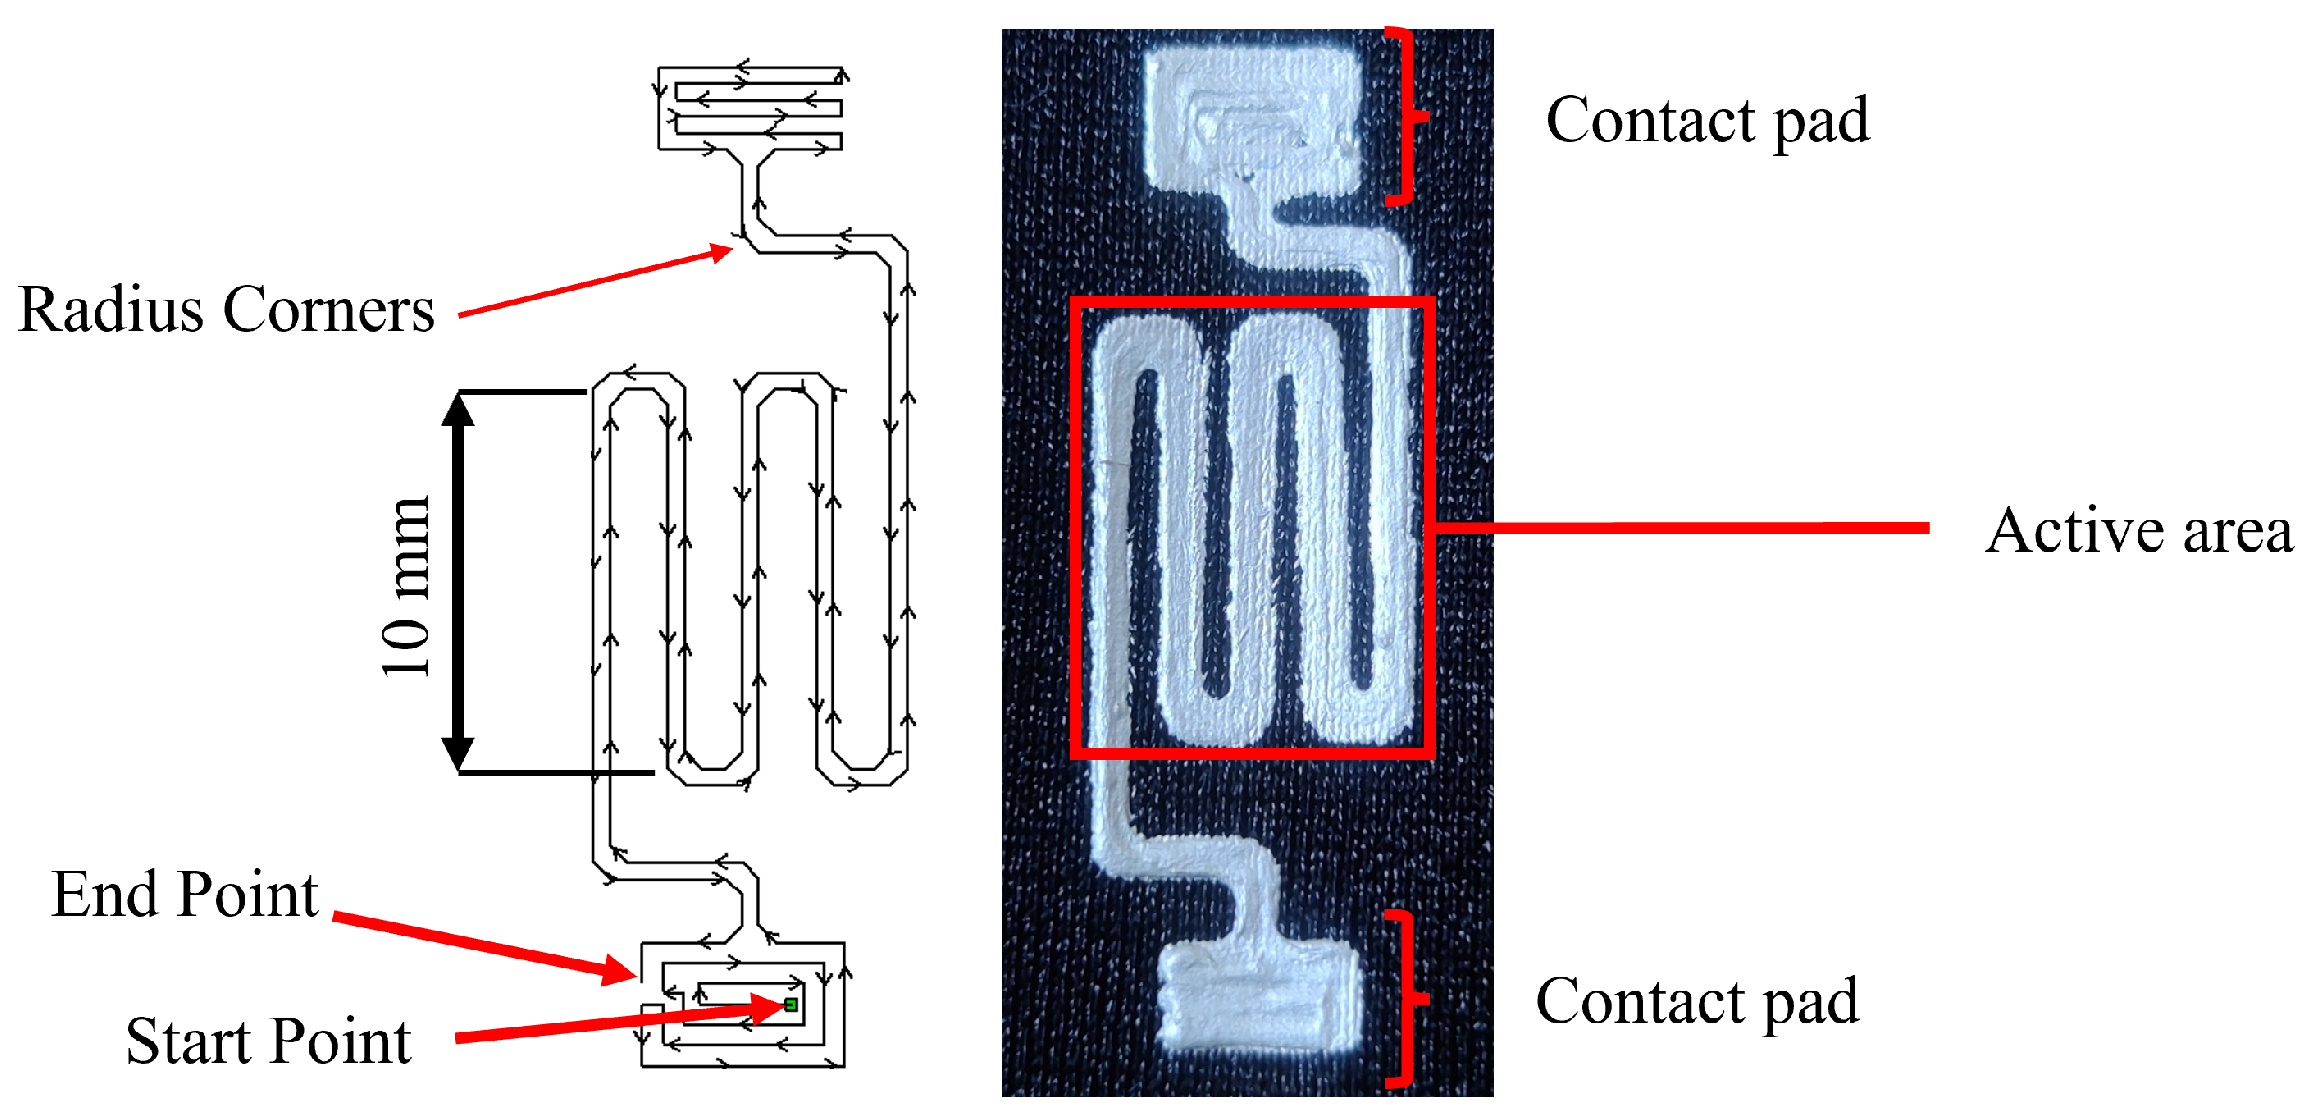
Figure 10.
The response (dR/R) of a quad model sensor showing the characteristics of five samples.
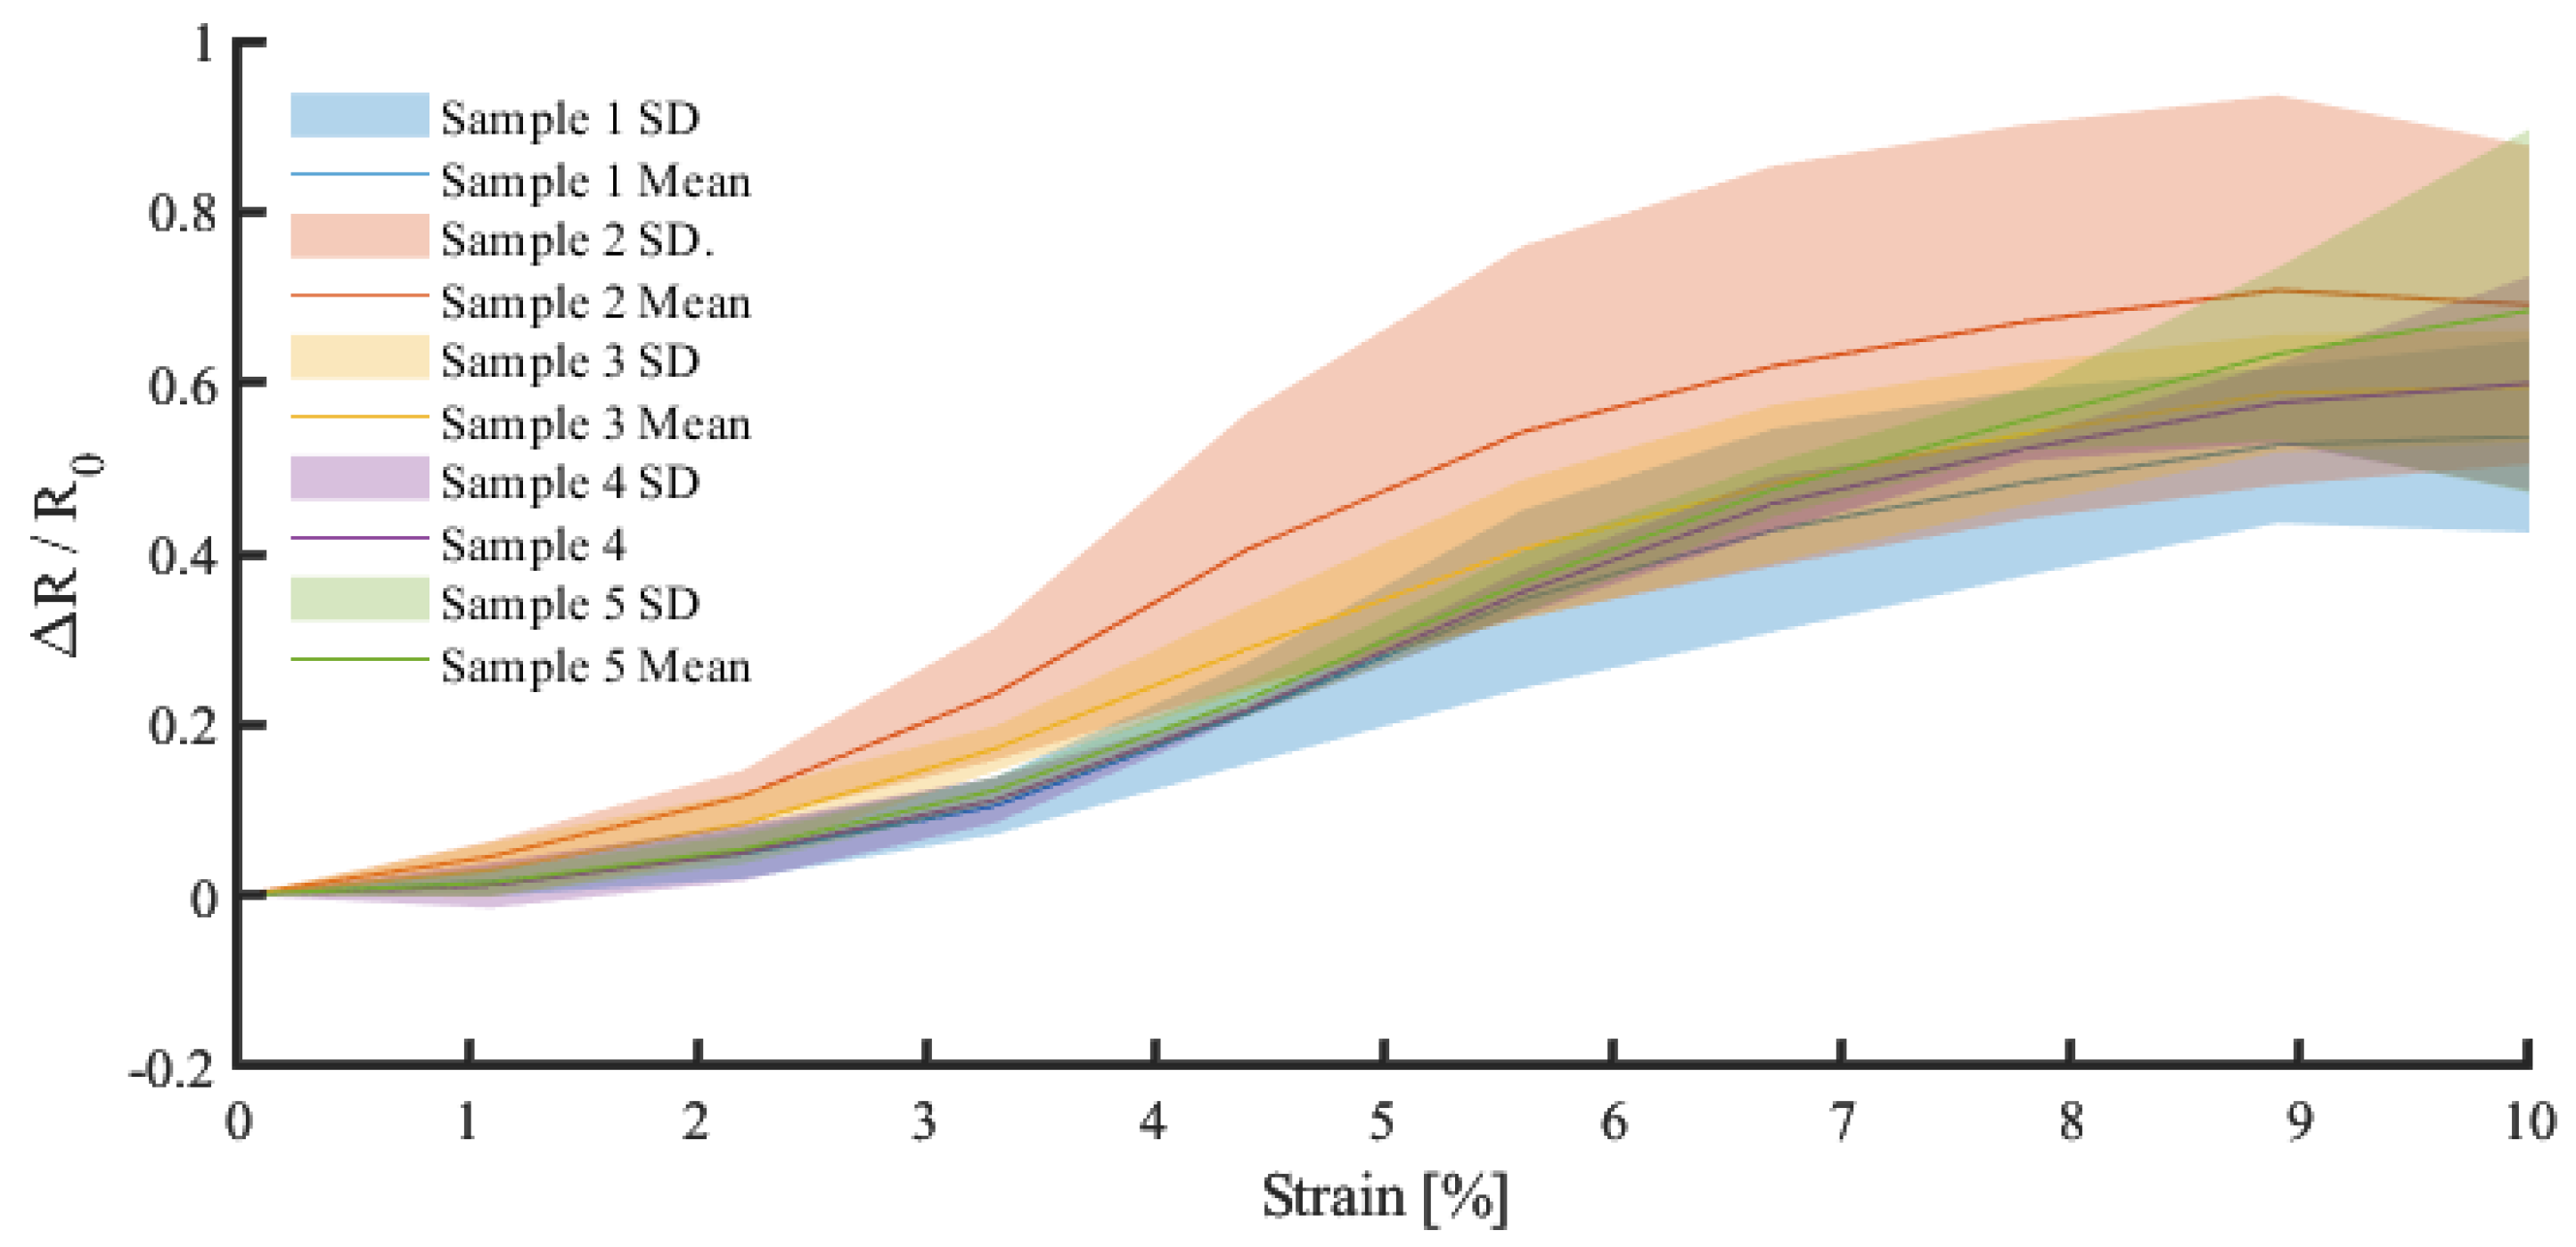
Figure 11.
Resistance drift associated with cyclic strain. a) Set 1, b) Set 2, c) Set 3. N.B. The continuous measurement is segmented into subplots for clarity.
Figure 11.
Resistance drift associated with cyclic strain. a) Set 1, b) Set 2, c) Set 3. N.B. The continuous measurement is segmented into subplots for clarity.
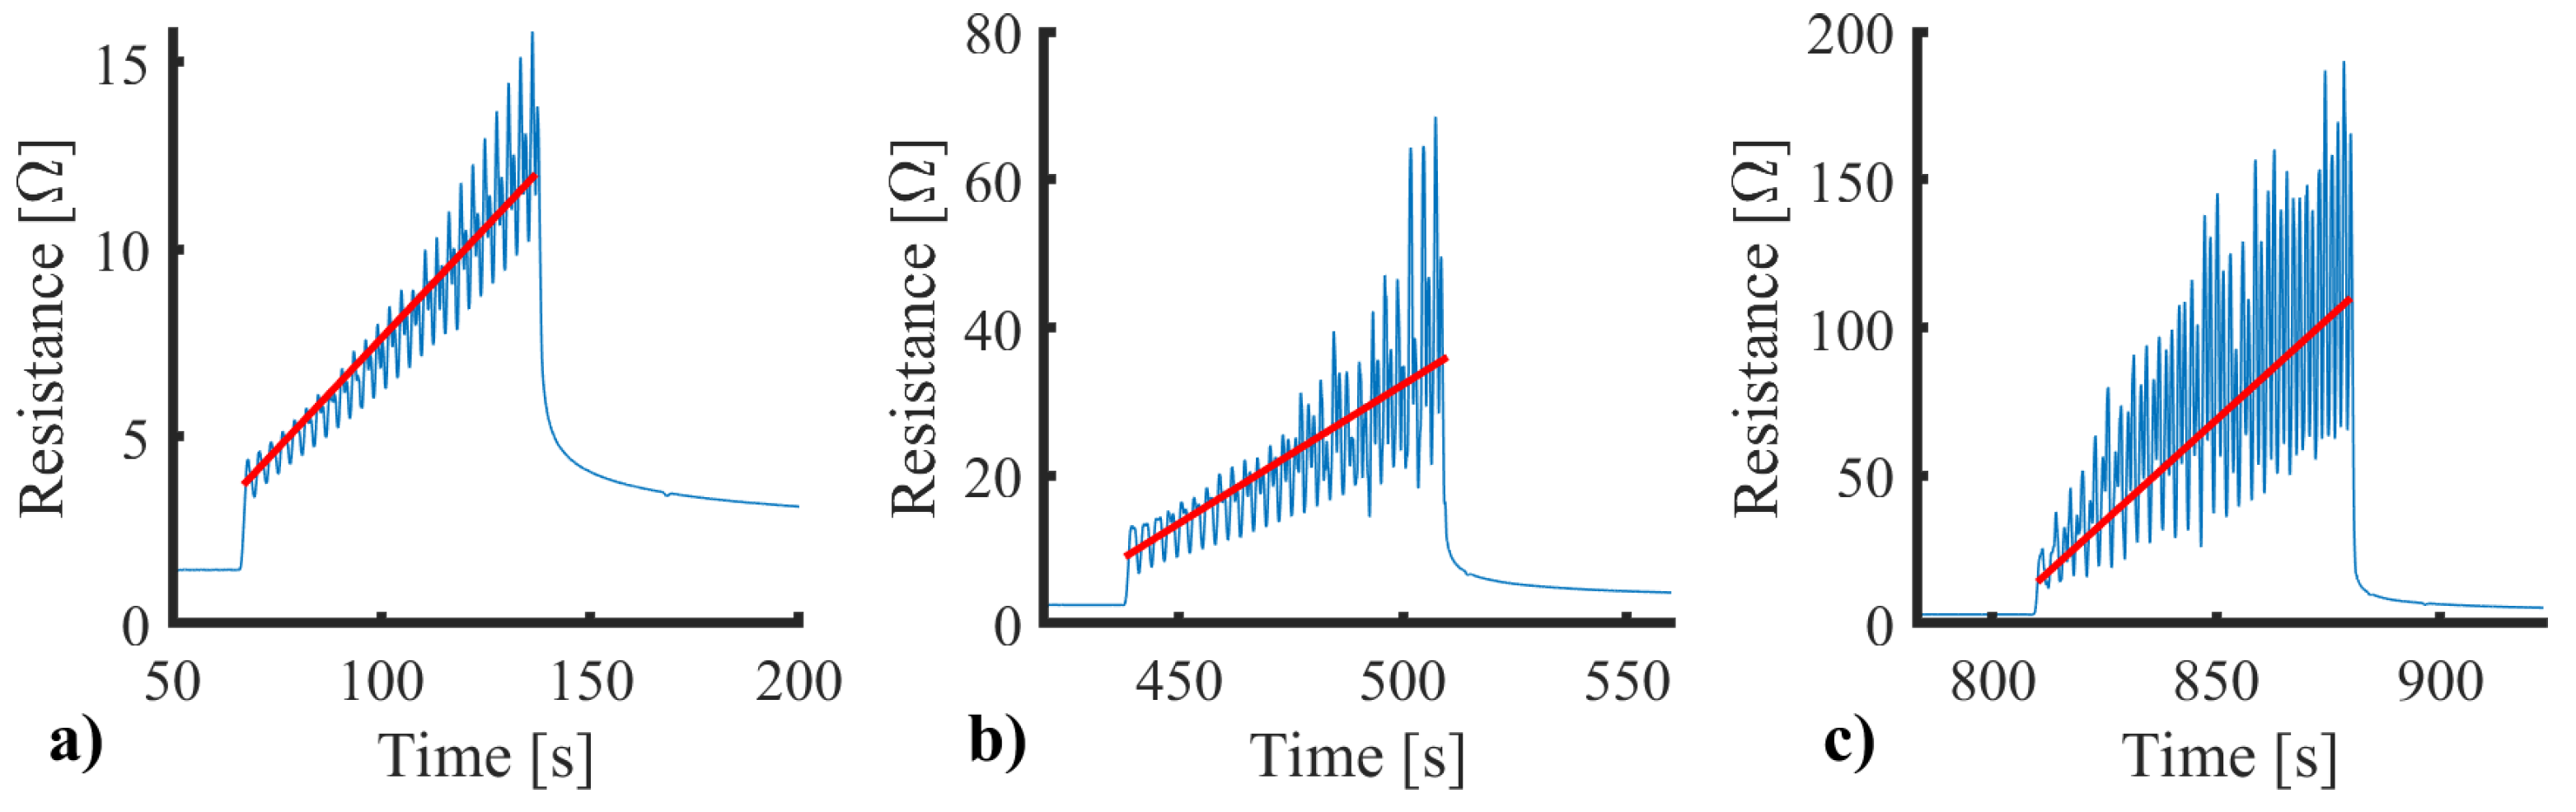
Figure 12.
Micro-crack in relaxed and stretch silver conductive adhesive. a) Relaxed , b) relaxed , c) stretched , d) stretched , e) stretched with measurements
Figure 12.
Micro-crack in relaxed and stretch silver conductive adhesive. a) Relaxed , b) relaxed , c) stretched , d) stretched , e) stretched with measurements
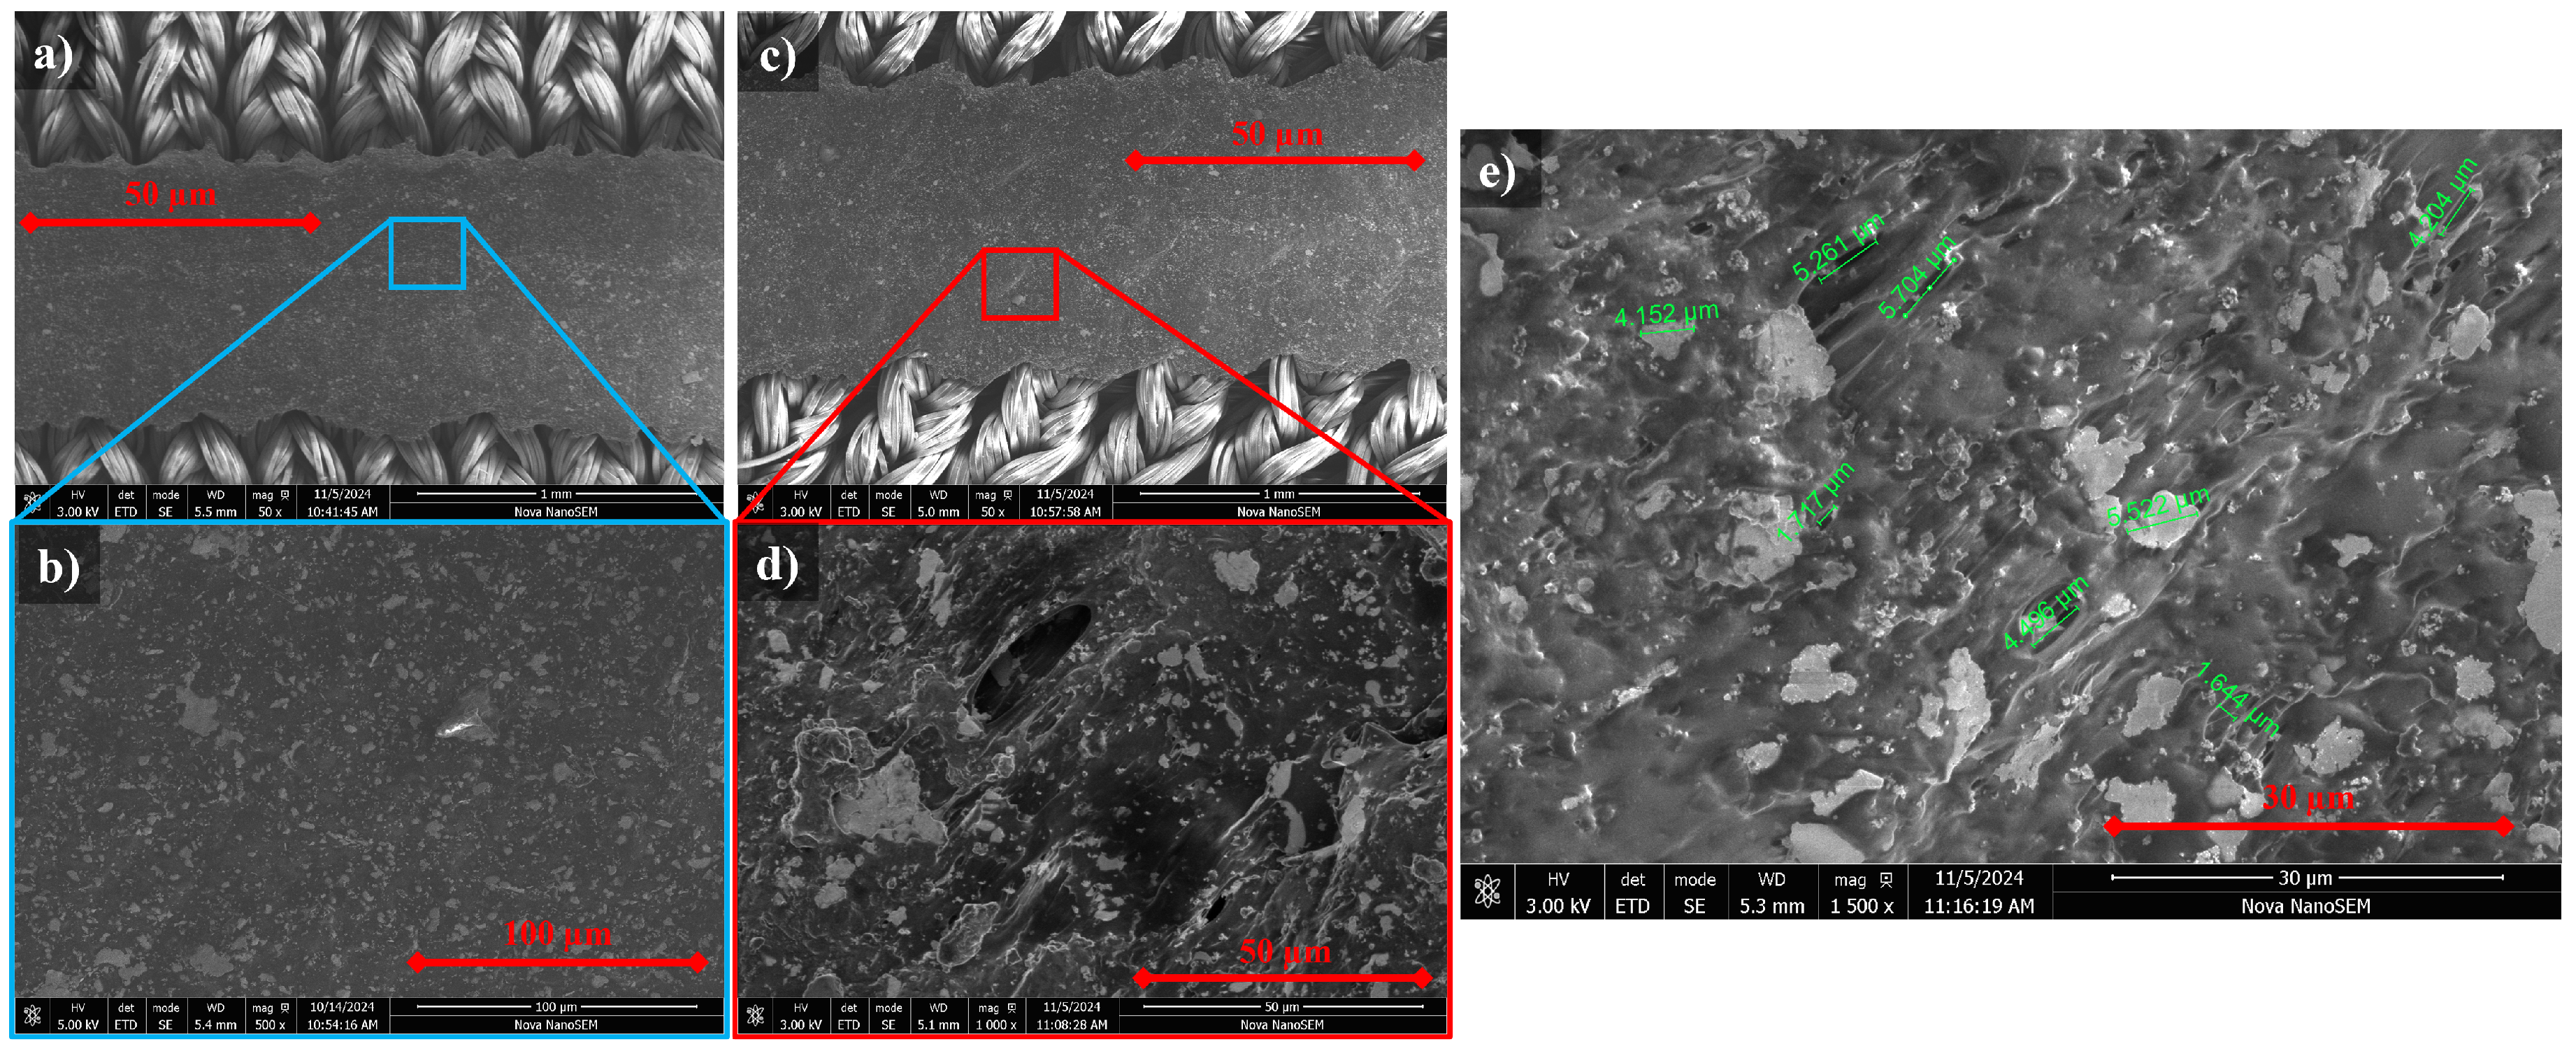
Figure 13.
Cyclic loading response at different temperatures over 100 cycles. a) 50°C cure, b) 60°C cure, c) 70°C cure and d) 80°C cure
Figure 13.
Cyclic loading response at different temperatures over 100 cycles. a) 50°C cure, b) 60°C cure, c) 70°C cure and d) 80°C cure
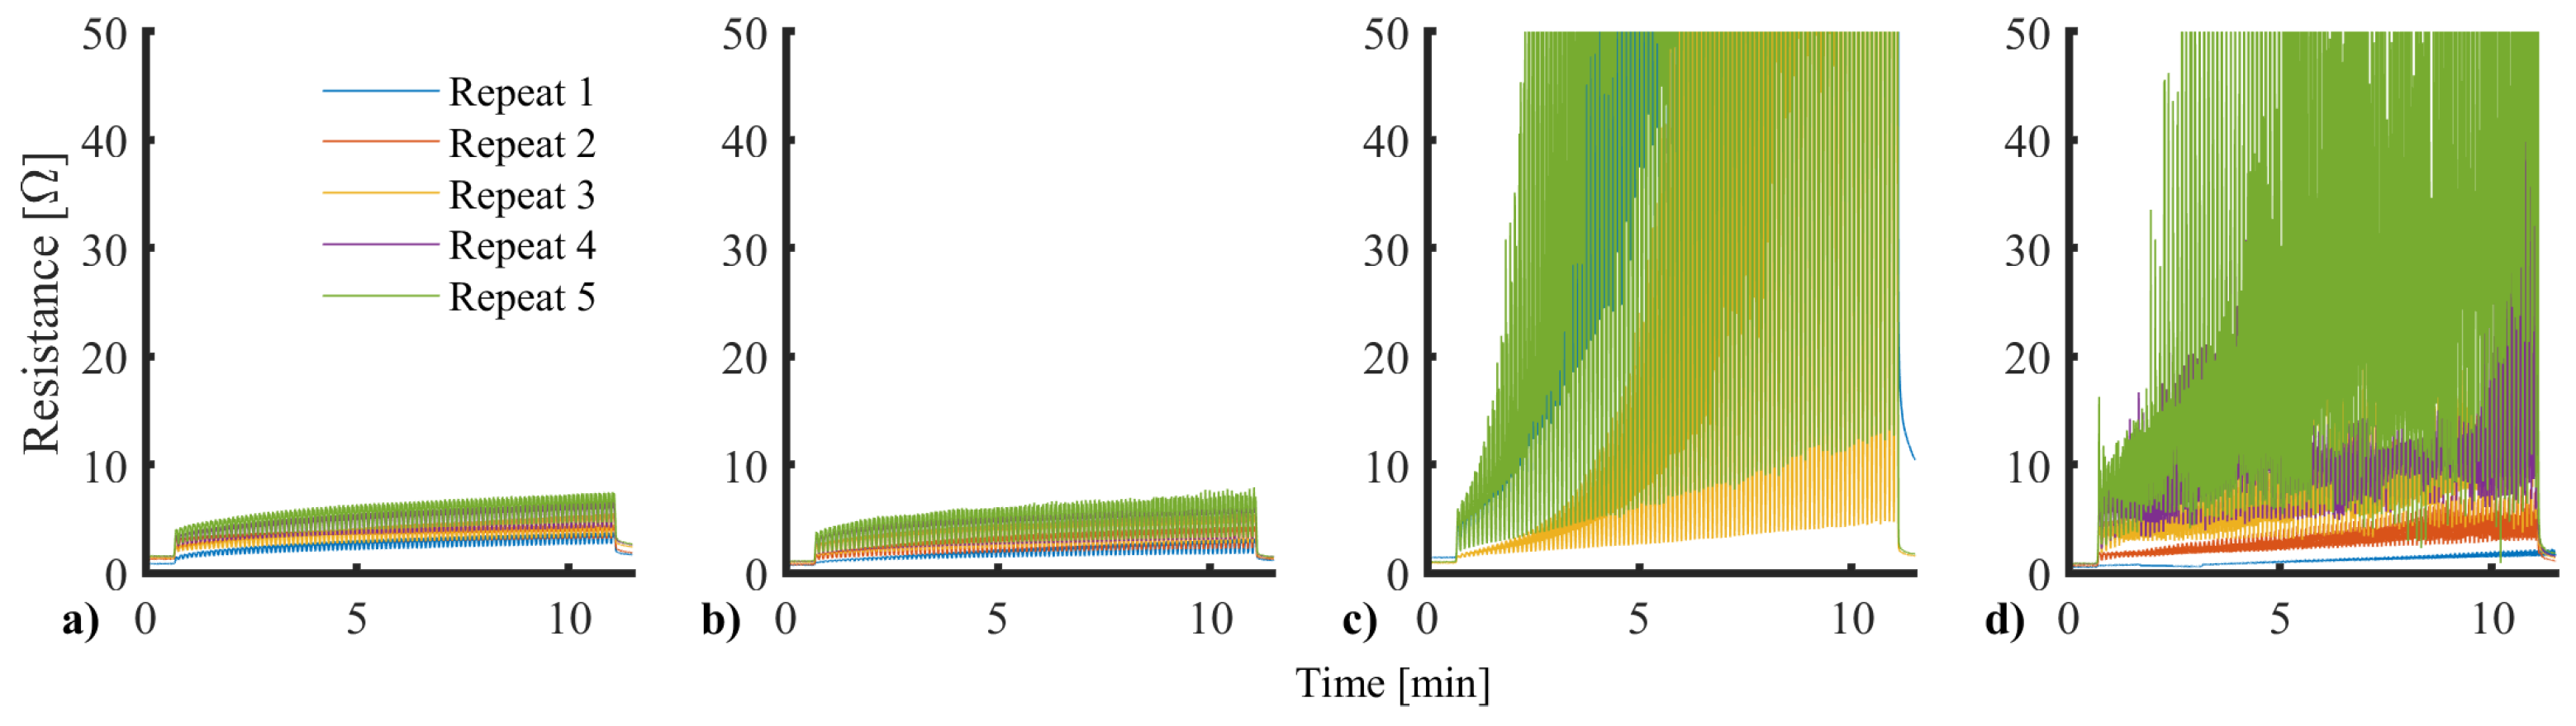
Figure 14.
Silver conductive adhesive integration with a) Lycra and, b) Knitted natural fibres, with highlighted interfacing.
Figure 14.
Silver conductive adhesive integration with a) Lycra and, b) Knitted natural fibres, with highlighted interfacing.
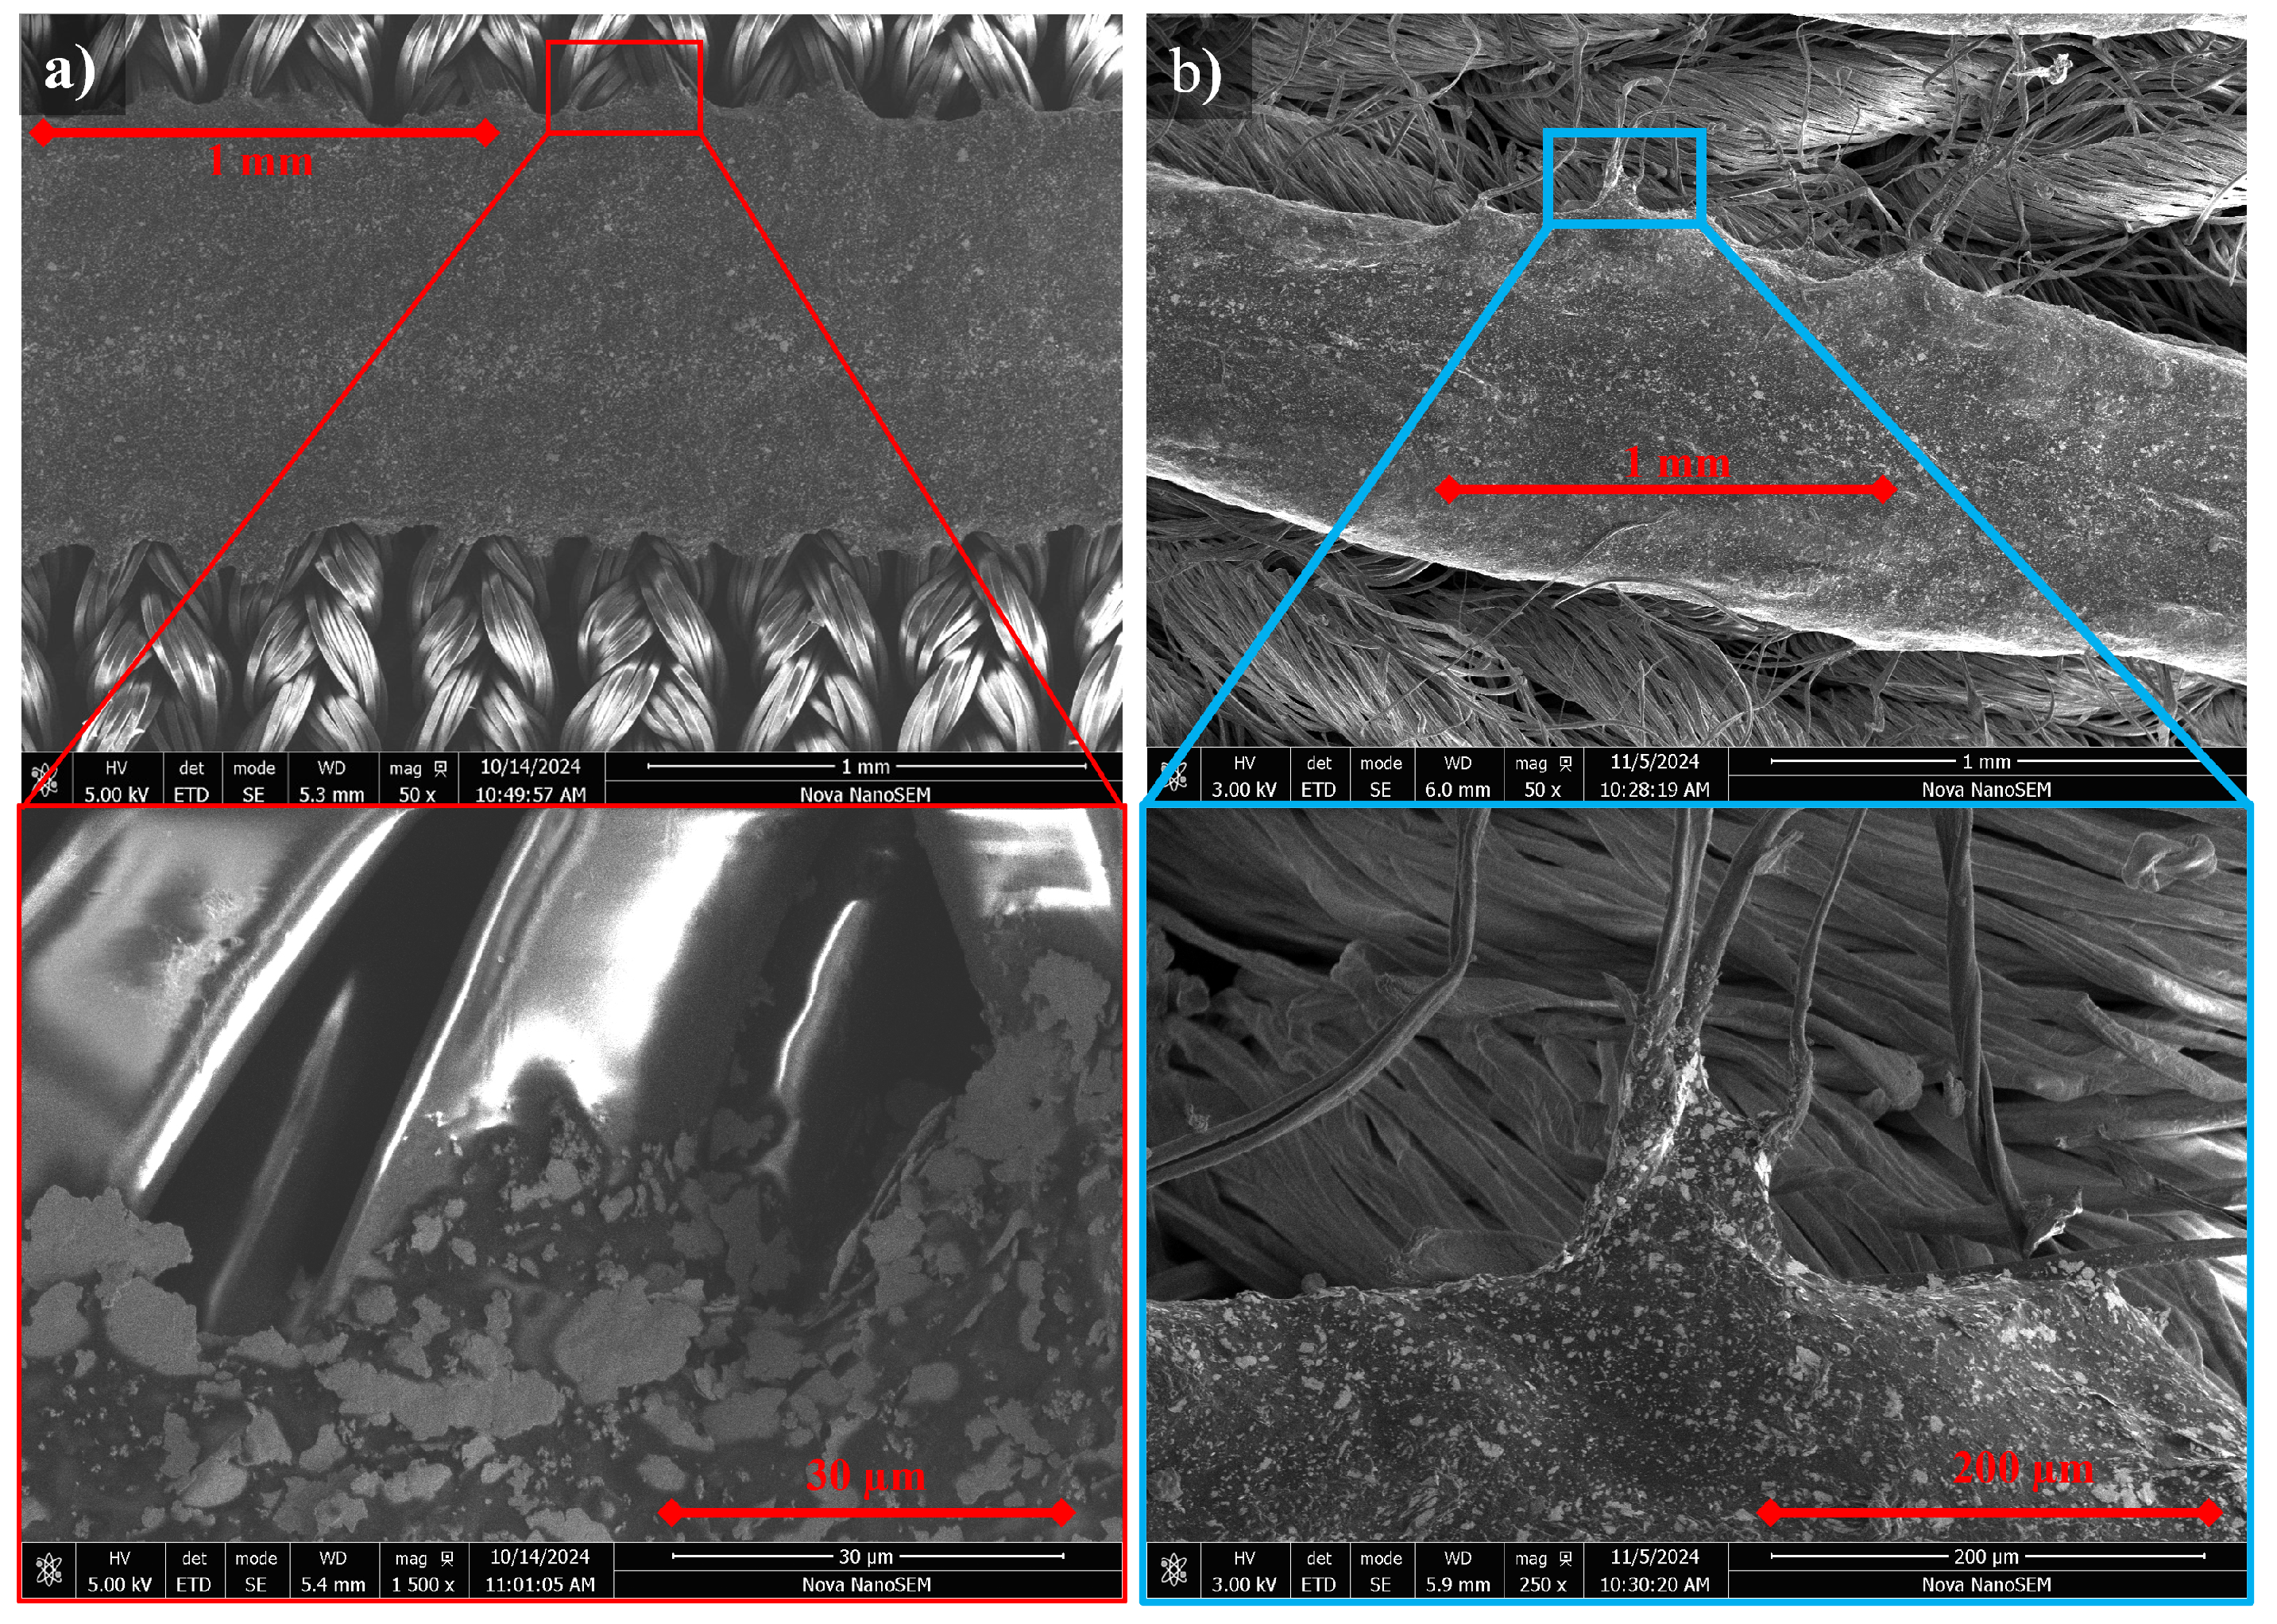
Figure 15.
Sensor response with reinforcing silicones Exoflex a) 00-20, b) 00-30 and c) 00-50.
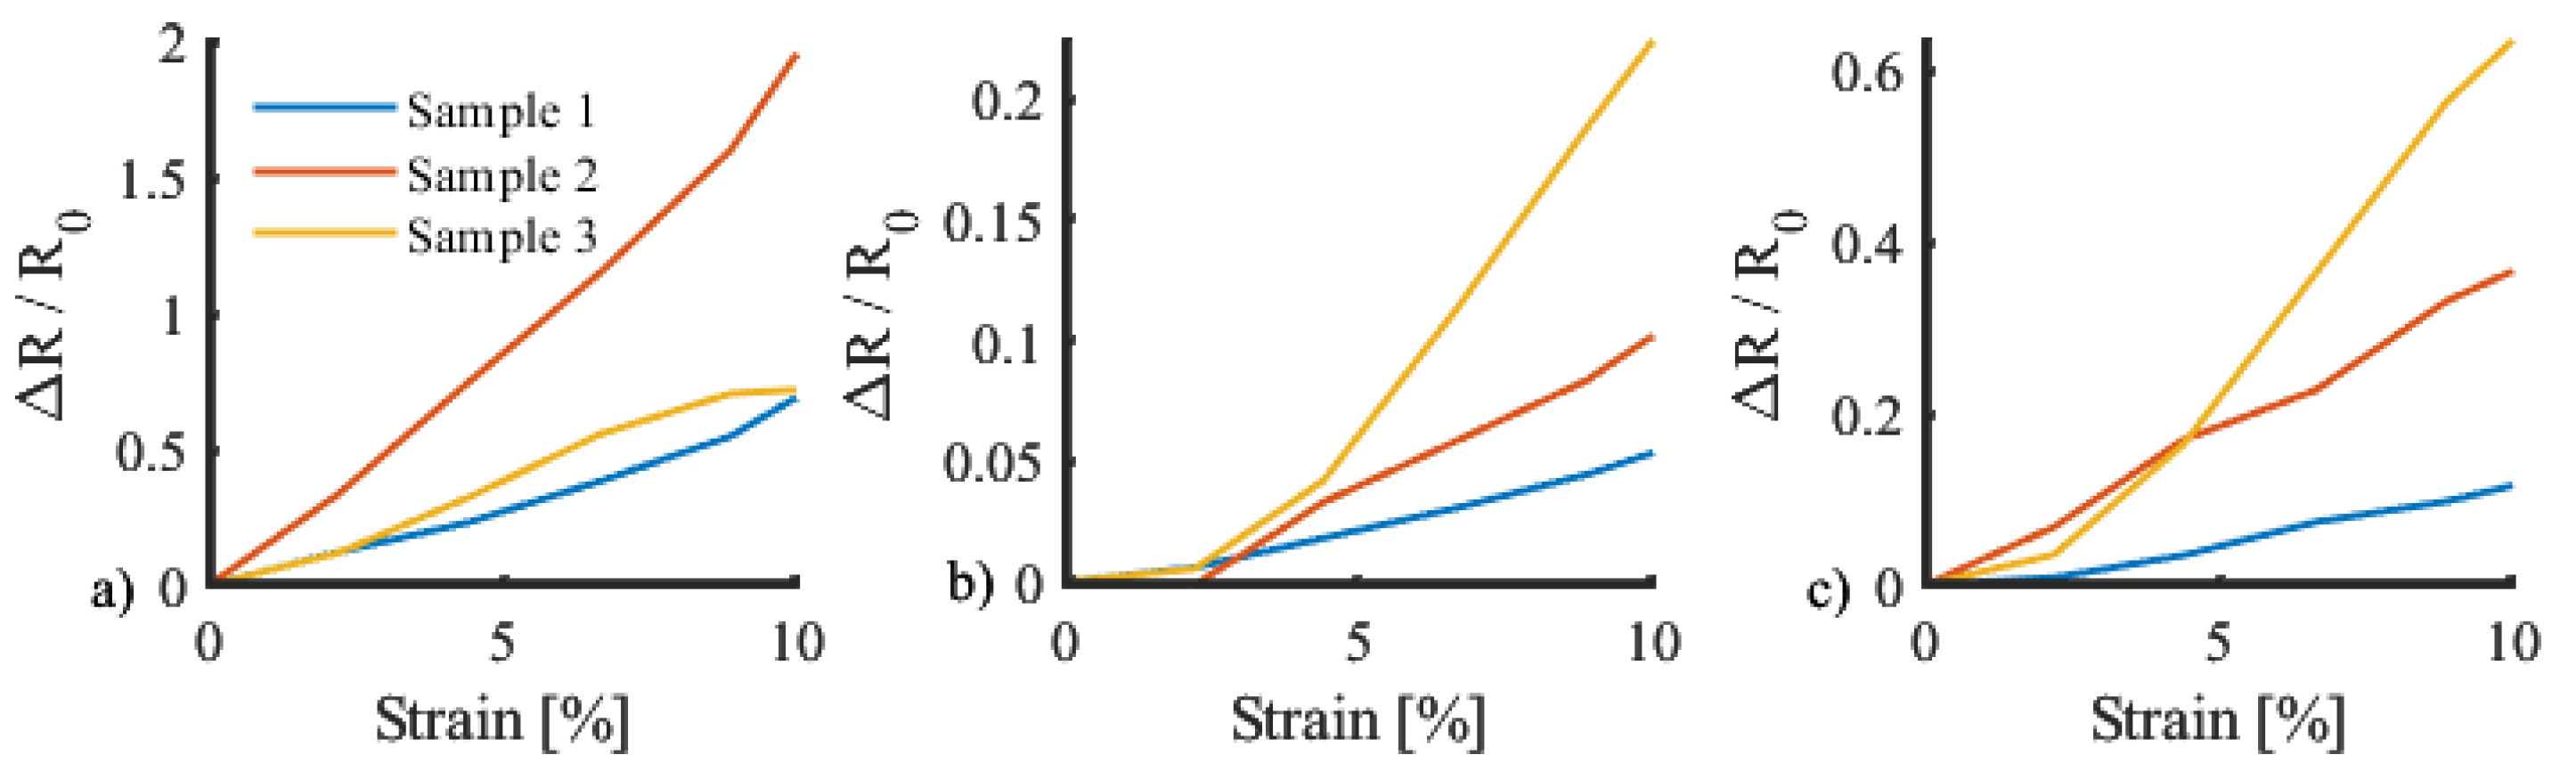
Figure 16.
Final sensor design showing: a) Dispensing route and b) Sensor sample.
Figure 17.
Applied strain vs sensor response example data a) over 100 cycles (left) with b) zoomed-in section across six cycles highlighting conformity and c) example of quantifying dynamic peak drift present.
Figure 17.
Applied strain vs sensor response example data a) over 100 cycles (left) with b) zoomed-in section across six cycles highlighting conformity and c) example of quantifying dynamic peak drift present.
Figure 18.
Cylic response with matched strain and normalised resistance for: a) Sample 1, b) Sample 2 and c) Sample 3. Highlighting sensitivity and drift metrics.
Figure 18.
Cylic response with matched strain and normalised resistance for: a) Sample 1, b) Sample 2 and c) Sample 3. Highlighting sensitivity and drift metrics.
Figure 19.
Avereage sensor response metrics a) Sensitivity gradient progression across 100 cycles, b) hysteresis loop example and c) hysteresis percentage progression across 100 cycles.
Figure 19.
Avereage sensor response metrics a) Sensitivity gradient progression across 100 cycles, b) hysteresis loop example and c) hysteresis percentage progression across 100 cycles.

Table 1.
Table of specification requirements defined by the application and scope. SID = Specification IDentifier
Table 1.
Table of specification requirements defined by the application and scope. SID = Specification IDentifier
| SID | Name | Requirement |
|---|---|---|
| 1 | Robustness | Placed on the foot’s plantar surface up to , bodyweight can be exerted during gait, requiring a robust solution. |
| 2 | Biocompatibility | Solutions must be biocompatible due to the increased risk of infection due to cracked or fissured skin increasing access through natural barriers. |
| 3 | Technology Readiness Level | With the interest of producing a real-world impact on patient quality of life. Solutions using commercially available technology will be prioritised. |
| 4 | Production Scale | The processes used in production must involve scalable technology. |
| 5 | Production Compatible | Relating to ID4 solutions must be compatible with industrial knitting machines. |
| 6 | Sensor Localisation | A discrete rather than global sensing approach for response localisation. |
| 7 | Low Profile | Due to increased sensitivity to ulcer formation of soft tissue, ridges and point forces must be avoided. |
Table 2.
Parameters selected to be taken forward
| Parameter | Selected Value |
|---|---|
| Number of Turns | 5 |
| Length | 10 mm |
| Cure Temperature | 75°C |
Disclaimer/Publisher’s Note: The statements, opinions and data contained in all publications are solely those of the individual author(s) and contributor(s) and not of MDPI and/or the editor(s). MDPI and/or the editor(s) disclaim responsibility for any injury to people or property resulting from any ideas, methods, instructions or products referred to in the content. |
© 2025 by the authors. Licensee MDPI, Basel, Switzerland. This article is an open access article distributed under the terms and conditions of the Creative Commons Attribution (CC BY) license (http://creativecommons.org/licenses/by/4.0/).
Copyright: This open access article is published under a Creative Commons CC BY 4.0 license, which permit the free download, distribution, and reuse, provided that the author and preprint are cited in any reuse.


