Submitted:
08 February 2026
Posted:
10 February 2026
You are already at the latest version
Abstract
The cement industry is one of the largest industrial sources of anthropogenic carbon dioxide (CO2) emissions, with clinker production representing the most energy- and carbon-intensive stage of cement manufacturing. Life cycle assessment (LCA) is widely used to quantify the environmental impacts of clinker production and to support benchmarking of energy use and greenhouse gas emissions. However, plant-level benchmarking studies based on real industrial operational data remain limited, and the relationship between energy efficiency improvements and overall climate change impacts is not always clearly resolved.
In this study, the environmental performance of clinker production at a representative integrated cement plant is assessed using a cradle-to-gate LCA approach. The analysis is based on real industrial operational data and uses a functional unit of 1~t of Portland cement clinker. Life cycle inventory data are compiled for raw material inputs, energy consumption, and direct CO2 emissions, and the results are benchmarked against a harmonized literature-based reference dataset. Global warming potential (GWP) is evaluated using IPCC 100-year characterization factors.
The results show that the case-study plant exhibits lower thermal energy demand (3162~MJ/t clinker) and electricity consumption (52.23~kWh/t clinker) compared to the literature benchmark. Despite these improvements in energy-related indicators, the total GWP of clinker production at the case-study plant (1010~kg~CO2-eq/t clinker) is comparable to the benchmark value (995~kg~CO2-eq/t clinker). Contribution analysis indicates that process-related CO2 emissions from limestone calcination dominate the total GWP, accounting for approximately 73\% of total emissions.
These findings demonstrate that improvements in energy efficiency alone do not necessarily translate into proportional reductions in overall climate change impacts for clinker production. The study highlights the importance of harmonized benchmarking and underscores the need for mitigation strategies that directly address process-related emissions in order to achieve substantial reductions in greenhouse gas emissions in the cement industry.
Keywords:
clinker production
; cement industry
; life cycle assessment
; life cycle inventory
; benchmarking
; global warming potential
; carbon dioxide emissions
1. Introduction
The cement industry plays a critical role in supporting global infrastructure development, yet it is also one of the most energy- and carbon-intensive industrial sectors worldwide [1,2,3]. Cement production is responsible for approximately 7–8% of global anthropogenic carbon dioxide (CO2) emissions, with the majority originating from clinker production, the intermediate product formed during high-temperature processing of limestone-based raw materials [4,5,6,7,8,9,10]. Clinker production requires substantial thermal energy input and involves the chemical decomposition of calcium carbonate, making it inherently carbon intensive. As global demand for cement continues to grow, reducing the environmental impact of clinker production has become a central challenge for both industry and policy makers [11].
Life cycle assessment (LCA) has been widely applied as a systematic framework for quantifying the environmental impacts associated with cement and clinker production across different system boundaries and geographical contexts [12,13,14]. Numerous LCA studies have consistently demonstrated that greenhouse gas emissions from clinker production are dominated by two main sources: process-related emissions from limestone calcination and energy-related emissions from fuel combustion in the kiln system [15]. Process-related emissions arise directly from the clinker formation chemistry and typically account for the largest share of total emissions, while fuel-related emissions are linked to kiln operation and energy efficiency [16]. Although improvements in energy efficiency, alternative fuels, and waste heat recovery have contributed to reducing fuel-related emissions, the intrinsic nature of calcination-related CO2 emissions limits the overall mitigation potential achievable through energy measures alone [17].
To support performance evaluation and emission reduction strategies, benchmarking of clinker production systems using life cycle indicators has gained increasing attention in the literature. Benchmarking enables the comparison of key performance indicators, such as thermal energy intensity, electricity consumption, and greenhouse gas emissions, across different plants and technologies [18]. Such comparisons provide valuable insights into relative performance levels, identify potential efficiency gaps, and support the dissemination of best practices within the cement industry [19]. However, the interpretation of benchmarking results strongly depends on the consistency of methodological choices, including the functional unit, system boundary, and life cycle impact assessment approach [20].
Despite the growing availability of life cycle inventory data for clinker production, many existing benchmark datasets are derived from generic or aggregated literature values. These datasets may not fully capture the operational characteristics of modern integrated cement plants operating under real industrial conditions [21]. Plant-level benchmarking studies based on real industrial operational datasets remain relatively limited, particularly those that explicitly harmonize foreground plant data with literature-based reference inventories. The lack of transparent and methodologically consistent comparisons constrains the interpretation of benchmarking results and may obscure the relationship between improvements in energy efficiency and overall climate change impacts.
The objective of this study is to assess the environmental performance of clinker production at a representative integrated cement plant using real industrial operational data and to benchmark the results against a literature-based reference dataset. A cradle-to-gate life cycle assessment is conducted with a functional unit of 1 t of Portland cement clinker, focusing on global warming potential (GWP) using IPCC 100-year characterization factors. By harmonizing methodological choices, inventory assumptions, and background data, this study aims to provide a transparent and robust comparison of energy use and greenhouse gas emissions. In particular, the analysis seeks to clarify the extent to which improvements in energy-related performance indicators translate into reductions in total climate change impacts. The findings contribute to the scientific discussion on clinker production benchmarking and support the development of more effective emission mitigation strategies in the cement industry.
2. Materials and Methods
2.1. Case Study Description
This study investigates a representative integrated cement manufacturing plant using real industrial operational data compiled in the DiB cement plant dataset. To preserve confidentiality, the identity and exact location of the plant are anonymized. The facility operates a conventional clinker-based cement production line and is considered representative of modern cement plants employing rotary kiln technology with preheating and precalcination stages.
2.2. Goal and Scope Definition
Figure 1 illustrates a simplified overview of the cement production process considered in this study. Raw materials, primarily limestone and corrective additives, are proportioned and ground to produce raw meal. The raw meal is subsequently preheated and partially calcined before entering the rotary kiln, where clinker formation occurs at high temperature. After clinker cooling, the material is transported to the finish grinding stage, where it is ground and blended with gypsum to produce cement.
Thermal energy required for clinker production is supplied mainly by fossil fuel-based energy sources, while electricity from the national grid is consumed across major unit operations, including raw meal grinding, kiln auxiliaries, clinker cooling, and cement grinding. Direct emissions, primarily carbon dioxide originating from both fuel combustion and limestone calcination, are released during the clinker production stage.
The main technical and operational characteristics of the case-study plant are summarized in Table 1. These characteristics provide the contextual basis for the life cycle assessment and enable a transparent benchmarking of the environmental performance of the case-study plant against literature-based reference data.
The goal of this study is to assess the environmental performance of clinker production at a representative integrated cement plant and to benchmark the results against literature-based reference data. The assessment is intended to support scientific discussion and industrial benchmarking by identifying key contributors to environmental impacts and potential improvement opportunities within the clinker production process.
The methodological choices adopted in the life cycle assessment, including the definition of the functional unit, system boundary, impact assessment method, and data sources, are summarized in Table 2.
The functional unit (FU) is defined as 1 tonne of Portland cement clinker produced at the plant gate. Clinker is selected as the functional unit because it represents the most energy- and carbon-intensive stage of cement manufacturing and is commonly used as a reference unit in life cycle assessment studies, allowing for consistent comparison with published literature.
A cradle-to-gate system boundary is adopted. The system includes all processes from raw material extraction and preparation through clinker production and cooling, while downstream processes such as cement blending, packaging, distribution, use, and end-of-life are excluded. The system boundary applied in this study is illustrated in Figure 2.
Life cycle impact assessment (LCIA) is performed at the midpoint level with a primary focus on climate change impacts. Global warming potential (GWP) is calculated using IPCC 100-year characterization factors. This indicator is selected due to its relevance for evaluating greenhouse gas emissions associated with clinker production.
Clinker production is treated as a single main product within the defined system boundary; therefore, no allocation procedures are required. Cut-off criteria are applied such that material and energy flows contributing less than 1% to the total mass, energy use, or environmental impact are excluded, while ensuring that at least 99% of the total environmental burden is captured.
Foreground inventory data are derived from real industrial operational records compiled in the DiB cement plant dataset and represent a multi-year average of plant operation. The geographical and technological scope corresponds to a modern integrated cement plant equipped with a rotary kiln, preheater, and precalciner. Life cycle modeling and impact assessment are conducted using the openLCA software environment.
2.3. Life Cycle Inventory
The life cycle inventory (LCI) was established using foreground industrial data and a literature-based benchmark dataset. Foreground data for the case-study plant were obtained from the DiB cement plant dataset and correspond to the production of 1 t of clinker. The inventory includes raw material inputs, fuel consumption, electricity use, and direct CO2 emissions associated with clinker production.
Table 3 reports the foreground inventory for the case-study plant. Raw material inputs comprise limestone and corrective materials (e.g., flue dust, red mud, laterite, and crushed slag). Electricity consumption is reported as the sum of the main unit operations listed in the DiB dataset (limestone crushing, raw meal preparation, coal milling, and kiln operation). Thermal energy demand is calculated from the reported fuel mix by converting the fuel masses to energy using their lower heating values (LHVs) provided in the DiB dataset.
Direct CO2 emissions are reported as the sum of (i) process-related CO2 from calcination and (ii) fuel-combustion CO2. Process CO2 is estimated from limestone input using the CO2 characterization factor for limestone reported in the DiB dataset (kg CO2/kg limestone). Fuel-combustion CO2 is calculated from the reported fuel masses using fuel-specific emission factors (kg CO2/kg fuel) reported in the same dataset. The resulting total direct CO2 emissions are provided in Table 3.
For benchmarking, a literature-based clinker inventory was compiled from Rhaouti et al. (2024). The reference inventory is reported per 1 kg of clinker in the original dataset; therefore, all flows were scaled to the functional unit of 1 t of clinker to ensure comparability. Table 4 summarizes the key benchmark parameters (materials, electricity, fuel input, and total direct fossil CO2 emissions). For consistent comparison of energy intensity when only fuel mass is reported, an energy-equivalent value can be derived by applying the same LHV assumption used for the case-study fuels.
Background processes (e.g., upstream electricity generation and fuel supply) are modeled using secondary datasets within the openLCA software environment, and consistent background assumptions are applied across both the case-study and literature-based inventories to avoid systematic bias in the benchmarking results.
2.4. Benchmarking Approach
The benchmarking analysis is conducted by comparing the life cycle inventory and impact assessment results of the case-study plant with the literature-based reference dataset derived from Rhaouti et al. (2024). To ensure a consistent comparison, both inventories are harmonized to the same functional unit (1 t of clinker) and system boundary (cradle-to-gate), as defined in Section 2.2.
Key benchmarking indicators include thermal energy intensity (MJ/t clinker), electricity consumption (kWh/t clinker), and direct CO2 emissions (kg CO2/t clinker). Differences between the case-study plant and the benchmark values are quantified and discussed in relative terms to highlight deviations from literature-reported performance levels.
Where inventory parameters are reported at different levels of aggregation, harmonization is applied prior to comparison. In particular, when literature data report only aggregated fuel inputs or total CO2 emissions, equivalent energy or emission values are derived using consistent assumptions with those applied to the foreground inventory. This approach ensures comparability while minimizing methodological bias.
The benchmarking results are interpreted to identify potential performance gaps and improvement opportunities in clinker production, with particular emphasis on energy efficiency and carbon intensity.
2.5. Uncertainty and Limitations
Several sources of uncertainty and limitation should be considered when interpreting the results of this study. First, the analysis is based on data from a single integrated cement plant. Although the plant is considered representative of modern clinker production technology, the results may not be fully generalizable to all cement plants, particularly those operating under different technological or regional conditions.
Second, while the foreground inventory data are derived from real industrial records and represent multi-year average operation, uncertainties remain due to measurement variability, data aggregation, and assumptions applied in the calculation of thermal energy demand and process-related CO2 emissions. These uncertainties may influence the absolute values of the reported indicators but are not expected to alter the relative comparison between the case-study plant and the literature benchmark.
Third, the benchmarking analysis relies on literature-based inventory data that are reported at different levels of detail and aggregation. Despite harmonization efforts, residual differences in data quality, reporting conventions, and background assumptions may affect the comparability of results.
Finally, the assessment focuses on direct energy use and greenhouse gas emissions at the clinker production stage and does not account for downstream processes or broader environmental impact categories. Future work could address these limitations by including multiple plants, additional impact categories, and uncertainty analysis methods such as sensitivity or Monte Carlo analysis.
3. Results
3.1. Life Cycle Inventory Results
The life cycle inventory results for clinker production at the case-study plant and the literature-based benchmark are presented in Table 3 and Table 4, respectively. The comparison focuses on material inputs, energy consumption, and direct carbon dioxide emissions, which constitute the main drivers of environmental impacts in clinker production. Regarding energy use, the case-study plant exhibits a thermal energy intensity of 3162 MJ/t clinker, compared to 3364 MJ/t clinker reported in the literature benchmark. This represents a reduction of approximately 6% in thermal energy demand, indicating a relatively efficient kiln operation at the case-study plant. The lower thermal energy intensity can be associated with differences in fuel mix composition, kiln operation efficiency, and heat recovery performance, although a detailed process-level assessment is beyond the scope of this inventory analysis.
Electricity consumption at the case-study plant amounts to 52.23 kWh/t clinker, which is substantially lower than the benchmark value of 74 kWh/t clinker. This corresponds to a reduction of about 29% and suggests improved electrical efficiency across major unit operations such as raw meal preparation, kiln auxiliaries, and clinker cooling. Lower electricity demand may reflect differences in equipment efficiency, process integration, and operational practices between the two systems. In terms of raw material inputs, the limestone requirement for clinker production at the case-study plant (1420 kg/t clinker) is comparable to the value reported in the literature benchmark (1410 kg/t clinker). This similarity indicates that both systems operate with comparable clinker chemistry and lime saturation levels. The case-study plant exhibits a slightly higher use of corrective materials, which can be attributed to differences in raw material quality and feed composition control strategies aimed at achieving the desired clinker mineralogy.
Direct carbon dioxide emissions at the case-study plant amount to 1010 kg CO2/t clinker, including contributions from both calcination-related emissions and fuel combustion. This value is marginally higher than the benchmark emission level of 995 kg CO2/t clinker reported in the literature. The difference is primarily driven by variations in fuel-related emissions and raw material carbonate content, which directly influence process CO2 release during calcination. Overall, the inventory results indicate that the case-study plant performs favorably in terms of energy efficiency compared to the literature benchmark, particularly with respect to electricity consumption. At the same time, direct CO2 emissions remain within the range reported in the literature, highlighting the dominant role of process-related emissions in clinker production. These inventory-level findings provide a robust basis for the life cycle impact assessment and benchmarking results discussed in the subsequent sections.
3.2. Global Warming Potential Results
The global warming potential (GWP) results for clinker production are presented in Figure 3 and are expressed per functional unit of 1 t of clinker. The results are derived from the life cycle inventory data reported in Table 3 and Table 4 and represent the characterized climate change impacts associated with clinker production at the case-study plant and the literature-based reference system.
The total GWP of the case-study plant is 1010 kg CO2-eq/t clinker, while the literature-based benchmark reported by Rhaouti et al. (2024) amounts to 995 kg CO2-eq/t clinker. The difference between the two systems is relatively small (approximately 1.5%), indicating that the overall climate change impact of the case-study plant is comparable to that reported for representative clinker production systems in the literature. This similarity suggests that the case-study plant operates within the typical performance range observed for modern integrated clinker production facilities.
Despite the lower thermal energy demand and electricity consumption observed for the case-study plant, the total GWP remains slightly higher than the benchmark value. This outcome reflects the dominant contribution of process-related CO2 emissions from limestone calcination, which constitute the largest share of total greenhouse gas emissions in clinker production. As calcination-related emissions arise from the chemical decomposition of calcium carbonate, they are largely independent of improvements in thermal and electrical energy efficiency. Consequently, reductions in energy consumption primarily affect fuel-related emissions and result in only marginal changes in total GWP.
The GWP results therefore highlight the limited sensitivity of overall climate change impacts to energy efficiency improvements at the clinker production stage. Even when energy-related performance indicators show favorable values, the total GWP remains strongly governed by process-related emissions. Overall, the GWP results confirm that clinker production at the case-study plant operates within the typical emission range reported in the literature. These findings provide a consistent and robust basis for the contribution analysis and benchmarking discussion presented in the subsequent sections.
3.3. Contribution Analysis
The contribution analysis examines the relative importance of different emission sources contributing to the total global warming potential (GWP) of clinker production at the case-study plant. The analysis focuses on process-related CO2 emissions from limestone calcination and energy-related CO2 emissions from fuel combustion. The results are illustrated in Figure 4.
Process-related CO2 emissions from limestone calcination represent the dominant contribution to the total GWP, accounting for approximately 73% of total greenhouse gas emissions. This contribution is inherent to clinker production and results from the decomposition of calcium carbonate during the calcination process. As such, these emissions are largely independent of improvements in thermal or electrical energy efficiency. Fuel combustion contributes the remaining share of total GWP, accounting for approximately 27% of total emissions. Fuel-related emissions are directly associated with the thermal energy demand of the kiln system and the composition of the fuel mix used in clinker production.
Overall, the contribution analysis clearly indicates that process-related emissions from calcination are the primary driver of climate change impacts in clinker production, while fuel-related emissions constitute a secondary but still significant contribution. These results highlight the structural limitations of energy efficiency measures alone in achieving substantial reductions in total GWP and provide a basis for the benchmarking analysis presented in the next section.
3.4. Benchmarking Analysis
The benchmarking analysis evaluates the environmental performance of the case-study plant relative to a literature-based reference system reported by Rhaouti et al. (2024). The comparison is conducted using harmonized indicators expressed per functional unit of 1 t of clinker and focuses on thermal energy intensity, electricity consumption, and global warming potential (GWP).
As shown in Figure 5, the case-study plant demonstrates lower thermal energy demand (3162 MJ/t clinker) compared to the literature benchmark (3364 MJ/t clinker). Similarly, electricity consumption at the case-study plant (52.23 kWh/t clinker) is substantially lower than the benchmark value (74 kWh/t clinker). These results indicate a favorable energy efficiency performance of the case-study plant relative to the reference system. In contrast, the total GWP of the case-study plant (1010 kg CO2-eq/t clinker) is comparable to that of the literature benchmark (995 kg CO2-eq/t clinker), as illustrated in Figure 3. Despite improvements in energy-related indicators, the overall climate change impact remains similar between the two systems.
The benchmarking results confirm that reductions in energy consumption do not necessarily translate into proportional reductions in total GWP. This outcome is consistent with the contribution analysis presented in Section 3.3, which shows that process-related CO2 emissions from limestone calcination dominate total emissions in both systems. Overall, the benchmarking analysis indicates that the case-study plant operates within the typical performance range reported for modern clinker production systems. The results provide a clear quantitative basis for interpreting the relative performance of the case-study plant and for contextualizing the findings within existing literature.
3.5. Summary of Key Results
This study assessed the life cycle inventory and global warming potential (GWP) of clinker production at a representative cement plant and benchmarked the results against literature-based reference data. The analysis was conducted using harmonized system boundaries and a consistent functional unit, enabling a transparent comparison of key performance indicators.
The life cycle inventory results indicated that the case-study plant performs favorably with respect to energy-related indicators. In particular, both thermal energy demand and electricity consumption were lower than the corresponding literature benchmark values. These findings suggest a relatively high level of operational energy efficiency at the case-study plant, reflecting differences in kiln operation, process integration, and electrical efficiency across major unit operations.
Despite the lower energy consumption, the total GWP of clinker production at the case-study plant was found to be comparable to that reported in the literature. The contribution analysis demonstrated that process-related CO2 emissions from limestone calcination constitute the dominant share of total greenhouse gas emissions, whereas fuel combustion represents a secondary but still significant contributor. Electricity-related emissions account for a comparatively minor share of total GWP.
The benchmarking analysis further confirmed that improvements in energy efficiency do not necessarily result in proportional reductions in total climate change impacts. This outcome highlights the structural importance of process-related emissions in clinker production and explains the limited sensitivity of total GWP to variations in energy-related performance indicators.
Overall, the results show that the case-study plant operates within the typical performance range reported for modern clinker production systems. The findings provide a robust quantitative basis for the discussion of environmental performance, mitigation potential, and future improvement strategies presented in the following section.
4. Discussion
4.1. Interpretation of Energy Performance
The life cycle inventory results demonstrate that the case-study plant exhibits relatively favorable energy performance compared to the literature-based benchmark. Both thermal energy demand and electricity consumption are lower than the benchmark values reported by Rhaouti et al. (2024), indicating a comparatively efficient operation of the kiln system and auxiliary processes. Differences in energy performance among clinker production systems are widely documented in the literature and are commonly attributed to variations in kiln configuration, fuel mix, heat recovery efficiency, and operational practices.
The lower electricity consumption observed for the case-study plant suggests effective process integration and efficient operation of electrical equipment across major unit operations, such as raw meal preparation, kiln auxiliaries, and clinker cooling. While the present analysis does not investigate process-level operational details, the results are consistent with previous studies reporting that modern integrated plants can achieve substantial reductions in electrical energy demand through optimized process control and equipment efficiency.
4.2. Relationship Between Energy Efficiency and Global Warming Potential
Despite the observed advantages in energy-related indicators, the global warming potential of clinker production at the case-study plant remains comparable to the literature benchmark. This finding highlights the limited sensitivity of total climate change impact to improvements in energy efficiency alone. As demonstrated by the contribution analysis, process-related CO2 emissions from limestone calcination dominate the total greenhouse gas emissions associated with clinker production [24,25,26].
Process-related emissions arise from the chemical decomposition of calcium carbonate during clinker formation and are therefore largely independent of thermal or electrical energy efficiency improvements [27]. Consequently, reductions in fuel-related emissions achieved through improved energy performance result in only modest changes in total GWP. This observation is consistent with previous life cycle assessment studies, which consistently identify calcination as the primary contributor to climate change impacts in clinker and cement production [28].
4.3. Benchmarking Implications for Clinker Production
From a benchmarking perspective, the results indicate that the case-study plant operates within the typical performance range reported for modern clinker production systems. The benchmarking analysis shows that superior energy efficiency does not necessarily translate into significantly lower total GWP, emphasizing the importance of interpreting benchmarking results in light of the relative contributions of different emission sources.
The comparison with literature data underscores the value of using harmonized functional units and system boundaries when benchmarking environmental performance. Without such harmonization, differences in reported results may reflect methodological inconsistencies rather than actual performance differences. The present study demonstrates that combining real industrial data with literature benchmarks provides a robust basis for contextualizing plant-level performance within the broader cement industry.
4.4. Implications for Emission Mitigation Strategies
The findings of this study have important implications for greenhouse gas mitigation strategies in the cement industry. While continued improvements in energy efficiency and fuel substitution remain essential for reducing fuel-related emissions, the dominance of process-related CO2 emissions limits the overall mitigation potential of such measures. As a result, achieving substantial reductions in total greenhouse gas emissions will require strategies that directly address process-related emissions [29,30].
Potential mitigation options include clinker substitution through the use of supplementary cementitious materials, alternative raw materials with reduced carbonate content, and the implementation of carbon capture, utilization, and storage (CCUS) technologies [31,32,33]. The results presented here reinforce the need for an integrated mitigation approach that combines energy efficiency measures with process-oriented strategies to achieve meaningful reductions in the climate change impact of clinker production.
4.5. Limitations and Future Research
Several limitations of the present study should be acknowledged. First, the analysis is based on data from a single cement plant and therefore may not fully represent the variability of technologies, fuel mixes, and operating conditions across the global cement industry. Second, the benchmarking relies on literature-based inventory data that may differ in terms of data quality, reporting conventions, and background assumptions. Although harmonization of the functional unit and system boundary was applied, some residual differences are unavoidable.
Future research could extend the present analysis by including multiple cement plants, additional impact categories beyond climate change, and uncertainty or sensitivity analyses to assess the robustness of the results. Scenario-based assessments exploring the effects of clinker substitution, alternative raw materials, and carbon capture technologies would further enhance understanding of potential pathways for reducing the environmental impacts of clinker and cement production.
5. Conclusions
The main conclusions of this study are summarized as follows:
- A cradle-to-gate life cycle assessment was performed for clinker production at a representative integrated cement plant using real industrial operational data, with a functional unit of 1 t of clinker, enabling a plant-level evaluation under realistic operating conditions.
- The case-study plant exhibits lower thermal energy demand (3162 MJ/t clinker) and electricity consumption (52.23 kWh/t clinker) than the harmonized literature benchmark, indicating comparatively efficient kiln operation and auxiliary process performance.
- Despite the improved energy-related indicators, the total global warming potential of clinker production at the case-study plant (1010 kg CO2-eq/t clinker) remains comparable to the benchmark value, demonstrating that reductions in energy consumption do not necessarily lead to proportional decreases in overall climate change impacts.
- Contribution analysis confirms that process-related CO2 emissions from limestone calcination are the dominant source of greenhouse gas emissions, accounting for approximately 73% of the total global warming potential and largely determining the climate performance of clinker production.
- The benchmarking results highlight the importance of interpreting energy efficiency indicators in conjunction with emission source contributions, as benchmarking based solely on energy performance may lead to misleading conclusions regarding climate impact.
- Overall, the findings indicate that while continued improvements in energy efficiency and fuel management remain important, substantial reductions in greenhouse gas emissions from clinker production will require mitigation strategies that directly target process-related emissions, including clinker substitution, alternative raw materials, and carbon capture technologies.
Author Contributions
Conceptualization, B.M. and Y.L.; methodology, Y.L.; software, J.B.; validation, B.M., Y.L. and Y.C.; formal analysis, J.B.; investigation, Y.L.; resources, Y.C.; data curation, Y.L.; writing—original draft preparation, B.M.; writing—review and editing, Y.C. and B.M. ; visualization, Y.L.; supervision, Y.C. and B.M.; project administration, Y.C.; funding acquisition, Y.C. All authors have read and agreed to the published version of the manuscript.
Funding
This work was supported by the Technology Innovation Program(RS-2022-00154993, Development of technology for manufacturing and utilizing Portland cement that uses non-carbonate raw materials to replace limestone by more than 5 wt.%) funded by the Ministry of Trade, Industry and Resources(MOTIR, Korea).
Data Availability Statement
The foreground life cycle inventory data used in this study were obtained from the DiB cement plant dataset reported by Basavaraj and Gettu [22]. Benchmark inventory data were derived from the open-access dataset reported by Rhaouti et al. [23]. Both datasets are publicly available under open access licenses via Mendeley Data.
Conflicts of Interest
The authors declare no conflicts of interest.
Abbreviations
The following abbreviations are used in this manuscript:
| CCUS | Carbon capture, utilization, and storage |
| CO2 | Carbon dioxide |
| FU | Functional unit |
| GHG | Greenhouse gas |
| GWP | Global warming potential |
| IPCC | Intergovernmental Panel on Climate Change |
| LCA | Life cycle assessment |
| LCI | Life cycle inventory |
| LCIA | Life cycle impact assessment |
| OPC | Ordinary Portland cement |
References
- Khalil, E.; AbouZeid, M. Framework for Cement Plants Assessment Through Cement Production Improvement Measures for Reduction of CO2 Emissions Towards Net Zero Emissions. Constr. Mater. 2025, 5, 20. [Google Scholar] [CrossRef]
- Haroon, M.; Ayub, A. Role of the Pakistan Cement Industry towards the Achievement of Net Zero Goal by Mid-Century: A Review from a Waste Heat Recovery Perspective. Eng. Proc. 2023, 45, 45. [Google Scholar] [CrossRef]
- Lin, B.; Zhang, Z.; Ge, F. Energy Conservation in China’s Cement Industry. Sustainability 2017, 9, 668. [Google Scholar] [CrossRef]
- Feng, R.; Wang, O.; Yang, X.; Gao, J.; Wang, P. Sulfate Attack Resistance of Cement-Stabilized Crushed Gravel Base. High-speed Railway 2026. [Google Scholar] [CrossRef]
- Mend, B.; Lee, Y.; Kwon, D.-Y.; Kim, J.-H. J.; Chu, Y.-S. Calcium Fluoride as an Efficient Mineralizer for Low-Temperature Portland Cement Clinkering: A Mechanistic Mini Review. Frontiers in Materials 2026, 13. [Google Scholar] [CrossRef]
- Piriyakul, K.; Petcherdchoo, A.; Punthutaecha, K.; Phoo-ngernkham, T. Unconfined Compressive Strength and Small-Strain Shear Modulus of Soft Marine Clay Improved by Ordinary Portland Cement and Polyester Fibers with Modeling by Michaelis-Menten Kinetics. Journal of Road Engineering 2026. [Google Scholar] [CrossRef]
- Gu, K.; Li, C.; Ye, J.; Gao, W.; Jiang, Z. Coupling Effect of Hydromagnesite Seeds and Carbonation on Strength Enhancement and Microstructure Evolution of Magnesium Oxysulfate (MOS) Cement. Construction and Building Materials 2026, 511, 145356–145356. [Google Scholar] [CrossRef]
- Li, J.; Zhang, S.; Cai, W.; Huang, X.; Jie, S.; Li, H.; Li, H.; Mao, X. Mid-Term Outcomes of Cement-In-Cement Revision for Aseptic Loosening versus Infection: A Comparative Study in a Small Retrospective Cohort. Arthroplasty Today 2026, 37, 101934–101934. [Google Scholar] [CrossRef]
- Mend, B.; Lee, Y. J.; Kwon, D.-Y.; Bang, J.-H.; Chu, Y. S. Utilisation of Industrial Sludge-Derived Ferrous Sulfate for Hexavalent Chromium Mitigation in Cement. Advances in Cement Research 2025, 1–9. [Google Scholar] [CrossRef]
- Jing, M.; Zhao, H.; Li, P.; Shen, Q.; Hao, H.; Chen, T.; Wu, H. Study on the Performance of 12CaO·7Al2O3 Prepared by Electric Thermal Coupling Rapid Calcination Method Applied in Conductive Cement-Based Materials Fabrication. Journal of Building Engineering 2026, 115551. [Google Scholar] [CrossRef]
- Oguntola, O.; Simske, S. Continuous Assessment of the Environmental Impact and Economic Viability of Decarbonization Improvements in Cement Production. Resources 2023, 12, 95. [Google Scholar] [CrossRef]
- Gálvez-Martos, J.-L.; Al-Hashimi, A.; Elhoweris, A.; Abdalla, O.; Chaliulina, R.; Al-Horr, Y.; Bannerman, M. N. Eco-Efficiency and Environmental Trade-Offs of Calcium Sulfoaluminate Cement Using a Large-Scale Parametric LCA Model. Resources, Conservation and Recycling 2026, 229, 108826. [Google Scholar] [CrossRef]
- Tefa, L.; Bianco, I.; Blengini, G. A.; Bassani, M. Integrated and Comparative Structural-LCA Analysis of Unbound and Cement-Stabilized Construction and Demolition Waste Aggregate for Subbase Road Pavement Layers Formation. Journal of Cleaner Production 2022, 352, 131599. [Google Scholar] [CrossRef]
- Mend, B.; Lee, Y.; Kim, J.-H.J.; Chu, Y.-S. Reducing Cement Clinker Sintering Temperature Using Fluorine-Containing Semiconductor Waste. Materials 2025, 18, 4202. [Google Scholar] [CrossRef]
- Ramasamy, V.; Kannan, R.; Muralidharan, G.; Sidharthan, R. K.; Veerasamy, G.; Venkatesh, S.; Amirtharajan, R. A Comprehensive Review on Advanced Process Control of Cement Kiln Process with the Focus on MPC Tuning Strategies. Journal of Process Control 2023, 121, 85–102. [Google Scholar] [CrossRef]
- Zhang, T.; Peng, H.; Wu, C.; Guo, Y.; Wang, J.; Chen, X.; Wei, J.; Yu, Q. Process Compatible Desulfurization of NSP Cement Production: A Novel Strategy for Efficient Capture of Trace SO2 and the Industrial Trial. Journal of Cleaner Production 2023, 411, 137344–137344. [Google Scholar] [CrossRef]
- Kuandykova, A.; Taimasov, B.; Potapova, E.; Sarsenbaev, B.; Kolesnikov, A.; Begentayev, M.; Kuldeyev, E.; Dauletiyarov, M.; Zhanikulov, N.; Amiraliyev, B.; et al. Production of Composite Cement Clinker Based on Industrial Waste. J. Compos. Sci. 2024, 8, 257. [Google Scholar] [CrossRef]
- Wei, X.-X.; Liang, P.-L.; Zhu, J.-H.; Pei, C. Synergistic Enhancement of Hydration and Sustainability in Cement Composites via Recycled Powder and Graphene Nanofluid Additives. Construction and Building Materials 2026, 509, 145217–145217. [Google Scholar] [CrossRef]
- Betancor-Cazorla, L.; Vielma, C. A.; Mañosa, J.; Dosta, S.; Chimenos, J. M.; Barreneche, C. Development of Ternary Blended Cements (LC3) to Be Applied as Thermal Energy Storage Material in Concentrated Solar Power Plants. Journal of Energy Storage 2025, 133, 118023. [Google Scholar] [CrossRef]
- Terán-Cuadrado, G.; Nurdiawati, A.; Al-Ghamdi, S. G. Comparative Prospective Life Cycle Assessment of Decarbonization Strategies in the Saudi Cement Industry. Environmental Impact Assessment Review 2026, 119, 108362–108362. [Google Scholar] [CrossRef]
- de Pedro, J.P.Q.; Lagao, J.A.T.; Ongpeng, J.M.C. Life Cycle Assessment of Concrete Using Copper Slag as a Partial Cement Substitute in Reinforced Concrete Buildings. Buildings 2023, 13, 746. [Google Scholar] [CrossRef]
- Basavaraj, S.; Gettu, R. Primary Life Cycle Inventory Data for Cement Production – Indian Cases. Mendeley Data, Version 2 2024. [Google Scholar] [CrossRef]
- Rhaouti, Y.; Taha, Y.; Benzaazoua, M. Life Cycle Inventory Results for a Comparative LCA of Moroccan Calcined Marl Cement, OPC and LC3. Mendeley Data, Version 1 2024. [Google Scholar] [CrossRef]
- Wang, Y.; Yang, M.; Shen, F.; Zhou, M.; Du, W. Conceptual Design and Life-Cycle Environmental and Economic Assessment of Low-Carbon Cement Manufacturing Processes. Journal of Cleaner Production 2024, 471, 143349–143349. [Google Scholar] [CrossRef]
- Li, W.; Wu, Y.; Li, X.; Ma, H.; Ru, Y.; Ye, X. Strength Enhancement and Microstructural Observation of Cement-Stabilized Calcareous Sand by Optimizing the Preparation Process. Journal of Cleaner Production 2025, 538, 147394–147394. [Google Scholar] [CrossRef]
- Shang, X.; Shi, H.; Li, Y.; Yang, J.; Wang, Y. Carbon Footprints of Recycling Straw Waste into Building Materials: A Life Cycle Assessment (LCA) Study. Journal of Cleaner Production 2026, 544, 147679–147679. [Google Scholar] [CrossRef]
- Zhang, B.; Muhammad, F.; Yu, T.; Fahimizadeh, M.; Hassan, M. A. S.; Liang, J.; Ning, X.; Yuan, P. Harnessing Iron Tailings as Supplementary Cementitious Materials in Limestone Calcined Clay Cement (LC3): An Innovative Approach towards Sustainable Construction. Construction and Building Materials 2024, 453, 139111. [Google Scholar] [CrossRef]
- Shamass, Rabee; Rispoli, O.; Limbachiya, Vireen; Kovacs, R. Mechanical and GWP Assessment of Concrete Using Blast Furnace Slag, Silica Fume and Recycled Aggregate. Case studies in construction materials 2023, 18, e02164–e02164. [Google Scholar] [CrossRef]
- Allo, P.T.; Rezaee, R.; Clennell, M.B. Overview of Cement Bond Evaluation Methods in Carbon Capture, Utilisation, and Storage (CCUS) Projects—A Review. Eng 2025, 6, 303. [Google Scholar] [CrossRef]
- Hargis, C.W.; Chen, I.A.; Devenney, M.; Fernandez, M.J.; Gilliam, R.J.; Thatcher, R.P. Calcium Carbonate Cement: A Carbon Capture, Utilization, and Storage (CCUS) Technique. Materials 2021, 14, 2709. [Google Scholar] [CrossRef]
- Zeng, D.; Han, X.; Zheng, C.; Du, Z.; Cao, S.; Xiang, G.; Yu, C.; Yang, J.; Xu, B.; Zhang, L. Study on Corrosion Laws of Casing Steels in CCUS Injection Wells in Simulated Cement Pore Fluids. Geoenergy Science and Engineering 2025, 252, 213908–213908. [Google Scholar] [CrossRef]
- Yuan, B.; Zhang, X.; Yang, S.; Xu, B.; Zheng, Z. Study on Carbonation Corrosion Mechanism and Hydration of Phosphoaluminate Cement for CCUS Wells. Geoenergy Science and Engineering 2025, 251, 213880. [Google Scholar] [CrossRef]
- Fan, J.-L.; Mao, Y.; Li, K.; Zhang, X. Early Opportunities for Onshore and Offshore CCUS Deployment in the Chinese Cement Industry. Engineering 2024. [Google Scholar] [CrossRef]
Figure 1.
Simplified process overview of the case-study cement plant, indicating major unit operations and main energy and emission flows.
Figure 1.
Simplified process overview of the case-study cement plant, indicating major unit operations and main energy and emission flows.
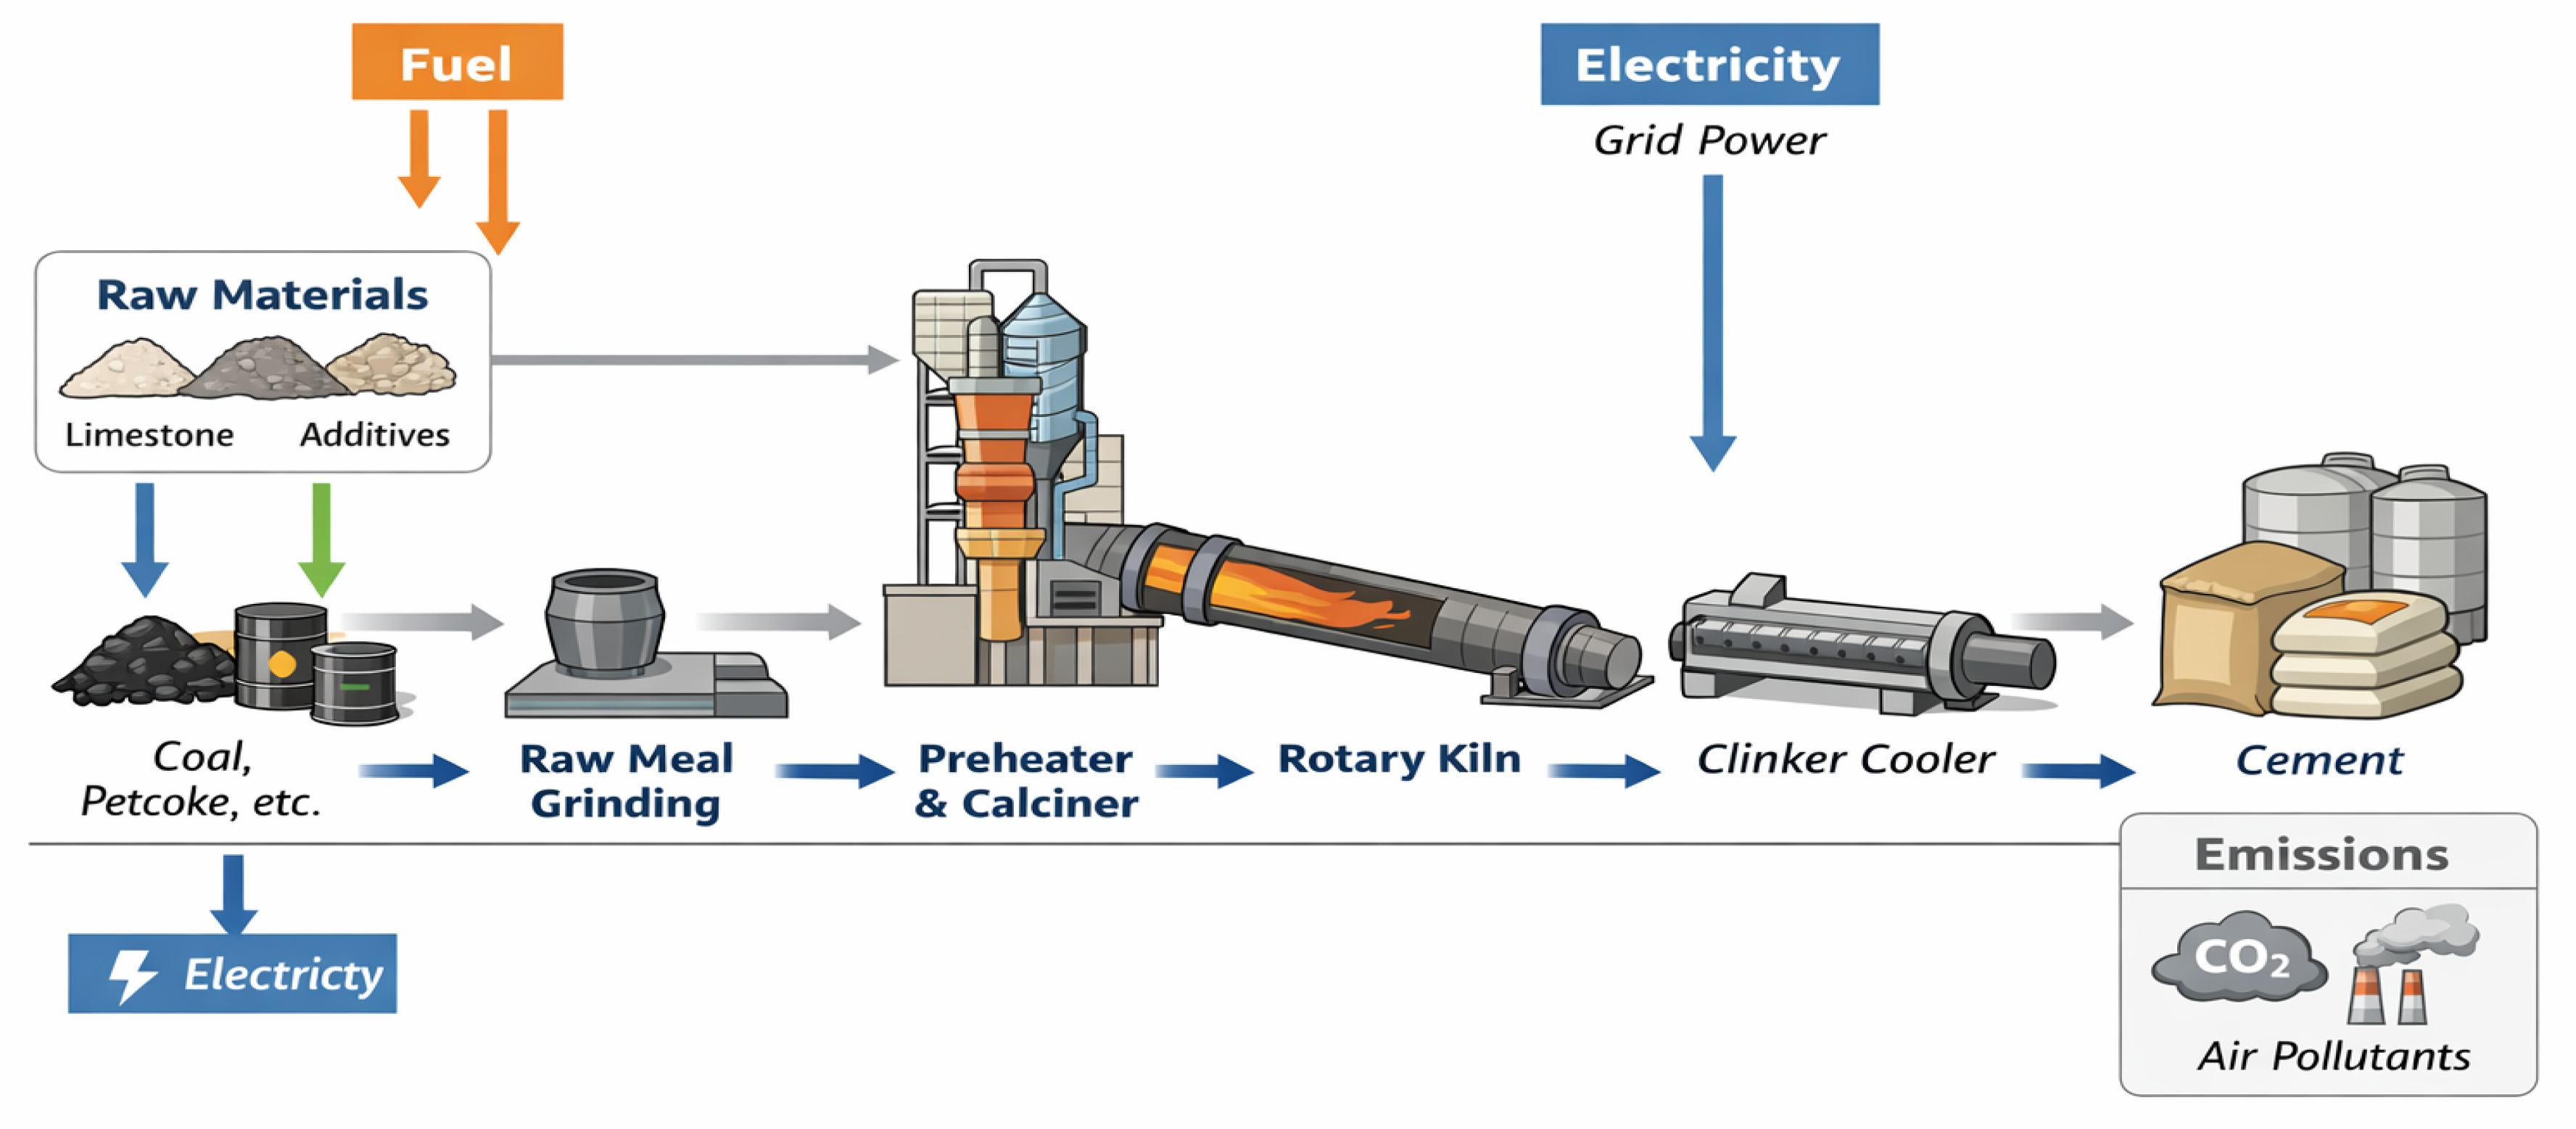
Figure 2.
Simplified process overview of the case-study cement plant, indicating major unit operations and main energy and emission flows.
Figure 2.
Simplified process overview of the case-study cement plant, indicating major unit operations and main energy and emission flows.
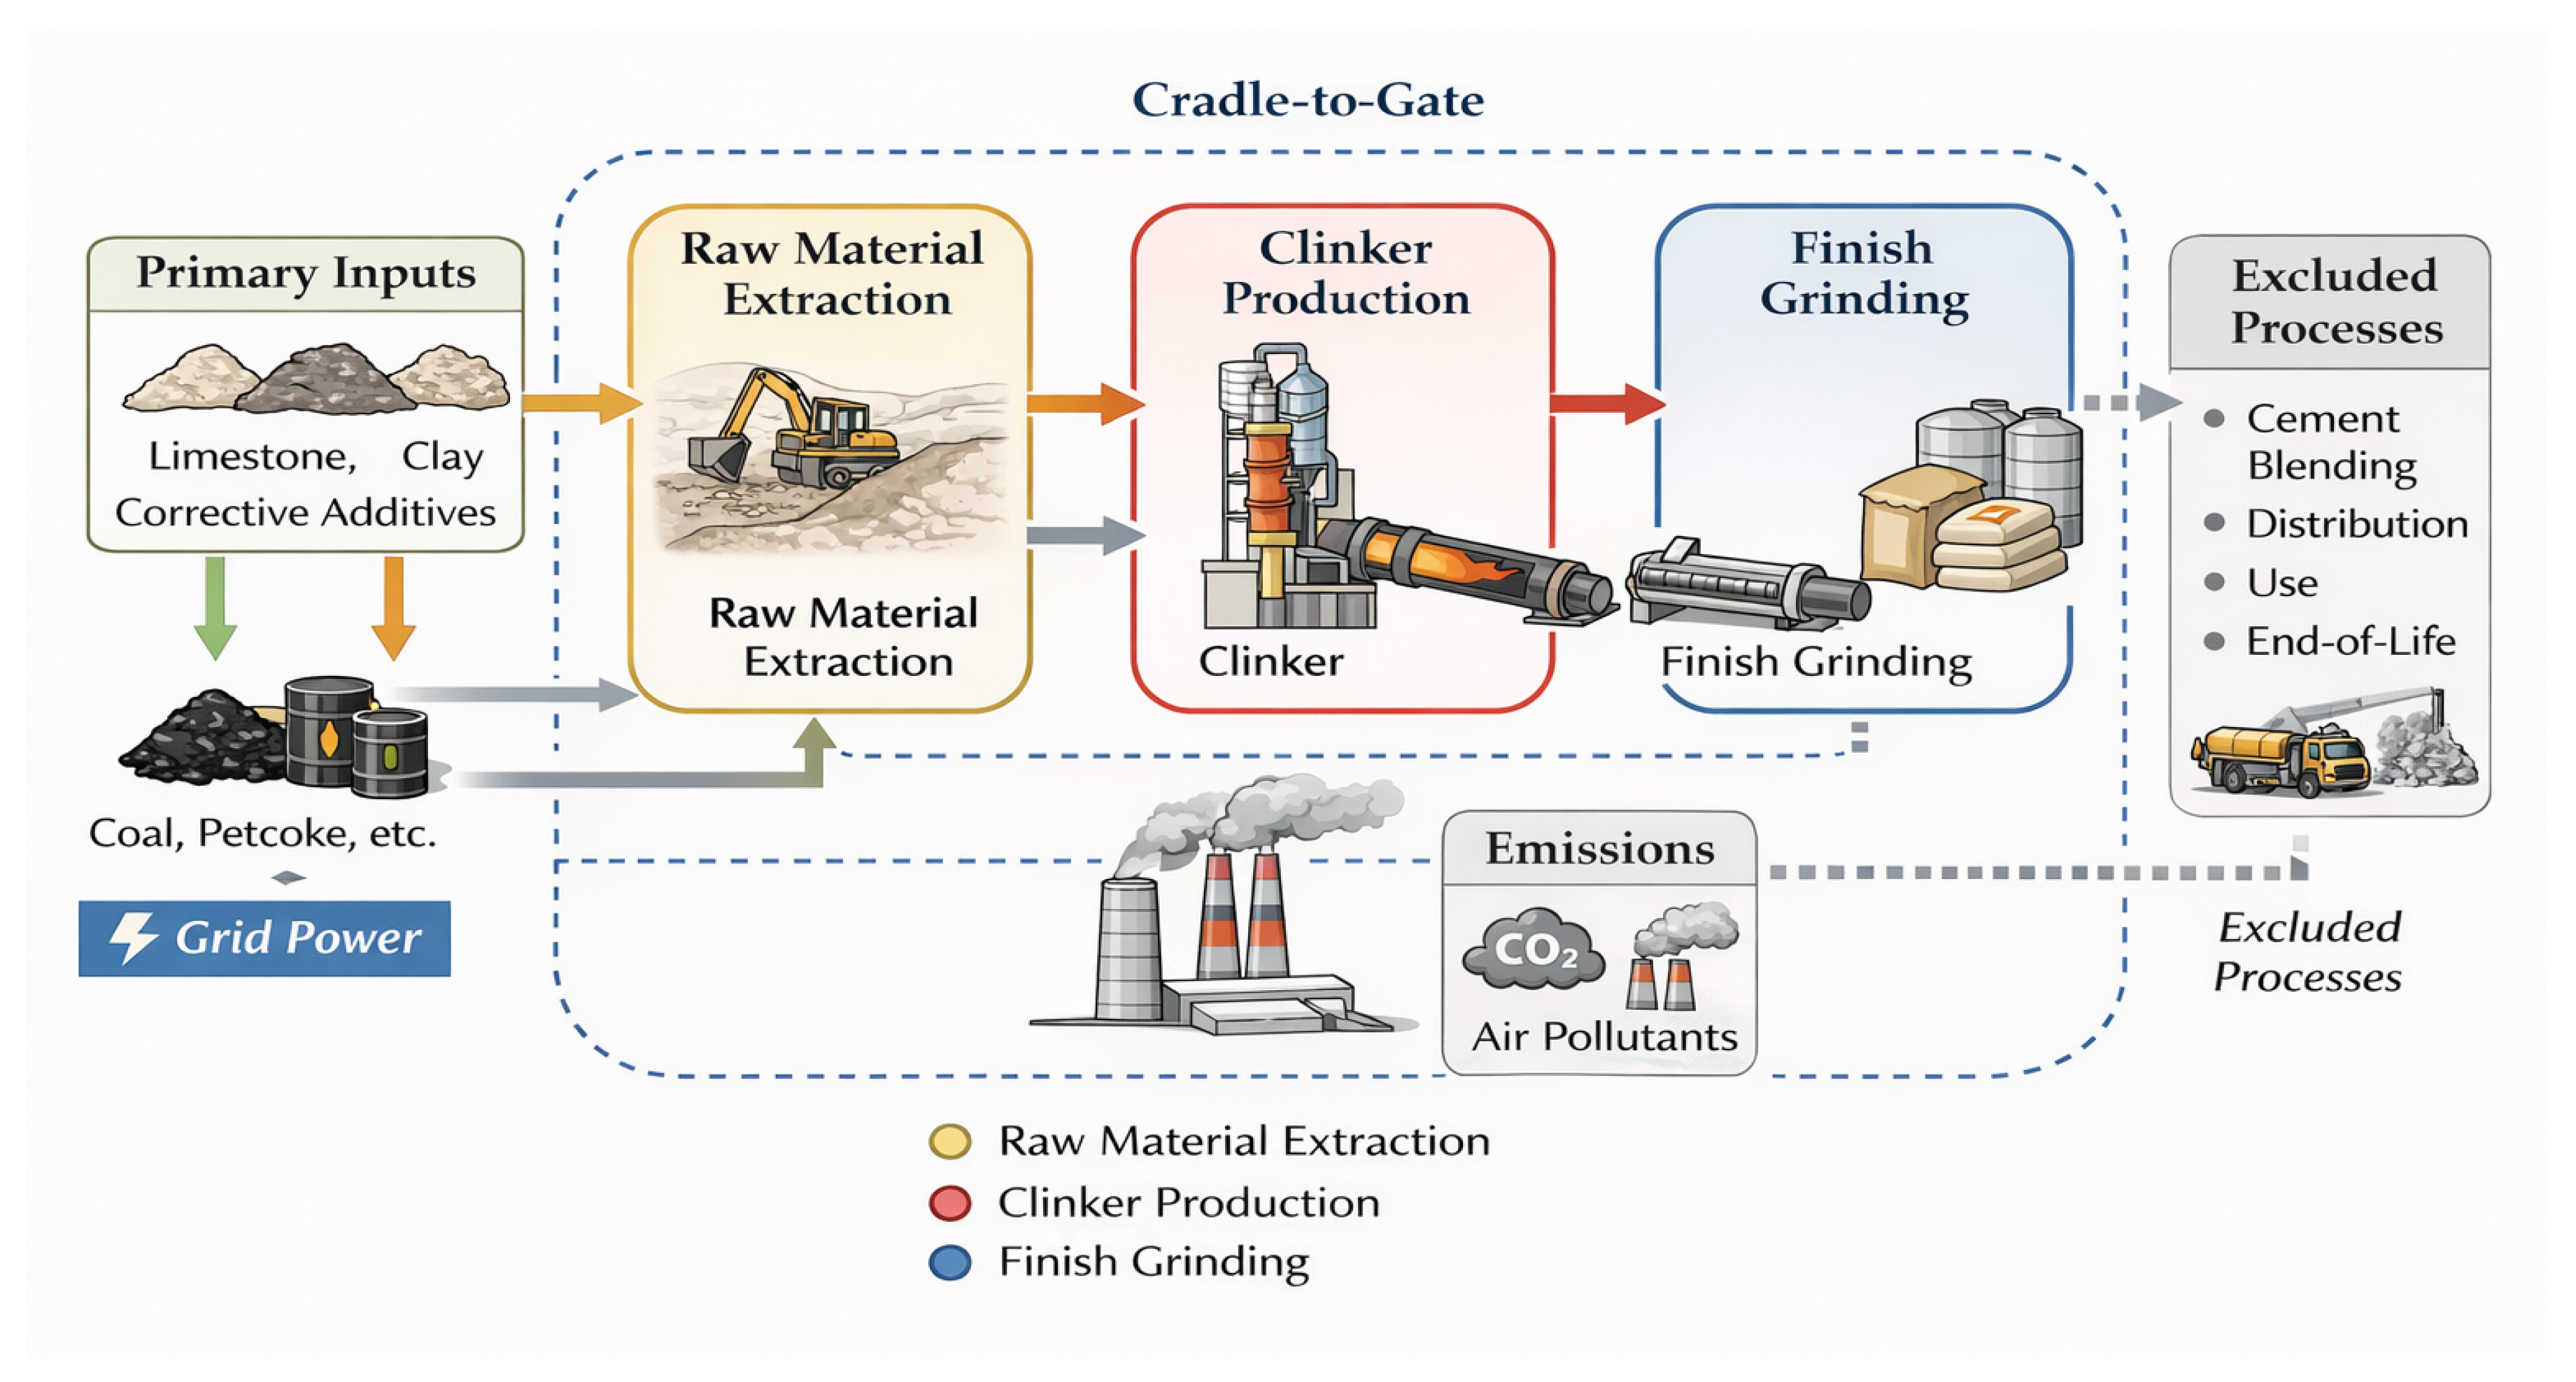
Figure 3.
Comparison of the global warming potential (GWP) of clinker production at the case-study plant and the literature benchmark, expressed per functional unit of 1 t of clinker. The results highlight the relative difference in climate change impact between the two production systems.
Figure 3.
Comparison of the global warming potential (GWP) of clinker production at the case-study plant and the literature benchmark, expressed per functional unit of 1 t of clinker. The results highlight the relative difference in climate change impact between the two production systems.
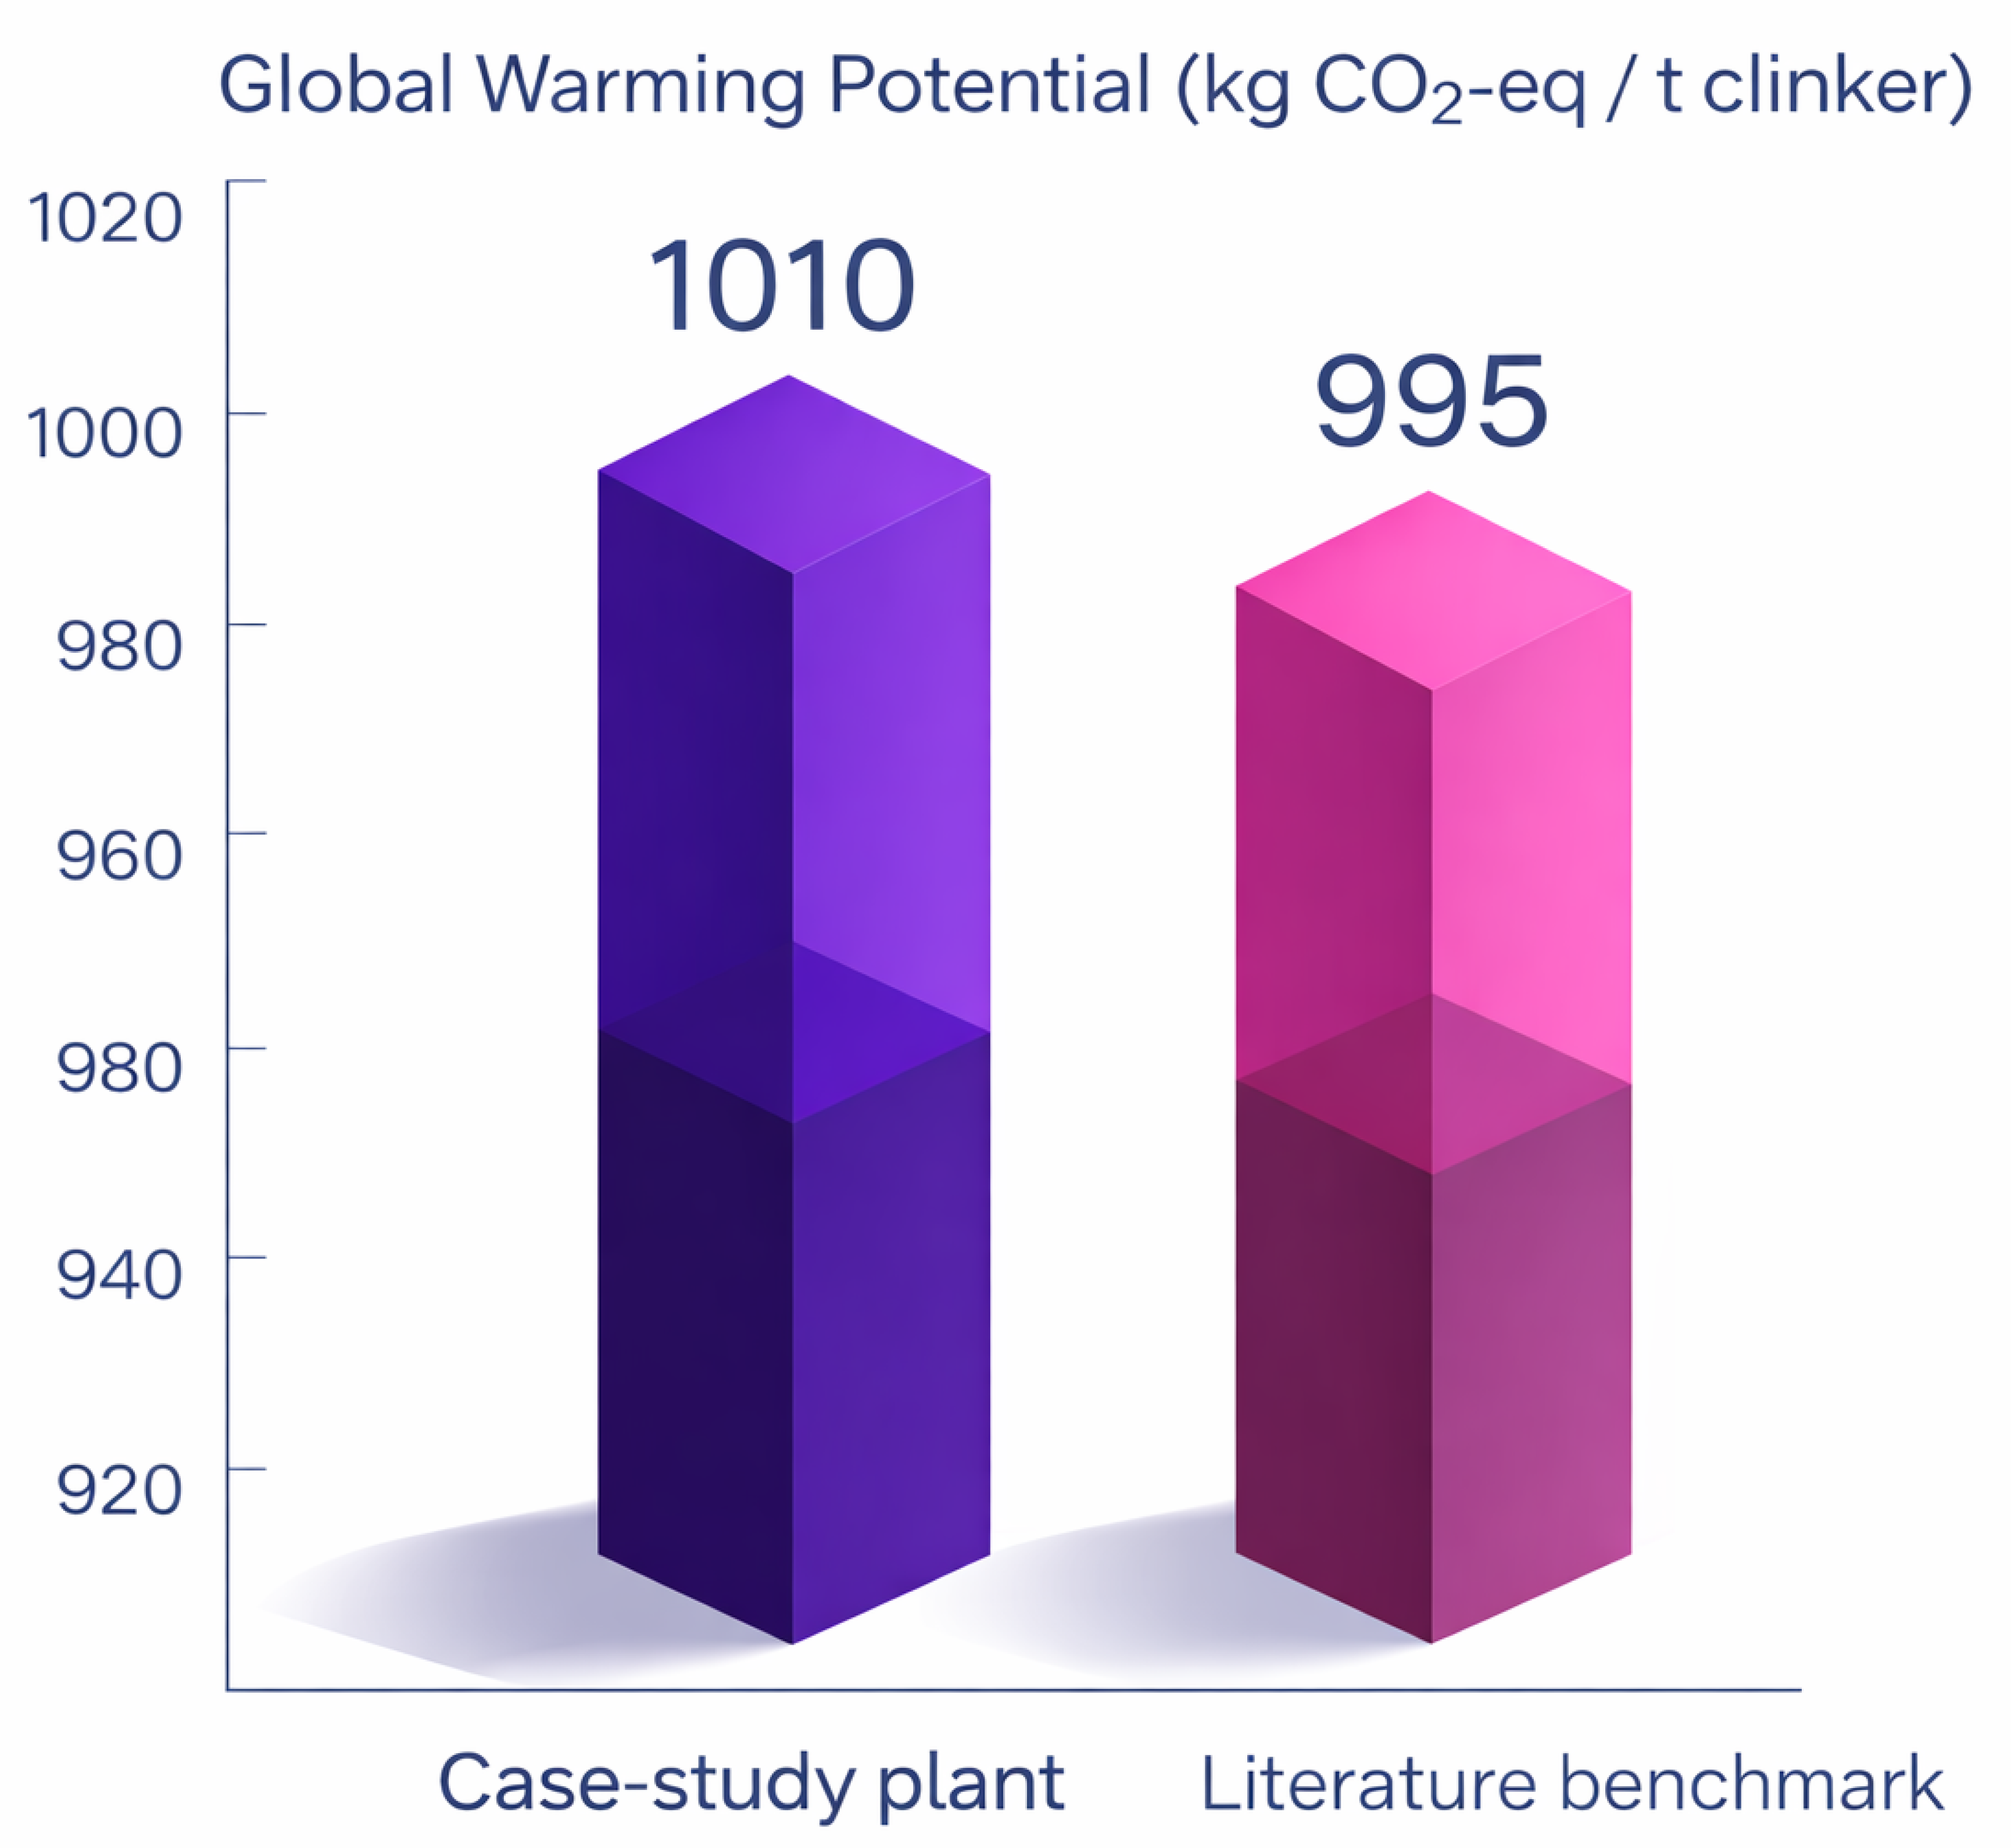
Figure 4.
Contribution of process-related CO2 emissions from calcination and energy-related emissions from fuel combustion to the total global warming potential of clinker production at the case-study plant.
Figure 4.
Contribution of process-related CO2 emissions from calcination and energy-related emissions from fuel combustion to the total global warming potential of clinker production at the case-study plant.
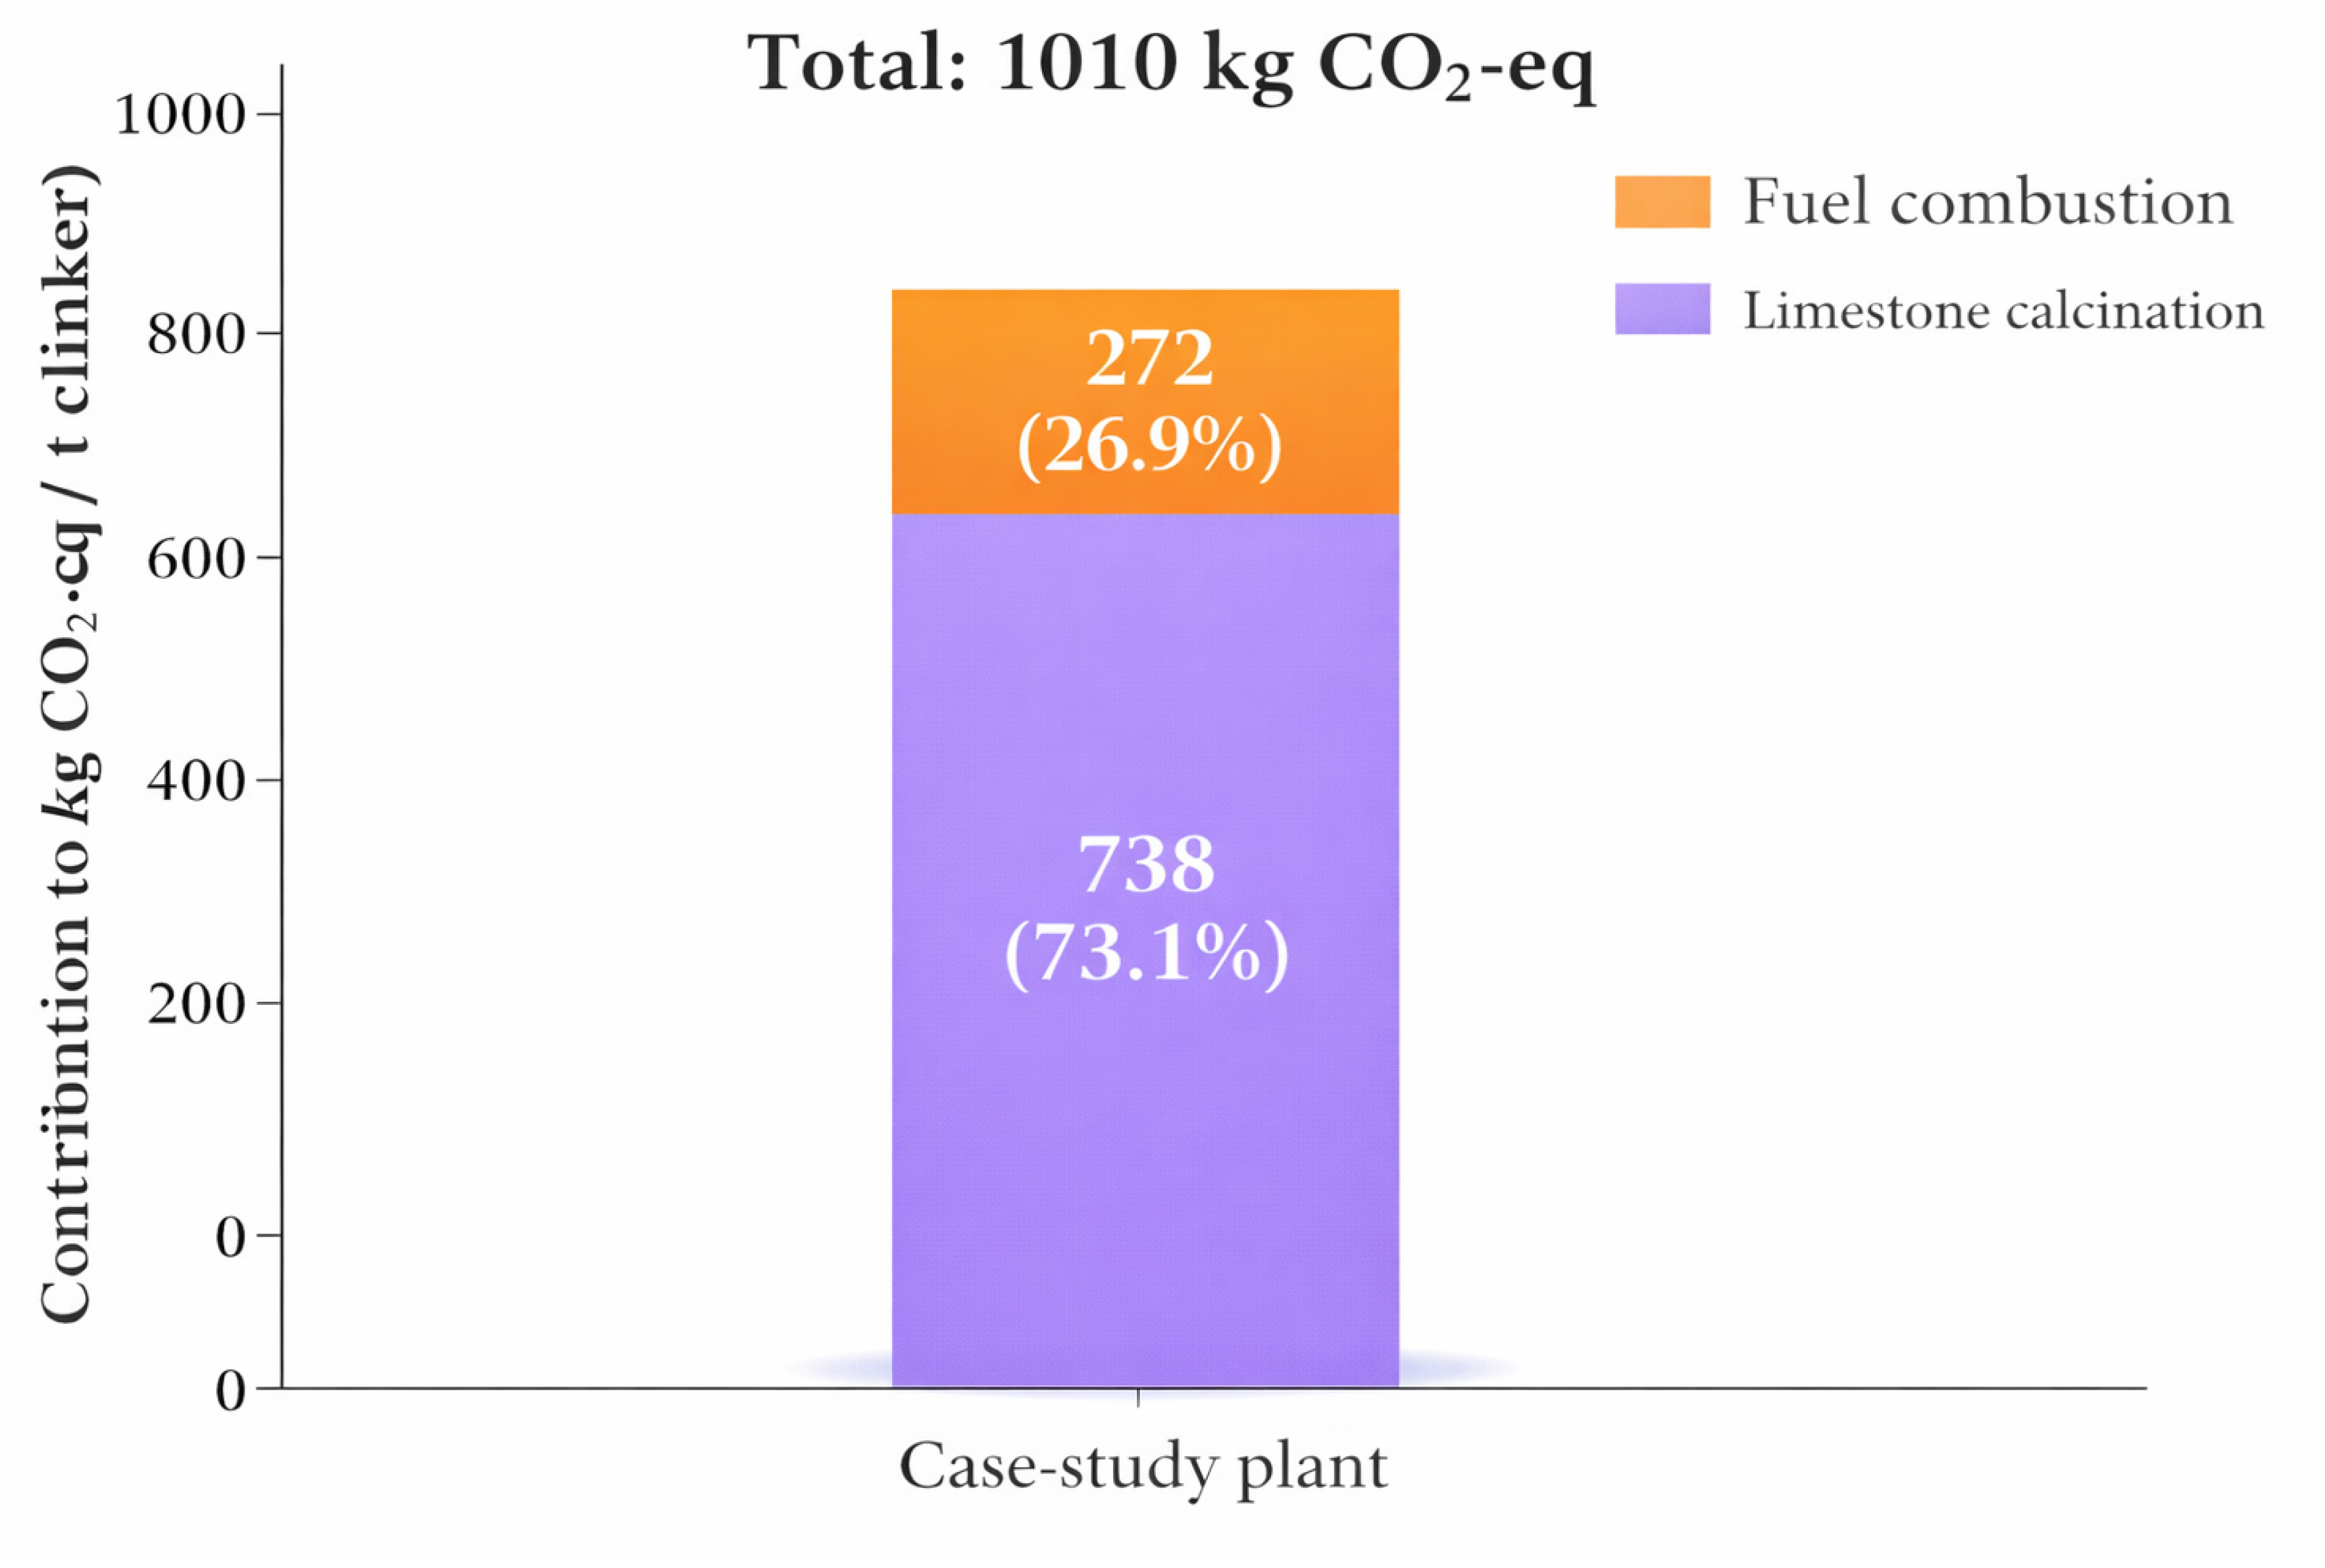
Figure 5.
Benchmarking comparison of key performance indicators for clinker production at the case-study plant and the literature benchmark.
Figure 5.
Benchmarking comparison of key performance indicators for clinker production at the case-study plant and the literature benchmark.
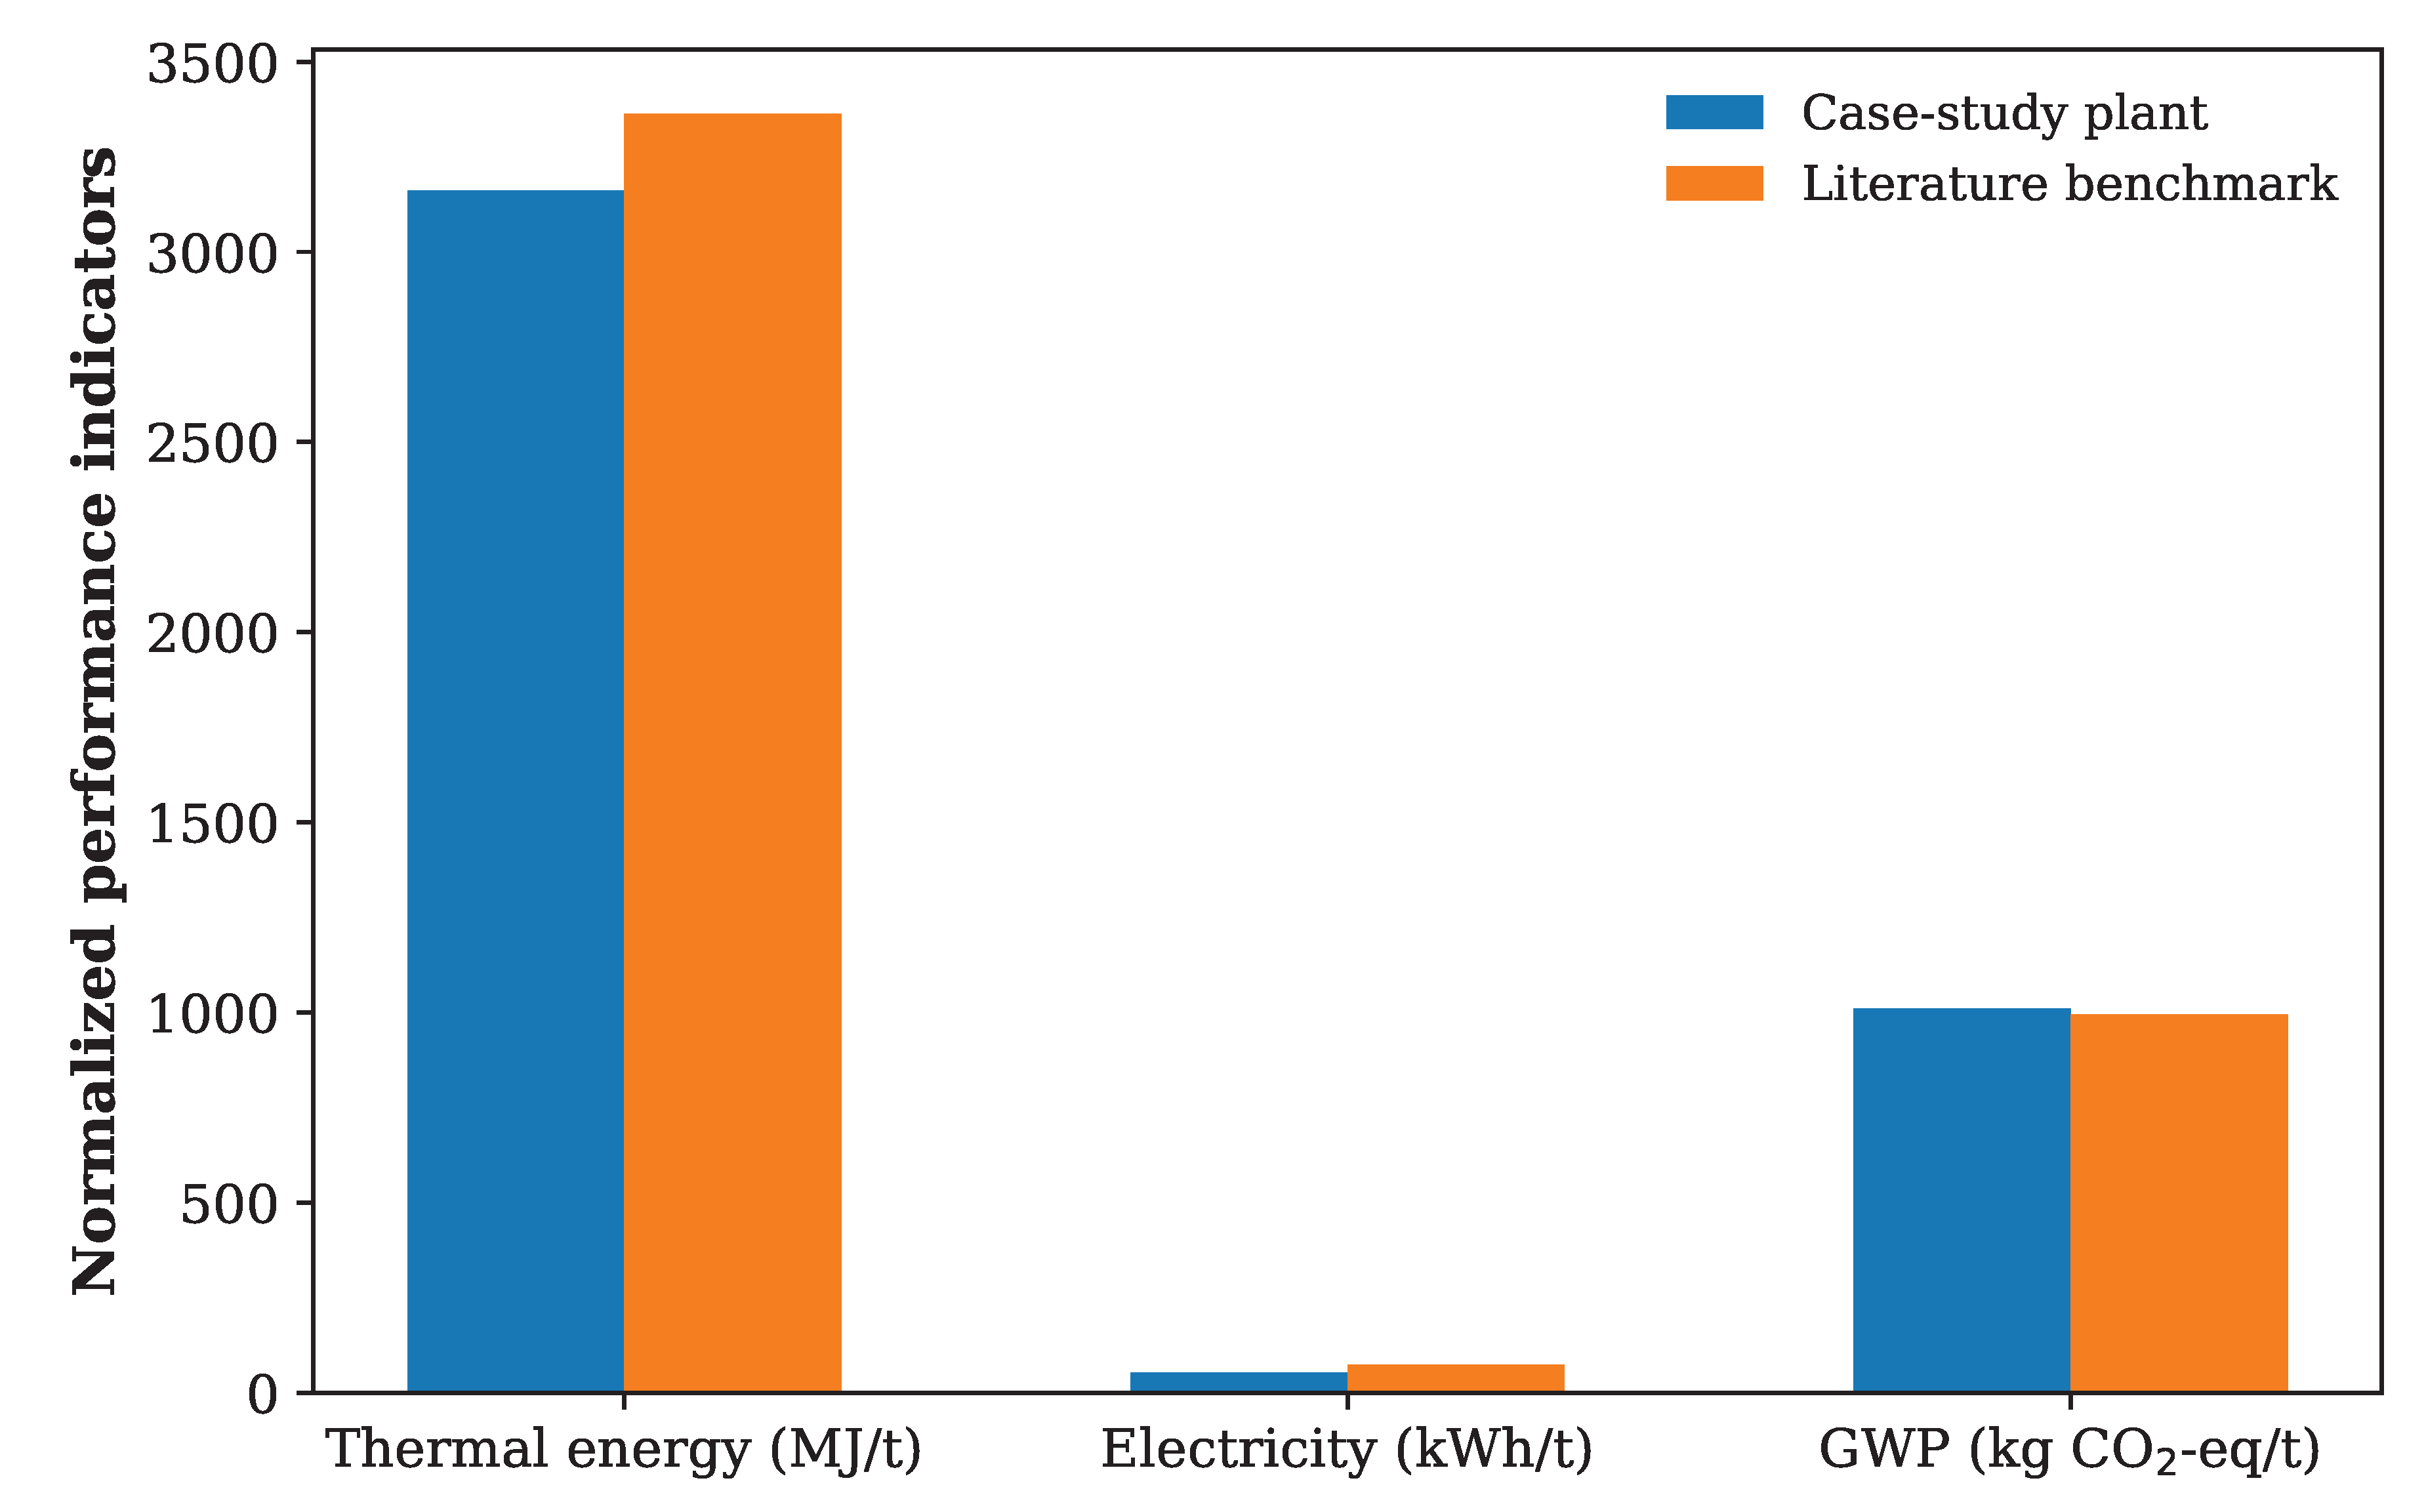

Table 1.
Main characteristics of the case-study cement plant.
| Parameter | Value |
|---|---|
| Plant type | Integrated cement plant |
| Geographical scope | Representative plant (anonymized) |
| Main product | Portland cement clinker |
| Functional unit | 1 t clinker |
| Kiln technology | Rotary kiln with preheater and precalciner |
| Primary thermal energy source | Fossil fuel–based (mixed fuel system) |
| Electricity supply | National grid electricity |
| Clinker-to-cement ratio | (typical OPC range) |
| Data representativeness | Multi-year operational average |
| Data source | DiB cement plant dataset |
Table 2.
Goal, scope, and methodological choices of the life cycle assessment.
| Item | Description |
|---|---|
| Goal of the study | Environmental performance evaluation and benchmarking of clinker production |
| Intended application | Scientific analysis and industrial benchmarking |
| Functional unit | 1 t of Portland cement clinker |
| System boundary | Cradle-to-gate |
| Included processes | Raw material extraction and preparation; raw meal grinding; preheating and calcination; clinker production in the rotary kiln; clinker cooling |
| Excluded processes | Cement blending, packaging, distribution, use, and end-of-life |
| Life cycle impact assessment method | IPCC 100-year GWP (midpoint level) |
| Allocation procedure | No allocation required (single main product) |
| Cut-off criteria | Flows contributing less than 1% of mass, energy, or environmental impact |
| Temporal representativeness | Multi-year average operational data |
| Geographical representativeness | Representative integrated cement plant (anonymized) |
| Technological representativeness | Modern rotary kiln with preheater and precalciner |
| LCA software | openLCA |
| Primary data source | DiB cement plant dataset |
| Benchmark data source | Rhaouti et al. (2024) |
Table 3.
Life cycle inventory of clinker production based on the DiB cement plant dataset reported by Basavaraj [22] (per functional unit of 1 t clinker).
Table 3.
Life cycle inventory of clinker production based on the DiB cement plant dataset reported by Basavaraj [22] (per functional unit of 1 t clinker).
| Inventory flow | Amount | Unit |
|---|---|---|
| Raw material inputs | ||
| Limestone | 1420.00 | kg |
| Corrective materials (flue dust + red mud + laterite + crushed slag) | 125.00 | kg |
| Energy inputs | ||
| Thermal energy (kiln fuels)a | 3162.44 | MJ |
| Electricity consumption (total)b | 52.23 | kWh |
| Direct emissions | ||
| CO2 from calcinationc | 738.40 | kg |
| CO2 from fuel combustiond | 271.63 | kg |
| Total direct CO2 emissions | 1010.03 | kg |
aCalculated as using fuel masses (coal 32 kg, pet coke 60 kg, pharmaceutical solid waste 3 kg, carbon black 3 kg, pharmaceutical liquid waste 2 kg) and calorific contents reported in the DiB dataset.
Table 4.
Literature-based life cycle inventory for clinker production used for benchmarking (adapted from the dataset reported by Rhaouti et al. [23]; per 1 t clinker).
Table 4.
Literature-based life cycle inventory for clinker production used for benchmarking (adapted from the dataset reported by Rhaouti et al. [23]; per 1 t clinker).
| Inventory flow | Amount | Unit |
|---|---|---|
| Raw material inputs | ||
| Limestone, processed | 1410.00 | kg |
| Corrective materials (shale + bauxite + iron ore) | 106.53 | kg |
| Energy inputs | ||
| Petroleum coke | 98.00 | kg |
| Thermal energy (derived from petcoke)e | 3364.34 | MJ |
| Electricity consumption (medium voltage) | 74.00 | kWh |
| Direct emissions | ||
| Carbon dioxide, fossil (total) | 995.00 | kg |
eThermal energy derived using the same petcoke LHV as used for Table 3 (34.33 MJ/kg) to allow consistent energy-intensity benchmarking when only fuel mass is reported.
Disclaimer/Publisher’s Note: The statements, opinions and data contained in all publications are solely those of the individual author(s) and contributor(s) and not of MDPI and/or the editor(s). MDPI and/or the editor(s) disclaim responsibility for any injury to people or property resulting from any ideas, methods, instructions or products referred to in the content. |
© 2026 by the authors. Licensee MDPI, Basel, Switzerland. This article is an open access article distributed under the terms and conditions of the Creative Commons Attribution (CC BY) license (http://creativecommons.org/licenses/by/4.0/).
Copyright: This open access article is published under a Creative Commons CC BY 4.0 license, which permit the free download, distribution, and reuse, provided that the author and preprint are cited in any reuse.


