
Submitted:
05 February 2026
Posted:
09 February 2026
You are already at the latest version
Abstract
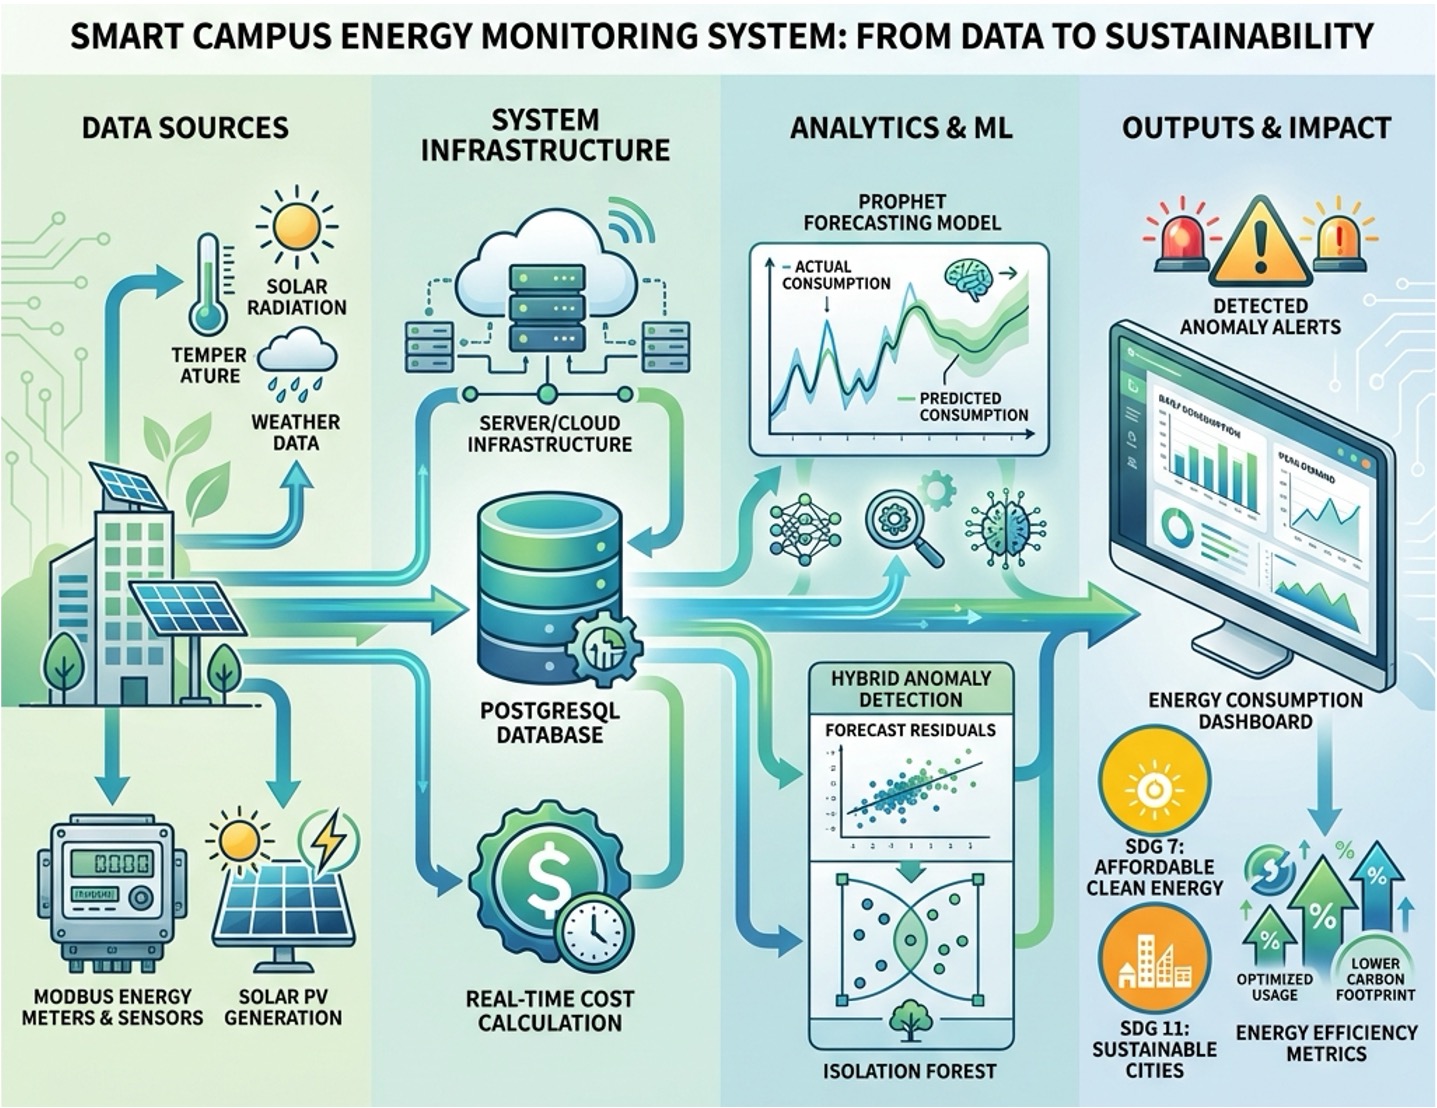
The transition towards sustainable educational campuses requires robust energy management strategies that integrate operational oversight with advanced analytics. This paper presents a campus-scale electricity monitoring system at the University of Algarve, designed to support the institution's sustainability goals through continuous monitoring, data reliability, and scalability. The system consolidates heterogeneous meters into a unified platform, enabling precise tracking of energy consumption and photovoltaic generation. Beyond operational efficiency, the platform incorporates a data-driven analytical layer featuring short-term forecasting using Prophet and a hybrid anomaly detection scheme combining forecast residuals with Isolation Forest. These capabilities facilitate the early identification of waste and abnormal consumption patterns, directly contributing to energy conservation and carbon footprint reduction. Validated across multiple buildings, the system demonstrates high data continuity and effective anomaly detection, reducing the cognitive load on facility managers. By providing a reproducible blueprint for intelligent energy monitoring, this work supports institutions in their pursuit of energy efficiency and sustainable development, aligning operational practices with broader environmental objectives.
Keywords:
energy monitoring
; campus energy management
; time-series forecasting
; anomaly detection
; building management systems
; smart buildings
; energy efficiency
1. Introduction
In an era of climate urgency and necessitating rapid decarbonization, efficient energy management has become a critical priority for large institutions, particularly in higher education [1,2]. Universities, with their vast campuses, diverse building types, and dynamic occupancy patterns, represent a significant challenge and opportunity for energy conservation and sustainability [3]. Effective energy management relies on the foundation of a robust and reliable monitoring system that provides continuous, high-quality data on electricity consumption and local generation, such as from photovoltaic (PV) installations [4]. This data is not only essential for operational awareness and billing verification but also enables advanced analytics for forecasting demand, detecting anomalies [5], and implementing data-driven energy efficiency strategies [6,7].
At the University of Algarve (UAlg), this need motivated the development of a campus-scale system supporting both operational oversight and meaningful sustainability outcomes. The design requirements emphasized data acquisition reliability, storage consolidation, scalability, and compatibility with modern analytical tools, creating a centralized, fault-tolerant platform that provides a complete view of the campus energy profile while supporting data-driven decision-making and sustainability initiatives [8,9]. Such a system reduces operational costs, improves energy efficiency, and enhances sustainability credentials, contributing to the United Nations Sustainable Development Goals (SDGs) [10], such as SDG 7 (Affordable and Clean Energy) or SDG 11 (Sustainable Cities and Communities). By providing reliable, high-quality data, it empowers facility managers to make informed decisions, validates energy-saving initiatives, and serves as a valuable resource for research and teaching.
This article presents the design, implementation, and evaluation of this campus-scale system for monitoring electricity consumption and photovoltaic generation at UAlg. The contribution is threefold. First, (i) a unified data acquisition pipeline integrates heterogeneous meters through a fault-tolerant process. Second, (ii) secure, centrally managed infrastructure consolidates data into a relational database with cost computation aligned with the national four-period time-of-use tariff. Third, (iii) a lightweight analytical layer combines Prophet-based forecasting with a hybrid anomaly detection scheme that intersects forecast residuals with Isolation Forest, reducing false positives and focusing operator attention on meaningful events. The system has been successfully deployed across multiple buildings, transforming raw energy data into actionable insights.
The remainder of this paper is organized as follows. Section 2 reviews related work in energy monitoring systems. Section 3 describes the system architecture and analytical layer. Section 4 presents the operational results and validates the forecasting and anomaly detection models. Finally, Section 5 summarizes the key findings and contributions, discusses limitations, and outlines directions for future work.
2. Related Work
Energy monitoring systems have become essential tools for managing electricity consumption and generation in institutional buildings, supporting both operational efficiency and strategic decision-making. These systems enable facility managers to track energy usage patterns, identify inefficiencies, validate cost allocations, and implement data-driven conservation strategies. The architecture of such systems typically follows a layered design that separates concerns across three fundamental tiers: (i) data acquisition at the field level, (ii) transport and pre-processing in the network layer, and (iii) storage and visualisation at the platform level [3,11]. This modular separation enables scalability, interoperability, and maintainability by decoupling field data collection from network communication and decision-oriented analytics, ensuring that evolution in one layer does not compromise the overall system integrity. In practice, Energy Management Systems (EMS) architectures focused on optimisation and planning often coexist with Supervisory Control and Data Acquisition (SCADA) systems designed for real-time supervision and control, and both paradigms are frequently integrated to combine operational diagnostics with reporting and trend analysis [3].
At the data acquisition layer, the selection of appropriate metering devices and communication protocols is critical for reliable and cost-effective deployment. Current practice combines panel-mounted energy analysers, advanced smart meters, and low-cost modules for distributed monitoring [11,12]. Selection criteria typically include installation type (single-phase or three-phase), available electrical quantities, maximum measurable power, and supported communication protocols, with integration simplicity being a key priority. The primary electrical variables of interest include active and reactive power, per-phase voltage and current, and frequency. Active power is fundamental for cost calculations and energy balances, while voltage and current measurements reveal power quality issues. From these base measurements, derived indicators such as apparent power, power factor, and imbalance indices can be computed when needed [13].
Regarding data communication, established industrial protocols continue to dominate the field. Modbus, available in both Remote Terminal Unit (RTU) over RS-485 and Transmission Control Protocol (TCP) over Ethernet variants, remains the de facto standard due to its master–slave simplicity, low integration cost, and widespread availability in industrial metering equipment [14]. At the application layer, the system employs Representational State Transfer (REST) APIs over Hypertext Transfer Protocol (HTTP). By exchanging JavaScript Object Notation (JSON) messages, these interfaces ensure loose coupling and direct integration with web services, facilitating interoperability with diverse software stacks [15,16,17]. For distributed scenarios with intermittent network links or edge deployments, Message Queuing Telemetry Transport (MQTT) offers a publish–subscribe model with a broker and configurable quality-of-service levels, providing efficiency and resilience. MQTT is common in edge gateways that buffer and forward measurements, ensuring data continuity even during network disruptions [18,19].
At the platform level, operational solutions that ingest and store time-series data are complemented by visualisation layers focused on data presentation and exploration. Locally deployable platforms such as EmonCMS [20] and Home Assistant [21] accept HTTP or MQTT inputs, organise data into time series, and provide built-in dashboarding capabilities, offering full control over infrastructure and data while requiring local deployment and maintenance. In contrast, cloud-based platforms such as ThingSpeak [22] and Arduino Internet of Things Cloud [23] offer application programming interface ingestion with built-in visualisation, trading control over infrastructure and data for operational simplicity and reduced maintenance overhead. Grafana [24] acts as an independent visualisation layer, connecting to external databases (e.g., PostgreSQL, InfluxDB) and enabling interactive exploration, complex querying, and alerting, making it particularly suitable for analytical dashboards and operational monitoring.
For data storage, the choice of repository architecture must balance read cadence, data volume, historical horizon, and query latency while maintaining operational simplicity. Specialized non-relational (NoSQL) time-series databases are frequently adopted for high-frequency sensor deployments, as they offer optimized write throughput, efficient compression, and flexible schemas suited to massive telemetry streams. However, in institutional settings where data integrity and integration with administrative records are paramount, a relational database engine such as PostgreSQL provides distinct advantages. It supports data consolidation, long-term historical storage, efficient time-indexed queries, retention policies with downsampling, and crucially, joins with asset metadata and tariff tables [25]. This dual-storage approach—pairing lightweight collection buffers with robust analytical relational stores—enables operational platforms to handle high-frequency ingestion while supporting deeper investigations and machine learning workflows.
On the infrastructure side, Linux-based operating systems provide a mature ecosystem for monitoring services, offering stability, comprehensive package management, task automation through cron, and secure integration with web services and databases. These features streamline system updates, backups, and maintenance operations, making Linux a natural choice for institutional deployments where reliability and long-term support are paramount.
Energy cost calculation represents a critical analytical component that maps consumption to financial impact. Globally, and particularly within the European Union, the regulatory landscape is shifting towards dynamic tariffs defined by the Clean Energy Package, which mandates that final customers be entitled to dynamic electricity price contracts [26]. These mechanisms, including Real-Time Pricing (RTP) and Critical Peak Pricing (CPP), reflect wholesale market fluctuations and are essential for incentivizing Demand Side Management (DSM) and integrating variable renewable energy sources [27]. Despite these advancements, many institutional consumers continue to operate under static or Time-of-Use (ToU) contracts that offer greater budgetary predictability but limited flexibility incentives. In the Portuguese context, the Energy Services Regulatory Authority (ERSE) provides the official tariff schedules, which define four distinct pricing periods that vary by day type (weekday, weekend) and season (summer, winter), with prices potentially changing at fifteen-minute boundaries [28]. Accurate cost computation enables financial analysis, budget validation, and cost allocation across different buildings or departments.
To support operational planning and proactive cost control, machine learning techniques have been increasingly adopted for consumption forecasting and anomaly detection. Recent literature highlights the efficacy of deep learning models, such as Long Short-Term Memory (LSTM) networks and Transformers, as well as gradient boosting algorithms like XGBoost, which often achieve state-of-the-art accuracy in capturing complex non-linear patterns [29,30]. Hybrid frameworks combining these approaches have also demonstrated superior performance in short-term load forecasting [31]. However, in operational campus settings where interpretability, computational efficiency, and robustness to missing data are paramount, Prophet remains a compelling choice. It effectively handles multiple seasonality patterns (daily, weekly, annual) and calendar effects without requiring the extensive data engineering or hardware acceleration often needed for deep neural networks [32,33]. These characteristics make it particularly well-suited for building-level energy forecasting where occupancy patterns and calendar events are dominant drivers of consumption.
For anomaly detection, unsupervised learning methods are predominant in building energy management due to the scarcity of labeled anomaly data. Recent literature explores deep learning approaches, such as Autoencoders, which learn complex latent representations to identify reconstruction errors [34], as well as density-based algorithms like Local Outlier Factor (LOF) [35] and DBSCAN [36], which are effective at detecting local outliers and irregular clusters. While these methods offer powerful detection capabilities, they often require careful hyperparameter tuning or computationally intensive training. In this work, forecast residuals provide a primary mechanism to flag persistent deviations between observed and expected load patterns [37]. To mitigate false positives from model drift or transient errors, we employ a hybrid approach by intersecting these residual-based flags with an independent Isolation Forest detector [38]. Isolation Forest is many times selected for its computational efficiency with high-dimensional data and its explicit isolation mechanism, which effectively separates anomalies without relying on complex distance computations.
In summary, while robust solutions exist for individual layers of the energy management stack—from data acquisition to predictive analytics—there remains a critical need for integrated, open-source frameworks tailored to institutional contexts. Most existing commercial solutions operate as closed ecosystems, limiting interoperability and customization, whereas many academic implementations often lack the resilience required for continuous facility management. The proposed system addresses this gap by orchestrating these best-of-breed technologies (Modbus/MQTT, PostgreSQL, Prophet, Isolation Forest) into a cohesive, cost-effective platform capable of delivering actionable sustainability insights.
3. Methodology
This section describes the design and implementation of the energy monitoring system at the University of Algarve. The system architecture is first presented, followed by the analytical layer that extends the platform with machine learning capabilities for forecasting and anomaly detection.
3.1. System Architecture
The system was designed for continuous operation, collecting one-minute electrical measurements from heterogeneous meters, computing costs according to the national time-of-use tariff, and making data available through both an operational platform (EmonCMS) for real-time dashboards and a PostgreSQL database for analytical purposes. The design prioritizes data acquisition reliability, scalability, and maintenance efficiency through unified components.
Topologically, the system comprises three tiers. At the field level, meters communicating via Modbus RTU are aggregated by gateways exposing Modbus TCP. Photovoltaic generation data is retrieved via REST APIs from the SolarLog system [39]. The middle tier polls these sources, consolidates readings in PostgreSQL, and forwards records to EmonCMS. The top tier ingests data via REST and serves operational dashboards. This layered structure provides logical separation with consistent error handling to ensure resilience, as shown in Figure 1.
The architecture features a single acquisition process with dedicated reading functions for each meter type, running sequentially to complete each sweep within the one-minute target window. Before reading each device, the script performs a reachability test with a three-second timeout. If a device fails to respond, the process skips to the next meter and records a gap, ensuring that one failure does not block the entire cycle. Bounded retries and structured error handling protect against cascading failures, enabling the system to scale without compromising acquisition cadence.
Configuration is centralized, and measurement point naming follows a hierarchical convention (campus, building, department) that reduces ambiguity and enables reliable aggregations. Units and scale factors are standardized across all sources to ensure comparability.
The cost calculation method models each day as ninety-six fifteen-minute slots, matching the national four-period time-of-use tariff structure. Separate cost tables exist for weekdays, weekends, summer, and winter. Each slot stores a period code (1–4) mapping to the corresponding Euro/kWh rate. At runtime, the system selects the appropriate table based on local calendar, derives the current slot from hour and minute components, and computes the minute-level cost from measured active power. A scheduled task resets the monthly accumulator on the first day of each month, with a guard mechanism to prevent double counting. Timestamps are handled consistently in local time, avoiding ambiguity during daylight-saving transitions.
The infrastructure is deployed on virtual machines hosted on the institution’s managed servers, with access restricted to the internal network. A comprehensive backup policy with weekly snapshots and four rotating retention cycles ensures recoverability. All system components use supported versions to ensure security compliance, maintainability, and compatibility with modern tooling. The architecture incorporates redundancy through a mirrored configuration on a second server. Each instance operates independently with its own acquisition process, EmonCMS platform, and PostgreSQL database. If one instance fails, the other continues without interruption. When service is restored, data reconciliation uses EmonCMS synchronisation capabilities [20], preserving historical continuity. Both instances have coordinated weekly backups and software updates, strengthening system resilience.
3.2. Analytical Layer and Machine Learning
The analytical layer extends the system beyond operational monitoring into predictive analytics and automated anomaly detection, enabling proactive energy management by providing short-term consumption forecasts and identifying unusual consumption patterns that may indicate equipment malfunctions, operational inefficiencies, or unexpected usage.
A Grafana dashboard connected to the PostgreSQL database integrates instantaneous electrical variables, cost indicators, and model outputs in a unified view, allowing operators to inspect load profiles, energy costs, and model behaviour simultaneously. Training and inference routines are scheduled via cron tasks that execute a Python pipeline to pre-process time series, train the forecasting model, generate predictions, and compute anomaly scores.
3.2.1. Consumption Forecasting
Forecasting was initially implemented in a pilot building to validate the model design and assess its effectiveness before broader deployment. Building 1 at the Gambelas campus was selected as the pilot because it offers a six-year historical window spanning from 27 May 2019 to 25 September 2025, with at least 91% valid records after quality checks and a stable load profile that supports reliable training and evaluation. Prior to analysis, historical data consolidation was performed to reconcile records from multiple sources into a unified PostgreSQL schema. This step was crucial because the newly deployed acquisition system alone lacks the long-term historical depth—covering multiple seasons, academic calendars, and holidays—required to train robust forecasting models. During this process, duplicate timestamps were eliminated, and coverage gaps were explicitly preserved without interpolation to maintain the integrity of the ground truth data.
For this part of the study and development, the target variable is active power measured in kilowatts, with a 24-hour forecasting horizon that aligns with operational planning needs. Data pre-processing was performed to build UTC-consistent training sets through sorting, duplicate removal, and controlled gap handling, ensuring that complete annual cycles are available for training and validation, which is essential for capturing seasonal patterns.
To enhance forecasting accuracy, exogenous weather variables were integrated as regressors. Historical weather indicators from a local weather station were available from the system’s inception, but to ensure continuous availability over the forecasting horizon, weather forecasts began to be obtained through the public Open-Meteo API [40], which provides forecasts with a maximum cadence of fifteen minutes. For computational efficiency and alignment with the forecast resolution, both active power and historical weather variables were resampled to fifteen-minute intervals using the average aggregation method. The selected regressors include global solar radiation (W/m2), air temperature (°C), relative humidity (%), and a binary precipitation indicator (0/1). All sources were normalised to ensure comparable scales and merged into a single dataset with standard Prophet columns ds (timestamp) and y (target variable), with exogenous variables aligned to the same timestamps, as illustrated in Table 1.
The Prophet model was configured with a linear trend component, daily and weekly seasonality, the weather regressors as covariates, and academic calendar features that enable the algorithm to learn campus occupancy patterns such as semester schedules, holidays, and exam periods. Hyperparameter tuning followed a two-phase process using rolling-origin temporal validation with Bayesian optimisation implemented through the Mango library [41], as illustrated in Figure 2. In the first phase, sixteen hyperparameter combinations were explored across thirty-three cutoffs spaced sixty days apart over the full historical series. At each cutoff, the model was trained on all available history up to the cut date and used to forecast the next 24 hours, with metrics recorded for each combination. The last twenty-four hours of the series were reserved as a final independent test set. For the final configuration reported in this paper, the model was retrained on all observations from 27 May 2019 up to 24 September 2025 23:45, and the independent holdout window corresponds to 25 September 2025 00:00–23:45.
In the second phase, the search expanded to approximately two hundred additional configurations derived from the best first-phase candidates, using four representative cutoffs distributed across the series to accelerate execution while maintaining temporal diversity. In this phase, the training history was limited to approximately three hundred and sixty-five days for the earliest cutoff and increased progressively for the remaining three cutoffs, always producing a 24-hour forecast after each cut, as depicted in Figure 3. This controlled training window approach balances model complexity with computational efficiency while ensuring that recent patterns receive appropriate weight.
For ranking configurations during Bayesian optimisation, a composite score was developed that combines deterministic and probabilistic criteria, with a nominal coverage target of 90%. The optimiser requires a single scalar objective, so multiple metrics were aggregated into a unified score. The deterministic component comprises Mean Absolute Error (MAE) and Root Mean Squared Error (RMSE), which quantify point forecast accuracy. The probabilistic component comprises prediction interval coverage and interval sharpness, which assess the quality of uncertainty quantification. MAE was given the highest weight because it is the primary metric for operational decisions and is less sensitive to outliers than RMSE. The remaining terms were scaled to similar magnitudes to ensure balanced influence. This design follows the principle of maximising sharpness subject to calibration, meaning that prediction intervals become narrower only when coverage remains close to the target. The composite score is defined as
where , , , and were set empirically to balance the importance of each term. Additional metrics including Weighted Absolute Percentage Error (WAPE) and quantile pinball loss were computed for completeness but were not included in the optimisation score.
After optimisation, the top configuration was re-evaluated across all thirty-three cutoffs to obtain a stable estimate of performance over the entire historical period. To reduce bias from intermediate averaging, all validation observations and forecasts were pooled into a single set, and aggregate metrics were computed directly on this pooled dataset rather than averaging metrics computed separately for each cutoff. Finally, the model was trained on all available history except the reserved 24-hour window, and the same metrics were assessed on that unseen holdout to confirm generalisation capability.
The resulting forecasting pipeline with the selected hyperparameters runs daily under cron, writes fifteen-minute forecasts to the relational database, and publishes them to the operational platform for integration into dashboards.
Section 4 presents the results of the forecasting model and the integration into the operational platform.
3.2.2. Anomaly Detection
Anomaly detection leverages the forecasting model to identify deviations between observed and expected consumption patterns. The approach combines a residual-based persistence rule with an independent Isolation Forest detector, requiring agreement between both methods to reduce false positives while maintaining interpretability for building operators.
The detection process begins by computing the deviation between the measured load and the forecast on the 15-minute active power series. This raw residual is then normalised to make it comparable over time through a sliding window that summarises recent behaviour. Instead of using the mean and standard deviation, which react strongly to spikes and outliers, robust statistical measures are adopted: the median as the typical level and the Median Absolute Deviation (MAD) as the scale [42]. The median remains stable in the presence of extreme values, and MAD quantifies variability around that median without being influenced by outliers and without assuming any specific distribution. With this normalisation, the error indicator becomes stable and adaptive, following slow changes in the building profile while highlighting only deviations that persist relative to the recent pattern.
In this implementation, the sliding window spans forty-eight fifteen-minute samples (approximately twelve hours), which is long enough to yield stable median and MAD estimates yet short enough to track intraday drift. This design ensures that the residual indicator ignores short-term fluctuations but reacts to sustained changes in consumption patterns. The threshold is the 99.5th percentile of recent residuals, corresponding to a 0.5% tail per sample, which adapts to local variability and, together with the persistence rule, keeps false positives rare while remaining sensitive to sustained departures from expected behaviour.
A second independent detector applies an Isolation Forest algorithm to features computed directly from the observed load, capturing level, recent change, local variability and calendar context (the hour of day and the day of week). The Isolation Forest assigns an isolation score and a pointwise label to each timestamp, flagging outliers according to a learned notion of normal behaviour derived from historical patterns.
An event is marked as anomalous only when the two detectors agree, that is, when a point lies in a persistent residual segment and is also classified as an Isolation Forest outlier. This intersection strategy significantly reduces false positives while preserving interpretability for building operators, as alarms represent clear and consistent deviations from expected patterns. In the implementation, these alarms are represented as discrete points on the 15-minute series.
The Isolation Forest was trained on the historical window of the 15-minute active power series. This training window ensures that the model reflects the current operating regime and measurement configuration. The model learns the boundary of normal behaviour directly from the signal and the calendar descriptors without imposing a parametric form on the load profile, making it adaptable to diverse consumption patterns. The configuration used 200 trees to stabilise isolation scores, automatic subsampling per tree, default feature selection, and a contamination level of one percent, aligned with the expected low incidence of anomalies in normal operation. In production, each new point is standardised using the same scaler employed during training, passed through the trained Isolation Forest, and flagged as anomalous whenever the model prediction is , using the internal threshold implied by the chosen contamination level.
These parameter choices were adopted for the case study reported here, but in practice the window length, threshold quantiles, persistence requirement, and contamination level should be calibrated for each building and monitoring objective, balancing sensitivity to relevant events against the rate of false alarms. The calibration process should consider the operational context, the cost of false positives versus missed detections, and the specific characteristics of each building’s consumption profile.
4. Results
This section summarizes the outcomes of the energy-monitoring infrastructure, the deployment of operational visualizations, and the validation of both forecasting and anomaly-detection models. The analysis reports on the architecture’s service continuity and data-acquisition reliability, presents quantitative performance metrics for the forecasting model, illustrates its integration within operational dashboards, and evaluates the efficacy of the anomaly-detection layer alongside the system’s integrity safeguards.
4.1. Architectural Stability and Acquisition Reliability
The deployed system demonstrates operational stability across multiple buildings. The unified Python codebase provides reliable acquisition, and the mirrored infrastructure ensures continuity if one instance fails. A periodic supervisory mechanism scheduled via cron detects network unavailability and stagnation in table writes, producing diagnostic records and leading to fewer pipeline interruptions and more complete time series.
The cost computation module operates continuously, providing both instantaneous and monthly accumulated costs aligned with the four-period tariff. In the operational visualizations, presenting these costs together makes the financial impact per building explicit and supports daily validation. In practice, alignment between the accumulated value and the sum of the measurements was observed, with minimal need for manual corrections.
4.2. Consumption Forecasting
The Bayesian search for the best hyperparameters of the Prophet model yielded the selected configuration, whose values are shown in Table 2. This configuration was evaluated using time-based validation with four cutoffs distributed along the series and achieved the lowest aggregate errors and the best score (see Equation (1)), as reported in row 4 Cutoffs (Validation) of Table 3. The Score results from the aggregation of the remaining metrics and was therefore used as the ranking criterion for the configurations.
To evaluate generalization, the same hyperparameter configuration was applied across the 33 cutoffs generated along the series, and the aggregate performance on the pooled validation set is reported also in Table 3 (row 33 Cutoffs (Aggregated)). The expected degradation was observed as temporal diversity increased. MAE, RMSE, and WAPE increased and coverage decreased, yet the values remained within acceptable ranges for operational use.
In the 24-hour holdout reserved for testing, the observed and predicted series showed visual alignment and metrics consistent with the earlier phases, as summarized in Table 3 (row 24h Holdout (Test)). Coverage remained close to the defined target and the width of the prediction intervals remained controlled.
To complement the single-day holdout analysis, the same fixed configuration was applied to an extended set of unseen days in October 2025. The model generated one-day-ahead trajectories with 15-minute resolution for each of the thirty-one days, and the mean performance across these daily horizons is reported in Table 3 (row October 2025 (Backtest)). Compared with the single-day holdout, the mean MAE and RMSE over October are lower, while WAPE remains of the same magnitude. The composite score also decreases, which indicates a slight overall improvement when the model is applied to this extended unseen period. The higher average coverage, together with almost unchanged interval width (Sharpness), shows that the predictive intervals become slightly conservative while remaining well calibrated.
In summary, the selected configuration demonstrated consistency across all evaluation scenarios. The four-cutoff validation achieved coverage close to 95% with the lowest errors. The 33-cutoff evaluation showed expected degradation as temporal diversity increased, yet remained within acceptable operational ranges. The 24-hour holdout maintained coverage near 95% with stable errors, confirming generalization capability. The October backtest over thirty-one unseen days showed similar or slightly improved performance, with daily composite scores ranging from 5.61 to 10.23, reinforcing confidence in operational deployment.
University of theaccuracy degrades over the 24-hour horizon, the reserved test period was used to analyze the metrics by forecast step. Figure 4 shows the evolution of MAE and RMSE in the holdout and does not indicate major degradation across the horizon. Only recurring low-amplitude oscillations are visible, with no consistent hourly pattern, which supports the inclusion of this plot as a visual validation of stability.
Operationally, the model integrates into the existing pipeline and runs daily, generating the forecast for the next 24 hours. The predicted series are stored in the database and published to EmonCMS. Figure 5 shows the operational view with observed consumption, forecast, and prediction intervals, which enables daily validation and immediate identification of deviations.
4.3. Anomaly Detection
This subsection evaluates the anomaly detection scheme over a multi-week period from early September to late October 2025 for the case-study building. Figure 6 summarizes the behavior of the robust residual layer over this interval. The upper panel shows the 15-minute active power series and the corresponding forecast, while the grey shaded regions mark the intervals in which the residual score exceeds the robust threshold for at least two consecutive samples. The lower figure depicts the score S together with the symmetric threshold and the individual exceedances. Over the evaluation period the residual rule identifies persistent events mostly clustered around peak-load periods.
In addition to the residual layer, the Isolation Forest detector was applied to the same evaluation period. Figure 7 shows the 15-minute active power series with the points flagged as outliers by the model highlighted in red.
The final alarm is obtained by intersecting the two layers, keeping only timestamps simultaneously flagged by both detectors. Figure 8 shows the 15-minute active power series with final alarms highlighted in black. Out of the persistent residual events and Isolation Forest segments, only two short intervals remain in the intersection, indicating conservative behaviour that focuses attention on the most pronounced and consistently abnormal deviations.
To examine these final alarms in more detail, Figure 9 zooms into the week in which they occur. In this interval the detections appear as two short bursts of persistent excess consumption relative to the expected afternoon load profile. The first event corresponds to samples on 15 September and the second to consecutive samples on 18 September. Both episodes are clear deviations above the expected level and stand out from the background variability. From an operational point of view, they can be interpreted as distinct events of sustained overconsumption or, under a coarser temporal aggregation, as closely related manifestations of an abnormal operating condition within the same week.
4.4. Integrated Dashboard
Figure 10 presents the integrated Grafana dashboard deployed for the pilot building, which serves as the central interface for facility managers. This operational view synthesizes real-time telemetry with the analytical outputs generated by the platform. The main panel overlays the instantaneous active power consumption (green line) against the 24-hour forecast generated by the Prophet model (yellow line), allowing operators to visually assess load performance against expected behaviour. Anomalies detected by the hybrid Isolation Forest and residual rule are highlighted with distinct markers, drawing immediate attention to abnormal deviations. Simultaneously, dedicated widgets track financial performance, displaying the accumulated energy cost for the current month in real-time, updated every minute according to the active Time-of-Use tariff period. This unified visualisation empowers operators to not only monitor technical stability but also validate budget adherence and rapidly identify cost-inefficient operating conditions.
5. Discussion
The proposed architecture exemplifies a “Smart and Hybrid Energy System” by unifying heterogeneous data streams—from legacy Modbus meters to modern IoT sensors and web-based weather services—into a cohesive analytical platform. This integration is critical for the transition to low-carbon societies, as it empowers facility managers to move beyond passive monitoring to active, data-driven energy optimization. By leveraging open-source technologies (PostgreSQL, Prophet, Isolation Forest), the system offers a cost-effective alternative to proprietary Building Management Systems (BMS), democratizing access to sophisticated energy insights. This replicability is a key contribution to social and economic sustainability, providing a viable blueprint for other public institutions with limited budgets to modernise their energy infrastructure.
However, the current implementation presents specific limitations. The reliance on public APIs for weather data introduces a dependency on external connectivity. Additionally, the tariff configuration, while flexible, currently requires manual updates when regulatory pricing periods change. Scaling the solution from the pilot building to the entire campus will also require further validation of the system’s computational performance under increased data ingestion rates, although this is expected to be minimal.
Future work will focus on resilience and expansion. We plan to externalize the tariff engine into a dedicated microservice to simplify regulatory updates and to extend the machine learning pipeline to the remaining campus buildings. Research will also be pursued to refine the forecasting model by incorporating real-time occupancy indicators (e.g., Wi-Fi connections) and to perform a systematic calibration of anomaly detection thresholds across different, distinct functional zones (e.g., laboratories vs. administrative offices).
6. Conclusions
This study presented the design, implementation, and operational validation of a campus-scale electricity monitoring system at the University of Algarve. Addressing the limitations of fragmented data silos and proprietary vendor lock-in, the proposed architecture offers a unified, open-source platform that consolidates heterogeneous metering streams—from legacy Modbus devices to modern IoT sensors—into a single high-performance database. This robust foundation not only ensures data integrity and accessibility but also provides the necessary granularity for precise cost allocation and multi-level consumption analysis across the institution.
The integration of advanced analytics proved highly effective in an operational setting. The machine learning pipeline, leveraging the Prophet algorithm, achieved a forecasting coverage of approximately 95% across varying diurnal and seasonal patterns, validating its reliability for day-ahead planning. Furthermore, the hybrid anomaly detection scheme—which intersects forecast residuals with Isolation Forest scores—was shown to significantly reduce false positive rates compared to univariate statistical methods. This dual-verification approach focuses reliability on genuine operational inefficiencies, minimising the cognitive load on facility managers and enabling a more responsive maintenance strategy.
Ultimately, this work illustrates that a resilient, data-driven path to sustainability is achievable without reliance on cost-prohibitive commercial solutions. By demonstrating how accessible technologies can be orchestrated to create a “Smart and Hybrid Energy System,” this research provides a scalable and replicable blueprint for other public institutions. This contribution directly supports the broader transition to low-carbon societies, proving that significant steps towards energy efficiency and operational excellence are within reach for budget-constrained organisations.
Author Contributions
Conceptualization, A.S., J.M., P.C.; methodology, A.S., J.M., P.C..; software, A.S.; validation, A.S., J.M., P.C., Y.Y. and Z.Z.; formal analysis, A.S., J.M., P.C.; investigation, A.S., J.M., P.C.; resources, J.M., P.C.; data curation, A.S.; writing—original draft preparation, A.S.; writing—review and editing, A.S., J.M., P.C.; visualization, A.S., J.M., P.C.; supervision, J.M., P.C.; project administration, J.M., P.C.; funding acquisition, J.M., P.C. All authors have read and agreed to the published version of the manuscript.
Funding
This work is supported by the UID/04516/NOVA Laboratory for Computer Science Informatics (NOVA LINCS) with the financial support of FCT.IP.
Acknowledgments
During the preparation of this manuscript, the author(s) used Gemini 3 Pro for the purposes of text editing. The authors have reviewed and edited the output and take full responsibility for the content of this publication.
Abbreviations
The following abbreviations are used in this manuscript:
| AI | Artificial Intelligence |
| API | Application Programming Interface |
| BMS | Building Management System |
| CPP | Critical Peak Pricing |
| DBSCAN | Density-Based Spatial Clustering of Applications with Noise |
| DSM | Demand Side Management |
| EMS | Energy Management System |
| ERSE | Energy Services Regulatory Authority |
| HTTP | Hypertext Transfer Protocol |
| JSON | JavaScript Object Notation |
| LOF | Local Outlier Factor |
| LSTM | Long Short-Term Memory |
| MAD | Median Absolute Deviation |
| MAE | Mean Absolute Error |
| MQTT | Message Queuing Telemetry Transport |
| PV | Photovoltaic |
| REST | Representational State Transfer |
| RMSE | Root Mean Squared Error |
| RTP | Real-Time Pricing |
| RTU | Remote Terminal Unit |
| SCADA | Supervisory Control and Data Acquisition |
| SDG | Sustainable Development Goal |
| ToU | Time-of-Use |
| UAlg | University of Algarve |
| WAPE | Weighted Absolute Percentage Error |
References
- Moura, P.; Moreno, J.I.; López López, G.; Alvarez-Campana, M. IoT Platform for Energy Sustainability in University Campuses. Sensors 2021, 21, 357. [Google Scholar] [CrossRef]
- Amaxilatis, D.; Akrivopoulos, O.; Mylonas, G.; Chatzigiannakis, I. An IoT-Based Solution for Monitoring a Fleet of Educational Buildings Focusing on Energy Efficiency. Sensors 2017, 17, 2296. [Google Scholar] [CrossRef]
- Quispe, E.C.; Viveros Mira, M.; Chamorro Díaz, M.; Castrillón Mendoza, R.; Vidal Medina, J.R. Energy Management Systems in Higher Education Institutions’ Buildings. Energies 2025, 18, 1810. [Google Scholar] [CrossRef]
- Furukakoi, M.; Nakadomari, A.; Uehara, A.; Krishnan, N.; Hemeida, A.M.; Senjyu, T. Optimization of PV and battery systems in university campuses: A combined planning and operation approach under uncertainties. Energy and Buildings 2025, 335, 115512. [Google Scholar] [CrossRef]
- Araya, D.B.; Grolinger, K.; ElYamany, H.F.; Capretz, M.A.; Bitsuamlak, G. An ensemble learning framework for anomaly detection in building energy consumption. Energy and Buildings 2017, 144, 191–206. [Google Scholar] [CrossRef]
- Billanes, J.D.; Ma, Z.G.; Jørgensen, B.N. Data-Driven Technologies for Energy Optimization in Smart Buildings: A Scoping Review. Energies 2025, 18, 290. [Google Scholar] [CrossRef]
- Liu, H.; Liang, J.; Liu, Y.; Wu, H. A Review of Data-Driven Building Energy Prediction. Buildings 2023, 13, 532. [Google Scholar] [CrossRef]
- Gulbinas, R.; Taylor, J.E. Effects of real-time eco-feedback and organizational network dynamics on energy efficient behavior in commercial buildings. Energy and Buildings 2014, 84, 493–500. [Google Scholar] [CrossRef]
- Tiefenbeck, V.; Wörner, A.; Schöb, S.; Fleisch, E.; Staake, T. Real-time feedback promotes energy conservation in the absence of volunteer selection bias and monetary incentives. Nature Energy 2018, 4, 35–41. [Google Scholar] [CrossRef]
- United Nations. The 17 Sustainable Development Goals. (retrieved January 6th, 2026), 2015.
- Domínguez, M.; San Martín, J.I.; Perallos, A.; Gutiérrez, J.A. Power monitoring system for university buildings. Energy and Buildings 2013, 66, 72–77. [Google Scholar] [CrossRef]
- Dat, M.N.; Trung, K.D.; Minh, P.V.; Van, C.D.; Tran, Q.T.; Ngoc, T.N. Assessment of energy efficiency using an energy monitoring system: A case study of a major energy-consuming enterprise in Vietnam. Energies 2023, 16, 5214. [Google Scholar] [CrossRef]
- BSI. EN 17267:2019 — Energy measurement and monitoring plan. Technical report, BSI, 2019. Accessed: 17 Oct. 2025.
- Modbus Organization. Modbus Application Protocol Specification V1.1b3 . Modbus Organization. 2006. Available online: https://www.modbus.org/modbus-specifications (accessed on 17 October 2025).
- Fielding, R.T.; Nottingham, M.; Reschke, J. HTTP semantics. RFC 9110; Internet Engineering Task Force (IETF), 2022. [Google Scholar] [CrossRef]
- Bray, T. The JavaScript Object Notation (JSON) data interchange format. RFC 8259, Internet Engineering Task Force (IETF), 2017. [CrossRef]
- Fielding, R.T. Architectural styles and the design of network-based software architectures. Ph.D. dissertation, University of California, Irvine, 2000. [Google Scholar]
- Manowska, A.; Wycisk, A.; Nowrot, A.; Pielot, J. The use of the MQTT protocol in measurement, monitoring and control systems as part of the implementation of energy management systems. Electronics 2023, 12, 17. [Google Scholar] [CrossRef]
- ISO. Information technology — Message Queuing Telemetry Transport (MQTT) v3.1.1. Technical Report ISO/IEC 20922:2016, ISO/IEC JTC 1, 2016. Accessed: 17 Oct. 2025.
- OpenEnergyMonitor. EmonCMS user guide. 2023. Available online: https://docs.openenergymonitor.org/emoncms/index.html (accessed on 17 October 2025).
- Home Assistant. Energy management with Home Assistant, 2024. Accessed: 17 Oct. 2025.
- MathWorks. ThingSpeak IoT analytics platform, 2024. Accessed: 17 Oct. 2025.
- Arduino. Arduino Internet of Things Cloud, 2024. Accessed: 17 Oct. 2025.
- Grafana Labs. Grafana documentation, 2024. Accessed: 17 Oct. 2025.
- PostgreSQL Global Development Group. PostgreSQL documentation, 2025. Accessed: 17 Oct. 2025.
- European Union. Directive (EU) 2019/944 of the European Parliament and of the Council of 5 June 2019 on common rules for the internal market for electricity and amending Directive 2012/27/EU. Official Journal of the European Union 2019. [Google Scholar]
- Dutta, G.; Mitra, K. A literature review on dynamic pricing of electricity. Journal of the Operational Research Society 2017, 68, 1131–1145. [Google Scholar] [CrossRef]
- ERSE. Tarifas e preços para a energia elétrica e outros serviços em 2025. 2024. Available online: https://www.erse.pt/media/xczdo4as/tep-se-2025.pdf (accessed on 17 October 2025).
- Faiz, M.F.; Sajid, M.; Ali, S.; Javed, K.; Ayaz, Y. Energy modeling and predictive control of environmental quality for building energy management using machine learning. Energy for Sustainable Development 2023, 74, 381–395. [Google Scholar] [CrossRef]
- Chan, J.W.; Yeo, C.K. A Transformer based approach to electricity load forecasting. The Electricity Journal 2024, 37, 107370. [Google Scholar] [CrossRef]
- Albahli, S. LSTM vs. Prophet: Achieving Superior Accuracy in Dynamic Electricity Demand Forecasting. Energies 2025, 18, 278. [Google Scholar] [CrossRef]
- Taylor, S.J.; Letham, B. Forecasting at Scale. The American Statistician 2018, 72, 37–45. [Google Scholar] [CrossRef]
- Taylor, S.J.; Letham, B. Prophet: Forecasting at scale, 2017. Accessed: 17 Oct. 2025.
- Pydi, D.P.; Advaith, S. Attention boosted autoencoder for building energy anomaly detection. Energy and AI 2023, 14, 100292. [Google Scholar] [CrossRef]
- Sharma, T.; Balyan, A.; Singh, A.K. Machine Learning-Based Energy Optimization and Anomaly Detection for Heterogeneous Wireless Sensor Network. SN Computer Science 2024, 5. [Google Scholar] [CrossRef]
- Yifei, S.; Bo, F.; Jieying, K.; Lai, Z. Electricity Consumption Behavior Analysis Based on DE-DBSCAN. In Proceedings of the 2022 4th International Conference on Electrical Engineering and Control Technologies (CEECT), 2022; IEEE; pp. 526–530. [Google Scholar] [CrossRef]
- Mendes, T.; Cardoso, P.J.S.; Monteiro, J.; Raposo, J. Anomaly detection of consumption in hotel units: A case study comparing isolation forest and variational autoencoder algorithms. Applied Sciences 2023, 13, 314. [Google Scholar] [CrossRef]
- Liu, F.T.; Ting, K.M.; Zhou, Z.H. Isolation Forest. In Proceedings of the 2008 Eighth IEEE International Conference on Data Mining. IEEE, 2008; pp. 413–422. [Google Scholar] [CrossRef]
- Solar-Log GmbH. Solar-Log Base manual 5.x, 2023. Accessed: 30 Oct. 2025.
- Open-Meteo. Weather forecast API documentation. 2025. Available online: https://open-meteo.com/en/docs (accessed on 30 October 2025).
- Arm Research. Mango: Parallel hyperparameter tuning library — documentation. 2025. Available online: https://arm-mango.readthedocs.io/ (accessed on 7 November 2025).
- Leys, C.; Ley, C.; Klein, O.; Bernard, P.; Licata, L. Detecting outliers: Do not use standard deviation around the mean, use absolute deviation around the median. Journal of Experimental Social Psychology 2013, 49, 764–766. [Google Scholar] [CrossRef]
Figure 1.
System architecture: unified acquisition; central configuration and bounded retries; tariff-aware cost on ingestion; internally hosted VM with mirrored redundancy; consolidated PostgreSQL historical store.
Figure 1.
System architecture: unified acquisition; central configuration and bounded retries; tariff-aware cost on ingestion; internally hosted VM with mirrored redundancy; consolidated PostgreSQL historical store.
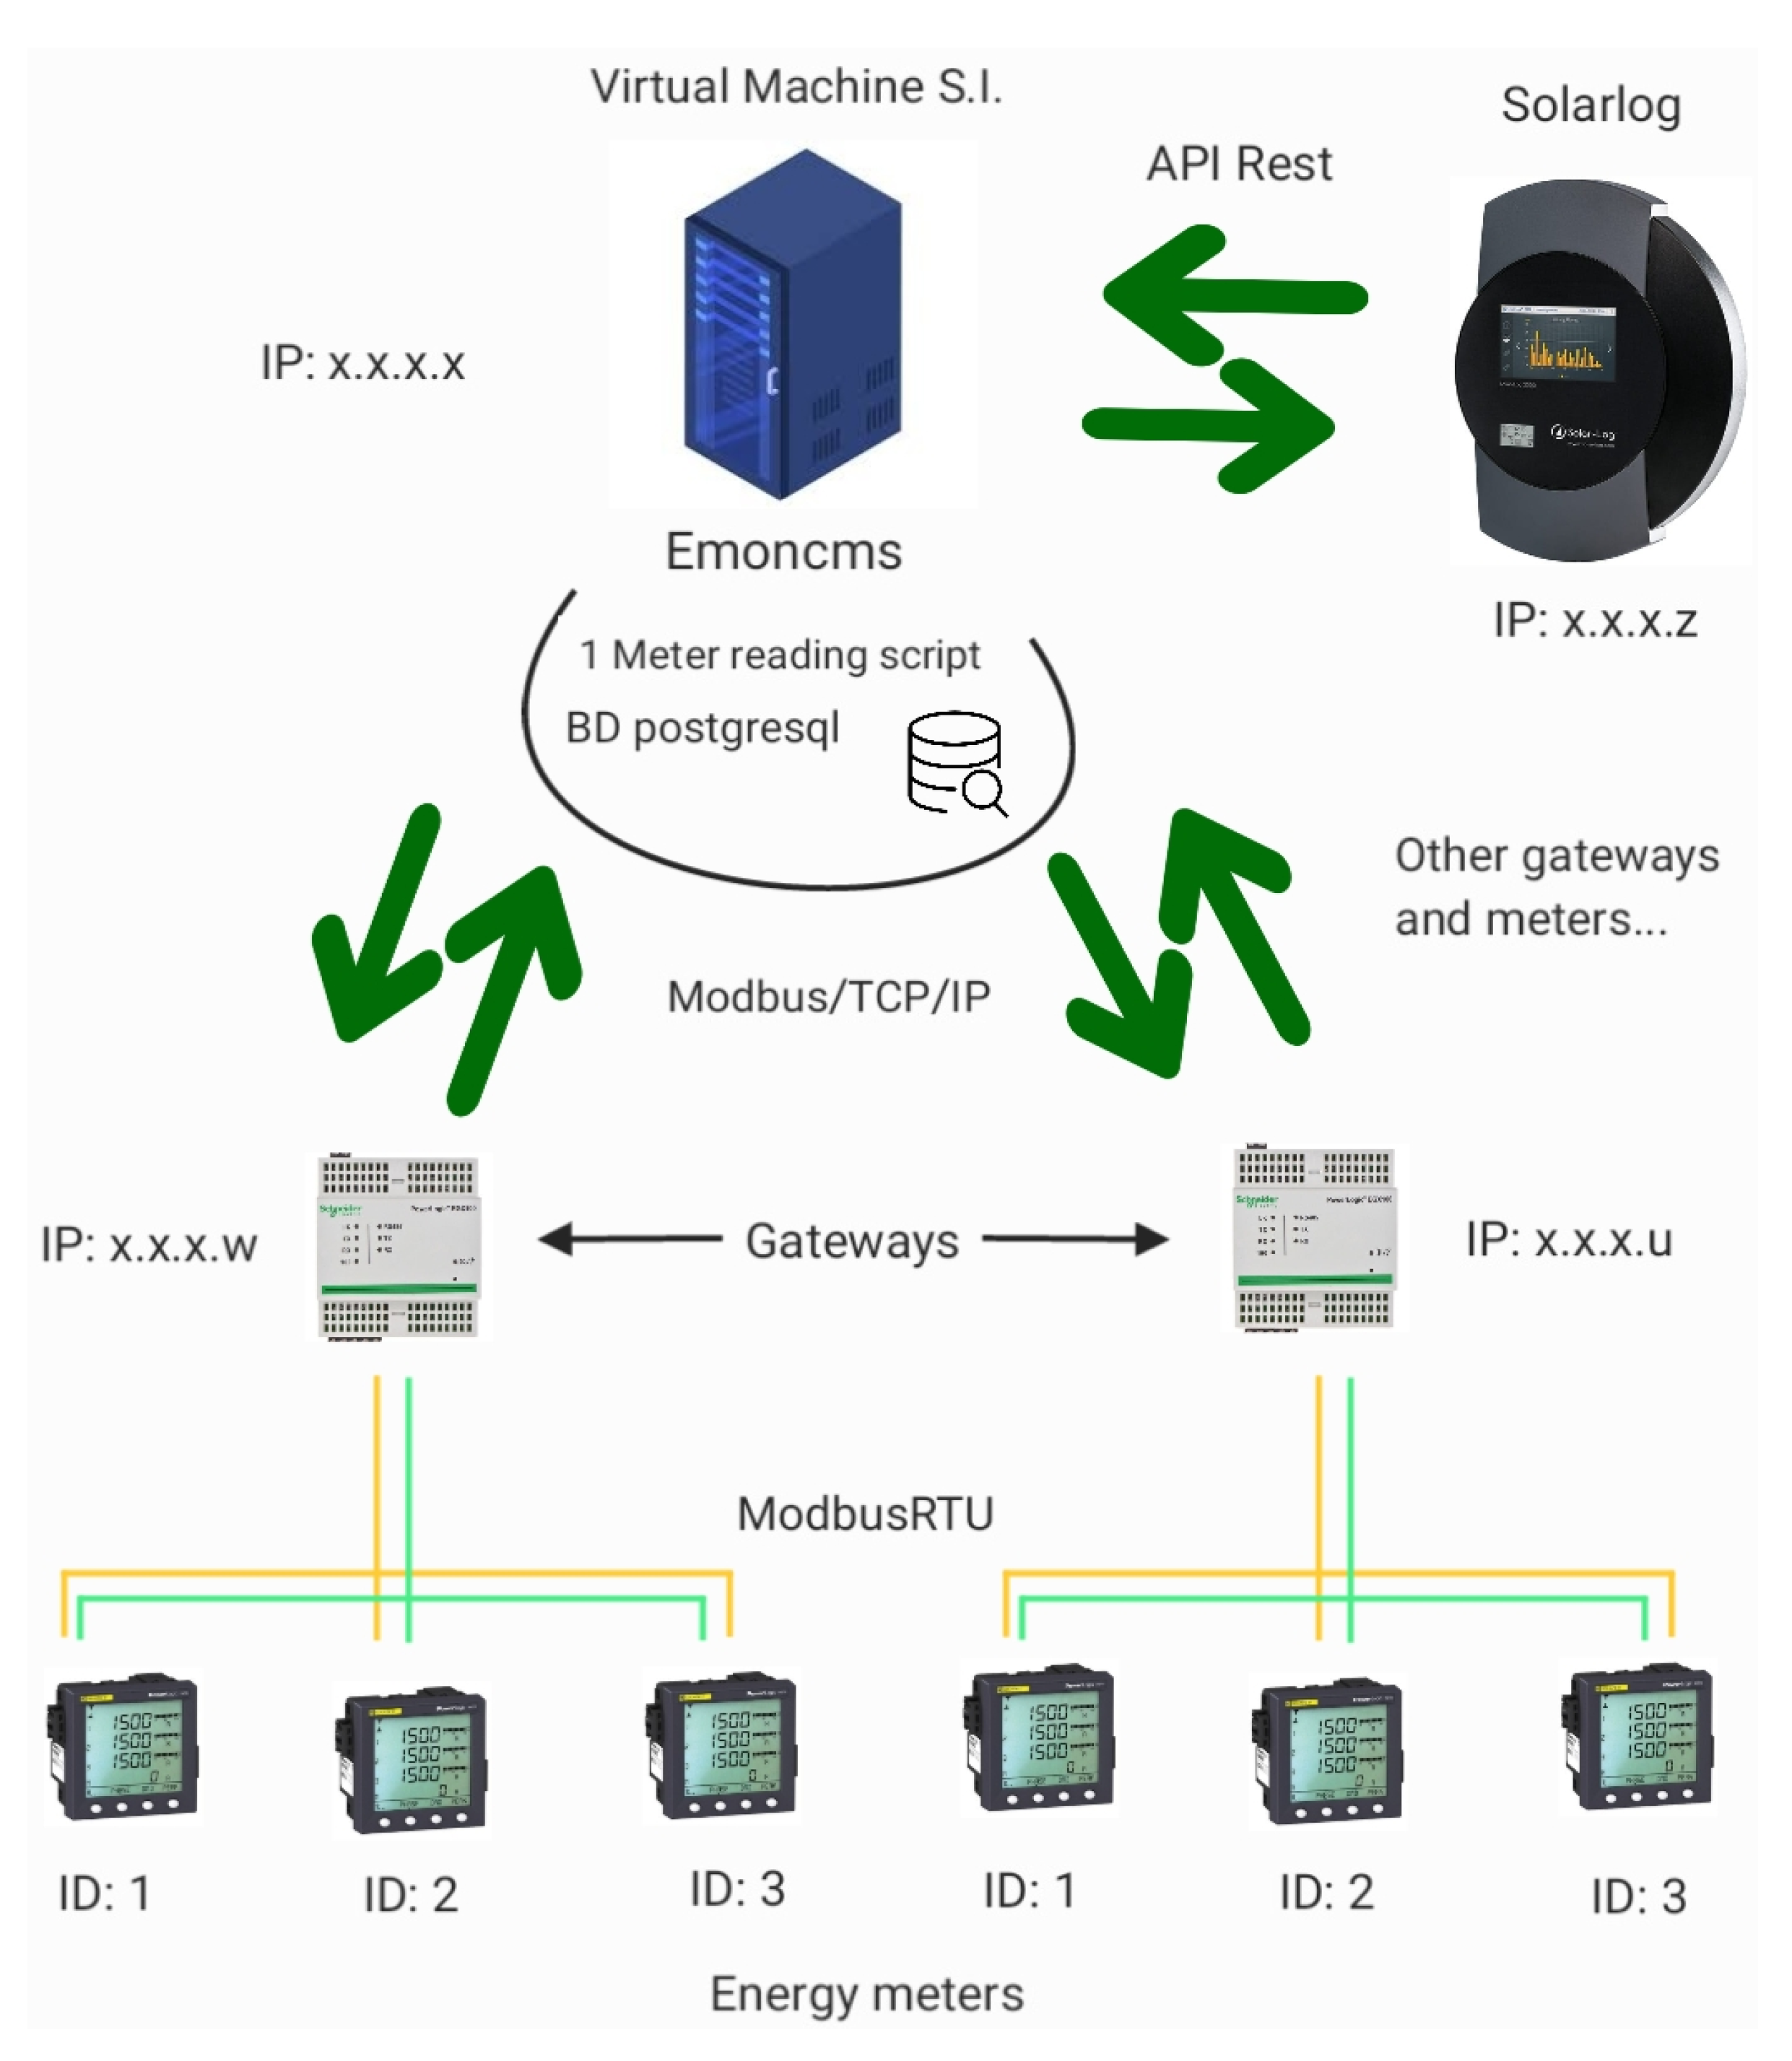
Figure 2.
Phase 1: temporal validation with 33 cutoffs spaced by 60 days; each cutoff trains on all prior data and forecasts the next 24-hours; the last 24-hours are kept as an independent holdout.
Figure 2.
Phase 1: temporal validation with 33 cutoffs spaced by 60 days; each cutoff trains on all prior data and forecasts the next 24-hours; the last 24-hours are kept as an independent holdout.
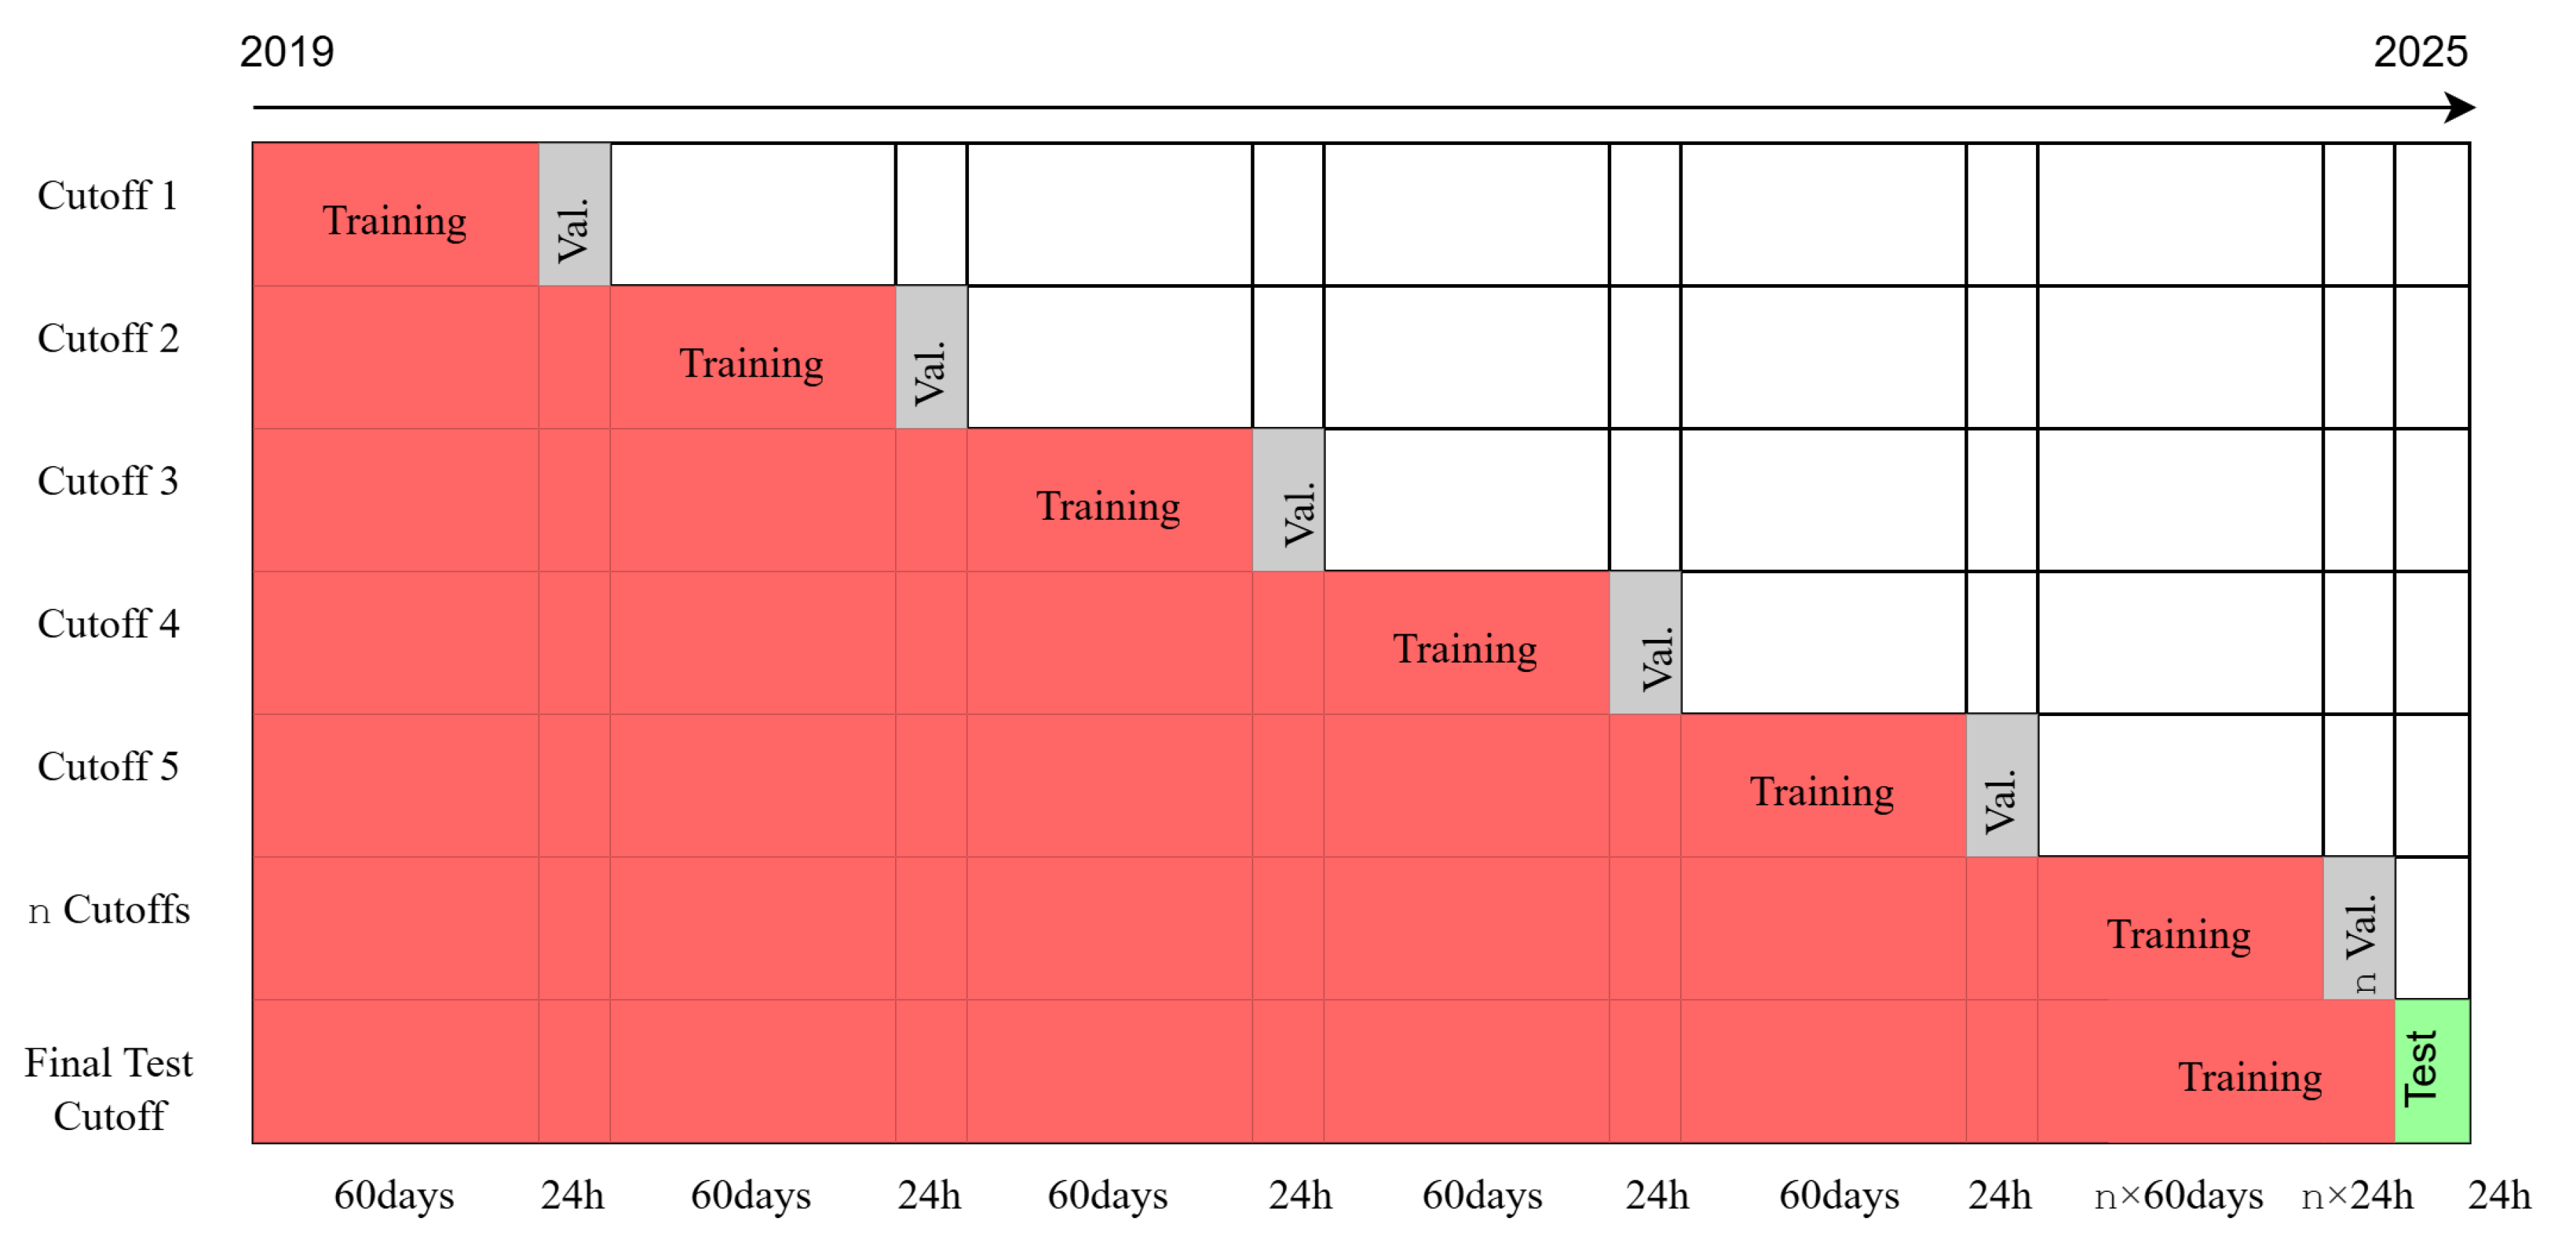
Figure 3.
Phase 2: Bayesian search with four representative cutoffs and controlled training history (about 365 days at the earliest, increasing progressively); each cutoff evaluates a 24-hour forecast window.
Figure 3.
Phase 2: Bayesian search with four representative cutoffs and controlled training history (about 365 days at the earliest, increasing progressively); each cutoff evaluates a 24-hour forecast window.
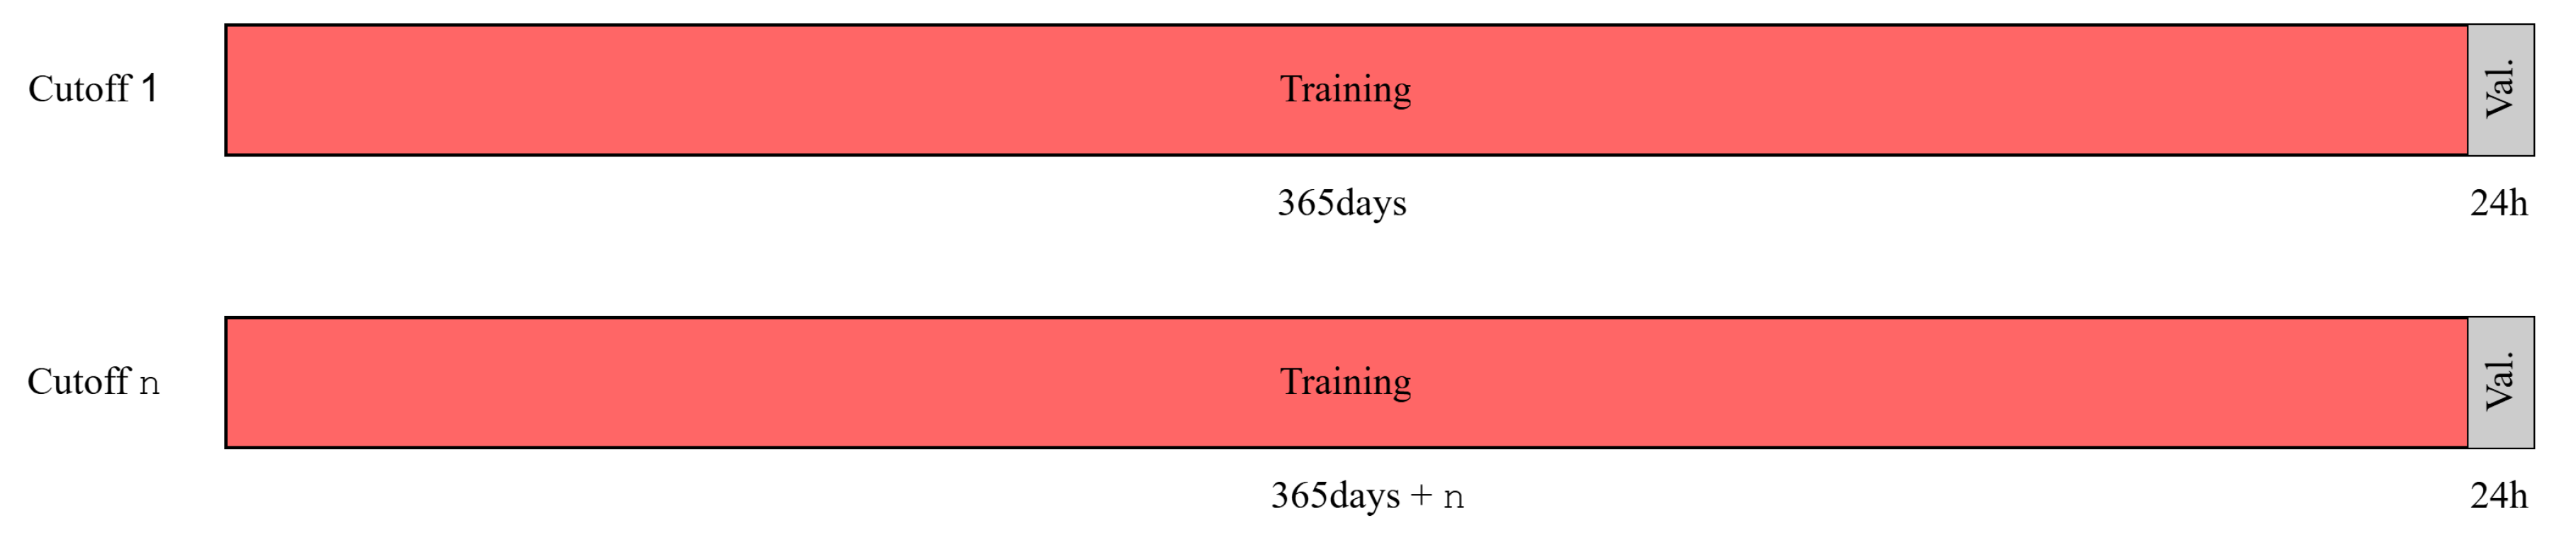
Figure 4.
MAE and RMSE over the 24-hour holdout period
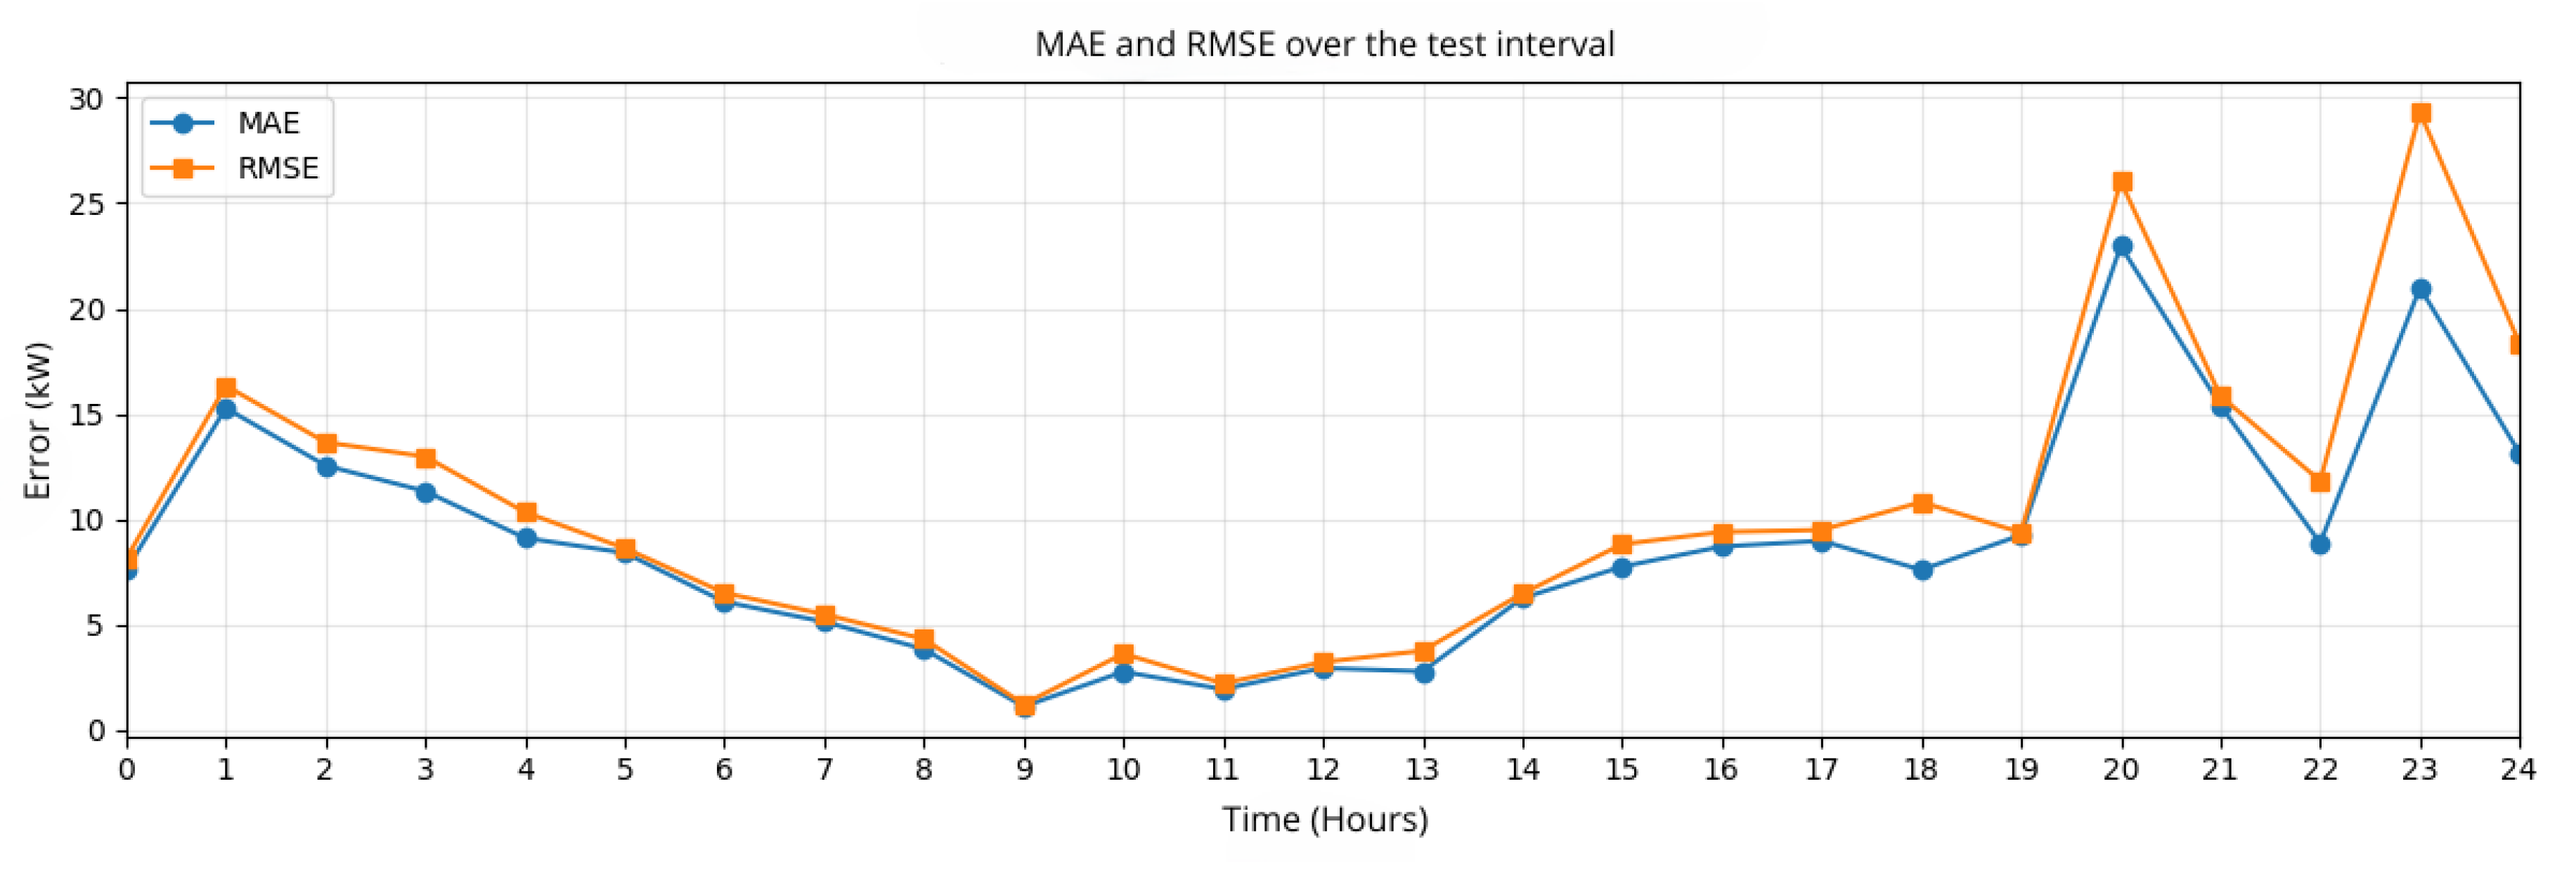
Figure 5.
Operational dashboard in EmonCMS showing observed consumption, point forecast, and prediction intervals
Figure 5.
Operational dashboard in EmonCMS showing observed consumption, point forecast, and prediction intervals
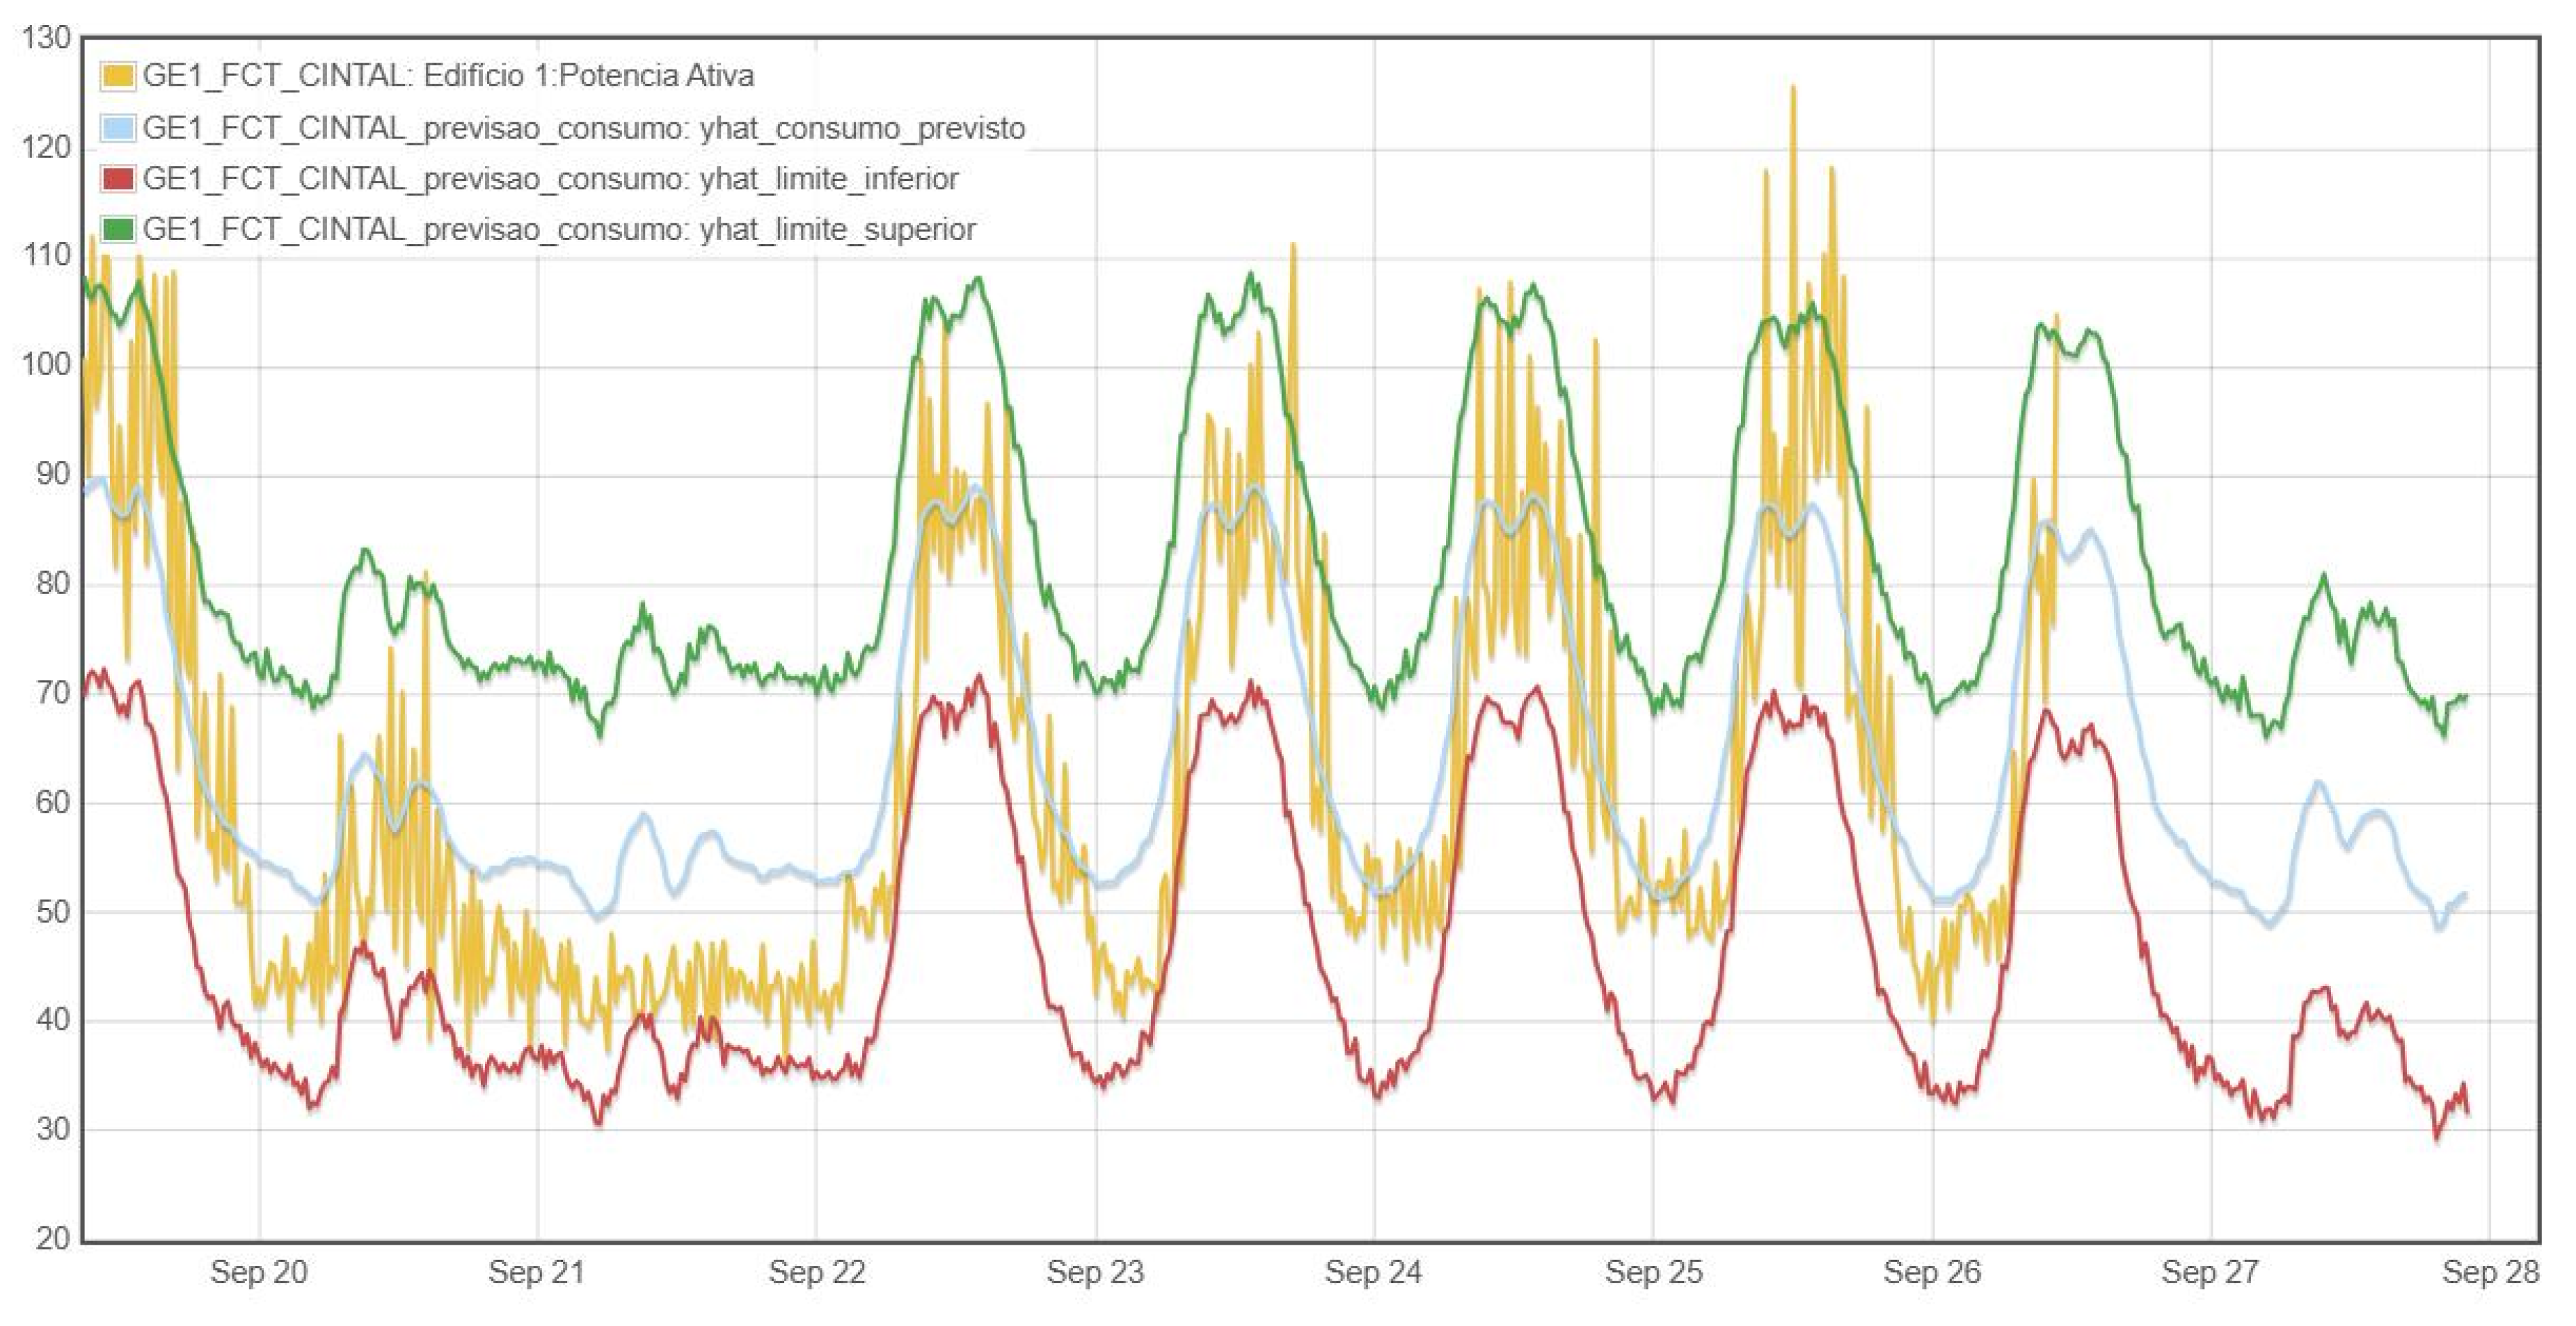
Figure 6.
15-minute active power and forecast with robust residual events (top) and robust score with threshold and exceedances (bottom)
Figure 6.
15-minute active power and forecast with robust residual events (top) and robust score with threshold and exceedances (bottom)
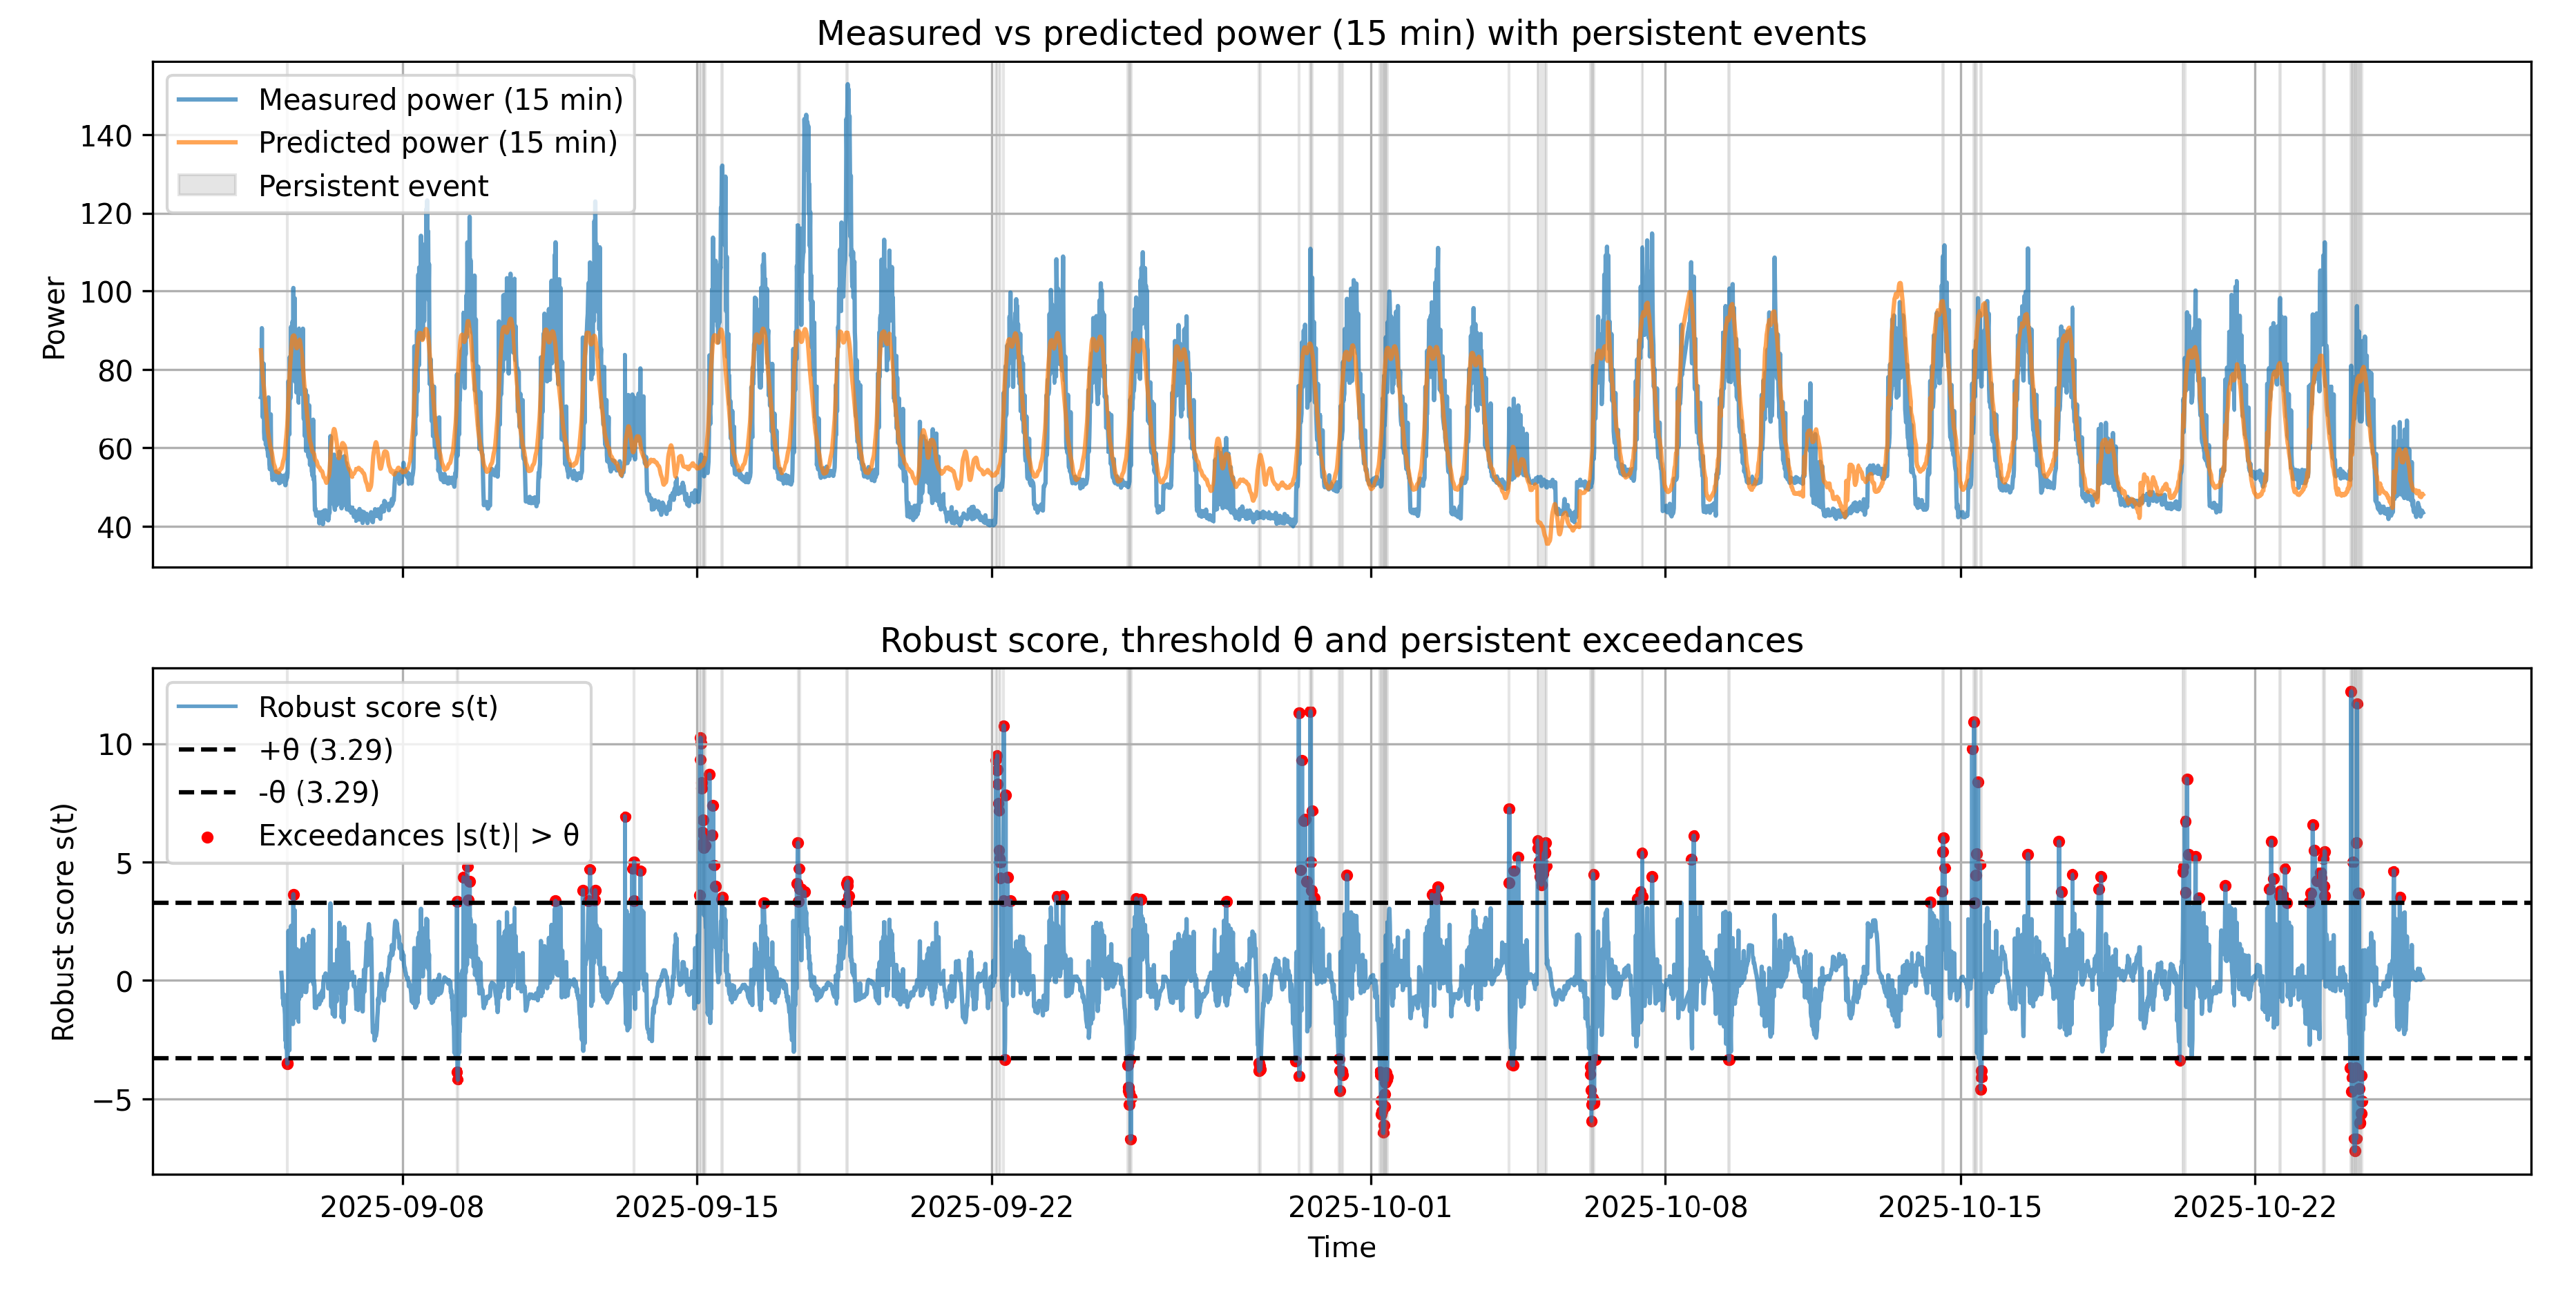
Figure 7.
15-minute active power series with anomalies flagged by the Isolation Forest (red markers) over the evaluation period
Figure 7.
15-minute active power series with anomalies flagged by the Isolation Forest (red markers) over the evaluation period
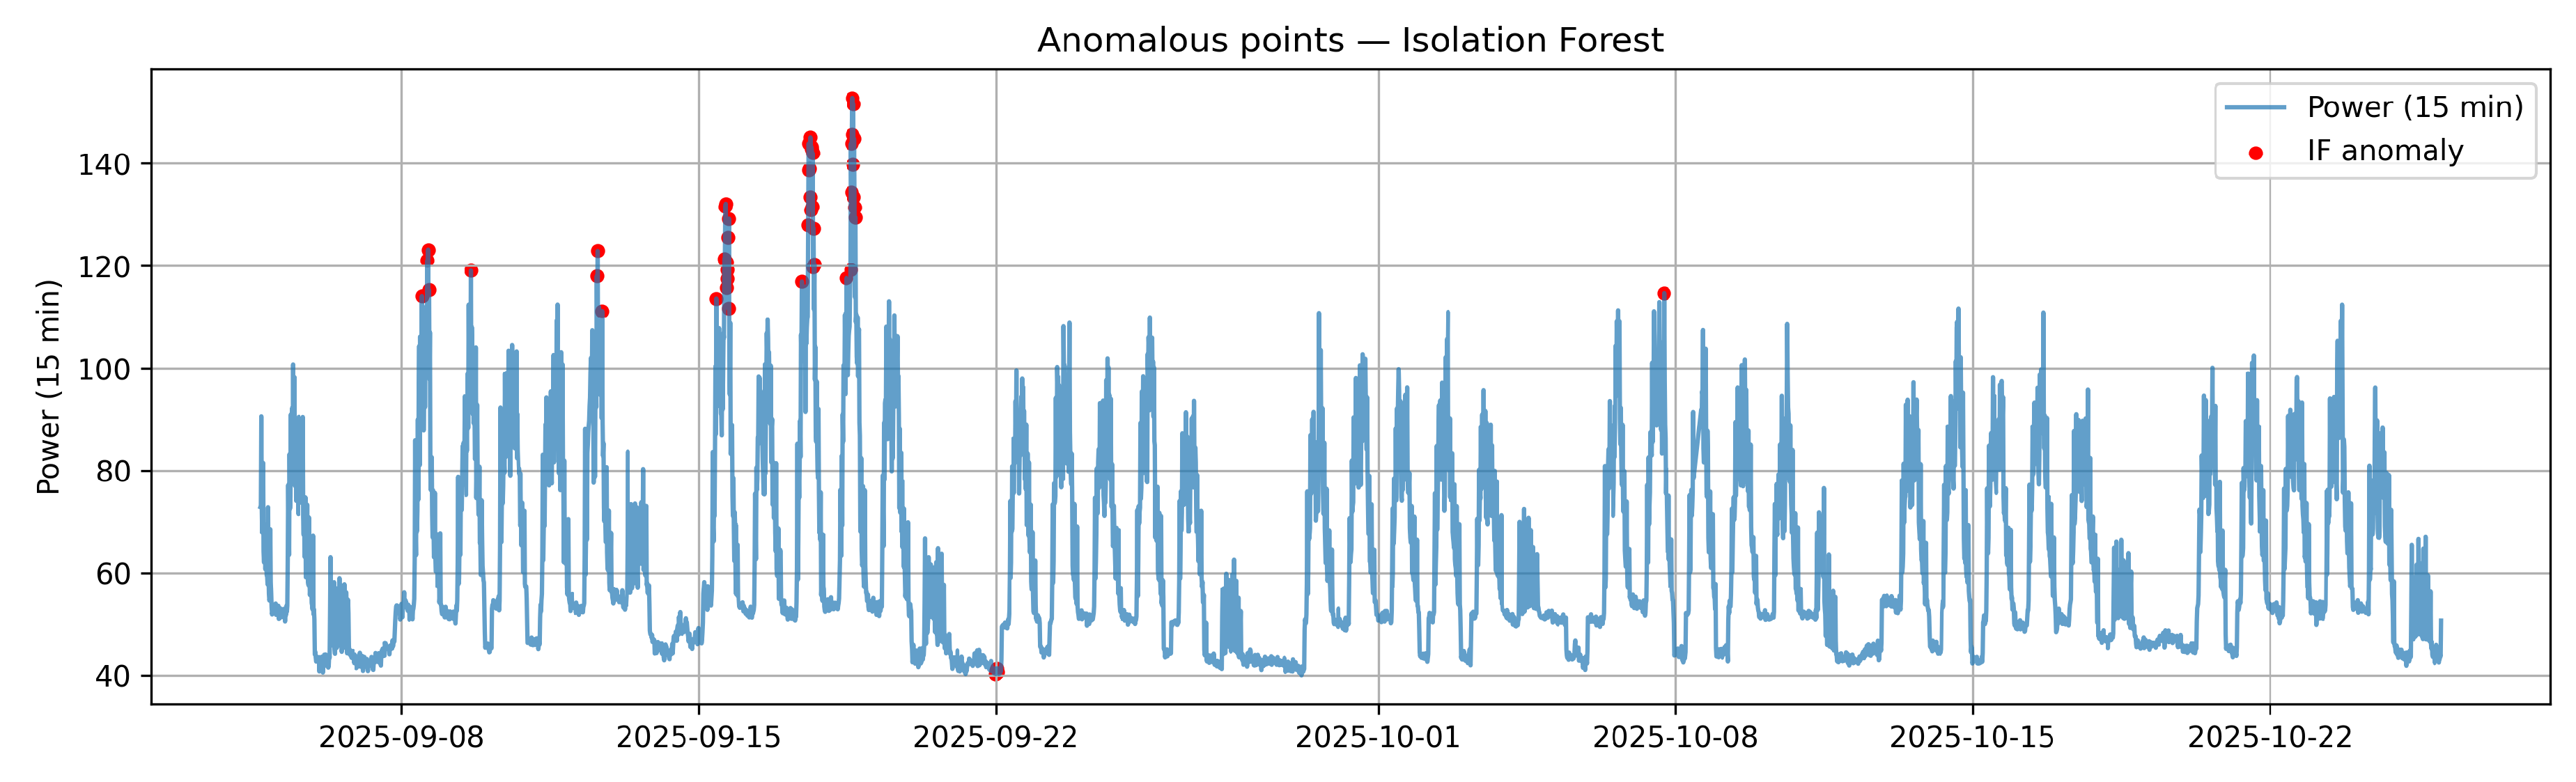
Figure 8.
Final alarm obtained from the intersection between the robust residual rule and the Isolation Forest, shown as black markers on the 15-minute active power series
Figure 8.
Final alarm obtained from the intersection between the robust residual rule and the Isolation Forest, shown as black markers on the 15-minute active power series
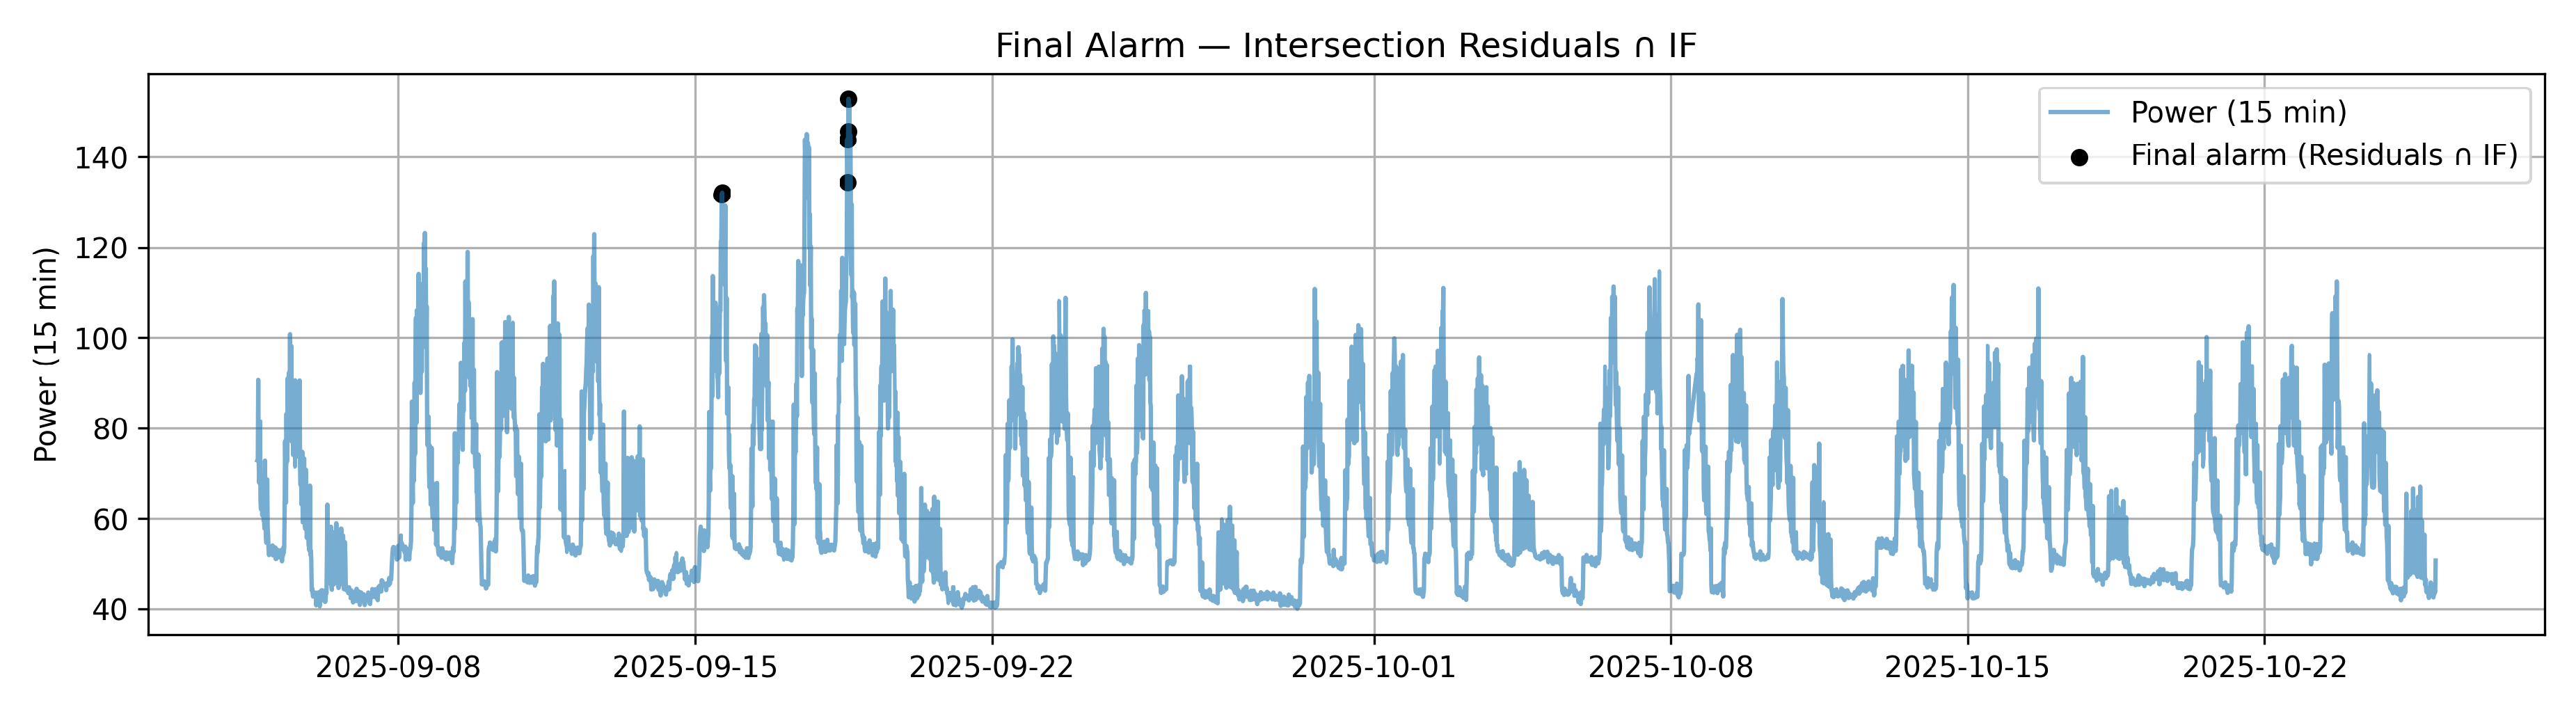
Figure 9.
Zoomed view of active power around the final anomalous episodes.
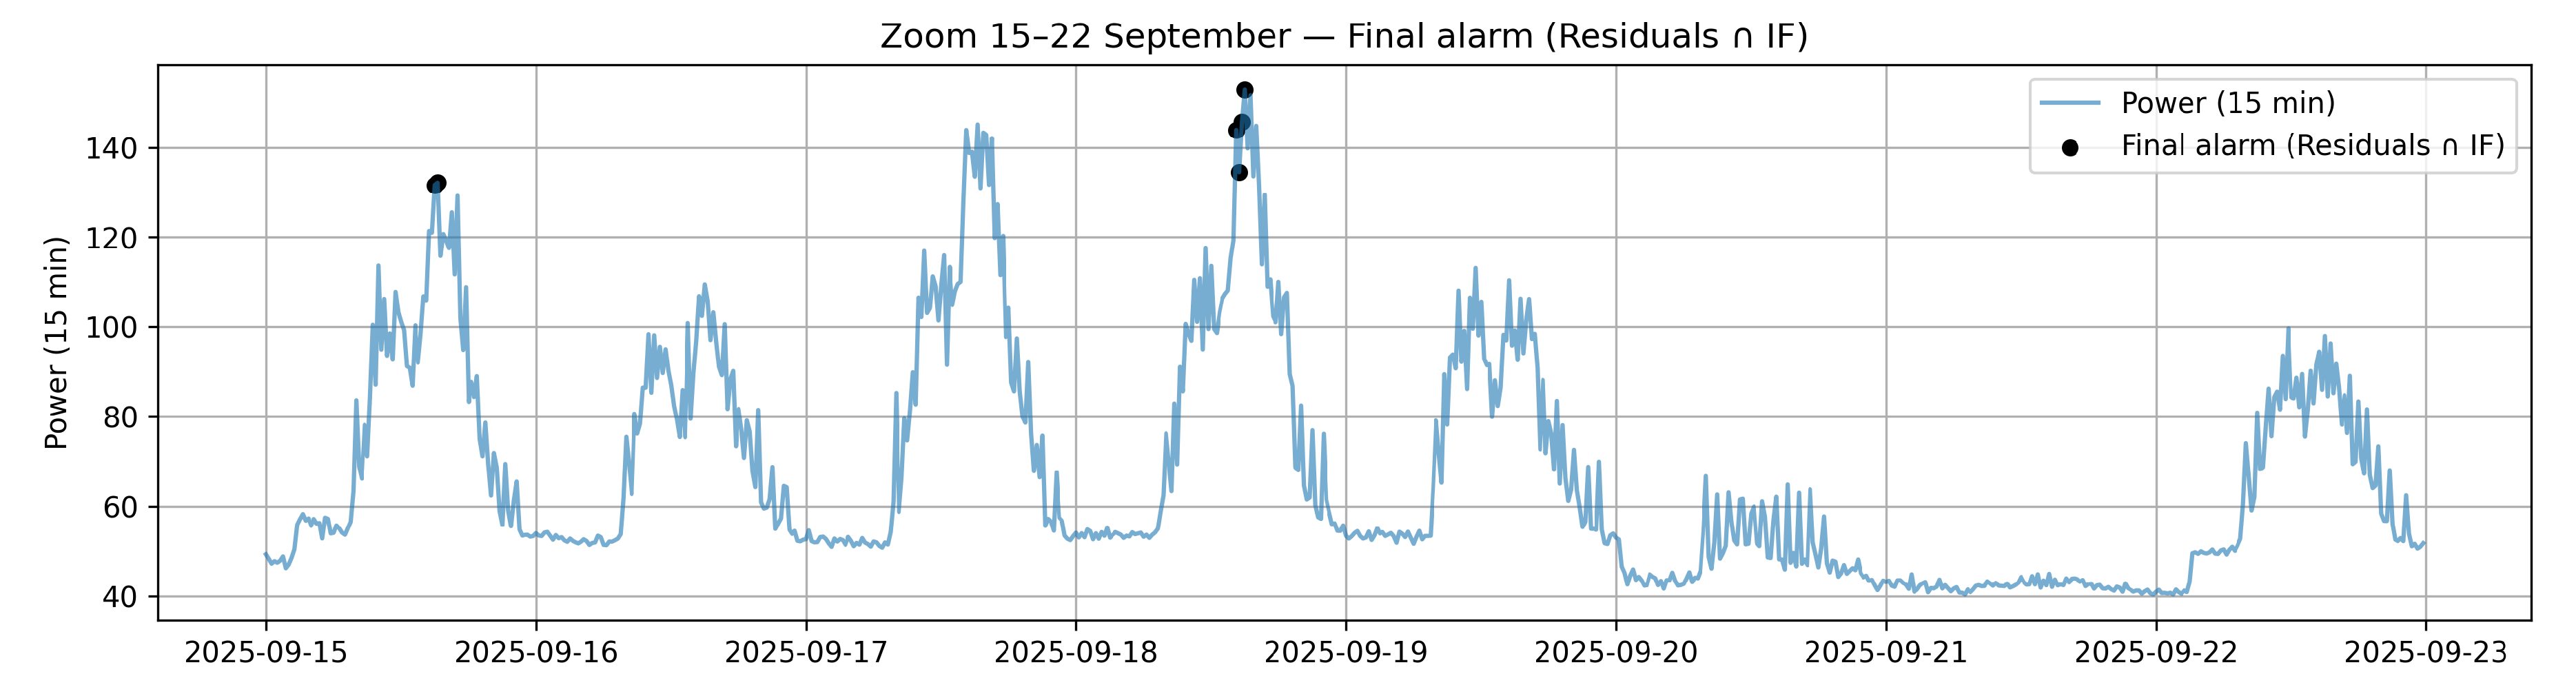
Figure 10.
Grafana dashboard for the pilot building.
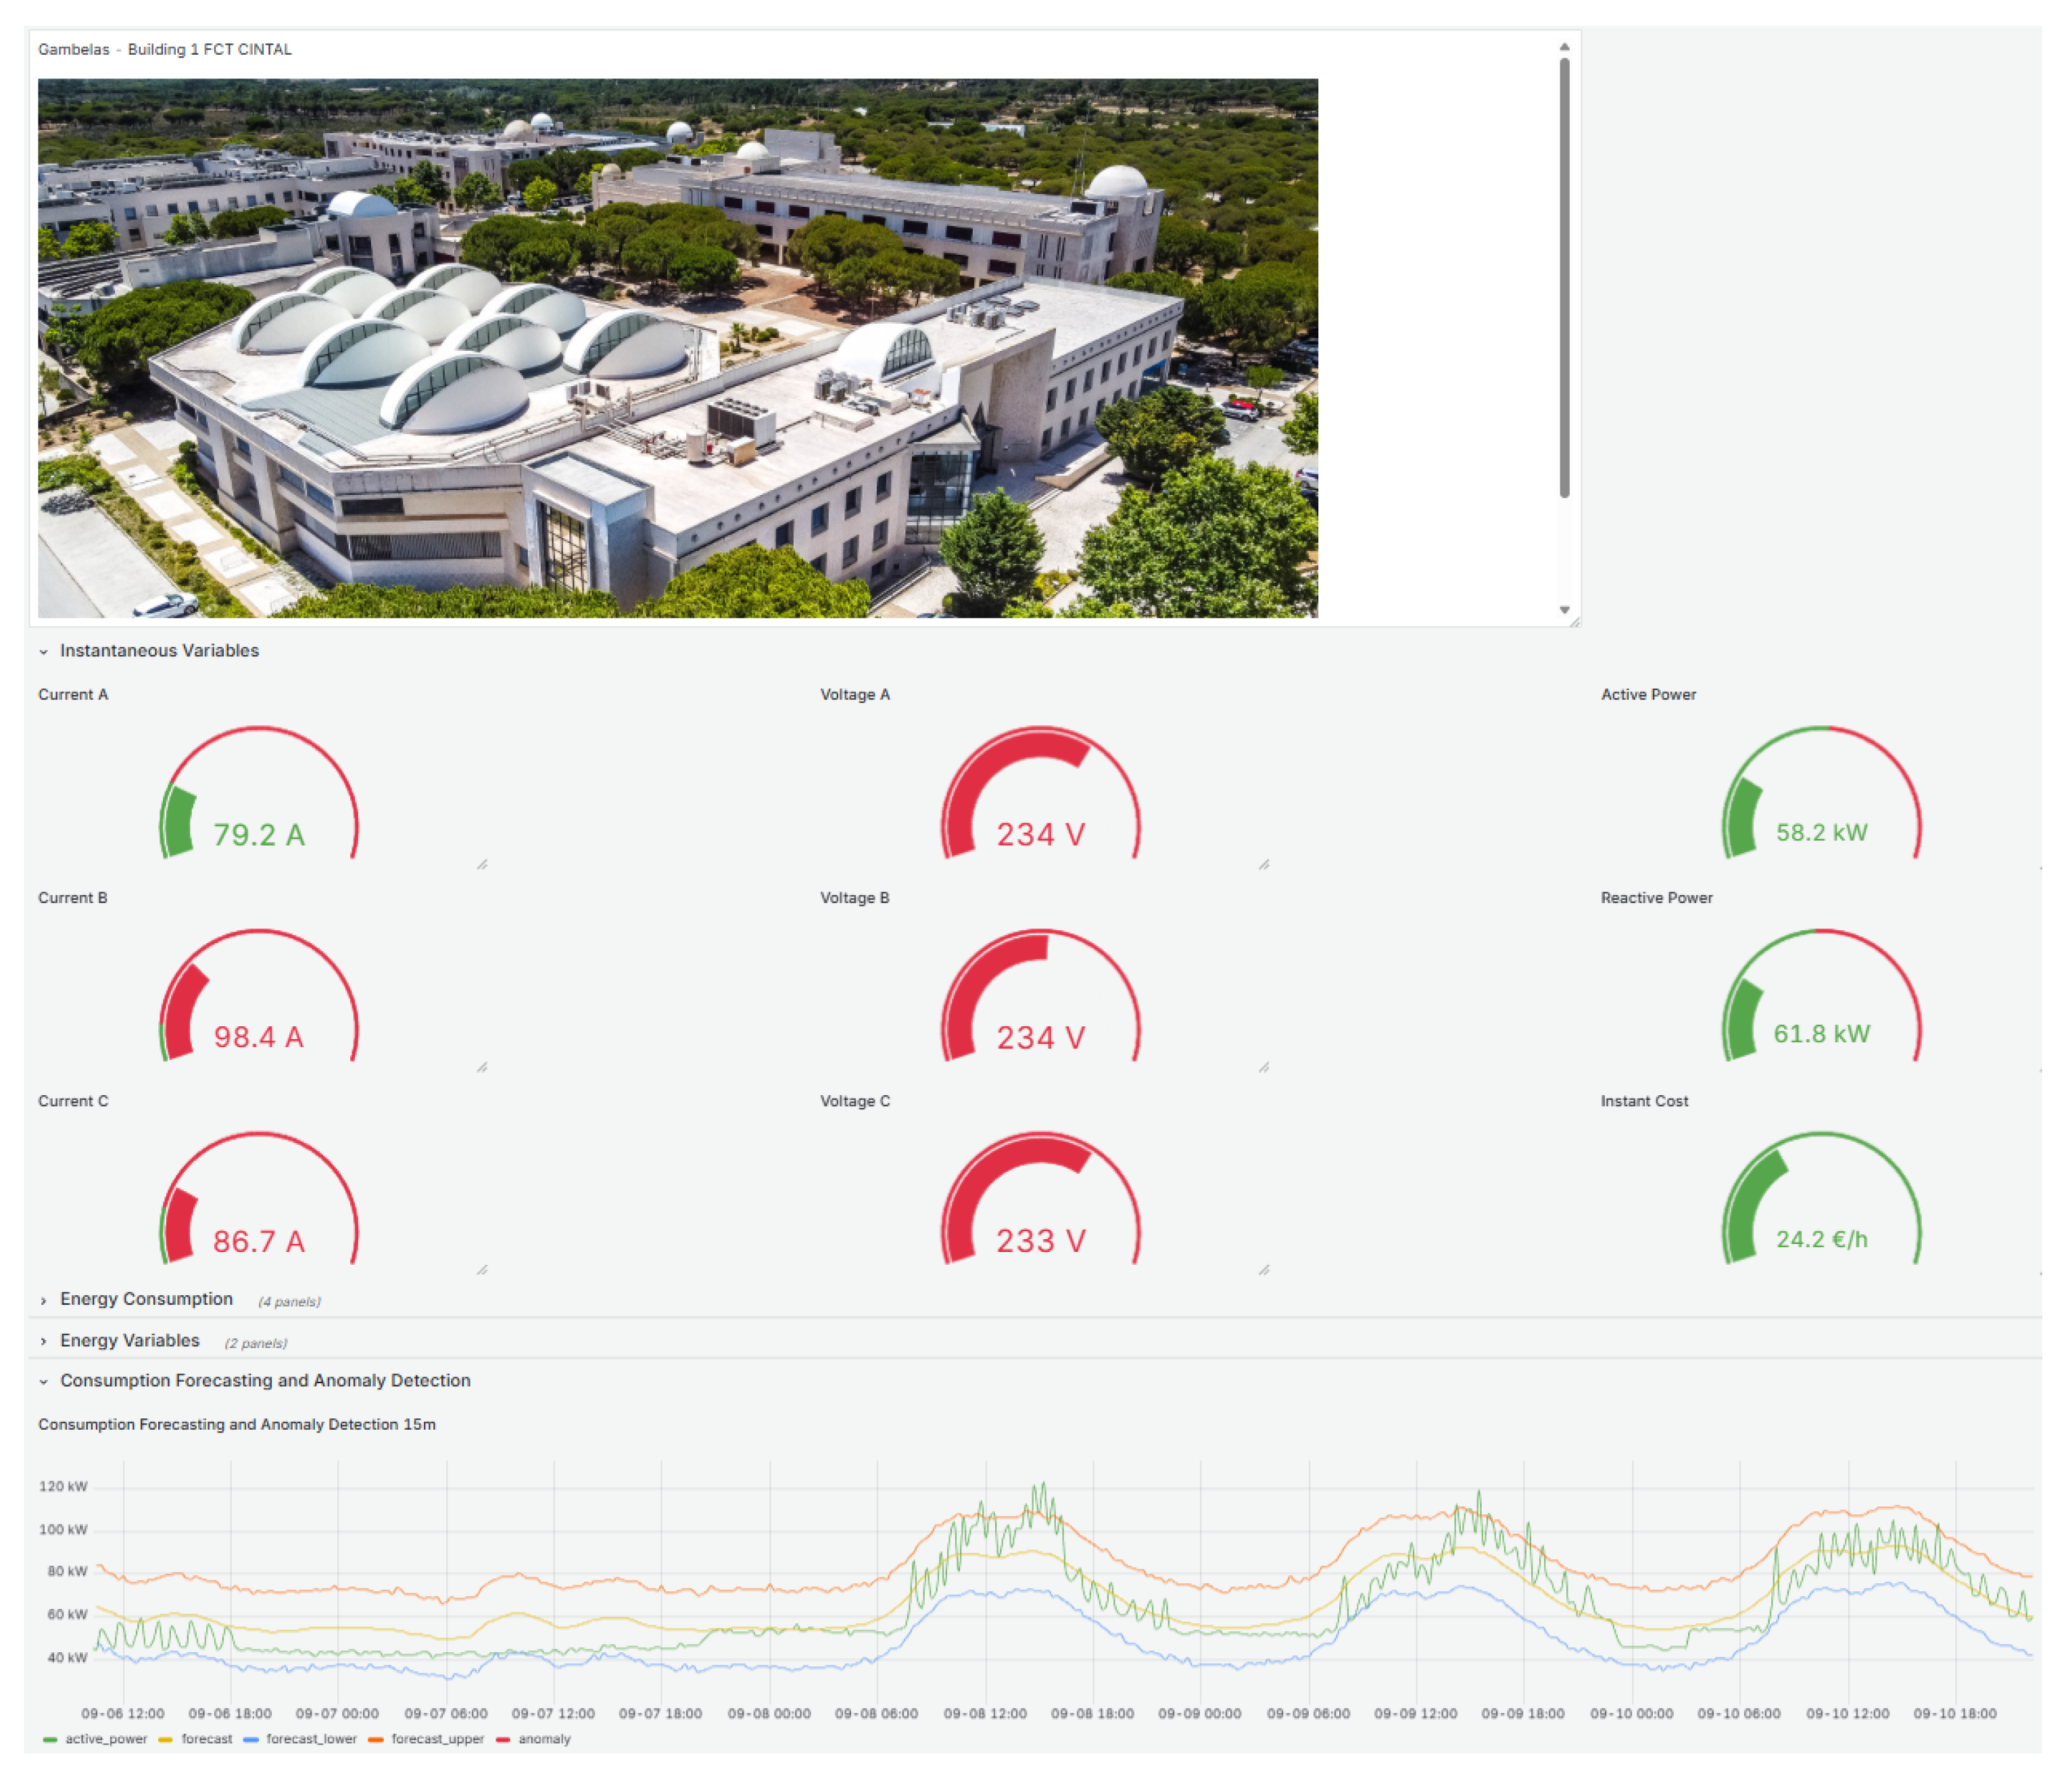

Table 1.
Sample records of the prepared dataset for Prophet: ds (timestamp), y (active power, kW), radiation (W/m2), temperature (°C), humidity (%), precipitation (0/1).
Table 1.
Sample records of the prepared dataset for Prophet: ds (timestamp), y (active power, kW), radiation (W/m2), temperature (°C), humidity (%), precipitation (0/1).
| ds | y | radiation | temperature | humidity | precipitation |
|---|---|---|---|---|---|
| 2025-09-23 15:00:00 | 40.55 | 740 | 27.54 | 31.0 | 0 |
| 2025-09-23 15:15:00 | 42.35 | 735 | 27.43 | 31.5 | 0 |
| 2025-09-23 15:30:00 | 41.25 | 730 | 27.20 | 33.0 | 0 |
Table 2.
Hyperparameters of the top-1 configuration (validated on 4 cutoffs). Hyperparameters were optimised using Bayesian optimisation and the score (see Equation (1)) was used as the ranking criterion for the configurations.
Table 2.
Hyperparameters of the top-1 configuration (validated on 4 cutoffs). Hyperparameters were optimised using Bayesian optimisation and the score (see Equation (1)) was used as the ranking criterion for the configurations.
| Parameter | Top-1 value |
|---|---|
| changepoint_prior_scale | 0.03314 |
| changepoint_range | 0.88956 |
| n_changepoints | 15 |
| daily_fourier | 28 |
| daily_prior_scale | 0.88323 |
| daily_mode | additive |
| weekly_fourier | 14 |
| weekly_prior_scale | 0.73642 |
| weekly_mode | multiplicative |
| yearly_fourier | 13 |
| yearly_prior_scale | 3.28514 |
| yearly_mode | multiplicative |
| holiday_prior_scale | 0.05672 |
| regressor_prior_scale | 2.56482 |
| regressor_mode | additive |
Table 3.
Performance summary across different evaluation scenarios
| Scenario | MAE | RMSE | WAPE% | Coverage | Sharpness | Pinball | Score |
|---|---|---|---|---|---|---|---|
| 4 Cutoffs (Validation) | 5.632 | 8.080 | 7.949 | 0.944 | 35.093 | 1.022 | 8.203 |
| 33 Cutoffs (Aggregated) | 8.202 | 11.061 | 12.267 | 0.856 | 31.746 | 1.295 | 10.904 |
| 24h Holdout (Test) | 6.166 | 8.285 | 8.701 | 0.938 | 36.173 | 0.993 | 8.811 |
| October 2025 (Backtest) | 5.456 | 6.703 | 9.083 | 0.990 | 36.108 | 0.921 | 7.950 |
Disclaimer/Publisher’s Note: The statements, opinions and data contained in all publications are solely those of the individual author(s) and contributor(s) and not of MDPI and/or the editor(s). MDPI and/or the editor(s) disclaim responsibility for any injury to people or property resulting from any ideas, methods, instructions or products referred to in the content. |
© 2026 by the authors. Licensee MDPI, Basel, Switzerland. This article is an open access article distributed under the terms and conditions of the Creative Commons Attribution (CC BY) license (http://creativecommons.org/licenses/by/4.0/).
Copyright: This open access article is published under a Creative Commons CC BY 4.0 license, which permit the free download, distribution, and reuse, provided that the author and preprint are cited in any reuse.


