Submitted:
05 February 2026
Posted:
06 February 2026
You are already at the latest version
Abstract
Urban transportation is a crucial aspect of modern societal development, with bus route optimization playing a central role in urban transit planning. Well-designed bus routes can enhance the efficiency and attractiveness of public transportation, alleviate traffic congestion and pollution, and ultimately contribute to the overall growth of a city. This study investigates the selection of bus stop locations and route optimization from three perspectives: population density, facility distribution, and route length. Firstly, a scheme for optimizing bus stop locations is proposed based on population grid data, Points of Interest (POI), and road network data. Next, candidate points are generated using the road network, and a new heuristic algorithm is introduced to initially establish optimized routes. A nondominated sorting algorithm is then employed to identify the optimal solution set, balancing population coverage, facility accessibility, and route distance. The proposed method for bus stop location and route optimization is universally applicable to urban bus routes and can be validated through case studies in different cities. Finally, an empirical analysis is conducted using Route 119 in Kunming City, Yunnan Province, as a case study. Compared with the original bus route, the optimized route demonstrates improvements of 18.26% in route distance, 15.79% in Points of Interest (POI) accessibility, and 10.53% in population coverage.
Keywords:
bus route optimization
; heuristic algorithm
; multi-objective
; non-dominated sorting
; Kunming City
1. Introduction
Public transportation systems are widely promoted as a solution to mitigate road congestion, reduce travel times, decrease air pollution, and lower energy consumption, owing to their cost-effectiveness, extensive coverage, large capacity, and minimal environmental impac[1]. When integrated into comprehensive economic and land-use planning frameworks, these systems can stimulate commercial development, alleviate urban sprawl, and foster community cohesion through transit-oriented development strategies. Modern transportation infrastructure faces multifaceted challenges stemming from rapid urbanization, population growth, and increasing demands for human mobility. The concept of intelligent transportation, which integrates advanced technologies into transportation applications as envisioned by urban planners, aims to optimize transportation networks and enhance service quality[2]. In the context of Chinese cities, bus systems remain the dominant mode of public transport and serve as essential infrastructure for accessing employment opportunities, educational institutions, retail outlets, healthcare facilities, and social services. However, without regular updates, public transportation services struggle to meet contemporary mobility needs. Empirical evidence indicates that private vehicles and ride-hailing services are increasingly favored over buses due to their greater convenience, comfort, and practicality[3]. To encourage a shift in transportation modes, reduce reliance on private vehicles, and thereby alleviate air and noise pollution, traffic congestion, accident rates, and inefficient road space utilization, strategic improvements to bus route configurations are essential.
The operational efficiency of public transportation systems is influenced by several factors, including minimizing travel time, ensuring safety, enhancing route directness, and adhering to vehicle cleanliness standards[4,5]. Analytical frameworks indicate that travel time, routing efficiency, and service accessibility can be significantly enhanced through optimized network design. Population grid datasets quantify service coverage density, while Points of Interest (POI) data assess facility accessibility, with route distance being the primary determinant of operational duration. Yuanyuan et al. [6] proposed an improved ant colony optimization algorithm, which optimizes the public transport network in Zhengzhou High-Tech Zone using Origin-Destination (OD) data. Similarly,[7] developed a multi-objective approximation model for the simultaneous optimization of bus routes and service frequencies, but their approach mainly focuses on route length, passenger costs, and operator expenses, overlooking the critical interdependence between optimal stop placement and route configuration.. However, their methodology did not address other important optimization objectives. To overcome these limitations, we developed a tri-objective optimization framework that simultaneously maximizes population coverage and POI accessibility while minimizing route distance, which was then validated through empirical implementation.
This study focuses on Route 119 within Kunming's urban transit network, proposing an innovative multi-objective heuristic optimization methodology that integrates multi-source spatial big data for the simultaneous selection of bus stop locations and route planning. Our research approach incorporates road network topology, population grid distributions, and POI datasets to generate candidate stop sets, and then formulates an integer linear programming model with three objective functions: (1) maximization of population coverage, (2) maximization of POI accessibility, and (3) minimization of route distance.
The implementation of an improved heuristic algorithm generated candidate solutions, with non-dominated sorting techniques identifying 19 Pareto-optimal configurations. A comparative analysis demonstrates that the optimized routes lead to significant improvements in population coverage, facility accessibility, and operational efficiency compared to the existing route configuration. The results validate the effectiveness of the proposed methodology in addressing the multi-objective conflicts inherent in urban transit network design, showcasing both theoretical robustness and practical applicability.
2. Related Work
Stop location constitutes a vital component in the design of public transportation networks. Contemporary research typically integrates population grid data, points of interest (POIs), and road network data to address this challenge. Both the placement of candidate stops and the optimization of routes are fundamental aspects of modern urban transport planning, necessitating a careful balance of multiple objectives to improve system efficiency and passenger experience. Traditional single-objective models, constrained by their limited scope, have gradually been replaced by multi-objective optimization, which has become the prevailing approach for enhancing transit systems. Moreover, the widespread availability of big data has empowered various algorithms to deliver innovative solutions for the optimization of bus routes and networks. This paper reviews three categories of relevant studies, supplemented by empirical case studies, and provides a detailed analysis as follows.
2.1. Optimization Methods for Bus Stop Location
Stop location is a critical component of public transport network design. Existing studies often integrate population grid data, points of interest (POIs), and road network data to model location problems. For example,[8] proposed an improved multi-objective method for selecting autonomous taxi stop locations, employing clustering and genetic algorithms to optimize demand-point coverage and construction costs, while enhancing POI data analysis. However, this approach overlooks dynamic passenger flow allocation and user choice behavior. [9] examined pedestrian accessibility around metro stations and developed an audit tool-based indicator system encompassing safety and comfort, though their study focused on micro-level factors without incorporating multi-source geographic data. [10] introduced a transport system selection model based on multi-attribute utility theory (MAUT), proposing a multi-actor, multi-criteria decision-making framework, which they applied to a case study of Bangkok’s feeder system. Our research advances stop location flexibility and real-time adaptability by integrating population grids, POIs, and road network data with dynamic heuristic algorithms.
2.2. Heuristic Algorithm Frameworks for Bus Route Optimization
Bus route optimization often involves NP-hard problems, prompting researchers to adopt heuristic algorithms to obtain near-optimal solutions. Classic heuristics are widely applied: [11] developed a hybrid Route Generation Algorithm (RGA), guided by demand matrices and planner expertise, to reduce the search space; however, their model assumes static demand. [12]proposed a novel alternating objective genetic algorithm to identify the Pareto optimality between user and operator costs. Furthermore, they introduced a novel benchmarking and reporting framework to facilitate consistent cross-method comparisons and establish a taxonomy for heuristic approaches. However, their work primarily focuses on travel time optimization and does not adequately account for residents’ accessibility and convenience in transit planning.[13] enhanced urban bus routing using a heuristic that combines POI-based initial solutions with a metaheuristic search, validated in real-world environments, although it remains decoupled from stop location considerations.
Existing literature often treats stop location and route optimization as separate problems. while [14] focused on network design to minimize total costs. Genetic algorithms are widely employed [15,16]developed a reinforcement learning framework for metro network expansion, incorporating considerations of equity and accessibility. [17] dynamically adjusted customized bus routes within 0.38 seconds, balancing service rates and profitability. [18] optimized metro-bus network topology using big data, while [19] addressed flexible bus routing through a gravity model. [20] predicted passenger destinations using smart card and GPS data in Shenzhen.
2.3. Multi-Objective Algorithms in Transit Optimization
Multi-objective optimization necessitates balancing competing goals, with non-dominated sorting algorithms (e.g., NSGA-II) serving as key tools.[21] integrated a two-stage multi-objective heuristic method based on the Non-dominated Sorting Genetic Algorithm II (NSGA-II) to optimize the total in-vehicle time, waiting time for all passengers, and the overall transfer distance. However, this approach did not incorporate Points of Interest (POI) as a factor in the optimization. [22]reduced metro energy consumption by 24.4% and improved travel time using NSGA-II, though their approach overlooked demand dynamics.[23] optimized rail service routing using cross-entropy methods to minimize waiting times, but did not account for stop location.[24] proposed MOEA-OSD to address congestion-prone passenger behavior, though scalability issues persisted. [25] focused on population coverage in frequency optimization. [26] prioritized public transport lane networks, and [27] developed MO-AVNS for handling disruption scenarios.
2.4. Empirical Case Studies
Case studies validate algorithms: [28] integrated a stop-skipping strategy with local route optimization and proposed a GA-SA hybrid algorithm to reduce both passenger and operational costs. The approach was validated using the case of Route 115 in Ganzhou, Jiangxi Province, demonstrating an 11% improvement in travel speed. In multi-objective optimization studies, [21] and [12] utilized NSGA-II and an alternating objective genetic algorithm, respectively, to optimize the design of airport shuttle bus networks, with the latter achieving a 5–6% improvement in Pareto solutions. Meanwhile, the team led by [29] introduced an innovative H-RL-VaNSAS algorithm, which enhanced the resilience index of tourist bus services by 12.24–17.02%. [30] proposed a demand-elasticity framework without integrating algorithmic methods.[31] introduced a system-level approach based on genetic algorithms to optimize bus transfer times, validating the method using scheduling data from Broward County Transit in Florida, which demonstrated significant reductions in transfer times.
To summarize the related work, bus route optimization involves three core interrelated components: stop location selection, heuristic algorithm-driven route generation, and multi-objective trade-off balancing. Existing stop location studies have integrated multi-source spatial data but often overlook dynamic demand allocation and real-time adaptability; heuristic algorithms for route optimization have achieved near-optimal solutions for NP-hard problems but frequently decouple stop location from route design or lack multi-objective frameworks; multi-objective optimization methods represented by non-dominated sorting algorithms have been applied to transit network design, yet many ignore the interdependence between stop placement and route configuration or fail to address demand dynamics. Additionally, most existing studies treat stop location and route optimization as separate tasks, and few have established a tri-objective framework that simultaneously maximizes population coverage, POI accessibility, and minimizes route distance. To fill these gaps, this study integrates population grid data, POI information, and road network topology, develops a constrained heuristic algorithm that unifies stop selection and route generation, and employs non-dominated sorting to identify Pareto-optimal solutions, thereby addressing the multi-objective conflicts in urban bus route planning.
3. Study area and Datasets
3.1. Study Area
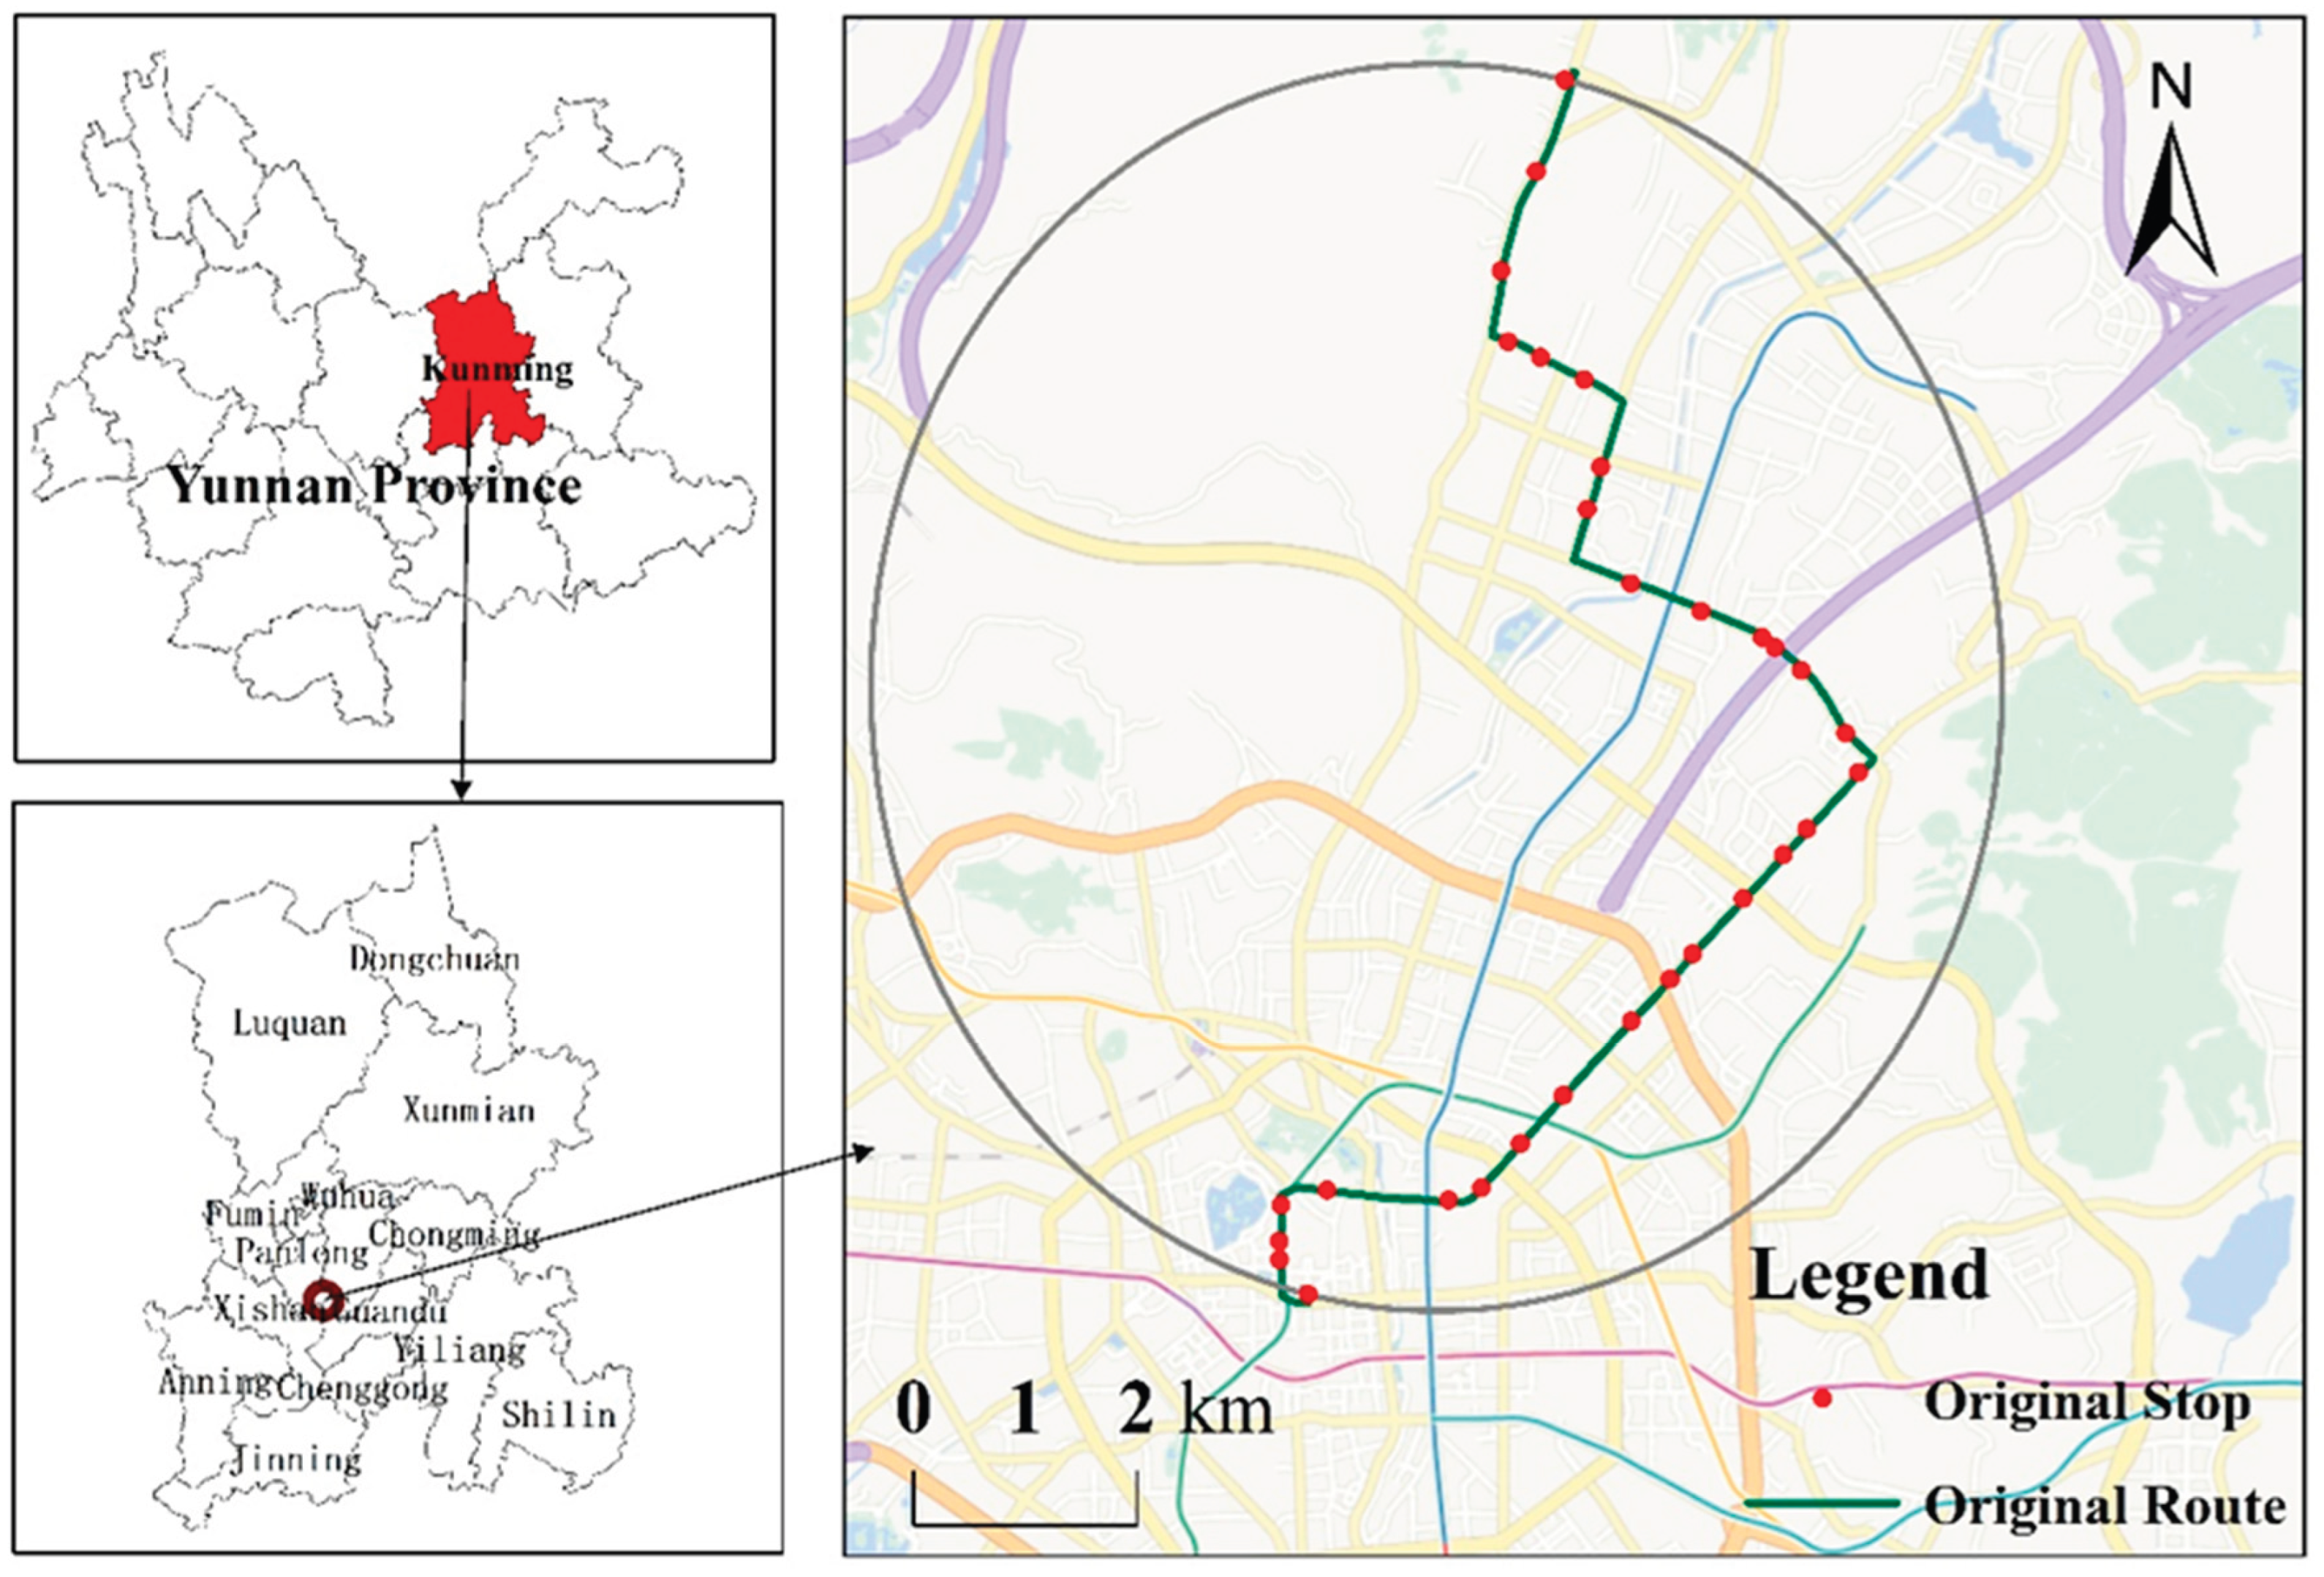
The coverage along bus route 119 in Kunming, Yunnan Province, was selected as the study area, focusing on a key north-south corridor that connects the North City Depot with Kunming Railway Station. This route passes through major urban roads, including Beijing Road and Huancheng North Road, and serves as a vital north-south bus corridor in the city’s central urban area.
Bus Route 119 serves residential areas, transportation hubs, and commercial districts. However, due to Kunming's "single-center, ring-shaped" expansion and the growing scale of newly developed areas, certain communities within the route's coverage, such as those along the Beijing Road Extension, are left without adequate bus service. Since the route’s establishment, a noticeable imbalance in passenger flow has emerged within its service radius, highlighting the need for route optimization and an improved feeder system. The rapid urban expansion along the Beijing Road Extension has led to newer residential zones being underserved, despite being within the nominal service radius of the route. Furthermore, the location of some candidate stops fails to consider nearby public facilities, such as parks, subway stations, and shopping malls. As a result, some passengers must walk long distances after alighting to reach their destinations, causing inconvenience to their daily commutes. Additionally, certain candidate stops are located too close to intersections, making it difficult for drivers to enter and exit the stops. Therefore, the operational efficiency of this route requires improvement, and adjustments to the layout of its stops are necessary.
Figure 1.
Location map of the study area.
3.2. Dataset
The data preparation for this study involved road network data, public transit data, population density data, and point-of-interest (POI) data for the study area in Kunming City, Yunnan Province. These datasets were sourced from OpenStreetMap (OSM), Amap (Gaode Map), and the World Pop Global Project, respectively.
The road network data primarily includes road nodes, edges, road classifications, and related attributes, while the public transit data encompasses route lines and stops. The population density data is provided in a gridded format, with population counts for each grid cell (e.g., 100m×100m). The population data from each grid cell serves as the primary basis for determining population coverage at candidate stops.
The POI data mainly includes facility names, categories, geographic coordinates (latitude/longitude), addresses, and other relevant information. The geographic coordinates and location details enable the evaluation of the rationality of candidate stops and assessments.
4. Methodology
The above is the research framework of this study, multi-source big data such as population data, road networks, and points of interest (POIs) were acquired. The candidate set of generated routes was then obtained, and the final set of routes, was selected based on POI data, population density, and route distance. A mathematical model was developed using integer linear programming to achieve the three objectives. Subsequently, a heuristic algorithm was employed to filter the candidate points and generate the candidate paths. Finally, non-dominated sorting was applied to determine the optimal path based on the three objectives.
Figure 2.
The flowchart of the research process.
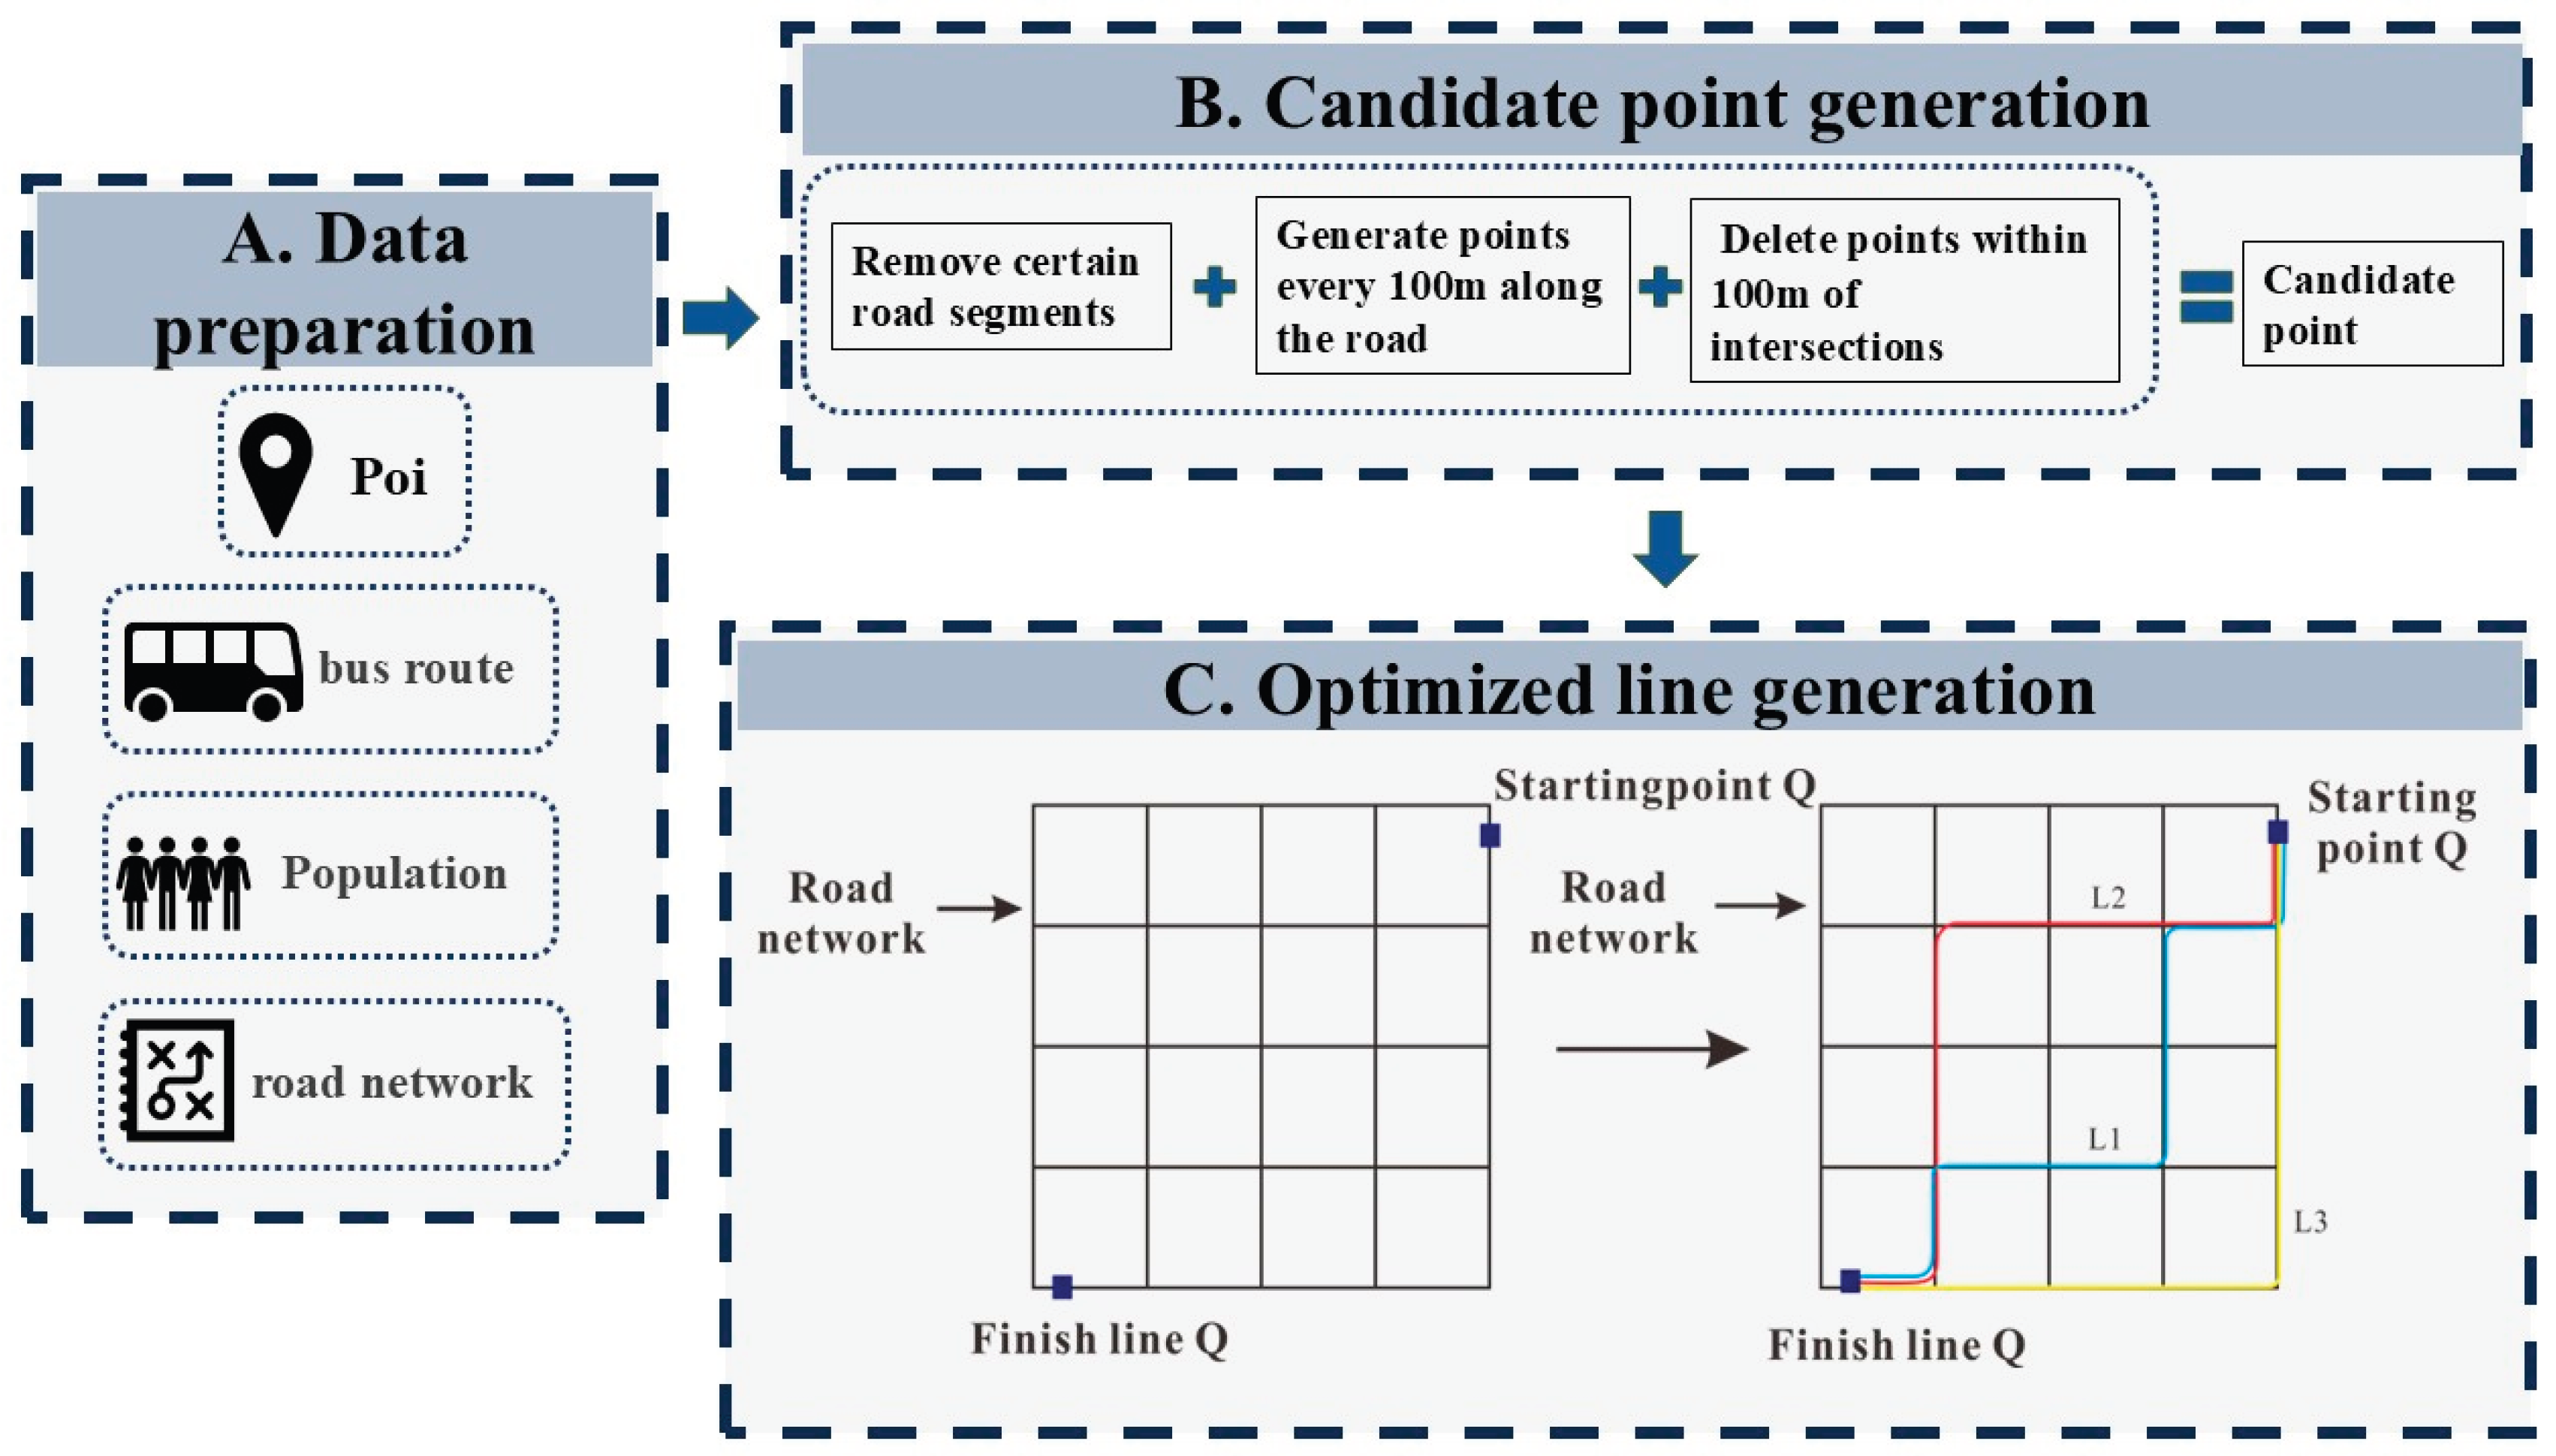
4.1. Candidate Selection
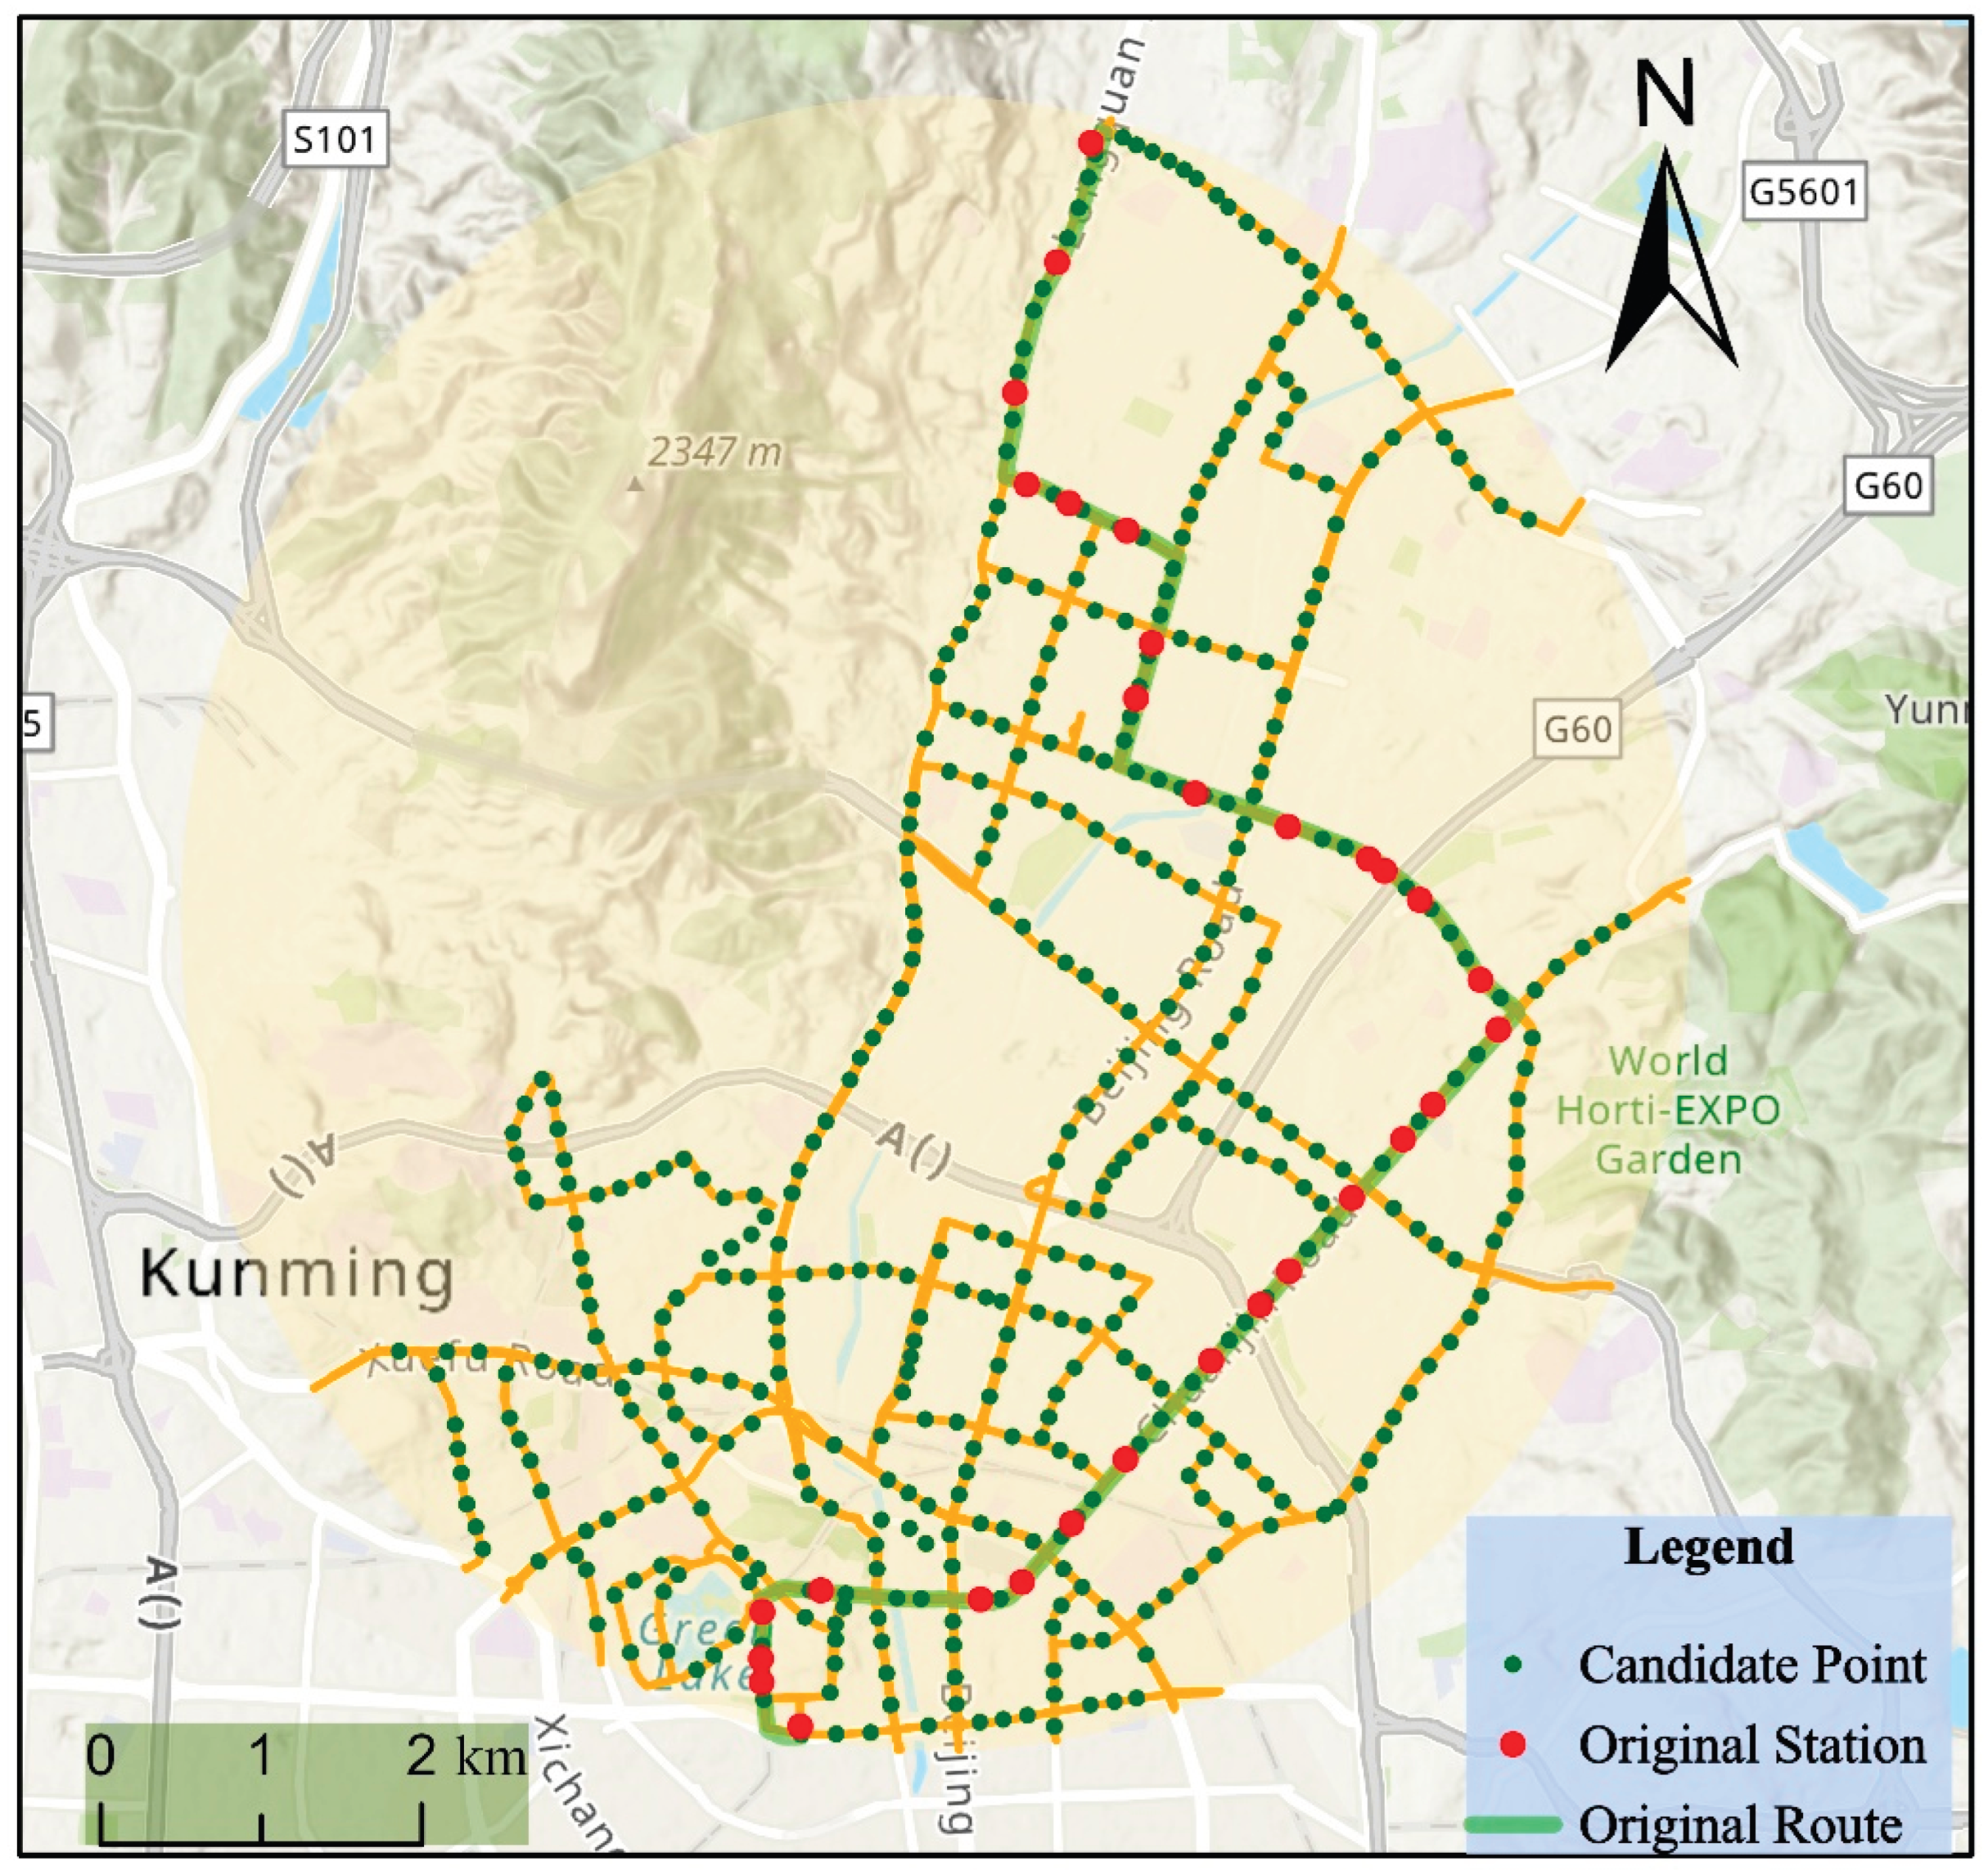
The main bus candidate stops were generated along road lines. To prevent candidate stops from deviating from the optimal route or causing excessive detouring between the origin-destination (O-D) pair, we filtered the road networks within the circle, retaining only the urban arterial roads (secondary roads) and removing side roads and walking paths. Candidate stopswere systematically deployed at 100-meter intervals along the identified roadway corridors to optimize service coverage and operational flexibility. Additionally, to ensure passenger safety when boarding and alighting, intersections and any points within a 200-meter radius of intersections were excluded. The resulting distribution of candidate points is shown in the figure.
Figure 3.
Schematic Illustration of Candidate Points.
4.2. Indicator Aggregation
To select the final stops from the candidate stops and generate optimal routes, a systematic evaluation of the candidate points is required. Research has demonstrated that population density is a critical optimization objective in bus route planning [32,33] . Maximizing population coverage ensures that candidate stops serve high-demand areas, thereby enhancing the accessibility of public transport [30,34].
The density of Points of Interest (POIs) serves as a quantifiable proxy for land use intensity and regional development levels [20]. Consequently, maximizing POI coverage within stop service areas ensures that transit routes pass through the most urbanized and economically vibrant districts. Additionally, in route planning, route distance is also an important metric, as it affects construction costs, operational costs, passenger travel costs, and route efficiency [15,26]. The specific methodology involves quantifying the population count and POI count within a 500-meter buffer zone of each candidate stop, and calculating the total route length after route generation.
The population data obtained from World Pop is based on 100m×100m raster grids. To calculate the population count within a 500-meter radius of candidate stops, a spatial link must be established between the candidate points and the population grids, followed by the aggregation of the total population covered by each stop. The formula is as follows:
: Set of candidate stops in the study area
: Set of all population grid sets in the study area
: Total population at candidate location i
: Population grid cells within a 500-meter radius of candidate location i
The method for calculating the number of Points of Interest (POIs) within the buffer area of candidate stops is identical to that used for population estimation. The formula is as follows:
: Point of Interest (POI) set in the study area
: Point of Interest (POI) count at candidate location i
: Point of Interest (POI) count within 500-meter radius of candidate location i
Notably, the distance must be calculated after the route has been generated. The formula is as follows:
: Euclidean distance between stop i and stop j(Total length of candidate paths)
n: Total number of stops along the route
: i-th stop location
: Distance between stop i and stop j
4.3. Network Generation
Generate Bus Routes
In order to select the optimal path from multiple options, heuristic algorithms are required. These paths are generated based on the set of candidate points. During the path generation phase of the study, the creation of a directed graph is a fundamental step. In the generated directed graph, the nodes represent the selected points, and the edges connect the paths between every two selected points. The primary objective of the directed graph creation algorithm is to establish spatial geometric constraints and construct a candidate route directed graph from the input candidate stops. This graph includes potential candidate stops and their sequencing, serving as the foundation for route generation. The constraints of the heuristic algorithm primarily involve stop spacing, directionality, and the total number of route stops, with the specific constraints outlined as follows:
- 1.
- Moderate Distance Between Consecutive Stops: Adjacent candidate stops should maintain an optimal spacing interval. According to the Chinese National Standard GB 55011-2021 "Code for Urban Road Engineering Construction Projects", the recommended spacing between candidate stops in urban areas typically ranges from 300 to 800 meters. This range strikes a balance between pedestrian accessibility and operational efficiency. Excessively short spacing increases stop density, which in turn reduces traffic flow speeds and raises accident risks. Conversely, excessively large gaps reduce service coverage, inconvenience residents, and lower ridership. Specifically, the inter-stop distances must satisfy the following conditions:
:The set of nodes to be selected for path generation
:The selected point m
:The next point of the selected point m
:Distance between stop m and stop m+1
- 2.
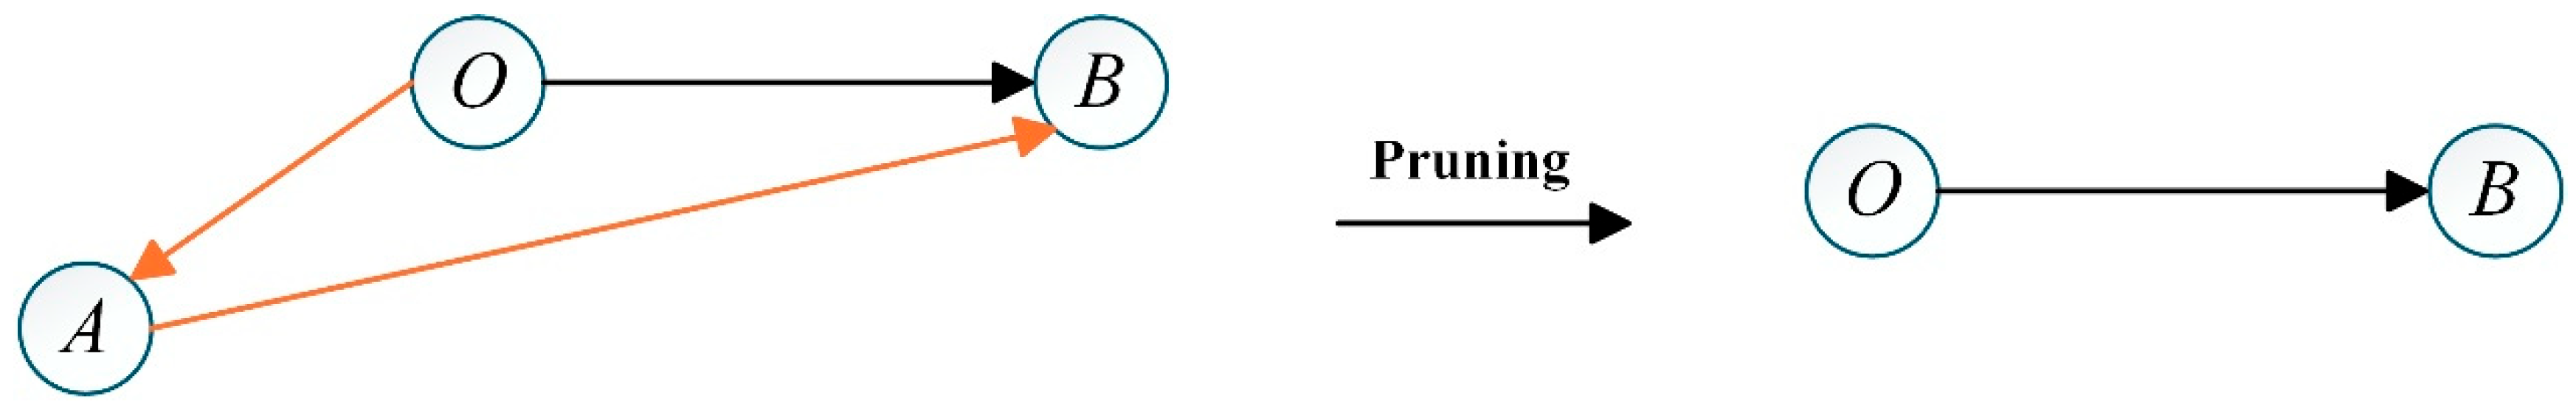
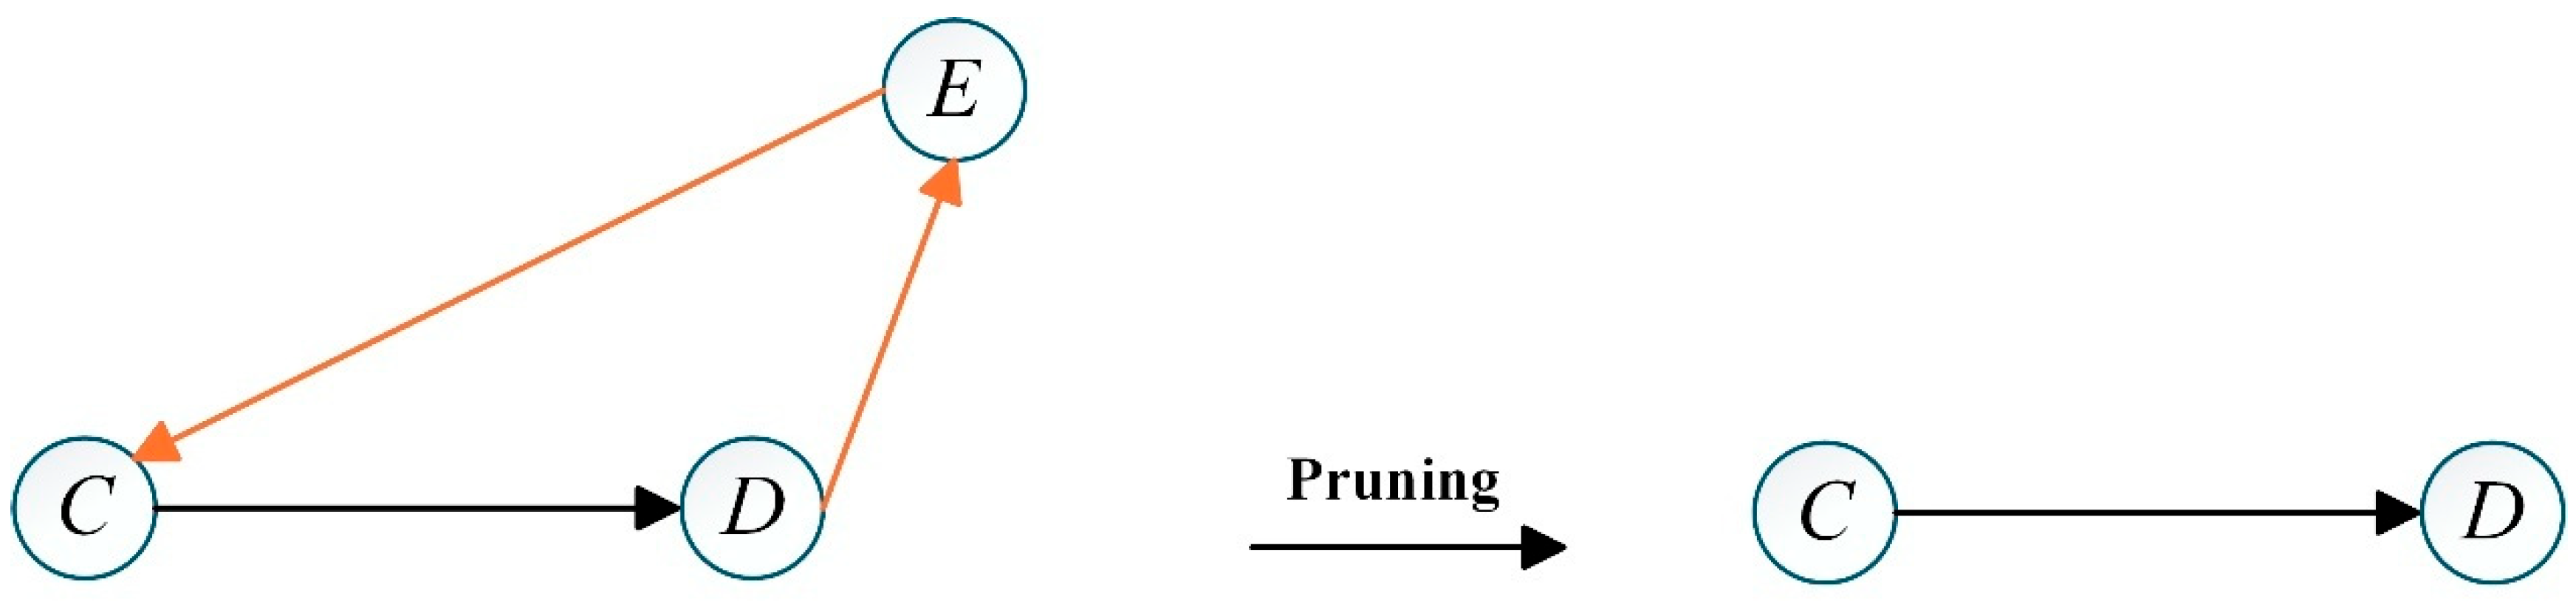
- Progression Toward the Destination: To ensure logical and efficient route planning, the bus route must maintain consistent forward progression towards the final destination. To prevent the final path from significantly deviating from the target direction, the route should not include unnecessary detours, sharp turns, or looping segments. To enforce this, the forward direction of the bus route should not deviate excessively. As illustrated in the following diagram, assume a route is planned from O to D. The current stop is O, and the bus route's forward direction should align with the positive direction of the Xₙ axis. The next selected stop, A, must satisfy two conditions: (1) it must lie on the same side of the Yₙ axis as O, and (2) the straight-line distance from intermediate stop A to stop D must be shorter than the straight-line distance from stop O to stop D. This restriction prevents the bus from making sudden directional changes or backtracking, which would otherwise increase travel time, reduce operational efficiency, and negatively impact passenger experience. Therefore, the schematic diagram is shown below:
Figure 4.
Schematic Illustration of Constraint 2.
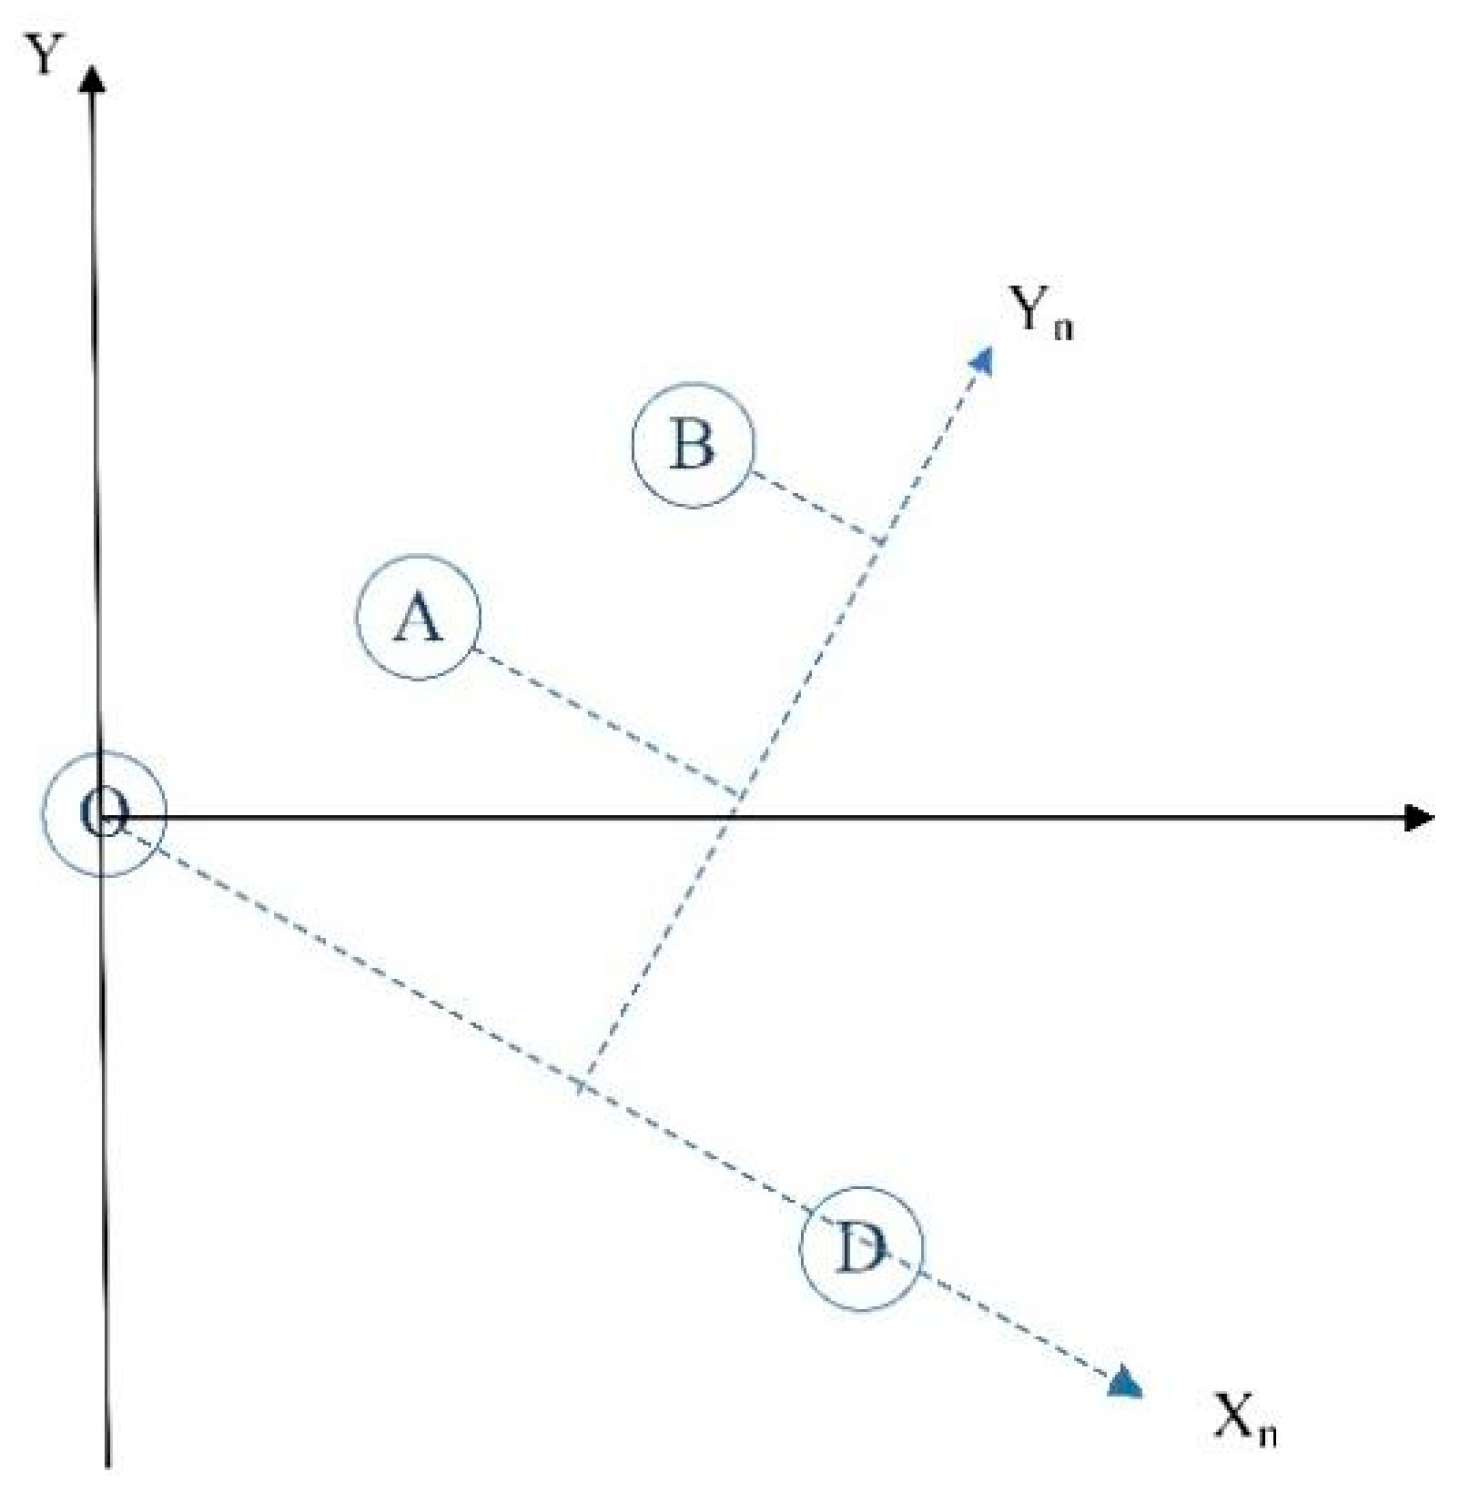
As shown in the schematic diagram, the constrained objective function is:
: The length of segment AD, which in this paper refers to the Euclidean distance between station A and station D.
: The length of segment OD, which in this paper refers to the Euclidean distance between station O and station D.
- 3.
-
Increasing Distance from the Origin: To maintain logical and efficient route progression, the position of each new bus stop must be farther from the starting point (Stop 1) than the previous one along the actual route path. This ensures steady forward movement from the origin, preventing inefficient routing patterns such as circular paths, backtracking, or zigzag segments that would create unnecessary travel distance and time.By enforcing this condition, the route guarantees cumulative progress in one primary direction while still allowing necessary turns within reasonable limits. This principle helps avoid redundant path segments, ensures a better passenger experience by providing clearer trip progression, and aids in preventing unnecessary congestion by minimizing route deviations. Therefore, the distance between stations should satisfy the following conditions:
Figure 5.
Schematic Illustration of Constraint 3.
: First stop (starting stop) on the bus route
:Distance between stop m and the first stop (stop O)
- 4.
- Decreasing Distance to the Destination: To ensure efficient and passenger-friendly route planning, the location of each new bus stop must be closer to the final destination (D) than the previous stop when measured in straight-line distance. This requirement works in tandem with the forward progression rule (moving away from the origin). This condition ensures steady progress towards the destination while allowing necessary turns and adjustments to serve key locations. The combination of moving away from the origin while progressing towards the destination creates optimal route geometry that meets both operational requirements and passenger needs. Therefore, the distance between stations should satisfy the following conditions:
Figure 6.
Schematic Illustration of Constraint 4.
: Last stop (destination stop) on the bus route
: Distance between stop m and the last stop (stop D)
- 5.
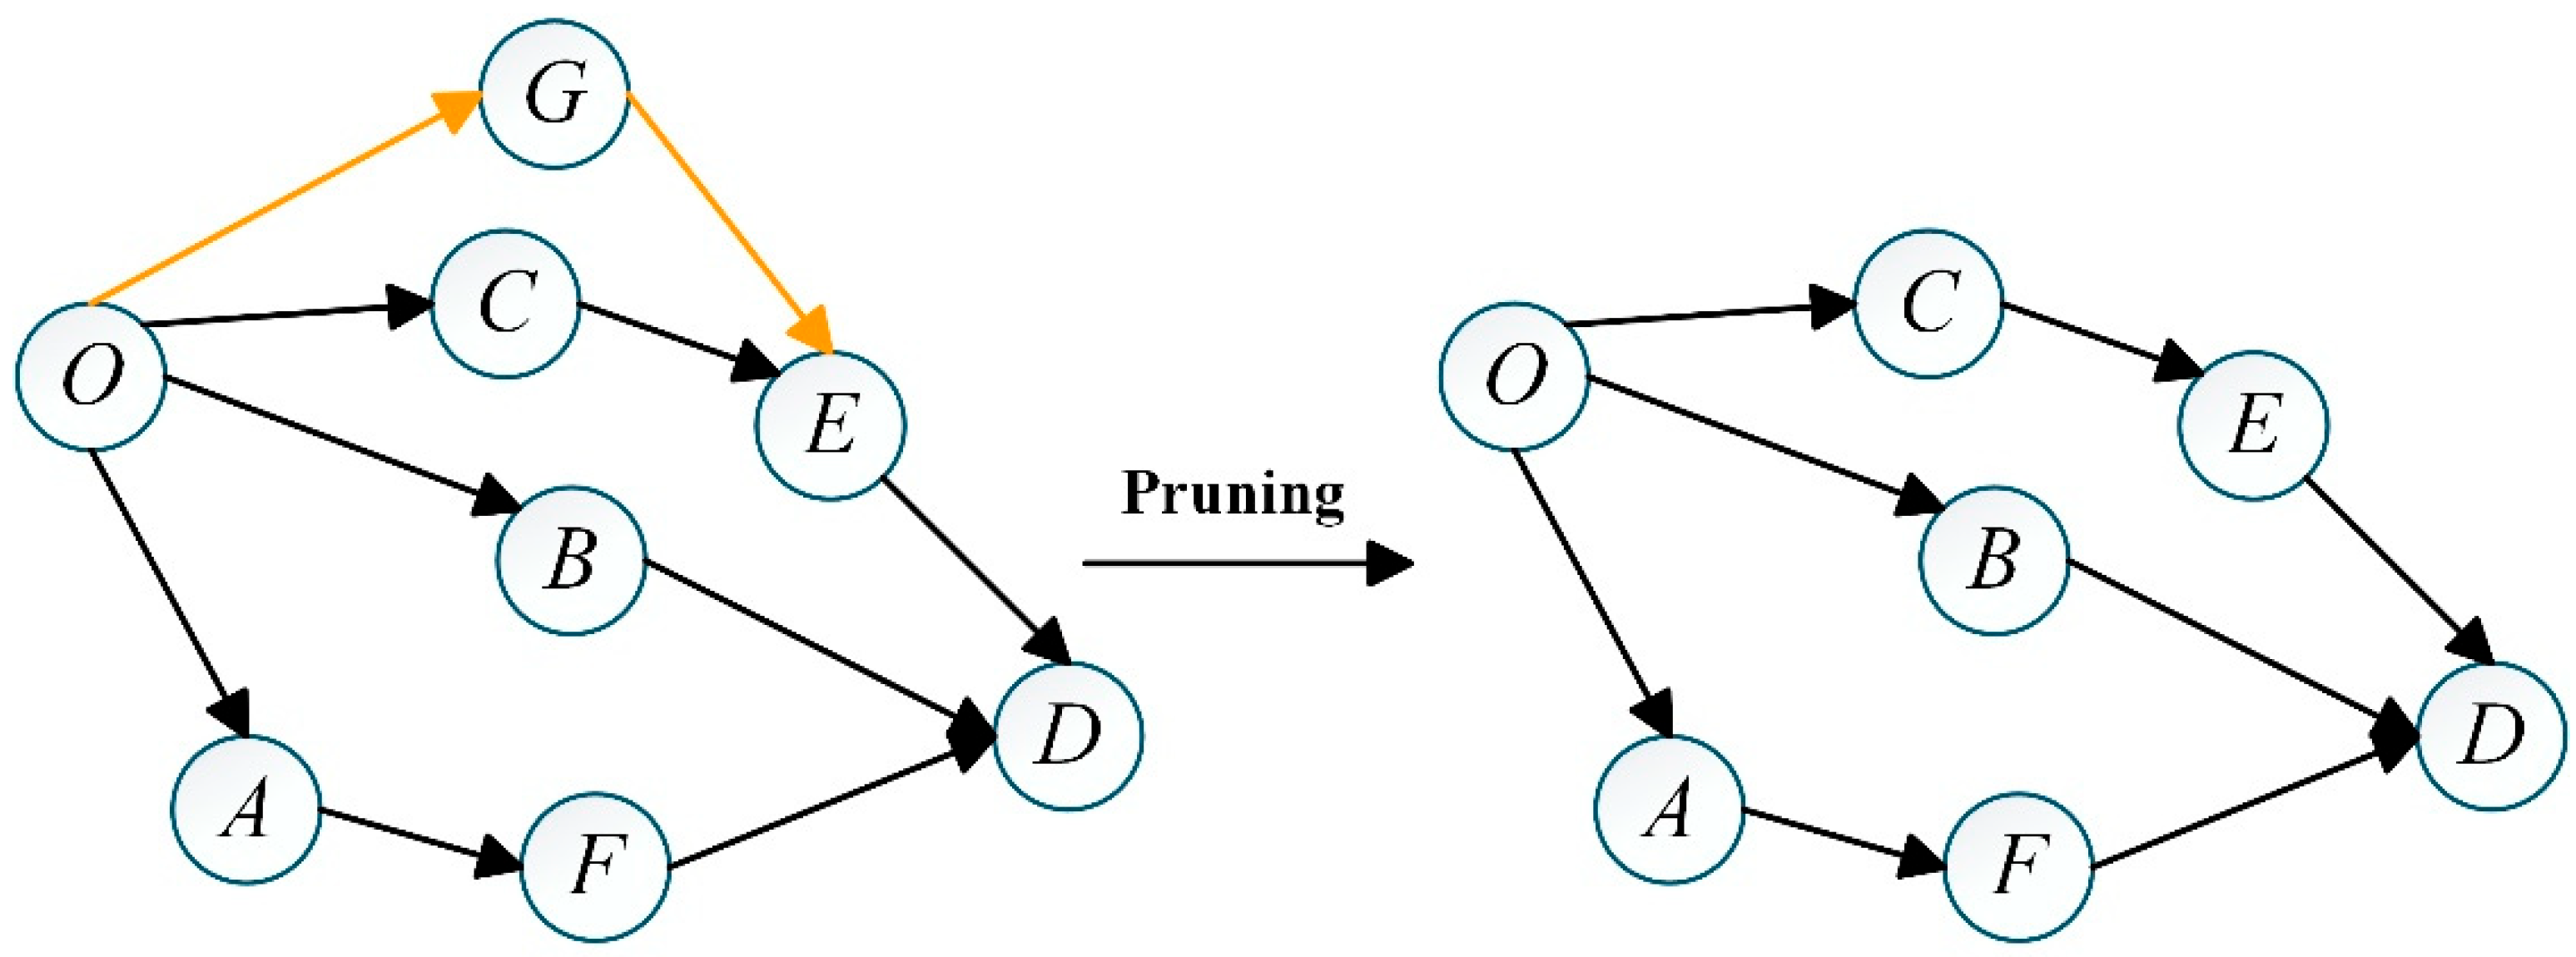
- Smooth Route with Minimal Detours: The bus route should maintain smooth transitions between stops, avoiding sharp turns or unnecessary detours. This is achieved by selecting each subsequent stop () as the nearest feasible location to the current stop (), while still adhering to directional progression requirements. By minimizing the distance between consecutive stops and prioritizing the closest valid candidate point, the route naturally forms gentler curves. This approach not only improves passenger comfort but also reduces fuel consumption and travel time. The smooth geometry enhances operational efficiency, as drivers can maintain more consistent speeds without frequent braking or acceleration caused by sudden directional changes. Therefore, the route must satisfy the following geometric conditions to maintain optimal smoothness:
- 6.
:Among all possible (Gₘ, Gₙ) pairs, the pair with the minimal distance from Gₘ to Gₙ)
- 7.
- As shown in the figure below, the Z-shaped path will be pruned by this constraint. For the path from point O to E, since G is more distant than C, the path segments O-G and G-E are pruned.
Figure 7.
Schematic Illustration of Constraint 5.
By incorporating these constraints and objectives, the generated bus routes will be optimised for efficiency, accessibility, and smoothness, ultimately enhancing the overall performance of the urban bus system.
4.4. Problem Modeling
To address the bus stop location optimization problem identified in the aforementioned research, this study formulates the practical problem as an integer linear programming (ILP) model. The specific mathematical formulations are presented below:
Subjected to
: Total Population within the threshold area of the candidate i
: Total POI count within the threshold area of candidate i
: Set of candidate points
: the number of stations must be selected
:decision variable: The binary decision variable associated with selection decisions, where if stop i is selected, and otherwise.
The proposed multi-objective bus stop location and route generation model considers three objective functions, integrating three optimization goals, with the aim of selecting the best combination of stop locations. The objective function f_1 (x_i ) maximizes the population coverage within the service area to ensure that the public transportation system serves a larger number of residents. The objective function f_2 (x_i ) eeks to maximize the number of public facilities covered, thereby enhancing the comprehensive utility of the stop services. The objective function f_3 (x_i ) aims to minimize the distance between stops, thus generating the route with the shortest total distance. A constraint is added to specify the predetermined number of stops. In summary, this model selects the optimal combination of candidate stops to maximize the three objective functions.
In the road network generation phase of the study, a directed graph is first constructed to represent connectivity and potential routes within the urban area. The subsequent step involves generating multiple candidate paths based on three key metrics: points of interest (POI) coverage, population coverage, and route distance. These metrics are critical for assessing the effectiveness and efficiency of the generated bus routes. POI coverage measures the potential travel demand reflected by key locations such as commercial centers, schools, and hospitals; population coverage evaluates the number of residents served by the route; and route distance quantifies the total length of the path, which directly impacts operational costs and travel time.
Non-dominated sorting classifies solutions based on their performance across three objectives, ensuring that no solution in the resulting Pareto front can be improved in any objective without deteriorating at least one other objective. A solution is considered Pareto-optimal if it is not dominated by any other solution in terms of POI coverage, population coverage, and route distance. This process yields a set of optimal trade-off solutions, known as the Pareto front, where each solution represents a unique equilibrium among the three objectives. By employing this methodology, the optimization process ensures that the final bus routes maximise service quality and efficiency while adhering to the predefined constraints and objectives.
4.5. Algorithm Analysis
The aforementioned multi-objective integer linear programming model belongs to the class of NP-hard problems, and solving large-scale integer linear programming models incurs extremely high computational costs. Therefore, this study designs a heuristic algorithm to efficiently obtain high-quality approximate optimal solutions. The research employs a multi-objective optimization approach to evaluate and select bus routes, utilizing the non-dominated sorting method to extract candidate paths from the Pareto optimal solution set.
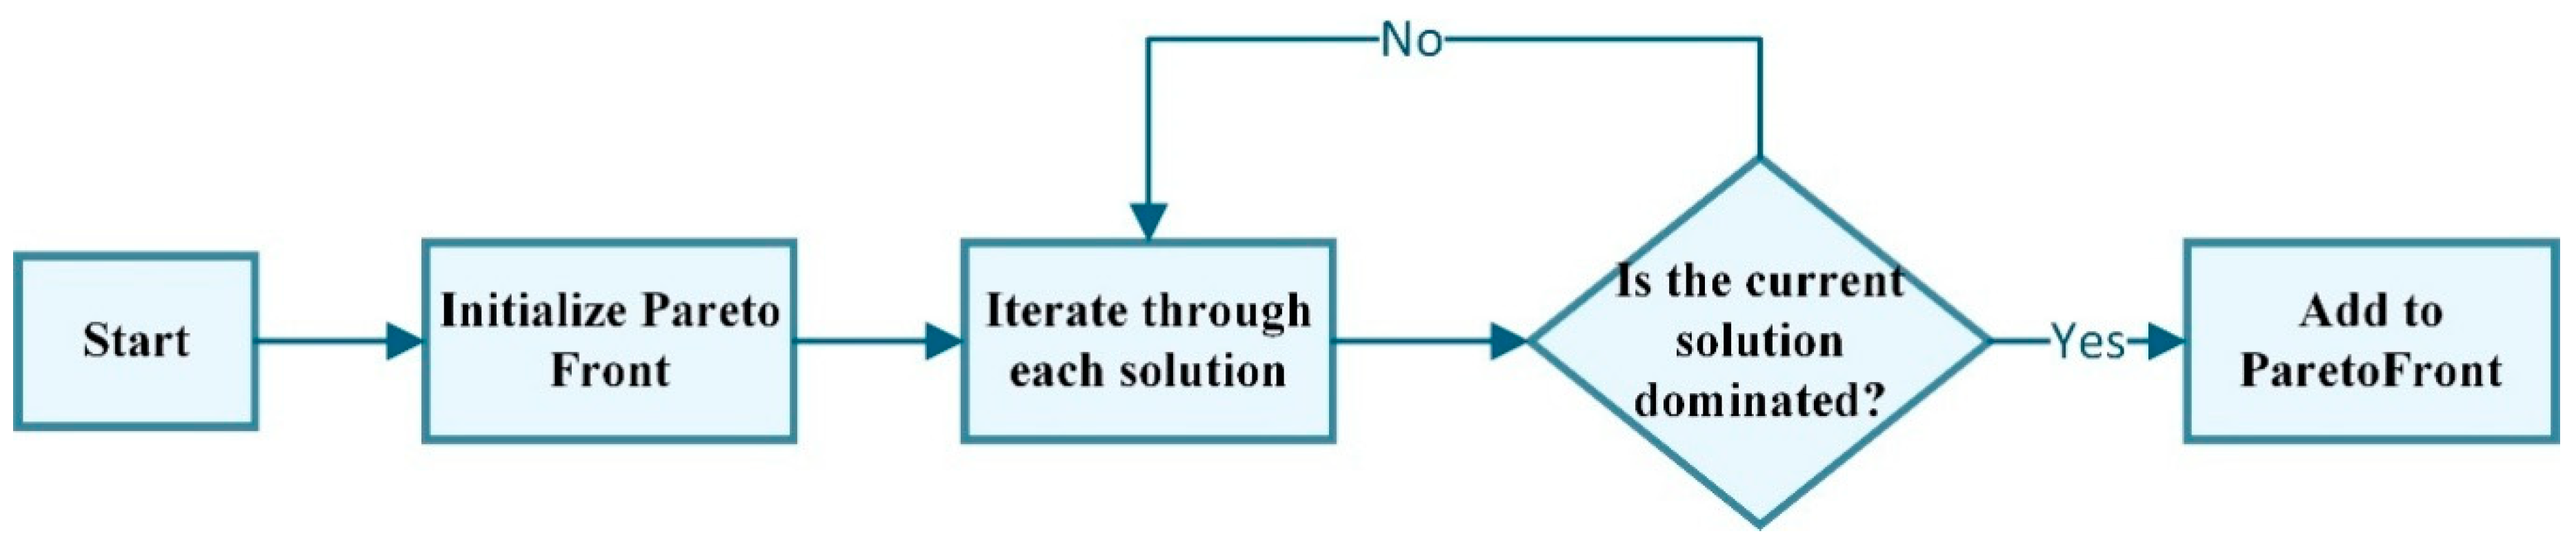
The algorithm first calculates three key metrics for each route: population coverage (Pop), point-of-interest (POI) coverage, and total distance (Dist.). It then filters solutions by determining dominance relationships to identify Pareto front solutions that are not dominated by any other solution across all objectives. Finally, the spatial distribution of the optimal routes is visualized. Below is a simplified algorithm flowchart and a section of the algorithm code.
Figure 8.
Flowchart of the Algorithm.
The heuristic algorithm implementation is presented in the following code segment:
| Algorithm 1: Pathfinding with DFS and Constraints |
| Input:Excel file with stations, MinDistance, MaxDistance, max_paths |
| Output:Found paths from 'O' to 'D' (up to max_paths) |
| 1: function read_stations_from_excel(xlsx_file_path) |
| 2: df ← read Excel file |
| 3: stations ← {row['ID']: (row['X'], row['Y']) for each row in df} |
| 4: return stations |
| 5: end function |
| 6: function dist(p1, p2) |
| 7: return sqrt((p1[0] − p2[0])² + (p1[1] − p2[1])²) |
| 8: end function |
| 9: function can_move(curr_id, next_id, stations, MinDist, MaxDist) |
| 10: d ← dist(stations[curr_id], stations[next_id]) |
| 11: if d < MinDist or d > MaxDist then return false |
| 12: if dist(stations['O'], stations[next_id]) ≤ dist(stations['O'], stations[curr_id]) then return false |
| 13: if dist(stations['D'], stations[next_id]) ≥ dist(stations['D'], stations[curr_id]) then return false |
| 14: return true |
| 15: end function |
| 16: function smooth_constraint(next_id, path, stations) |
| 17: distances ← [(dist(stations[next_id], stations[pid]), pid) for pid in path] |
| 18: closest_id ← min(distances)[1] |
| 19: return closest_id == path[-1] |
| 20: end function |
| 21: function valid_next_station(path, candidate, stations, MinDist, MaxDist) |
| 22: if candidate in path or not can_move(path[-1], candidate, stations, MinDist, MaxDist) then return false |
| 23: if not smooth_constraint(candidate, path, stations) then return false |
| 24: return true |
| 25: end function |
| 26: function dfs_all_paths(current_path, stations, MinDist, MaxDist, max_paths) |
| 27: if current_path[-1] == 'D' then |
| 28: add current_path to found_paths |
| 29: if length(found_paths) ≥ max_paths then return true |
| 30: return false |
| 31: end if |
| 32: for each next_id in stations do |
| 33: if next_id ≠ 'O' and valid_next_station(current_path, next_id, stations, MinDist, MaxDist) then |
| 34: append next_id to current_path |
| 35: if dfs_all_paths(current_path, stations, MinDist, MaxDist, max_paths) then return true |
| 36: pop from current_path |
| 37: end if |
| 38: end for |
| 39: return false |
| 40: end function |
| 41: function write_routes_to_csv(routes, csv_file_path) |
| 42: open csv_file_path for writing |
| 43: write header to CSV |
| 44: for each route in routes do |
| 45: write route index and path to CSV |
| 46: end for |
| 47: end function |
| 48: if __name__ == "__main__" then |
| 49: stations ← read_stations_from_excel('path_to_excel_file') |
| 50: MinDist ← 300, MaxDist ← 800, max_paths ← 30 |
| 51: start_path ← ['O'] |
| 52: dfs_all_paths(start_path, stations, MinDist, MaxDist, max_paths) |
| 53: write_routes_to_csv(found_paths, 'output_file_path') |
| 54: print "Found ", len(found_paths), " paths" |
| 55: end if |
The non-dominated sorting implementation is shown in the following code block:
| Algorithm 2: ParetoPathOptimization |
| Input:Excel file with station data, CSV file with found paths |
| Output:Pareto Front solutions (non-dominated paths) |
| 1: function read_station_info(xlsx_file) |
| 2: df ← read Excel file |
| 3: coord_map, pop_map, poi_map ← {}, {}, {} |
| 4: for each row in df do |
| 5: coord_map[row['ID']] ← (row['X'], row['Y']) |
| 6: pop_map[row['ID']] ← row['pop'] |
| 7: poi_map[row['ID']] ← row['poi'] |
| 8: end for |
| 9: return coord_map, pop_map, poi_map |
| 10: end function |
| 11: function dist(p1, p2) |
| 12: return sqrt((p1[0] − p2[0])² + (p1[1] − p2[1])²) |
| 13: end function |
| 14: function compute_route_metrics(route_str, coord_map, pop_map, poi_map) |
| 15: stations_in_route ← split(route_str, '->') |
| 16: total_pop ← sum(pop_map[st] for st in stations_in_route) |
| 17: total_poi ← sum(poi_map[st] for st in stations_in_route) |
| 18: total_dist ← 0 |
| 19: for i ← 0 to len(stations_in_route) - 2 do |
| 20: total_dist += dist(coord_map[stations_in_route[i]], coord_map[stations_in_route[i+1]]) |
| 21: end for |
| 22: return total_pop, total_poi, total_dist |
| 23: end function |
| 24: function dominates(sol_a, sol_b) |
| 25: f1a, f2a, f3a ← -sol_a['Pop'], -sol_a['POI'], sol_a['Dist'] |
| 26: f1b, f2b, f3b ← -sol_b['Pop'], -sol_b['POI'], sol_b['Dist'] |
| 27: return (f1a ≤ f1b) and (f2a ≤ f2b) and (f3a ≤ f3b) and (f1a < f1b or f2a < f2b or f3a < f3b) |
| 28: end function |
| 29: function non_dominated_sort(solutions) |
| 30: pareto_front ← [] |
| 31: for each sol in solutions do |
| 32: dominated ← false |
| 33: for each other in solutions do |
| 34: if dominates(other, sol) then |
| 35: dominated ← true |
| 36: break |
| 37: end if |
| 38: end for |
| 39: if not dominated then |
| 40: pareto_front.append(sol) |
| 41: end if |
| 42: end for |
| 43: return pareto_front |
| 44: end function |
| 45: function write_routes_to_csv(routes, csv_file_path) |
| 46: open csv_file_path for writing |
| 47: write header to CSV |
| 48: for each route in routes do |
| 49: write route index and path to CSV |
| 50: end for |
| 51: end function |
| 52: dfs_all_paths(start_path, stations, MinDist, MaxDist, max_paths) |
| 53: write_routes_to_csv(found_paths, 'output_file_path') |
| 54: print "Found ", len(found_paths), " paths" |
| 55: end if |
| 56: for each row in df_paths do |
| 57: total_pop, total_poi, total_dist ← compute_route_metrics(row['Route'], coord_map, pop_map, poi_map) |
| 58: solutions.append({'PathIndex': row['PathIndex'], 'Route': row['Route'], 'Pop': total_pop, 'POI': total_poi, 'Dist': total_dist}) |
| 59: end for |
| 60: pareto_front ← non_dominated_sort(solutions) |
| 61: print "Pareto Front:", pareto_front |
| 62: write_routes_to_csv(pareto_front, 'output_csv_path') |
| 63: end if |
5. Result
5.1. Spatial Distribution Characteristics of Candidate Stop Locations
The generation of candidate points focuses on two primary objectives: Points of Interest (POI) and population density. Therefore, data processing and analysis were conducted for both target datasets. Based on the processing of POI data and population raster data, hotspot maps and spatial autocorrelation analysis diagrams were generated. The following presents the processing results and analysis:
5.1.1. Spatial Distribution
The left and right images present choropleth maps depicting the distribution of POI density and population grid data within 500-meter buffer zones of candidate points, respectively. The spatial gradient of POI distribution reveals distinct core-periphery characteristics, with pronounced concentration along central urban corridors such as Dongfeng East Road and Renmin West Road. In these areas, the choropleth values for POI density within 500-meter buffers reach the highest range (53,832-96,544). A typical example is the intersection of Beijing Road and Dongfeng East Road, which forms a distinct POI aggregation core characterized by dense concentrations of various commercial formats, including shopping malls, Class A office towers, and mixed-use developments that integrate residential, workplace, and leisure functions.
Figure 9.
Choropleth Map of Classified Candidate Points.
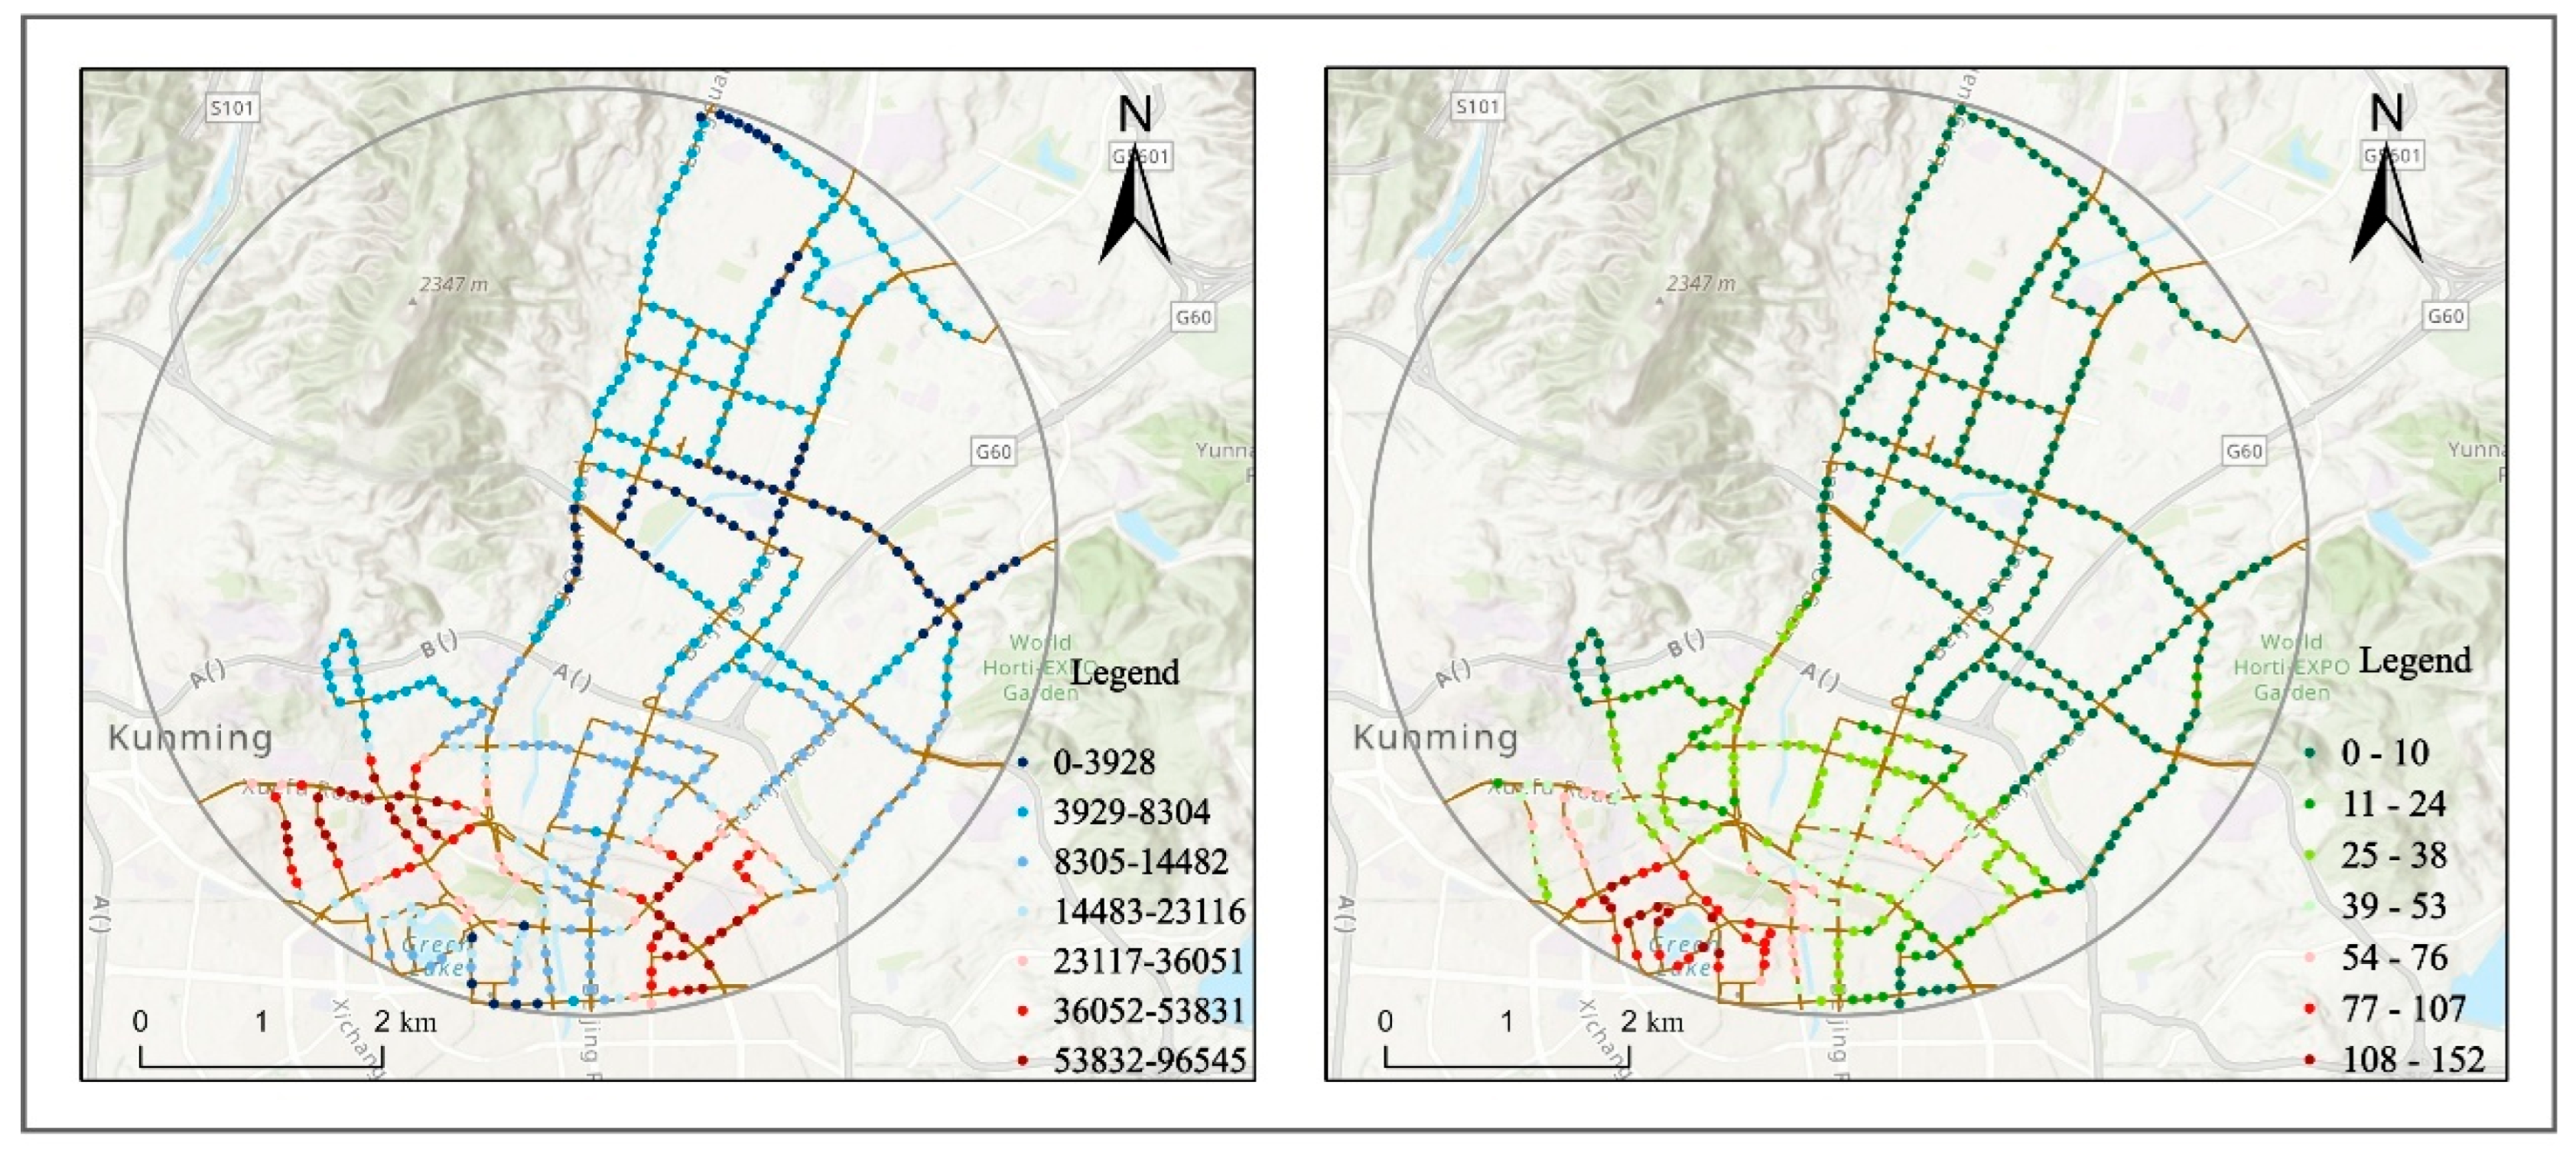
In contrast, the northern study area (e.g., surrounding the Botanical Garden and Golden Temple Park) exhibits significantly lower POI density, with choropleth values falling into the lowest range (448-8,304). These zones are characterized by ecological conservation functions and low-density residential development, resulting in limited POI variety and quantity. This core-to-periphery spatial gradient of POI distribution demonstrates the imbalanced urban functional development in Kunming and the directional diffusion pattern of urban vitality.
The population grid data within the study area exhibits strong spatial correlation with POI distribution in urban core zones. The highest population density areas (with choropleth values of 53,832–96,544 within 500-meter buffers) overlap with POI aggregation cores (e.g., Dongfeng East Road and Renmin West Road corridors), forming high-density population clusters. In these core areas, high-density residential communities coexist with large commercial centers, generating substantial commuting, shopping, and social trips that constitute the demand base for public transportation systems.
In contrast, the northern peripheral areas demonstrate different spatial relationships between POIs and population grids. These zones are characterized by ecologically dominated POI distributions and low-density residential development patterns in population grids, collectively shaping the 'basic accessibility demand' of transportation systems.
5.1.2. Spatial Autocorrelation
The left and right figures respectively display Local Moran's I analysis maps of POI data and population grid data within the study area. In the POI grid LISA analysis, High-High clusters (red indicators) are predominantly concentrated along Dongfeng East Road and Renmin West Road (e.g., the intersection of Beijing Road and Dongfeng East Road). These areas demonstrate both high POI concentration and significant spatial autocorrelation with surrounding areas, representing core urban zones for commercial, office, and entertainment functions (exemplified by areas around Plaza 66 and Shuncheng Shopping Mall, which aggregate numerous POIs including shopping centers, office buildings, and restaurants). Low-Low clusters (light blue indicators) are primarily distributed in the northern botanical garden sector (e.g., surrounding Golden Temple Park and Kunming Botanical Garden, geographic coordinates corresponding to urban ecological function zones). These areas exhibit low POI density with homogeneous spatial association characteristics, dominated by ecological conservation and low-density recreational functions.
Figure 10.
Local Moran's I Map of Candidate Points.
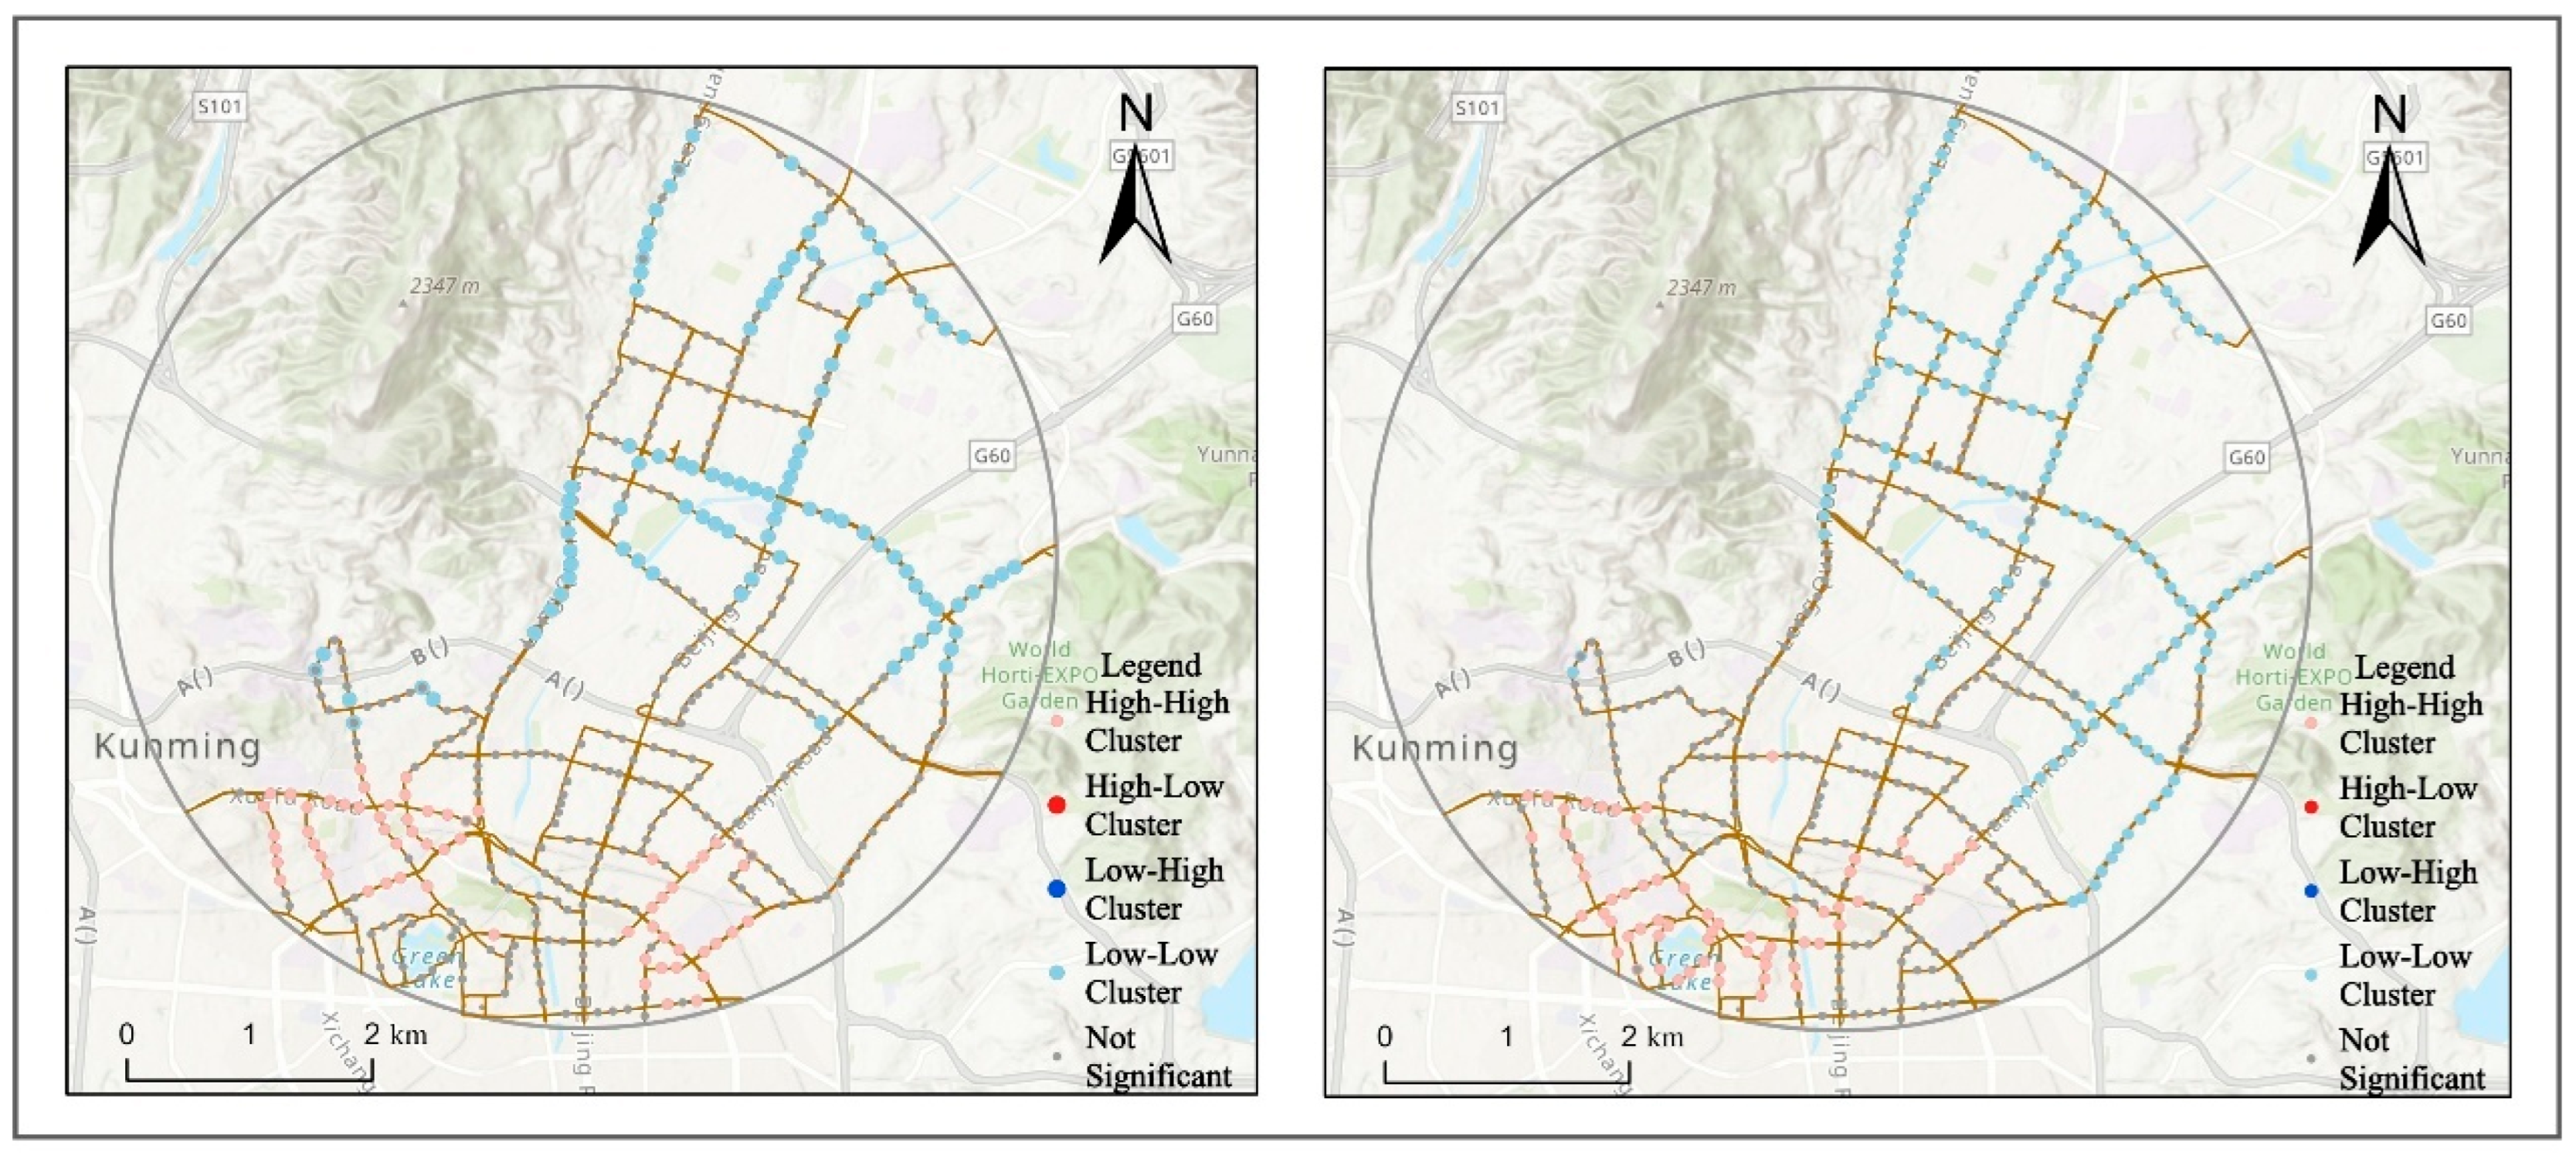
The population grid LISA analysis reveals distinct spatial association patterns (as shown in the population grid LISA map). High-High clusters exhibit similar spatial concentration patterns to Points of Interest (POIs), being predominantly located along Dongfeng East Road and Renmin West Road. These areas demonstrate both high population density and significant positive spatial autocorrelation with adjacent zones, representing urban commercial-office and high-density residential mixed-use districts. A typical example is the area surrounding Plaza 66, which integrates office buildings, shopping malls, and residential complexes within a compact urban form. Low-Low clusters (light blue indicators) are distributed in the northern botanical garden sector (e.g., surrounding Golden Temple Park), characterized by low population density and homogeneous spatial association with neighboring areas. These zones are primarily designated for ecological conservation and low-density residential functions.
5.1.3. Distribution Characteristics Summary
The urban core corridor (Dongfeng East Road-Renmin Road-Beijing Road segment) exhibits a strong spatial similarity between POI and population grid distributions. This area is predominantly characterized by high concentrations of shopping malls, office buildings, and residential communities, supporting dense human activity and generating significant daily travel demand for commuting, shopping, and other purposes.
In contrast, the northern study area demonstrates different spatial relationships between POIs and population distribution. This sector is mainly composed of ecological zones (such as parks and botanical gardens) and low-density residential neighborhoods, where both POIs and population exhibit sparse distribution patterns. Although local residents' travel demand is less intense compared to the urban core, basic transportation services remain crucial for their mobility needs.
5.2. Algorithm Effectiveness and Comparative Analysis
5.2.1. Data-Driven Analysis of Algorithm Outputs
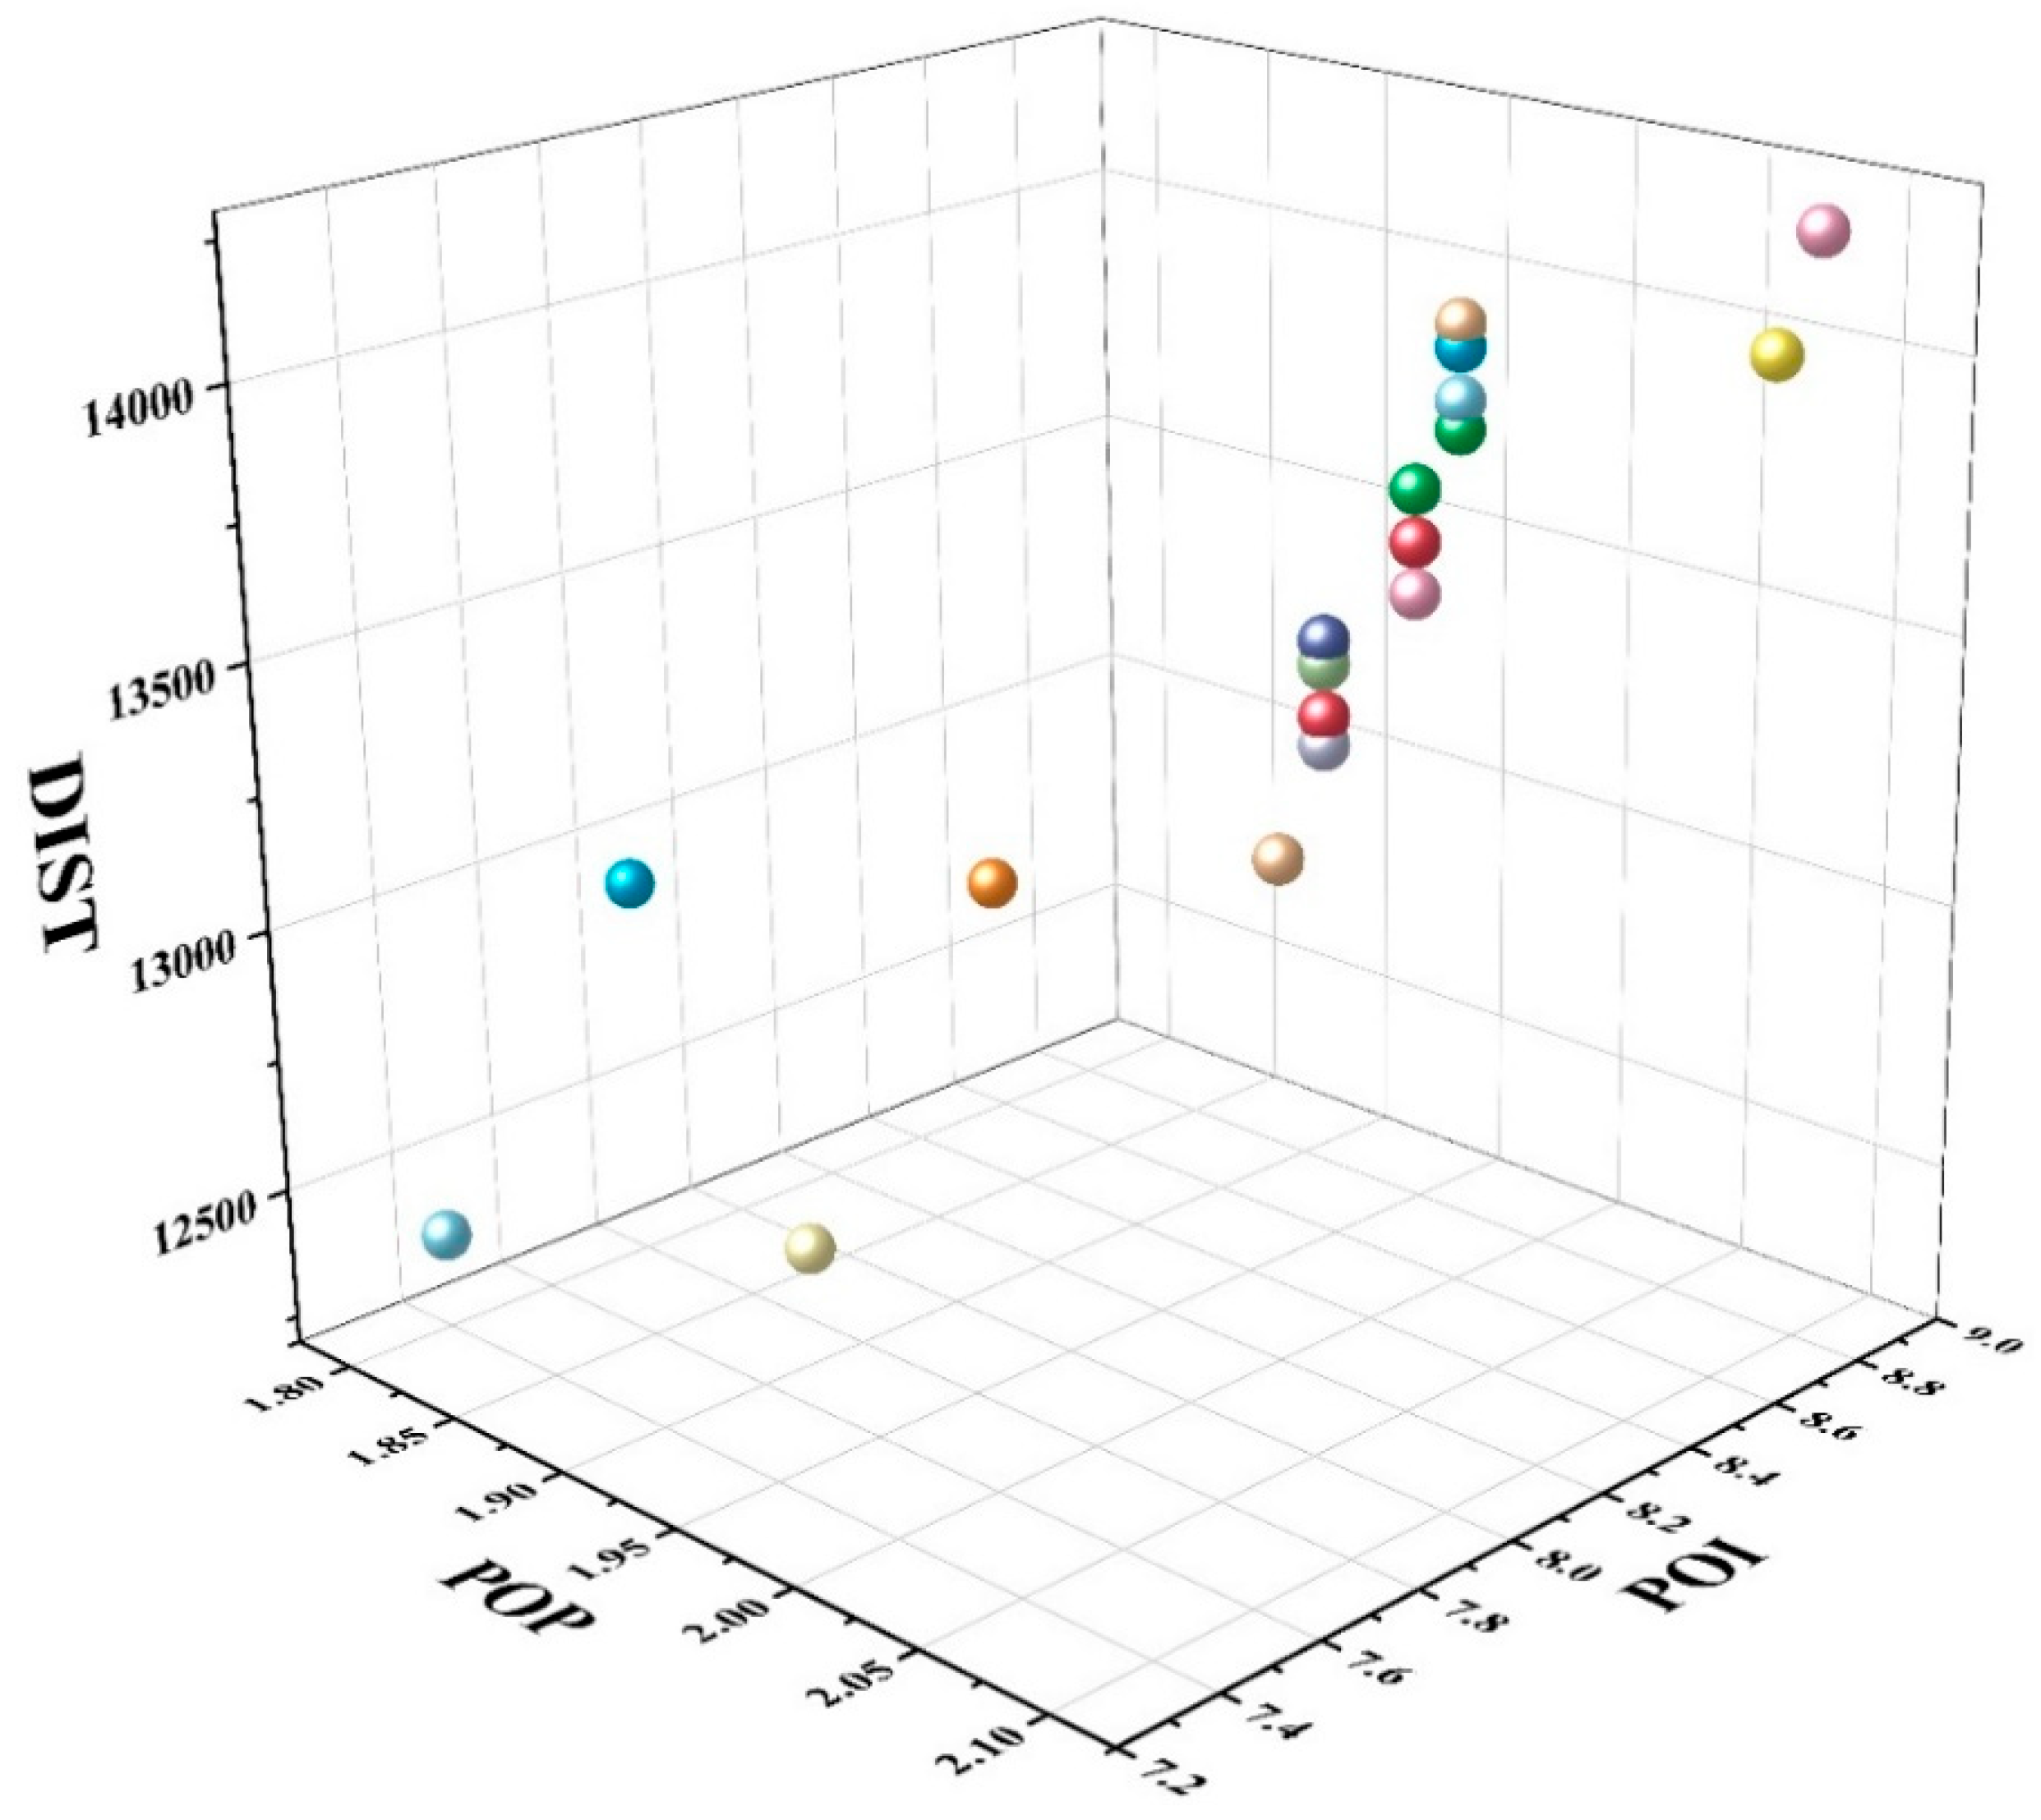
This study selected Bus Route 119 in Kunming City for experimental validation and analysis. Based on the actual conditions of the route, we determined the locations of the origin and terminal candidate stops and established constraint conditions to screen candidate bus stop locations using an improved heuristic algorithm. Through in-depth spatial analysis of these 100 feasible solutions for Kunming's Bus Route 119, we observed that while all route alternatives maintained fundamental consistency with the north-south arterial corridor orientation, the algorithm produced variations in segment selections within northern urban areas, particularly along Hongyun Road, Xiaokang Avenue, and Hongxing Road. Using POI (Point of Interest) density and population grid distribution as dual constraint criteria, we performed non-dominated sorting on the 100 feasible solutions, ultimately generating 19 Pareto-optimal solutions. The three-dimensional scatter plot below visualizes the POI coverage, population service, and route distance metrics for these 19 optimal routes.
Figure 11.
3D Scatter Plot of Results.
For a systematic summary and analysis, we performed cluster analysis on the experimental results and identified four distinct categories of route alignments based on their cluster centroids. The subsequent visualization of these route alignment patterns is presented in the following four figures.
Figure 12.
Optimized Path Results Diagram.
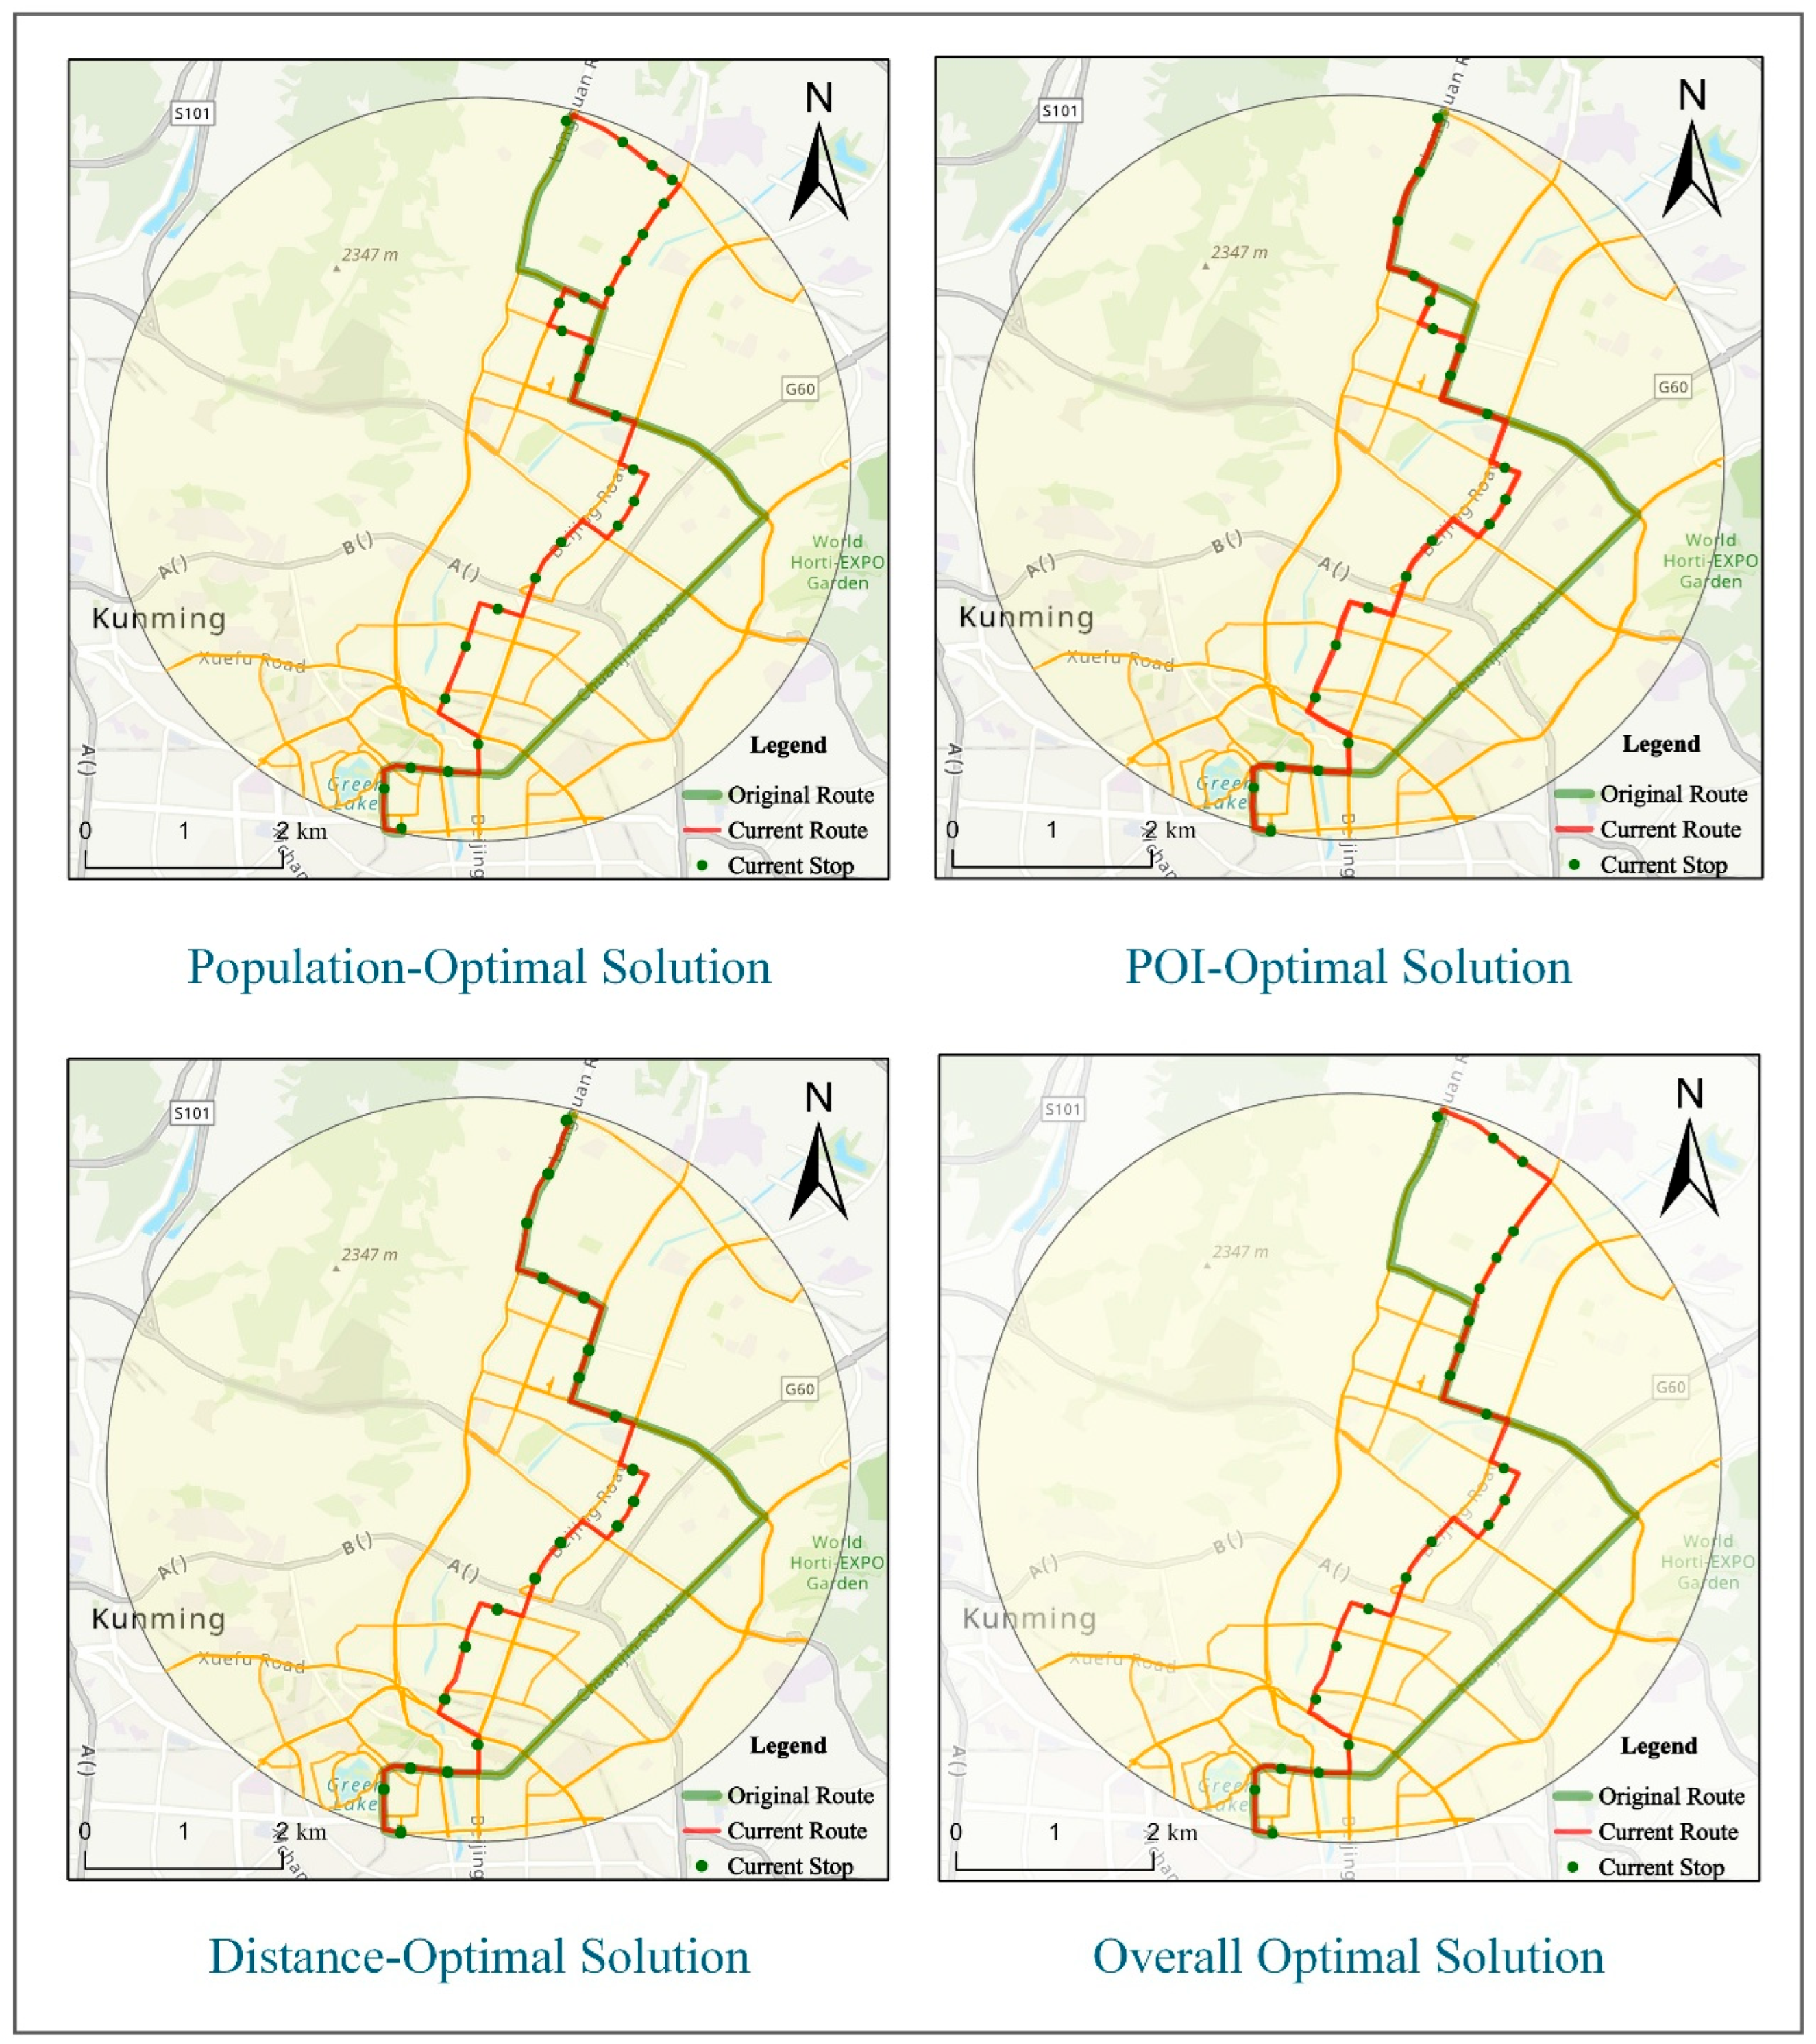
Visualization of the four routes reveals a complete alignment with the original trajectory of Route 119 along Huashan West Road and Yuantong Street. However, the optimized routes implement directional adjustments at the Beijing Road intersection. The key findings of the analysis are as follows:
The population-optimal route solution results in a longer total distance with moderate curvature, but it significantly enhances population coverage by adding stops at key high-density areas, including the Hong Yun Cigarette Factory and the Tian jiao Beilu residential area, both of which are among Kunming’s most densely populated zones. This routing strategy makes use of the eastern section of Hongxing Road before returning to the northern portion of Xiaokang Avenue, passing by Yunnan Agricultural University. In comparison to other alternatives that divert onto Longquan Road, the northern section of Xiaokang Avenue serves denser residential communities and covers a larger population, while also accommodating student populations effectively. As a result, this configuration stands out as the demographic optimal solution.
The POI-optimal route solution results in a moderate increase in total distance, incorporating a turn onto Hongxing Road before proceeding along Hongyuan Road and then redirecting onto Longquan Road. This route passes through Tian jiao Beilu and covers important facilities along Longquan Road, including Shizhuan Affiliated Primary School and Changchang Mountain Park, one of northern Kunming's most popular parks. The chosen path not only improves accessibility for student populations using public transportation but also better serves park visitors. Thus, this configuration is established as the facility-optimal solution.
The distance-optimal route incorporates a detour via Hongxing Road before merging onto Longquan Road. Compared to the previous solutions, it has minimal path curvature, reducing total distance while still covering key areas like Hong Yun Cigarette Factory, Tian jiao Beilu residential area, and Changchang Mountain Park. However, this route sacrifices coverage of the high-density communities along the northern segment of Xiaokang Avenue.
Following a thorough evaluation, we propose an integrated optimal solution that reduces detours while maintaining coverage of high-density residential areas, food streets, and commercial hubs, including services to Yunnan Agricultural University. This configuration sacrifices coverage of residential areas along Hongxing Road and Hongyuan Road in favor of a more compact route, thereby improving operational efficiency.
5.2.2. Validation of Algorithm Effectiveness
To further analyses the algorithm’s outcomes, we compared the three objective values of the 19 optimized non-dominated solutions with the original data from Kunming City’s Bus Route 119 and summarized the results in the table below.

Table 1.
Percentage Comparison of Algorithm Results Before and After Optimization.
| Number | POP | Percentage Change of POP | POI | Percentage Change of POI | DIST | Percentage Change of DIST |
|---|---|---|---|---|---|---|
| Origin | 1.9 | 0% | 7.6 | 0% | 15145.6 | 0% |
| 51 | 1.8 | -5.26% | 7.4 | -2.63% | 12380.9 | 18.26% |
| 62 | 1.8 | -5.26% | 7.8 | 2.63% | 12932.1 | 14.61% |
| 73 | 2.0 | 5.26% | 8.5 | 11.84% | 13555.2 | 10.50% |
| 74 | 2.0 | 5.26% | 8.3 | 9.21% | 13388.2 | 11.59% |
| 75 | 2.0 | 5.26% | 8.3 | 9.21% | 13485.3 | 11.09% |
| 76 | 2.0 | 5.26% | 8.5 | 11.84% | 13745.7 | 9.24% |
| 78 | 2.0 | 5.26% | 8.2 | 7.89% | 13157.1 | 13.12% |
| 79 | 1.9 | 0.00% | 8.1 | 6.58% | 12990.1 | 14.10% |
| 80 | 2.0 | 5.26% | 8.3 | 9.21% | 13336.1 | 11.94% |
| 83 | 2.0 | 5.26% | 8.3 | 9.21% | 13526.6 | 10.68% |
| 85 | 1.9 | 0.00% | 7.7 | 1.32% | 12425.1 | 17.96% |
| 90 | 2.1 | 10.53% | 8.7 | 14.47% | 14047.6 | 7.25% |
| 91 | 2.0 | 5.26% | 8.6 | 13.16% | 13880.6 | 8.35% |
| 92 | 2.0 | 5.26% | 8.6 | 13.16% | 13977.7 | 7.70% |
| 93 | 2.1 | 10.53% | 8.8 | 15.79% | 14238.1 | 5.99% |
| 95 | 2.0 | 5.26% | 8.5 | 11.84% | 13649.5 | 9.87% |
| 96 | 2.0 | 5.26% | 8.3 | 9.21% | 13482.4 | 11.11% |
| 97 | 2.0 | 5.26% | 8.6 | 13.16% | 13828.4 | 8.69% |
| 100 | 2.0 | 5.26% | 8.6 | 13.16% | 14018.9 | 7.44% |
A comparative analysis of the route maps and operational data reveals clear differences between the proposed solutions and the existing Route 119 configuration. The original route primarily follows Chuanjin Road, while our optimized solutions exhibit a nearly identical alignment along the main corridor between the northern transit hub and southern commercial district, diverging only at the Beijing Road-Chuanjin Road junction. This deviation arises from the optimization logic of the heuristic algorithm, which favors the more direct route along Beijing Road to reduce commute distances, achieving a 10% shorter inter-station linear distance compared to the Chuanjin Road alternative. In contrast, the original layout took a more circuitous route to maintain coverage of secondary residential clusters and educational facilities along Chuanjin Road. The population-optimal solution (Sol#90) demonstrates a 10.53% greater population coverage compared to the original route. The facility-optimal solution (Sol#93) improves POI accessibility by 15.79%. Meanwhile, the distance-optimal solution (Sol#51) reduces the total route length by 18.26%. Tabular data comparisons decisively confirm the effectiveness of the algorithm in addressing these distinct optimization objectives.
A comparative analysis with the original route reveals significant improvements across multiple dimensions. In terms of route alignment, the original configuration along Chuanjin Road-Huancheng North Road-Golden Avenue exhibited circuitous routing issues. In contrast, the optimized solutions implement directional adjustments at the Beijing Road intersection, effectively eliminating redundant path segments and reducing the total route length through algorithmic optimization. Regarding demographic and facility coverage, the optimized routes provide superior service to high-density residential areas (e.g., Jinxing Community and Jinshi Community) while incorporating additional commercial facilities (such as Tongde Kunming Plaza and Xindu Longcheng) and public amenities (including Shizhuan Affiliated Primary School and Changchongshan Ecological Park). These improvements collectively enhance both population coverage and public facility accessibility.
Tabular comparisons conclusively show that all 19 non-dominated solution sets outperform the original route across three key metrics: population coverage, POI service accessibility, and operational efficiency. These results provide empirical validation of the algorithm's effectiveness in multi-objective route optimization.
6. Conclusion and Discussion
This study proposes a novel bus network design methodology and validates its implementation in real-world networks. The primary contribution lies in the development of a heuristic algorithm capable of screening feasible solutions for route optimization, effectively addressing issues related to unreasonable route length and stop spacing post-optimization. Compared to existing approaches, the proposed algorithm demonstrates enhanced implement ability while maintaining low data requirements and computational complexity. Through the optimization case of Kunming's Bus Route 119, the multi-objective optimization framework developed in this study has been successfully validated, with the improved heuristic algorithm and non-dominated sorting technology achieving significant theoretical breakthroughs and practical advancements in public transport network optimization. The main conclusions are as follows:
Firstly, the improved heuristic algorithm based on candidate point weighting significantly enhances computational efficiency. By comprehensively considering constraints, including road tortuosity and stop spacing, the initial algorithm generates feasible solutions. The tri-objective constraints (population coverage, POI coverage, and route length) in the non-dominated sorting process ensure that the optimized results do not excessively deviate in any dimension. Through non-dominated sorting of 100 feasible solutions, 19 Pareto-optimal routes were ultimately identified. These solution sets exhibit two notable characteristics: (1) The 100 solutions show a high level of consistency in overall alignment, confirming strong correlations between Kunming's road network layout and population density/POI distribution, with the network structure being both concise and efficient; (2) The optimal solutions demonstrate objective synergy in specific areas along Route 119, indicating spatial similarity between population density and POI distribution in these regions, with no significant divergence among the three optimization objectives along identical alignments.
The bus stop location selection and route optimization created by this algorithm provide a preliminary solution that can serve as a foundation for route deployment. Future bus network adjustments and developments could consider: optimizing stop layouts to enhance service efficiency; adjusting route alignments to reduce redundant paths; strengthening POI coverage to improve service diversity; adopting data-driven decision-making to promote intelligent optimization methods; and establishing dynamic evaluation mechanisms for regular route optimization to adapt to urban development and changes in passenger flow.
Study limitations include: the current model does not incorporate real-time traffic congestion or traffic signal delays, which could be addressed in future work through traffic simulation for further route runtime optimization; the research primarily relies on static demand distribution without considering passenger travel preferences (e.g., transfer habits, peak-hour demand variations), which could be improved by introducing passenger flow prediction models. For future research, optimization strategies could be explored by integrating bus networks with other transportation modes, such as metro and bike-sharing, in multi-modal systems. Additionally, Intelligent Transportation System (ITS) data could be incorporated to enable dynamic route adjustments based on real-time traffic conditions and changes in passenger flow.
Author Contributions
Siyuan Li: Data curation,Wrinting-original drafit. Hongling Wu: Data, Review, Editing. Zhiyu Chen: Software. Xiaoqing Zuo: Validation. Huyue Chen: Visualization. Bowen Zuo: Supervision. Weiwei Song: Conceptralization, Methodology, Soft-ware.
Funding
This research was funded by the Major Science and Technology Project of Yunnan Province, China, grant number 202502AD080005. It was also supported by the Yunnan Key Laboratory of Intelligent Monitoring and Spatiotemporal Big Data Governance of Natural Resources.
Institutional Review Board Statement
Ethical review and approval were not required for the study on human participants/animals in accordance with the local legislation and institutional requirements. This study focuses on urban bus route planning and does not involve human or animal subjects.
Informed Consent Statement
No informed consent was required as the data used in this study are publicly available and do not contain personal identifiers, and the research does not involve human participants.
Data Availability Statement
The data presented in this study were sourced from OpenStreetMap (OSM), Amap (Gaode Map), and the World Pop Global Project. The benchmark network used is publicly available and has been cited in the manuscript. Additional data used to support the findings of this study are available from the corresponding author upon reasonable request.
Acknowledgments
I would like to express their sincere gratitude to all co-authors for their dedicated contributions to this study. Special thanks go to Weiwei Song for his invaluable academic guidance and profound teachings throughout the research process, which laid a solid foundation for the completion of this manuscript. We appreciate Xiaoqing Zuo for her professional suggestions on manuscript validation, and Hongling Wu for providing high-quality data support from the Yunnan Provincial Basic Geographic Information Center. We also thank Zhiyu Chen for his efforts in software implementation, Siyuan Li for meticulous data curation and draft writing, and Huyue Chen and Bowen Zuo for their work in result visualization. Additionally, we are grateful to the editorial team of Applied Sciences for their technical support, as well as data providers including OpenStreetMap, Amap, and the World Pop Global Project.
Conflicts of Interest
The authors declare that they have no known competing financial interests or personal relationships that could have appeared to influence the work reported in this paper.
References
- J. Anable, “‘complacent car addicts’ or ‘aspiring environmentalists’? Identifying travel behaviour segments using attitude theory,” Transp. Policy, vol. 12, no. 1, pp. 65–78, Jan. 2005. [CrossRef]
- M. A. Kashem, M. Shamsuddoha, and T. Nasir, “Digitalization in sustainable transportation operations: a systematic review of AI, IoT, and blockchain applications for future mobility,” Future Transp., vol. 5, no. 4, pp. 157–189, Nov. 2025. [CrossRef]
- T. Monahan and C. G. Lamb, “Transit’s downward spiral: assessing the social-justice implications of ride-hailing platforms and COVID-19 for public transportation in the US,” Cities, vol. 120, p. 103438, Jan. 2022. [CrossRef]
- L. dell’Olio, A. Ibeas, and P. Cecín, “Modelling user perception of bus transit quality,” Transp. Policy, vol. 17, no. 6, pp. 388–397, Nov. 2010. [CrossRef]
- S. Stradling, M. Carreno, T. Rye, and A. Noble, “Passenger perceptions and the ideal urban bus journey experience,” Transp. Policy, vol. 14, no. 4, pp. 283–292, Jul. 2007. [CrossRef]
- Y. Wei, N. Jiang, Z. Li, D. Zheng, M. Chen, and M. Zhang, “An improved ant colony algorithm for urban bus network optimization based on existing bus routes,” ISPRS Int. J. Geo-Inf., vol. 11, no. 5, p. 317, May 2022. [CrossRef]
- Z. Ahern, A. Paz, and P. Corry, “Approximate multi-objective optimization for integrated bus route design and service frequency setting,” Transp. Res. Part B Methodol., vol. 155, pp. 1–25, Jan. 2022. [CrossRef]
- Y. He, Y. Xiao, J. Chen, and D. Wang, “An improved multi-objective method for the selection of driverless taxi site locations,” Int. J. Transp. Sci. Technol., p. S204604302400128X, Oct. 2024. [CrossRef]
- A. Gupta, G. R. Bivina, and M. Parida, “Prioritising pedestrian’s needs around transit stations through walkability assessment: a walk audit tool approach,” Transp. Res. Procedia, vol. 82, pp. 1205–1228, 2025. [CrossRef]
- A. Sirikijpanichkul, S. Winyoopadit, and A. Jenpanitsub, “A multi-actor multi-criteria transit system selection model: a case study of Bangkok feeder system,” Transp. Res. Procedia, vol. 25, pp. 3736–3755, 2017. [CrossRef]
- M. H. Baaj and H. S. Mahmassani, “Hybrid route generation heuristic algorithm for the design of transit networks,” Transp. Res. Part C Emerg. Technol., vol. 3, no. 1, pp. 31–50, Feb. 1995. [CrossRef]
- T. Vlachopanagiotis, K. Grizos, G. Georgiadis, and I. Politis, “Public transportation network design and frequency setting: pareto optimality through alternating-objective genetic algorithms,” Future Transp., vol. 1, no. 2, pp. 248–267, Aug. 2021. [CrossRef]
- G. Hüsselmann, J. H. Van Vuuren, and S. J. Andersen, “An improved solution methodology for the urban transit routing problem,” Comput. Oper. Res., vol. 163, p. 106481, Mar. 2024. [CrossRef]
- Z. Drezner and G. O. Wesolowsky, “Network design: selection and design of links and facility location,” Transp. Res. Part Policy Pract., vol. 37, no. 3, pp. 241–256, Mar. 2003. [CrossRef]
- P. Chakroborty and T. Wivedi, “Optimal route network design for transit systems using genetic algorithms,” Eng. Optim., vol. 34, no. 1, pp. 83–100, Jan. 2002. [CrossRef]
- F. A. Kidwai and K. Deb, “A genetic algorithm based bus scheduling model for transit network,” Proc. East. Asia Soc. Transp. Stud., vol. 5, 2005.
- K. Huang, L. Xu, Y. Chen, Q. Cheng, and K. An, “Customized bus route optimization with the real-time data,” J. Adv. Transp., vol. 2020, pp. 1–9, Aug. 2020. [CrossRef]
- S. Wang, Z. Zuo, and Y. Liu, “Study on location of bus stop in subway service area based on residents’ travel accessibility,” Sustainability, vol. 15, no. 5, p. 4517, Mar. 2023. [CrossRef]
- S. Ji-yang, H. Jian-ling, C. Yan-yan, W. Pan-yi, and J. Jian-lin, “Flexible bus route optimization for multitarget stations,” Math. Probl. Eng., vol. 2020, pp. 1–8, Mar. 2020. [CrossRef]
- Y. Tu et al., “Uncovering the nature of urban land use composition using multi-source open big data with ensemble learning,” Remote Sens., vol. 13, no. 21, Art. no. 21, Oct. 2021. [CrossRef]
- M. Wei, C. Yang, and T. Liu, “An integrated multi-objective optimization for dynamic airport shuttle bus location, route design and departure frequency setting problem,” Int. J. Environ. Res. Public. Health, vol. 19, no. 21, p. 14469, Nov. 2022. [CrossRef]
- Z. Zhang, X. Cheng, Z. Xing, and X. Gui, “Pareto multi-objective optimization of metro train energy-saving operation using improved NSGA-II algorithms,” Chaos Solitons Fractals, vol. 176, p. 114183, Nov. 2023. [CrossRef]
- H. T. M. Nguyen, A. H. F. Chow, and C. Ying, “Pareto routing and scheduling of dynamic urban rail transit services with multi-objective cross entropy method,” Transp. Res. Part E Logist. Transp. Rev., vol. 156, p. 102544, Dec. 2021. [CrossRef]
- M. Liang, M. Xu, and S. Wang, “A novel multi-objective evolutionary algorithm for transit network design and frequency-setting problem considering passengers’ choice behaviors under station congestion,” Transp. Res. Part B Methodol., vol. 197, p. 103238, Jul. 2025. [CrossRef]
- M. Owais and M. K. Osman, “Complete hierarchical multi-objective genetic algorithm for transit network design problem,” Expert Syst. Appl., vol. 114, pp. 143–154, Dec. 2018. [CrossRef]
- Y. Hadas and O. E. Nahum, “Urban bus network of priority lanes: a combined multi-objective, multi-criteria and group decision-making approach,” Transp. Policy, vol. 52, pp. 186–196, Nov. 2016. [CrossRef]
- C. Iliopoulou and M. A. Makridis, “Critical multi-link disruption identification for public transport networks: a multi-objective optimization framework,” Phys. Stat. Mech. Its Appl., vol. 626, p. 129100, Sep. 2023. [CrossRef]
- X. Zhou, H. Guo, B. Li, and X. Zhao, “Transit dynamic operation optimization using combination of stop-skipping strategy and local route optimization,” Appl. Sci., vol. 14, no. 17, p. 7783, Sep. 2024. [CrossRef]
- K. Sriprateep et al., “Multi-objective optimization of resilient, sustainable, and safe urban bus routes for tourism promotion using a hybrid reinforcement learning algorithm,” Mathematics, vol. 12, no. 14, p. 2283, Jul. 2024. [CrossRef]
- R. Balcombe et al., “The demand for public transport: a practical guide”.
- F. Cevallos and F. Zhao, “Minimizing transfer times in public transit network with genetic algorithm”.
- A. T. Murray, “A coverage model for improving public transit system accessibility and expanding access,” Ann. Oper. Res., vol. 123, no. 1, Art. no. 1, Oct. 2003. [CrossRef]
- F. Zhao and I. Ubaka, “Transit network optimization – minimizing transfers and optimizing route directness,” J. Public Transp., vol. 7, no. 1, pp. 63–82, Jan. 2004. [CrossRef]
- J. Chen, S. Wang, Z. Liu, and X. Chen, “Network-level optimization of bus stop placement in urban areas,” KSCE J. Civ. Eng., vol. 22, no. 4, pp. 1446–1453, Apr. 2018. [CrossRef]
Disclaimer/Publisher’s Note: The statements, opinions and data contained in all publications are solely those of the individual author(s) and contributor(s) and not of MDPI and/or the editor(s). MDPI and/or the editor(s) disclaim responsibility for any injury to people or property resulting from any ideas, methods, instructions or products referred to in the content. |
© 2026 by the authors. Licensee MDPI, Basel, Switzerland. This article is an open access article distributed under the terms and conditions of the Creative Commons Attribution (CC BY) license (http://creativecommons.org/licenses/by/4.0/).
Copyright: This open access article is published under a Creative Commons CC BY 4.0 license, which permit the free download, distribution, and reuse, provided that the author and preprint are cited in any reuse.


