Submitted:
05 February 2026
Posted:
06 February 2026
You are already at the latest version
Abstract
We review recent experimental progress in charmed baryon physics achieved by the Belle and Belle~II experiments, with an emphasis on measurements reported since 2022. Using large $e^{+}e^{-}$ data samples collected at or near the $\Upsilon(4S)$ resonance, Belle and Belle~II have delivered a series of precision results on hadronic weak decays of anti-triplet charmed baryons, providing critical inputs for testing flavor-symmetry approaches and dynamical models. We summarize new and improved branching fraction determinations for $\Xi_c^{0}$, $\Xi_c^{+}$, and $\Lambda_c^{+}$ decays, including channels with neutral hadrons in the final state and the first measurements of several singly Cabibbo-suppressed modes. We also highlight the first determination of the decay asymmetry parameter in $\Xi_c^{0}\to \Xi^{0}\pi^{0}$. In addition, we review the first Belle~II measurements of $CP$ asymmetries in three-body singly Cabibbo-suppressed decays of $\Xi_c^{+}$ and $\Lambda_c^{+}$, and discuss their implications for U-spin sum rules and searches for physics beyond the Standard Model. Finally, we look forward to exploiting the Belle~II data set to perform more stringent tests of decay dynamics.
Keywords:
charmed baryons
; Belle
; Belle II
; branching fractions
; decay asymmetry
; CP violation
1. Introduction
The hadronic weak decays of baryons provide a powerful window into the dynamics of nonleptonic weak interactions in a strongly coupled, three-quark environment, and are closely connected to the fundamental problem of the cosmic matter–antimatter asymmetry [1,2]. Charmed baryons are especially valuable in this respect: their decays simultaneously test flavor symmetry ideas and expose genuinely nonperturbative quantum chromodynamics (QCD) effects that are difficult to control from first principles. Although a variety of phenomenological descriptions have been developed, including the widely used topological-diagram formalism [3], the complexity of heavy-flavored baryon decay dynamics continues to challenge any single quantitative framework [4]. As a result, precise experimental inputs are indispensable for discriminating among theoretical mechanisms and for pinning down the relative importance of factorizable and nonfactorizable contributions.
Experimentally, charmed baryon measurements are more challenging than their mesonic counterparts due to lower production rates; however, the situation has changed markedly with the advent of large data sets and improved detector performances. Over the past two decades, high-luminosity experiments have substantially enriched charmed baryon spectroscopy and motivated a new wave of precision studies of their decay properties [5]. In particular, absolute branching fraction measurements for key reference modes, including , , and , were performed at Belle [6,7,8]. Utilizing these absolute branching fractions as normalization channels, the absolute branching fractions for more , , and decay modes have been measured by Belle and Belle II in recent years [9,10,11,12,13]. Besides the branching fractions of charmed baryons in inclusive processes, Belle II reported a charmed baryon pair involving a sextet and an antitriplet from B decays for the first time [14].
For the weak decay of a spin- charmed baryon into a spin-0 meson and a spin- baryon, the decay asymmetry parameter arises from the interference between parity-violating and parity-conserving amplitudes, reflecting both relative magnitudes and strong-phase differences [15]. Consequently, measurements of probe the helicity structure and final-state-interaction effects that are not accessible through branching fractions alone. This makes precise determinations of central to modern charmed baryon studies, as they complement rate measurements and sharpen tests of model-building assumptions [4]. Recently, Belle II measured the asymmetry parameter for for the first time [9].
Searches for violation (CPV) in charmed baryon decays are particularly compelling. CP violation is one of the necessary ingredients for generating the observed matter–antimatter asymmetry in the Universe [2,16,17]. Within the Standard Model (SM), CPV originates from a single complex phase in the CKM matrix, yet its predicted magnitude is insufficient to account for the cosmological asymmetry. Although CPV has been firmly established in open-flavor mesons, it remains unconfirmed for charmed baryons. Recent progress in the baryon sector, including the observation of CPV in beauty-baryon decays [18], further motivates extending sensitive searches to charm. In practice, CPV can appear both as a decay-rate asymmetry and through polarization-related observables; for two-body decays, the latter is naturally accessed via -based asymmetries [15]. Moreover, because SM expectations for CPV in charm are typically very small, an observed effect at the level significantly above would provide a strong hint of physics beyond the SM [19,20,21,22,23]. Phenomenological investigations of CPV in charmed baryons exist but remain limited, underscoring the importance of new high-precision measurements [24,25,26,27]. Recently, Belle II searched for CP violation in , , , and for the first time [28].
Motivated by these considerations, and in light of the recent experimental progress, this review summarizes the most up-to-date measurements of branching fractions, decay asymmetry parameters, and CPV searches in charmed baryon decays, with an emphasis on results reported since 2022 [9,10,11,12,13,14,28], and compares them with representative theoretical expectations. The remainder of this paper is organized as follows. Section 2 briefly introduces the Belle and Belle II experiments and datasets. Section 3 and Section 4 review recent branching fraction measurements in inclusive processes and in B-meson decays, respectively. Section 5 and Section 6 summarize recent results on decay asymmetry parameters and CP asymmetries. Finally, Section 7 presents a summary and outlook.
2. Belle and Belle II Experiments
The Belle experiment is an international collaborative particle-physics experiment, conducted at the High Energy Accelerator Research Organization (KEK) in Japan, using the KEKB asymmetric-energy electron–positron collider. As one of the world’s leading B-factory experiments, Belle was designed and optimized to precisely measure -violation phenomena in the B-meson system. In the experiment, electrons and positrons are accelerated by KEKB to energies close to the speed of light and brought into collision at the interaction point, where the Belle detector records the particles produced in the annihilation process [29,30]. The Belle experiment began data taking in 1999 and, by 2010, had collected an integrated luminosity of approximately [31]. Its primary physics goals include studies of B-meson mixing, decays, and -violation phenomena, while also covering charm physics, physics, and other rare processes. In 2001, Belle (together with the BaBar experiment) observed violation in B-meson decays [32], a result consistent with the theoretical predictions of Kobayashi and Maskawa, and this achievement was explicitly cited in the award of the 2008 Nobel Prize in Physics [31].
The Belle II experiment is an upgraded successor to Belle and represents a new-generation super B factory [33]. Its main scientific objectives include high-precision measurements of flavor-interaction parameters, in-depth studies of charm physics, and searches for physics beyond the SM [34]. From 2019 to 2022, during its first phase of operation (Run 1), Belle II successfully collected data with an integrated luminosity of [35]. From 2024, Belle II started the second phase of operation (Run 2). On December 27, 2024, it achieved a record instantaneous luminosity of , marking the entry of the experiment into a new era of high-precision physics studies. The combined data samples from the Belle and Belle II experiments correspond to an integrated luminosity of . The abundant data samples for studies of B and charm hadrons as well as for rare-process searches. In addition, the experiment also involves investigations related to hadron physics and dark matter.
The data collected by the Belle and Belle II experiments are primarily taken at the center-of-mass (C.M.) energy , corresponding to the production of the resonance, which predominantly decays into pairs. In addition to production, the electron–positron annihilation process also yields abundant charm hadrons at . Table 1 summarizes the reaction cross sections for various physics processes produced in collisions at . As a result, the Belle and Belle II experiments serve not only as B factories but also as important platforms for charm-physics research.
3. Branching Fractions of Charmed Baryons in Inclusive Processes
In the last decade, experimental investigations of charmed baryons have achieved substantial progress [36]. In particular, absolute branching fractions have been established for several benchmark decay modes, including [6], [8], and [7]. Throughout these measurements, charge-conjugate processes are implicitly taken into account. The availability of these absolute measurements has laid the groundwork for extracting branching fractions of anti-triplet charmed baryons in a wide range of decay channels.
3.1. Studies of Decays
In recent years, an increasing number of theoretical predictions have been made within various dynamical models [37,38,39,40,41,42,43] and the framework of SU(3) flavor symmetry [44,45,46,47,48,49,50,51,52]. These theoretical approaches have been widely applied to predict the branching fractions of Cabibbo-favored (CF) and Cabibbo-suppressed (CS) decays, including decay modes of the (CF) and (CS), where . Figure 1 illustrates the Feynman diagrams for the internal W-emission and W-exchange topologies contributing to the CF decays , in which only nonfactorizable amplitudes contribute [5]. For the decay , the relevant topological contributions can be expressed in a compact form, as shown in Figure 2.
In 2024, Belle II reported measurements of the branching fractions for the CF decay modes with and , providing new experimental inputs from charmed baryons including neutral final states [9]. The invariant mass distributions are shown in Figure . The signal yields for , , and are 1315±66 (869±46), 81±15 (60±11), 23±6 (8±4) at Belle (Belle II), respectively. The statistical significances for , , and are greater than , , and at Belle (Belle II), respectively. The ratios of branching fractions to the normalization mode were calculated to be
where the first and second uncertainties are statistical and systematic throughout this review. Using the branching fraction of the normalization mode, = [36], Belle II obtained the absolute branching fractions, which are listed in Table 2. The experimental results were compared with theoretical expectations, as shown in Figure 4, allowing for stringent tests of various theoretical models.
Figure 3.
invariant mass distributions of candidates in data samples for , , and modes from the (left) Belle and (right) Belle II experiments [9]. The markers with error bars represent the data. The solid blue curves, solid red curves, dashed red curves, and dashed blue curves show the total fit, signal shape, broken-signal shape, and smooth backgrounds, respectively. The cyan histograms show the data from the mass sidebands.
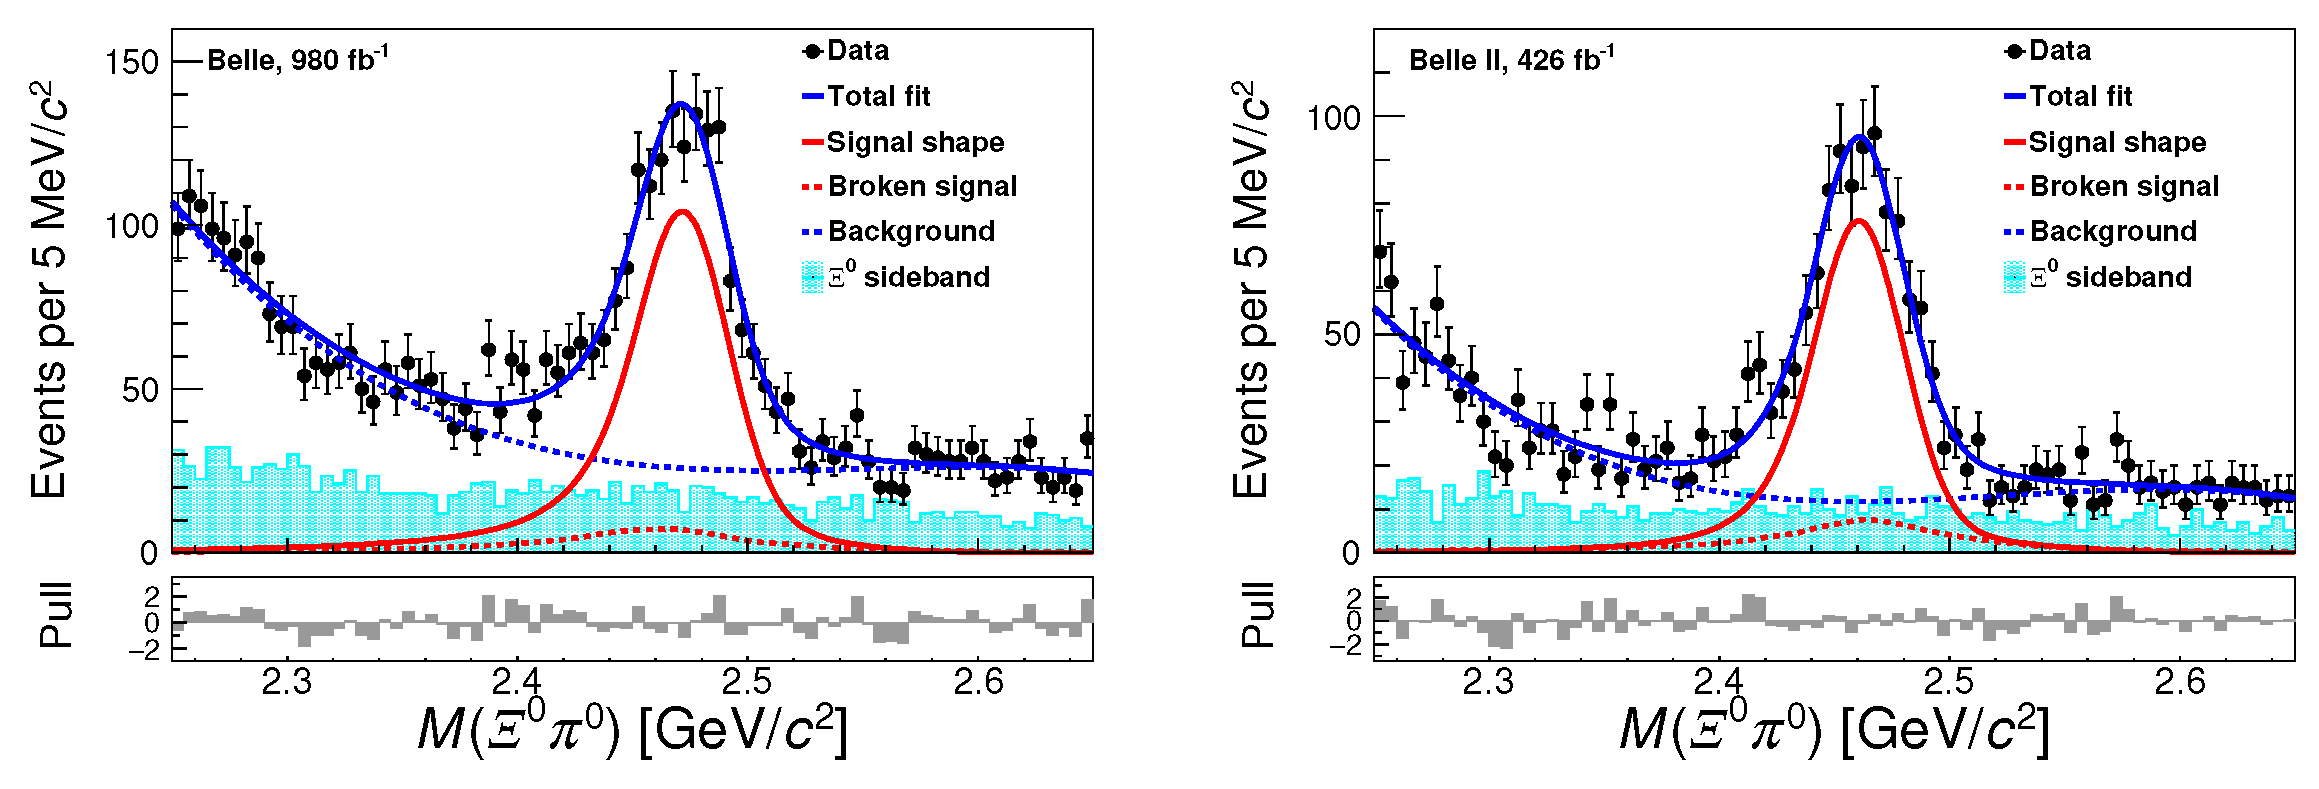
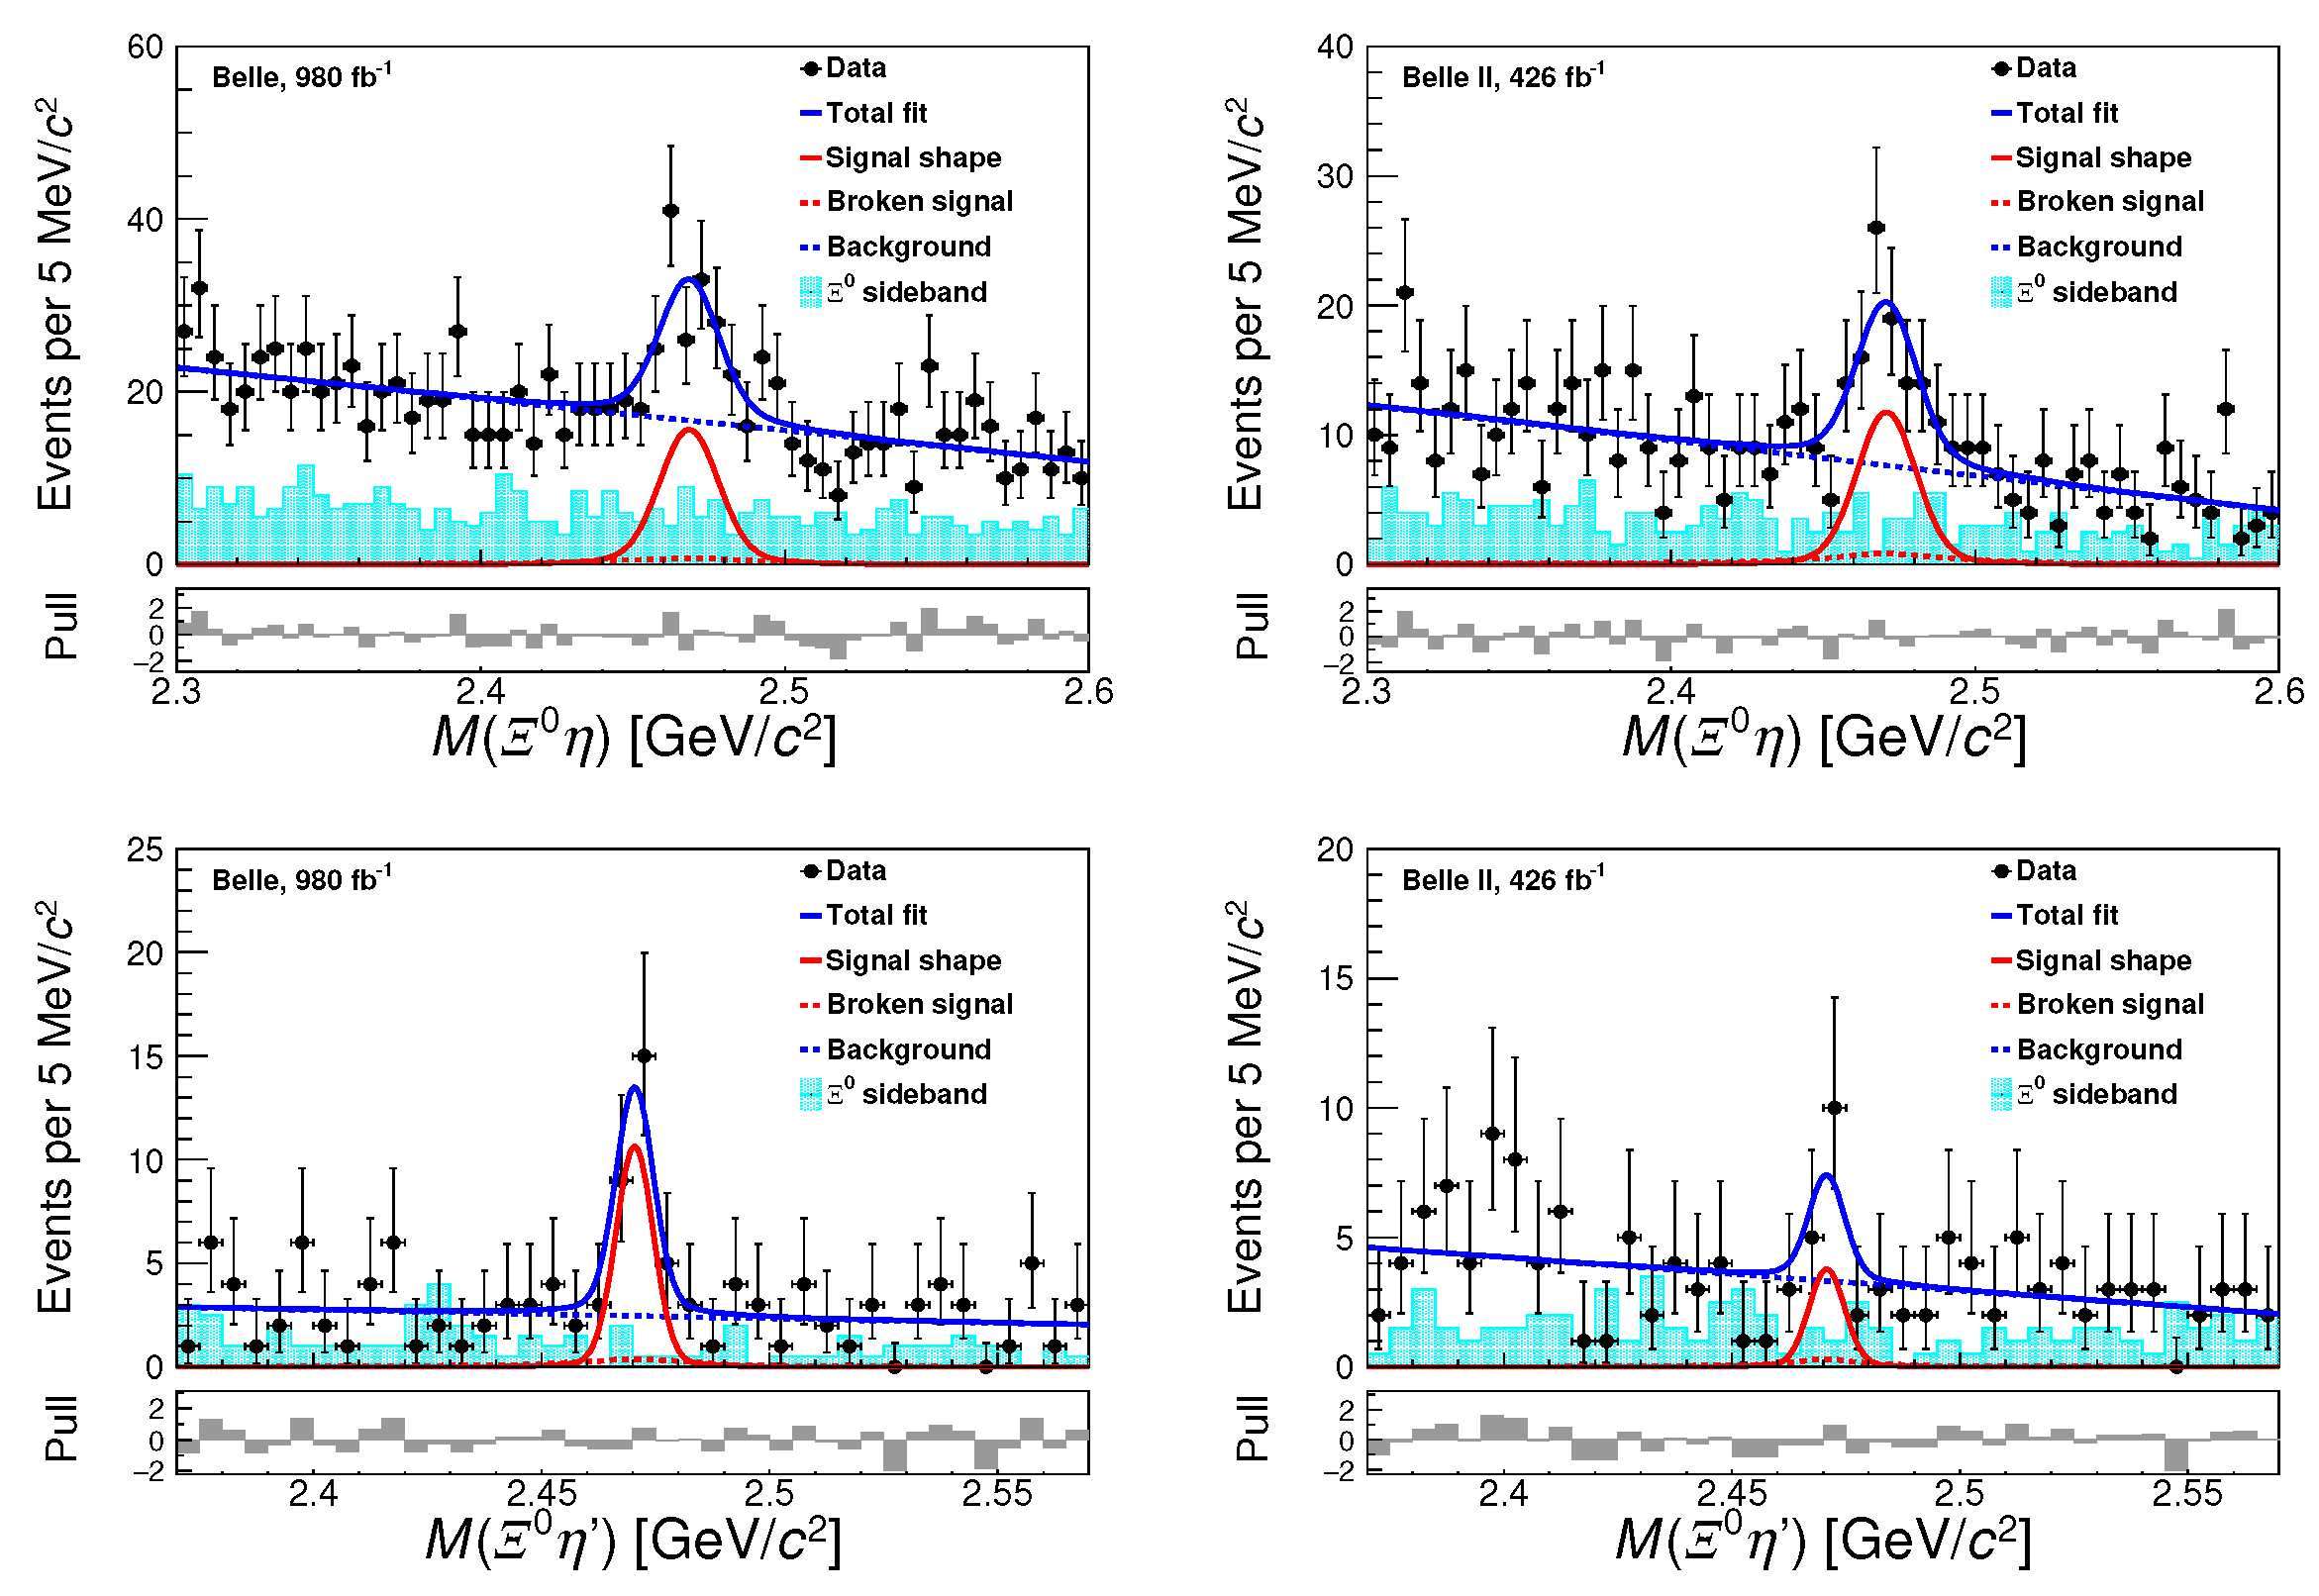
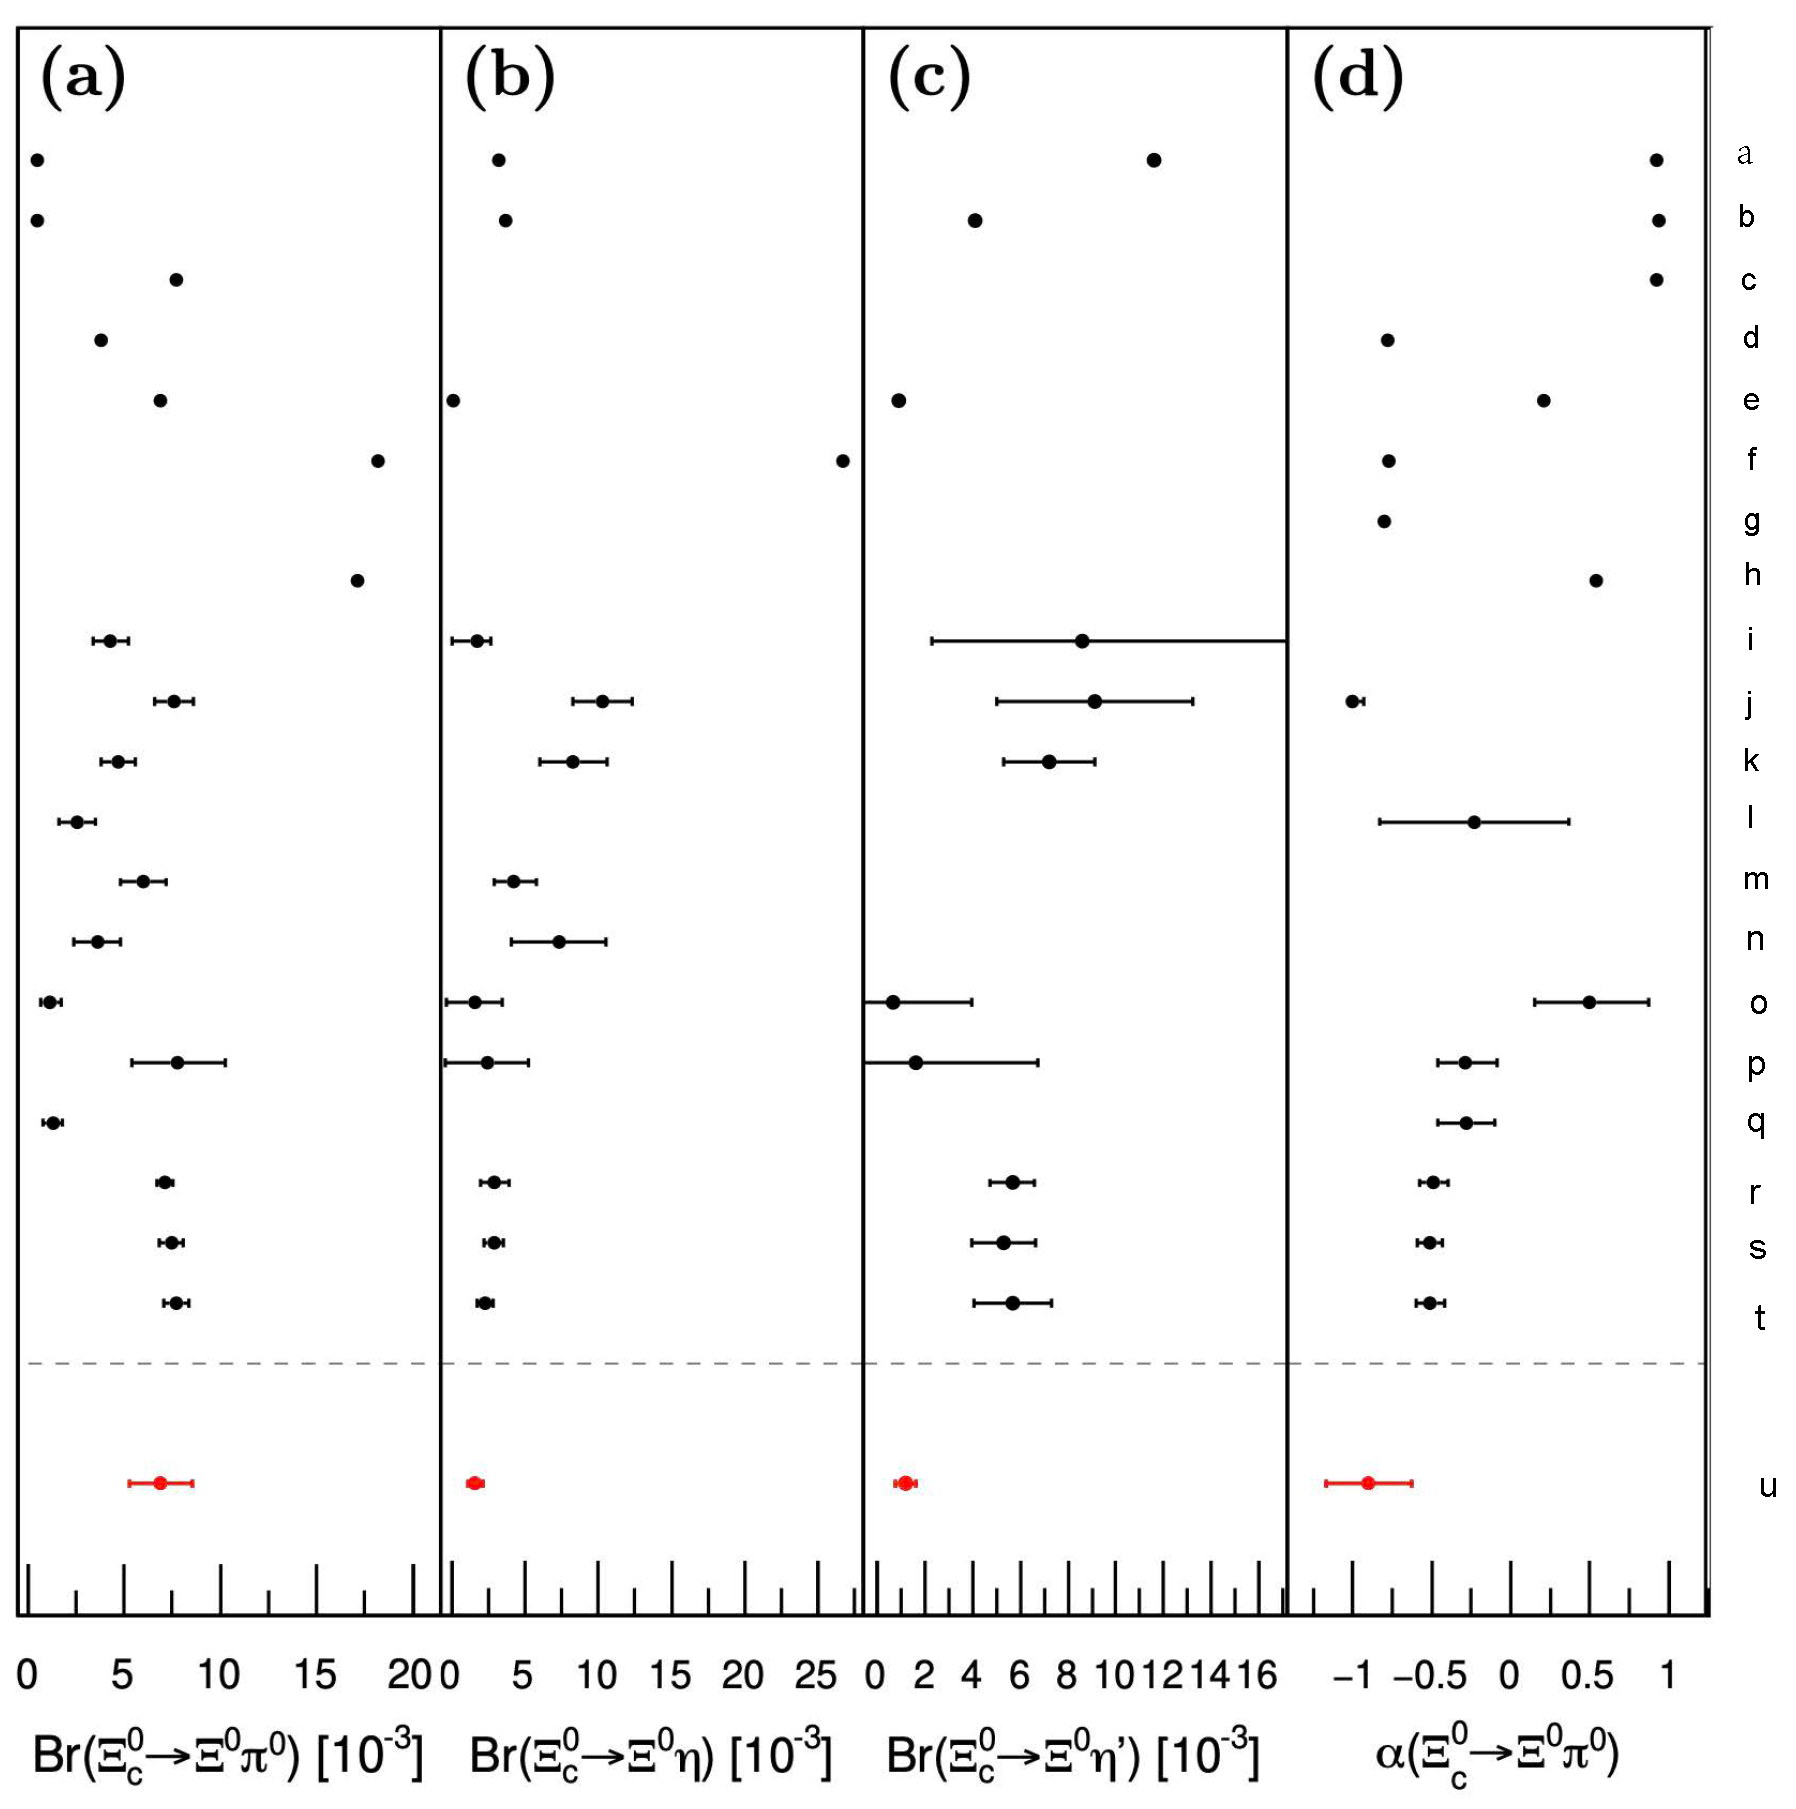
Figure 4.
Comparisons of the measured , , , and with theoretical predictions. The dots and error bars represent the central values and uncertainties, respectively. Dots without error bars indicate that no theoretical uncertainty is available. The theoretical results correspond to: (a) Körner and Krämer [37], (quark model); (b) Ivanov et al. [38], (quark model); (c) Xu and Kamal [39], (pole model); (d) Cheng and Tseng [40], (pole model); (e) Żenczykowski [41], (pole model); (f) Zou et al. [42], (pole model); (g) Sharma and Verma [43], (current algebra); (h) Cheng and Tseng [40], (current algebra); (i) Geng et al. [44], (SU(3)F symmetry(IRA)); (j) Geng et al. [45], (SU(3)F symmetry(IRA)); (k) Zhao et al. [50], (SU(3)F symmetry(TDA)); (l) Huang et al. [46], (SU(3)F symmetry(IRA)); (m) Hsiao et al. [51], (SU(3)F symmetry(TDA)); (n) Hsiao et al. [51], (SU(3)F-breaking (TDA)); (o) Zhong et al. [47], (SU(3)F symmetry(IRA)); (p) Zhong et al. [47], (SU(3)F-breaking (IRA)); (q) Xing et al. [49], (SU(3)F symmetry(IRA)); (r) Geng et al. [53], (SU(3)F symmetry(KPW)); (s) Zhong et al. (I) [52], (SU(3)F (TDA)); (t) Zhong et al. (II) [52], (SU(3)F (IRA)). and (u) the Belle and Belle II combined measurements. Throughout this review, the TDA represents topological diagram approach, and the IRA represents irreducible representation amplitude. The KPW impose the Körner–Pati–Woo theorem, which restricts certain decay amplitudes due to the antisymmetry of diquark configurations.
In 2025, Belle II reported the branching fraction for the singly Cabibbo-suppressed (SCS) decay [10]. The invariant mass distributions are shown in Figure . Fits to data combining Belle and Belle II return signal yields of , , and events for the , , and decay modes, corresponding to statistical significances of , , and , respectively. The measured branching ratios for and are
and
Belle II find no evidence for the decay and set an upper limit at the 90% confidence level (C.L.) of
Branching ratios obtained from independent fits to Belle and Belle II data are consistent with those obtained from simultaneous fits. Using the branching fraction of the normalization mode, = [36], Belle II obtained the absolute branching fractions, which are listed in Table 2. The corresponding experimental results were compared with theoretical expectations, as shown in Figure 6.
Figure 5.
The invariant mass spectra of (a) Λη, (b)Λη′, and (c) Λπ0 candidates overlaid with the fit results obtained using the Belle and Belle II data samples [10]. Dots with error bars represent the number of events in data; solid red curves indicate the signal probability density functions; dashed red lines denote the fitted combinatorial backgrounds; solid blue curves illustrate the fit results. The gray bars show the pull distributions of the fit results.
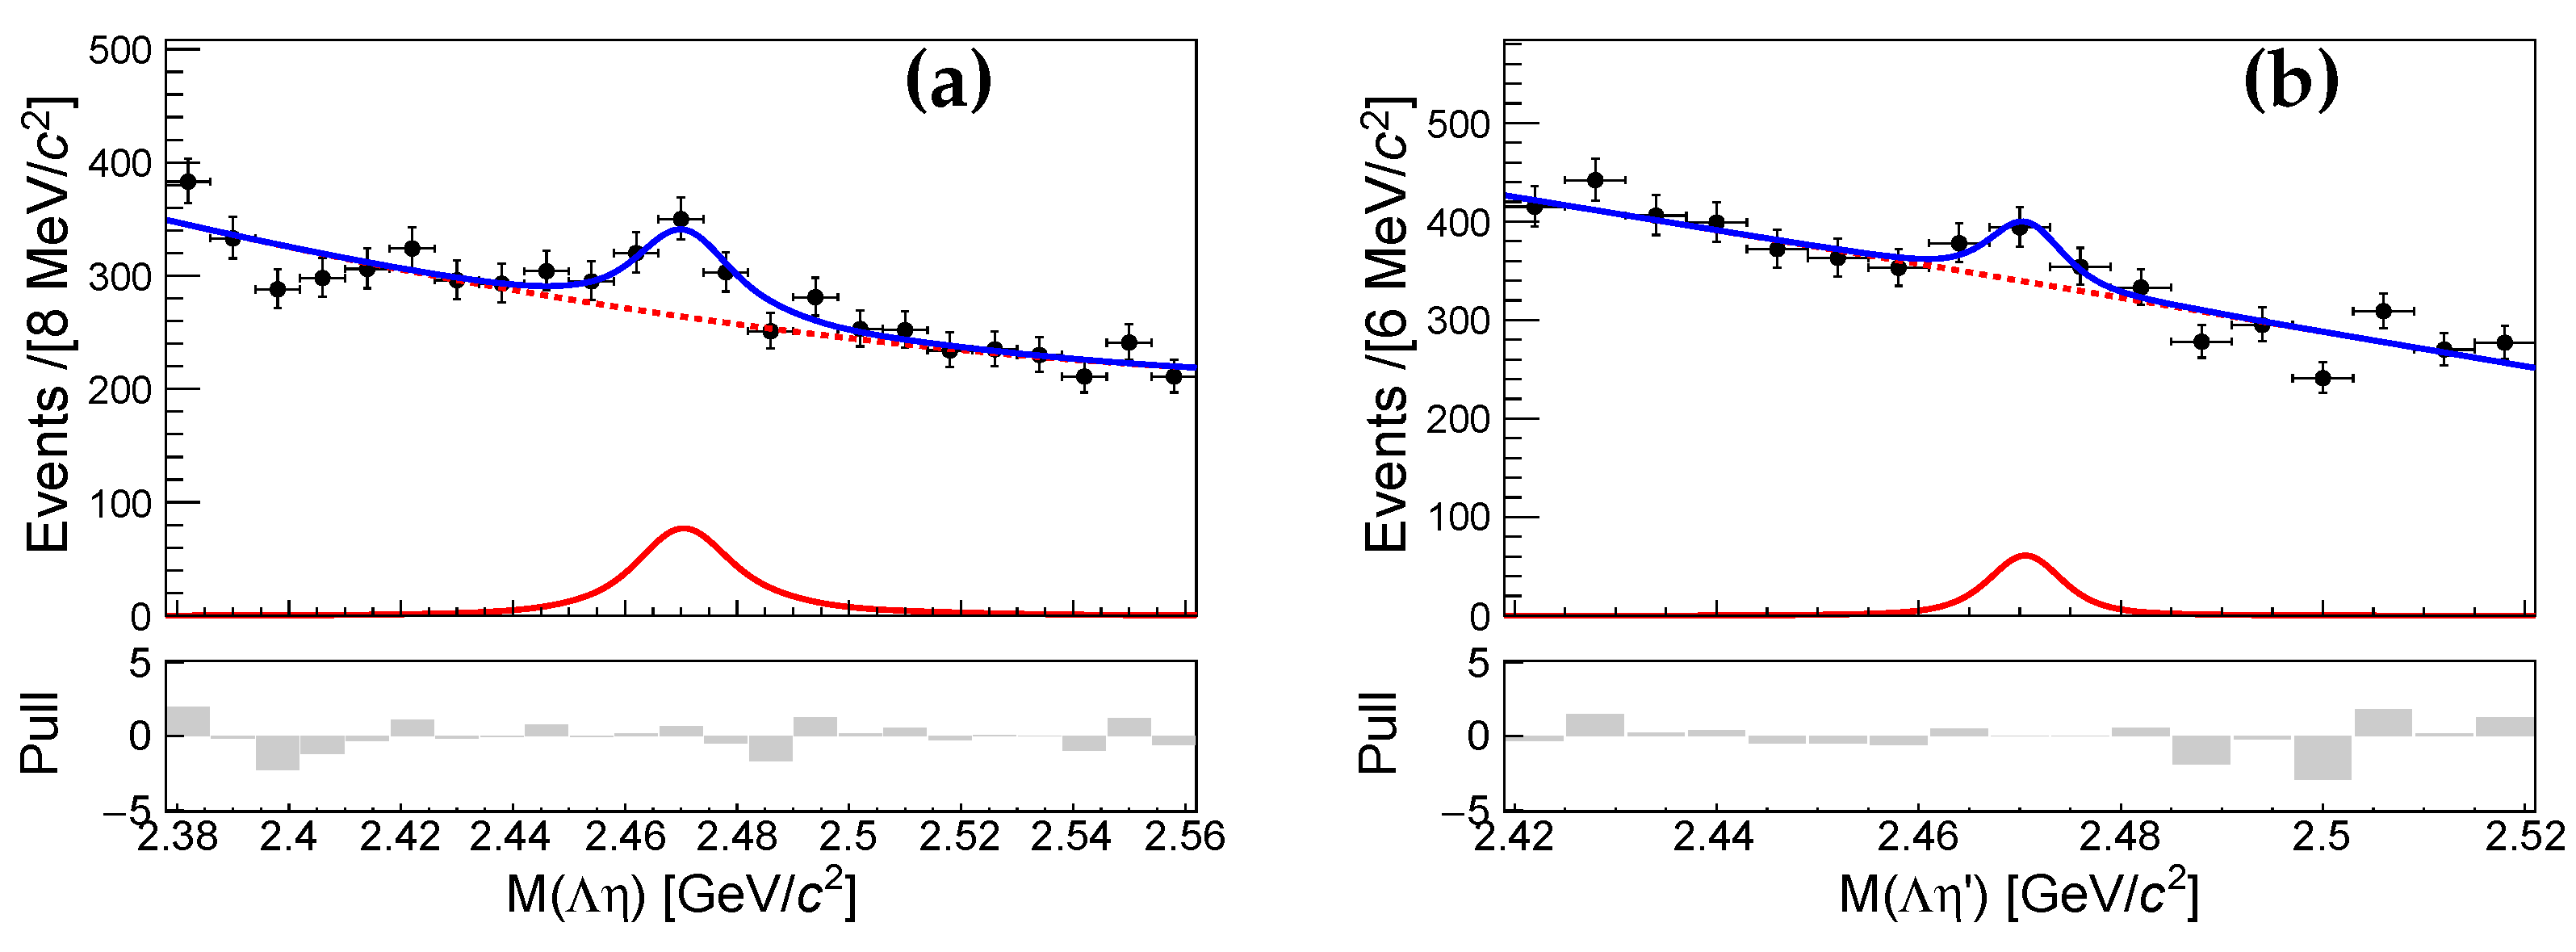
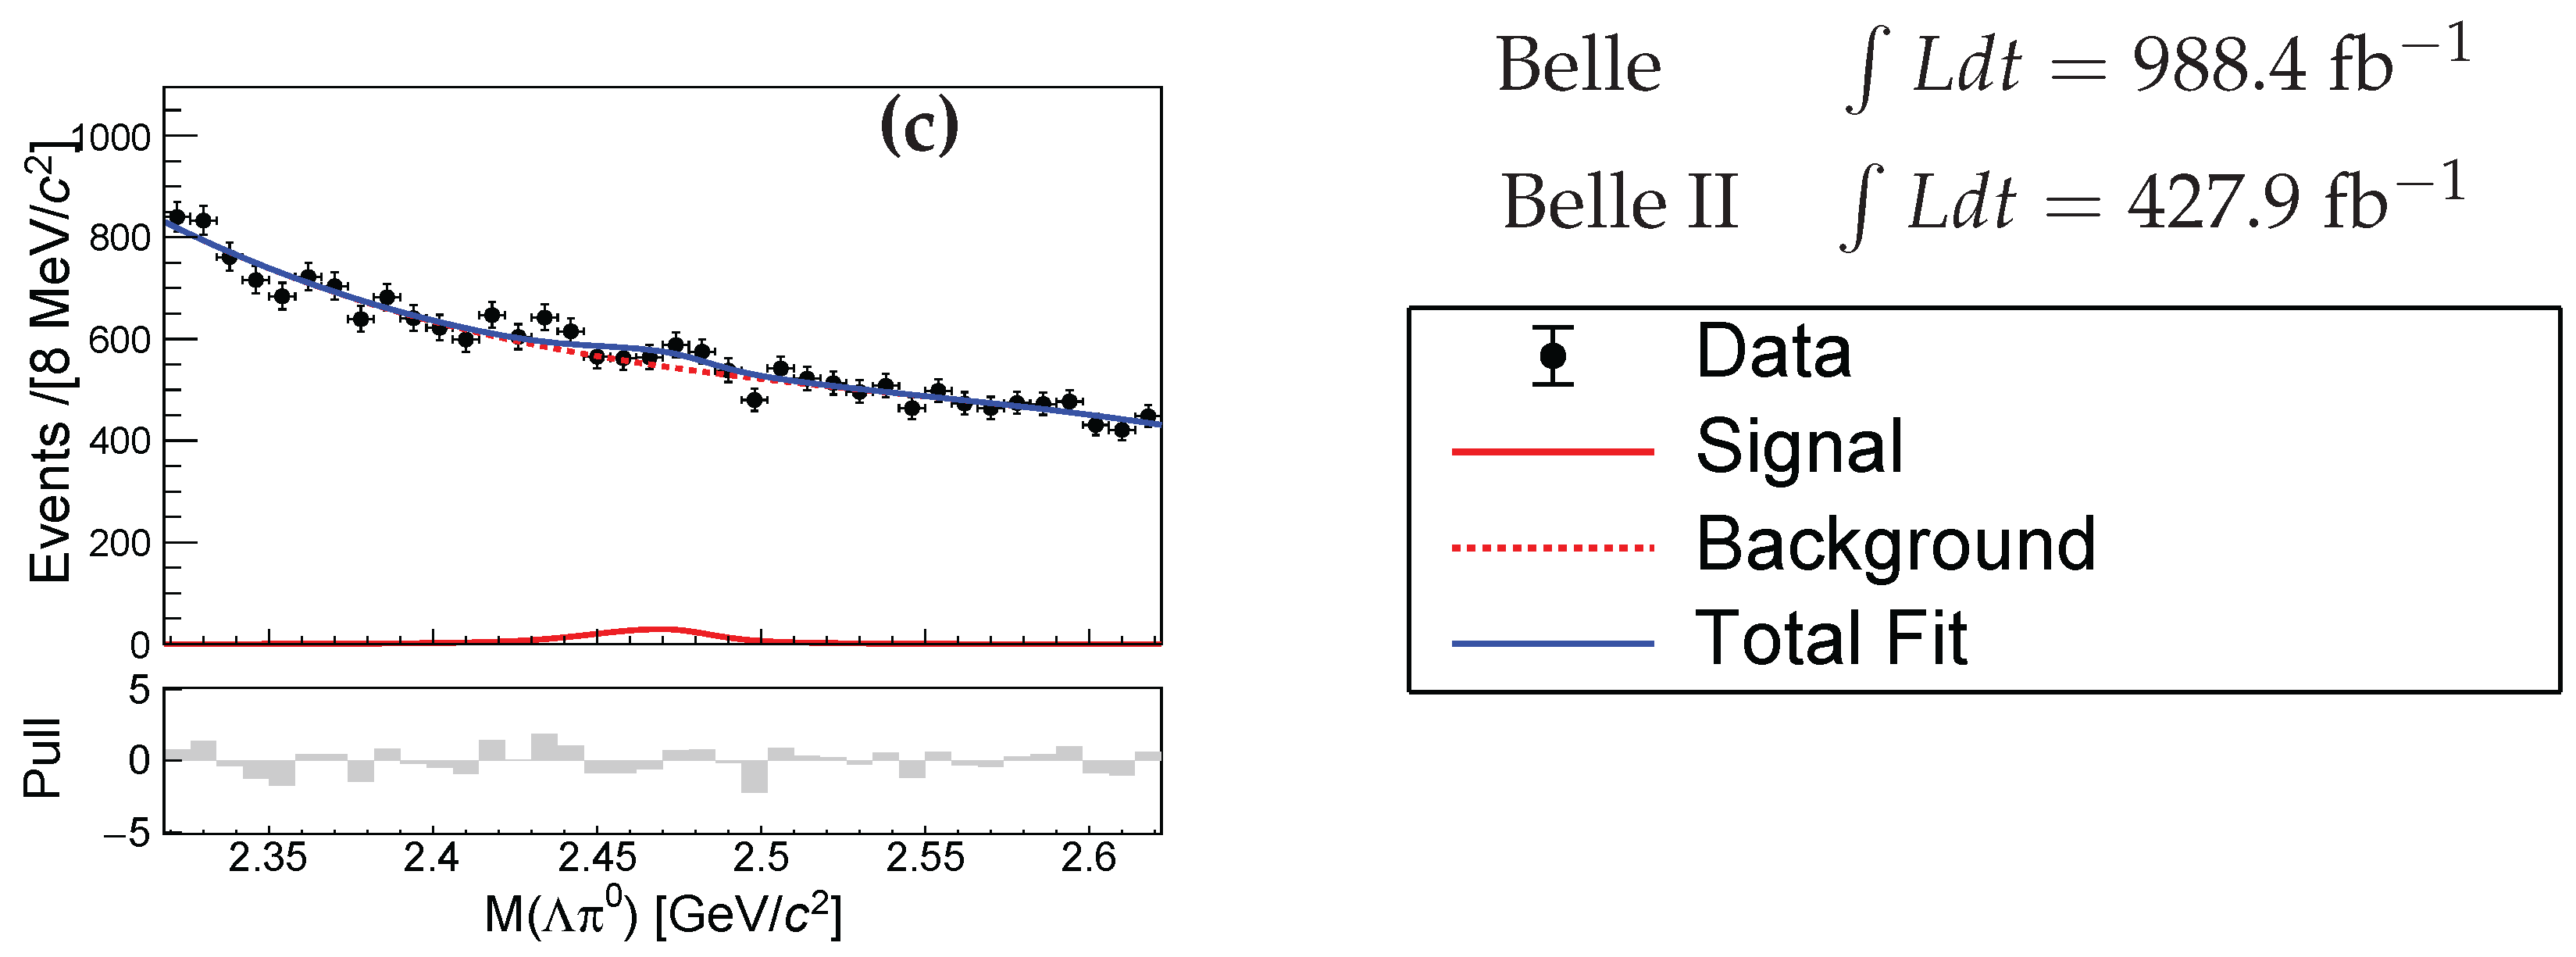
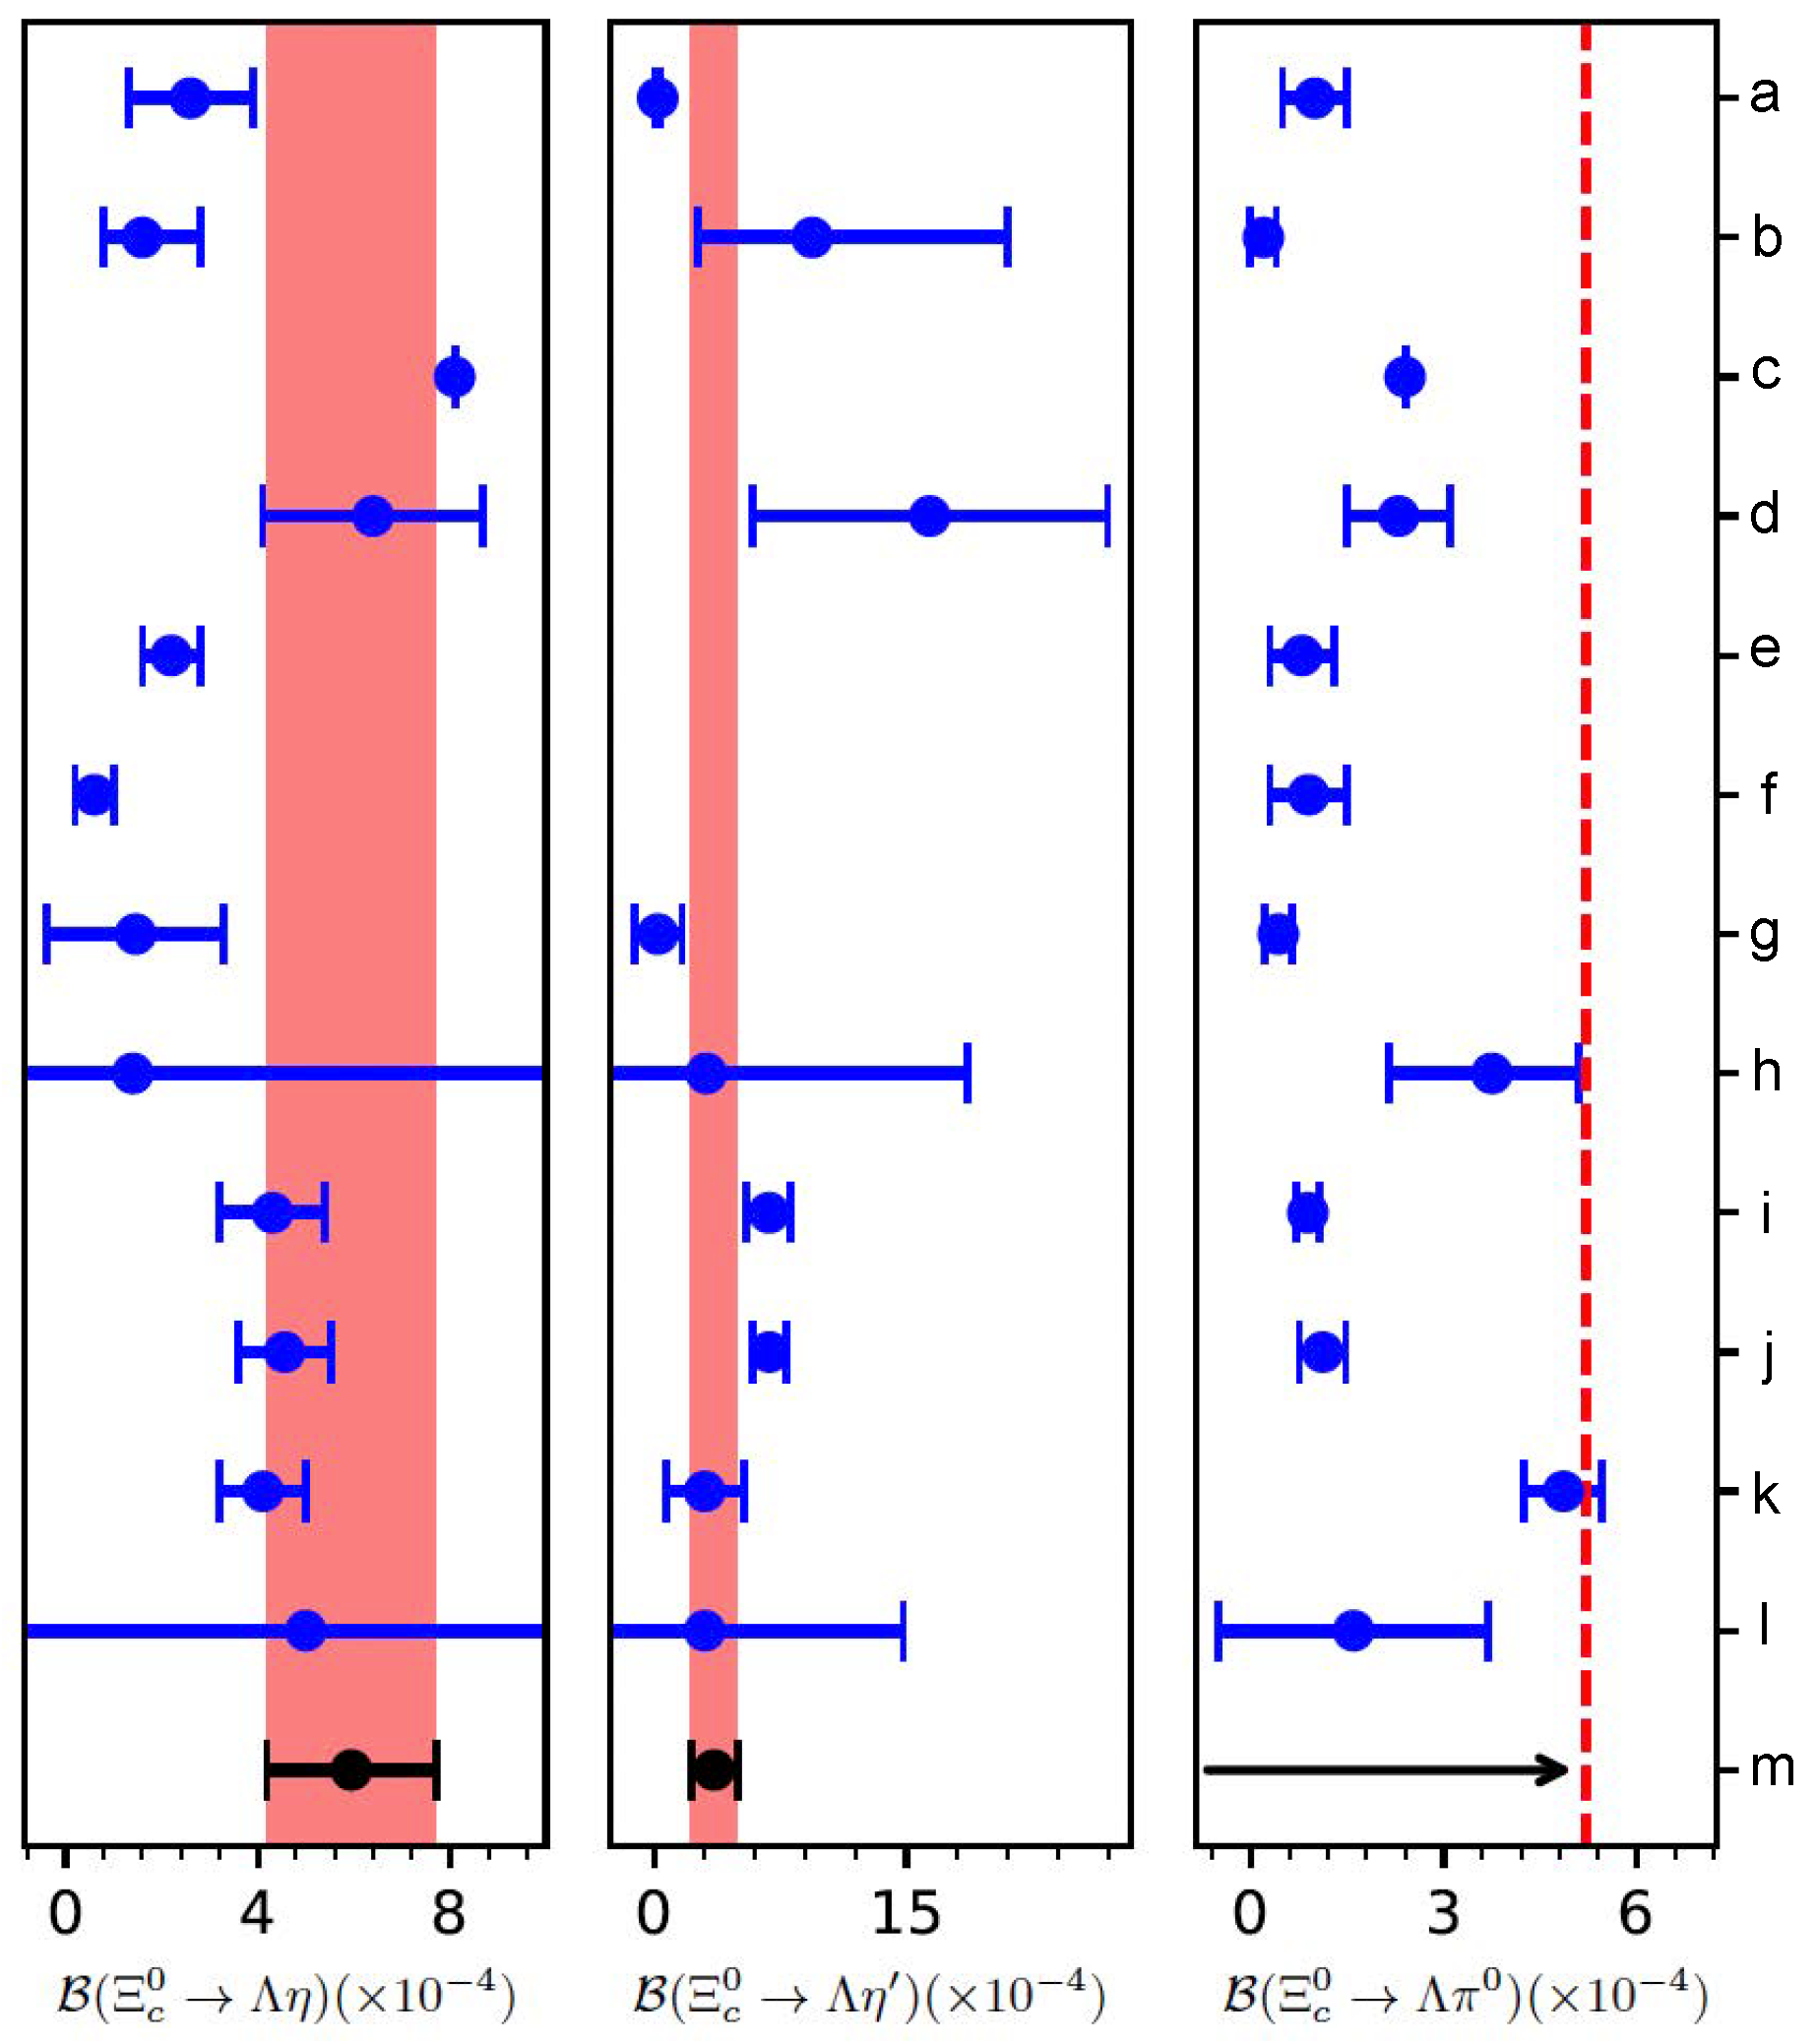
Figure 6.
Comparison of the branching fractions , , and the measured 90% C.L. upper limit on with respect to theoretical predictions [42,44,45,47,49,50,51,52,53]. Dots with error bars represent central values and their uncertainties; those without error bars indicate that no theoretical uncertainty is provided. Missing dots signify the absence of theoretical predictions for the corresponding decay mode. Some predictions exhibit large errors that are not fully shown within the present scale. The black dots with error bars denote the measured absolute branching fractions of the decays and . The red vertical bands denote the intervals dominated by the systematic uncertainty of . The red dashed line and black arrow indicate the measured 90% C.L. upper limits on . The meanings of the vertical coordinates (a)-(m) in the figure: (a) Zhao et al. [50], (SU(3)F symmetry, TDA); (b) Geng et al. [44], (SU(3)F symmetry, IRA); (c) Zou et al. [42], (pole model); (d) Geng et al. [45], (SU(3)F symmetry, IRA); (e) Hsiao et al. (I) [51], (SU(3)F symmetry, TDA); (f) Hsiao et al. (II) [51], (SU(3)F-breaking, TDA); (g) Zhong et al. (I) [47], (SU(3)F symmetry, IRA); (h) Zhong et al. (II) [47], (SU(3)F-breaking, IRA); (i) Geng et al. [53], (SU(3)F symmetry, KPW); (j) Zhong et al. [52], (SU(3)F, TDA); (k) Xing et al. (I) [49], (SU(3)F, IRA, real form factors); (l) Xing et al. (II) [49], (SU(3)F, IRA, complex form factors); (m) Belle and Belle II combined measurements. For Ref. [49], (I) and (II) denote the predicted values obtained using real form factors only and those incorporating complex form factors, respectively.
3.2. Studies of Decays
The weak decays of the baryon have been extensively studied within various dynamical models [42] and SU(3)-based frameworks [44,45,46,47,48,50,51,52,53,54]. The corresponding theoretical predictions differ substantially among these approaches, highlighting the crucial role of experimental measurements in constraining and refining theoretical descriptions of decays. However, most decay channels remain experimentally unmeasured, particularly the SCS modes. Figure 7 illustrates the typical decay diagrams arising from internal W-emission and W-exchange contributions for the SCS decays , , and . Notably, the decay proceeds through purely nonfactorizable diagrams, so its measurement provides a direct probe of their importance in decays. Predictions from different theoretical models place the branching fractions of these channels in the range of to [42,44,45,46,47,48,50,51,52,53,54].
In 2024, Belle II measured the branching fractions of these three SCS decay modes , , and [11]. The invariant mass distributions are shown in Figure 8. The signal yields for the decays , , and are (), (), and () events at Belle (Belle II), respectively. Each signal has a significance greater than , using the combined data samples collected by the Belle and Belle II detectors. The ratios of branching fractions relative to the normalization mode are determined to be
and
Using the branching fraction of the normalization mode, [36], Belle II obtained the absolute branching fractions. The results are summarized in Table 2 and compared with theoretical expectations in Figure 9.
Beyond SCS decays, theoretical studies also predict sizable branching fractions for several CF modes of . In particular, the CF decay is predicted to have a branching fraction of order [42,45,46,47,48,50,51,54], yet had not been measured previously, motivating its first experimental study. For another CF decay, , earlier measurements suffered from substantial uncertainties [55], while the more recent results from Belle and Belle II provide a significantly improved determination of the branching fraction. Meanwhile, the SCS decay is predicted to have a branching fraction in the range – [42,45,46,47,48,50,51,54]. Given its experimental similarity to , it was also searched for in the Belle and Belle II data samples.
In 2025, Belle II reported the first measurements of the branching fractions for and , together with an improved determination of the branching fraction for , using as the normalization mode [12]. The invariant mass distributions are shown in Figure 10. The signal yields for , , and are 286±40 (178±31), 2728±165 (1419±63), 134±30 (94±19) at Belle (Belle II), respectively. The statistical significances for , , and are , greater than , and at Belle (Belle II), respectively. The branching fractions relative to are measured to be
and
Using the branching fraction of the normalization mode, [36], Belle II obtained the absolute branching fractions. These results, summarized in Table 2 and compared with theoretical predictions in Figure 11, provide valuable tests of different theoretical models.
3.3. Studies of Decays
The nonleptonic weak decays of provide a unique testing ground for understanding the factorization scheme involving the transition and final-state interactions. Among the possible final states, decays are particularly useful for examining the isospin properties of the weak interaction in . In the quark-diagram scheme for decays, as shown in Figure 12, direct emission can proceed via a color-allowed factorizable process with external emission (Figure 12(c)), whereas a cannot be produced through this mechanism. Instead, the dominant contributions to the decays arise from color-suppressed internal emission and internal flavor conversion involving the subprocess via exchange.
The absolute branching fractions for and decays were reported by BESIII to be and , respectively [56]. The branching fraction of relative to reported by CLEO is [57]. In 2025, the Belle II performed a precise measurement of the relative branching fraction of [13]. The invariant mass distributions of and for candidates are shown in Figure 13. The signal yields for and are and , respectively. After applying a bin-by-bin correction to estimate the efficiency-corrected yields of both decays, the relative branching fraction was measured to be:
By assuming that the sum of the amplitudes, , is zero [56,58,59], the amplitudes can be expressed in terms of two components, and , corresponding to the isospin amplitudes of the and states of the system, respectively [56,58]. Defining a relative phase difference () between and as , the relationship between the branching fractions and the isospin amplitudes is given by the following equations,
and
With the measured value of and the world-average [36], was determined to be , while the relative strength () was found to be , where the uncertainty is the sum in quadrature of the statistical uncertainty and the uncertainty in . The results show that the isospin amplitude is not significantly suppressed compared to in decays. Here, we note that the calculation assumes isospin symmetry for the non-resonant contributions [58].
In addition, Belle II carried out the first study of intermediate resonant contributions in the decay [13]. Figure 14 presents the Dalitz distribution of versus for the decay , where several enhanced regions associated with intermediate resonant contributions are visible. To study these intermediate states in more detail, the Dalitz plot is projected onto the one-dimensional invariant mass spectra of , , and . The spectra are corrected for reconstruction efficiency, and the non- background is subtracted by fitting the reconstructed mass distribution in each bin. In the spectrum and the Dalitz plot of the decay, shown in Figure 15(a) and on the left panel of Figure 14, respectively, hyperon contributions are found to be relatively weak. Nevertheless, clear localized structures appear in the distribution, which can be tentatively interpreted as the and resonances, as illustrated in Figure 15(b). This observation is consistent with the expectation that hyperons are favored over states in the emission processes [36]. Such a hierarchy may be understood as a consequence of the production mechanism in the decay being dominated by color-suppressed, factorized transitions.
The contribution associated with the resonance is found to be significantly weaker in the spectrum of the channel (Figure 15(c)) than in the distribution observed in the channel (Figure 15(d)). This reduction can be understood as a consequence of isospin symmetry, which favors the production channel over the channel. In addition, a pronounced enhancement close to the mass threshold is present in the spectrum of the decay. This structure corresponds to the diagonal feature observed in the Dalitz distribution shown on the left side of Figure 14. A similar enhancement was previously reported in the study of decays [60]. The resemblance between this structure and the threshold cusp, which is enhanced by the resonance in the system (Figure 15(b)) [61,62], suggests that the feature near the threshold in Figure 15(c) may originate from a threshold cusp amplified by the state.
Both and decays also exhibit a distinct signal associated with the vector meson , as illustrated in Figure 15(e) and (f). In the higher-mass region of the system, an enhancement beyond phase-space expectations is observed in both decay modes. To further clarify the role of isospin symmetry in decays and to improve the understanding of intermediate resonant contributions, such as , , , and states, a dedicated amplitude analysis employing the helicity formalism for these two channels is suggested.
4. Branching Fractions of Charmed Baryons in B Meson Decays
Baryonic B decays provide a valuable laboratory for investigating the production mechanisms of baryon–antibaryon pairs in the nonperturbative regime of QCD. Over the past three decades, a variety of baryonic B decay modes have been observed [36], exhibiting several remarkable features, including threshold enhancements in the baryon–antibaryon invariant mass spectra [63,64,65,66] and a pronounced hierarchy between two-body and multi-body branching fractions [67,68]. These phenomena offer important insights into the kinematic structure and dynamical properties governing baryonic B decays [69].
In 2003, Belle reported the first observation of a two-body baryonic B decay and measured the branching fraction of to be of order [70]. Subsequently, in 2006, Belle observed the doubly charmed decay [71], which was later confirmed by BaBar [72]. In contrast to singly charmed modes, these doubly charmed baryonic B decays were found to have branching fractions at the level of . The decay processes and are governed by the quark-level transitions and , respectively, and involve Cabibbo–Kobayashi–Maskawa (CKM) matrix elements of comparable magnitudes [73]. Nevertheless, their branching fractions differ by nearly two orders of magnitude, indicating that additional dynamical mechanisms may strongly enhance or suppress specific decay channels.
A number of theoretical explanations have been proposed to account for the large decay rates into charmed baryon pairs, including soft nonperturbative mechanisms such as meson exchange [74,75], final-state interactions [76], and hard-gluon exchange contributions [77]. Further experimental studies of baryonic B decays into charmed baryon pairs therefore provide crucial input for probing the underlying decay dynamics and for discriminating among competing theoretical interpretations.
From the theoretical perspective, the decays and have been investigated using both the QCD sum rule approach [78] and the diquark model [79]. The QCD sum rule calculations predict branching fractions as large as [78], while the diquark model estimates values of order , corresponding to roughly – of those for the and decay modes [79]. These processes proceed via purely internal W-boson emission [80], as illustrated in Figure 16, which generates nonfactorizable amplitudes [81] arising from nonperturbative QCD effects such as final-state interactions and soft-gluon exchanges [82,83,84,85].
Within the framework of flavor symmetry, the baryon belongs to a sextet representation of flavor-symmetric states, whereas the baryon is classified as a member of the antitriplet of flavor-antisymmetric states. To date, no B decays into charmed baryon pairs involving both a sextet and an antitriplet have been experimentally observed.
In 2025, Belle II reported the first observation of the two-body baryonic decays and , using collision data samples containing and events collected by the Belle and Belle II detectors, respectively [14]. The yields are extracted from a two-dimensional fit to the distributions of the difference between the expected and observed B-meson energy () and the invariant mass. The fit results are shown in Figure 17. Fits to data combining Belle and Belle II samples yield and signal events for the and decay modes, corresponding to statistical significances of and , respectively. The branching fractions were measured to be
and
The first and second uncertainties are statistical and systematic, respectively, while the third ones arise from the absolute branching fractions of or decays. The observed branching fractions are one order of magnitude smaller than those predicted by the QCD sum rule [78], but are consistent with the expectations of the diquark model [79]. Interestingly, these branching fractions are larger than those of their singly charmed counterparts, and , by about two orders of magnitude [36], although the corresponding combinations of CKM matrix elements in their amplitudes have nearly equal magnitudes.
5. Asymmetry Parameter
In addition to the branching fraction measurement, parity violation in decays can be measured using the decay asymmetry parameter . In the case of the decay, can be extracted by fitting the decay angular distribution according to the differential decay rate function
where is the decay asymmetry parameter of the decay, and is defined as the cosine of the angle between the momentum vector and the opposite of the momentum vector in the rest frame. In weak decays, the interference between parity-violating and parity-conserving amplitudes gives rise to an asymmetry in the angular distribution, which can be quantified by the parameter . The decay asymmetry parameter for the process has been investigated in a number of theoretical models, as summarized in Figure 4. The predicted values differ significantly among different models. Therefore, an experimental determination of the decay asymmetry parameter for this channel is highly desirable.
In 2024, the Belle II presented the first measurement of the decay asymmetry parameter for the decay [9]. The final signal yields in bins of for are shown in Figure 18, together with the results of the simultaneous fit using Eq. (19) with the common for the Belle and Belle II data samples. Using simulated pseudo-experiments generated with different values of , Belle and Belle II test the extraction procedure and finds that it is linear. The product of asymmetry parameters is obtained to be
Taking [36], the value of is calculated to be . The values of extracted via individual fits to the Belle and Belle II data samples are and , respectively, where the uncertainties are statistical only. These results are in good agreement with that obtained from the simultaneous fit.
6. CP Violation
A viable way to investigate violation and examine U-spin symmetry is to study SCS three-body hadronic decays of charmed baryons [26,27]. Under the assumption of exact U-spin symmetry, the following relations hold:
Despite the large branching fractions of these decay modes, none of the individual asymmetries, nor their U-spin sums, have been experimentally determined so far. LHCb has measured the difference between and [86]; however, since these two modes are not connected by U-spin symmetry, this result does not provide direct information on U-spin-symmetry breaking.
In 2025, Belle II presented the first measurements of the asymmetries in the decays and , where h denotes either a kaon or a pion [28]. The analysis is based on Belle II data sample corresponding to an integrated luminosity of of collisions, collected by the Belle II experiment at or near the C.M. energy between 2019 and 2022.
The asymmetry in the decay rate of a charmed baryon into a final state is defined as
Experimentally, this quantity is obtained from the asymmetry in the reconstructed signal yields,
after applying corrections for detector-induced and production-related asymmetries. For sufficiently small asymmetries, one can express as
where accounts for the forward–backward asymmetry in charmed baryon production in collisions [87,88,89], and denotes the detection asymmetry associated with the charged final-state particles. Since the production asymmetry is an odd function of the cosine of the polar angle of the charmed baryon momentum in the C.M. frame, , its contribution can be suppressed by replacing the raw yield asymmetry in Eq. (24) with the average value measured in the forward and backward hemispheres,
The detection asymmetries associated with charged particles are removed by subtracting the yield asymmetries measured in several CF control channels, including , , and . The decay mode is chosen instead of because the phase-space distributions of the pair in the former are similar to those in , while this similarity does not hold for . As these control channels are Cabibbo favored, they are expected to have negligible asymmetries, which are therefore assumed to be zero.
The decay-rate asymmetry for the process is determined as
while that for is given by
In this procedure, subtracting the asymmetries cancels the detection asymmetries associated with the final-state baryon, while including the term eliminates the residual detection asymmetries of the and introduced by the subtraction of . For the control channels, the distributions of the charmed baryon momentum in the C.M. frame and of are required to match those of the signal channels. In addition, the kinematic distributions of the kaon–pion pair are aligned by applying event-by-event kinematic weights.
Figure 19 and Figure 20 show the mass distributions of the candidates for each decay channel, the results of the final fit, and the resulting averaged yield asymmetries as functions of the masses. Table 3 lists the measured yields and forward, backward, and averaged yield asymmetries.
Using of collisions collected by Belle II, Belle II measured
These results are consistent with symmetry. Their U-spin sums are
which are consistent with U-spin symmetry.
These are the world’s first measurements of for individual hadronic three-body charmed baryon decays. The uncertainties are dominated by statistical contributions; therefore, future measurements with larger data samples collected by Belle II will enable us to perform precision searches for violation and to carry out stringent tests of U-spin sum rules.
7. Summary and Outlook
We summarize the recent experimental progress on charmed baryons achieved by the Belle and Belle II experiments. Several absolute branching fractions for , , and decays have been determined for the first time or with the highest precision, as presented in Table 2. The decays and have been found. The corresponding branching fractions were measured to be and . The asymmetry parameter for was obtained to be . No CP asymmetries in the SCS decays , , , and were found. The U-spin symmetry was measured to be consistent with zero. The first-time and updated measurements of the branching fraction and asymmetry parameter serve as essential inputs for flavor-symmetry analyses and dynamical models. The first Belle II measurements of CP violation in three-body SCS decays of and open a new avenue for quantitative tests of U-spin relations and for searching for effects beyond SM expectations.
The Belle II experiment, operating at a high-luminosity electron–positron collider, offers an excellent platform characterized by low background levels and well-identified final states. Benefiting from improved vertex reconstruction performance, long-lived particles such as , , , and can be detected with higher efficiency at Belle II. The total integrated luminosity at Belle and Belle II exceeds 1.6 ab−1. The integrated luminosity at Belle II is expected to achieve 4 ab−1 and 10 ab−1 in 2029 and 2034, respectively [90]. Therefore, using large data samples, Belle II will substantially improve the accuracy of measurements of branching fraction, decay asymmetry, and CP violation, and extend such studies to a wider set of channels. These forthcoming high-statistics results are expected to sharpen discrimination among competing theoretical frameworks and to stimulate sustained progress in understanding the nonleptonic weak dynamics of charmed baryons.
Author Contributions
Conceptualization, S.J and C.-P.S; investigation, Y.-W.Z and S.J; writing—original draft preparation, Y.-W.Z; writing—review and editing, Y.-W.Z, S.J, and C.-P.S; supervision, S.J and C.-P.S. All authors have read and agreed to the published version of the manuscript.
Funding
This work is supported by National Key R&D Program of China under contract Nos. 2024YFA1610503, and 2024YFA1610504. National Natural Science Foundation of China under contract Nos. 121350051419 and 12475076; Fundamental Research Funds of China for the Central Universities under contract Nos. 2242025RCB00141420 and RF1028623046.
Institutional Review Board Statement
Not applicable.
Informed Consent Statement
Not applicable.
Data Availability Statement
Not applicable.
Conflicts of Interest
The authors declare no conflict of interest.
Abbreviations
The following abbreviations are used in this manuscript:
| CPV | CP Violation |
| CF | Cabibbo–Favored |
| CS | Cabibbo–Suppressed |
| SCS | singly Cabibbo–Suppressed |
| SM | Standard Model |
References
- Donoghue, J. F.; Pakvasa, S. Signals of CP Nonconservation in Hyperon Decay . Phys. Rev. Lett. 1985, 55, 162. [Google Scholar] [CrossRef] [PubMed]
- Sakharov, A. D. Violation of CP Invariance, C Asymmetry, and Baryon Asymmetry of the Universe . Pisma Zh. Eksp. Teor. Fiz. 1967, 5, 32–35. [Google Scholar]
- Chau, L. L.; Cheng, H. Y.; Tseng, B. Analysis of two-body decays of charmed baryons using the quark-diagram scheme . Phys. Rev. D 1996, 54, 2132. [Google Scholar] [CrossRef]
- Cheng, H. Y. Charmed baryons circa 2015, Front. Phys. 2015, 10, 101406. [Google Scholar]
- Cheng, H. Y. Charmed baryon physics circa 2021, Chin. J. Phys. 2022, 78, 324. [Google Scholar]
- Zupanc, A.; et al. (Belle Collaboration), Measurement of the Branching Fraction of Λc+→pK-π+. Phys. Rev. Lett. 2014, 113, 042002. [Google Scholar] [CrossRef]
- Li, Y. B.; et al. (Belle Collaboration), First Measurements of Absolute Branching Fractions of the Ξc0 Baryon at Belle. Phys. Rev. Lett. 2019, 122, 082001. [Google Scholar] [CrossRef]
- Li, Y. B.; et al. (Belle Collaboration), First Measurements of Absolute Branching Fractions of the Ξc+ Baryon at Belle. Phys. Rev. D 2019, 100, 031101. [Google Scholar] [CrossRef]
- Adachi, I.; et al. Belle and Belle II Collaborations), Measurements of the branching fractions of Ξc0→Ξ0π0, Ξc0→Ξ0η, and Ξc0→Ξ0η′ and the decay asymmetry parameter of Ξc0→Ξ0. π0, JHEP 10, 045 (2024).
- Abumusabh, M.; et al. (Belle and Belle II Collaborations), First measurements of the branching fractions for the decay modes Ξc0→Λη and Ξc0→Λη′ and search for the decay Ξc0→Λ. π0 using Belle and Belle II data, JHEP 03, 061 (2025).
- Adachi, I.; et al. (Belle and Belle II Collaborations), Observations of the singly Cabibbo-suppressed decays Ξc+→pKS0, Ξc+→Λπ+, and Ξc+→Σ0. π+ at Belle and Belle II, JHEP 03, 061 2025. [Google Scholar]
- Adachi, I.; et al. (Belle and Belle II Collaborations), Measurements of the branching fractions of Ξc+→Σ+KS0, Ξc+→Ξ0π+, and Ξc+→Ξ0K+ at Belle and Belle II. JHEP 08 2025, 195. [Google Scholar]
- Adachi, I.; et al. (Belle and Belle II Collaborations), Measurement of the branching fraction of Λc+→pKS0π0 at Belle. Phys. Rev. D 2025, 112, 092005. [Google Scholar] [CrossRef]
- Abumusabh, M.; et al. (Belle and Belle II Collaborations), Observation of the decays B+→Σc(2455)++Ξ¯c- and B0→Σc(2455)0Ξ¯c0. Phys. Rev. D 2025, 112, 052001. [Google Scholar] [CrossRef]
- Lee, T. D.; Yang, C. N. General partial wave analysis of the decay of a hyperon of spin 1/2 . Phys. Rev. 1957, 108, 1645–1647. [Google Scholar] [CrossRef]
- Sakharov, A. D. Baryon asymmetry of the universe . Sov. Phys. Usp. 1990, 34, 65–80. [Google Scholar] [CrossRef]
- Shaposhnikov, M. E. Baryon asymmetry of the Universe in Standard Electroweak Theory . Nucl. Phys. B 1987, 287, 757–775. [Google Scholar] [CrossRef]
- et al.; R. Aaij et al. (LHCb Collaboration) Observation of charge–parity symmetry breaking in baryon decays . Nature 2025, 643, 1223–1228. [Google Scholar] [CrossRef]
- Brod, J.; Kagan, A. L.; Zupan, J. Size of direct CP violation in singly Cabibbo-suppressed D decays . Phys. Rev. D 2012, 86, 014023. [Google Scholar] [CrossRef]
- Cheng, H. Y.; Chiang, C. W. Direct CP violation in two-body hadronic charmed meson decays . Phys. Rev. D Erratum: Phys. Rev. D 85, 079901 (2012). [CrossRef. 2012, 85, 034036. [Google Scholar] [CrossRef]
- Li, H. N.; Lu, C. D.; Yu, F. S. Branching ratios and direct CP asymmetries in D→PP decays . Phys. Rev. D 2012, 86, 036012. [Google Scholar] [CrossRef]
- Grossman, Y.; Kagan, A. L.; Nir, Y. New physics and CP violation in singly Cabibbo-suppressed D decays . Phys. Rev. D 2007, 75, 036008. [Google Scholar] [CrossRef]
- Grossman, Y.; Kagan, A. L.; Zupan, J. Testing for new physics in singly Cabibbo-suppressed D decays . Phys. Rev. D 2012, 85, 114036. [Google Scholar] [CrossRef]
- Bigi, I. I. Probing CP asymmetries in charm baryons decays . arXiv 2012, arXiv:1206.4554. [Google Scholar] [CrossRef]
- Ünal, Y.; Meißner, U.-G. Strong CP violation in spin-1/2 singly charmed baryons . JHEP 01 2021, 115. [Google Scholar] [CrossRef]
- Grossman, Y.; Schacht, S. U-spin sum rules for CP asymmetries of three-body charmed baryon decays . Phys. Rev. D 2019, 99, 033005. [Google Scholar] [CrossRef]
- Wang, D. Sum rules for CP asymmetries of charmed baryon decays in the SU(3)F limit . Eur. Phys. J. C 2019, 79, 429. [Google Scholar] [CrossRef]
- Abumusabh, M.; et al. (Belle and Belle II Collaborations), Search for CP violation in Ξc+→Σ+h+h- and Λc+→ph+. h- decays at Belle II arXiv:2509.25765.
- Akai, K. Nucl. Instrum. Meth. A 2003, 499, 191–227. [CrossRef]
- Abashian, A.; et al. (Belle Collaboration), The Belle Detector. Nucl. Instrum. Meth. A 2002, 479, 117–232. [Google Scholar] [CrossRef]
- Brodzicka, J.; et al. (Belle Collaboration), Physics Achievements from the Belle Experiment. Prog. Theor. Exp. Phys. 2012, 04D001. [Google Scholar]
- Abe, K.; et al. (Belle Collaboration), Observation of large CP violation in the neutral B meson system. Phys. Rev. Lett. 2001, 87, 091802. [Google Scholar] [CrossRef]
- Abe, T.; et al. (Belle II Collaboration), Belle II Technical Design Report. arXiv [physics.ins-det. 2010, arXiv:1011.0352. [Google Scholar]
- Altmannshofer, W.; et al. (Belle II Collaboration). The Belle II Physics Book, Prog. Theor. Exp. Phys. 2019 2019, 123C01. [Google Scholar]
- The Belle II Collaboration. Measurement of the integrated luminosity of data samples collected during 2019–2022 by the Belle II experiment [hep-ex]. [CrossRef. arXiv:2407.00965.
- Navas, S.; et al. (Particle Data Group), Review of Particle Physics. Phys. Rev. D 2024, 110, 030001. [Google Scholar] [CrossRef]
- Körner, J. G.; Krämer, M. Exclusive nonleptonic charm baryon decays . Z. Phys. C 1992, 55, 659. [Google Scholar] [CrossRef]
- Ivanov, M. A.; Körner, J. G.; Lyubovitskij, V. E.; Rusetsky, A. G. Exclusive nonleptonic decays of bottom and charm baryons in a relativistic three-quark model: Evaluation of nonfactorizing diagrams . Phys. Rev. D 1998, 57, 5632. [Google Scholar] [CrossRef]
- Xu, Q. P.; Kamal, A. N. Cabibbo-favored nonleptonic decays of charmed baryons . Phys. Rev. D 1992, 46, 270. [Google Scholar] [CrossRef]
- Cheng, H. Y.; Tseng, B. Cabibbo-allowed nonleptonic weak decays of charmed baryons . Phys. Rev. D 1993, 48, 4188. [Google Scholar] [CrossRef]
- Żenczykowski, P. Nonleptonic charmed baryon decays: Symmetry properties of parity-violating amplitudes . Phys. Rev. D 1994, 50, 5787. [Google Scholar] [CrossRef] [PubMed]
- Zou, J. Q.; Xu, F. R.; Meng, G. B.; Cheng, H. Y. Two-body hadronic weak decays of anti-triplet charmed baryons . Phys. Rev. D 2020, 101, 014011. [Google Scholar] [CrossRef]
- Sharma, K. K.; Verma, R. C. A study of weak mesonic decays of Λc and Ξc baryons on the basis of HQET results . Eur. Phys. J. C 1999, 7, 217. [Google Scholar] [CrossRef]
- Geng, C. Q.; Hsiao, Y. K.; Liu, C. W.; Tsai, T. H. Anti-triplet charmed baryon decays with SU(3) flavor symmetry . Phys. Rev. D 2018, 97, 073006. [Google Scholar] [CrossRef]
- Geng, C. Q.; Liu, C. W.; Tsai, T. H. Asymmetries of anti-triplet charmed baryon decays . Phys. Lett. B 2019, 794, 19. [Google Scholar] [CrossRef]
- Huang, F.; Xing, Z. P.; He, X. Z. A global analysis of charmless two body hadronic decays for anti-triplet charmed baryons, JHEP 03 (2022) 143.
- Zhong, H.; Xu, F.; Wen, Q.; Gu, Y. Weak decays of anti-triplet charmed baryons from the perspective of flavor symmetry, JHEP 02 (2023) 235.
- Xing, Z. P.; He, X. Z.; Huang, F.; Yang, C. Global analysis of measured and unmeasured hadronic two-body weak decays of anti-triplet charmed baryons . Phys. Rev. D 2023, 108, 053004. [Google Scholar] [CrossRef]
- Xing, Z. P.; Shi, Y. J.; Sun, J.; Xing, Y. SU(3) symmetry analysis in charmed baryon two body decays with penguin diagram contribution . Eur. Phys. J. C 2024, 84, 1014. [Google Scholar] [CrossRef]
- Zhao, H. J.; Wang, Y. L.; Hsiao, Y. K.; Yu, Y. A diagrammatic analysis of two-body charmed baryon decays with flavor symmetry, JHEP 02 (2020) 165.
- Hsiao, Y. K.; Wang, Y. L.; Zhao, H. J. Equivalent SU(3)f approaches for two-body anti-triplet charmed baryon decays, JHEP 09 (2022) 35.
- Zhong, H.; Xu, F.; Cheng, H. Y. Analysis of hadronic weak decays of charmed baryons in the topological diagrammatic approach . Phys. Rev. D 2024, 109, 114027. [Google Scholar] [CrossRef]
- Geng, C. Q.; He, X. G.; Jin, X. N.; Liu, C. W.; Yang, C. Complete determination of SU(3)f amplitudes and strong phase in Λc+→Ξ0K+ . Phys. Rev. D 2024, 109 L073102. [Google Scholar] [CrossRef]
- Liu, C. W. Nonleptonic two-body weak decays of charmed baryons . Phys. Rev. D 2024, 109, 033004. [Google Scholar] [CrossRef]
- et al.; K. W. Edwards et al. (CLEO Collaboration) Observation of new decay modes of the charmed-strange baryon Ξc+ . Phys. Lett. B 1996, 373, 691. [Google Scholar] [CrossRef]
- Ablikim, M.; et al. (BESIII Collaboration), Measurement of the branching fraction for Λc+→pK-π+. Phys. Rev. Lett. 2017, 118, 112001. [Google Scholar] [CrossRef]
- Alam, M. S.; et al. (CLEO Collaboration), Measurement of Cabibbo-suppressed decays of the Λc+ baryon. Phys. Rev. D 1998, 57, 4467–4470. [Google Scholar] [CrossRef]
- Lü, C. D.; Wang, W.; Yu, F. S. Test flavor SU(3) symmetry in exclusive Λc decays . Phys. Rev. D 2016, 93, 056008. [Google Scholar] [CrossRef]
- Gronau, M.; Rosner, J. L.; Wohl, C. G. Isospin analysis of charmed baryon decays . Phys. Rev. D 2018, 98, 073003. [Google Scholar] [CrossRef]
- Li, L. K.; et al. (Belle Collaboration), Measurement of branching fractions of Λc+→pKS0KS0 and Λc+→pKS0η at Belle. Phys. Rev. D 2023, 107, 032004. [Google Scholar] [CrossRef]
- Lee, J. Y.; et al. (Belle Collaboration), Measurement of branching fractions of Λc+→ηΛπ+, ηΣ0π+, Λ(1670)π+, and ηΣ(1385)+. Phys. Rev. D 2021, 103, 052005. [Google Scholar] [CrossRef]
- Yang, S. B.; et al. (Belle Collaboration), Observation of a threshold cusp at the Λη threshold in the pK- mass spectrum with Λc+→pK-π+ decays. Phys. Rev. D 2023, 108, L031104. [Google Scholar] [CrossRef]
- Abe, K.; et al. (Belle Collaboration), Observation of B±→pp¯K±. Phys. Rev. Lett. 2002, 88, 181803. [Google Scholar] [CrossRef]
- Wang, M. Z.; et al. (Belle Collaboration), Observation of B+→pp¯π+, B0→pp¯K0, and B+→pp¯K*+. Phys. Rev. Lett. 2004, 92, 131801. [Google Scholar] [CrossRef]
- et al.; B. Aubert et al. (BaBar Collaboration) Measurement of the B+→pp¯K+ branching fraction and study of the decay dynamics . Phys. Rev. D 2005, 72, 051101. [Google Scholar] [CrossRef]
- Aaij, R.; et al. (LHCb Collaboration), Observation of charmless baryonic decays B(s)0→pp¯h+h′-. Phys. Rev. D 2017, 96, 051103. [Google Scholar] [CrossRef]
- Chistov, R.; Decays, Baryonic B.J. Phys. Conf. Ser. 2016, 675, 022007. [CrossRef]
- Huang, X.; Hsiao, Y.-K.; Wang, J.; Sun, L. Baryonic . B meson decays, Adv. High Energy Phys. 2022, 4343824. [Google Scholar]
- Bevan, A. J.; et al. (Belle Collaboration), The Physics of the B Factories. Eur. Phys. J. C 2014, 74, 3026. [Google Scholar] [CrossRef]
- Gabyshev, V.; et al. (Belle Collaboration), Observation of the Decay B¯0→Λc+p¯. Phys. Rev. Lett. 2003, 90, 121802. [Google Scholar] [CrossRef]
- Ushiroda, Y.; et al. (Belle Collaboration), Time-dependent CP asymmetries in B0→Ks0π0γ transitions. Phys. Rev. D 2006, 74, 111104. [Google Scholar] [CrossRef]
- Aubert, B.; et al. (BaBar Collaboration), Study of B¯→ΞcΛ¯c- and B¯→Λc+Λ¯c-K decays at BABAR. Phys. Rev. D 2008, 77, 031101. [Google Scholar] [CrossRef]
- Cheng, H.-Y. Exclusive baryonic B decays circa 2005 . Int. J. Mod. Phys. A 2006, 21, 4209–4232. [Google Scholar] [CrossRef]
- Cheng, H. Y.; Chua, C. K.; Tsai, S. Y. Doubly charmful baryonic B decays . Phys. Rev. D 2006, 73, 074015. [Google Scholar] [CrossRef]
- Cheng, H. Y.; Chua, C. K.; Hsiao, Y. K. Study of B¯→ΛcΛ¯c and B¯→ΛcΛ¯cK . Phys. Rev. D 2009, 79, 114004. [Google Scholar] [CrossRef]
- Chen, C. H. Production of doubly-charmed baryons in B decays . Phys. Lett. B 2006, 638, 214. [Google Scholar] [CrossRef]
- Rui, Z.; Zou, Z. T.; Li, Y. Higher twist corrections to doubly-charmed baryonic B decays . J. High Energy Phys. 2024, 12, 159. [Google Scholar] [CrossRef]
- Chernyak, V. L.; Zhitnitsky, I. R. B-meson exclusive decays into baryons . Nucl. Phys. B 1990, 345, 137–172. [Google Scholar] [CrossRef]
- Ball, P.; Dosch, H. G. Branching ratios of exclusive decays of bottom mesons into baryon-antibaryon pairs . Z. Phys. C 1991, 51, 445. [Google Scholar] [CrossRef]
- Hsiao, Y. K. Study of two-body doubly charmful baryonic B decays with SU(3) flavor symmetry . J. High Energy Phys. 2023, 11, 117. [Google Scholar] [CrossRef]
- Cheng, H. Y. Status of baryonic B decays . Nucl. Phys. B Suppl. 2007, 163, 68. [Google Scholar] [CrossRef]
- Verma, R. C. SU(3) flavor analysis of nonfactorizable contributions to D→PP decays . Phys. Lett. B 1996, 365, 377–382. [Google Scholar] [CrossRef]
- Katoch, A. C.; Sharma, K. K.; Verma, R. C. Isospin analysis of non-factorizable contributions to hadronic decays of charm mesons . J. Phys. G: Nucl. Part. Phys. 1997, 23, 807. [Google Scholar] [CrossRef]
- Kamal, A. N.; Santra, A. B.; Uppal, T.; Verma, R. C. Nonfactorization in hadronic two-body Cabibbo-favored decays of D0 and D+ . Phys. Rev. D 1996, 53, 2506. [Google Scholar] [CrossRef]
- Kaur, M.; Verma, R. C. SU(3) analysis of nonfactorizable contributions to bottom mesons decays . J. Subatomic Part. Cosmol. 2025, 3, 100033. [Google Scholar] [CrossRef]
- et al.; R. Aaij et al. (LHCb Collaboration) A measurement of the CP asymmetry difference in Λc+→pK-K+ and Λc+→pπ-π+ decays . JHEP 03 2018, 182. [Google Scholar]
- Berends, F. A.; Gaemers, K. J. F.; Gastmans, R. α3 contribution to the angular asymmetry in e+e-→μ+μ- . Nucl. Phys. B 1973, 63, 381. [Google Scholar] [CrossRef]
- Brown, R. W.; Mikaelian, K. O.; Cung, V. K.; Paschos, E. A. Electromagnetic background in the search for neutral weak currents via e+e-→μ+μ- . Phys. Lett. B 1973, 43, 403. [Google Scholar] [CrossRef]
- Cashmore, R. J.; Hawkes, C. M.; Lynn, B. W.; Stuart, R. G. The forward–backward asymmetry in e+e-→μ+μ-: comparisons between theoretical calculations at the one-loop level in the Standard Model and with the experimental measurements . Z. Phys. C 1986, 30, 125. [Google Scholar] [CrossRef]
- Belle II Collaboration, Belle II Collaboration Homepage.
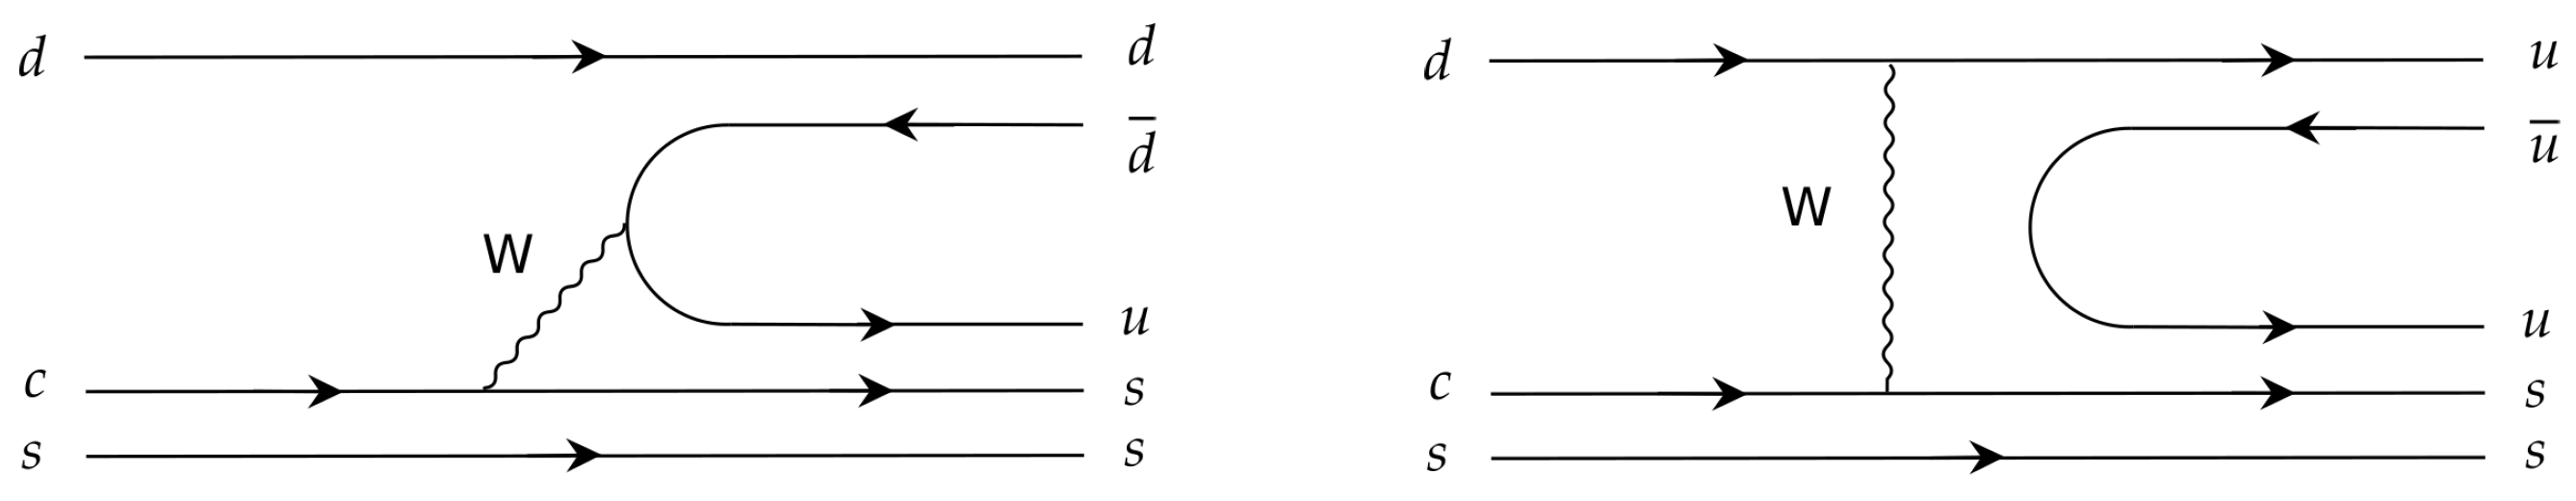
Figure 2.
Topological diagrams contributing to decays: internal W-emission C, inner W-emission , and W-exchange diagrams and [5].
Figure 2.
Topological diagrams contributing to decays: internal W-emission C, inner W-emission , and W-exchange diagrams and [5].
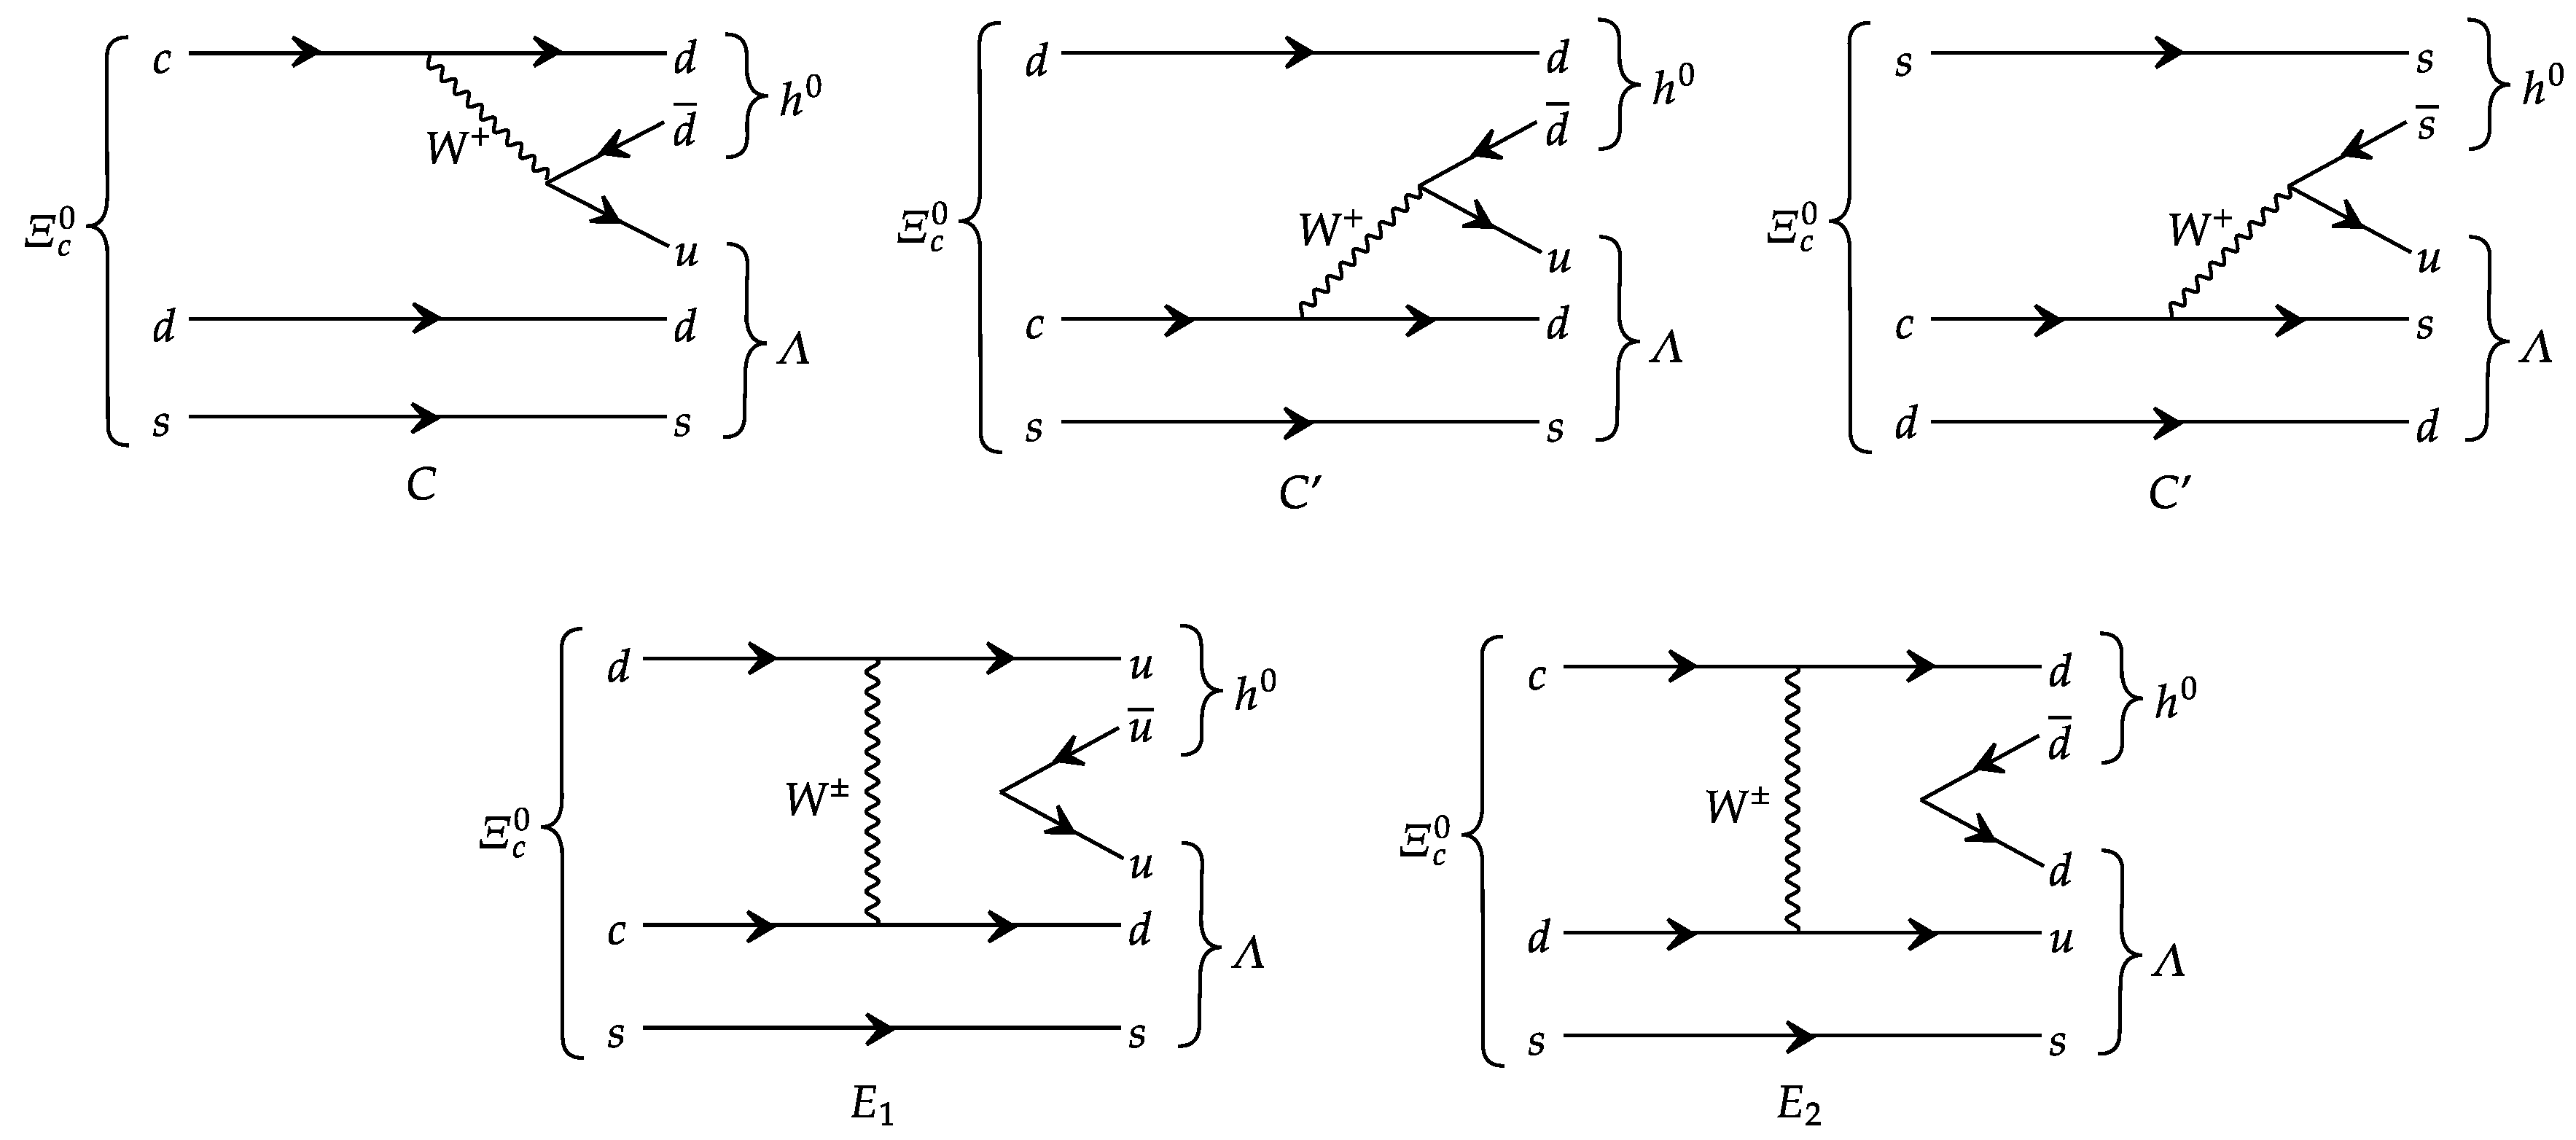
Figure 7.
Typical decay diagrams from (a,b) internal W-emission, (c) external W-emission, and (d,e) W-exchange contributions for the SCS decays , , and .
Figure 7.
Typical decay diagrams from (a,b) internal W-emission, (c) external W-emission, and (d,e) W-exchange contributions for the SCS decays , , and .
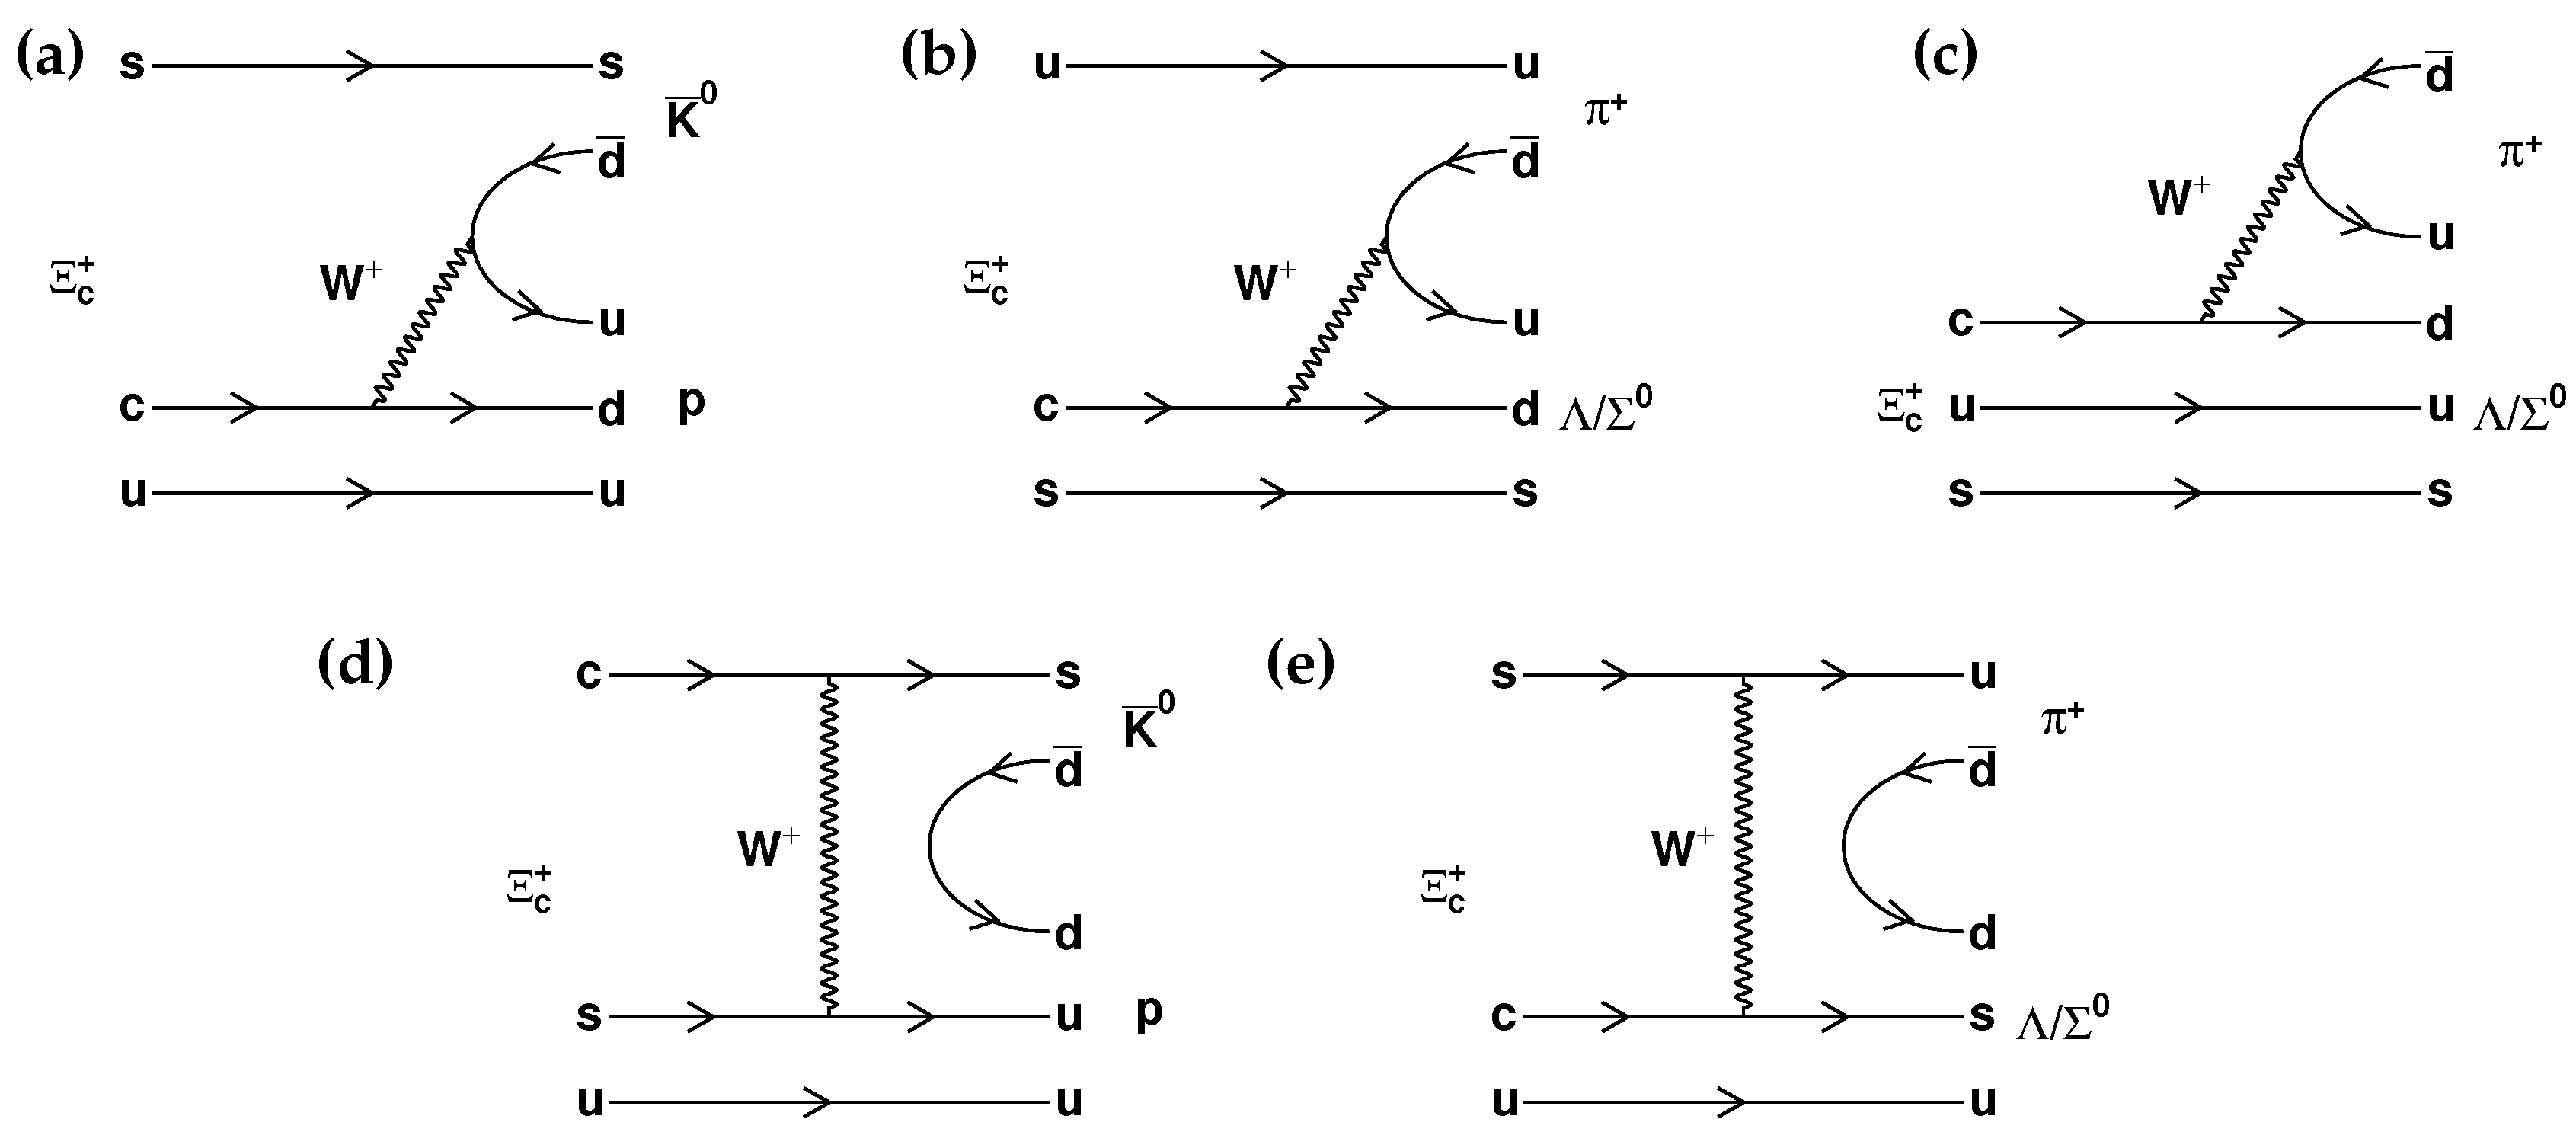
Figure 8.
invariant mass spectra of (a) , (b) , and (c) in the (1) Belle and (2) Belle II data [11]. The points with error bars represent the data, the solid blue curves show the best-fit results, and the black dashed curves represent the fitted combinatorial backgrounds. In the and distributions, the pink dashed curves indicate the fitted feed-down backgrounds from the and decays, respectively.
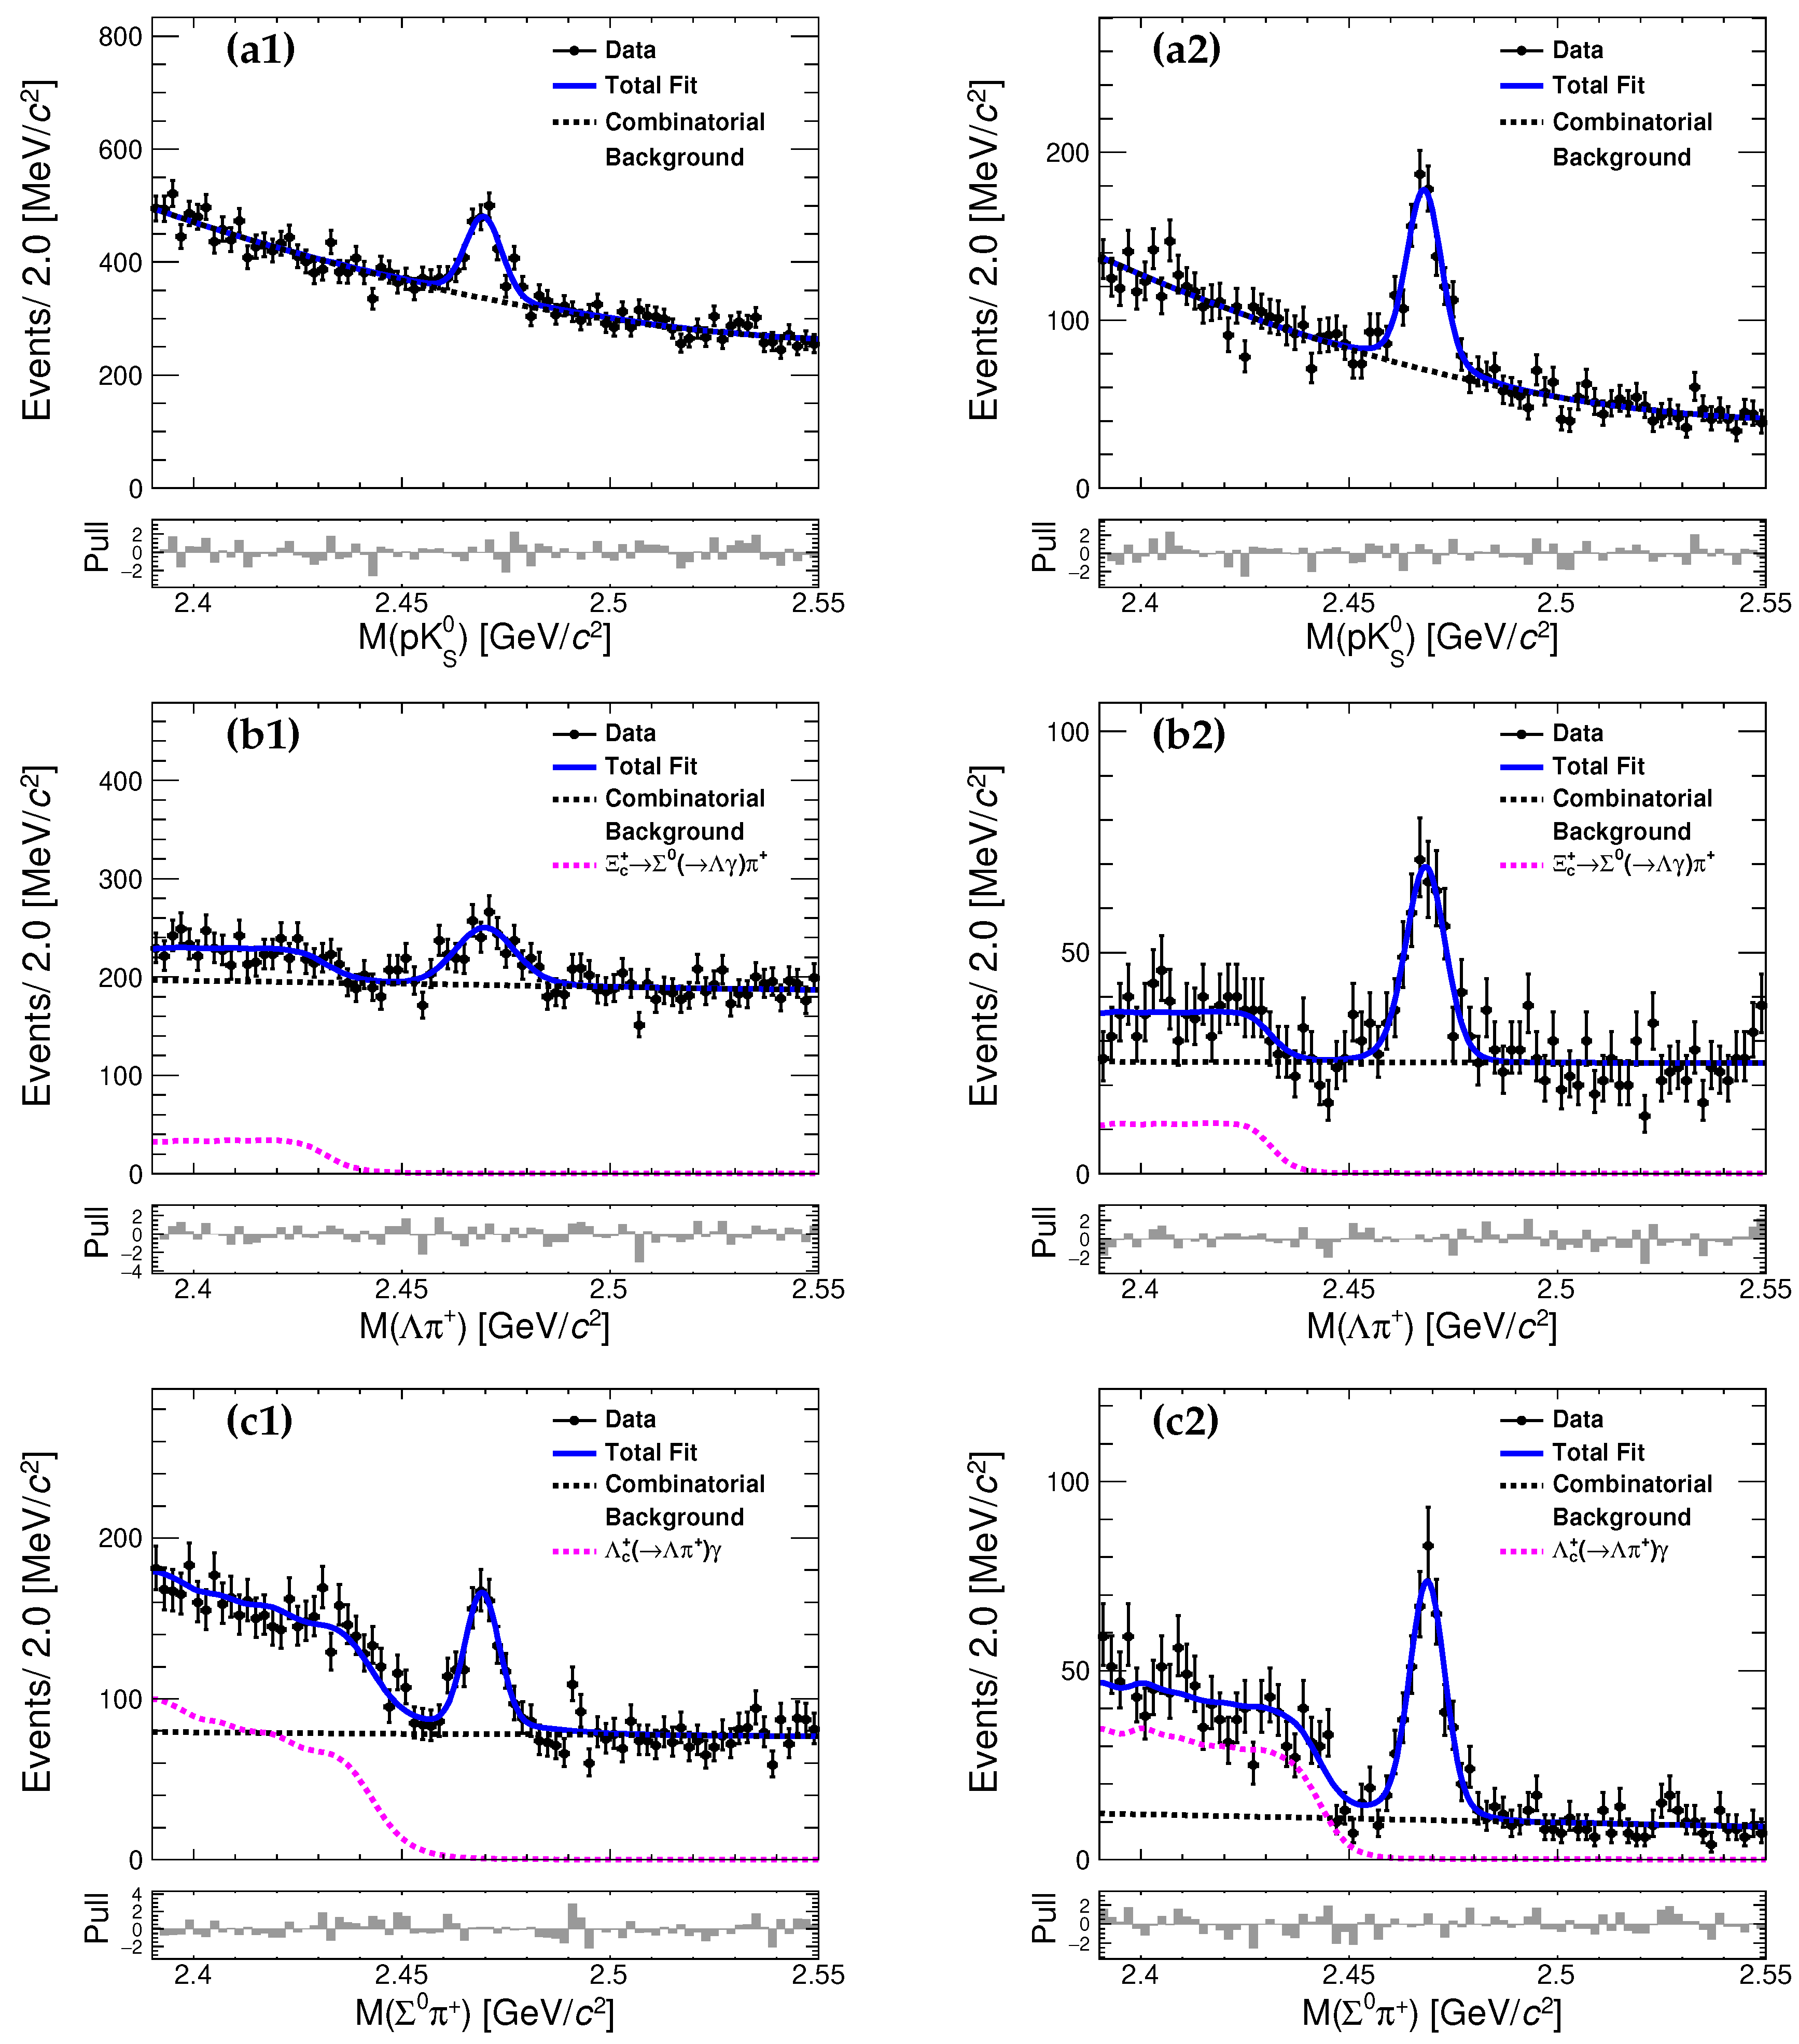
Figure 9.
Comparisons of the measured (a) , (b) , and (c) with theoretical predictions. The dots and error bars represent the central values and uncertainties of the theoretical predictions, respectively. The dots without error bars indicate that no theoretical uncertainty is available. The squares and error bars denote the measured central values and uncertainties in this work. The meanings of the vertical coordinates (a)-(o) in the figure: (a) Zou et al. [42], (pole model); (b) Geng et al. [44], (SU(3)F symmetry (IRA)); (c) Geng et al. [45], (SU(3)F symmetry (IRA)); (d) Huang et al. [46], (SU(3)F symmetry (IRA)); (e) Zhong et al. (I) [47], (SU(3)F symmetry (IRA)); (f) Zhong et al. (II) [47], (SU(3)F-breaking (IRA)); (g) Xing et al. [48], (SU(3)F symmetry (IRA)); (h) Geng et al. [53], (SU(3)F with KPW constraint); (i) Liu [54], (SU(3)F symmetry (IRA)); (j) Zhong et al. (I) [52], (SU(3)F (TDA)); (k) Zhong et al. (II) [52], (SU(3)F (IRA)); (l) Zhao et al. [50], (SU(3)F symmetry (TDA)); (m) Hsiao et al. (I) [51], (SU(3)F symmetry (TDA)); (n) Hsiao et al. (II) [51], (SU(3)F-breaking (TDA)); (o) Belle and Belle II combined.
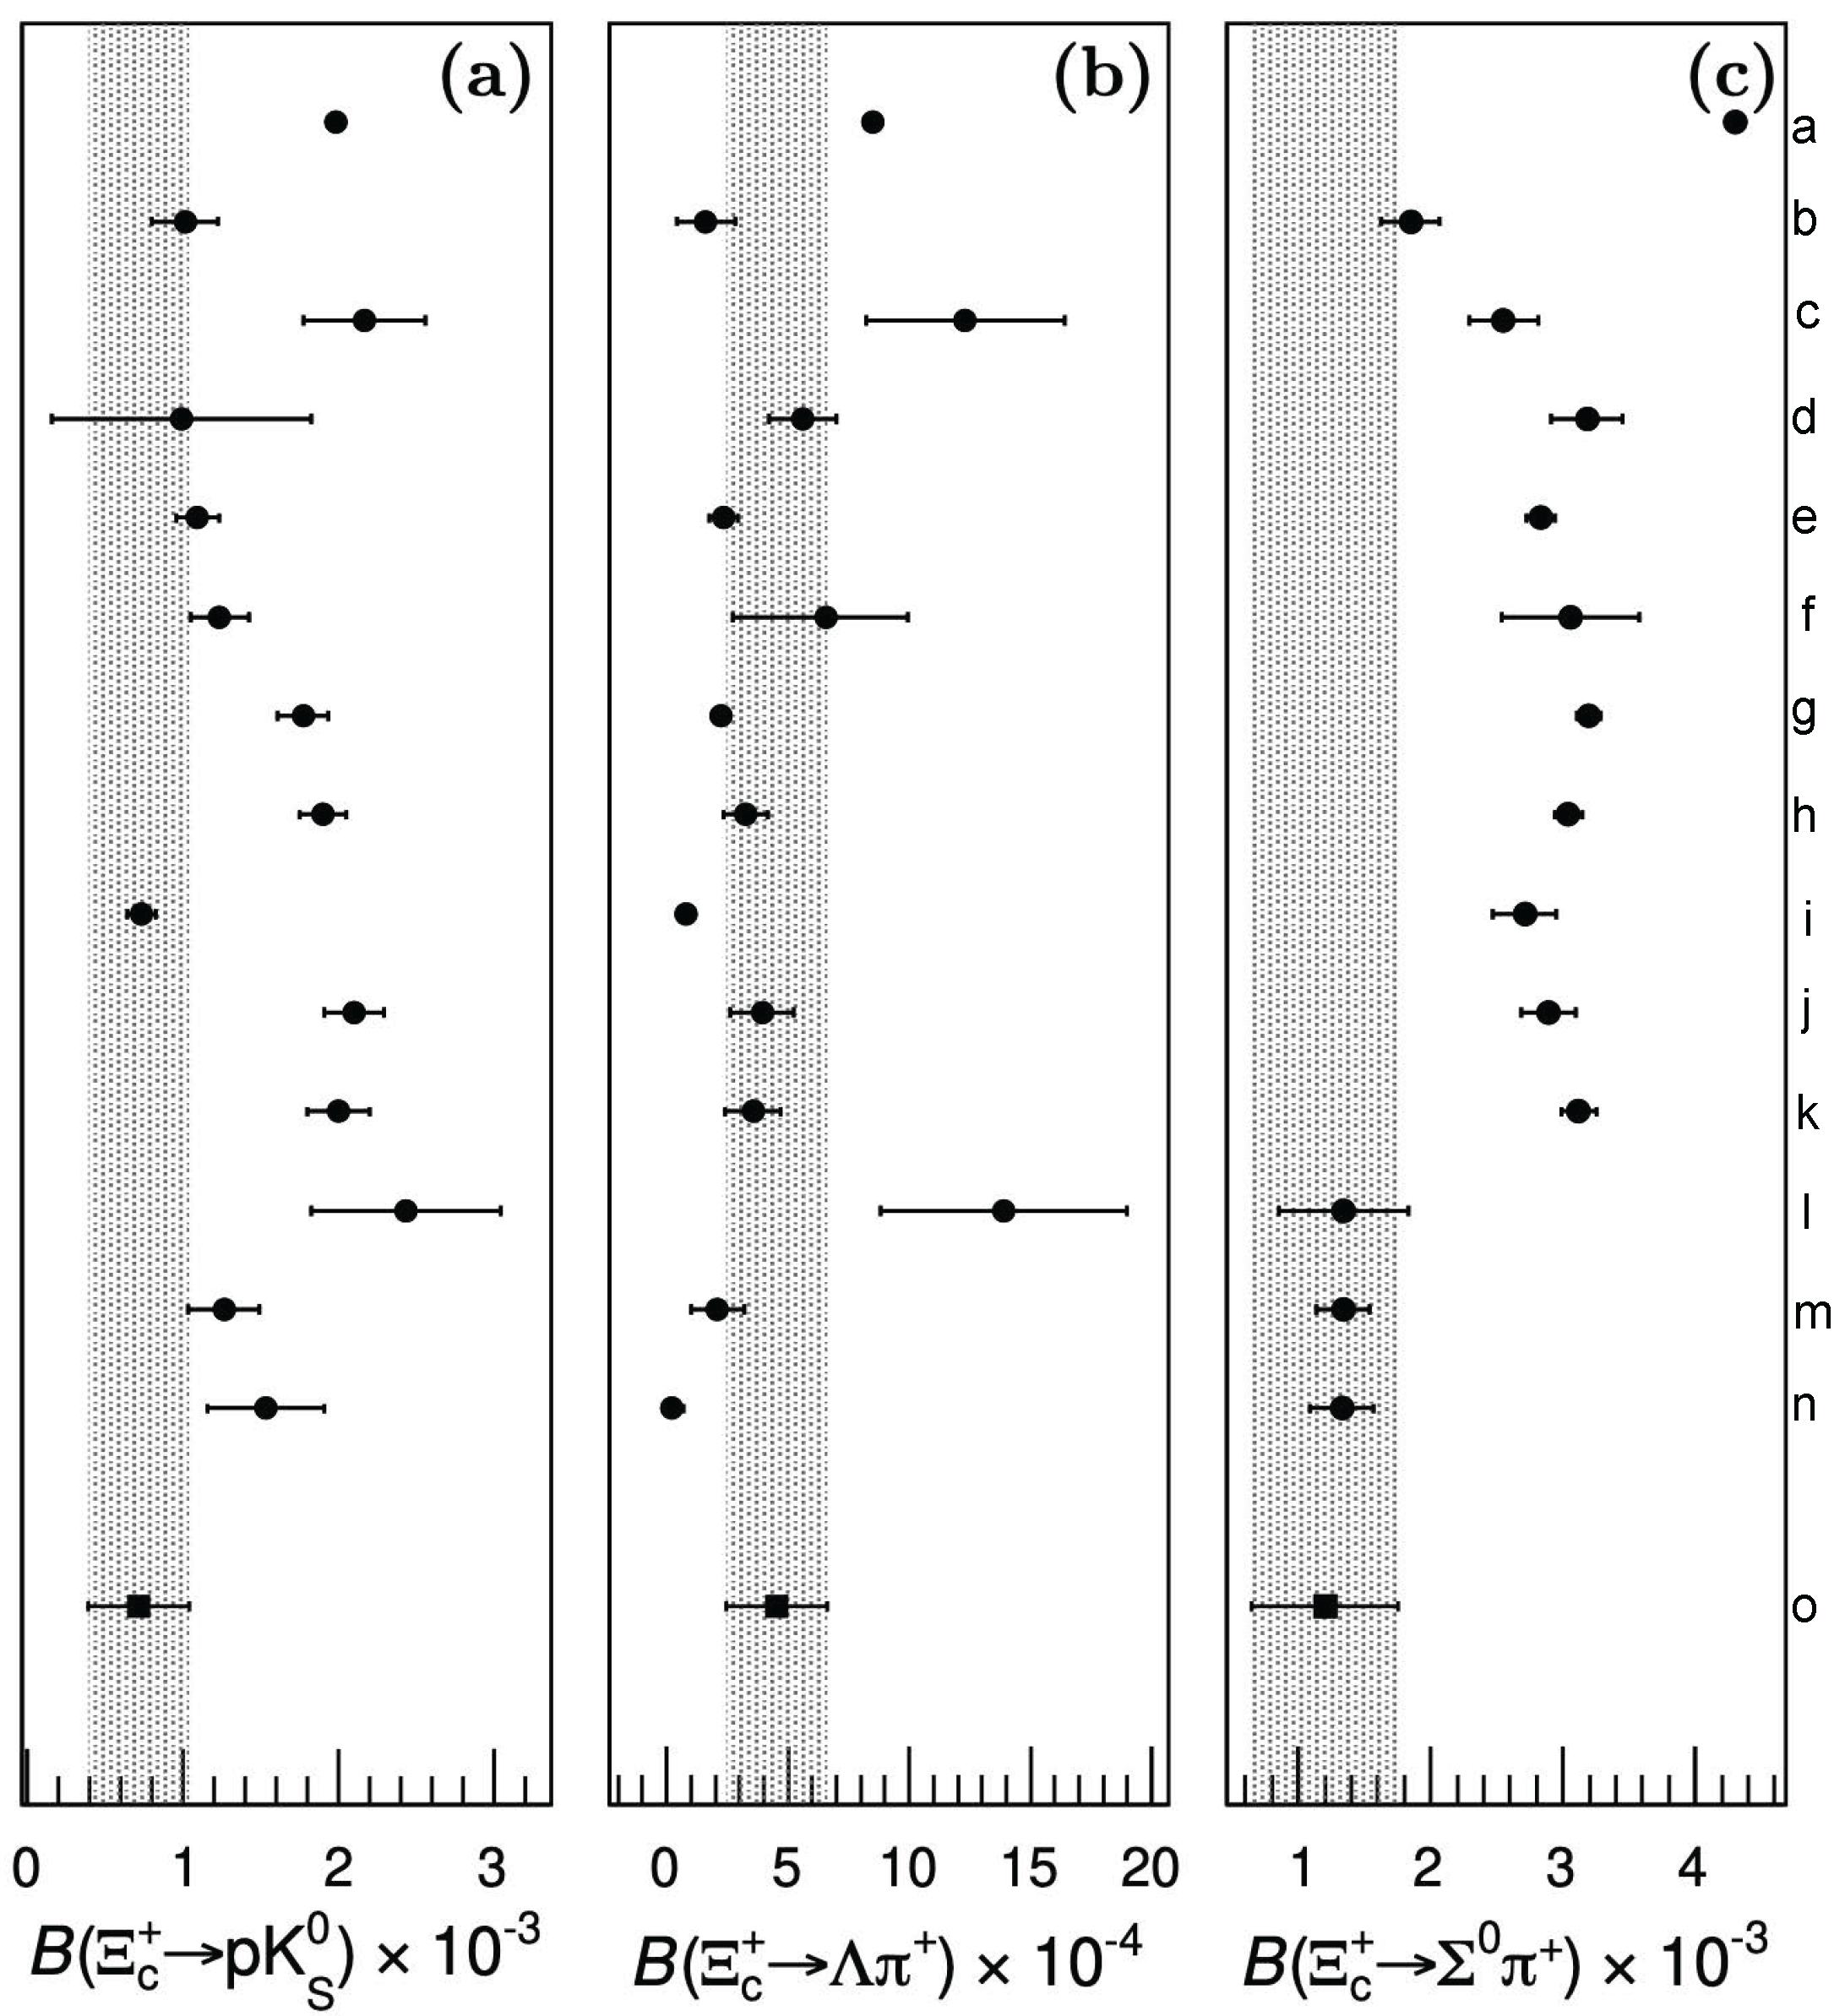
Figure 10.
invariant mass distributions of candidates from (a) , (b) , and (c) decays reconstructed in the (left) Belle and (right) Belle II data [12]. The black dots with error bars represent the distributions from data. The solid blue and red curves show the total fit and total background, respectively. The cyan areas indicate the broken-signal component.
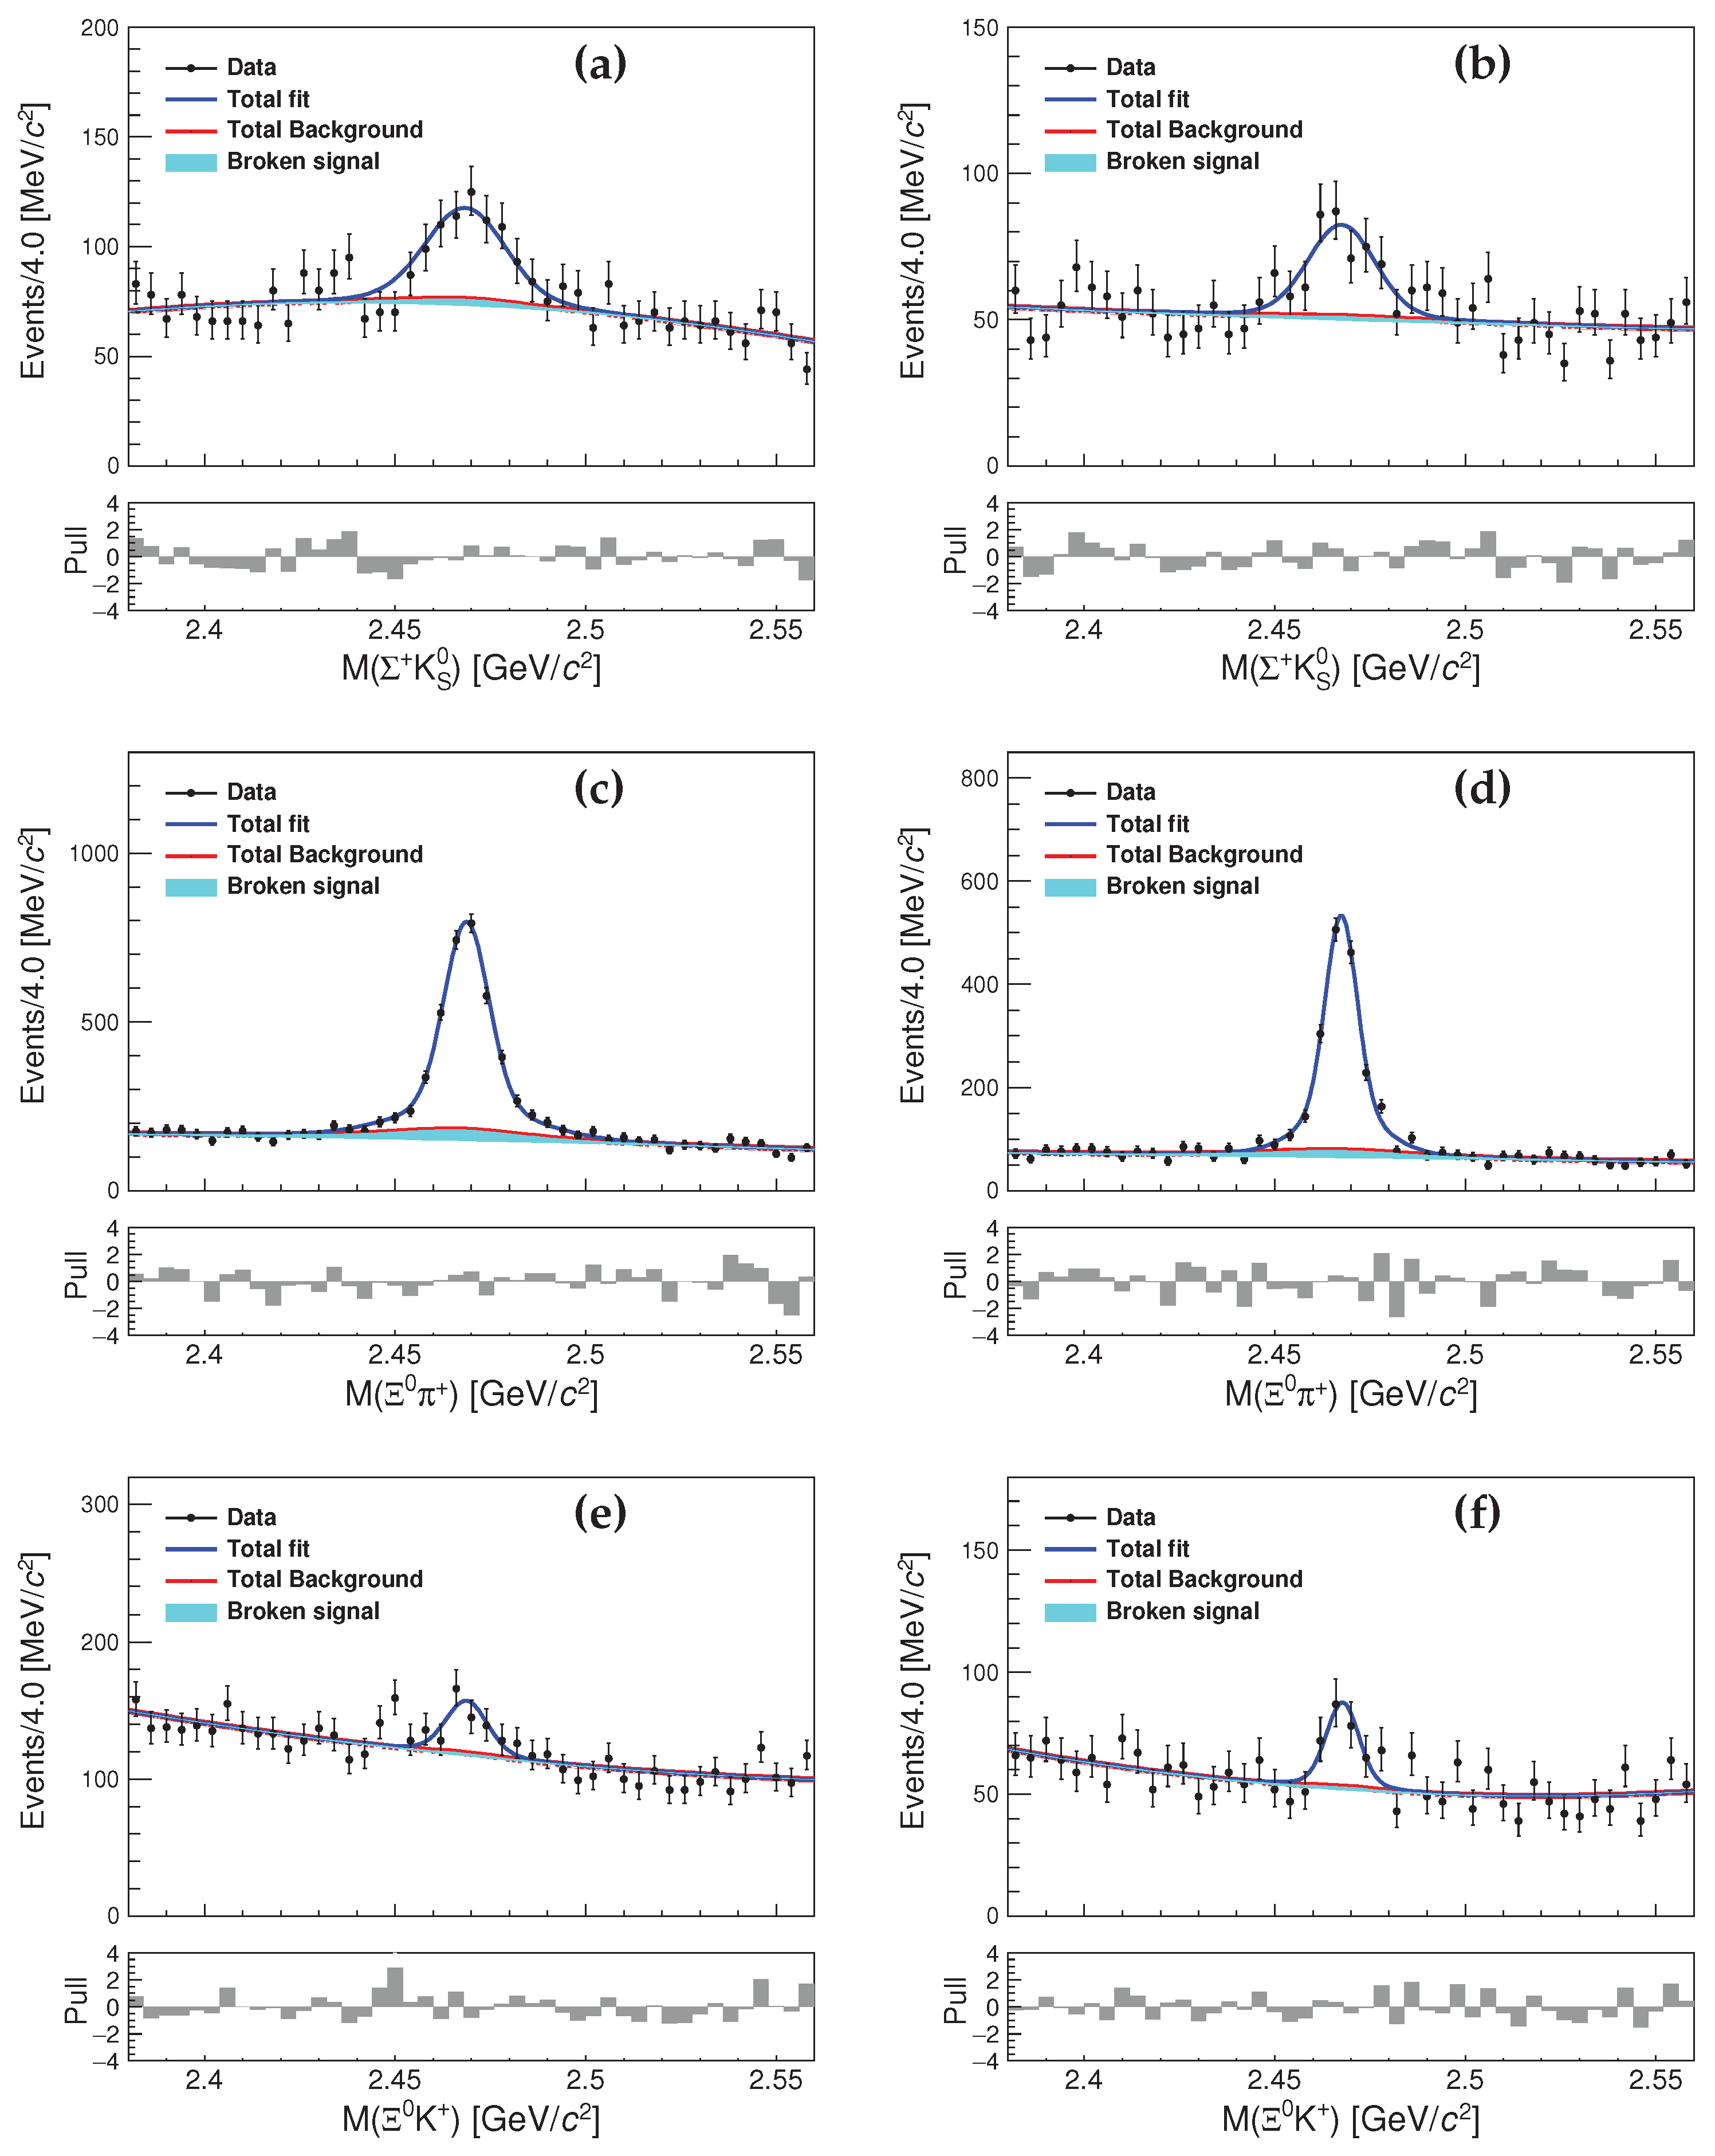
Figure 11.
Comparison of the measured branching fractions , , and with theoretical predictions. The blue dots with error bars represent theoretical predictions. The green dot with an error bar indicates the result from CLEO, and the black dots with error bars correspond to the results of this study. The meanings of the vertical coordinates (a)-(m) in the figure: (a) Zou et al. [42], (pole model); (b) Geng et al. [45], (SU(3)F symmetry (IRA)); (c) Zhao et al. [50], (SU(3)F symmetry (TDA)); (d) Hsiao et al. (I) [51], (SU(3)F symmetry (TDA)); (e) Hsiao et al. (II) [51], (SU(3)F-breaking (TDA)); (f) Huang et al. [46], (SU(3)F symmetry (IRA)); (g) Xing et al. [48], (SU(3)F symmetry (IRA)); (h) Liu et al. (I) [54], (SU(3)F symmetry (IRA)); (i) Liu et al. (II) [54], (SU(3)F-breaking (IRA)); (j) Zhong et al. (I) [47], (SU(3)F symmetry (IRA)); (k) Zhong et al. (II) [47], (SU(3)F-breaking (IRA)). (l) CLEO [55]; (m) Belle and Belle II combined. The horizontal dashed line distinguishes theoretical predictions from experimental results. The red vertical bands represent a region corresponding to the measurements. Dots with error bars represent central values with their uncertainties. Missing dots indicate no theoretical predictions or experimental results for that decay mode.
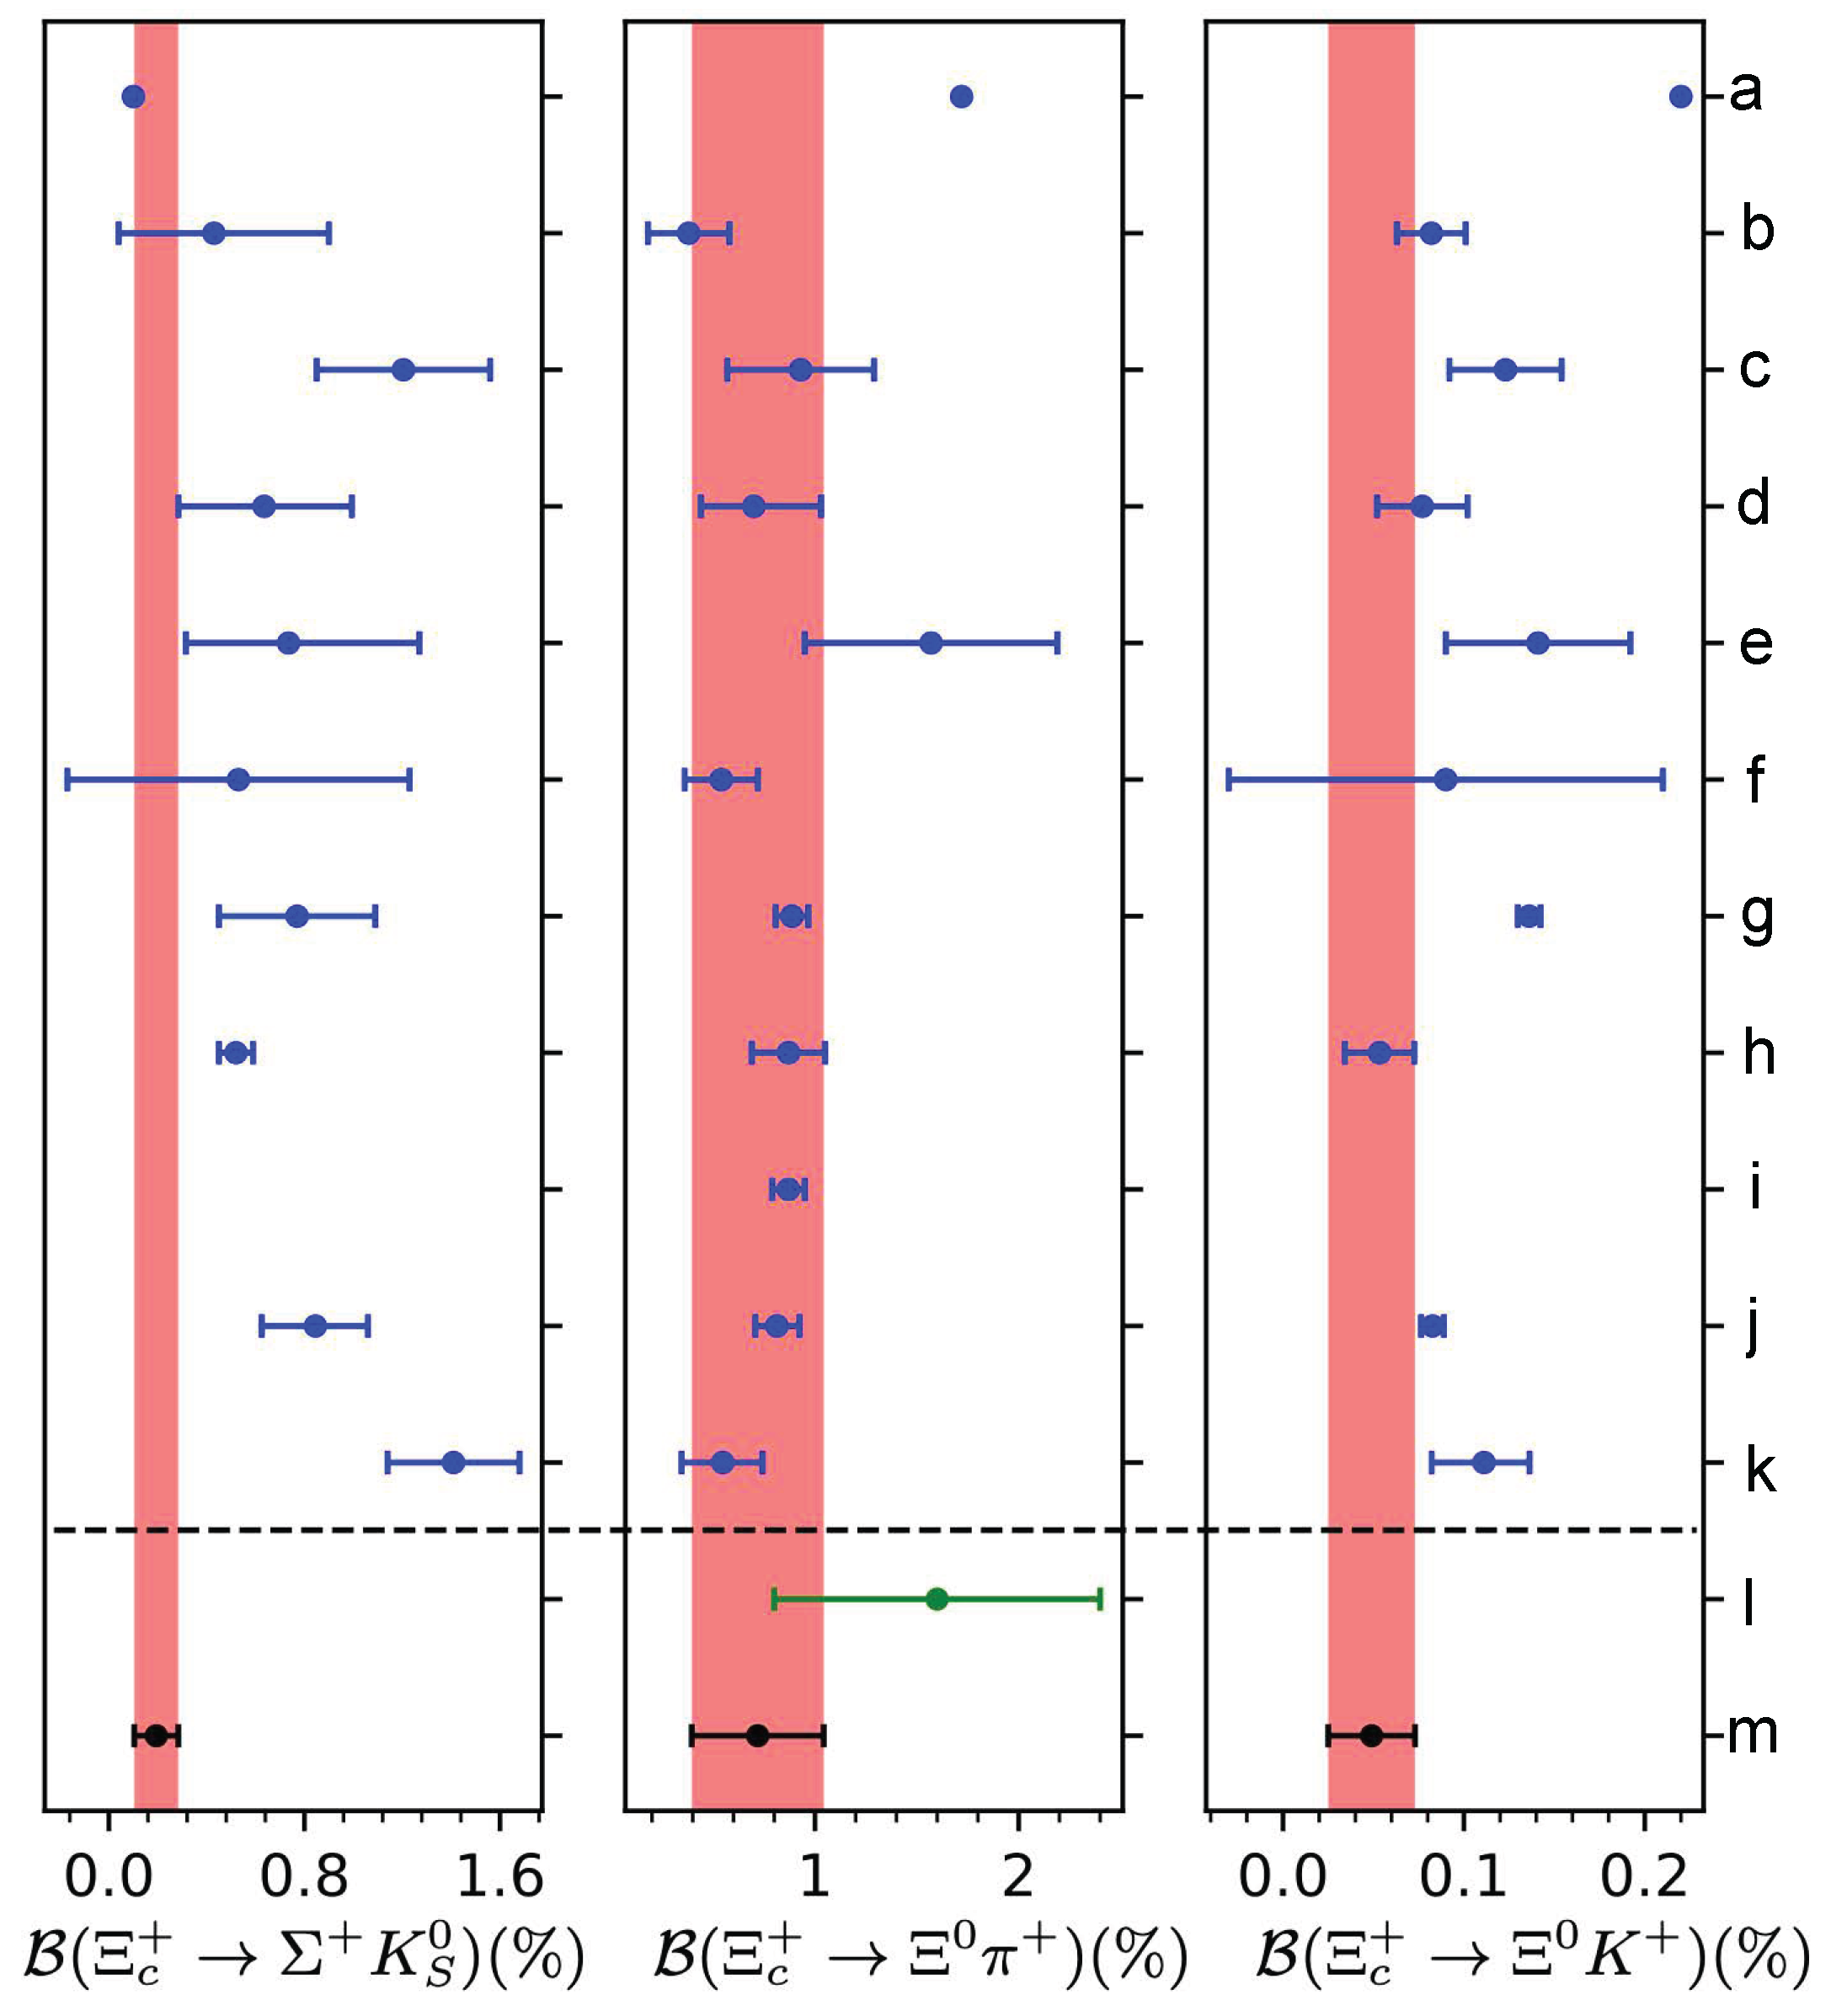
Figure 12.
Typical Feynman diagrams for internal W emission (a), internal W exchange (b), and external W emission (c) processes in decays, and internal W emission (d) and internal W exchange (e) processes in decays.
Figure 12.
Typical Feynman diagrams for internal W emission (a), internal W exchange (b), and external W emission (c) processes in decays, and internal W emission (d) and internal W exchange (e) processes in decays.
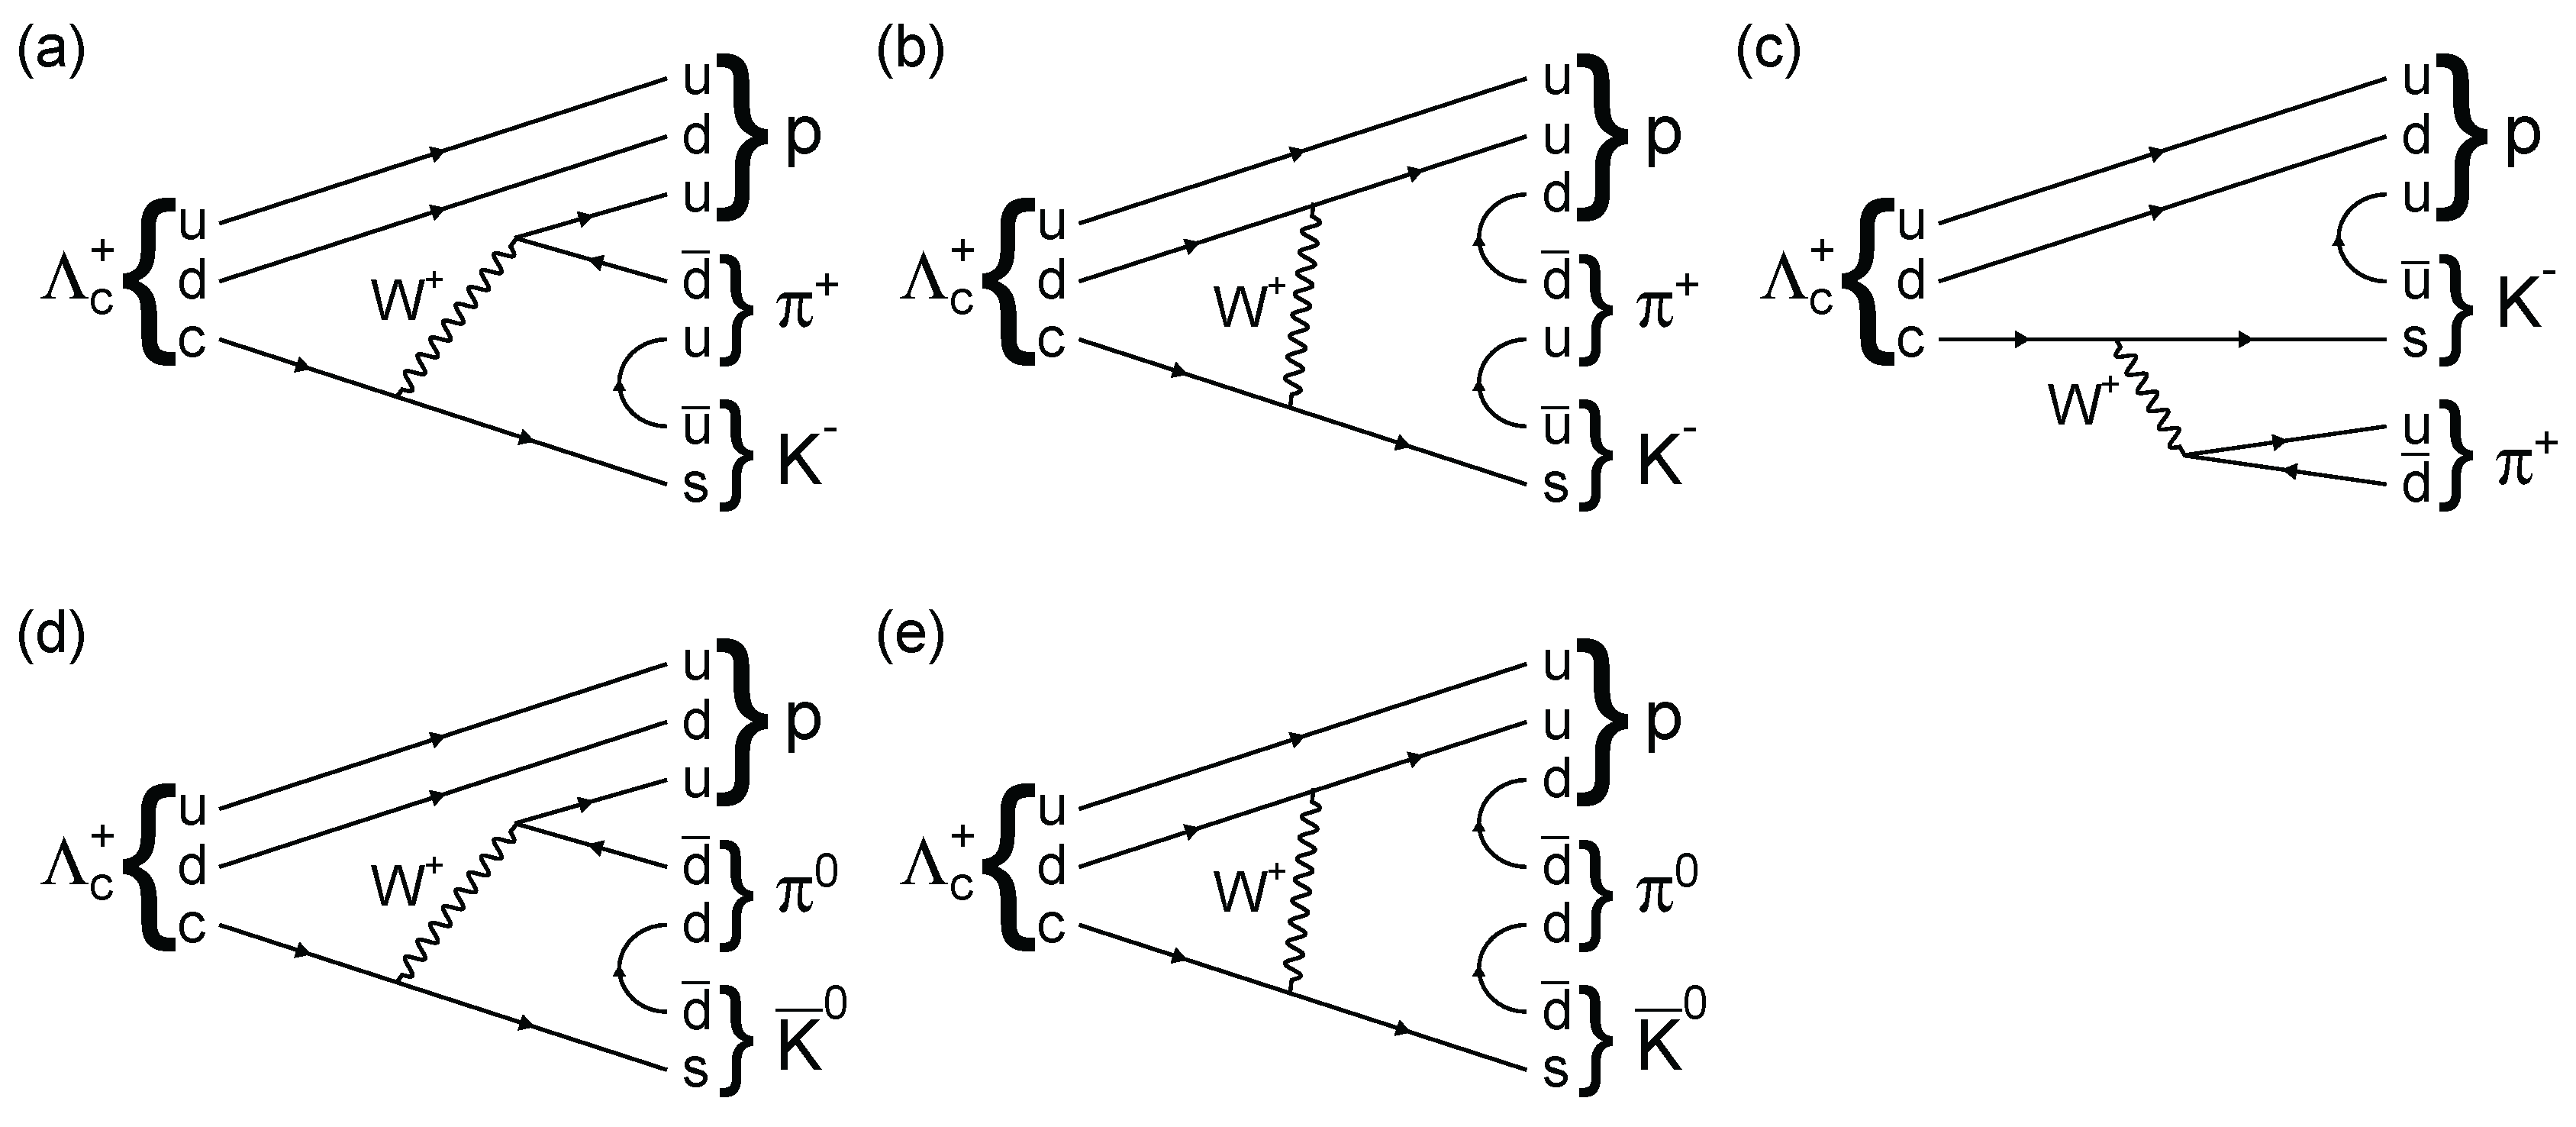
Figure 13.
Invariant mass distributions of candidates and fit results for (left) and (right) [13]. The total fit, signal, and background are shown by solid red, dashed blue, and long dashed green curves, respectively.
Figure 13.
Invariant mass distributions of candidates and fit results for (left) and (right) [13]. The total fit, signal, and background are shown by solid red, dashed blue, and long dashed green curves, respectively.
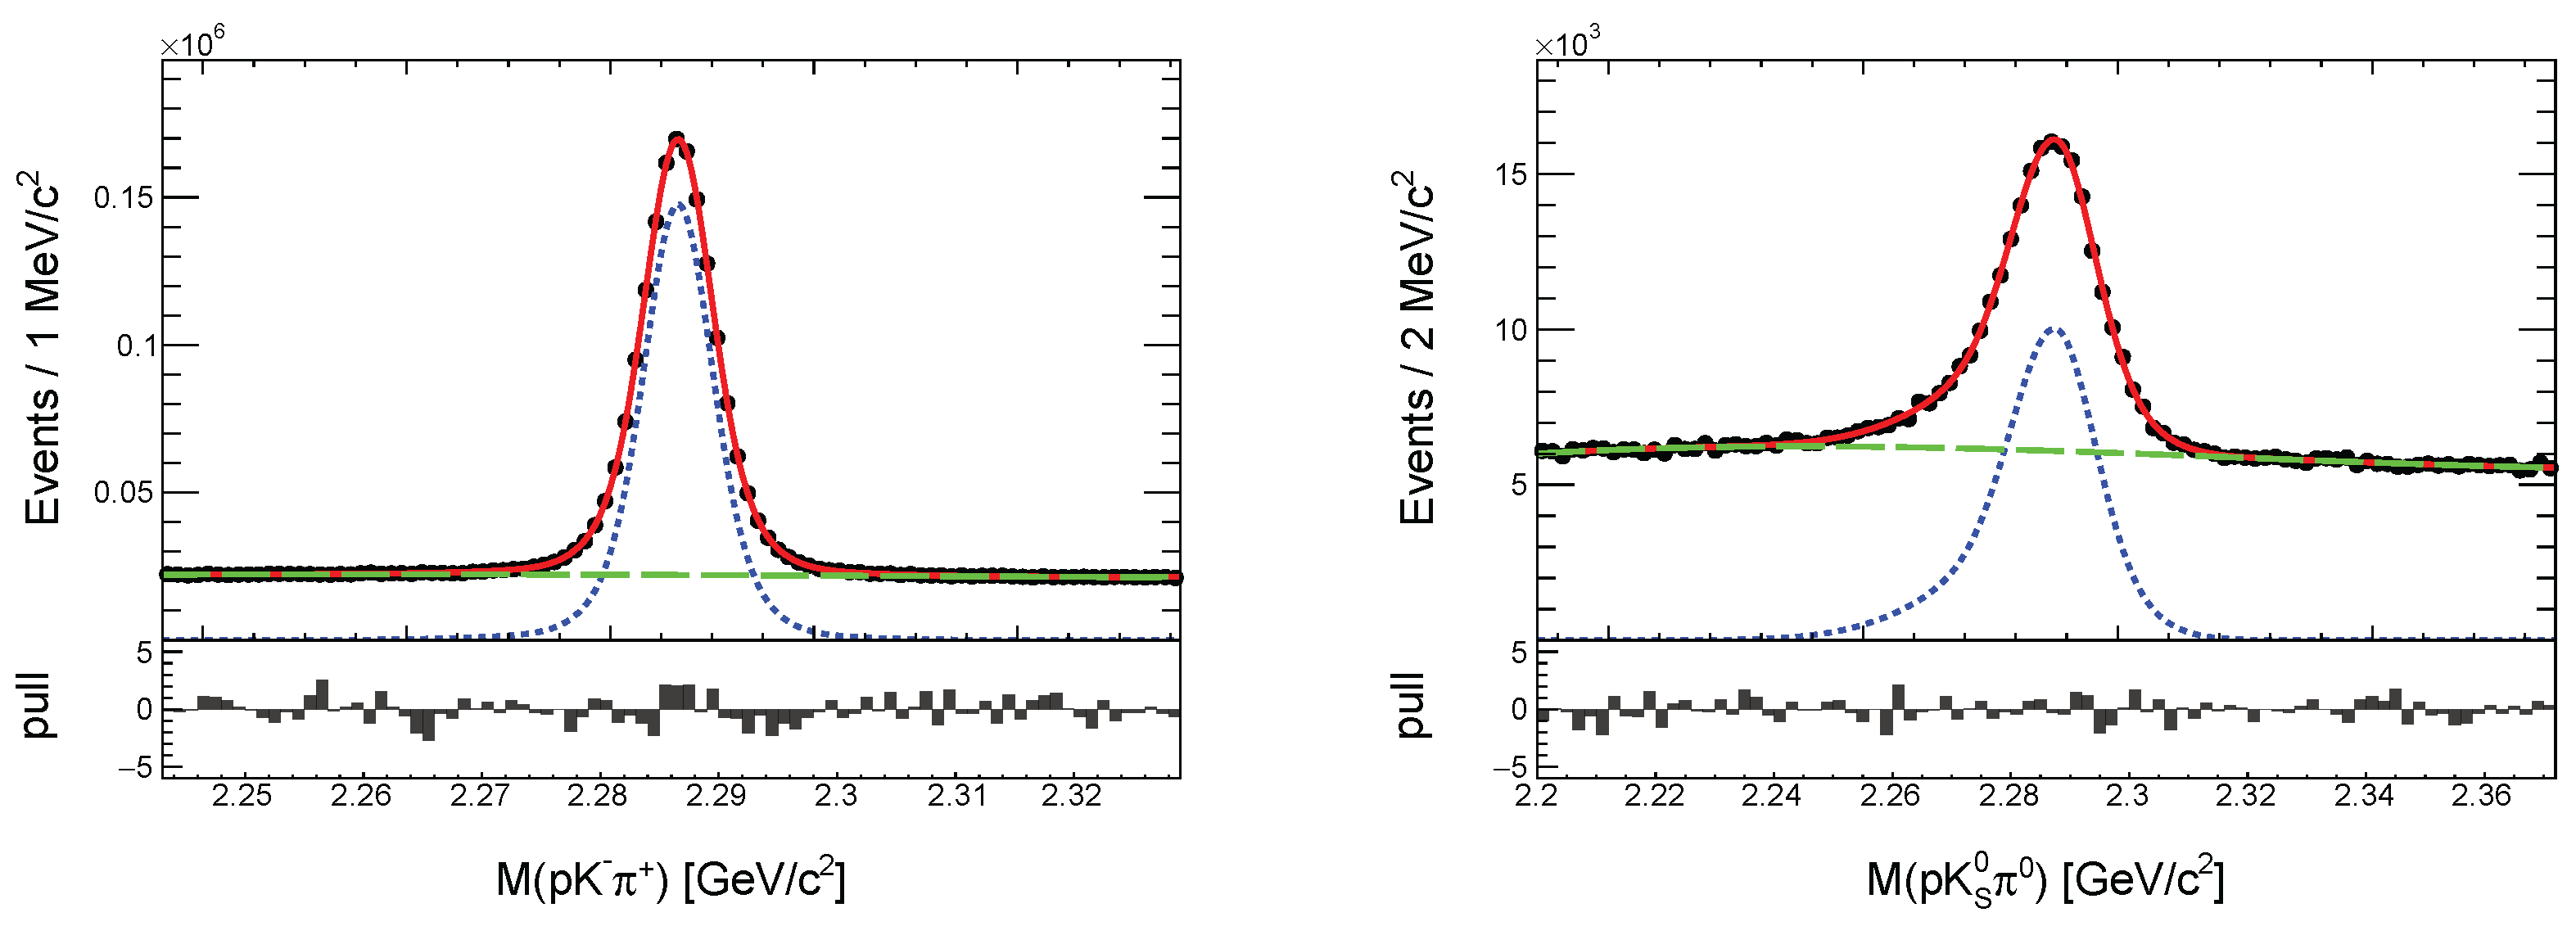
Figure 14.
Dalitz distributions for the decays (left) and (right), selected within the invariant mass windows and , respectively [13]. The bin sizes along both Dalitz axes are set to . Non- background contributions are retained in the displayed Dalitz plots.
Figure 14.
Dalitz distributions for the decays (left) and (right), selected within the invariant mass windows and , respectively [13]. The bin sizes along both Dalitz axes are set to . Non- background contributions are retained in the displayed Dalitz plots.
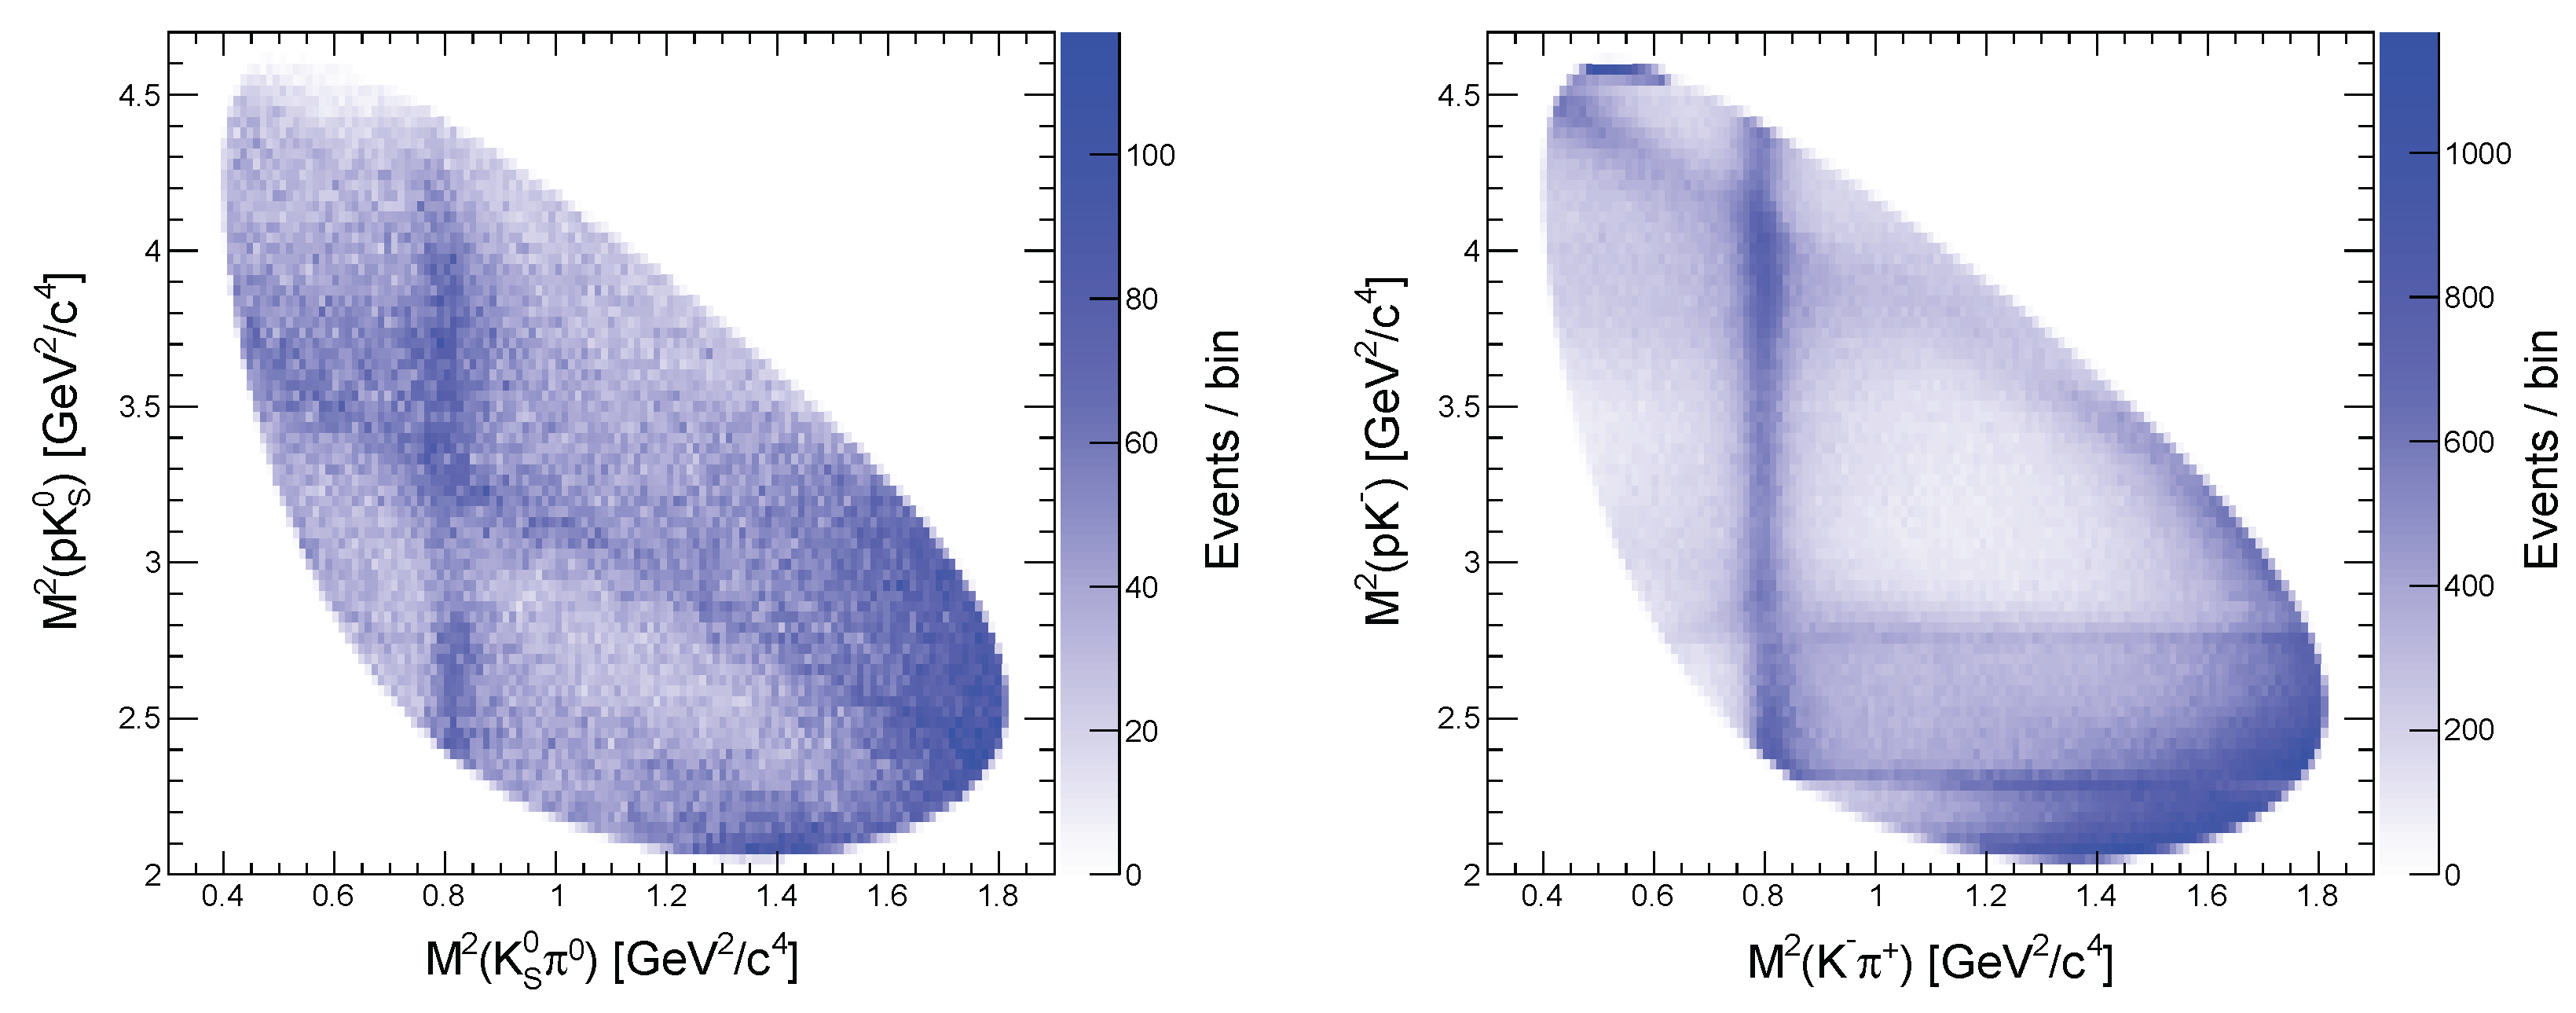
Figure 15.
invariant mass projection spectra for the decays (left) and (right) after subtraction of background contributions and correction for reconstruction efficiency [13]. The expectations from signal Monte Carlo simulations generated according to a phase-space model are overlaid and shown as blue histograms. A pronounced enhancement close to the mass threshold is observed in panel (c), while the and thresholds are indicated in panels (b) and (c), respectively. In addition, a distinct resonance peak corresponding to the is visible in the invariant mass distribution shown in panels (e) and (f).
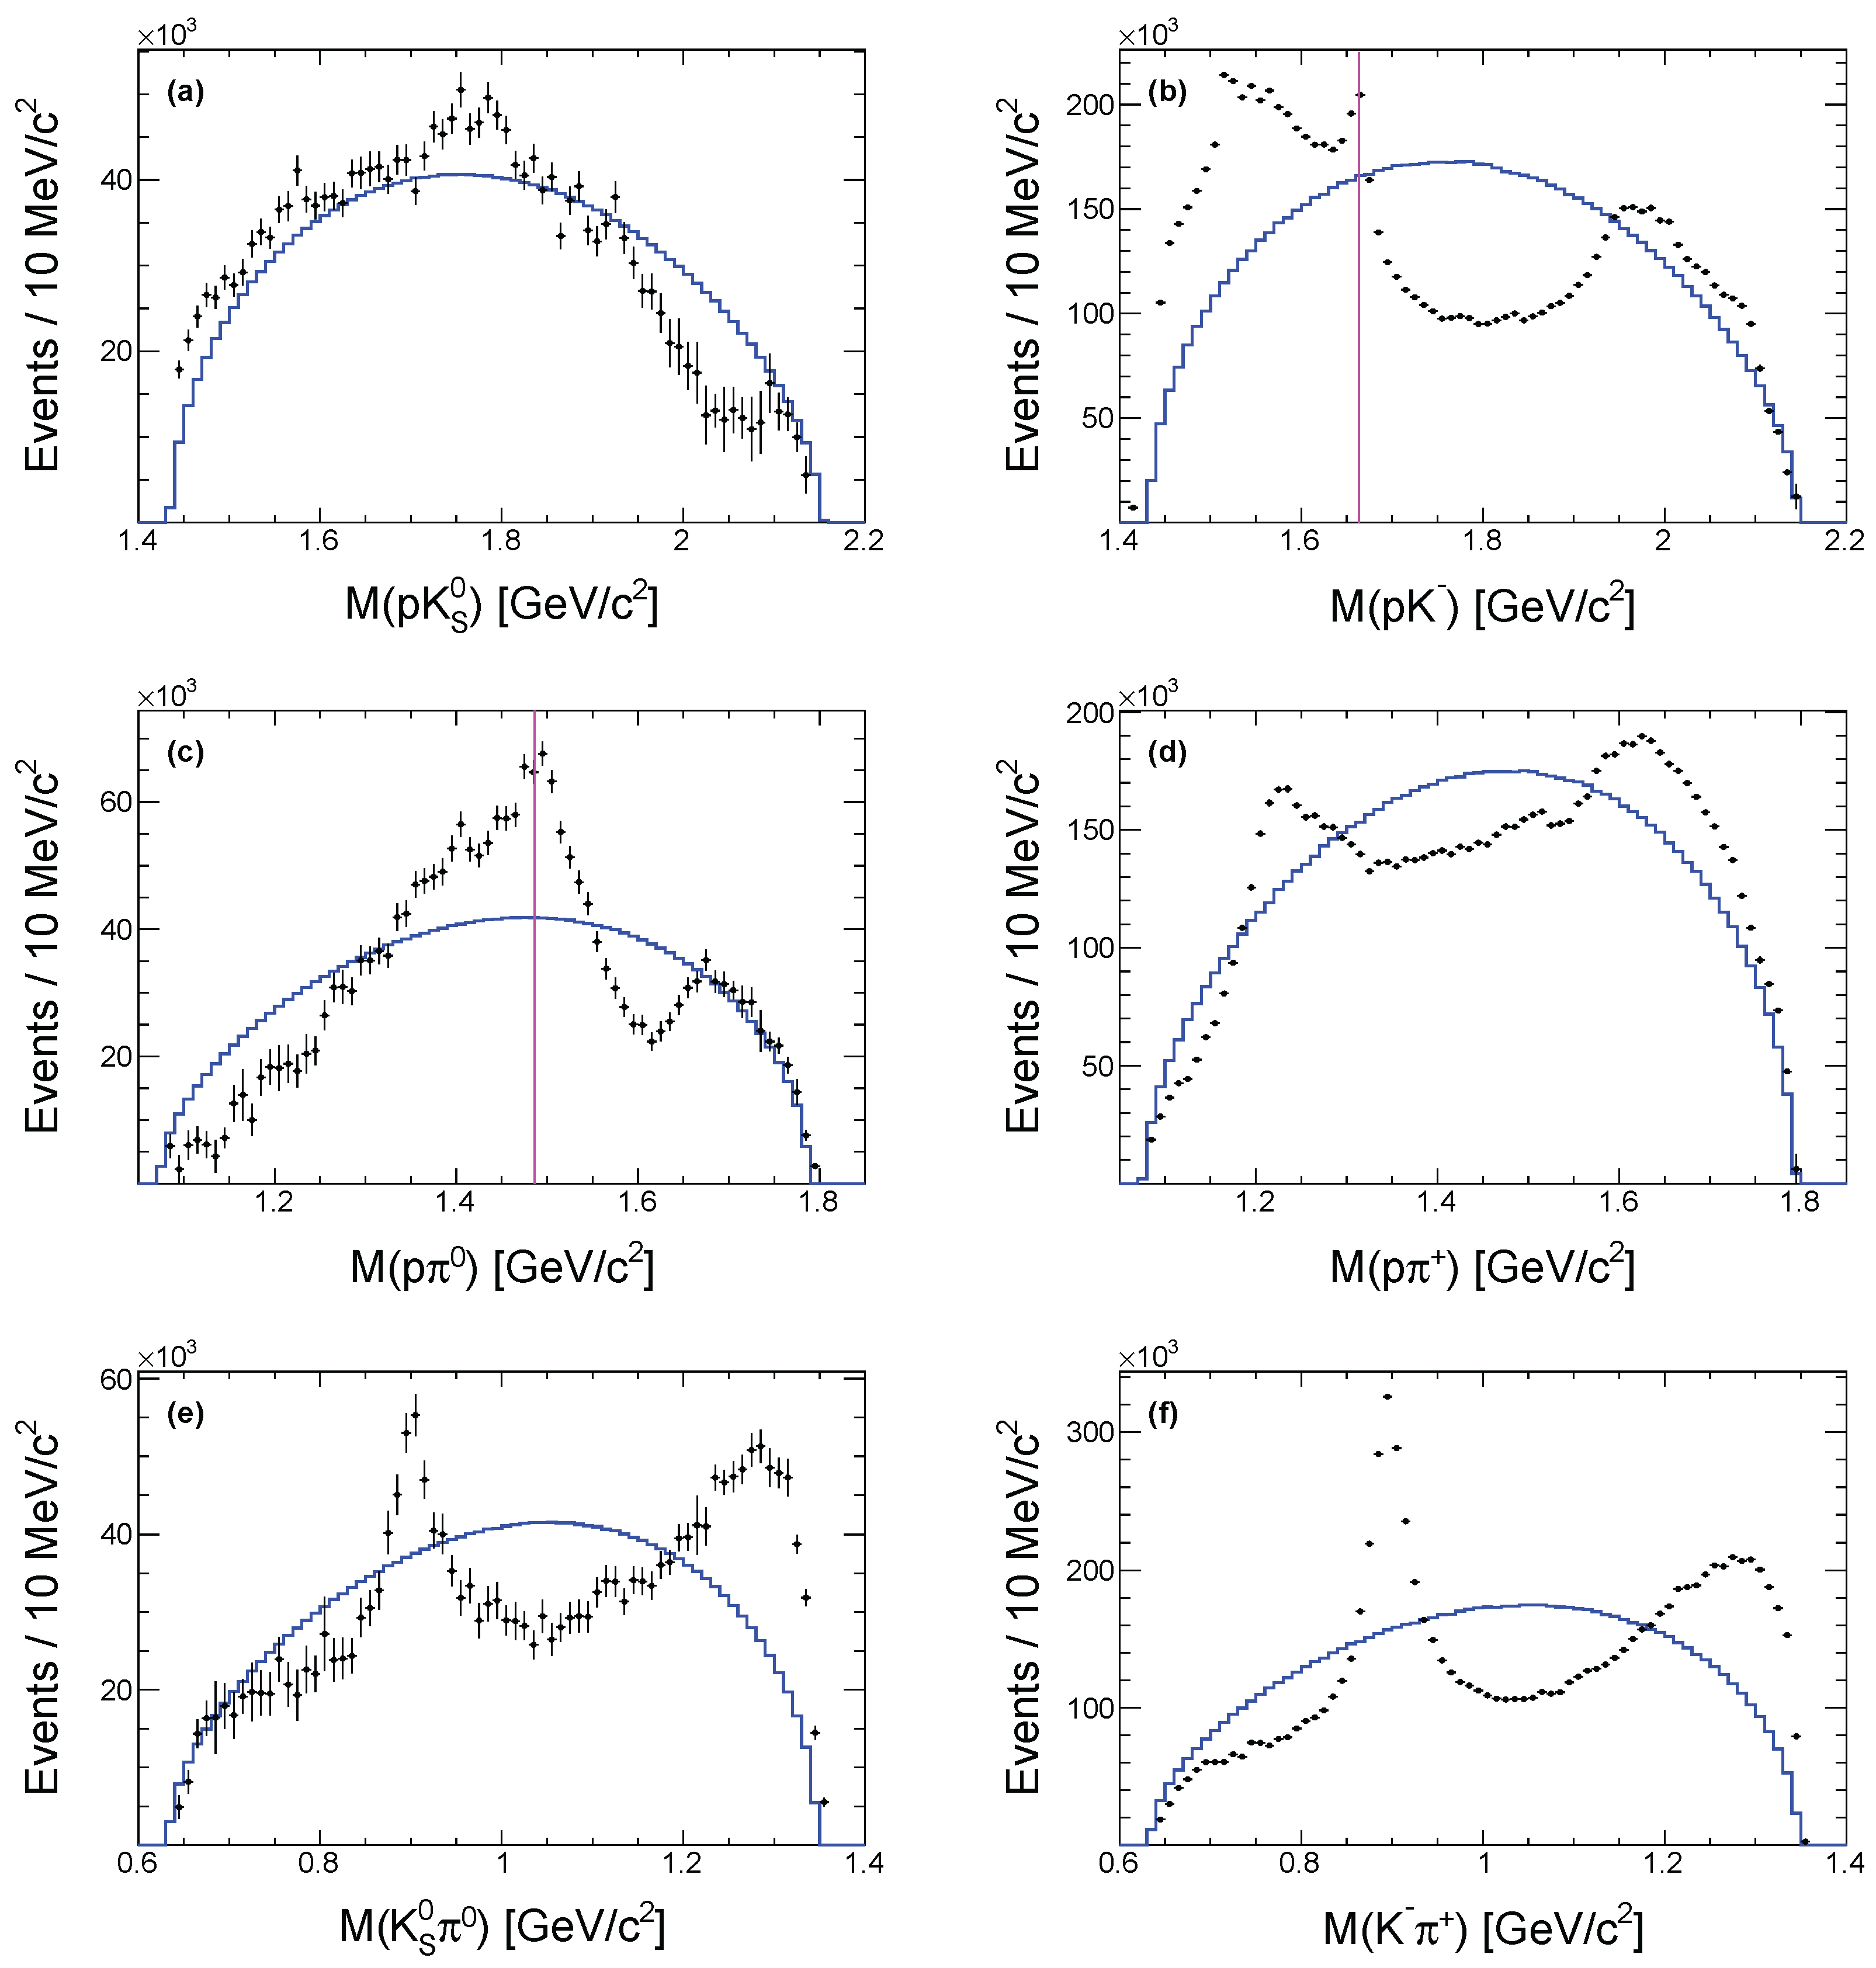
Figure 16.
Diagram representing the internal W-boson emission amplitude for the decays and , corresponding to and , respectively.
Figure 16.
Diagram representing the internal W-boson emission amplitude for the decays and , corresponding to and , respectively.
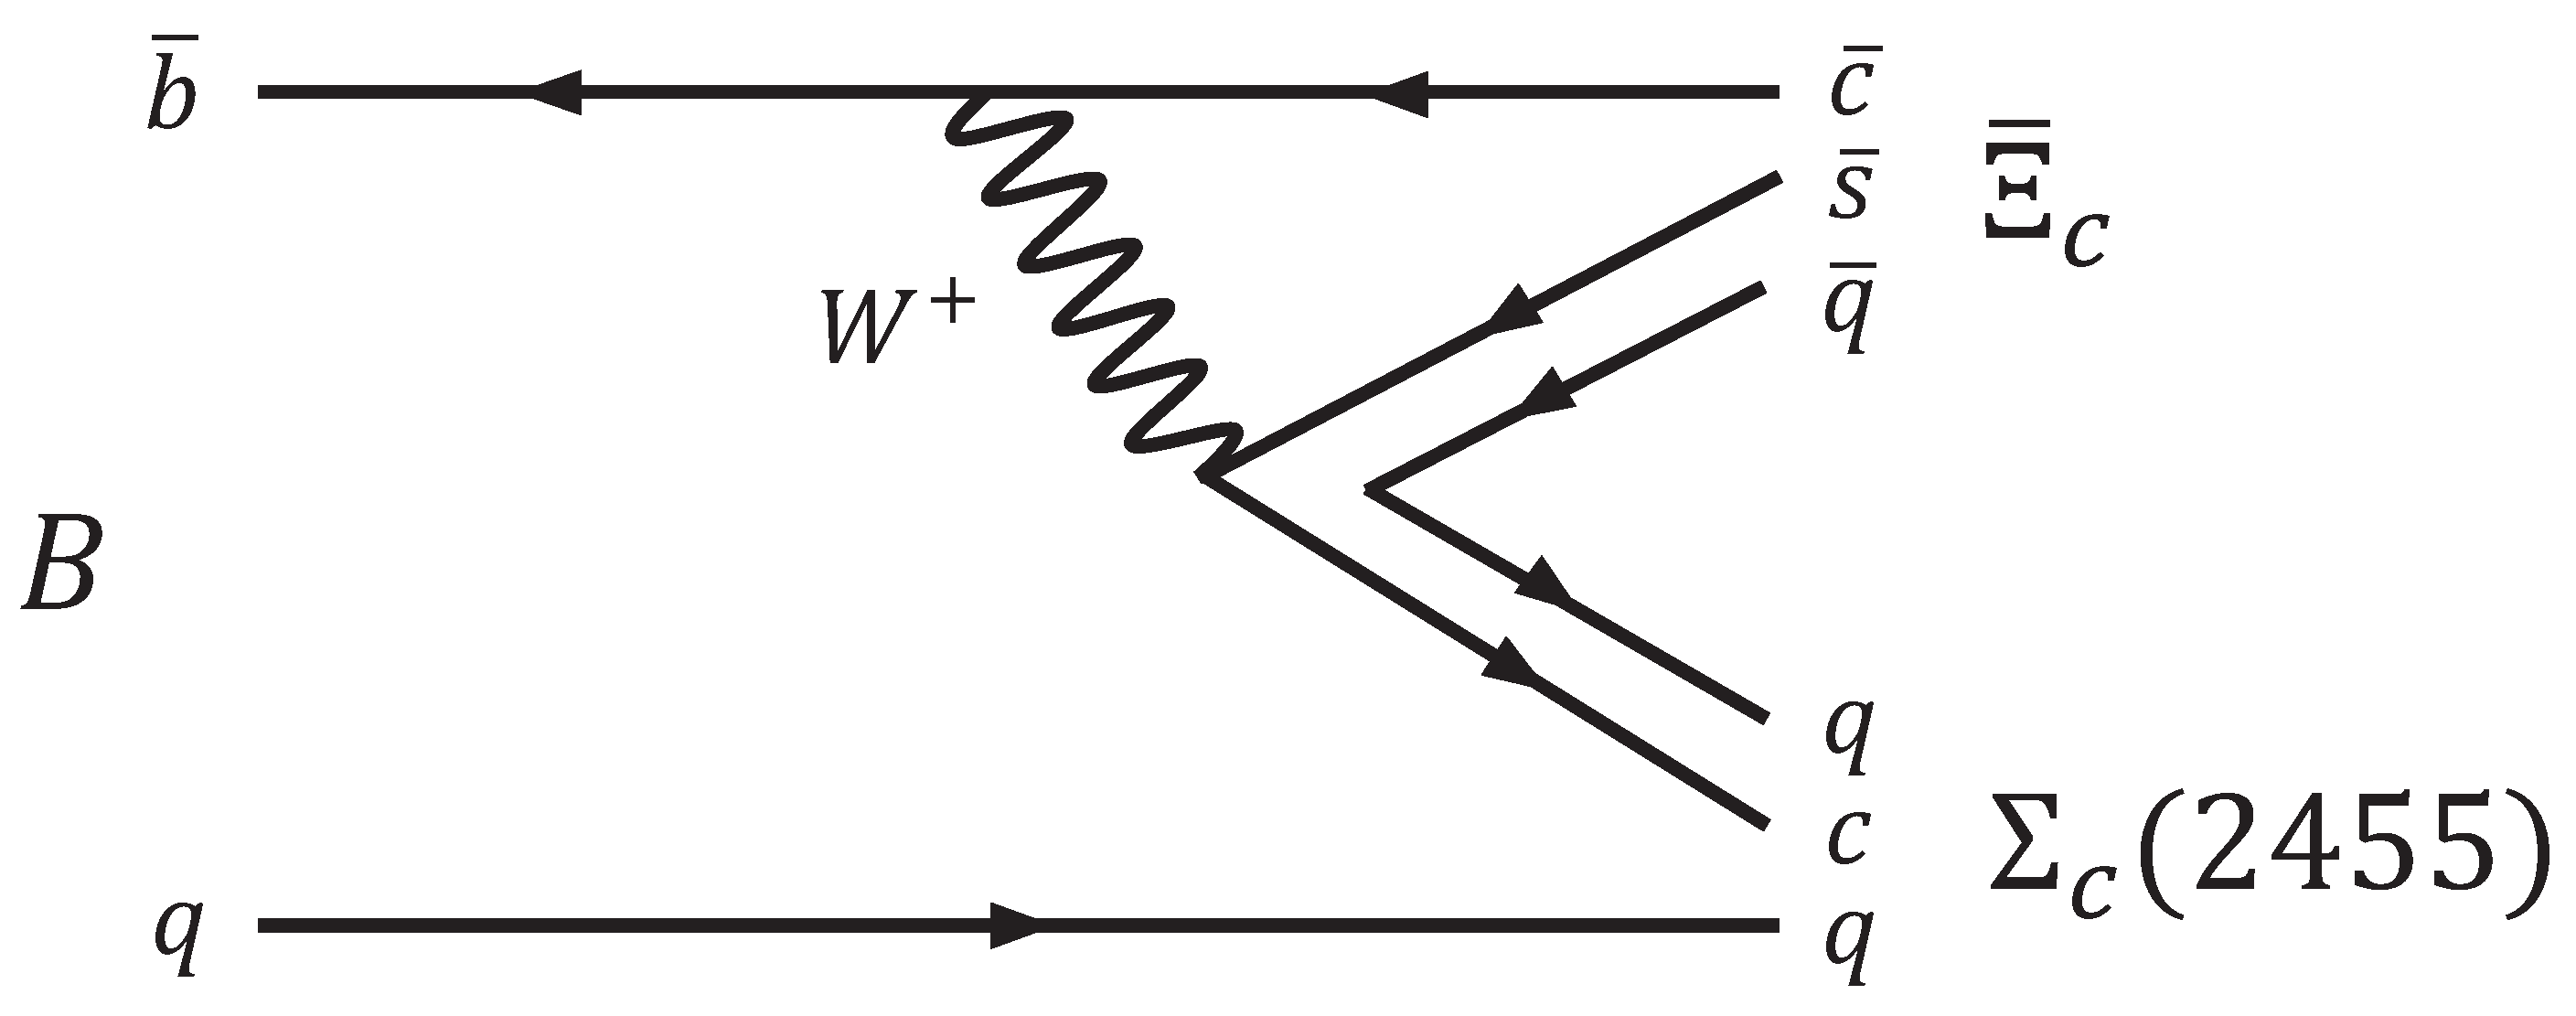
Figure 17.
Distributions of (a,c) and (b,d) for the reconstructed (top) and (bottom) candidates, using events from the signal regions of in the combined Belle and Belle II data sets [14]. Points with error bars represent the data, the solid blue curves show the total fit results, the solid red curves correspond to the fitted signal components, and the dashed magenta curves represent the total fitted background components. The shaded cyan regions indicate the peaking-background contributions from the inclusive decays, where .
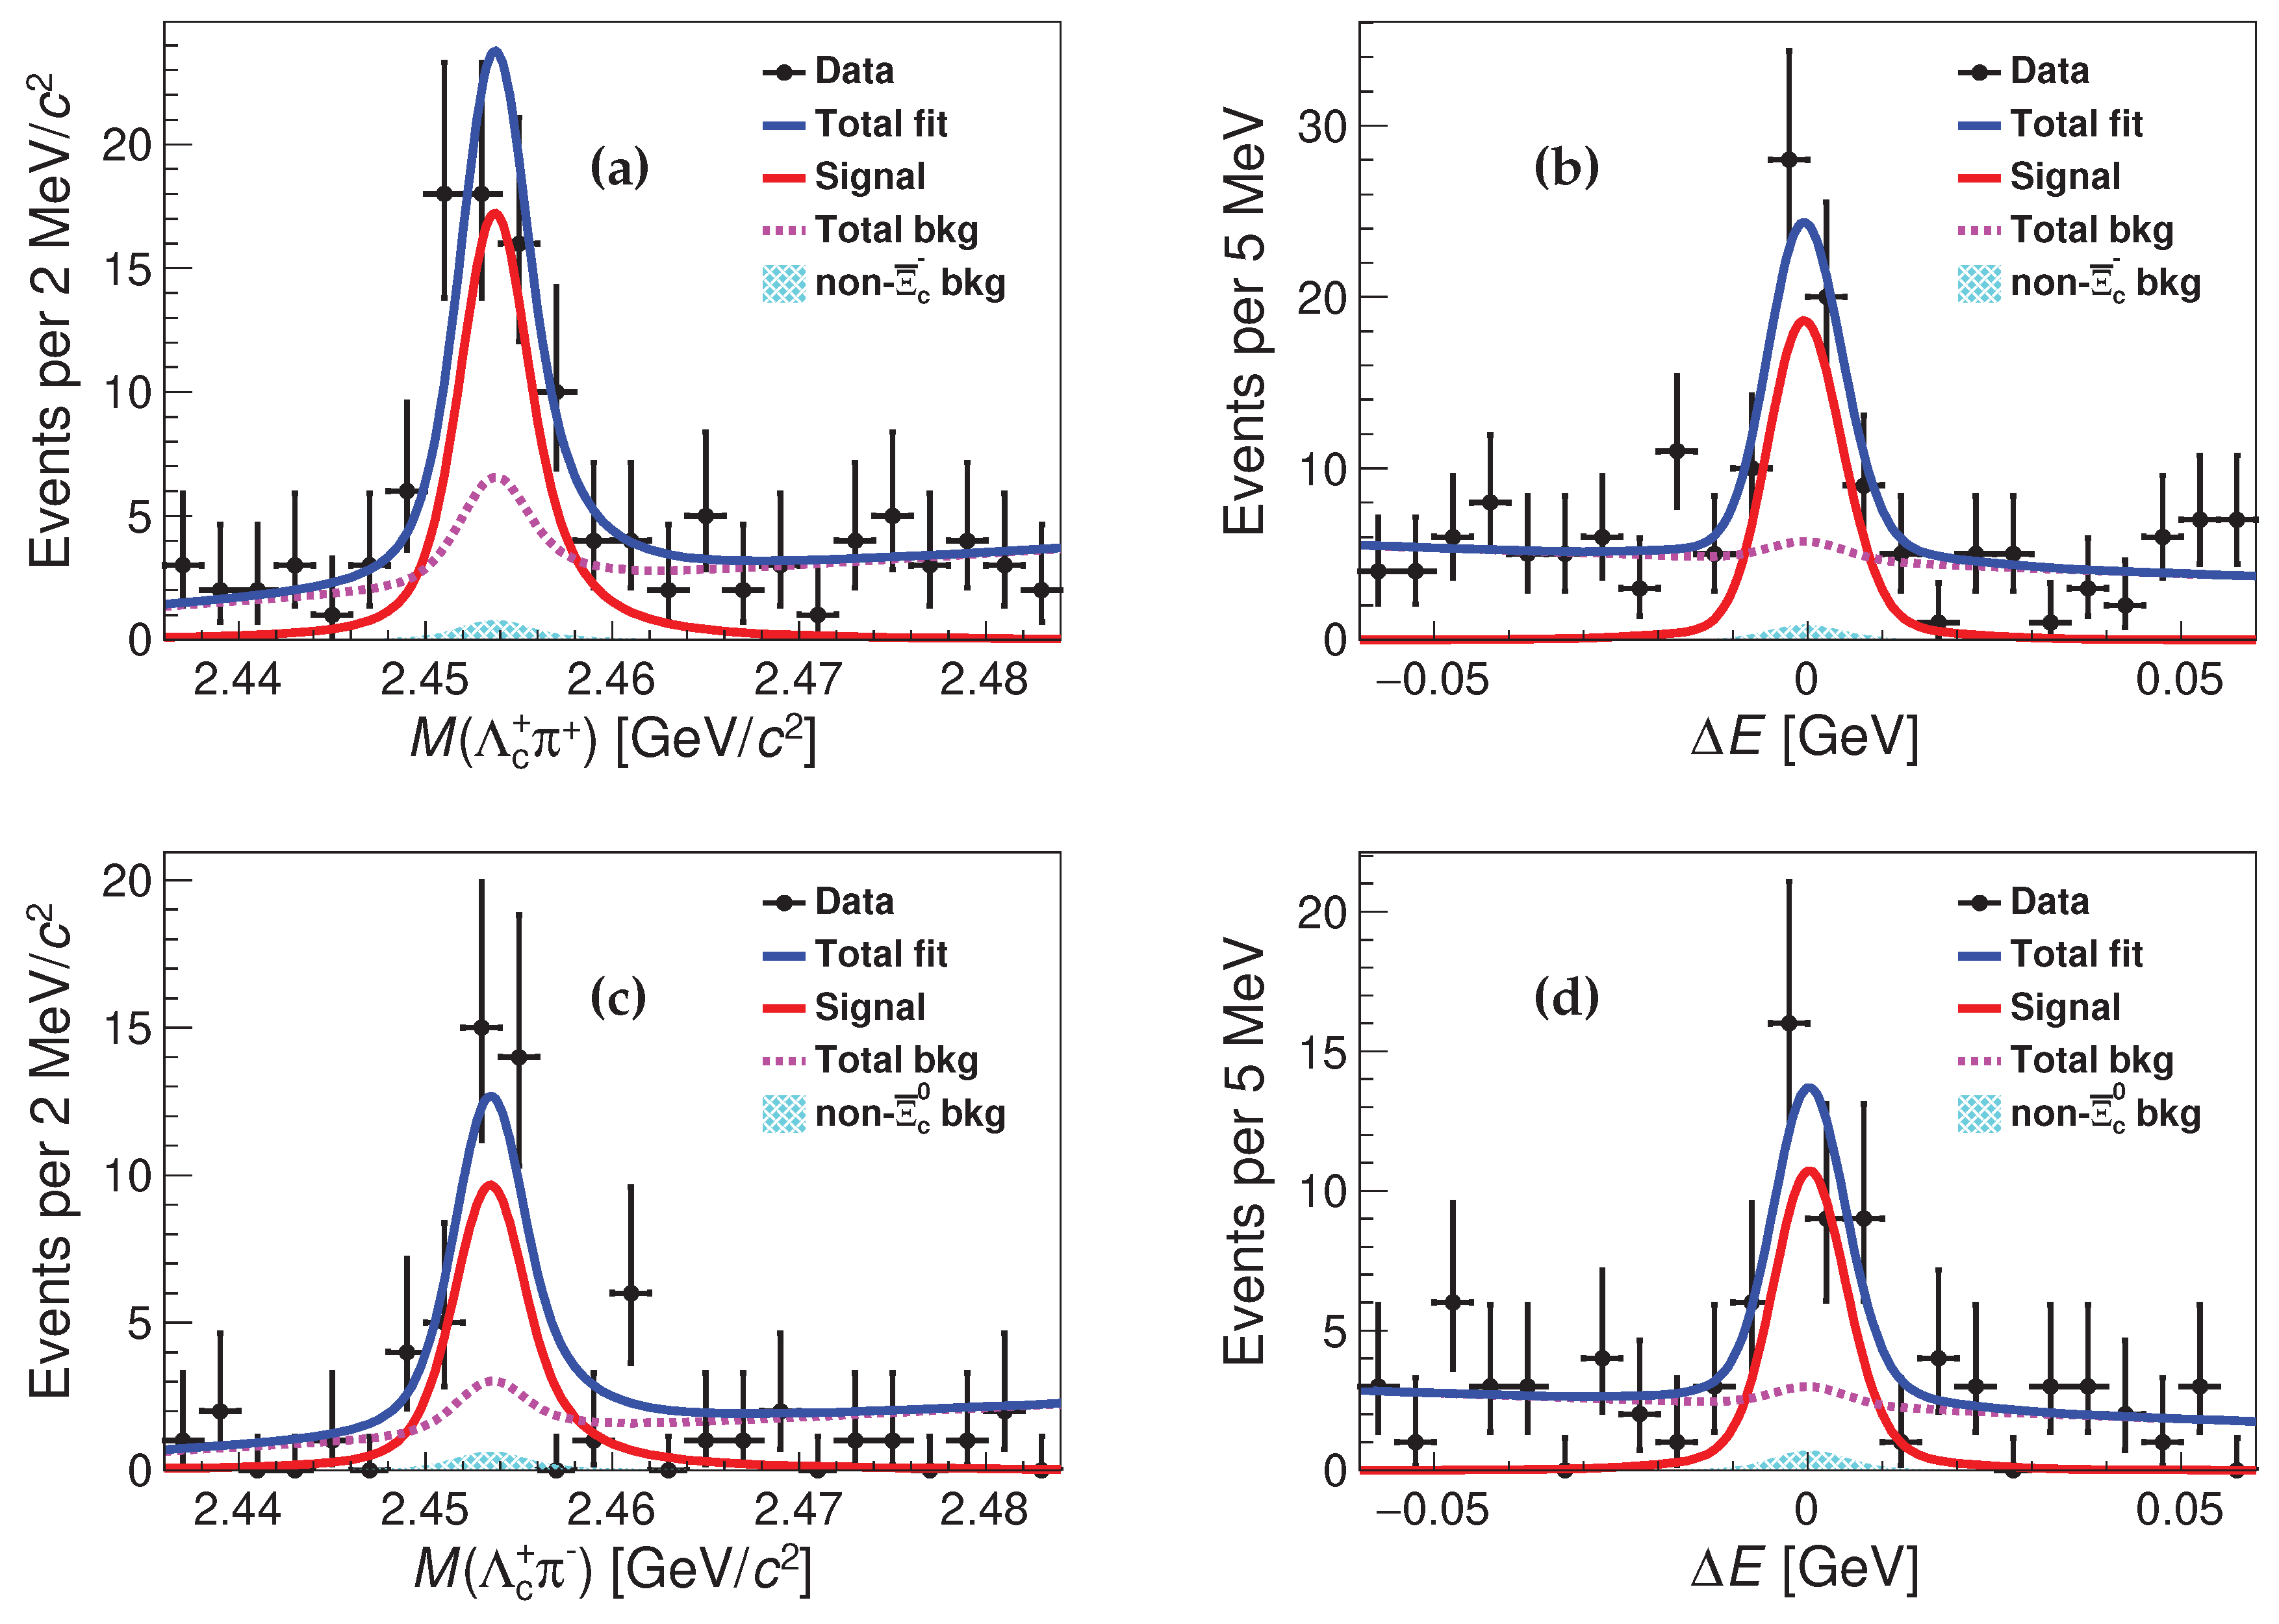
Figure 18.
The signal yields in bins of from the (a) Belle and (b) Belle II datasets [9]. The lines show the linear regression results.
Figure 18.
The signal yields in bins of from the (a) Belle and (b) Belle II datasets [9]. The lines show the linear regression results.
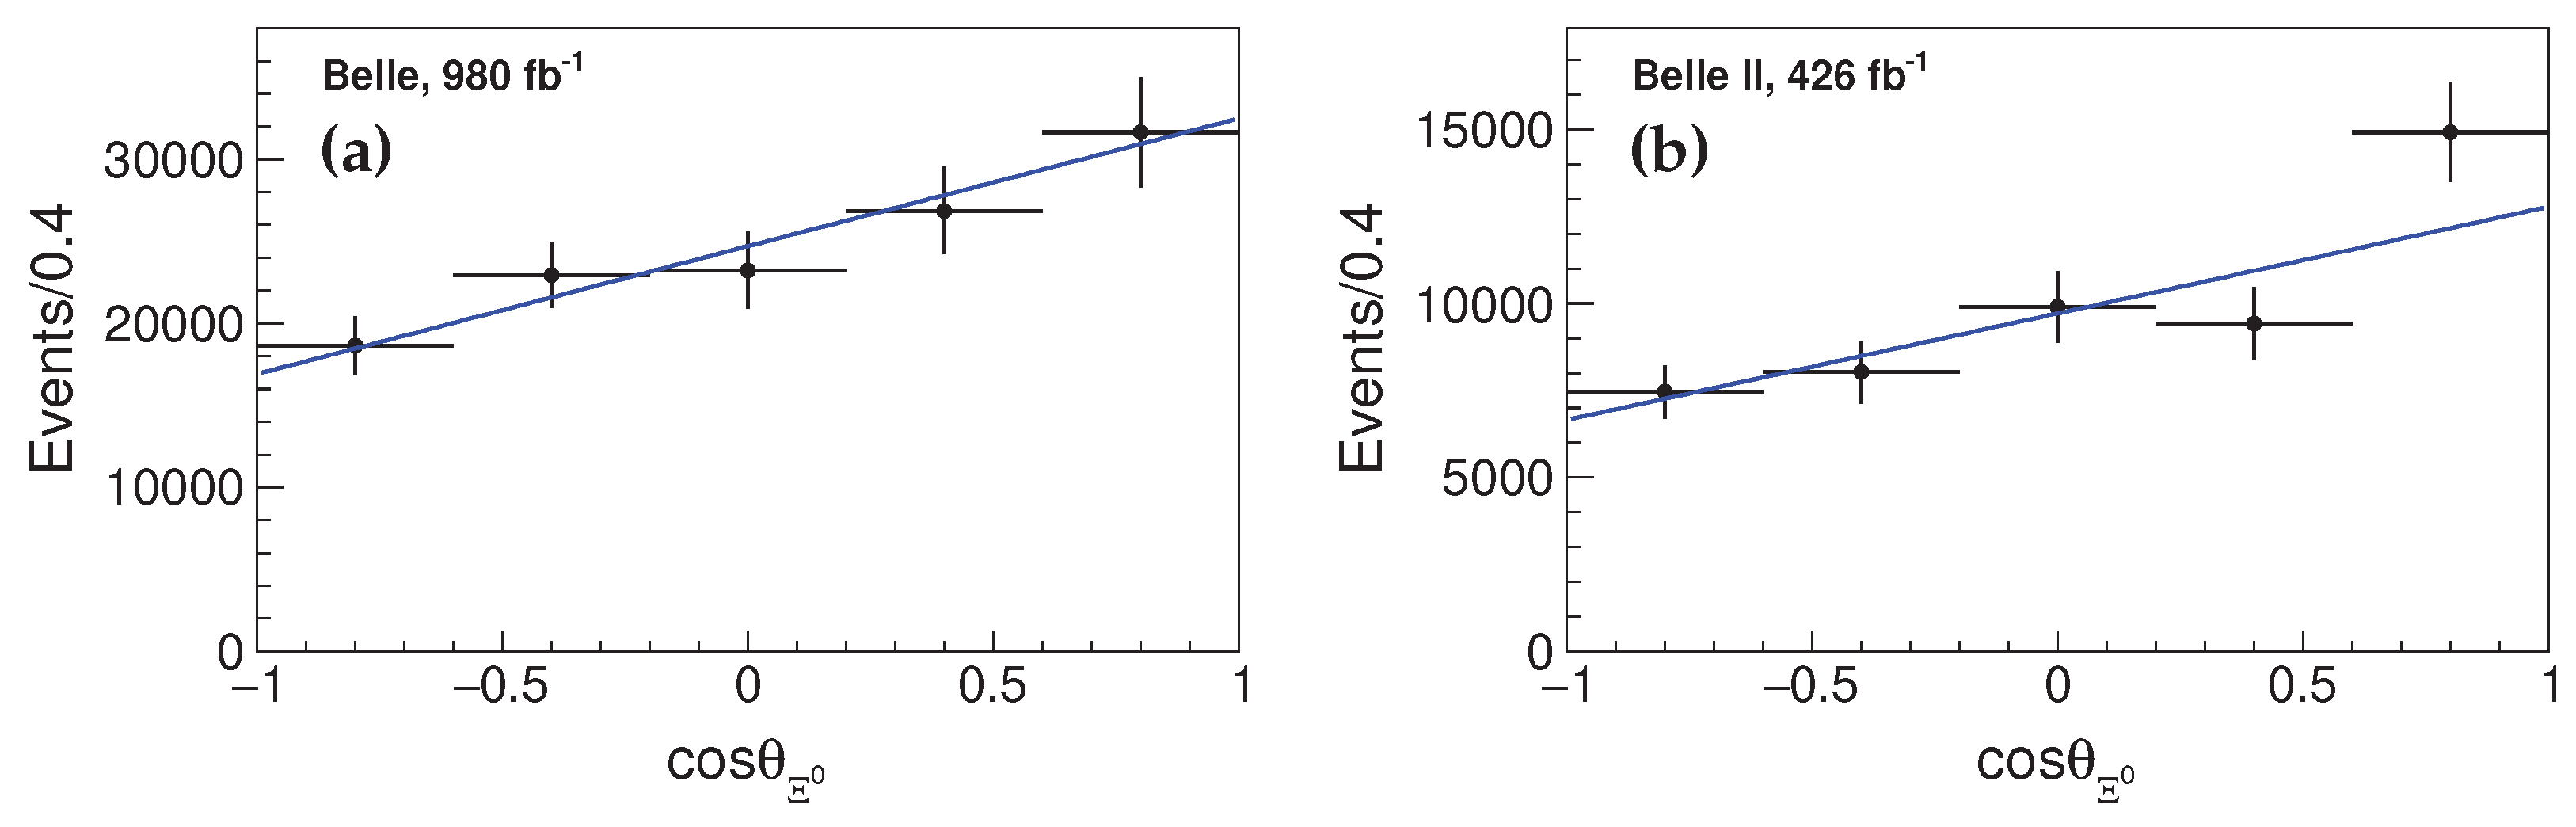
Figure 19.
Mass distributions for (top) and (bottom) candidates for (left) and (right), together with the results of the fits, summing forward and backward contributions, and their averaged yield asymmetries as functions of mass, with the fit projections overlaid [28].
Figure 19.
Mass distributions for (top) and (bottom) candidates for (left) and (right), together with the results of the fits, summing forward and backward contributions, and their averaged yield asymmetries as functions of mass, with the fit projections overlaid [28].
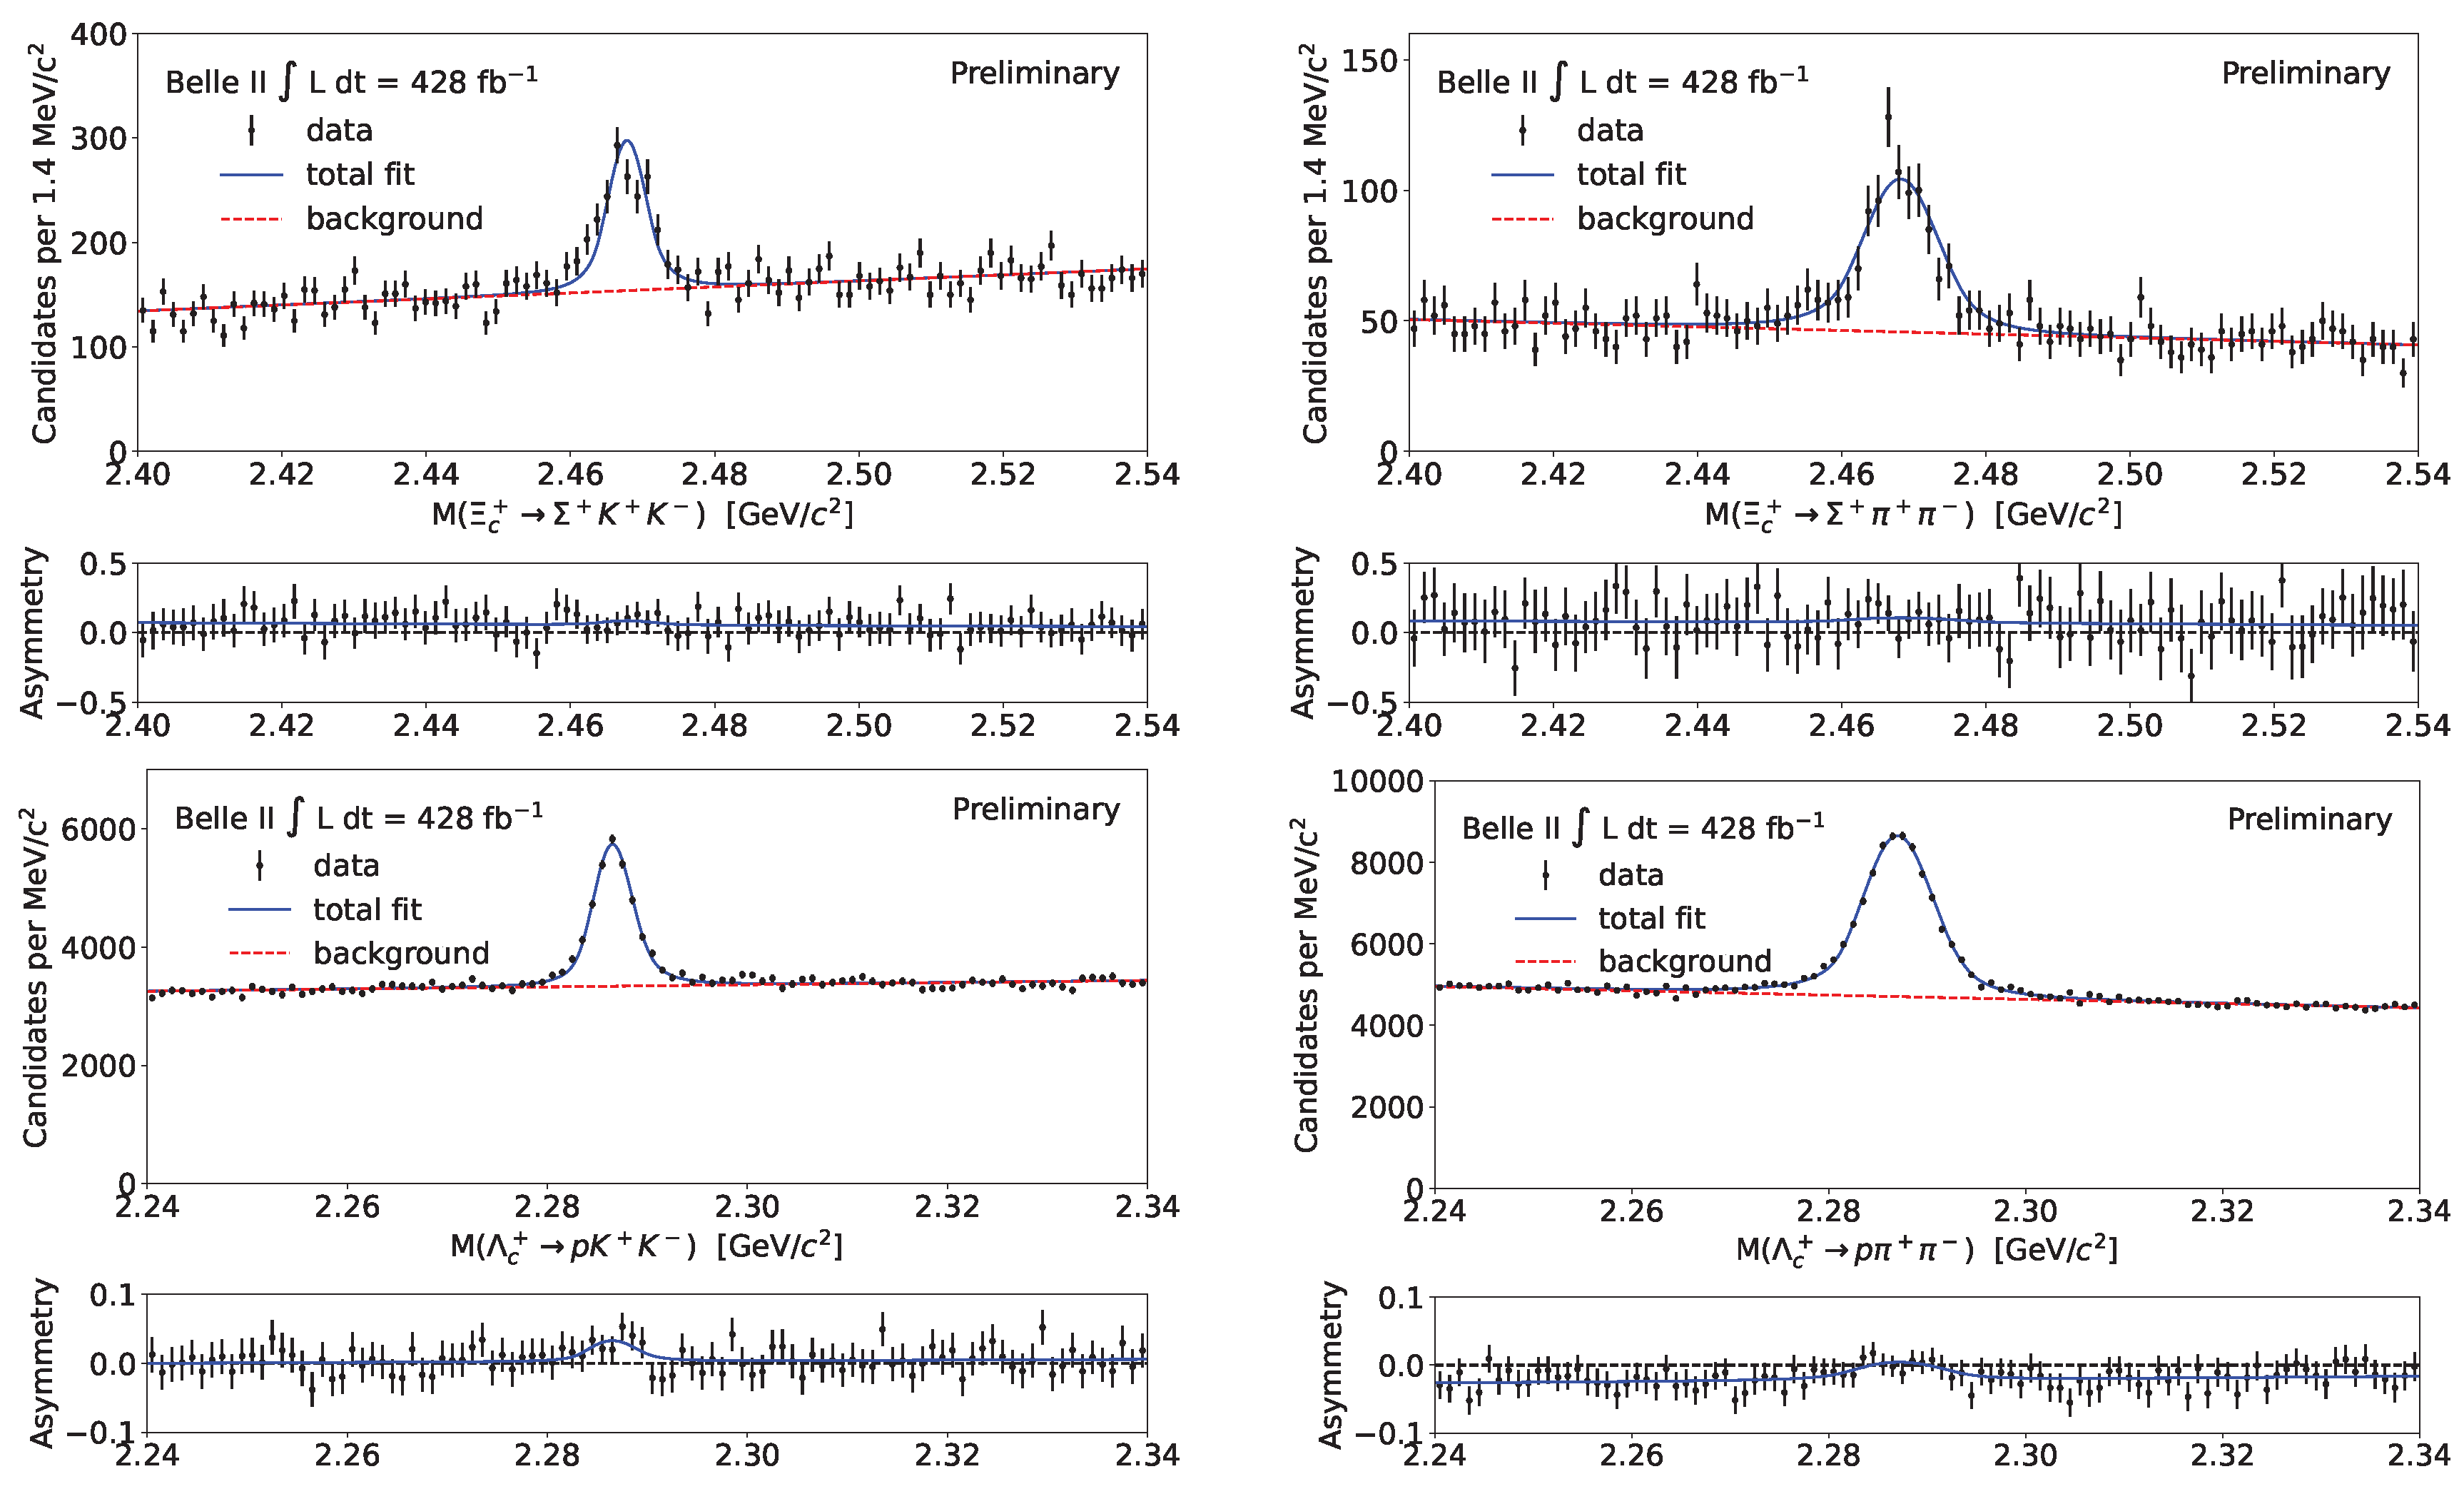
Figure 20.
Mass distributions for (top), (middle), and (bottom) candidates, using the selection criteria for (left) and (right), together with the results of the fits, summing forward and backward contributions, and their averaged yield asymmetries as functions of mass, with the fit projections overlaid [28].
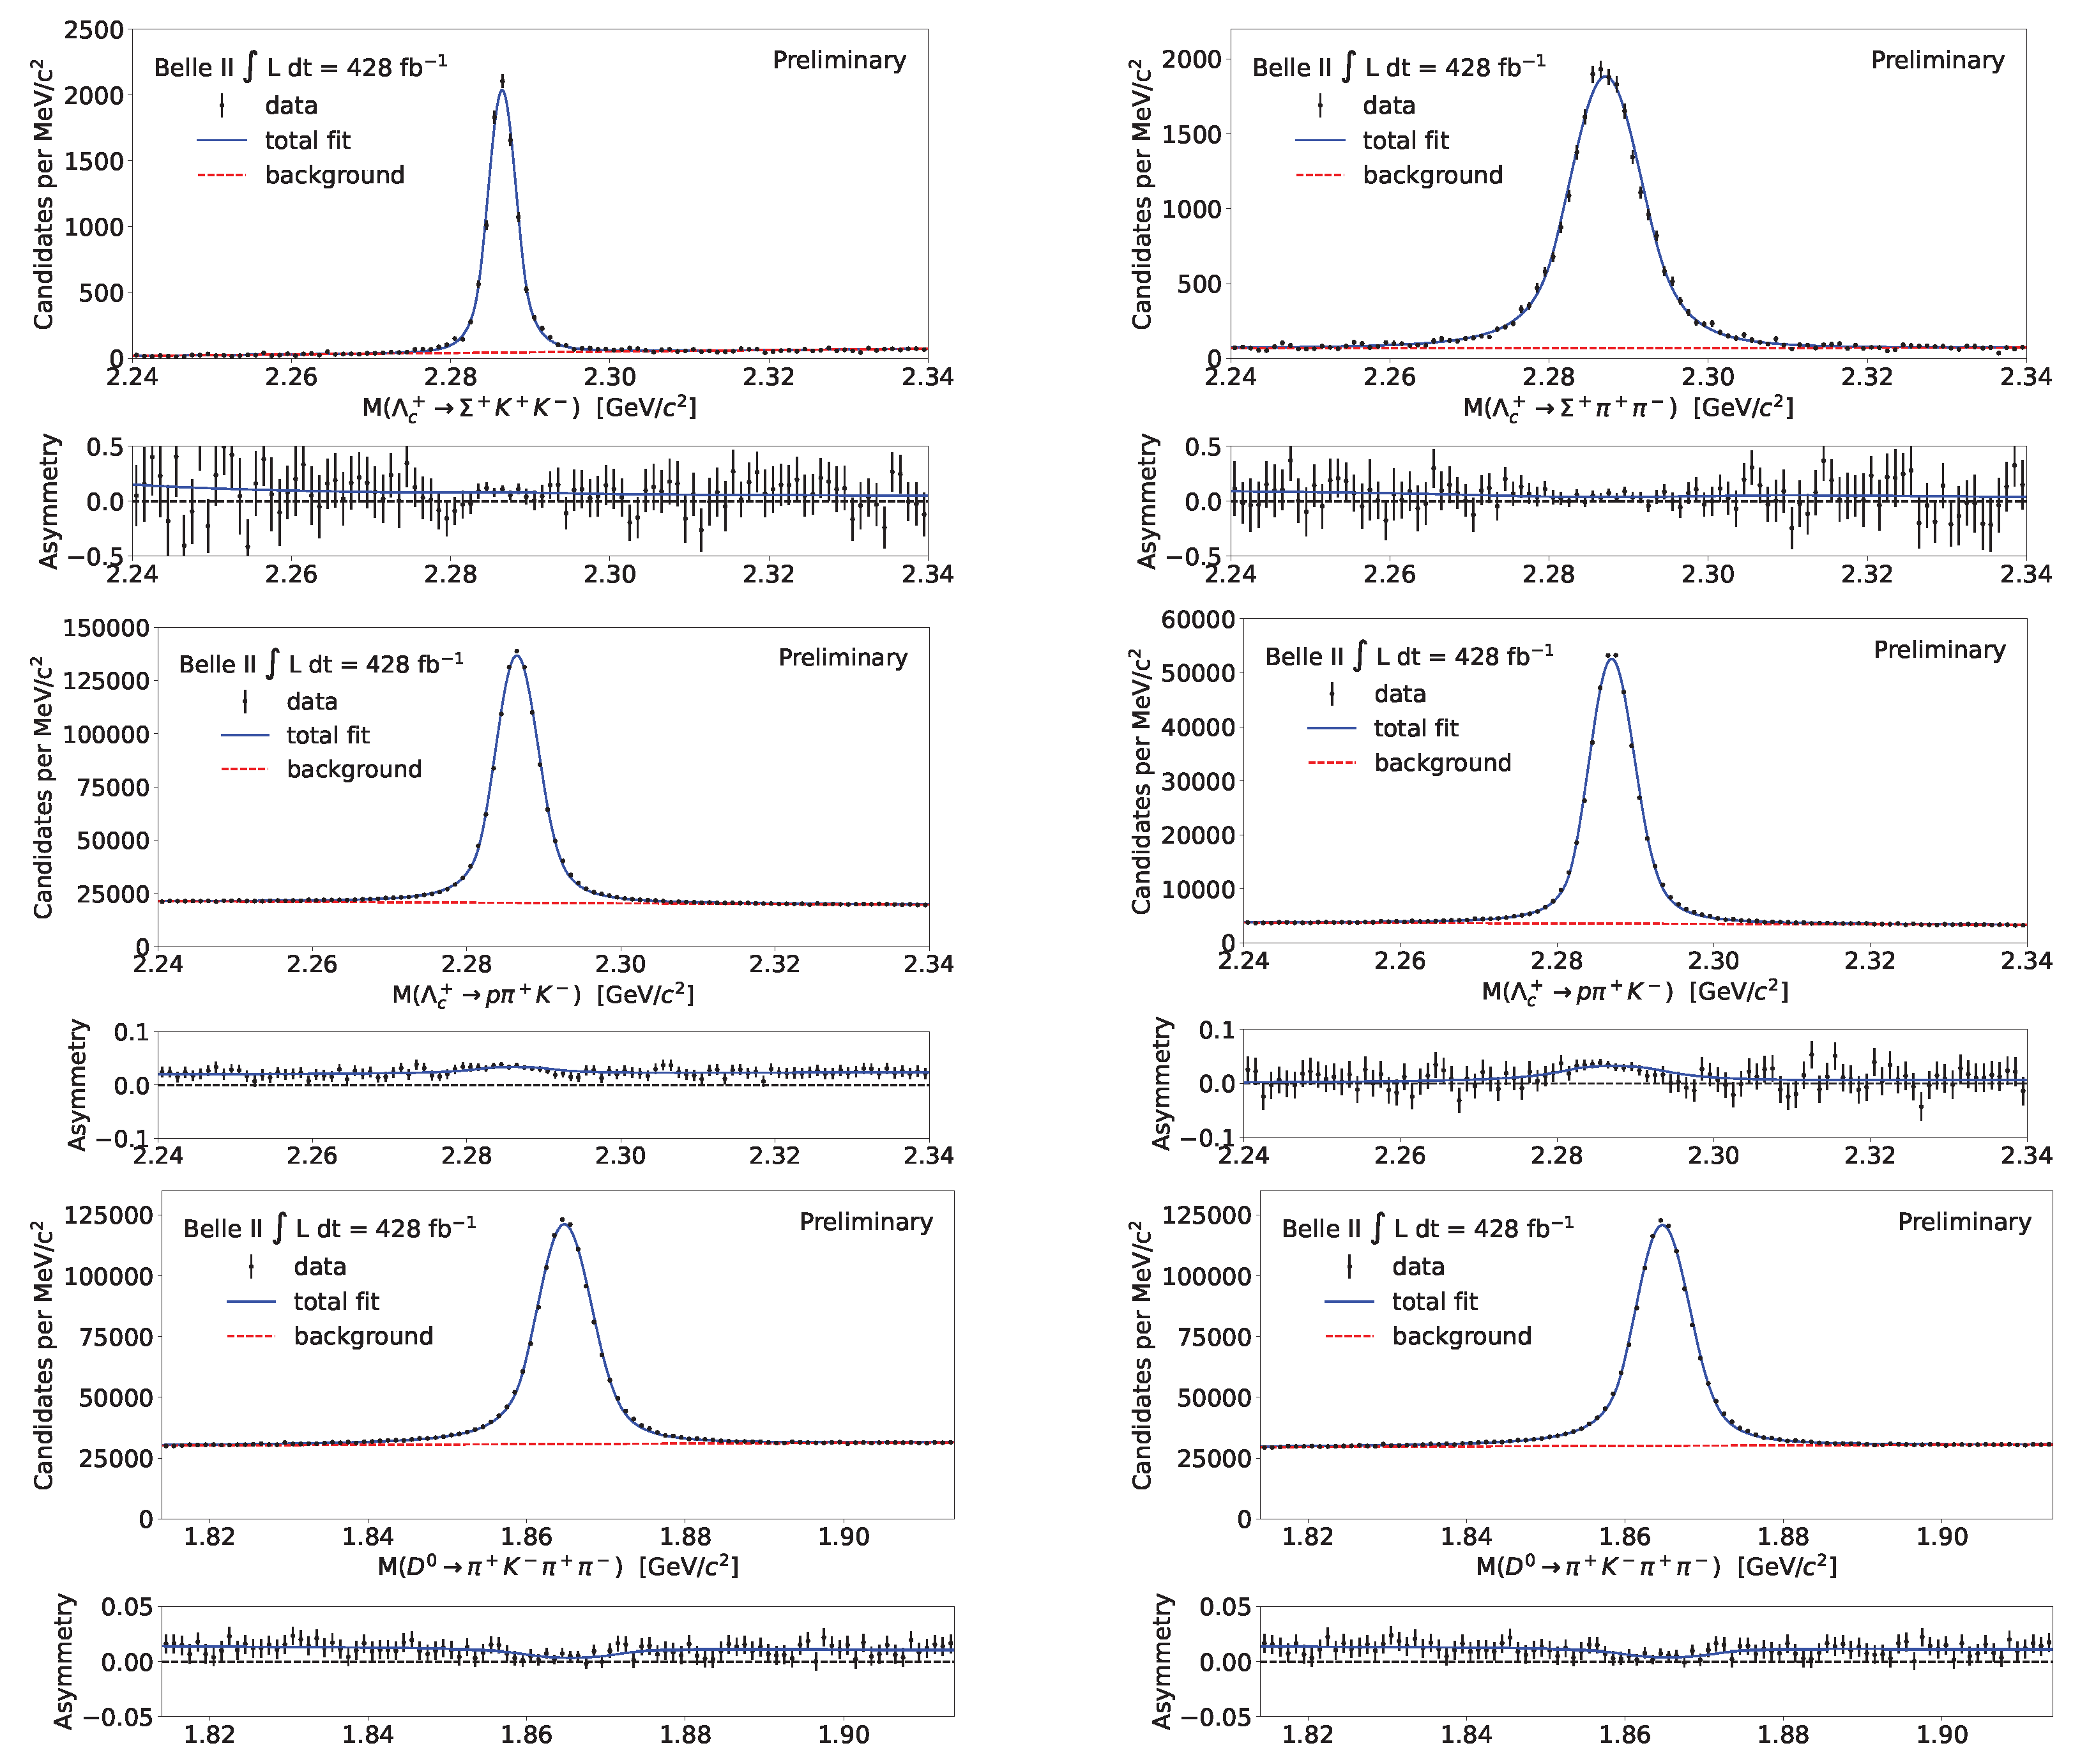

Table 1.
Reaction cross sections of various physics processes produced in annihilation at [34].
Table 1.
Reaction cross sections of various physics processes produced in annihilation at [34].
| Process | Cross section (nb) |
|---|---|
Table 2.
Recent Belle II measurements of the branching fractions of charmed baryons. The first and second uncertainties are statistical and systematic, respectively, while the third uncertainty arises from that of the reference mode.
Table 2.
Recent Belle II measurements of the branching fractions of charmed baryons. The first and second uncertainties are statistical and systematic, respectively, while the third uncertainty arises from that of the reference mode.
| Decay | |
|---|---|
| (90% C.L.) | |
Table 3.
Yields (in ) and asymmetries (in %) with statistical uncertainties [28]. † and ‡ indicate candidates selected and kinematically weighted for the and modes, respectively.
Table 3.
Yields (in ) and asymmetries (in %) with statistical uncertainties [28]. † and ‡ indicate candidates selected and kinematically weighted for the and modes, respectively.
| Decay mode | Yield | Forward | Backward | |
|---|---|---|---|---|
Disclaimer/Publisher’s Note: The statements, opinions and data contained in all publications are solely those of the individual author(s) and contributor(s) and not of MDPI and/or the editor(s). MDPI and/or the editor(s) disclaim responsibility for any injury to people or property resulting from any ideas, methods, instructions or products referred to in the content. |
© 2026 by the authors. Licensee MDPI, Basel, Switzerland. This article is an open access article distributed under the terms and conditions of the Creative Commons Attribution (CC BY) license (http://creativecommons.org/licenses/by/4.0/).
Copyright: This open access article is published under a Creative Commons CC BY 4.0 license, which permit the free download, distribution, and reuse, provided that the author and preprint are cited in any reuse.


