
Submitted:
04 February 2026
Posted:
05 February 2026
You are already at the latest version
Abstract
This study analyzes the spatiotemporal variability of carbon monoxide (CO) column density along the Lima–Huancayo section of the Central Highway in Peru during the 2019–2024 period, using data from the TROPOMI instrument onboard the Sentinel-5P satellite and official records of vehicular traffic flow. An approach based on remote sensing and exploratory statistical analysis is employed to examine the spatial and temporal patterns of atmospheric CO and its co-variability with vehicular activity at representative control points along the highway corridor. The results show heterogeneous spatial patterns and differentiated temporal behaviors, as well as statistical associations between traffic variability and CO column density at a regional and long-term scale. Given that satellite observations represent vertically integrated atmospheric content and that explicit meteorological variables are not incorporated, the findings should be interpreted as exploratory, non-causal relationships that contribute to understanding the regional dynamics of CO in transportation corridors located in complex Andean environments.
Keywords:
carbon monoxide (CO)
; Google Earth Engine
; remote sensing
; Sentinel-5P
; vehicular emissions
1. Introduction
Air pollution is one of the major environmental and public health problems worldwide. Although its effects may manifest at the local scale, scientific evidence demonstrates that anthropogenic air pollution contributes significantly to premature mortality and to the deterioration of quality of life in both developed and developing countries [1,2]. In this context, identifying emission sources and understanding the spatial and temporal patterns of atmospheric pollutants are essential for the design of effective environmental management policies.
Among the most relevant atmospheric pollutants is carbon monoxide (CO), a colorless, odorless, and highly toxic gas generated primarily by incomplete combustion processes. Exposure to CO has been associated with adverse effects on human health, particularly in urban areas and road corridors with high traffic intensity [3,4]. Numerous studies have indicated that road transport constitutes one of the main sources of CO emissions, especially in regions characterized by heterogeneous vehicle fleets, congested road infrastructure, and limited emission control systems [5,6,7,8].
In the case of Peru, air pollution associated with vehicular transport represents a growing concern. The sustained increase in the vehicle fleet, the importation of used vehicles, and the limited coverage of atmospheric monitoring networks have contributed to the emergence of areas subject to significant pollution pressure [9,10,11,12]. Although the country has national air quality standards established by the Ministry of the Environment (MINAM), their effective implementation largely depends on the availability of reliable information that enables the assessment of the spatial distribution and temporal evolution of atmospheric pollutants [13,14,15,16].
Within this context, satellite remote sensing has become a complementary tool to surface-based monitoring by enabling the systematic observation of atmospheric trace gases at the regional scale. The Sentinel-5P mission, equipped with the TROPOspheric Monitoring Instrument (TROPOMI), was designed to monitor various atmospheric pollutants, including carbon monoxide, through the estimation of total atmospheric column density. These measurements correspond to a vertical integration of CO content within the satellite pixel and do not represent direct surface concentrations; therefore, their interpretation should focus on spatial and temporal variability at broader scales [17,18,19,20].
The analysis of large volumes of satellite data has been facilitated by cloud-computing platforms such as Google Earth Engine (GEE), which provide access to extensive geospatial data catalogs and scalable analysis tools. GEE is widely used in environmental studies based on remote sensing due to its ability to process and analyze satellite data without the need for local computational infrastructure, although it is not the only platform available for this type of analysis [21,22].
Several studies have employed Sentinel-5P data to investigate the distribution of carbon monoxide in urban environments, industrial regions, and transport-influenced areas. These investigations highlight the utility of the sensor for identifying broad spatial gradients and temporal trends associated with changes in anthropogenic activity, while also emphasizing limitations related to its spatial resolution and sub-pixel mixing effects, particularly in regions with complex topography [23,24,25,26,27,28,29].
In mountainous road corridors, the interaction between vehicular emissions, topography, and atmospheric conditions can generate pollutant accumulation patterns that are difficult to capture using point-based monitoring stations alone. In the Peruvian context, the systematic application of remote sensing tools for the regional analysis of transport-related atmospheric pollutants remains limited, especially for strategic infrastructures such as the Central Highway, which connects Lima with the central highlands and supports traffic volumes that exceed its design capacity along several sections [30,31,32,33].
Within this framework, the present study aims to analyze the spatial and temporal variability of atmospheric carbon monoxide associated with vehicular transport along the Central Highway of Peru, focusing on the Lima–Huancayo section during the 2019–2024 period, using Sentinel-5P satellite data processed through the Google Earth Engine platform. The study is conceived as an exploratory regional-scale analysis oriented toward identifying spatial patterns, interannual variations, and statistical associations between vehicular traffic flow and CO column density, thereby contributing to the strengthening of environmental management tools in contexts where ground-based monitoring is limited..
2. Methods
This study was conducted as a descriptive and correlative spatial analysis based on remote sensing, aimed at examining the spatiotemporal variability of atmospheric carbon monoxide (CO) at a regional scale. The methodological approach falls within the scope of applied research, using data obtained from remote sensors to identify spatial patterns, describe their temporal evolution, and explore statistical associations between environmental and anthropogenic variables.
Unlike experimental studies or primary monitoring approaches, this methodology does not involve the direct collection of new field data, but rather the integrated analysis of satellite information and official secondary records. In this sense, the adopted approach complements existing ground-based monitoring, facilitates the identification of areas subject to higher pollution pressure, and provides useful evidence for decision-making in contexts where monitoring station coverage is limited.
2.1. Study Area
The study area corresponds to the Lima–Huancayo section of the Central Highway of Peru, a strategic road infrastructure that connects the country’s capital with the central highlands. This corridor traverses a predominantly Andean environment, characterized by mountainous topography, narrow valleys, and steep slopes—conditions that may influence the atmospheric dispersion of pollutants emitted by vehicular traffic.
From a topographic perspective, the analyzed section spans an approximate altitudinal range between 800 and 4,800 m above sea level, as shown in Figure 1, crossing geomorphologically complex settings typical of the central Andean range. Topographic information was used in this study for descriptive purposes, in order to contextualize the spatial patterns of carbon monoxide observed through remote sensing, recognizing that terrain complexity may favor local accumulation or channeling processes without implying the use of explicit atmospheric modeling. This spatial context is illustrated in Figure 2.
For the statistical analysis, the sectors of Corcona and Casaracra were selected as reference points, as these locations provide continuous records of vehicular traffic flow and frequently experience congestion episodes associated with interregional transit.
2.1. Data Acquisition
This study is based on data from the TROPOspheric Monitoring Instrument (TROPOMI) onboard the Sentinel-5P satellite, accessed through the Google Earth Engine (GEE) platform. For the analysis of carbon monoxide (CO), the COPERNICUS/S5P/OFFL/L3_CO collection was used, corresponding to the Level 3 offline (OFFL) product generated in GEE from the reprocessing and gridding of the original Level 2 products. The variable employed was CO_column_number_density, which represents the total atmospheric CO column density, expressed in mol/m², corresponding to the vertical integration of atmospheric CO content within each pixel.
Data from the 2019–2024 period were analyzed, with an approximate spatial resolution of 1 km. The OFFL product was selected due to its higher quality and posterior validation, making it suitable for retrospective analyses. Since CO data represent vertically integrated atmospheric columns rather than direct surface concentrations, the results are interpreted as indicators of the spatial and temporal variability of the pollutant at a regional scale. Data processing was carried out without applying additional quality control filters, using directly the values provided by the Level 3 GEE collection.
The area of analysis was defined based on the provincial administrative units intersected by the Lima–Huancayo section of the Central Highway of Peru, within which the data were spatially aggregated through clipping and summation operations. In addition, official daily vehicular traffic flow records provided by the Supervisory Agency for Investment in Public Transportation Infrastructure (OSITRAN) were incorporated for the Corcona and Casaracra toll stations, selected due to their operational relevance and the continuity of available information throughout the study period.
2.2. Data Preprocessing
Satellite data were accessed and processed on the Google Earth Engine platform using scripts developed in the JavaScript programming language. As a quality control criterion, filtering based on the qa_value parameter was applied, retaining only observations with values greater than 0.5, in accordance with technical recommendations for the TROPOMI CO product.
Preprocessing included the definition of the temporal analysis window (2019–2024) and the area of interest, delineated using administrative shapefiles corresponding to the provinces of Lima, Huarochirí, and Yauli. Spatial and temporal filters were subsequently applied, and annual cumulative composites of the pollutant were generated.
The resulting products were exported in GeoTIFF format for subsequent analysis within Geographic Information System (GIS) environments. The general workflow for satellite data extraction and processing is presented in Figure 3, which summarizes the main stages of the procedure implemented in Google Earth Engine.
2.2. Spatial Analysis
The preprocessed satellite data were integrated into a Geographic Information System (ArcGIS) to generate thematic maps and analyze the spatial distribution of CO along the road corridor and its regional surroundings. This analysis made it possible to identify spatial gradients of the pollutant and to evaluate its annual variability over the study period.
Although the analyzed area exceeds the exact alignment of the Central Highway, this approach is consistent with the spatial resolution of the TROPOMI sensor and allows the contextualization of pollutant values within a broader regional framework. In addition, the relationship between the spatial distribution of CO, road infrastructure, and topography within the study area was explored descriptively, while explicitly acknowledging the limitations inherent to this type of analysis.
2.3. Validation and Statistical Correlation
The statistical analysis of this study was conducted using an exploratory approach aimed at examining structural associations between vehicular traffic flow and the variability of atmospheric carbon monoxide (CO) at regional and temporal scales. Since Sentinel-5P–derived CO data represent vertically integrated column density rather than direct surface concentrations, the analysis does not seek to model instantaneous atmospheric dispersion processes nor to establish direct causal relationships conditioned by daily meteorological variability.
The consistency of satellite-derived data was evaluated through a qualitative comparison with in situ carbon monoxide measurements reported by the National Service of Meteorology and Hydrology of Peru (SENAMHI) for the year 2019. This comparison was performed with explicit recognition of differences in spatial scale and measurement units between both data sources; therefore, it was not intended as a quantitative validation, but rather as a verification of spatial and temporal coherence.
To analyze the relationship between vehicular traffic flow and CO column density, data were evaluated independently for the Corcona and Casaracra toll stations in order to avoid aggregating heterogeneous time series that could lead to spurious correlations. This approach allows for a more robust interpretation of the associations observed in each sector of the road corridor.
A combination of complementary statistical tests was applied. Pearson correlation was used to assess linear associations between variables, while Spearman correlation enabled the identification of monotonic relationships that are robust to potential outliers or non-normal data distributions. Additionally, the non-parametric Mann–Kendall test was employed to detect the presence of statistically significant temporal trends in the CO column density time series over the study period.
Meteorological variables such as wind speed and direction, precipitation, and atmospheric stability significantly influence pollutant dispersion at local and short-term scales. However, these variables were not explicitly incorporated into the statistical analysis of the present study, as the objective focuses on identifying long-term average relationships between vehicular traffic and regional CO variability, rather than explaining specific short-term episodes conditioned by daily meteorological conditions.
Consequently, correlation results are interpreted as exploratory structural associations that integrate multiple meteorological conditions throughout the analyzed period, and not as evidence of a direct causal relationship between vehicular traffic flow and surface-level CO concentrations. All statistical analyses were performed using the Python programming language.
3. Results
This section presents the spatial and statistical analysis of carbon monoxide (CO) column density along the Central Highway between Chosica and Huancayo, covering the provinces of Lima, Huarochirí, and Yauli. The spatial distribution of the pollutant was derived from Sentinel-5P satellite data accessed and processed using the Google Earth Engine platform. Values are expressed in units of CO column density (mol/m²), as provided by the platform and used consistently in the spatial and statistical analyses. This unit was retained to ensure consistency with the satellite data and the generated maps, avoiding additional assumptions regarding atmospheric vertical profiles that would be required to convert values to surface concentrations (ppm or μg/m³).
In addition, satellite-derived values were compared with daily vehicular traffic flow data recorded at two strategically located toll stations along the corridor (Corcona and Casaracra) in order to examine the exploratory statistical association between traffic intensity and CO column density. Based on these data, correlation coefficients were calculated and temporal trend analyses were performed to characterize the co-variability between both variables. Pearson, Spearman, and Mann–Kendall tests were applied to evaluate the strength, direction, and temporal stability of the observed associations, without implying direct causal relationships.
3.1. Annual Cumulative Spatial Representation of CO
Using the script implemented on the Google Earth Engine (GEE) platform, and following the methodology described above, spatial distribution patterns of carbon monoxide (CO) column density were obtained for annual periods from 2019 to 2024. These annual maps, expressed in units of mol/m², depict the cumulative column density of the pollutant along the Central Highway corridor traversing the provinces of Lima, Huarochirí, and Yauli. The raster information representing CO column density (mol/m²) is shown in Figure 4.
Based on the generated maps, the spatial and temporal evolution of carbon monoxide (CO) column density along the analyzed section of the Central Highway can be observed. Although a relatively stable general pattern is identified, interannual variations in pollutant magnitude are evident, reflecting changes in its regional distribution throughout the analyzed period. In addition, the maps allow the identification of sectors with relatively higher and lower CO column density values, with higher values concentrated toward the initial segment of the corridor and lower values toward the final section of the route.
Vehicular traffic flow data were obtained from performance reports published by the Supervisory Agency for Investment in Public Transport Infrastructure (OSITRAN), within the framework of the IIRSA Centro concession. This information includes records of daily vehicular traffic for the period 2019–2024, as presented in Table 1, collected at two strategically located toll stations along the Central Highway: Corcona and Casaracra. These stations are situated at distinct geographic locations, allowing the analysis of traffic flow variability across different sections of the highway, as illustrated in Figure 5.
During the period from 2019 to 2024, vehicular traffic flow data were collected from official reports issued by the competent authorities [34,35,36,37,38]. Based on the values presented in Table 2, it was possible to examine in greater detail the joint variability of daily vehicular traffic flow and carbon monoxide (CO) column density throughout the study period. Using these data, a scatter plot was constructed, incorporating the corresponding trend line and the Pearson correlation coefficient. This representation allowed visualization of the joint behavior of both variables and assessment of the degree of association between them, as shown in Figure 6.
3.1. Temporal Regression Analysis and Statistical Tests
To evaluate the relationship between remotely sensed carbon monoxide (CO) column density (mol/m²) and mean daily vehicular traffic volume, bivariate Pearson and Spearman correlation tests were applied. The significance level was set at α = 0.05 (5%), in accordance with widely accepted statistical conventions in scientific research, which allow up to a 5% probability of committing a Type I error, i.e., incorrectly concluding that an association exists when it does not.
The Pearson linear correlation analysis, appropriate for quantifying linear relationships between continuous variables, yielded a correlation coefficient of r = 0.689 with a p-value of 0.0132. Since the p-value was below the significance threshold (p < 0.05), the null hypothesis of no correlation was rejected, indicating a moderately strong, positive, and statistically significant association between both variables. The 95% confidence interval for this coefficient was [0.190, 0.905]. Constructed under the principle that, in repeated sampling, 95% of such intervals would contain the true population parameter, this interval indicates a consistent trend in the data despite its width, which can be attributed to the sample size.
Complementarily, given that the data may not strictly satisfy all parametric assumptions, Spearman’s rank correlation was applied as a non-parametric test. This test evaluates monotonic relationships (not necessarily linear) and is robust to potential outliers. The Spearman correlation coefficient (ρ) was 0.622 with a p-value of 0.0307, which is also below α = 0.05, thus robustly confirming the existence of a positive and statistically significant association between vehicular traffic volume and CO column density. The consistency in statistical significance across both tests, despite their different underlying assumptions, reinforces the evidence of a statistically consistent association between the analyzed variables within the considered temporal period and scale.
3.1.1. Pearson and Spearman Correlation Analysis
The analysis of the relationship between carbon monoxide (CO) column density and vehicular traffic flow was conducted using a dual statistical approach implemented in Python with data from Table 3. This methodological strategy allowed the association between both variables to be characterized from complementary perspectives.
First, the Pearson correlation coefficient (r) was applied. This parametric method quantifies the strength and direction of a linear relationship between continuous variables, operating under assumptions of normality and homoscedasticity.
Simultaneously, given that environmental data frequently deviate from these assumptions, the Spearman correlation coefficient (ρ) was computed. This non-parametric test evaluates the existence of a monotonic relationship (i.e., whether one variable tends to consistently increase or decrease as the other changes). It is robust to outliers and does not require assumptions regarding data distribution.
The combined application of both coefficients provides a more robust and reliable evaluation of the association under study.
The results confirm a positive and moderately strong association between daily vehicular traffic volume and CO column density. The Pearson coefficient (r = 0.689) indicates a substantial linear trend, while the Spearman coefficient (ρ = 0.622) corroborates a consistent monotonic relationship, even in the presence of potential non-linearities in the data. The statistical significance of this association, supported by p-values below 0.05 for both tests (p = 0.0132 for Pearson; p = 0.0307 for Spearman), implies that the probability of observing a correlation of this magnitude by chance—assuming no true association in the population—is less than 5%. This threshold (α = 0.05), conventionally adopted in scientific research, ensures a high level of confidence in the findings.
In substantive terms, these findings indicate the existence of a positive and statistically significant association between daily vehicular traffic volume and CO column density in the study area, within the spatial and temporal scale analyzed. The consistency between the Pearson and Spearman coefficients suggests that this association holds under both linear assumptions and general monotonic relationships. Nevertheless, these results should be interpreted as evidence of statistical co-variability rather than as demonstrations of direct causality, as the analysis does not incorporate meteorological variables or physical models of atmospheric dispersion.
3.1.2. Mann–Kendall Trend Test
The Mann–Kendall test was also implemented using the Python programming language. The objective was to determine whether CO column density and vehicular traffic flow recorded at the toll stations exhibited a systematic increase or decrease during the period 2019–2024, beyond specific variations that could be attributed to circumstantial factors. This analysis enables the identification of long-term trends in both variables and contributes to a deeper understanding of their temporal evolution, suggesting that the observed variations may be associated with year-specific conditions rather than with a sustained structural change in CO column density or vehicular traffic flow.
As shown in Figure 6, Table 3, and Table 4, the results indicate that neither CO column density nor vehicular traffic volume exhibit a statistically significant temporal trend during the period from 2019 to 2024 (trend = “no trend”, p = 0.732 in both cases). The fact that the p-value exceeds the 0.05 significance threshold indicates that there is insufficient statistical evidence to assert the presence of a sustained increasing or decreasing trend in the analyzed time series. In other words, although interannual fluctuations are observed, these do not follow a consistent temporal pattern, suggesting that the observed variations may be associated with year-specific factors rather than with a structural change in CO column density or vehicular traffic flow.
In Table 5, the results of the applied statistical tests show a positive and statistically significant relationship between vehicular traffic volume and carbon monoxide (CO) column density, as indicated by the Pearson (R = 0.689) and Spearman (ρ = 0.622) coefficients. A moderate positive association is observed between the variability of vehicular traffic volume and CO column density over the analyzed period.
On the other hand, the Mann–Kendall trend test did not reveal a statistically significant temporal trend (p > 0.05) for either carbon monoxide or vehicular traffic volume. This indicates that, despite interannual variability, no sustained increase or decrease was observed during the 2019–2024 period. Taken together, these results suggest that CO variability is more closely associated with short-term variations in vehicular traffic flow than with a long-term temporal trend.
3.1.1. Annual Summary
The annual summary table was generated using Python, based on monthly CO column density values and vehicular traffic volume data. Using the pandas and NumPy libraries, annual mean values and standard deviations were calculated for each year, and trend indicators derived from the Mann–Kendall test were incorporated. This automated procedure provided a clear and concise summary of the temporal evolution of the analyzed variables.
Table 6 shows that mean CO values exhibit a slight overall decrease between 2019 and 2023, followed by a rebound in 2024. Vehicular traffic volume follows a similar pattern, with declines during 2020 and a slight recovery in 2021, but without a sustained trend. This is consistent with the results of the Mann–Kendall test, which did not reveal a statistically significant temporal trend in either variable.
3.1.1. Analysis of Temporal Trends (Mann–Kendall and Sen’s Slope)
The non-parametric Mann–Kendall test was applied at a 5% significance level (α = 0.05) to detect temporal trends in carbon monoxide (CO) column density during the 2019–2024 period, complemented by the estimation of Sen’s slope to quantify the magnitude of annual change. The results obtained from the computational analysis are presented below.
Corcona:
Mann_Kendall_Test(trend = ‘decreasing’, h = True, p = 0.0242, z = −2.2544, Tau = −0.8667, S = −13.0, var(S) = 28.33, slope = −0.3667, intercept = 6.67)
Casaracra:
Mann_Kendall_Test(trend = ‘no trend’, h = False, p = 0.4524, z = 0.7515, Tau = 0.3333, S = 5.0, var(S) = 28.33, slope = 0.0450, intercept = 3.82)
● Corcona Toll Station
The results indicate a statistically significant decreasing trend (τ = −0.867, z = −2.25, p = 0.024 < 0.05), evidencing a systematic reduction in CO column density over the analyzed period. Sen’s slope was −0.367 mol/m² per year, indicating that, on average, CO column density at Corcona decreased by approximately 0.37 mol/m² per year between 2019 and 2024. The estimated intercept (6.66) represents the initial CO value at the beginning of the period.
● Casaracra Toll Station
In this case, no statistically significant trend was detected (p = 0.452 > 0.05), with τ = 0.333 and a Sen’s slope of +0.045 mol/m² per year. This indicates a slight upward tendency that is not statistically significant, suggesting that interannual CO variability at Casaracra does not follow a clearly defined temporal trend over the same period.
3.2. Qualitative Comparison with In Situ Measurements Reported by SENAMHI
In this phase of the study, atmospheric measurement records provided by the National Service of Meteorology and Hydrology of Peru (SENAMHI) corresponding to the year 2019 were used. These data were employed to conduct a qualitative comparison between in situ carbon monoxide (CO) measurements and CO column density values derived from Sentinel-5P satellite observations for the same period and coincident geographic locations.
The values derived from satellite image processing using Google Earth Engine and ArcGIS for the year 2019 are presented in Table 7, while the mean daily CO values reported by SENAMHI for the considered stations are shown in Table 8. In addition, a previous study that used SENAMHI records to analyze atmospheric CO variability in Metropolitan Lima [39] was considered as a reference, with the aim of contextualizing the results obtained.
By comparing the values presented in Table 7 and Table 8, it can be observed that areas exhibiting higher CO column density values derived from Sentinel-5P spatially coincide with those where SENAMHI stations recorded relatively higher surface-level CO concentrations. This correspondence suggests spatial coherence between both data sources, particularly in terms of identifying zones with a higher relative burden of carbon monoxide.
It should be noted that the Sentinel-5P satellite retrieves vertically integrated total CO column density (mol/m²), whereas SENAMHI stations measure surface-level concentrations (µg/m³). Consequently, the comparison conducted in this study does not aim to establish quantitative equivalence nor to directly validate satellite-derived values against surface measurements, but rather to assess the consistency of observed spatial patterns between both sources.
The conversion of satellite CO column densities to surface concentrations would require additional information on CO vertical profiles, planetary boundary layer height, and atmospheric mixing conditions—elements that fall beyond the scope and spatial resolution of the present analysis. Therefore, the evaluation of the satellite-derived CO product was based on a qualitative approach focused on spatial coherence and general compatibility of observed trends, following practices commonly adopted in exploratory remote-sensing–based air quality studies.
3.3. Exploratory Relationship between Vehicular Traffic Flow and CO Column Density
The exploratory statistical analysis assessed the association between vehicular traffic flow recorded at toll stations and the temporal variability of CO column density derived from Sentinel-5P. To reduce the influence of spatial heterogeneity (e.g., local differences in topography and road configuration), analyses were conducted independently for Corcona and Casaracra, and their patterns and contrasts were reported as differentiated results.
The correlation coefficients (Pearson and Spearman) indicate statistically significant co-variability between both variables during the study period. However, these results should be interpreted as long-term average associations integrated over multiple environmental conditions, rather than as evidence of direct causality. In particular, the analysis does not incorporate daily meteorological variables (wind, atmospheric stability, or precipitation) that can modulate CO dispersion and mixing; therefore, the magnitude of the correlations reflects statistical consistency at an aggregated temporal scale but does not allow isolation of short-term mechanisms.
In terms of trends, the Mann–Kendall test was used to evaluate whether a sustained monotonic pattern (increasing or decreasing) was present in the 2019–2024 time series. The results show that the presence or absence of a trend varies between stations, reinforcing the interpretation that the observed CO behavior is influenced by local corridor conditions (including topographic and operational characteristics) and interannual variability, rather than by a uniform structural change along the entire roadway.
4. Discussion
4.1. Comparative Discussion with Similar Studies
The results of the present study reveal differentiated spatial patterns of carbon monoxide (CO) column density along the Lima–Huancayo section of the Central Highway, evidencing regional variability associated with both the configuration of the road corridor and the territorial characteristics of its surroundings. In this sense, the geographical and operational context of the corridor—characterized by segments with physical and environmental complexity—is consistent with documented evidence regarding the Central Highway and its associated issues reported in national and academic sources [16,31]. Given that Sentinel-5P products represent vertically integrated atmospheric content, the identified spatial gradients should be interpreted as regional patterns rather than as direct indicators of local exposure, as discussed in reviews on satellite-based air quality monitoring [13].
The temporal analysis of CO column density during the 2019–2024 period reveals interannual fluctuations and detectable behaviors identified through non-parametric tests, which is consistent with studies that have used Sentinel-5P to analyze seasonal dynamics and multi-year trends of atmospheric pollutants [24], as well as with satellite-based applications during periods of changes in human activity (e.g., during COVID-19), where temporal variations in pollutants at the regional scale have been observed [20]. Consequently, the trends identified in this study should be considered aggregated indicators of regional pollutant behavior within the scope of remote sensing, in agreement with the satellite monitoring literature [13].
The exploratory statistical evaluation showed consistent associations between variability in vehicular traffic flow and CO column density at the analyzed control points. This result is compatible with investigations that employ Sentinel-5P for the spatial analysis of emissions or patterns associated with vehicular activity and transportation at regional scales [19]. In addition, recent evidence exists regarding the use of Sentinel-5P in transportation infrastructure environments (e.g., toll stations) to analyze atmospheric pollutants linked to activity patterns, although not necessarily CO, which supports the methodological relevance of the applied approach in transport corridors [22]. However, the associations observed in the present study should not be interpreted as direct causal relationships, since satellite data represent vertically integrated atmospheric content and short-term meteorological variables were not incorporated in this analysis. Therefore, the obtained coefficients reflect long-term statistical co-variability within the analytical scale employed [13,24].
Conducting separate analyses for the Corcona and Casaracra stations reduced the risk of biased interpretations arising from spatial aggregation of heterogeneous locations within the corridor. In this context, the observed differences between stations reinforce the importance of considering internal spatial heterogeneity and support the interpretation of results as local associations within a broader regional framework, consistent with the use of kilometer-scale satellite products [13,29].
The qualitative comparison with in situ measurements reported by SENAMHI for the year 2019 showed spatial coherence between areas with higher CO column density values derived from Sentinel-5P and those where relatively higher surface-level concentrations were recorded. This comparison is supported by institutional SENAMHI data (databases and bulletins) and a local academic precedent analyzing CO dynamics in East Lima for 2019, allowing contextualization and triangulation of results without aiming for quantitative equivalence [33,39,40]. In line with reviews on satellite-based air quality monitoring, this comparison does not seek to directly validate satellite values against surface measurements, but rather to assess general compatibility of patterns within limitations of scale and vertical representativeness [13].
It should be emphasized that converting column densities to surface concentrations requires additional information (e.g., vertical structure and mixing processes), which exceeds the scope of the present study. This limitation is consistent with the scope and constraints described in reviews on satellite-based air quality and health monitoring, as well as in regional multi-year studies based on Sentinel-5P [13,24].
Finally, the findings are consistent with recent research highlighting the potential of satellite products (including Sentinel-5P) for analyzing regional patterns of atmospheric pollution, particularly in contexts where ground-based monitoring may be limited or discontinuous [13,24]. In the case of the central Andean corridor of Peru, this study contributes exploratory evidence on the regional dynamics of CO, underscoring the usefulness of remote sensing as a complementary tool for preliminary assessments and for guiding future research incorporating meteorological integration and/or atmospheric modeling.
4.2. Study Limitations
Several limitations should be considered when interpreting the results of this study. The spatial resolution of the Sentinel-5P/TROPOMI sensor (~7 km) limits the level of detail achievable at finer spatial scales and may introduce sub-pixel mixing of multiple emission sources along linear infrastructures. In addition, a direct quantitative comparison between satellite-derived carbon monoxide data and ground-based SENAMHI measurements was not feasible due to fundamental differences in the represented physical quantities—namely atmospheric column densities (mol/m²) versus near-surface concentrations (µg/m³). Consequently, the validation approach was based on spatial coherence and statistical association rather than direct unit-based comparison.
Moreover, the use of annually aggregated vehicular traffic flow data reduces temporal resolution when evaluating short-term relationships between traffic dynamics and satellite observations. These methodological aspects are discussed in greater detail in the following section.
4.3. Limitations Related to Spatial Resolution and Temporal Aggregation
● Spatial resolution constraints of TROPOMI data
Although the Sentinel-5P/TROPOMI instrument provides valuable regional-scale information on atmospheric CO, its spatial resolution (~7 × 7 km² during the study period) imposes inherent limitations on the interpretation of pollution patterns along linear infrastructures such as highways. Each satellite pixel integrates emissions from multiple sources within its footprint, including vehicular traffic, urban activities, industrial facilities, and natural background contributions.
Therefore, the identified “hotspots” should not be interpreted as precise locations of maximum emissions along specific road segments, but rather as zones of elevated average concentrations where traffic-related emissions coexist with other contributing factors. This sub-pixel mixing effect is particularly relevant in topographically complex environments such as the Central Andes, where atmospheric dispersion and valley channeling processes further influence pollutant accumulation.
Despite these limitations, the consistent spatial alignment between elevated CO values and segments of intense vehicular activity supports the use of TROPOMI data as an effective tool for identifying regional pollution patterns and priority areas for environmental management, rather than for fine-scale source attribution.
● Temporal aggregation of traffic data and its implications
Another limitation of this study relates to the temporal resolution of vehicular traffic data. Traffic information was obtained from annual performance reports, which represent aggregated averages and do not capture short-term fluctuations associated with daily traffic cycles, seasonal variability, or episodic congestion events. In contrast, satellite-derived CO observations reflect atmospheric conditions influenced by both short-term emissions and meteorological variability.
As a result, the observed correlations between vehicular traffic flow and CO column density should be interpreted as indicative of long-term structural relationships rather than direct temporal synchrony. Although this aggregation may attenuate correlation strength at finer temporal scales, the statistically significant associations obtained suggest that average traffic intensity remains a dominant factor in CO variability along the Central Highway. Future studies incorporating higher-resolution traffic datasets could further refine temporal coupling between emissions and atmospheric observations.
4.4. Contributions of the Study
This work provides original and methodologically sound evidence on the use of satellite data for monitoring atmospheric pollutants along Peruvian roadways. Its main contributions include:
● A pioneering application of Sentinel-5P satellite data and the Google Earth Engine platform to analyze transport-related CO pollution along the Central Highway.
● Practical validation of remote sensing as a complementary tool to ground-based monitoring, particularly useful in areas with limited measurement infrastructure.
● Integration of statistical techniques (Pearson, Spearman, Mann–Kendall) that strengthen the quantitative interpretation of relationships between traffic and air quality.
● A replicable methodological framework for future environmental assessments of road infrastructure and for incorporating satellite-based indicators into environmental management and mitigation processes.
5. Conclusions
This study analyzed the spatiotemporal variability of carbon monoxide (CO) column density along the Lima–Huancayo section of the Central Highway during the 2019–2024 period, using satellite data from the TROPOMI instrument aboard Sentinel-5P and official vehicular traffic flow records. Through a remote-sensing-based approach and exploratory statistical analysis, regional CO distribution patterns and their co-variability with vehicular activity were identified, while explicitly considering limitations inherent to the scale and nature of the employed data.
Regarding spatial characterization, the results show regional gradients in CO column density along the road corridor, with differences between sectors that coincide with areas of higher traffic intensity and complex topographic configurations. These patterns should be interpreted as regionally integrated variations, consistent with previous studies that use satellite products to analyze atmospheric pollutants in mountainous regions, rather than as direct representations of surface concentrations or local exposure.
The temporal analysis allowed the detection of interannual fluctuations and statistically identifiable trends in the CO series, suggesting non-uniform pollutant behavior over the study period. These trends reflect aggregated variability of the regional atmospheric system and are consistent with the literature highlighting the combined influence of structural factors and environmental conditions not explicitly controlled in remote-sensing-based studies.
With respect to the relationship between vehicular traffic and CO, exploratory statistical analyses revealed consistent associations between traffic flow variability and CO column density at the analyzed control points. However, these associations are interpreted as long-term structural co-variability rather than evidence of direct causality, since satellite data represent vertically integrated atmospheric content and do not incorporate short-term meteorological variables that modulate pollutant dispersion and mixing.
The qualitative comparison with in situ measurements reported by SENAMHI for 2019 showed spatial coherence between areas with higher CO column density values and those with relatively higher surface-level concentrations. This consistency supports the use of Sentinel-5P products for exploratory analysis of regional CO patterns, although it does not constitute direct quantitative validation due to fundamental differences in units, scale, and vertical representativeness between the two data sources.
Overall, the study demonstrates the potential of satellite remote sensing as a complementary tool for exploratory assessment of regional CO dynamics in transport corridors located in topographically complex environments, such as the central Andean region of Peru. The identified limitations—particularly the absence of explicit meteorological variables and the spatial resolution of the sensor—define the scope of the results and underscore the need for future research integrating detailed meteorological information and dispersion models to further elucidate the physical mechanisms underlying the observed associations.
Declaration of AI Use
ChatGPT was used to improve the wording and coherence of the manuscript.
References
- Chibueze, C.; Afangideh, C.B.; Nnaji, C.C. La amenaza y mitigación de la contaminación del aire en el entorno construido: una revisión [The threat and mitigation of air pollution in the built environment: A review]. Nigerian Journal of Technology 2023, 42, 12–29. [Google Scholar] [CrossRef]
- Manisalidis, E.; Stavropoulou, E.; Stavropoulos, A.; Bezirtzoglou, E. Impactos medioambientales y en salud de la contaminación atmosférica: una revisión [Environmental and health impacts of air pollution: A review]. Frontiers in Public Health 2020, 8, 14. [Google Scholar] [CrossRef]
- Gładyszewska-Fiedoruk, K.; Wiater, J. Calidad del aire interior con especial referencia al monóxido de carbono en la habitación – Un estudio piloto [Indoor air quality with special reference to carbon monoxide in a room—A pilot study]. Journal of Ecological Engineering 2022, 23, 286–293. [Google Scholar] [CrossRef]
- Li, B.; Xiong, J.; Liu, H.-X.; Li, D.; Chen, G. Diablo o ángel: dos roles del monóxido de carbono en el ictus [Devil or angel: Two roles of carbon monoxide in stroke]. Medical Gas Research 2022, 12, 125–130. [Google Scholar] [CrossRef]
- Huertas, J.I.; Mogro, A.E.; Mendoza, A.; Huertas, M.E.; Ibarra, R. Evaluación de la reducción de emisiones de vehículos mediante la implementación de programas de inspección y mantenimiento [Assessment of vehicle emission reduction through inspection and maintenance programs]. International Journal of Environmental Research and Public Health 2020, 17, 4730. [Google Scholar] [CrossRef]
- Altshuler, S.L.; Ayala, A.; Collet, S.; Chow, J.C.; Frey, H.C.; Shaikh, R.; Stevenson, E.D.; Walsh, M.P.; Watson, J.G. Tendencias en transporte por carretera, energía y emisiones [Trends in on-road transportation, energy, and emissions]. Journal of the Air & Waste Management Association 2018, 68, 1015–1024. [Google Scholar] [CrossRef]
- Cristiano, S. El “precio” del tiempo ahorrado, la ilusión de combustible ahorrado: evaluación del ciclo de vida de una gran expansión de autopista [The “price” of time saved, the illusion of fuel saved]. Journal of Cleaner Production 2022, 344, 131087. [Google Scholar] [CrossRef]
- Fonseca, J.P.S. Congestión vehicular y contaminación ambiental en Lima Metropolitana [Vehicular congestion and environmental pollution in Metropolitan Lima]. Revista Lasallista de Investigación 2022, 19, 152–164. [Google Scholar] [CrossRef]
- Moretti-Villegas, L. F.; Tafur-Anzualdo, V. I.; Valiente-Saldaña, Y. M. Contaminación del aire en la ciudad de Lima, Perú [Air pollution in the city of Lima, Peru]. Revista Arbitrada Interdisciplinaria Koinonía 2023, vol. 8(no. 2), 822–830. [Google Scholar] [CrossRef]
- Tello, Z.; Cabrera, C.; Moore, R. Tendencias y escenarios de la contaminación del aire por origen automotriz en Lima Metropolitana [Trends and scenarios of air pollution from automotive sources in Metropolitan Lima]. Rev. Inst. Investig. Fac. Minas Metal. Cienc. Geogr. 2021, 24, 211–219. [Google Scholar] [CrossRef]
- Poblete, M.M.; Huaman, E.T.; Ibarra, E.; Mendoza, D.L.; Monge-Rodríguez, F.S.; Horna, D. Contaminación del aire en dos distritos de la ciudad de Cusco: un estudio interdisciplinar basado en el monitoreo ambiental y la percepción del riesgo social [Air pollution in two districts of Cusco city]. Atmosphere 2025, 16, 770. [Google Scholar] [CrossRef]
- Yauri, R.; Loayza, B.; Yauri, A.; Aquino, A. Sistema de monitorización de la calidad del aire basado en tecnología de red de área amplia de bajo consumo en paradas de transporte público [Air quality monitoring system based on LPWAN technology]. International Journal of Reconfigurable Embedded Systems 2024, 13, 699–707. [Google Scholar] [CrossRef]
- Holloway, T.; Miller, D.; Anenberg, S.; Diao, M.; Duncan, B.; Fiore, A.M.; Henze, D.K.; Hess, J.; Kinney, P.L.; Liu, Y.; et al. Monitorización satelital para la calidad del aire y la salud [Satellite monitoring for air quality and health]. Annual Review of Biomedical Data Science 2021, 4, 417–447. [Google Scholar] [CrossRef] [PubMed]
- Perilla, G.A.; Mas, J.-F. Google Earth Engine (GEE): una poderosa herramienta que vincula el potencial de los datos masivos y la eficacia del procesamiento en la nube [Google Earth Engine (GEE): A powerful tool linking big data and cloud processing]. Investigaciones Geográficas 2020, 101, e59929. [Google Scholar] [CrossRef]
- Gorelick, N.; Hancher, M.; Dixon, M.; Ilyushchenko, S.; Thau, D.; Moore, R. Google Earth Engine: Análisis geoespacial a escala planetaria para todos [Planetary-scale geospatial analysis for everyone]. Remote Sensing of Environment 2017, 202, 18–27. [Google Scholar] [CrossRef]
- Mendieta Gómez, N.; Suito Rivero, A.K. Problemática de la carretera central [Central Highway issues]. Master’s Thesis, Universidad de Piura, Piura, Perú, 2017. Available online: https://hdl.handle.net/11042/3586.
- Ministerio de Transportes y Comunicaciones (MTC). Reporte sobre vía alterna a la Carretera Central v5 — Neutro [Report on alternative route to the Central Highway v5—Neutral]. Lima, Perú, 2023. Available online: https://portal.mtc.gob.pe/transportes/terrestre/documentos/REPORTE%20SOBRE%20V%C3%8DA%20ALTERNA%20A%20LA%20CARRETERA%20CENTRAL%20v5%20-%20NEUTRO.pdf.
- Machacuay Rojas, M.K. Influencia de la carga vehicular en el diseño del pavimento flexible, Carretera Central – Huancayo [Influence of vehicular load on flexible pavement design]. Tesis de Ingeniería Civil, Universidad Peruana Los Andes: Huancayo, Perú, 2019. Available online: https://hdl.handle.net/20.500.12848/1276.
- Metran, B.M.; Elumba, J.P.; Alvarado, M.; Bermoy, M. Mapeo y estimación de emisiones de tráfico por carretera en la región de Caraga usando imágenes satelitales Sentinel-5P [Road traffic emission mapping using Sentinel-5P]. Proc. Int. Exch. Innov. Conf. Eng. Sci. 2023, 9, 6–12. [Google Scholar] [CrossRef]
- Akbar, M.O.; Malik, H.; Hassan, F.; Khan, M.S.S. Análisis sobre contaminantes atmosféricos en el confinamiento por COVID-19 usando imágenes satelitales: un estudio sobre Pakistán [Analysis of atmospheric pollutants during COVID-19 lockdown]. International Journal of Design & Nature and Ecodynamics 2022, 17, 47–54. [Google Scholar] [CrossRef]
- Cao, H.; Henze, D.K.; Cady-Pereira, K.; McDonald, B.C.; Harkins, C.; Sun, K.; Bowman, K.W.; Fu, T.-M.; Nawaz, M.O. Los confinamientos por COVID-19 ofrecen la primera confirmación por satélite de que los vehículos son una fuente poco reconocida de contaminación urbana NH₃ [COVID-19 lockdowns provide first satellite confirmation]. Environmental Science & Technology Letters 2022, 9, 3–9. [Google Scholar] [CrossRef]
- Xu, S.; Yang, X. Análisis de la concentración de dióxido de nitrógeno en estaciones de peaje en carreteras basado en fsQCA — Datos obtenidos de Sentinel-5P [NO₂ concentration analysis at highway toll stations]. Atmosphere 2025, 16, 517. [Google Scholar] [CrossRef]
- Yilgan, F.; Yildiz, N.; Dogan, T. Evaluación de los impactos ambientales del incendio forestal de Capilla del Monte en el Valle de Punilla, Argentina, utilizando Landsat-9 y Sentinel-5P [Environmental impact assessment of forest fire]. Environmental Monitoring and Assessment 2025, 197, 939. Available online: https://link.springer.com/article/10.1007/s10661-025-14374-y. [CrossRef]
- Mohamed, H.; Hassan, A.; Elhag, A. Un estudio de cinco años utilizando datos Sentinel-5P que observan dinámicas estacionales y tendencias a largo plazo de contaminantes atmosféricos [Five-year Sentinel-5P study]. International Journal of Engineering Geosciences 2025, 10, 262–271. [Google Scholar] [CrossRef]
- Kinoshita, H.; Türkan, H.; Vucinic, S.; Naqvi, S.; Bedair, R.; Rezaee, R.; Tsatsakis, A. Intoxicación por monóxido de carbono [Carbon monoxide poisoning]. Toxicology Reports 2020, 7, 169–173. [Google Scholar] [CrossRef] [PubMed]
- Yang, C.-H.; Chen, P.; Wu, C.; Yang, C.; Chuang, L. Análisis de contaminación atmosférica basado en aprendizaje profundo sobre monóxido de carbono en Taiwán [Deep learning-based CO analysis]. Ecological Informatics 2024, 80, 102477. [Google Scholar] [CrossRef]
- Cachola, C.S.; Andrade, A.C.A.C.; Lopes, L.S.; Santos, E.M.; Peyerl, D. O papel das políticas públicas na redução das emissões veiculares de gases de efeito estufa no estado de São Paulo [Role of public policies in reducing vehicular emissions]. Desenvolvimento e Meio Ambiente 2022, 59, 418–437. [Google Scholar] [CrossRef]
- Zhang, Y.; Yan, S.; Zhu, Y. Propiedades de adsorción de SnS₂ y MoTe₂ dopados en racimo Ptₙ (n = 1–3) hacia las emisiones de vehículos: CO, CO₂ y NO [Adsorption properties toward vehicle emissions]. ACS Omega 2023, 8, 29746–29757. [Google Scholar] [CrossRef]
- Carbone, A.; Restaino, R.; Vivone, G.; Chanussot, J. Superresolución basada en modelos para datos Sentinel-5P [Model-based super-resolution for Sentinel-5P]. IEEE Transactions on Geoscience and Remote Sensing 2024, 62, 1–16. [Google Scholar] [CrossRef]
- Google Developers. Empieza con Earth Engine [Getting started with Earth Engine]. 2023. Available online: https://developers.google.com/earth-engine/guides/getstarted?hl=es-419.
- Ministerio de Transportes y Comunicaciones (MTC). Marco de Gestión Ambiental y Social – Programa de Infraestructura Vial para la Competitividad Regional (PROREGIÓN 2) – PE-L1279 [Environmental and Social Management Framework]. Lima, Perú, 2023. Available online: https://www.proviasdes.gob.pe/PROREGION2/archivos/mgas/PE-L1279-MGAS.pdf.
- Carmona Arteaga, A. Código en Google Earth Engine Raster de gases contaminantes [Google Earth Engine code for pollutant gas rasters]. 2023. Available online: https://code.earthengine.google.com/951deabf36e2226aa37a5fadb88b3a4d.
- Servicio Nacional de Meteorología e Hidrología del Perú (SENAMHI). Base de datos de concentraciones de monóxido de carbono (CO) – Región Lima Este [Carbon monoxide concentration database]. Lima, Perú, 2021. Available online: https://drive.google.com/file/d/1pgSePWzliHa81m7CFDBB4-5dhp_ejMux/view.
- Organismo Supervisor de la Inversión en Infraestructura de Transporte de Uso Público (OSITRAN). Informe de desempeño 2020: Concesión del IIRSA Centro – Tramo 2 [Performance report 2020]. Lima, Perú, 2021. Available online: https://www.ositran.gob.pe/anterior/wp-content/uploads/2021/07/id-2020-iirsa-centro-t2.pdf.
- OSITRAN. Informe de desempeño 2021: Concesión del IIRSA Centro – Tramo 2 [Performance report 2021]. Lima, Perú, 2022. Available online: https://www.ositran.gob.pe/anterior/wp-content/uploads/2020/07/id-iirsa-centro-t2-2021.pdf.
- OSITRAN. Informe de desempeño 2022: Concesión del IIRSA Centro – Tramo 2 [Performance report 2022]. Lima, Perú, 2023. Available online: https://www.ositran.gob.pe/anterior/wp-content/uploads/2023/07/id-iirsa-centro-t2-2022.pdf.
- OSITRAN. Informe de desempeño 2023: Concesión del IIRSA Centro – Tramo 2 [Performance report 2023]. Lima, Perú, 2024. Available online: https://www.ositran.gob.pe/anterior/wp-content/uploads/2024/07/id-iirsa-centro-t2-2023.pdf.
- OSITRAN. Informe de desempeño 2024: Concesión IIRSA Centro – Tramo 2 [Performance report 2024]. Lima, Perú, 2025. Available online: https://www.ositran.gob.pe/anterior/wp-content/uploads/2025/07/id-2024-iirsa-centro-tramo-2.pdf.
- Pando Huerta, D.L. Evaluación e interpretación de la dinámica del monóxido de carbono en el aire de Lima Este 2019 [Evaluation of carbon monoxide dynamics]. Tesis de Ingeniería Ambiental; Universidad Continental: Huancayo, Perú, 2021. Available online: https://hdl.handle.net/20.500.12394/10050.
- Servicio Nacional de Meteorología e Hidrología del Perú (SENAMHI). Boletín mensual Vigilancia de la calidad del aire – Lima Metropolitana y Callao, marzo 2019 [Monthly air quality surveillance bulletin]. Lima, Perú, 2019. Available online: https://www.senamhi.gob.pe/load/file/03201SENA-70.pdf.
Figure 1.
Elevation map of the provinces of Lima, Huarochirí, and Yauli, showing the altitudinal range of the study area along the Central Highway of Peru.
Figure 1.
Elevation map of the provinces of Lima, Huarochirí, and Yauli, showing the altitudinal range of the study area along the Central Highway of Peru.
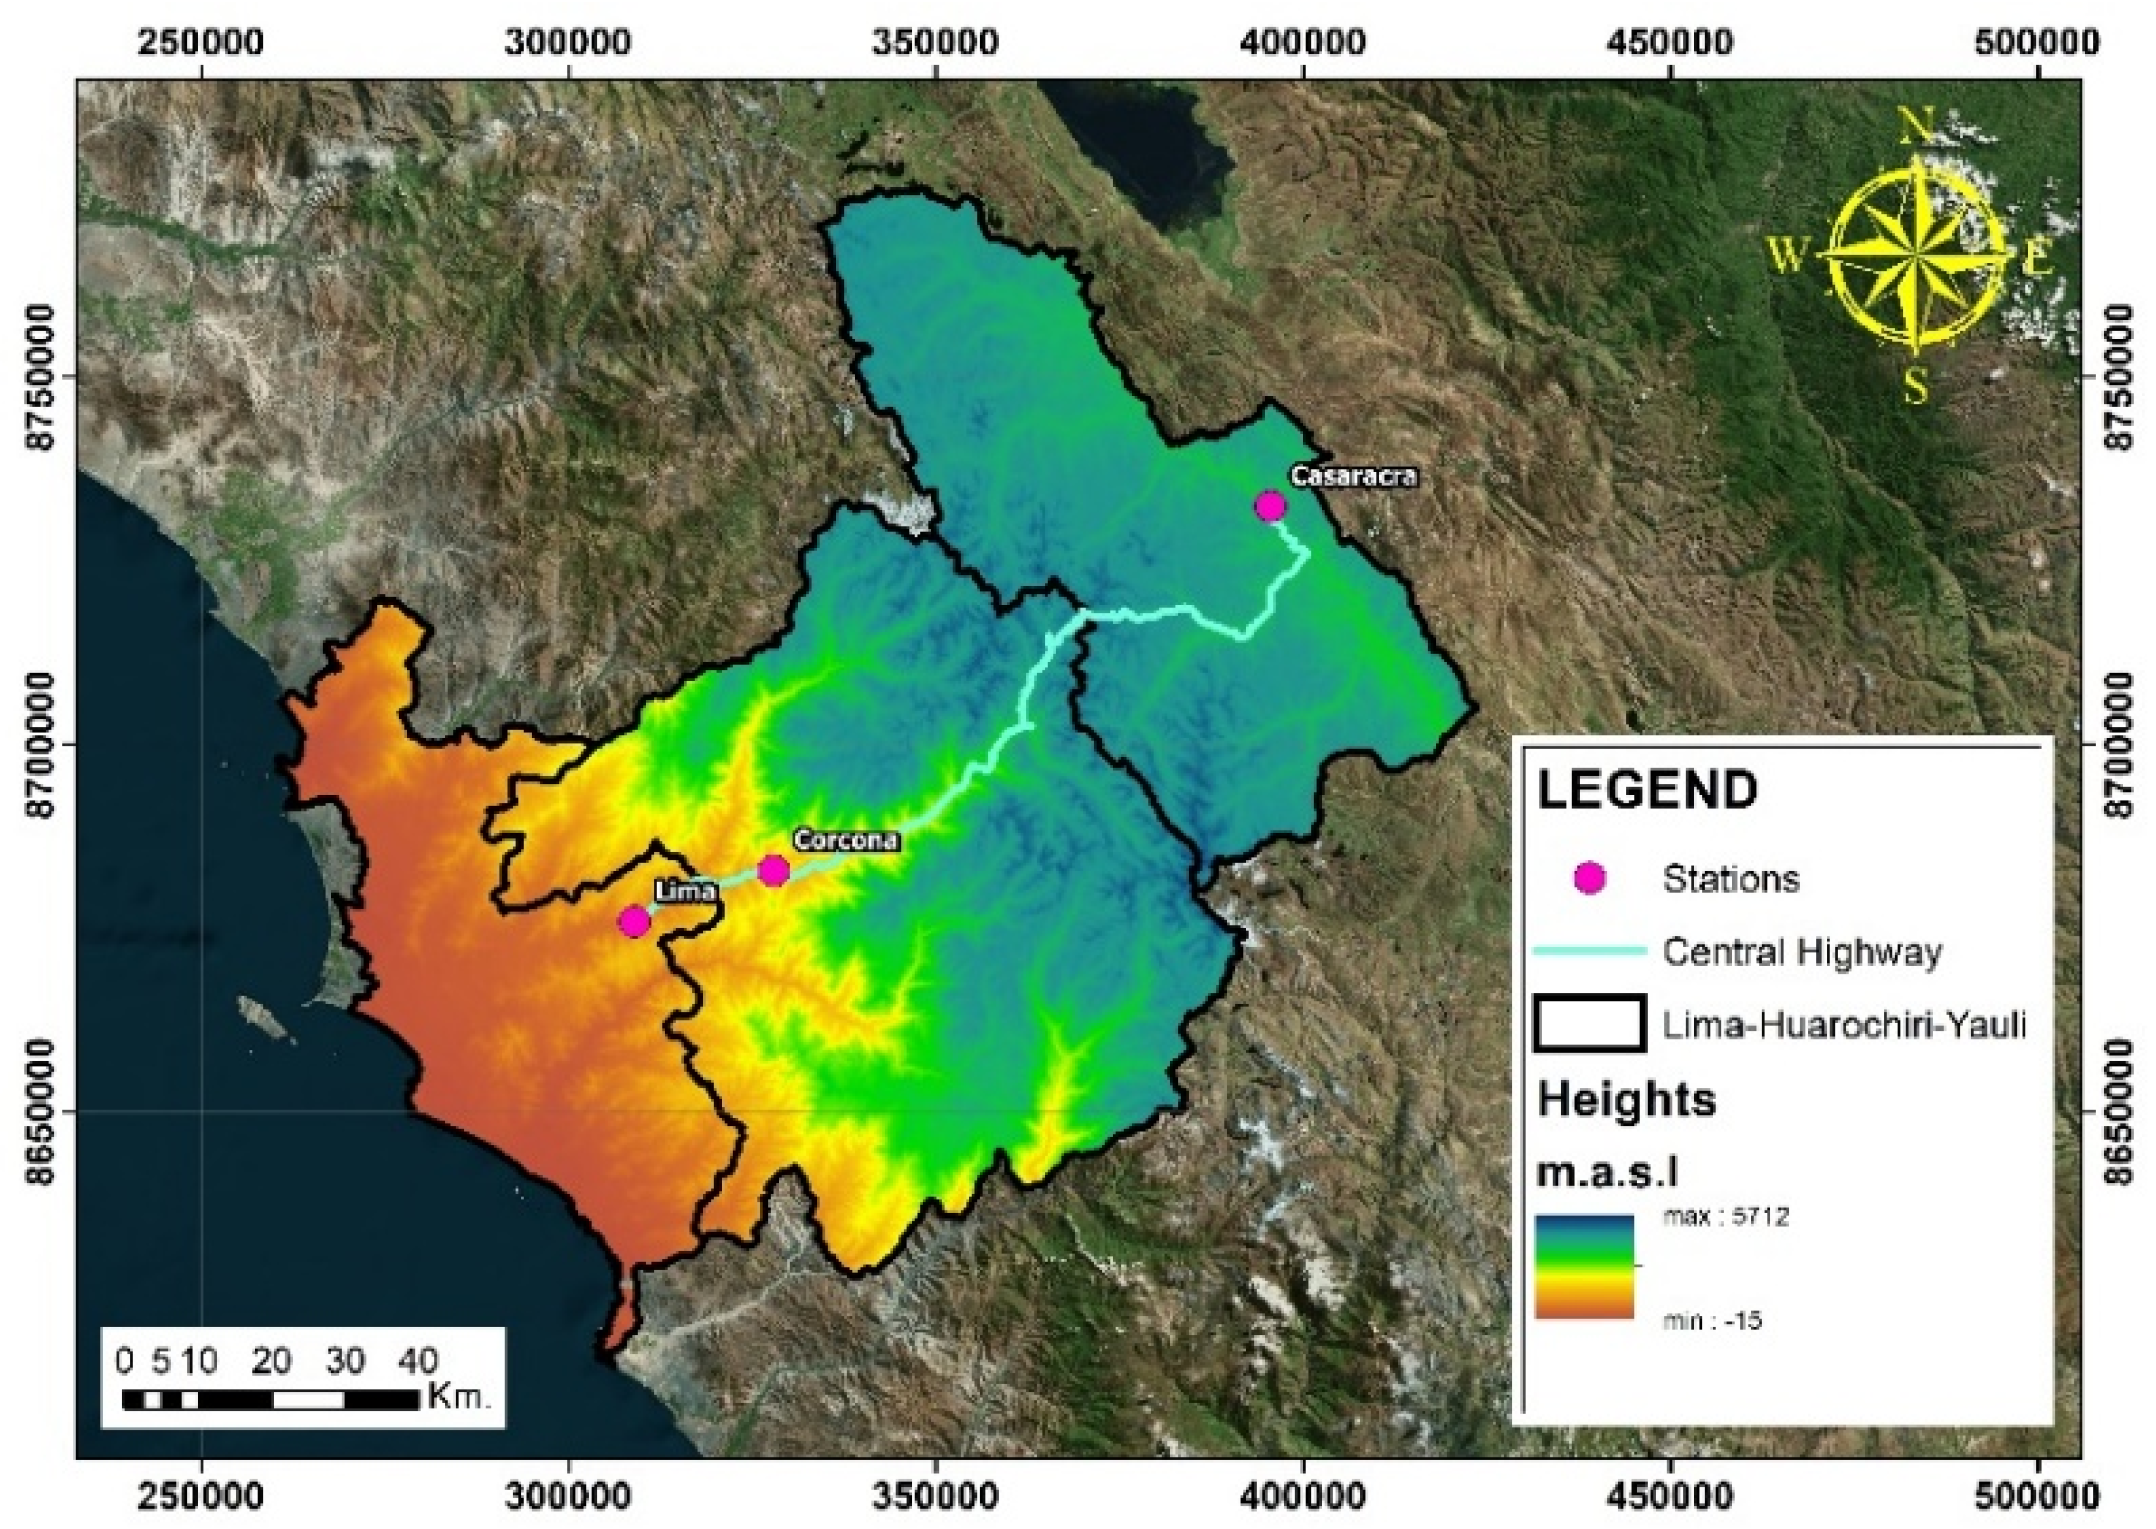
Figure 2.
Spatial distribution of carbon monoxide (CO) column density overlaid on elevation along the Central Highway of Peru.
Figure 2.
Spatial distribution of carbon monoxide (CO) column density overlaid on elevation along the Central Highway of Peru.
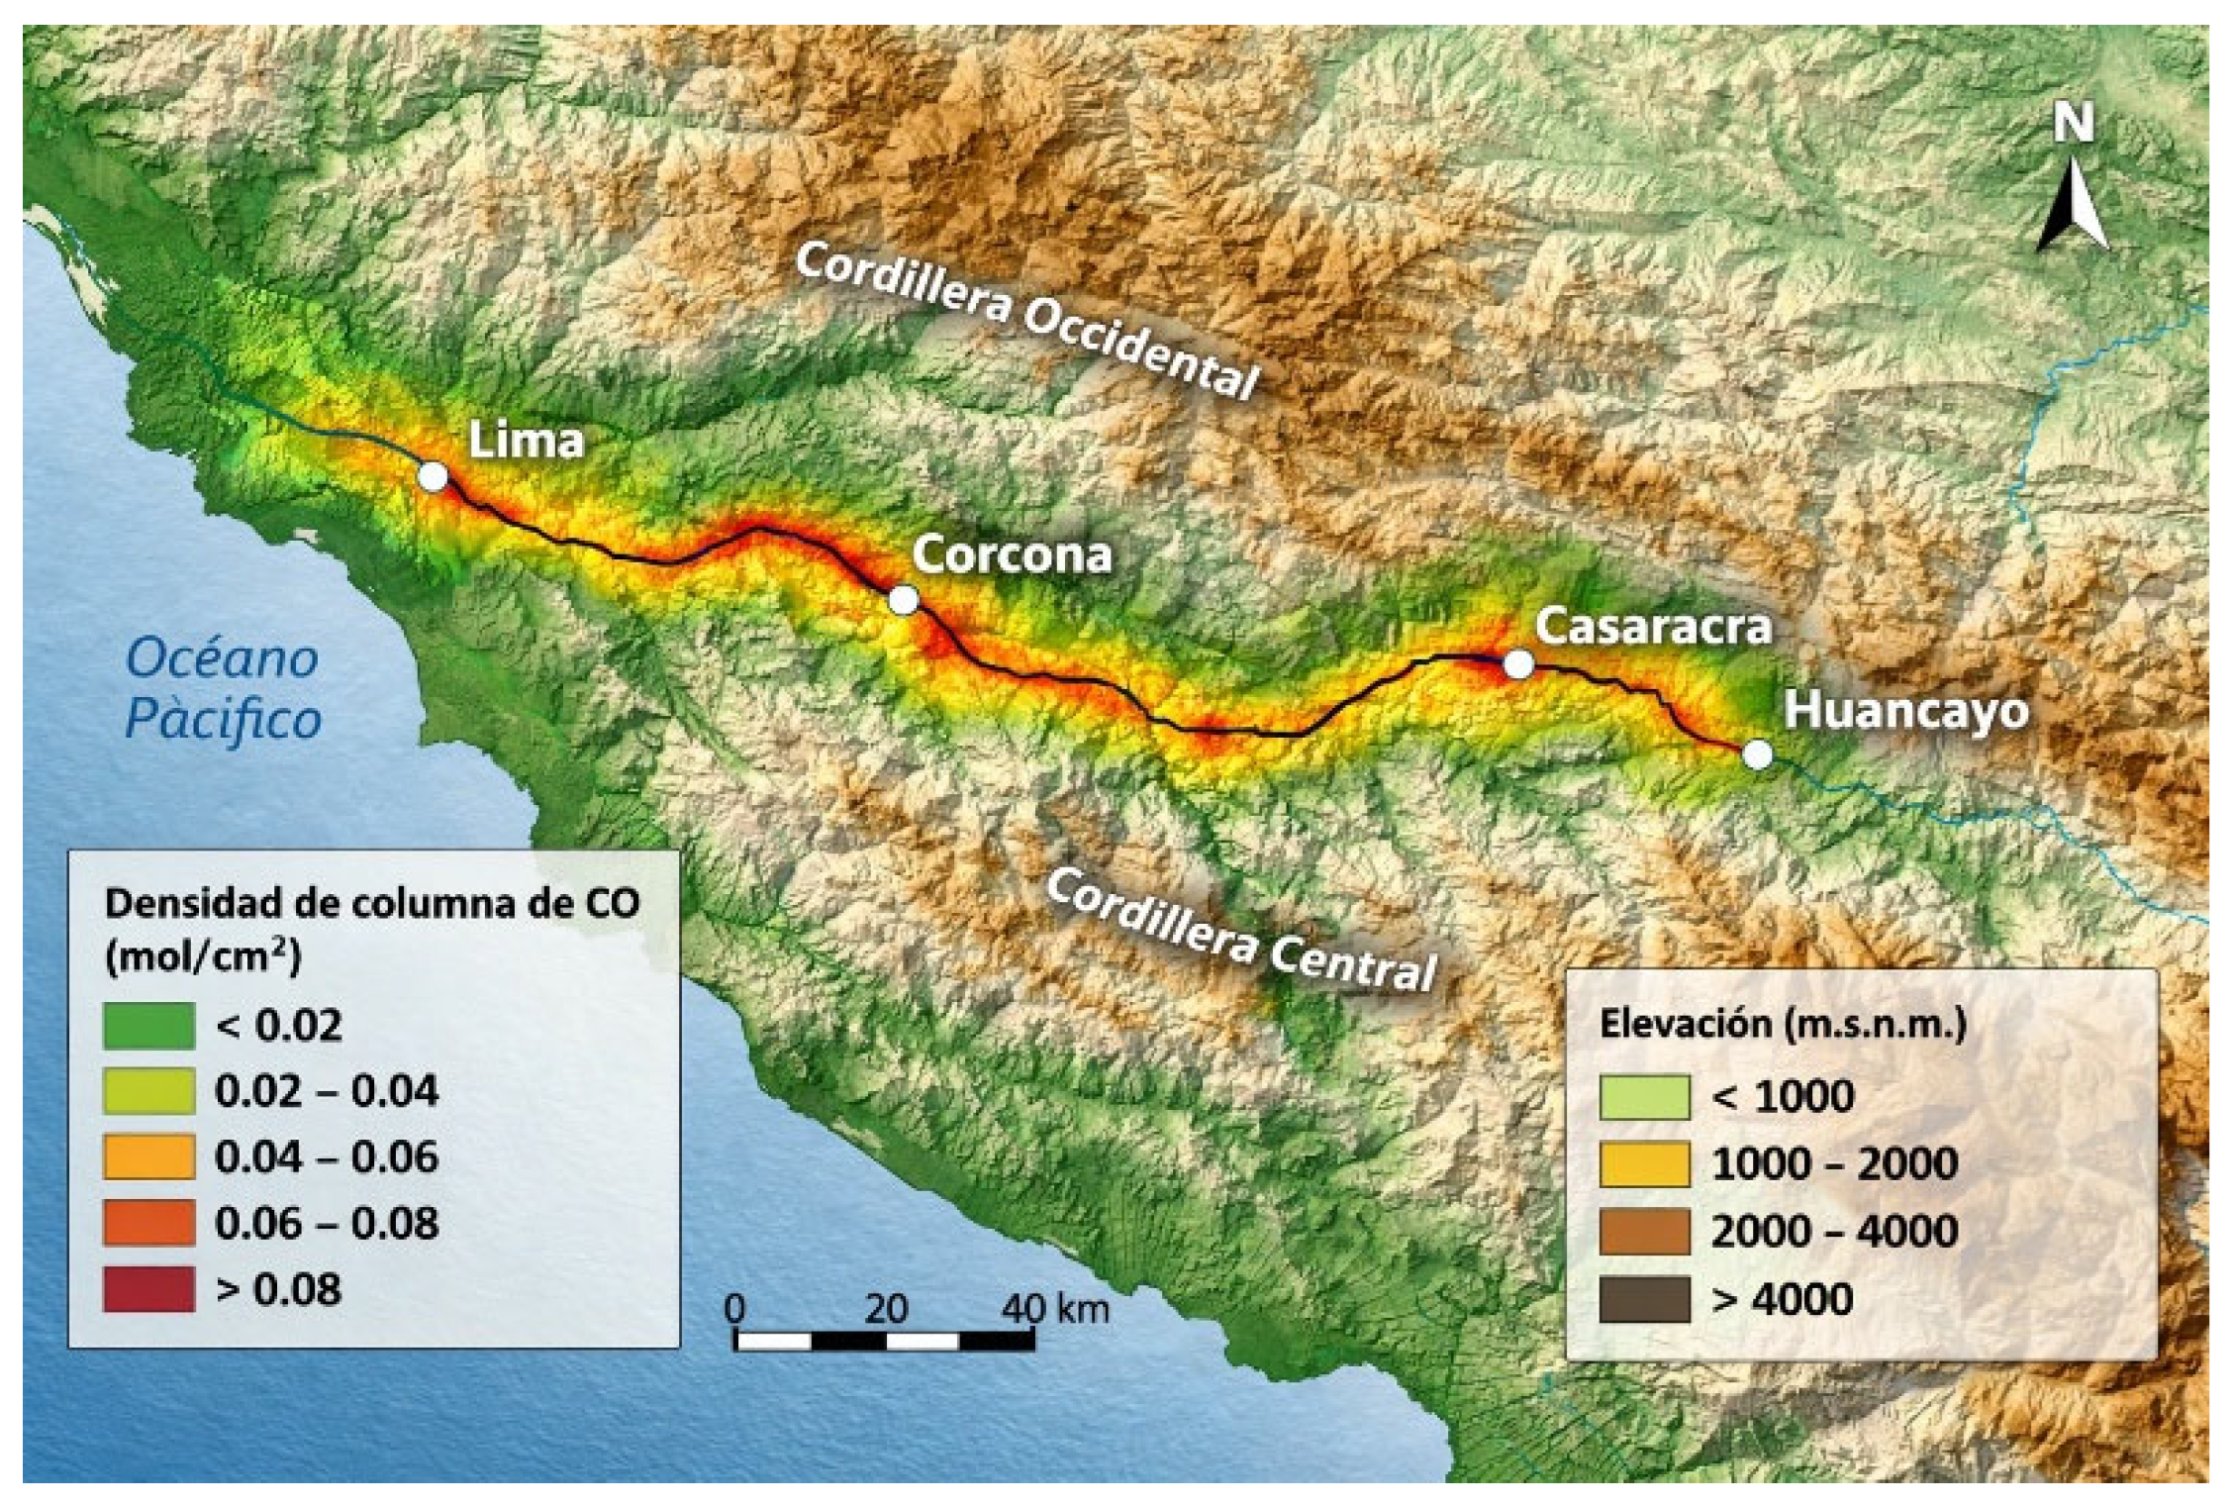
Figure 3.
Flowchart of the GEE data extraction procedure.
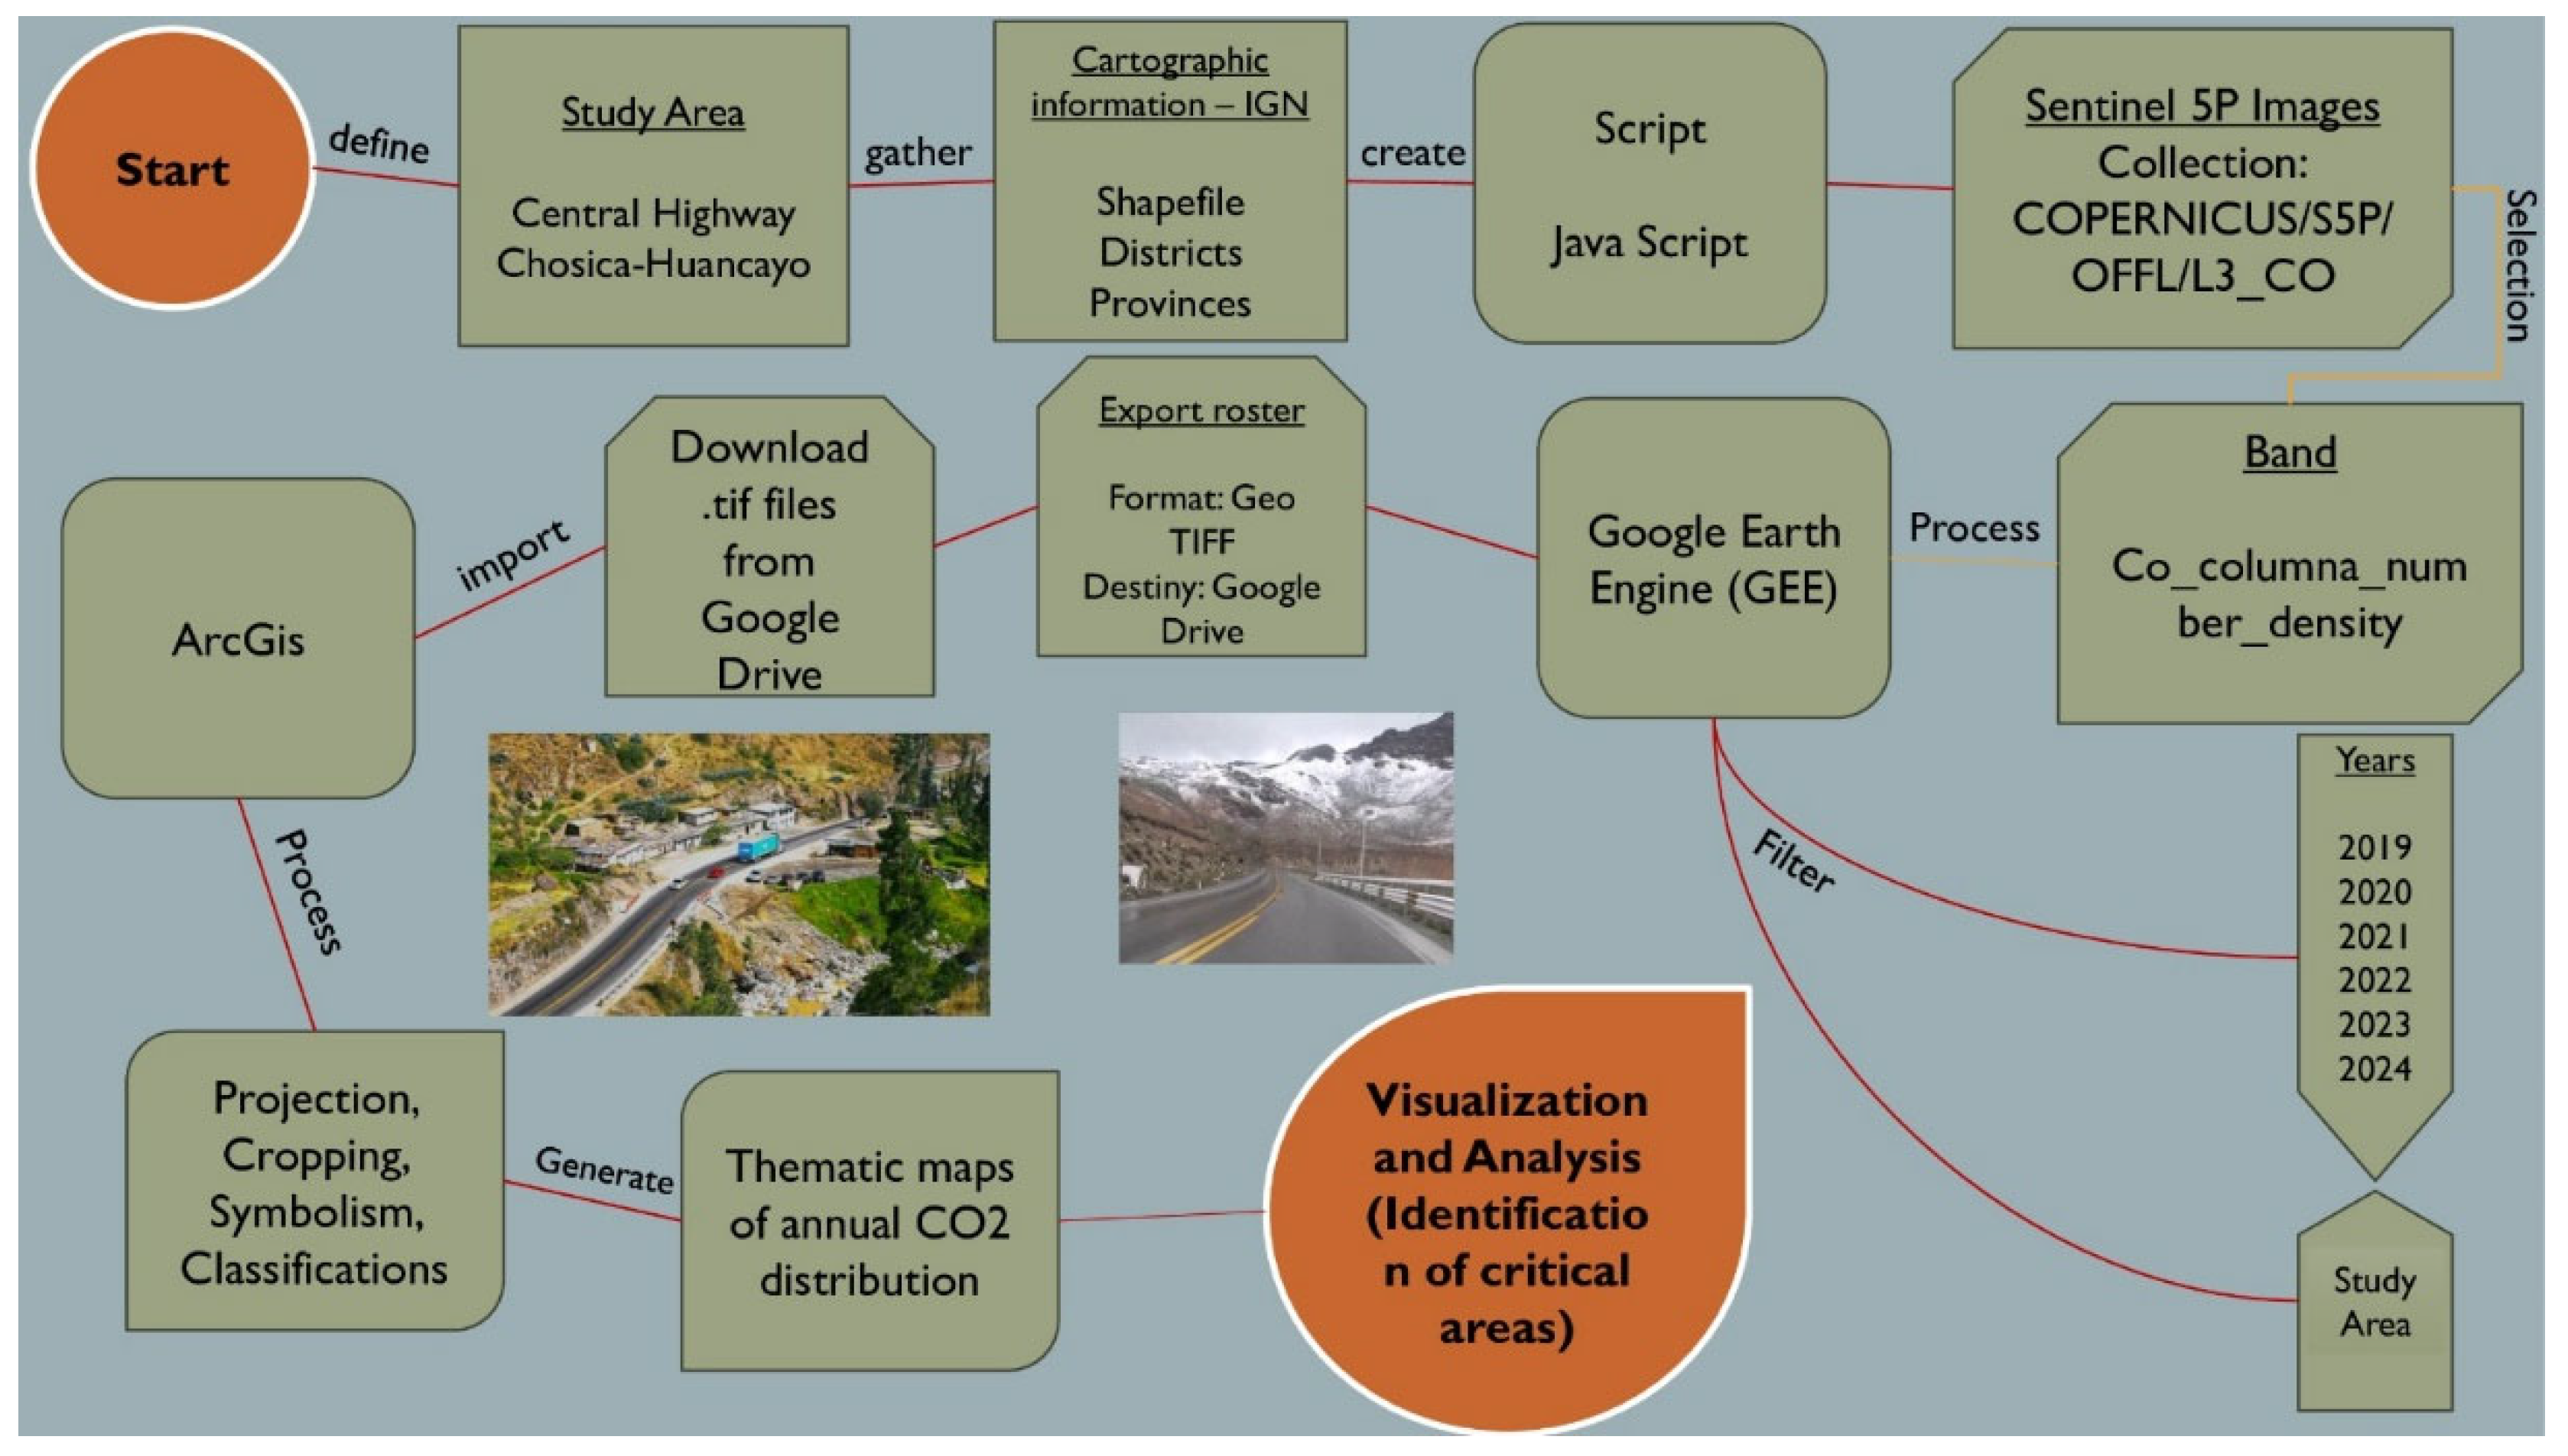
Figure 4.
(a) CO distribution map for 2019; (b) CO distribution map for 2020; (c) CO distribution map for 2021; (d) CO distribution map for 2022; (e) CO distribution map for 2023; (f) CO distribution map for 2024.
Figure 4.
(a) CO distribution map for 2019; (b) CO distribution map for 2020; (c) CO distribution map for 2021; (d) CO distribution map for 2022; (e) CO distribution map for 2023; (f) CO distribution map for 2024.
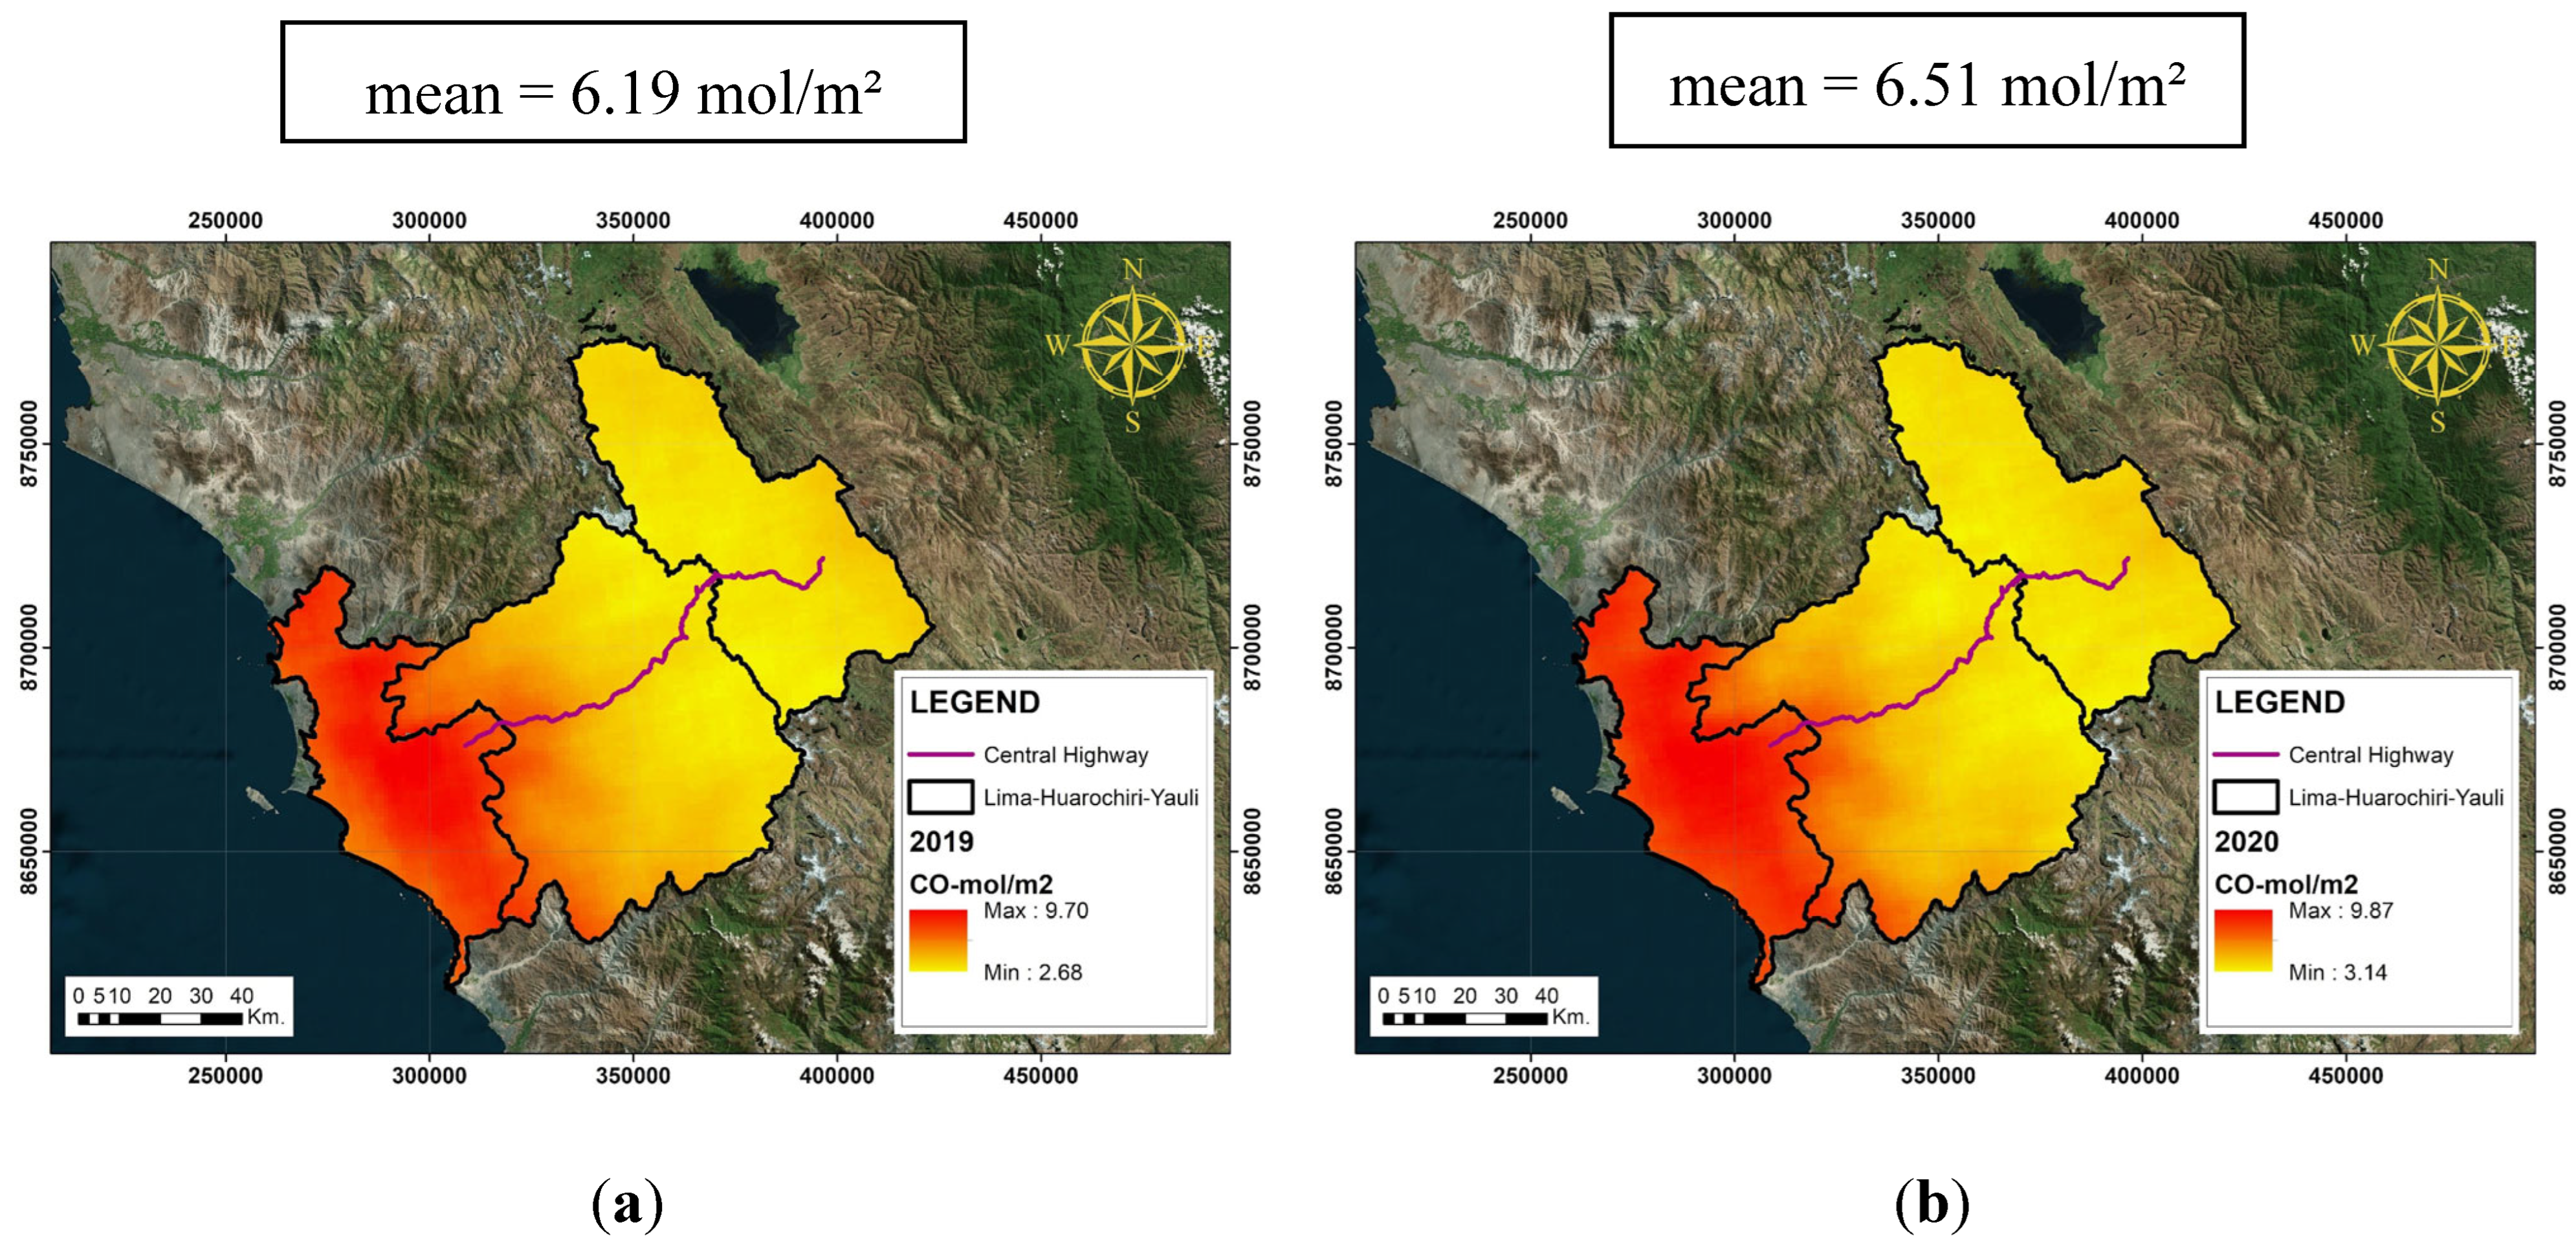
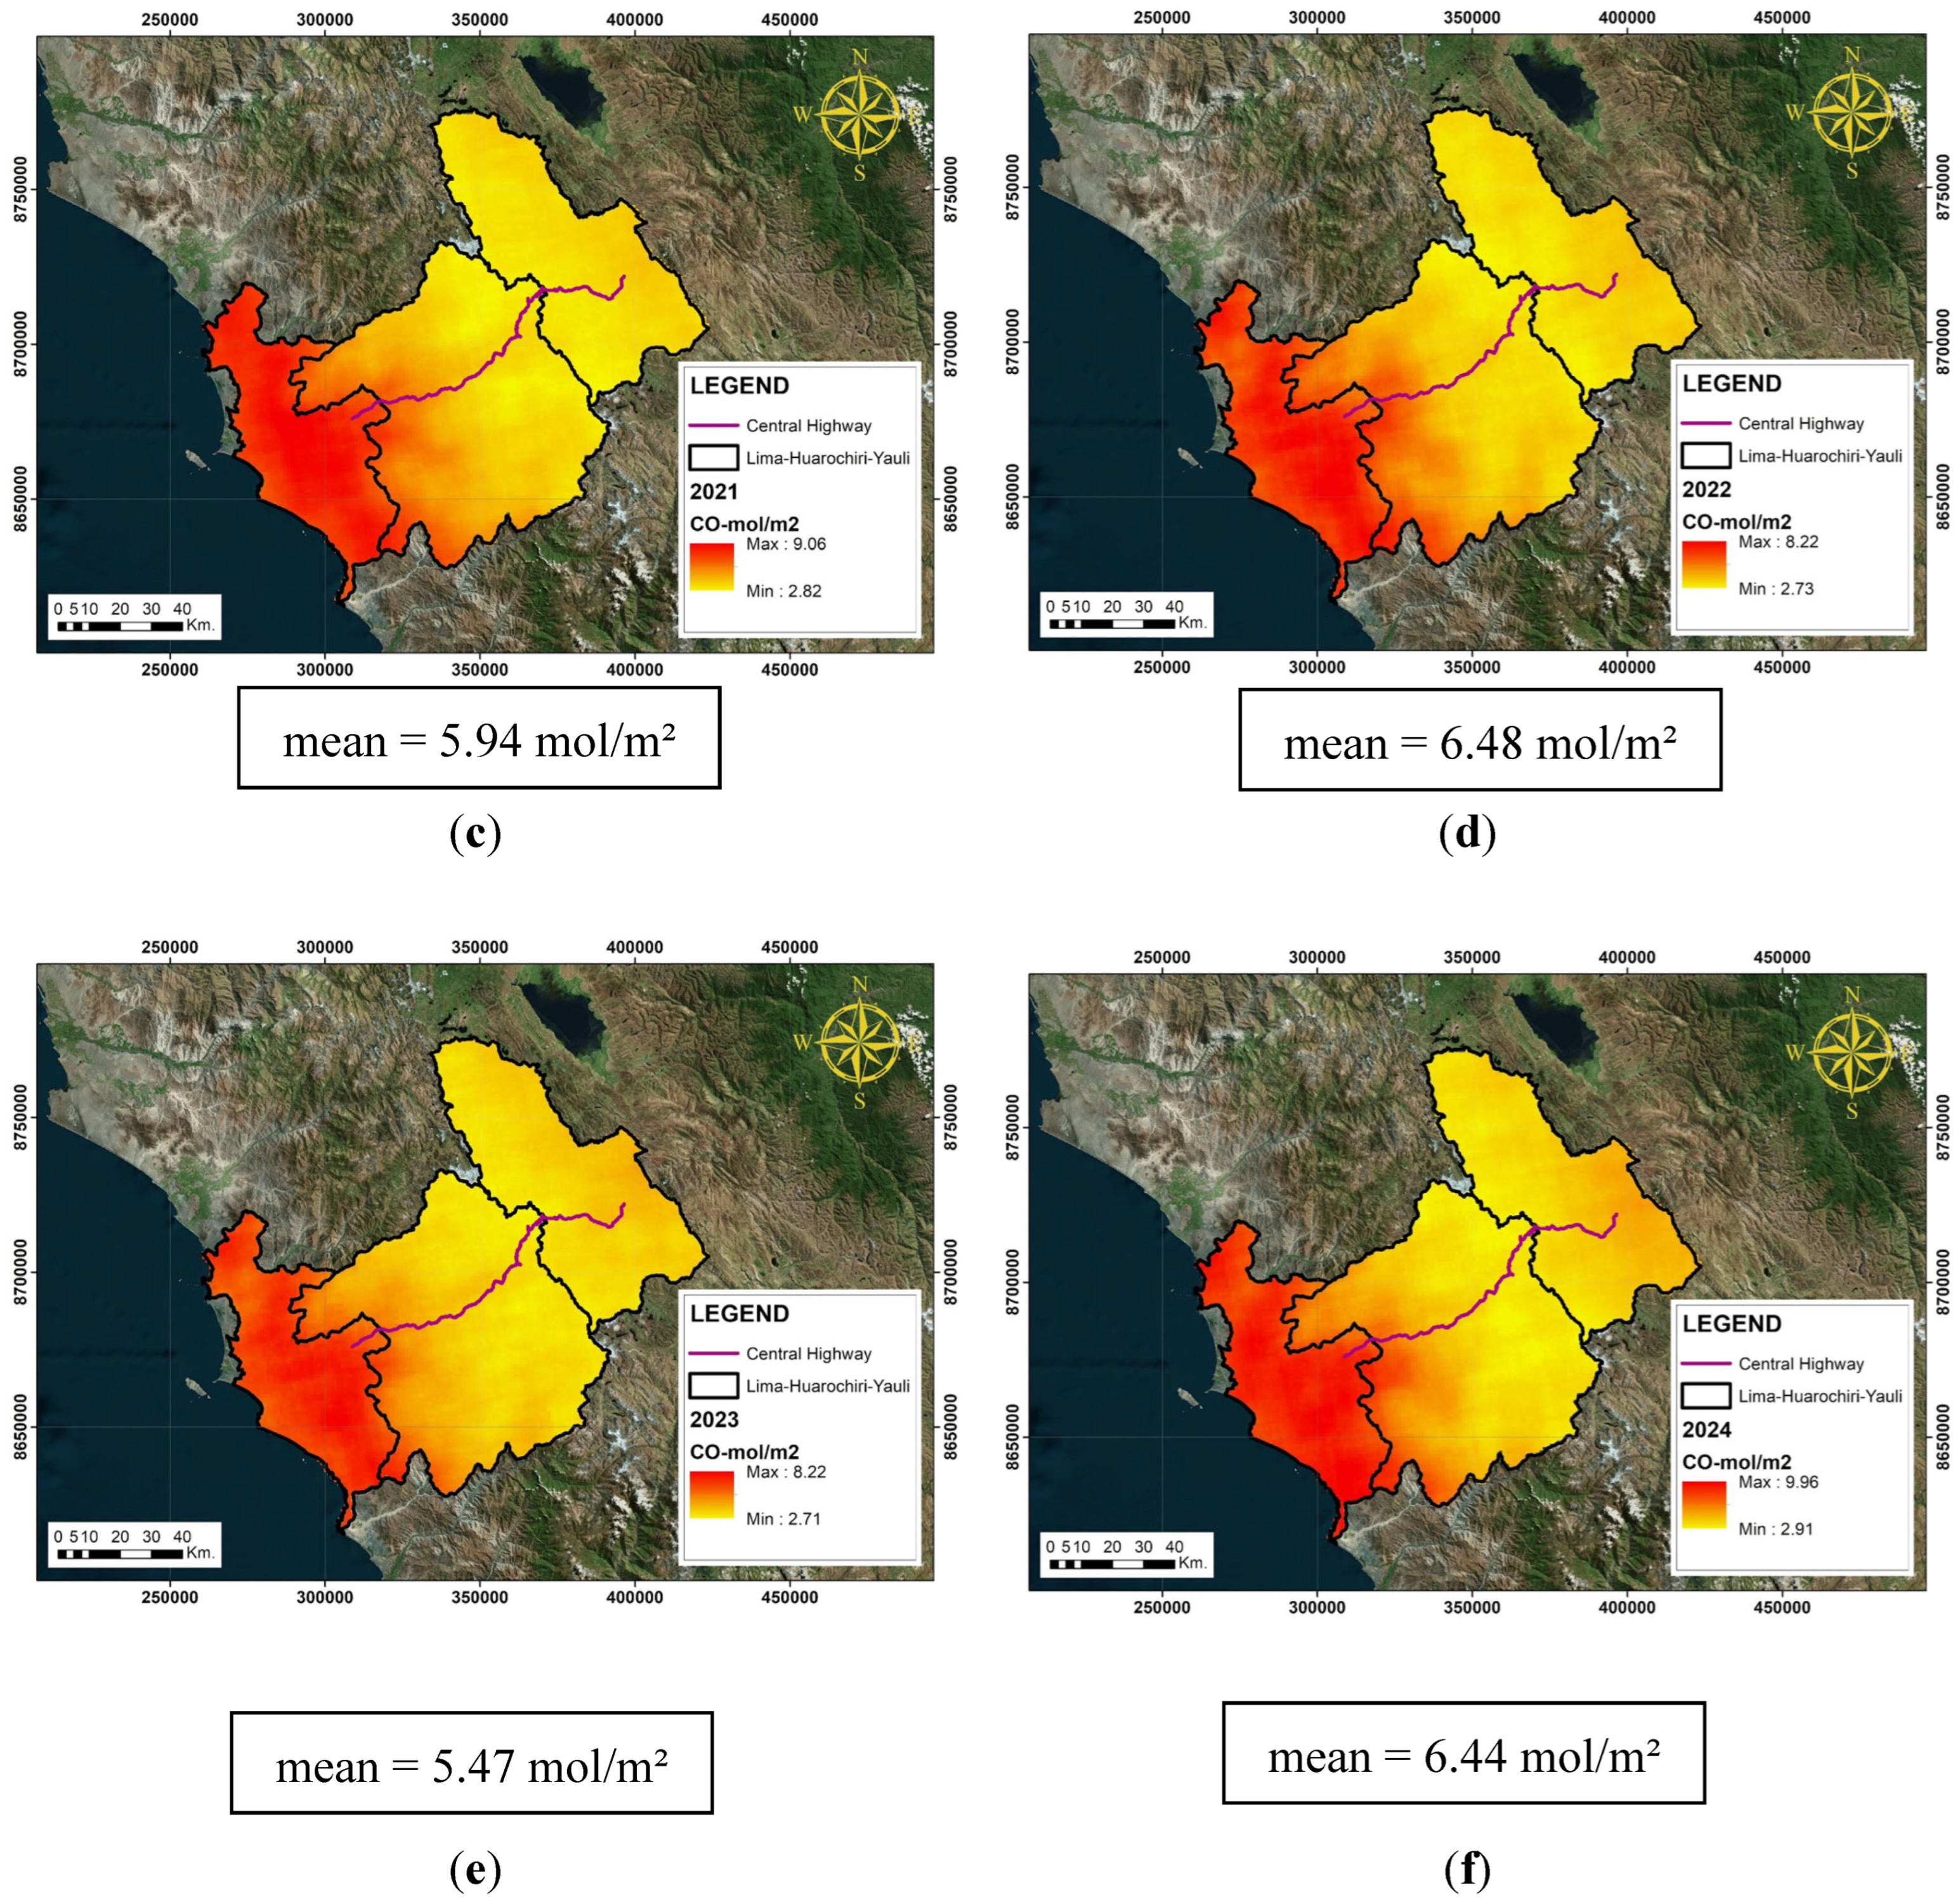
Figure 5.
Map of the concession area showing the location of the toll stations. Source: Office of Regulation Management and Economic Studies – OSITRAN.
Figure 5.
Map of the concession area showing the location of the toll stations. Source: Office of Regulation Management and Economic Studies – OSITRAN.
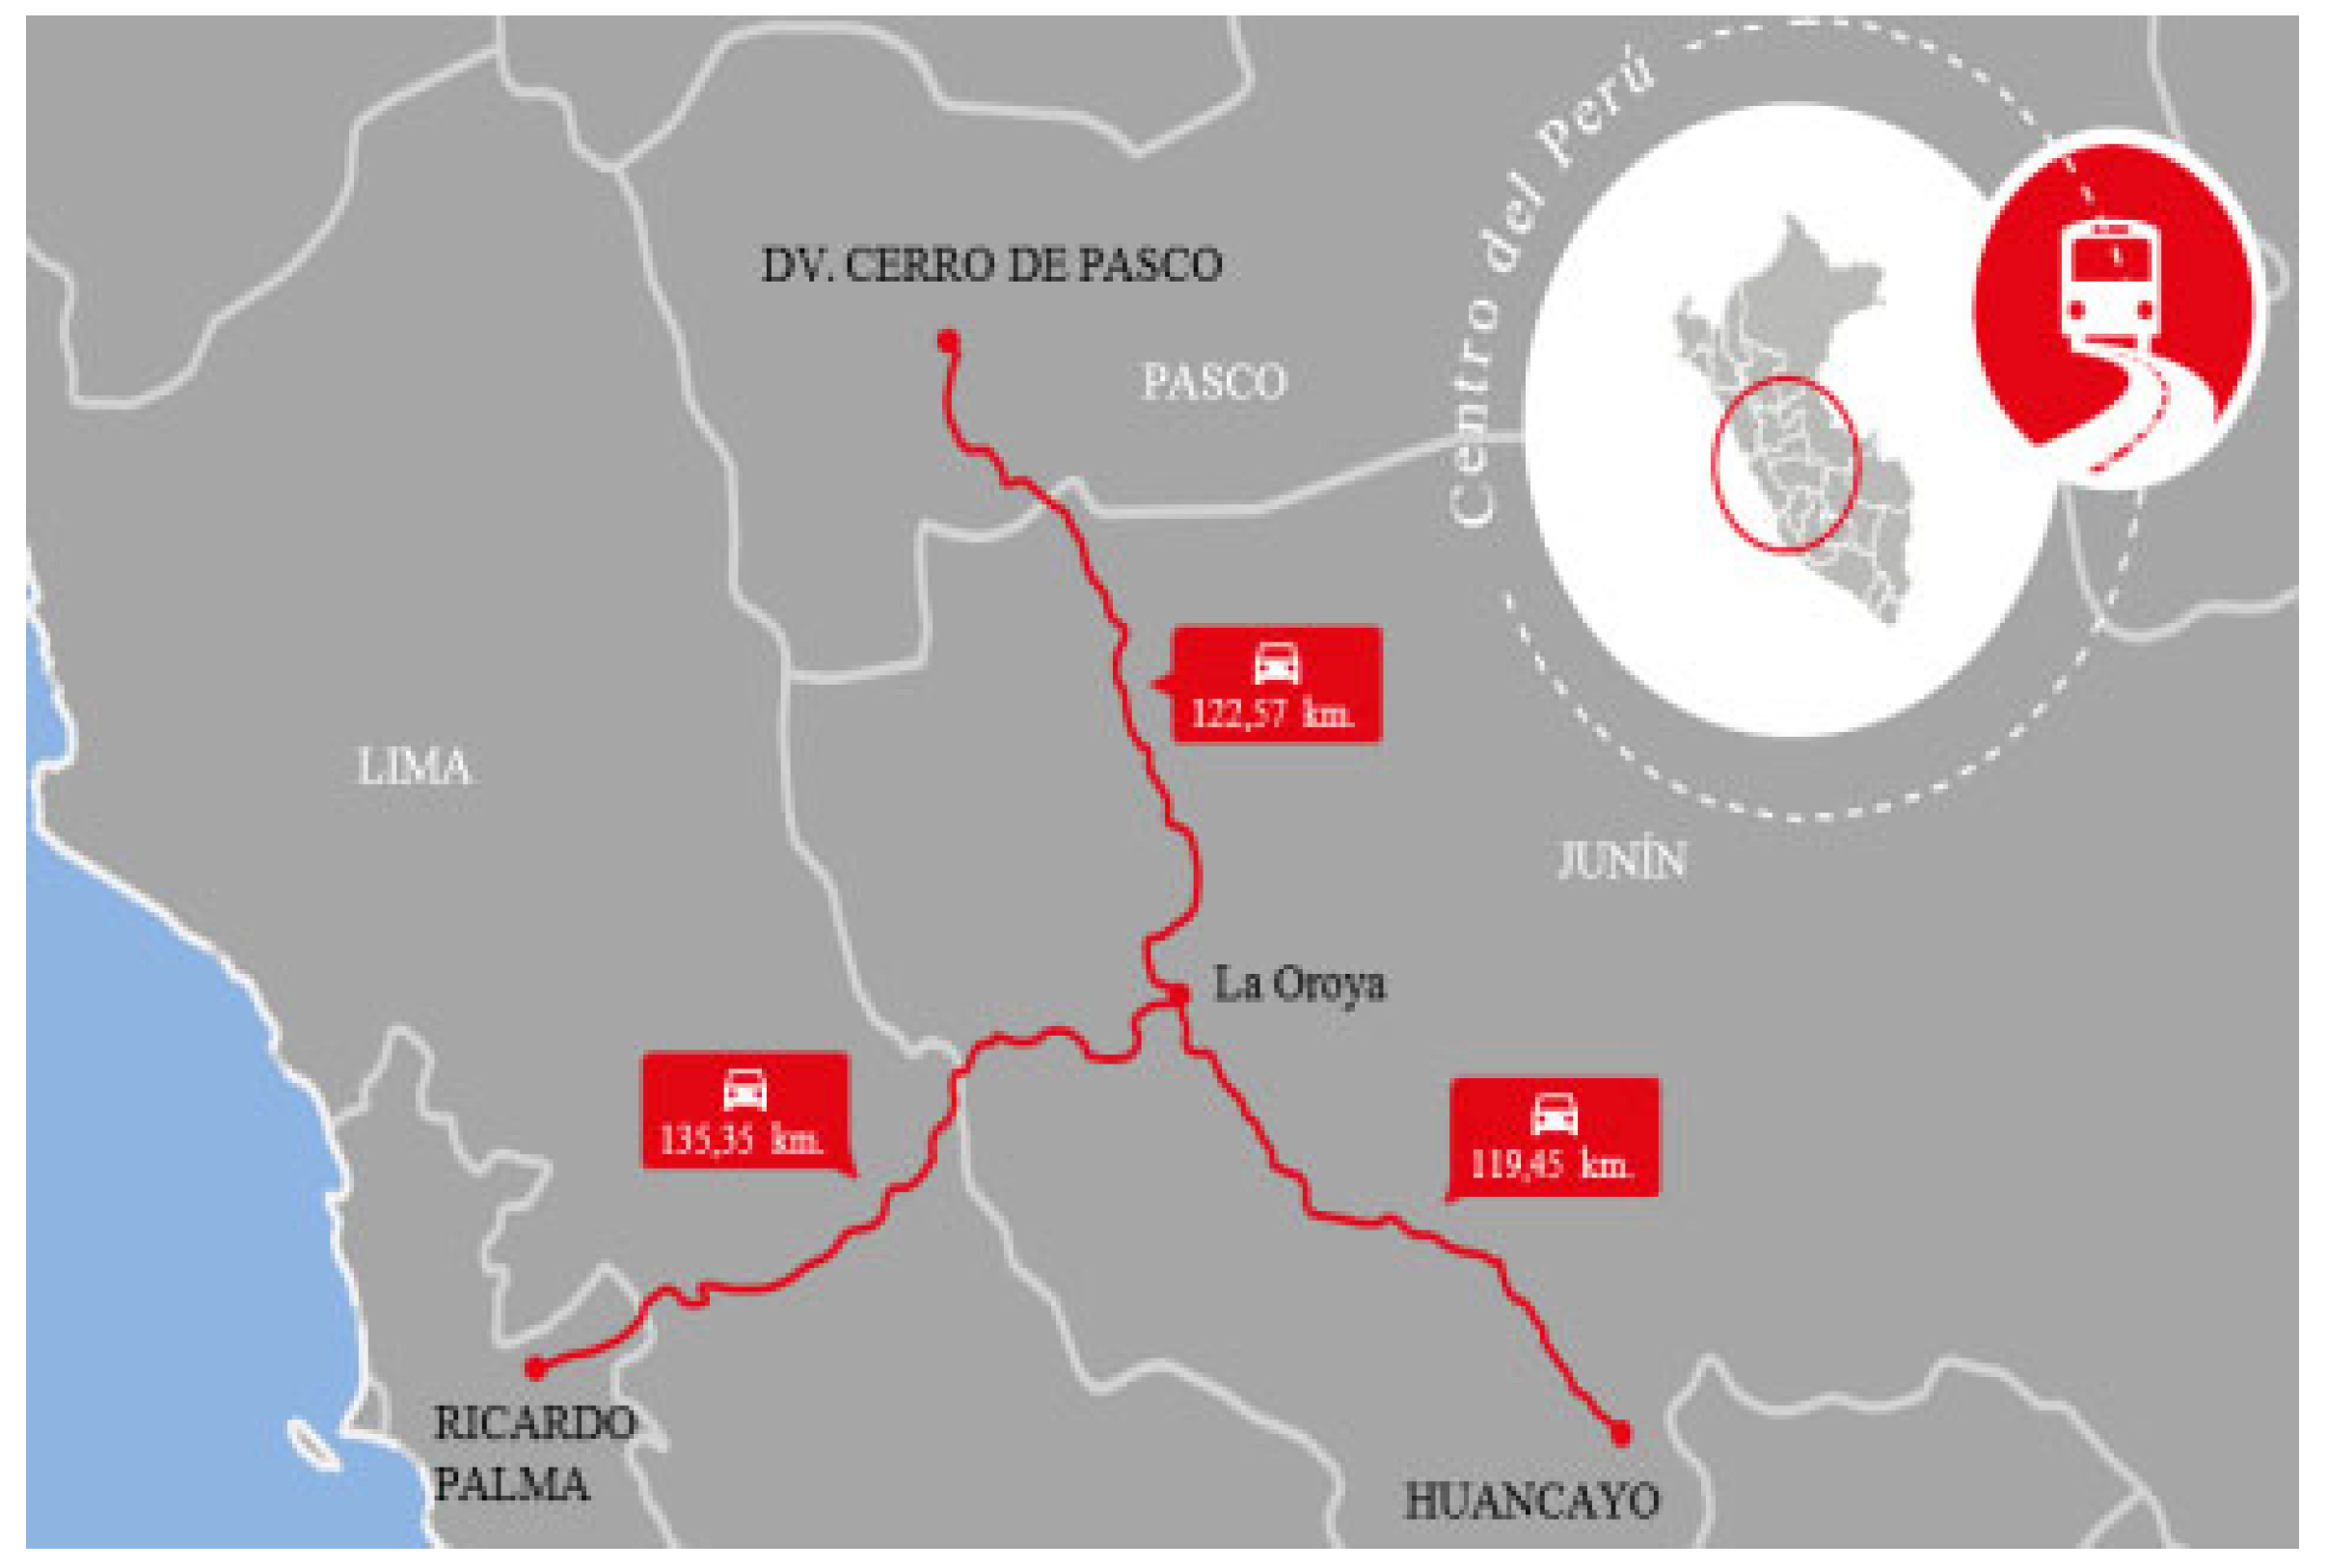
Figure 6.
Scatter plot of CO concentration versus daily vehicle volume at the Corcona and Casaracra toll stations (2019-2024).
Figure 6.
Scatter plot of CO concentration versus daily vehicle volume at the Corcona and Casaracra toll stations (2019-2024).
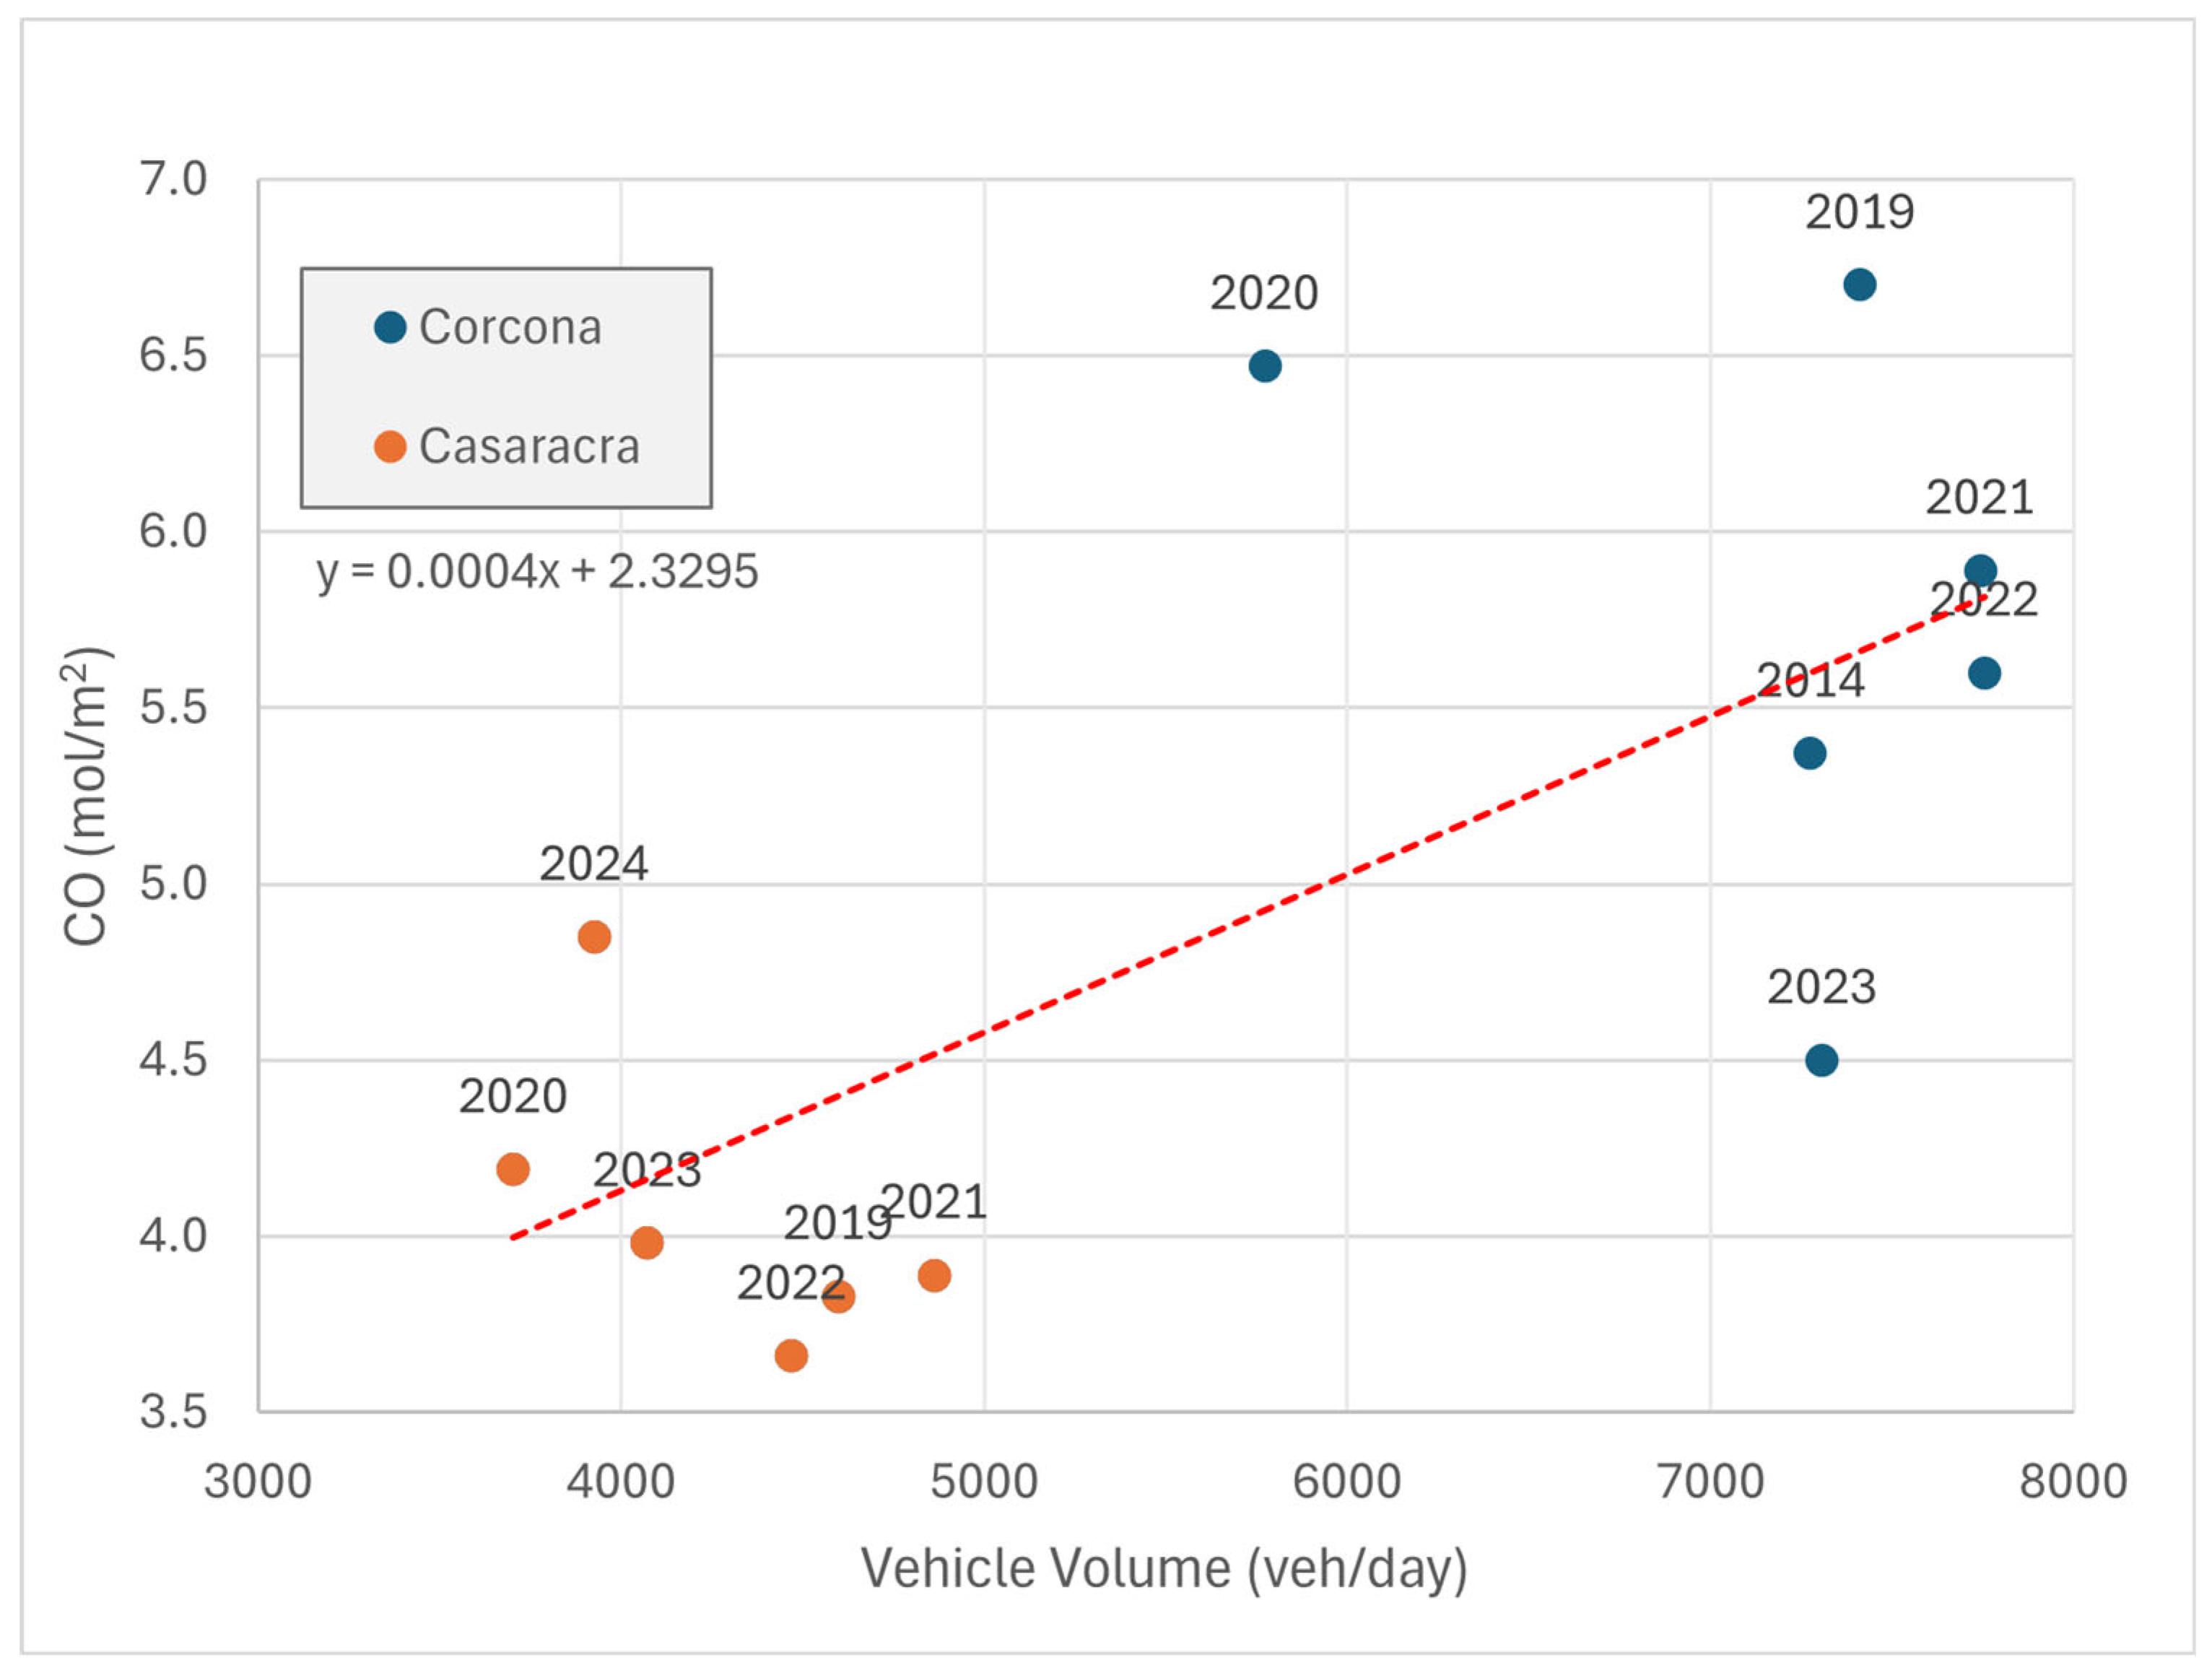

Table 1.
Variation in traffic by vehicle type at the Corcona and Casararra toll stations.
|
Vehicle Type |
Toll | 2019 | 2020 | 2021 | 2022 | 2023 | 2024 |
| Light Vehicles |
Casaracra | 774 | 597 | 864 | 776 | 684 | 701 |
| Corcona | 1370 | 1028 | 1526 | 1532 | 1427 | 1448 | |
| Heavy Vehicles |
Casaracra | 881 | 736 | 886 | 832 | 782 | 712 |
| Corcona | 1299 | 1050 | 1260 | 1259 | 1203 | 1171 | |
| total | Casaracra | 1655 | 1333 | 1750 | 1608 | 1466 | 1413 |
| Corcona | 2669 | 2078 | 2786 | 2791 | 2630 | 2619 |
Table 2.
Vehicle flow and CO distribution at the Corcona and Casaratra toll stations.
| year | Toll | Vehicle volume (veh/day) | CO (mol/m²) |
| 2019 | Corcona | 7411 | 6.7 |
| 2020 | Corcona | 5772 | 6.47 |
| 2021 | Corcona | 7742 | 5.89 |
| 2022 | Corcona | 7753 | 5.6 |
| 2023 | Corcona | 7306 | 4.5 |
| 2024 | Corcona | 7275 | 5.37 |
| 2019 | Casaracra | 4597 | 3.83 |
| 2020 | Casaracra | 3703 | 4.19 |
| 2021 | Casaracra | 4861 | 3.89 |
| 2022 | Casaracra | 4469 | 3.66 |
| 2023 | Casaracra | 4072 | 3.98 |
| 2024 | Casaracra | 3925 | 4.85 |
Table 3.
Results of the Mann–Kendall test for CO column density.
| Parámeter | Value |
| Trend | no trend |
| Hypothesis (h) | False (there is no significant trend) |
| p-value | 0.7317 |
| Z- static | -0.3429 |
| Kendall's tau | -0.0909 |
| S | -6 |
| Variance of S | 212.67 |
| Slope | -0.0767 |
| Intercept | 5.0967 |
Table 4.
Mann-Kendall test results for vehicle volume.
| Parámeter | Value |
| Trend | No trend |
| Hypothesis (h) | False (there is no significant trend) |
| p-value | 0.7317 |
| Z- static | -0.3429 |
| Kendall's tau | -0.0909 |
| S | -6 |
| Variance of S | 212.67 |
| Slope | -28.3 |
| Intercept | 5472.15 |
Table 5.
Summary of statistical analyses applied to CO concentrations and vehicle volume (2019–2024).
Table 5.
Summary of statistical analyses applied to CO concentrations and vehicle volume (2019–2024).
| Statistical test | Variable(s) analyzed | Coefficient / Statistic | p-value | Result | Interpretation |
| Pearson correlation | Vehicular traffic volume vs. CO | R = 0.689 | 0.0132 | Significant | Indicates a moderate positive correlation, suggesting that higher vehicular traffic volume is associated with higher CO column density. |
| Spearman correlation | Vehicular traffic volume vs. CO | ρ = 0.622 | 0.0307 | Significant | Confirms a positive monotonic relationship between vehicular traffic flow and CO, without assuming a strictly linear relationship. |
| Mann–Kendall | CO (time series 2019–2024) | Tau = −0.0909, Z = −0.3429 | 0.7317 | Not significant | No statistically significant temporal trend is observed in CO column density during the analyzed period. |
| Mann–Kendall | Vehicular traffic volume (time series 2019–2024) | Tau = −0.0909, Z = −0.3429 | 0.7317 | Not significant | No significant increasing or decreasing trend is detected in vehicular traffic volume at the analyzed toll stations. |
Table 6.
Annual summary of average values, standard deviations and trends in vehicle volume and CO2 (2019-2024).
Table 6.
Annual summary of average values, standard deviations and trends in vehicle volume and CO2 (2019-2024).
| Year | Mean_Volume | Volume_std | Mean_CO | CO_std | Volume_Trend | CO_Trend |
| 2019 | 6004.0 | 1989.8 | 5.26 | 2.03 | – | – |
| 2020 | 4737.5 | 1463 | 5.33 | 1.61 | ↓ | ↑ |
| 2021 | 6301.5 | 2037.17 | 4.89 | 1.41 | ↑ | ↓ |
| 2022 | 6111 | 2322.14 | 4.63 | 1.37 | ↓ | ↓ |
| 2023 | 5689 | 2286.78 | 4.24 | 0.37 | ↓ | ↓ |
| 2024 | 5600 | 2368.81 | 5.11 | 0.37 | ↓ | ↑ |
Table 7.
Values obtained with Google Earth Engine and ArcGIS for the year 2019.
| Estation | CO2019 (mol/m2) |
| SJL | 8.763947 |
| Santa Anita | 8.05398 |
| Ate | 9.45032 |
| Lurigancho | 9.366203 |
Table 8.
Average CO values based on SENAMHI data.
| Estation | CO Average (μgCO/m3) |
| SJL | 1578.2 |
| Santa Anita | 999.8 |
| Ate | 1477.4 |
| Lurigancho | 1433.5 |
Disclaimer/Publisher’s Note: The statements, opinions and data contained in all publications are solely those of the individual author(s) and contributor(s) and not of MDPI and/or the editor(s). MDPI and/or the editor(s) disclaim responsibility for any injury to people or property resulting from any ideas, methods, instructions or products referred to in the content. |
© 2026 by the authors. Licensee MDPI, Basel, Switzerland. This article is an open access article distributed under the terms and conditions of the Creative Commons Attribution (CC BY) license (http://creativecommons.org/licenses/by/4.0/).
Copyright: This open access article is published under a Creative Commons CC BY 4.0 license, which permit the free download, distribution, and reuse, provided that the author and preprint are cited in any reuse.


