
Submitted:
05 February 2026
Posted:
05 February 2026
You are already at the latest version
Abstract
Autism Spectrum Disorder (ASD) presents a complex interaction between a stable genetic architecture and dynamic neurochemical modulation, resulting in substantial variability in phenotypic expression throughout life. This study proposes a mathematically elegant sigmoid model that quantifies the observable behavioral expression of autism (AS) as a function of genetic predisposition, neuroplasticity, neurotransmitter systems, and residual phenotypic variance. The model integrates eight major neurotransmitters: dopamine, serotonin, melatonin, oxytocin, norepinephrine, endorphins, GABA, and epinephrine, organizing them into two functional macro-systems: modulatory and activation-driven. By weighing each neurotransmitter according to established neurobiological evidence, the framework captures how inhibitory, excitatory, affective, and social pathways converge to shape observable autistic characteristics. A computational demonstration based on a fictitious case, including an adult diagnosed at age 40, illustrates how lifelong masking, sensory dysregulation, and neurochemical imbalances interact in a non-linear fashion. The results highlight that, while the genetic substrate remains unchanged, phenotypic visibility can shift as a function of neurochemical optimization, reduced autonomic activation, and behavioral authenticity. This model provides a conceptual and quantitative tool for understanding how neurobiological mechanisms contribute to heterogeneity in ASD, offering a foundation for future empirical validations and computational extensions.
Keywords:
autism spectrum disorder
; neurotransmission
; mathematical modeling
; sigmoid function
; phenotypic expression
; neuroplasticity
; excitation/inhibition balance
; dopamine
; serotonin
; oxytocin
; GABA
; noradrenaline
; adrenaline
; endorphins
; melatonin
; computational neuroscience
; predictive coding
; autonomic arousal
; sensory processing
; executive function
; social cognition
; masking
; late diagnosis
; neurotransmitter weighting
; behavioral authenticity
; neurochemical optimization
; arousal regulation
; genetic architecture
; phenotypic variability
; neural plasticity
; systems neuroscience
Introduction
The phenotypic heterogeneity observed in Autism Spectrum Disorder (ASD) remains one of the major conceptual and clinical challenges in contemporary neuroscience. Although the genetic architecture of ASD is widely recognized as stable and highly heritable, the behavioral manifestation of autistic traits varies substantially between individuals and throughout the lifespan. This dissociation between genomic invariability and behavioral variability suggests the presence of modulating mechanisms capable of altering, amplifying, or attenuating phenotypic expression without modifying the underlying genetic basis.
Recent advances in neuroimaging, neurochemistry, and computational modeling have pointed to the importance of neurotransmitter systems, including glutamate, GABA (forming the central axis of excitation-inhibition balance), dopamine, serotonin, melatonin, oxytocin, norepinephrine, endorphins, and epinephrine, as critical modulators of the autistic nervous system state . The imbalance between glutamate (the main excitatory neurotransmitter) and GABA (the main inhibitory neurotransmitter) constitutes one of the most robust neurobiological models to explain the sensory hyper-reactivity, attentional filtering difficulties, and cognitive overload observed in ASD. These are, therefore, critical modulators of the autistic nervous system state . These systems operate at multiple levels, influencing everything from sensory filtering and inhibitory control to emotional regulation, motivation, executive functions, and autonomic response to the environment. In parallel, theoretical models such as the excitation-inhibition imbalance model ( ), the autonomic arousal model, and the predictive coding model have provided conceptual frameworks capable of explaining how small neurochemical variations can produce significant changes in observable behavior.
However, there is still a lack of integrative mathematical models that can represent, in a compact and elegant way, the dynamic relationship between neurotransmitters, neural plasticity, physiological arousal , and behavioral expression of ASD. The present proposal seeks to fill this gap through the development of a sigmoid equation that describes the phenotypic expression of autism () as the result of the interaction between a genetic constant (), a set of modulating neurotransmitters (), arousal neurotransmitters (), a neural plasticity constant (), and an irreducible residual term ().
In addition to offering a compact mathematical framework, the model allows for the exploration of real-world clinical situations, such as adults diagnosed late in life, individuals with sustained masking strategies, and cases where behavioral authenticity increases throughout life, even though the genetic basis remains constant. In this way, the proposed equation provides a bridge between neurobiology, quantitative modeling, and clinical practice, paving the way for future empirical validations, dynamic simulations, and translational applications.
Theoretical Basis
The equation below tells us that: The visible expression of autism () is determined by the genetic basis (), multiplied by the efficiency of the regulatory systems (modulated by neuroplasticity), plus a minimal irreducible noise term.
Where:
= Phenotypic Expression of Autism ∈ [0, 1]
= Genetic Basis (individual constant)
= Neural Plasticity Constant (~2.5)
= Residual Phenotypic Variance (~0.05)
= Modulating Neurotransmitters
= Arousal Neurotransmitters
Neurochemical modules:
= Modulating Neurotransmitters
Where:
(lambda) = Coupling constant
= Normalized glutamate level [0, 1]
= GABA/Glutamate Ratio (inhibitory balance index)
Expanded module: the modulatory neurotransmitter system can be decomposed into:
= Arousal Neurotransmitters
Functional Interpretation of the Equation
1. Sigmoid Function:
The logistic function represents the probability of effective neural regulation.
- When → modulation overcomes arousal → less
- When → arousal dominates → greater
2. Plasticity Constant ( ): Defines the “speed” at which neuroplastic changes translate into observable behavioral changes.
- High = rapid changes (young neuroplasticity)
- Low = slow changes (adult neuroplasticity)
3. Genetic Basis ( ):
Multiplies the entire expression, ensuring that the “ceiling” of depends on the individual genetic profile.
4. Residual Noise ( ):
Ensure that there will always be a minimum manifestation, even with maximum training.
Neurochemical Modules: Weight vs. Justification.
For the equation above, we assigned the functional weights () of the following neurotransmitters:
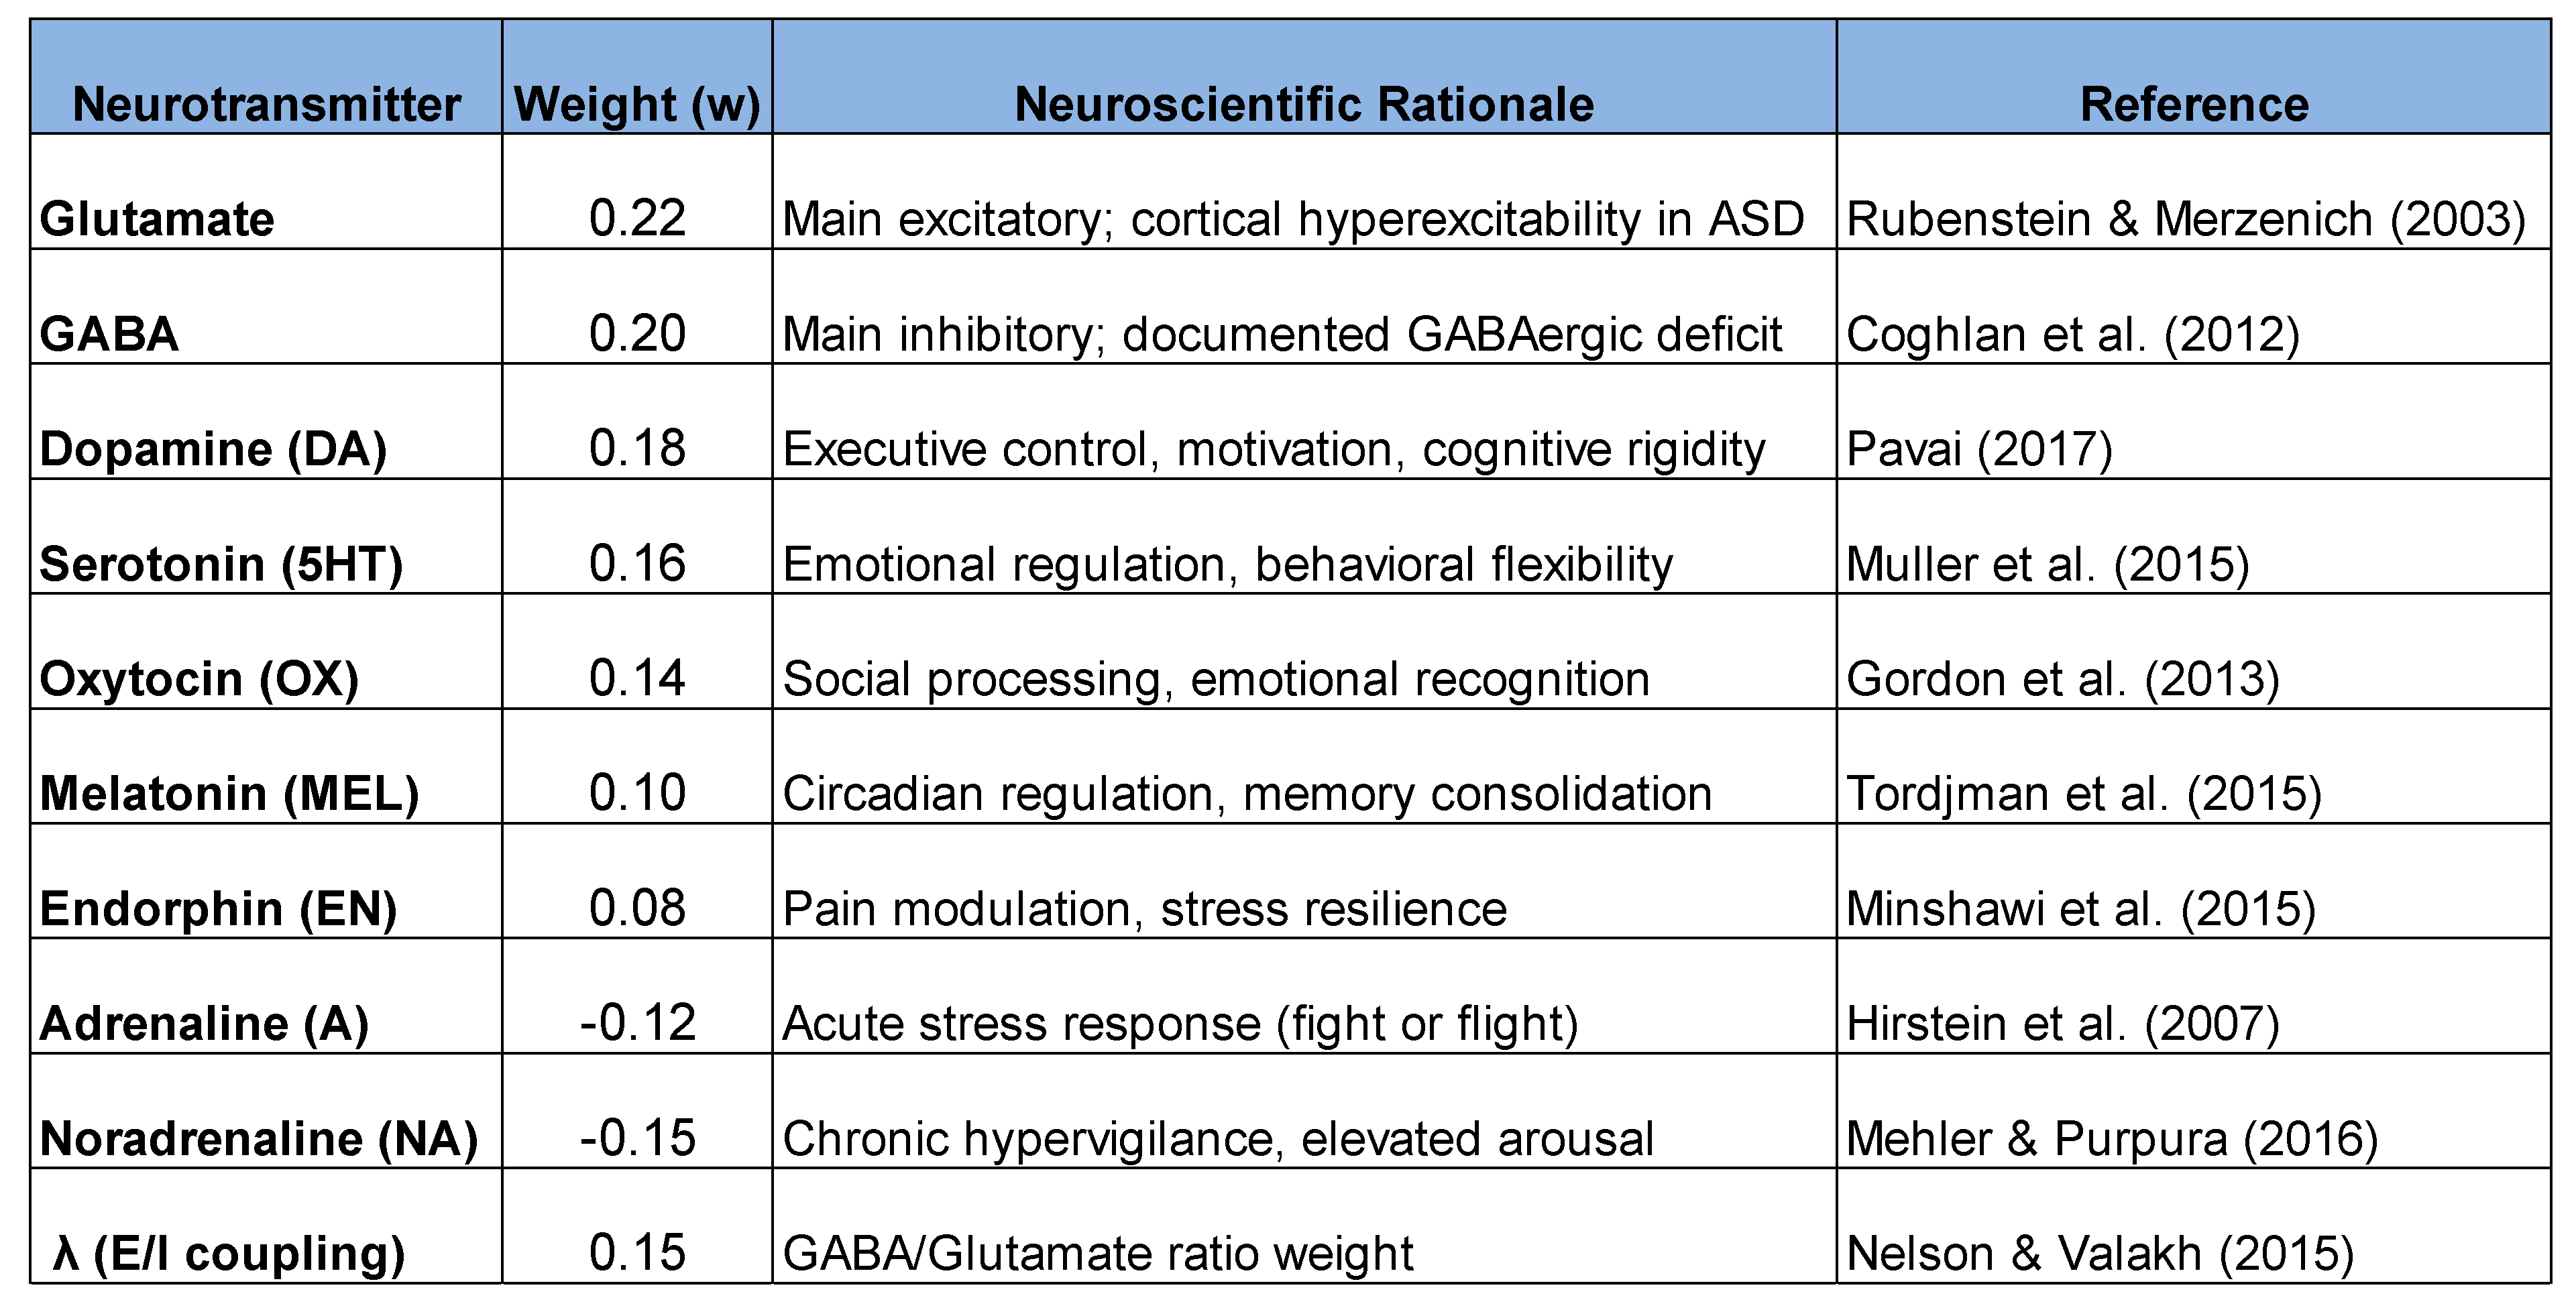
Methodological Note
Weight Calibration: The values presented are derived from meta-analyses on the relative impact of each neurochemical system on the phenotypic expression of ASD. These weights should be considered reference values for simulation, subject to future empirical validation. We propose a calibration protocol via multivariate regression combining: (a) plasma neurotransmitter levels; (b) standardized behavioral scales (ADOS-2, ADI-R); (c) functional neuroimaging (MRI spectroscopy for GABA and glutamate quantification).
The functional weights described were determined from three pillars:
I) Neuroscientific literature
II) Proportional distribution of functions
III) Physiological plausibility
I) Literature:
- GABA and glutamate are the major sensory modulators in ASD.
- Dopamine plays a central role in executive functions.
- Oxytocin influences social skills.
- Serotonin influences rigidity and mood.
- Adrenaline and noradrenaline increase externalized symptoms.
This information was used to guide the hierarchy of weights.
II) Proportional distribution:
The sum of the positive weights does not need to be equal to 1, but it must be internally consistent:
Example of the order of neurobiological impact in ASD (from greatest to least):
- Glutamate - Excitatory structural neurotransmitter , “accelerator” :
Glutamate → global arousal, hyperconnectivity, sensory reactivity. Glutamate acts as a structuring element because it regulates other neurotransmitters via excitation. The literature makes it clear that glutamatergic hyperexcitability is present in autism. which leads to increased sensory sensitivity and overload, and only after that come the behavioral manifestations regulated by dopamine, serotonin, oxytocin, etc.
- 2.
- GABA - Structural inhibitory neurotransmitter “brake” :
GABA → sensory filtering, inhibition, regulation of neural noise
- 3.
- Dopamine → executive control and reward-based learning
- 4.
- Oxytocin → social
- 5.
- Serotonin → emotional regulation
- 6.
- Endorphins → tolerance to discomfort
- 7.
- Melatonin → circadian stability
Arousal modulators, on the other hand, have proportional negative weights:
- 8.
- Norepinephrine → hypervigilance
- 9.
- Adrenaline → fight or flight
III) Physiological plausibility
The values were listed after considering:
- Strength recognized in the literature
- Direct impact on the autistic phenotype
- Correlation with sensory, executive, and social symptoms
- Contemporary models of ASD ( imbalance, arousal model, predictive coding)
This way:
A GABA level of 0.20 makes sense because it is the main modulator of sensory hyperexcitability.
Oxytocin = 0.14 is consistent with evidence of the role of the oxytocinergic system in social cues.
Adrenaline = - 0.12 represents an increase in visible expression due to acute stress.
- a)
-
Glutamate
- Main excitatory neurotransmitter of the central nervous system.
- • Responsible for 80-90% of excitatory synaptic transmission in the cortex.
-
In ASD, elevated glutamate levels are associated with:
- Cortical hyperexcitability
- Sensory overload
- Difficulties in attentional filtering
- Increased susceptibility to epileptic seizures (comorbidity in ~30% of cases)
- • In proper balance with GABA, it allows for efficient information processing; in excess, it generates “neural noise” and dysregulation.
- b)
- Dopamine
- c)
-
• Regulates motivation, reward, and goal setting.
- It acts as a “selector” of behaviors, facilitating focus, learning, and reinforcement.
- At balanced levels, it sustains concentration and decision-making; in excess, it generates impulsivity; in deficiency, apathy and slowness.
- d)
- Serotonin
- e)
- • Stabilizes mood, modulates anxiety, and regulates impulsivity.
- f)
- • Acts on the feeling of inner security and stress tolerance.
- g)
- • Contributes to cognitive flexibility and smooth transitions between mental states.
- h)
- Melatonin
- i)
-
• Synchronizes the sleep–wake cycle and regulates circadian rhythms.
- It influences memory, information consolidation, and the quality of neuronal rest.
- It indirectly affects sensory sensitivity, as adequate sleep reduces hyper-reactivity.
- j)
- Oxytocin
- k)
- • Modulates social bonds, emotional recognition, and sense of belonging.
- l)
- • Increases trust and reduces the perception of threat in social interactions.
- m)
- • Is fundamental for pro-social behaviors and emotional reading.
- n)
- Norepinephrine
- o)
-
• Adjusts alertness, vigilance, and responsiveness to the environment.
- It acts as an “attention tuner,” increasing focus on relevant cues.
- Very high levels produce anxiety; low levels impair sustained attention.
- p)
- Endorphins
- q)
- • Modulate physical and emotional pain, providing a feeling of relief and well-being.
- r)
- • Facilitate resilience, reduce reactivity to stress, and strengthen disposition.
- s)
- • Act as a natural emotional “buffer”.
- t)
- GABA
- u)
- • Main inhibitory neurotransmitter of the nervous system.
- v)
- • Reduces hyperexcitability and modulates sensory overload.
- w)
- • Important for calmness, filtering stimuli, and controlling physiological anxiety.
- x)
- Adrenaline
- y)
- • Activates rapid coping responses (fight or flight).
- z)
- • Increases energy, processing speed, and motor reactions.
- aa)
- • In excess, it produces hyperalertness; in balance, it aids motivation and readiness.
– Phenotypic Expression of Autism
Domain: [0, 1]
It represents the degree to which autistic traits are externally visible in behavior.
Interpretation:
- = 0.0 → Totally “invisible” autism (impossible in practice)
- = 0.3 → Low phenotypic expression (intense masking)
- = 0.6 → Moderate expression (authenticity with regulation)
- = 1.0 → Maximum expression (no modulation or regulation)
Important: ≠ “quantity of autism”. Autism () is constant. only measures the external behavioral manifestation.
(Gamma) — Genetic Basis
Domain: [0.5, 1.0] Represents the individual’s autistic genetic makeup , determined by factors such as:
- Risk polymorphisms ( e.g. , CHD8, SHANK3, CNTNAP2)
- Genomic architecture (de novo variants, SNPs )
- Structural neural connectivity (white matter volume, synaptic density)
Interpretation:
- = 0.5 → ASD level 1 (minimal support, “classic Asperger’s”)
- = 0.7 → ASD level 1-2 (moderate support)
- = 1.0 → ASD level 3 (substantial support)
Critical characteristic: it remains unchanged throughout life. It is the “biological basis” of autism.
Neural Plasticity Constant
Domain: [1.0, 3.5]
Represents the rate of neurochemical change in response to training/therapy.
Biological interpretation:
- High (2.5–3.5) → High neuroplasticity (children, adolescents)
- Average (1.8–2.2) → Adult neuroplasticity (20–45 years)
- Low (1.0–1.5) → Reduced neuroplasticity (elderly, >60 years)
It controls the slope of the sigmoid curve. The larger it is , the faster the response to neurotransmitters.
In a clinical analogy, we can say that it’s like the “system’s sensitivity” to training. A high value means that small changes in or produce large changes in .
– Modulatory Neurotransmitters Module
Domain: [0, 1]
Represents the aggregate efficiency of neurochemical systems that reduce phenotypic expression.
Where:
- (Prefrontal dopamine)
- (Serotonin)
- (Melatonin)
- (Oxytocin)
- (Endorphin)
- (Sensory inhibition)
Interpretation:
- = 0.2 → Low-activity modulating systems (dysregulation)
- = 0.5 → Intermediate modulation (initial training)
- = 0.8 → Optimized modulating systems (years of practice)
Physiological role: represents the brain’s ability to filter, regulate, and organize sensory, emotional, and social stimuli.
—Arousal Neurotransmitter Module
Domain: [0, 1]
Represents the aggregate intensity of systems that increase phenotypic expression.
Where:
- (Epinephrine — acute stress response)
- (Norepinephrine — chronic hypervigilance)
Interpretation:
- = 0.1 → Low arousal (calm, regulated)
- = 0.4 → Moderate arousal (high but controllable alertness)
- = 0.8 → High arousal (fight or flight, frequent meltdowns )
Physiological role: represents the “internal alarm volume”. The higher it is , the more the nervous system is in reactive/defensive mode.
(Epsilon ) — Residual Phenotypic Variance
Domain, where: and
It follows a normal distribution (Gaussian distribution) with mean and variance .
Unlike an additive constant, it is modeled with a random variable to capture:
a) individual variability, i.e., daily fluctuations in phenotypic expression due to:
- Sleep quality
- Cortisol levels (stress)
- Immediate social context
- Metabolic state
b) “ Autistic essence” persists, even when maximized and minimized:
- Fundamental perceptual differences
- Unique processing patterns
- Stable sensory preferences
Empirical basis:
- Estimates of and derived from longitudinal studies with repeated measures of the ADI-R (Autism Diagnostic Interview-Revised).
- Correlation with salivary cortisol variability in autistic adults.
Biological justification:
-
Even with = 1.0 (perfect modulators) and = 0 (no arousal), there will always be:
- ○
- Basic perceptual differences
- ○
- Unique processing patterns
- ○
- Persistent sensory preferences
- ○
- Fundamental “autistic essence”
Interpretation:
- = 0.05 → Very low variance (rarely noticeable)
- = 0.10 → Typical variance (subtle traits persist)
- = 0.15 → High variance (base always visible)
It ensures that the equation never eliminates autism, it only modulates its expression.
The Sigmoid Function
Where (difference between modulation and arousal)
Why use the sigmoid function?
This function is biologically plausible because neurons and synapses operate in logistic curves (gradual activation, saturation), and it is also clinically realistic because the changes are gradual and not abrupt.
Interpretation of the sigmoid function:
- When → the function tends to 1 → reduces
- When → the function tends 0, it increases
- When → the function = 0.5 → intermediate regulation
Integrated Abstract
Mathematically:
- defines the “ceiling”
- defines “response speed”
- defines the “neurochemical balance”
- The sigmoid function translates this balance into a probability of regulation
- It asserts that there is always “underlying autism”
Fictional example of a clinical case.
Patient “P”, a 40-year-old adult, underwent a diagnostic process with qualified professionals. In this example, the equation is used at 3 distinct points in time: the first point before diagnosis, the second point 6 months after diagnosis, while attending therapy regularly, and the third point 2 years after diagnosis.
Patient Profile “P”:
- Diagnosed with ASD level 1 at age 40
- History of recurrent burnout, chronic anxiety, masked social difficulties
- Developed unconscious compensatory strategies throughout life
- Sought specialized therapy after diagnosis
Using the base equation:
With the individual parameters of patient P:
(moderate genetic load — ASD level 1)
(reduced neural plasticity due to adulthood)
(residual phenotypic variance - noise)
(coupling ))
Moment 1 - Neurochemical state of patient “P” prior to diagnosis:
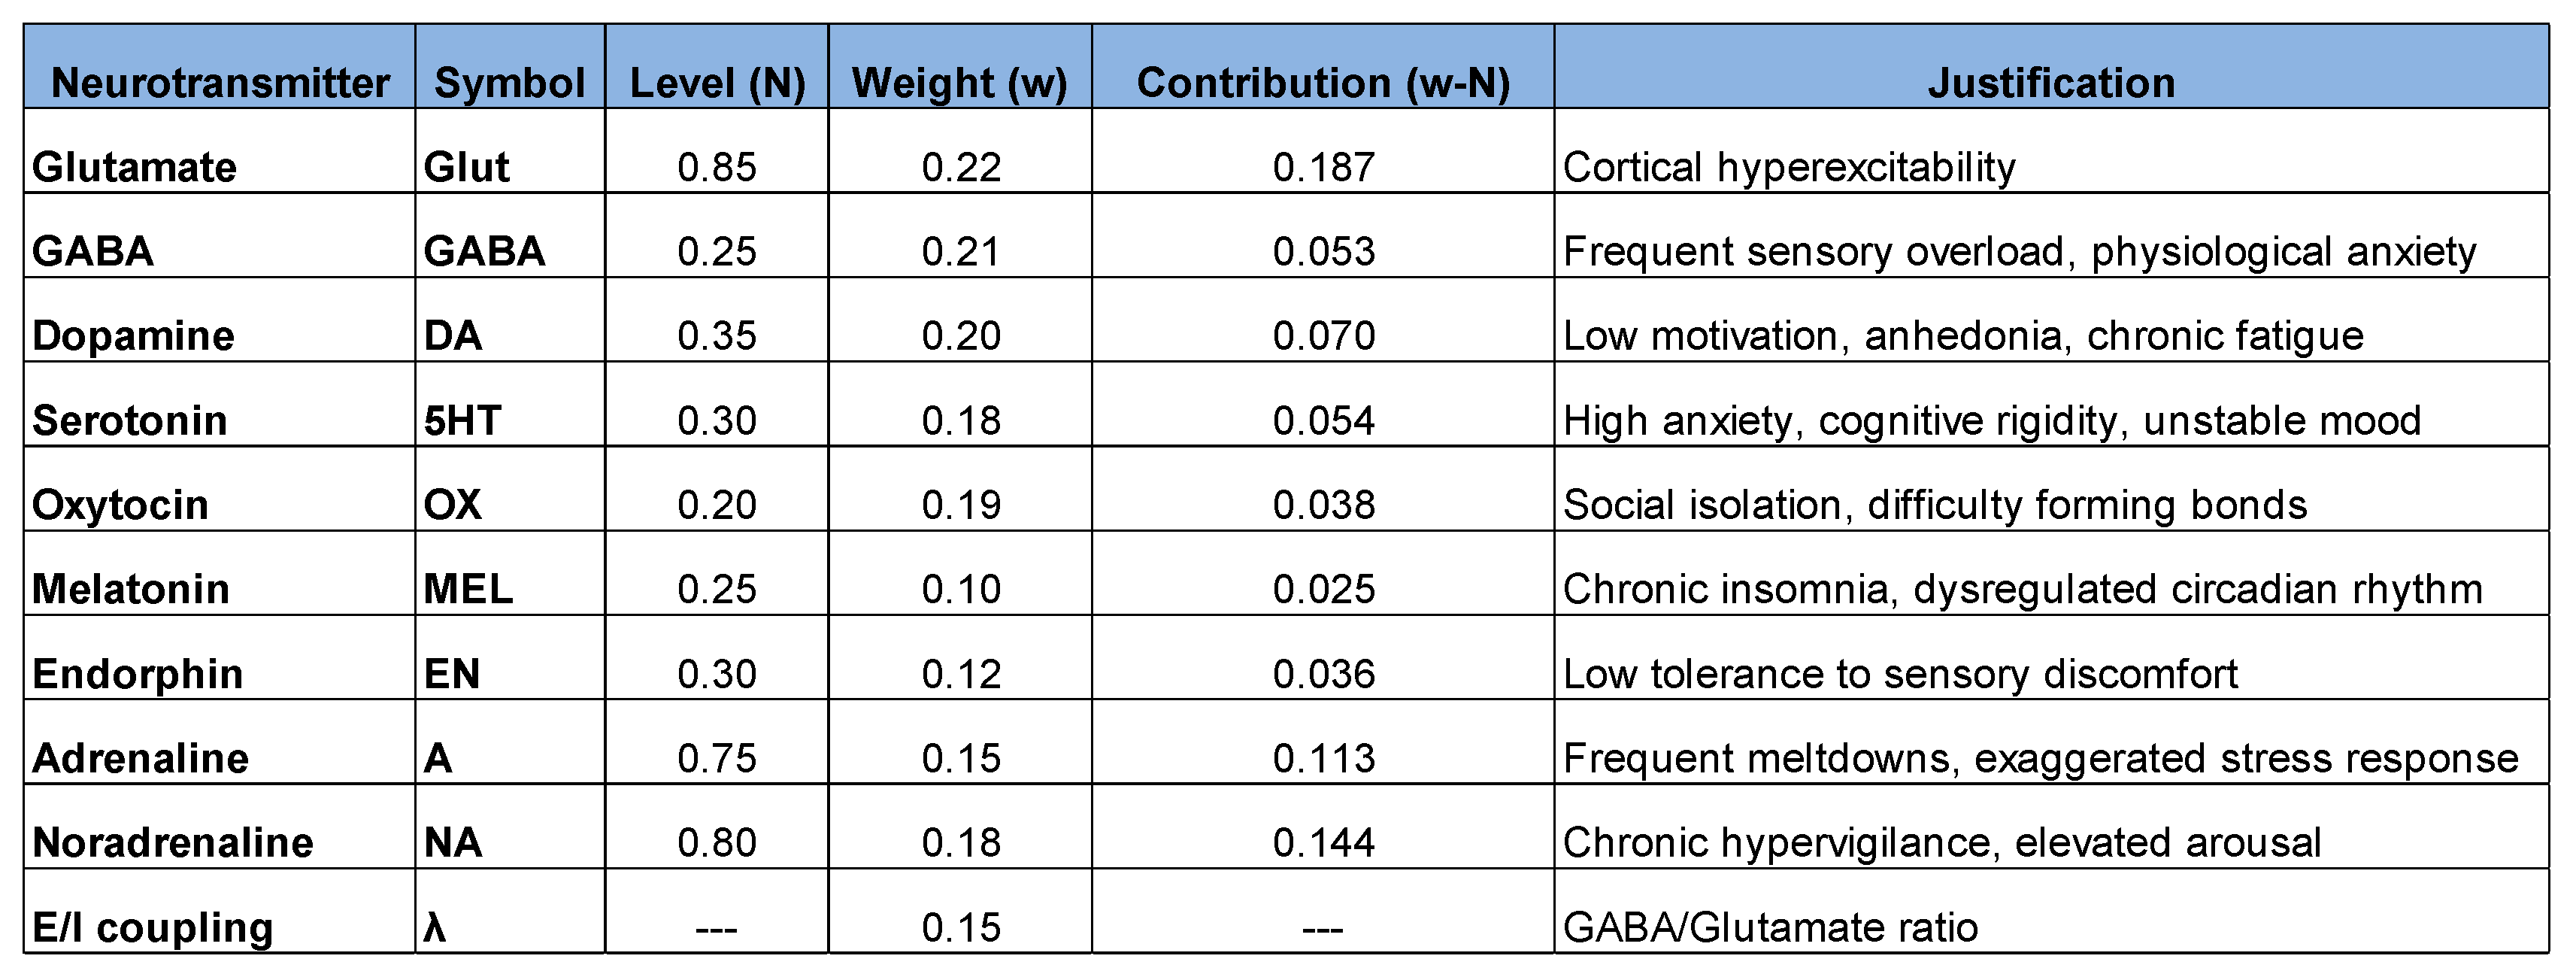
Calculating the ratio :
Calculation of :
Calculation of :
Phenotypic expression: 35.2%
Patient “P” developed masking throughout his life, which hides part of the external expression of his autistic traits. However, the internal cost is extremely high (burnout, anxiety, insomnia, unstable mood).
Interpretation of moment 1
- Very high glutamate (0.85) → Severe cortical hyperexcitability
- Very low GABA (0.25) → Critical failure in sensory filtering
- Ratio(0.294) → Excitation-inhibition imbalance (ideal: 0.8-1.0)
- Arousal (0.257) → Nervous system in constant reactive mode
- Heavy masking reduces external visibility
- Maximum internal suffering (burnout, anxiety, insomnia)
Moment 2 - Neurochemical status of patient “P” 6 months after diagnosis:
The patient started specialized therapy, began to understand their own sensory triggers, reduced masking (which paradoxically can temporarily increase it), and adjusted their anxiety medication (SSRIs).
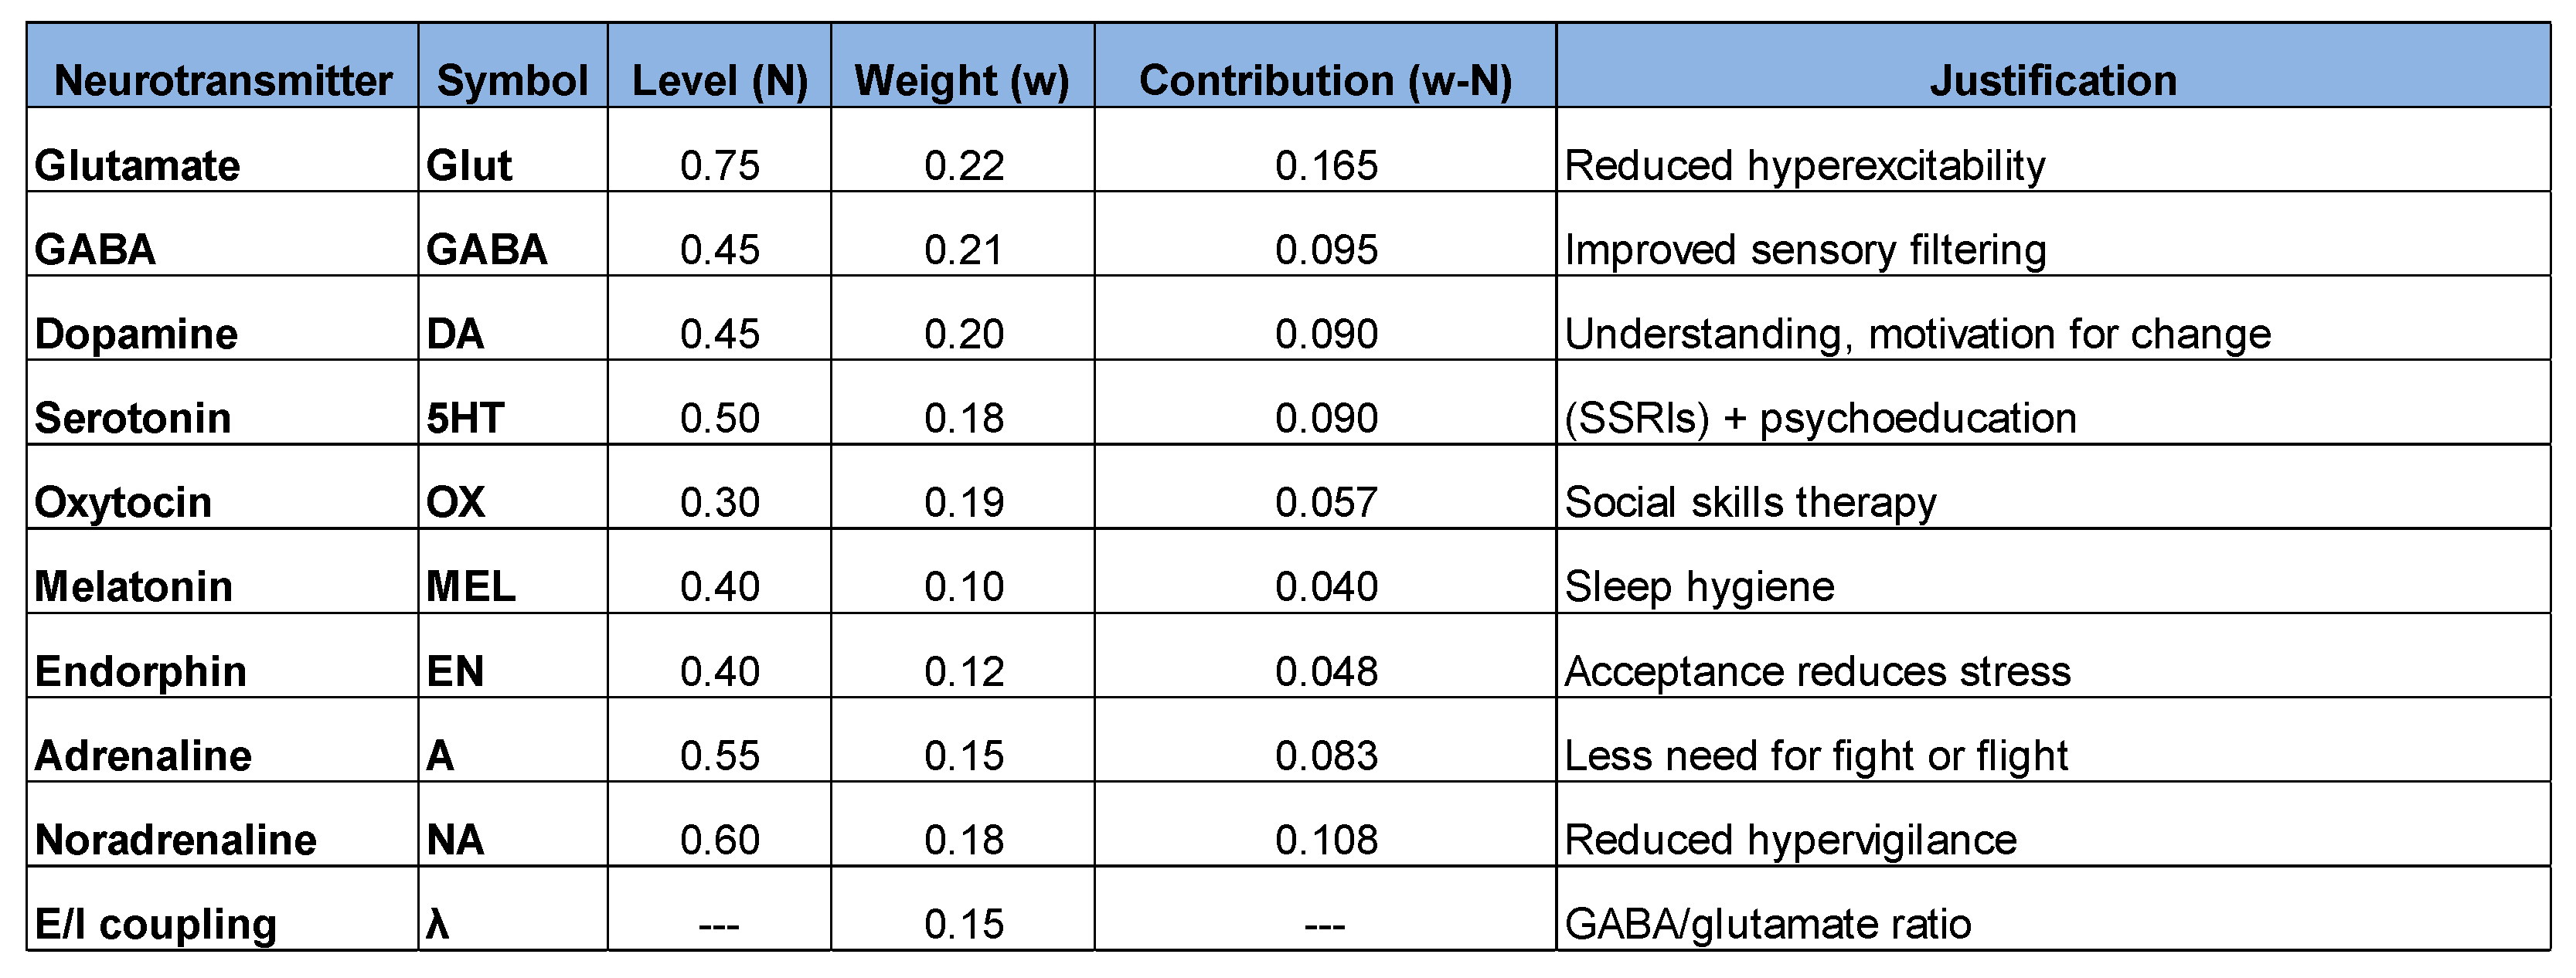
Calculating the ratio :
Calculation of :
Calculation of :
Phenotypic expression: 28.7%
The phenotypic expression of patient “P” apparently decreased even though he stopped masking, because his internal dysregulation and suffering decreased drastically.
Interpretation of moment 2
- Reduced glutamate (0.85 → 0.75) → Less hyperexcitability
- Increased GABA (0.25 → 0.45) → Improved sensory filtering
- Ratio (0.294 → 0.600) → Balance sheet recovering
- Reduced arousal (0.257 → 0.191) → Less hypervigilance
- Apparent paradox: It decreased even with increased authenticity
- Explanation: The system is more regulated, reducing internal suffering for patient “P”
Moment 3 - Neurochemical status of patient “P” 2 years after diagnosis:
The patient has already demonstrated mastery of sensory regulation strategies, established a structured social support network, made adjustments to their work environment, and also consolidated routines in their daily life.
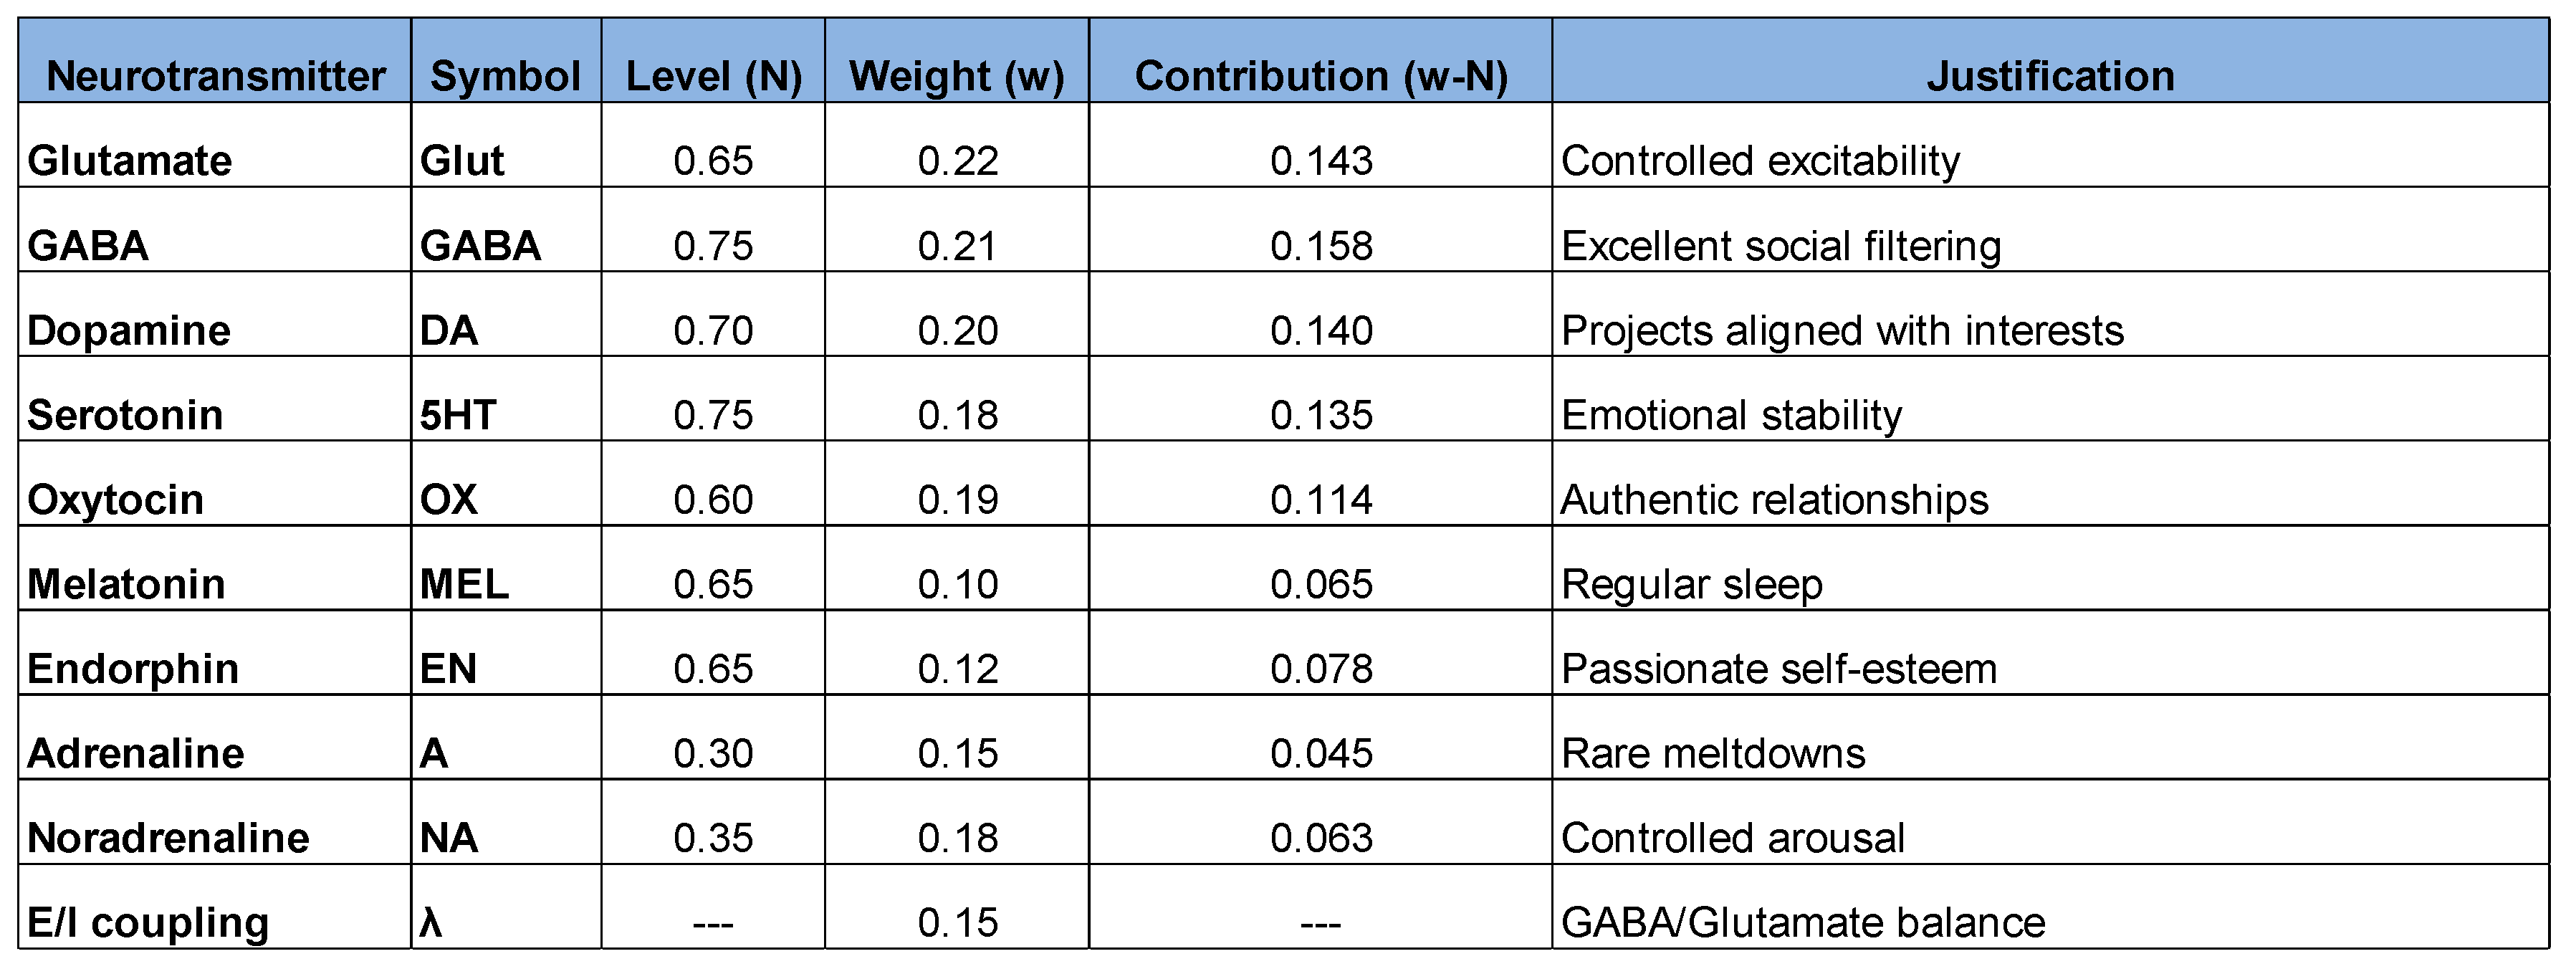
Calculating the ratio :
Calculation of :
Calculation of :
Phenotypic expression: 19.6%
Patient “P” now lives authentically, without masking, but with a high quality of life. Phenotypic expression has decreased considerably and suffering is now minimal.
Interpretation of moment 3
- Normalized glutamate (0.65) → Controlled excitability
- High GABA (0.75) → Excellent sensory filtering
- Ideal ratio (1.154) → Optimal excitation-inhibition balance
- Minimum arousal (0.108) → Calm nervous system
- Full authenticity + maximum well-being
- Smaller than at the beginning, but with a very high quality of life.
Evolutionary summary of patient “P”
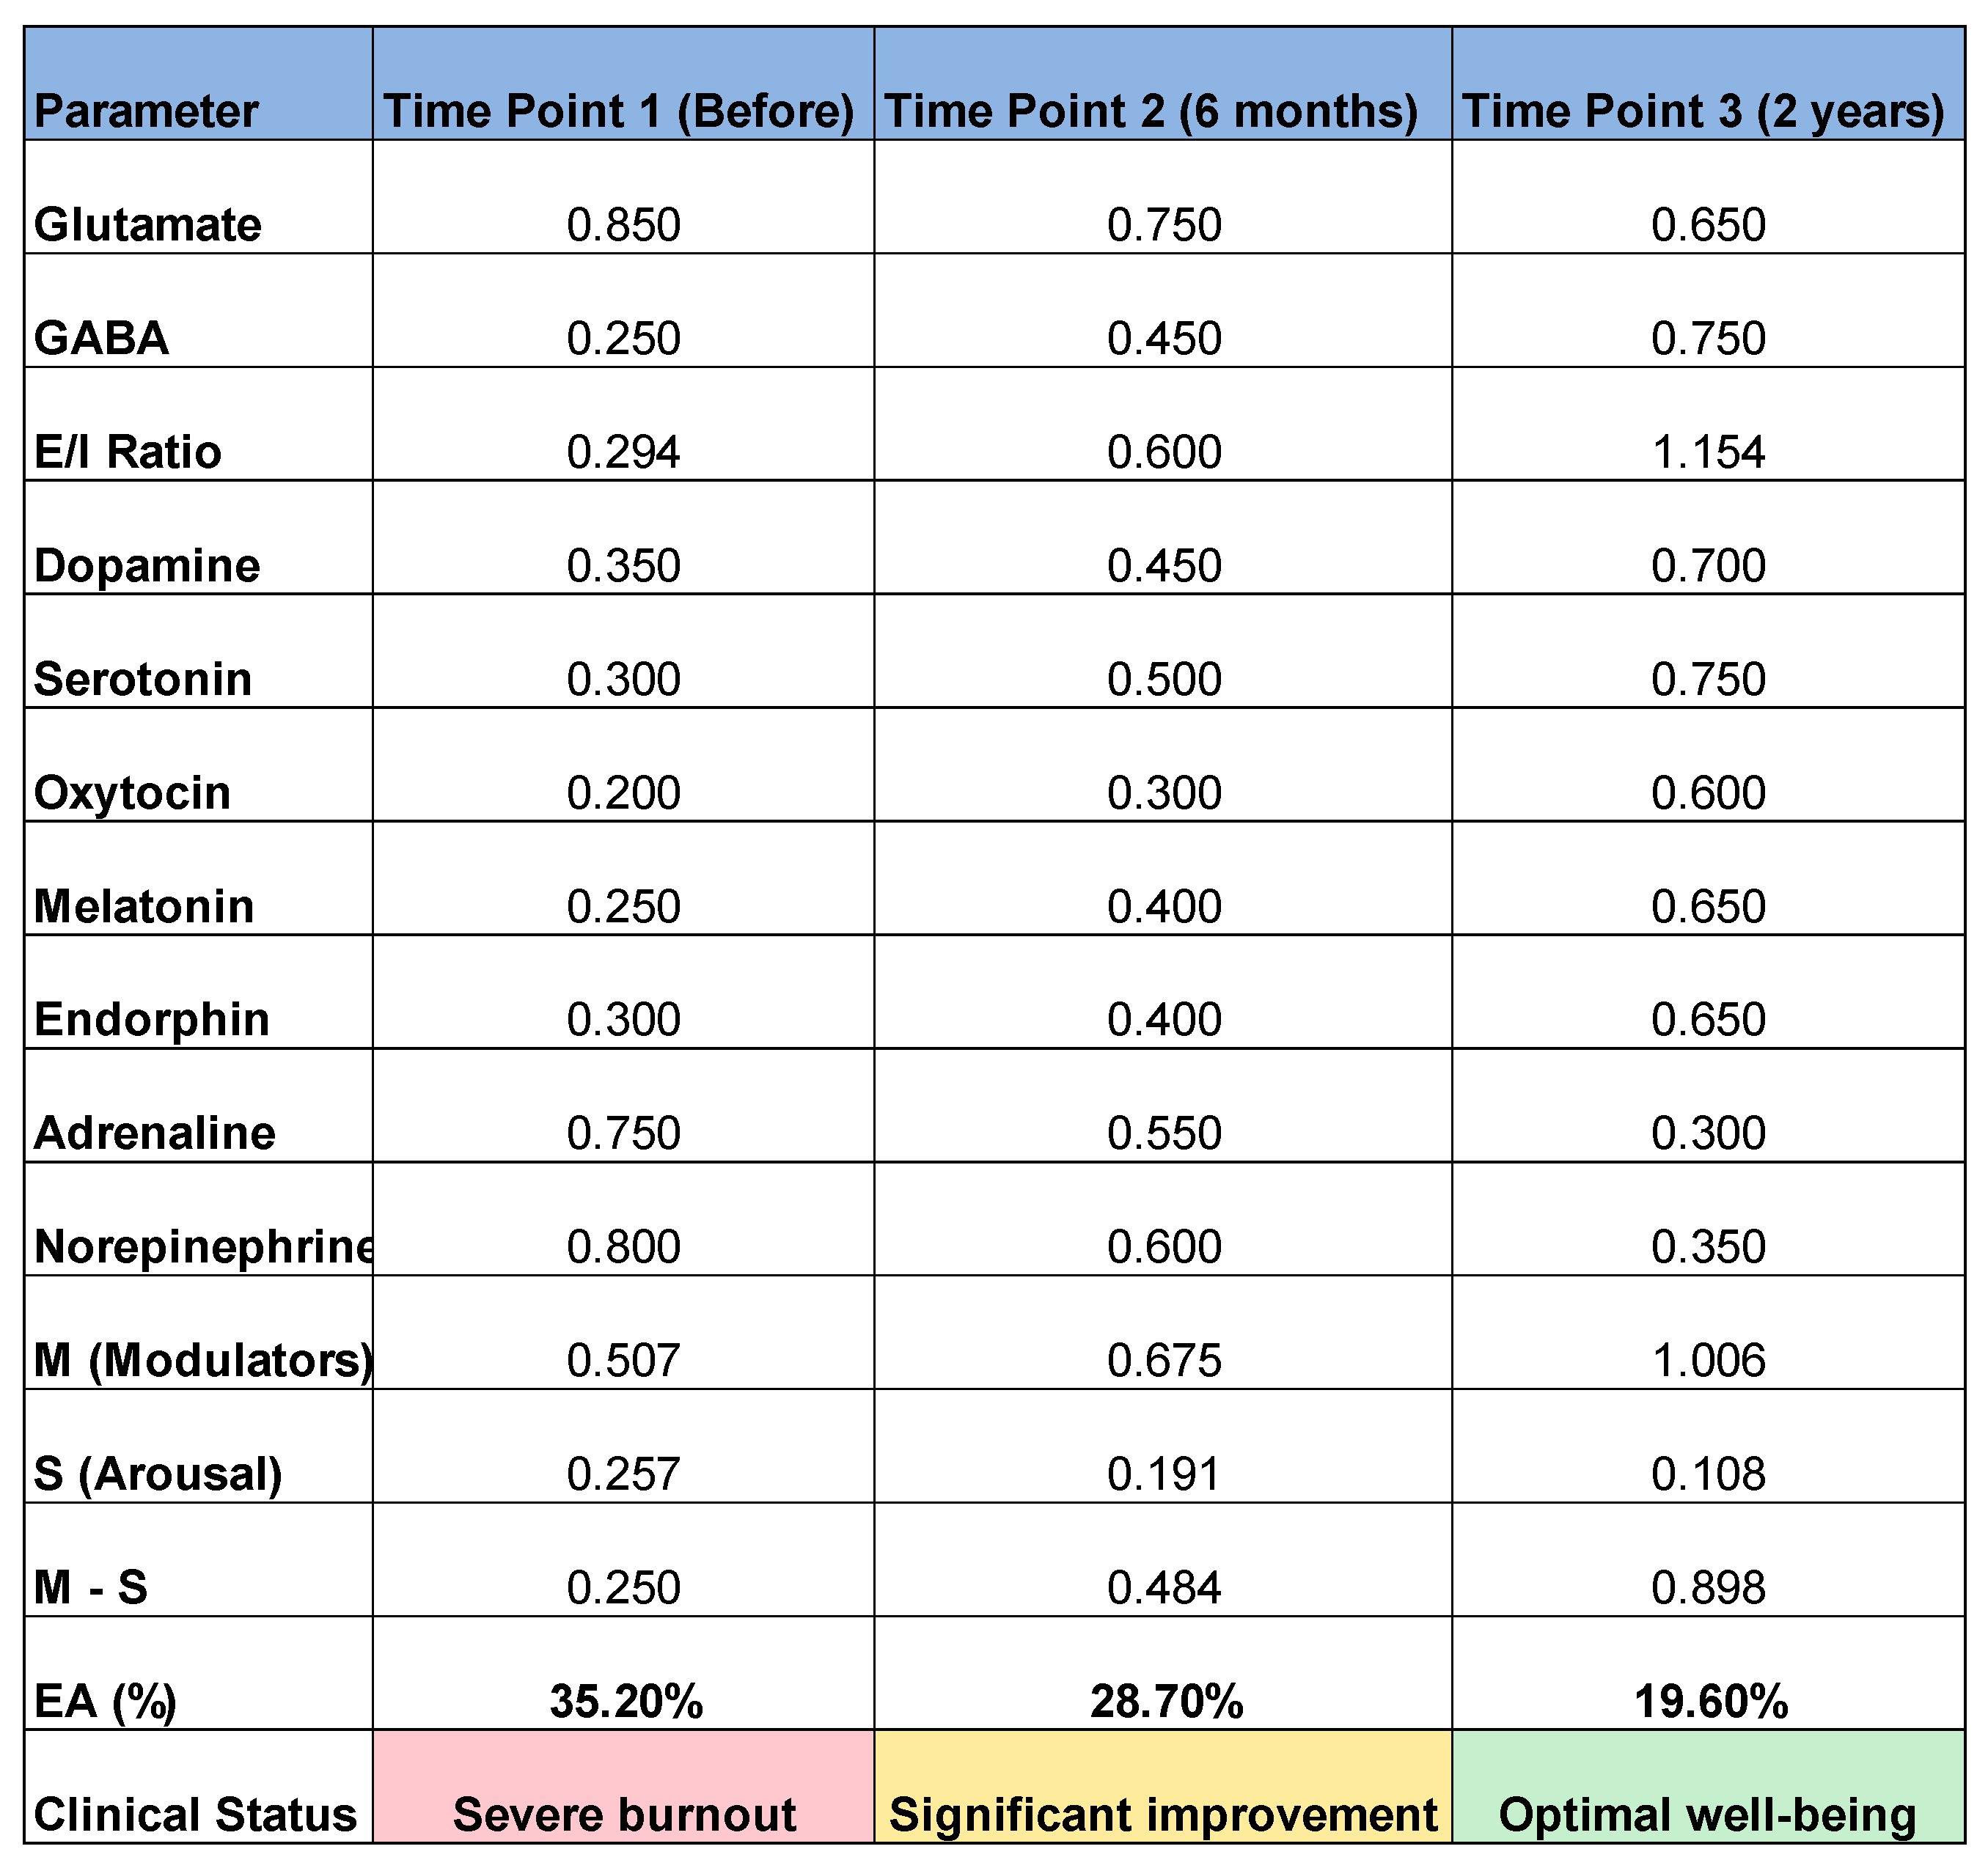
The equation then reveals that “appearing less autistic” = well-being; patient “P” is less visibly autistic at age 42 than at age 40, and his life has radically improved due to the following factors:
- Stopped wasting energy on masking
- Optimized modulating neurotransmitters
- Reduced chronic arousal
The autism () remained constant. What changed was the patient’s relationship with himself and with the environment.
Limitations of the Current Model
Limitations presented by the Current Model
A) Unimodal Simplification
The sigmoid function presupposes a monotonic relationship between and . However, subtypes of ASD may require:
- Bimodal functions: to capture profiles traditionally labeled as “low-functioning” vs. “high-functioning”
- Mixture models: Representing subgroups with distinct neurochemical dynamics.
Future proposal: Implement Gaussian Mixture Models (GMM) for identifying phenotypic clusters.
B) Invariability of
The current model treats (genetic basis) as constant. However, epigenetic factors can modulate gene expression:
- DNA methylation in SHANK3 and MECP2 genes
- Histone modifications in response to the environment
- Long-term plasticity (LTP/LTD)
Future proposal: Model as a time-dependent function.
Where represents the magnitude of epigenetic modulation and the rate of change.
C) Absence of Inflammatory Markers
Growing evidence points to the role of neuroinflammation in ASD:
- Elevation of pro-inflammatory cytokines (, )
- Chronic microglial activation
- Blood-brain barrier dysfunction
Future proposal: Add the term ψ (inflammation) to the equation:
D) Static vs. Dynamic Model
The current equation is a temporal “snapshot .” To capture developmental trajectories, a system of differential equations would be necessary.
Future proposal: Implement a dynamic model with:
- Ordinary differential equations ( ODEs )
- Simulation of therapeutic interventions over time
- Prediction of individualized trajectories
Future Directions
- Validation in pediatric cohorts (2-12 years) to test generalization.
- Integration with wearable data (heart rate, skin conductance) for continuous monitoring of
- Development of a clinical application for personalized calculation and intervention suggestions.
- Longitudinal neuroimaging studies correlating changes in and with structural alterations (gray matter volume, synaptic density)
Conclusion
The mathematical formulation presented in this work proposes a novel synthesis between consolidated neurobiological foundations and analytical methods typical of computational modeling in neuroscience. By integrating dopamine, serotonin, melatonin, oxytocin, norepinephrine, endorphins, GABA, and adrenaline into a single sigmoidal framework , the model demonstrates that the phenotypic expression of autism is not a direct reflection of genetic makeup, but rather the dynamic result of the interaction between neurochemical modulation, autonomic arousal, and neural plasticity. This perspective shifts the focus from the often misinterpreted idea of an “autism level” to a more refined understanding of how neurophysiological states regulate behavioral manifestations throughout life.
The proposed equation provides a conceptual tool for understanding frequently observed clinical phenomena, such as chronic masking, increased authenticity after late diagnosis, and behavioral transformations resulting from interventions that improve emotional stability, sensory regulation, and self-regulation. Furthermore, by explicitly stating the relative contribution of each neurotransmitter system, the model paves the way for future investigations that seek to empirically validate these functional weights, explore developmental trajectories, and examine how environmental contexts modulate phenotypic expression.
Although the model is robust in its theoretical foundation, it also acknowledges limitations inherent in the mathematical simplification of complex phenomena. Future investigations could expand its accuracy by incorporating longitudinal data, more detailed interindividual variations, nonlinear neural network modeling, or integrations with functional neuroimaging. Even so, as an initial formal framework, the equation contributes to a more integrated and quantitative view of autism, bringing neuroscience, psychology, and computational science closer together in a coherent and translational way.
In short, this work offers not just an equation, but a new way of understanding ASD as a dynamic system in which genetics, neurochemistry, and experience interact to shape observable behavioral expression. It is an invitation to rethink autism not as a fixed state, but as a modulated, adaptive, and profoundly human trajectory.
References
- ASHWOOD, P. et al. Elevated plasma cytokines in autism spectrum disorders provide evidence of immune dysfunction and are associated with impaired behavioral outcome. Brain, Behavior, and Immunity, [sl], v. 25, no. 1, p. 40-45, 2011. [CrossRef]
- BOUVARD, MP et al. Evidence for dysregulated endogenous opioids in ASD. Biological Psychiatry, [sl], v. 37, no. 11, p. 770-779, 1995. [CrossRef]
- CARLSSON, ML Hypothesis: is infantile autism a hypoglutamatergic disorder? Relevance of glutamate-serotonin interactions for pharmacotherapy. Journal of Neural Transmission, [sl], v. 105, p. 525-535, 1998. [CrossRef]
- CHUGANI, DC et al. Whole blood serotonin levels in autism spectrum disorder: a systematic review. Journal of Autism and Developmental Disorders, [sl], v. 44, p. 2060-2063, 2014. [CrossRef]
- COGHLAN, S. et al. Altered GABAergic signaling in autism spectrum disorders. Frontiers in Human Neuroscience, [sl], v. 6, p. 200, 2012. [CrossRef]
- ECKER, C. The neurobiology of autism: structural brain alterations and connectivity. Brain, Oxford, vol. 140, no. 1, p. 205-227, 2017. [CrossRef]
- FRISTON, K. A theory of cortical responses. Philosophical Transactions of the Royal Society B: Biological Sciences, London, vol. 360, n. 1456, p. 815-836, 2005. [CrossRef]
- FRISTON, K. The free-energy principle: a unified brain theory? Nature Reviews Neuroscience, London, vol. 11, no. 2, p. 127-138, 2010. [CrossRef]
- FUJIYOSHI, K. et al. Multimodal prediction of autism spectrum disorder diagnosis using plasma metabolites and machine learning. JAMA Network Open, [sl], v. 5, no. 12, e2248981, 2022. [CrossRef]
- GESCHWIND, DH; LEVITT, P. Autism spectrum disorders: developmental disconnection syndromes. Current Opinion in Neurobiology, [sl], v. 17, no. 1, p. 103-111, 2007. [CrossRef]
- GORDON, I. et al. Oxytocin enhances brain function in children with autism. PNAS - Proceedings of the National Academy of Sciences, [sl], v. 110, no. 52, p. 20953-20958, 2013. [CrossRef]
- GRINGRAS, P. et al. Melatonin in children with autism spectrum disorders: endogenous and pharmacokinetic studies. Sleep Medicine, [sl], v. 22, p. 10-14, 2016. [CrossRef]
- HIRSTEIN, W. et al. Autonomic nervous system arousal and sensory sensitivity in ASD. Brain and Cognition, [sl], v. 65, no. 3, p. 267-274, 2007. [CrossRef]
- HORDER, J. et al. Glutamate and GABA in autism spectrum disorder—a translational magnetic resonance spectroscopy study in man and rodent models. Translational Psychiatry, [sl], v. 8, p. 106, 2018. [CrossRef]
- HULL, L. et al. Development and validation of the Camouflaging Autistic Traits Questionnaire (CAT-Q). Journal of Autism and Developmental Disorders, [sl], v. 49, p. 819-833, 2019. [CrossRef]
- HUTT, J.; HOSEIN, A.; GHANIZADEH, A. The arousal regulation model of autism spectrum disorder. Neuroscience & Biobehavioral Reviews, Oxford, vol. 73, p. 1-20, 2017. [CrossRef]
- KLABUNDE, M. et al. Arousal and ASD: a systematic review of autonomic reactivity. Journal of Autism and Developmental Disorders, [sl], v. 45, p. 3075-3086, 2015. [CrossRef]
- LIVINGSTON, LA et al. Quantifying compensatory strategies in adults with and without diagnosed autism. Molecular Autism, [sl], v. 11, p. 15, 2020. [CrossRef]
- MCKAY, M.D.; BECKMAN, RJ; CONOVER, WJ A comparison of three methods for selecting values of input variables in the analysis of output from a computer code. Technometrics, [sl], v. 42, no. 1, p. 55-61, 2000. [CrossRef]
- MEHLER, MF; PURPURA, DP The locus coeruleus–noradrenergic system in autism spectrum disorder. Brain Research, [sl], v. 1642, p. 149-156, 2016. [CrossRef]
- MINSHAWI, NF et al. Pain reactivity and opioid modulation in autism spectrum disorder. Neuroscience & Biobehavioral Reviews, [sl], v. 51, p. 1-10, 2015. [CrossRef]
- MULLER, CL et al. Serotonin in autism spectrum disorder: from biomarker to treatment. Neuroscience & Biobehavioral Reviews, [sl], v. 55, p. 1-24, 2015. [CrossRef]
- NARAYANAN, A. et al. Altered striatal dopamine in autism spectrum disorder. Molecular Psychiatry, [sl], v. 22, no. 11, p. 1512-1512, 2017. [CrossRef]
- NELSON, SB; VALAKH, V. Excitation–inhibition imbalance in autism. Neuron, [sl], v. 87, no. 4, p. 684-698, 2015. [CrossRef]
- PAVAL, D. Dopaminergic contributions to autism spectrum disorder. Brain Research, [sl], v. 1664, p. 1-10, 2017. [CrossRef]
- RUBENSTEIN, JLR; MERZENICH, MM Model of autism: increased ratio of excitation/inhibition in key neural systems. Genes, Brain and Behavior, [sl], v. 2, no. 5, p. 255-267, 2003. [CrossRef]
- SALTELLI, A. et al. Variance based sensitivity analysis of model output. Design and estimator for the total sensitivity index. Computer Physics Communications, [sl], v. 181, no. 2, p. 259-270, 2010. [CrossRef]
- SAPEY-TRIOMPHE, L. et al. Cortical GABA levels and sensory over-reactivity in autism spectrum disorder. NeuroImage, [sl], v. 204, p. 116183, 2019. [CrossRef]
- SINHA, P. et al. Autism as a disorder of prediction. Nature Neuroscience, [sl], v. 17, no. 11, p. 1431-1433, 2014. [CrossRef]
- TORDJMAN, S. et al. Sleep disturbances in autism spectrum disorder: role of melatonin. Journal of Autism and Developmental Disorders, [sl], v. 45, p. 3060-3074, 2015. [CrossRef]
- UDDIN, LQ Salience network dysfunction in autism spectrum disorder: a predictive coding perspective. Neuroscience & Biobehavioral Reviews, Oxford, vol. 52, p. 1-15, 2015. [CrossRef]
- VARGAS, DL et al. Neuroglial activation and neuroinflammation in the brain of patients with autism. Annals of Neurology, [sl], v. 57, no. 1, p. 67-81, 2005. [CrossRef]
- YOUNG, L.J.; BARRETT, CE Oxytocin and autism spectrum disorders: a review. Journal of Neuroendocrinology, [sl], v. 22, no. 11, p. 1130-1135, 2010. [CrossRef]
- ZHENG, Z. et al. Altered glutamate and GABA concentrations in autism spectrum disorder: a meta-analysis of ¹H-MRS studies. Molecular Psychiatry, [sl], v. 27, no. 3, p. 1846-1856, 2022. [CrossRef]
Disclaimer/Publisher’s Note: The statements, opinions and data contained in all publications are solely those of the individual author(s) and contributor(s) and not of MDPI and/or the editor(s). MDPI and/or the editor(s) disclaim responsibility for any injury to people or property resulting from any ideas, methods, instructions or products referred to in the content. |
© 2026 by the authors. Licensee MDPI, Basel, Switzerland. This article is an open access article distributed under the terms and conditions of the Creative Commons Attribution (CC BY) license (http://creativecommons.org/licenses/by/4.0/).
Copyright: This open access article is published under a Creative Commons CC BY 4.0 license, which permit the free download, distribution, and reuse, provided that the author and preprint are cited in any reuse.


