
Submitted:
02 February 2026
Posted:
03 February 2026
You are already at the latest version
Abstract
Like other agricultural products, food legumes production faces uncertainty risks stemming from climate change, which may affect yields and consequently impact farmers' livelihoods. Agricultural insurance serves as one of the climate change adaptation measures available to farmers, helping mitigate the impacts of climate change on agricultural production and livelihoods. Based on a survey of 460 food legumes farmers in Baicheng City, Jilin Province of China, this study employs a binary probit regression model to analyze how perceptions of climate change influence farmers' adoption of agricultural insurance as an adaptation measure. Robustness tests are conducted by using a replacement econometric model and altering the climate change perception variable. Results indicate that food legumes farmers' perceptions of climate change significantly influence their agricultural insurance purchasing behavior. Farmers who perceive lower temperatures and more severe frosts are more inclined to purchase agricultural insurance. Participation in food legumes production cooperatives and prior experience with yield reductions exert significant positive effects on insurance purchase decisions. Therefore, enhancing climate change awareness campaigns, establishing meteorological risk defense mechanisms, and leveraging the driving role of cooperative organizations hold positive implications for reducing farmers' exposure to climate change risks.
Keywords:
climate change
; perception
; food legumes
; agricultural insurance
; adaptation measures
1. Introduction
Food legumes refer to various leguminous crops, excluding soybeans and peanuts, primarily cultivated for harvesting dry or fresh seeds. They are mainly grown in impoverished regions of Northeast, North, Northwest, and Southwest China characterized by harsh ecological environments and scarce water resources. Due to their exceptional adaptability, unique nutritional value, health benefits, and effective nitrogen-fixing capabilities, they align with the agricultural production principle of “one control, two reductions, and three fundamentals”. They are ideal crops for developing grain-legume rotation systems and promoting organic dryland farming tailored to local conditions. They play a vital role in addressing food security in remote, underdeveloped, and ethnic minority regions, ensuring income growth for farmers and herders in remote areas, improving dietary structures for the general population, and preserving agricultural diversity (Chen et al. 2021). The 2019 Central Document No. 1 emphasized accelerating the development of distinctive rural industries, promoting diverse specialty industries tailored to local conditions, advocating for “one village, one product” and “one county, one industry,” and actively developing the coarse grain and pulse sector. The China Food and Nutrition Development Outline (2021–2035) encourages residents to improve their nutritional intake by consuming more grains and legumes. Rising living standards and consumption levels have driven new demand for plant-based proteins and healthy foods, fueling sustained growth in food legumes production and consumption. This trend is powerfully propelling the development of minor grain and bean industries, with promising prospects for the food legumes sector.
However, agriculture is a vulnerable sector, and the catastrophic impacts of climate change and its associated meteorological risks are occurring with increasing intensity and frequency. China's National Climate Change Adaptation Strategy to 2035 states that agricultural production is profoundly affected by climate change. Existing agricultural resource endowments and the nation's large population amplify natural risks to agricultural production while causing climate risks to exhibit distinct clustering characteristics and chain reactions. This deepens the contradiction between the severe climate change situation and the objective need for stable and high agricultural yields. Therefore, enhancing farmers' climate change adaptation capacity holds significant importance for consolidating poverty alleviation achievements and comprehensively advancing rural revitalization. The IPCC Sixth Assessment Report identifies agricultural insurance as a key adaptation strategy. According to the China Regulations on Agricultural Insurance, this insurance involves insurers providing compensation for property losses incurred by policyholders during agricultural production due to specified natural disasters, accidents, epidemics, or diseases covered under the policy. Current agricultural insurance products primarily include yield insurance, price insurance, income insurance, and index insurance. As a market-based risk management tool, agricultural insurance plays a vital role in mitigating agricultural disaster risks, safeguarding producers' interests, and promoting the sustainable development of modern agriculture.
The practice of agricultural insurance in China in the modern sense began with the introduction of Western insurance concepts in the early 20th century, marked by initiatives such as the oxen mutual cooperative insurance in He County, Anhui Province in 1934 and the Beibei Livestock Insurance Society in Chongqing in 1939. However, for a considerable period, agricultural insurance developed slowly due to high operating costs, significant risks, and a lack of fiscal support. A historic turning point occurred in 2004 when China explicitly called for “accelerating the establishment of the policy-based agricultural insurance system.” In 2007, the central government formally launched a pilot program for agricultural insurance premium subsidies, targeting five crop varieties including corn and rice in six provinces and regions such as Jilin, Inner Mongolia, and Xinjiang. This marked China's entry into a phase of rapid policy-driven development characterized by government guidance and fiscal subsidies. Subsequently, each year's Central Document No. 1 has outlined plans for agricultural insurance development, driving continuous improvements to its institutional framework. In 2013, the implementation of the Regulations on Agricultural Insurance placed the sector on a standardized, law-based development track. In 2019, the Guiding Opinions on Accelerating High-Quality Development of Agricultural Insurance were issued, further clarifying its direction toward enhancing quality and efficiency while serving modern agriculture. After years of expanding coverage, increasing product types, and raising standards, a comprehensive protection network has now been established. This network centers on the three major grain crops (rice, wheat, corn) and has gradually extended to important agricultural products such as soybeans and oilseeds. While solidifying the foundation of food security, the scope of agricultural insurance services is accelerating its expansion from traditional bulk agricultural products to locally advantageous specialty crops, driven by the establishment of a broader food security perspective and the depth of agricultural supply-side structural reforms. This represents not only an inherent requirement for expanding coverage, increasing product offerings, and raising coverage standards, but also a key measure for boosting farmers' incomes and serving the revitalization of rural industries. The development history of China's agricultural insurance is summarized in Table 1.
As a major mung bean production area in China, Jilin Province accounts for approximately 10-33% of the national output (see Figure 1). Baicheng mung beans from Jilin Province are characterized by large, plump seeds, bright color, and high protein content. They are recognized as a national geographical indication product in China. Mung bean cultivation has become a significant source of income for farmers in Baicheng City and a primary means of poverty alleviation and prosperity (Zhang et al. 2012). From 2012 to 2024, Baicheng City in Jilin Province exhibited a slight upward trend in annual average temperature (see Figure 2), while annual precipitation showed significant fluctuations (see Figure 3). Reviewing Jilin's history of severe droughts and the increasingly prominent flood risks in recent years (see Table 2), it is evident that these factors directly impact mung bean yield stability and farmers’ income. To better address climate risks and safeguard agricultural production, the critical value of agricultural insurance has become increasingly prominent. However, there is currently no unified mandatory policy for food legumes insurance nationwide. Instead, local governments independently explore such programs. Insurance for mung beans and other minor grains and pulses falls under the category of locally advantageous specialty agricultural product insurance and is not included in central government premium subsidies. Jilin's bean insurance centers on soybeans as the core insured crop, extending coverage to mung beans and other minor grains and pulses. It incorporates nationally unified policies like comprehensive cost insurance, while some regions also adopt innovative insurance-plus-futures models. Farmers contribute 25% of the premium, with the government providing a 75% subsidy. As one of Jilin Province's first pilot cities for policy-based agricultural insurance, Baicheng City has insured corn, rice, soybeans, sunflower seeds, and peanuts since 2007. However, farmers bear the risk for food legumes like mung beans they cultivate. In 2017, Baicheng City first included coarse grains and pulses in its local specialty insurance subsidy program. The provincial government adopted a subsidy-replacement approach, covering up to 60% of the actual burden borne by county governments in impoverished counties and 50% in non-impoverished counties. Food legumes like mung beans were explicitly designated as key support targets. That same year, Anhua Agricultural Insurance Company insured 920,000 mu (approximately 61,333 hectares) of specialty coarse grain and pulse crops. Therefore, this study examines whether climate change perception influences the adoption of agricultural insurance adaptation measures among 460 food legumes farmers in Baicheng City, Jilin Province, and investigates the response relationship between the two. The findings aim to provide policy insights for addressing climate change risks and promoting agricultural insurance.
2. Literature Review
2.1. The Concept and Measurement of Farmers’ Perception on Climate Change
Farmers’ perception on climate change refers to the their understanding, cognition and intuitive judgement of climate change (Lü and Chen 2010). In China, most rural populations perceive climate change through three channels: daily activities, production activities, and observation of natural phenomena. This perception plays a crucial role in adjusting agricultural production and enhancing economic efficiency (Yun et al. 2009). Accurate perception of climate change by farmers translates into adaptive decision-making for farm households. This may involve effectively leveraging climate-related benefits for agricultural production, timely mitigation of climate-induced risks, or reducing adverse impacts of natural disasters on farming, thereby promoting sustainable agricultural production and household livelihoods (Zhao and Xue 2016). However, due to individual objective influences, the outcomes of such perceptions carry inherent uncertainty. Cui et al. (2012) found through empirical surveys that most agricultural practitioners exhibit significant deficiencies in perceiving climate evolution patterns, with their subjective judgments often diverging markedly from statistical results derived from meteorological observations. Yun et al. (2009) further noted that while public perceptions of temperature changes generally align with measured data, discrepancies still exist. When precipitation exhibits large short-term fluctuations, the average perceived intensity of temperature changes tends to exceed that of precipitation. Chang et al. (2012) also noted that while awareness of climate change adaptation has been preliminarily established among policymakers and grassroots communities, the public's perception framework remains characterized by weak foundations and insufficient scientific basis. Rahman et al. (2023) specifically highlighted that agricultural populations' understanding of climate variability mechanisms often remains superficial.
Perceptions of climate change encompass two distinct dimensions: awareness of general climate variations such as temperature and precipitation, and recognition of extreme climate events like droughts and frosts. General climate changes are gradual in nature (Schlenker and Roberts 2009). They directly impact crop physiological activities and phenological development, manifesting through long-term cumulative effects such as adjustments in crop planting structures, changes in water resource utilization, and increased pest and disease incidence (Liu et al. 2025). Farmers can mitigate risks by adjusting production factors such as adopting drought-tolerant varieties, improving irrigation techniques, and optimizing fertilizer and labor inputs, which may lead to underestimating their severity (Deressa et al. 2009). Extreme climate events, however, occur rapidly and are characterized by unpredictability and suddenness (Liu 2023). They directly impact crop growth and yields, causing agricultural economic losses (Fu et al. 2023). Jose and Ruben (2023) highlighted that extreme events like droughts are sudden and unpredictable, leading to abrupt yield declines or total crop failure. Farmers struggle to mitigate such risks through preemptive measures, making insurance demand more pronounced in these scenarios.
There are primarily three methods for measuring climate change perceptions: questionnaire surveys and scales, participatory rural appraisals, and behavioral inference. First, questionnaire surveys and scales are divided into direct perception measurement and Likert scale quantification. Direct perception measurement involves structured questionnaires asking farmers for their intuitive judgments on climate change, such as “Has rainfall decreased over the past decade?” or “Has the frequency of extreme weather events increased?” (Chu 2024). Likert scale quantification employs 5-point or 7-point scales to assess the intensity of farmers' perceptions regarding the severity of climate change. For instance, in their Bangladesh study, Kabir et al. (2017) asked farmers to rate “frequency of droughts” and “risk of market price fluctuations” on a 1-5 scale, constructing a risk matrix to visualize different risk scenarios. Second, participatory rural appraisal involves group interviews. In studies of agro-pastoral transition zones, Bian and Song (2014) facilitated collective discussions among farmers through core group interviews to rank the perceived impacts of climate change phenomena. They found that farmers in Yanchi County, Ningxia, ranked precipitation and temperature changes in alignment with meteorological observation trends. Third, behavioral inference methods, which reverse-engineer perceptions from adaptive behaviors. By examining farmers' adopted adaptation measures such as altering planting times or adopting drought-tolerant varieties, researchers can indirectly infer the intensity of their climate risk perceptions (Feng 2017). Based on this, this study adopts Chu's (2024) measurement method for climate change perception. A structured questionnaire asks farmers about their intuitive judgments on climate change, such as “Has the local average temperature/precipitation changed over the past five years?” and “Has the severity of local droughts/frosts changed over the past five years?” The response options are set as “1 = increased; 2 = unchanged; 3 = decreased” and "1 = worsened; 2=unchanged; 3=lessened," thereby measuring farmers' climate change perceptions.
2.2. Climate Change Adaptation Measures
Climate change adaptation measures refer to the various adjustments and behavioral choices adopted by farmers to cope with extreme weather and climate events and their associated risks in the background of climate change (Wang et al. 2022). Hou et al. (2018) categorized farmers' adaptation measures into three types. The first is productive adaptation measures, which involve strategies to increase agricultural inputs and protective measures based on existing practices. Examples include adjusting crop planting times, increasing fertilizer and pesticide application rates, changing crop varieties, enhancing irrigation, actively utilizing fallow land after harvest, and adopting new technologies (Below et al. 2010; Hou et al. 2018), and implementing water conservation measures like plastic mulching, straw mulching, and artificial grass planting (Feng et al. 2017; Wang 2022; Gao et al. 2025). Second, livelihood adaptation measures involve supplementing existing land income through alternative income sources, such as off-season labor, expanding crop cultivation scale, acquiring relevant agricultural skills (Hou et al. 2018), and diversifying income streams (Smit and Skinner 2002). Third, protective adaptation measures aim to enhance resilience against agricultural losses caused by climate variability, such as accessing agricultural loans or purchasing crop insurance (Smit and Skinner 2002; Wang 2022; Feng et al. 2024). Wheeler et al. (2013) further categorized farmer adaptation measures into expansionary measures (e.g., acquiring land or water rights, increasing irrigated areas), adjustment measures (e.g., improving irrigation facilities and management systems, planting water-efficient crops), and contractionary measures (e.g., selling land, reducing irrigated areas, selling water rights). Lü and Chen (2010) found that farmers in Dezhou City of Shandong Province of China, primarily adopted passive adaptation measures such as adjusting farming schedules, increasing inputs, and irrigation, supplemented by active adaptation measures like crop variety adjustment, infrastructure construction, new technology adoption, and improvement of the ecological environment around farmland.
Farmers are influenced by various factors when selecting adaptation measures. Derssa et al. (2009) noted that education level, gender, age, household head health status, climate information, and social capital all affect farmers' choice of climate change adaptation measures. Lack of adaptation information and financial constraints are two major barriers hindering adaptation efforts. Wu (2015) found that factors such as household head gender, years of education, income structure, cropping scale, meteorological information, and agricultural technical services significantly influence farmers' climate change adaptation behaviors. Bryan et al. (2009) identified farmers' agricultural experience, socioeconomic status, availability of technology extension services, and access to credit services as primary influencing factors. Liu et al. (2018) examined factors influencing farmers' willingness to pay for agricultural insurance. They concluded that individual or household characteristics such as gender, education level, household income, and number of dependents, along with factors like the amount of cultivated land and disaster experience, significantly affect farmers' willingness to purchase agricultural insurance. Among farmers in Wuhu and Tongling, Anhui Province of China, the more severe the disaster losses, the greater the likelihood of purchasing weather index insurance (Meng 2018). Furthermore, climate change perception is considered a key factor influencing farmers' adaptation decisions. Grothmann and Patt (2005) proposed a social cognitive model of individual proactive adaptation to climate change from a cognitive perspective, indicating that climate change perception is a crucial determinant of whether farmers take adaptation actions. Chen and Hu (2023) similarly argued that climate change perceptions, combined with farmer education levels, farming experience, farm size, and household income, collectively influence adaptation decisions. Sérès (2010) observed that Zambian farmers' selection of extreme climate adaptation measures correlates with their perceived intensity of climate change. Wheeler et al. (2021) found that farmers in the southern Murray-Darling Basin who were more likely to perceive climate change risks tended to make lower-risk agricultural production decisions and engage in more climate adaptation behaviors. Shang et al. (2020) further indicated that higher levels of climate risk perception among farmers correlate positively with their willingness to adopt risk management tools.
2.3. The Impact of Climate Change Perception on Farmers' Adoption of Adaptation Measures
Existing research suggests that farmers' perceptions of climate change, serving as the foundation for adaptive behaviors, will drive climate change adaptation actions. Most scholars typically employ empirical models such as binary logit models, binary probit models, and multinomial logit models to validate and analyze the relationship between these two factors. For instance, Li et al. (2013) used a probit model to analyze that the stronger the perceptions of extreme climate impacts among farmers and herders, the more inclined they are to adopt adaptive behaviors. Kurukulasuriya (2007) employed a multinomial logit model to examine farmers' crop selection responses to climate change, revealing that crop choice behavior is highly sensitive to climate variability. Wang et al. (2016) used a multinomial logit regression model to quantitatively analyze factors influencing farmers' adaptation strategy selection, finding that deeper perceptions of extreme climate impacts correlate with greater adoption of adaptation behaviors such as livestock sales, intensive farming, and seasonal migration. Zhao et al. (2016) employed a binary logit model to investigate that perceptions of climate change exert a significant positive influence on farmers' adoption of variety improvement and out-migration measures. Moreover, farmers' climate change perceptions exhibit notably differential impacts on their adoption of various adaptive behaviors. Feng et al. (2016) employed logit and mlogit models to examine factors influencing apple growers' adaptation to drought. Results indicated that growers' perception of drought severity and household participation in cooperatives positively influence the adoption of preventive adaptation strategies. Gao et al. (2025) analyzed factors influencing climate adaptation behaviors among apple growers using a binary logit model. They found that both perceptions of climate change conditions and perceptions of its impacts negatively affect the adoption of technology-oriented adaptation behaviors. Regarding adaptive measures like purchasing agricultural insurance, Wang et al. (2022) employed a probit model to analyze how climate change perceptions among food legumes farmers in Shanxi and Jiangsu influenced their willingness to buy weather index insurance. They found that stronger perceptions of abnormal average temperatures, rainfall, and drought disasters correlate with higher insurance purchase probabilities. Chen and Hu (2023) employed a logit model to reveal that peach growers perceiving increased frequency of extreme weather events exhibit higher probability of purchasing crop insurance. Du (2011) utilized a binary logit model to demonstrate a significant positive correlation between farmers' perception of agricultural risks and their demand for agricultural insurance. Li et al. (2017) analyzed factors influencing farmers' demand for weather index insurance through logit regression models, indicating that Heilongjiang farmers exhibit stronger insurance willingness when they perceive clearer correlations between weather events and crop yields. McCarthy (2003) employed a probit model to compare payment willingness for rainfall index insurance across four regions in Morocco, revealing that farmers exhibit greater willingness to purchase insurance as the risks they face increase.
In summary, Numerous scholars have investigated farmers' perceptions of climate change and their adaptive behaviors. Key areas of focus include farmers' understanding of climate change, the adaptive actions they undertake and their influencing factors, as well as the impact of climate change perceptions on the adoption of adaptive measures. However, most studies have concentrated on adaptive measures related to production practices, with limited quantitative research on how climate change perceptions influence farmers' adoption of adaptive measures such as purchasing agricultural insurance. Additionally, studies at the micro-level have rarely examined food legumes farmers. Therefore, based on a survey of food legumes farmers in Baicheng City, Jilin Province, this paper examines the impact of climate change perceptions on the adoption of agricultural insurance as an adaptation measure among food legumes farmers.
3. Data Source and Sample Description
3.1. Description of Baicheng City's Climate Characteristics
Baicheng City is located in the heart of the Songnen Plain, with soil composed of Quaternary Tao'er River alluvial deposits. The topsoil predominantly consists of chestnut calcareous soil and sandy loam, making it exceptionally suitable for mung bean production and cultivation. The region boasts abundant light and heat resources, with a frost-free period of 125–140 days, annual sunshine hours of 2,960, and effective accumulated temperature≥10°C reaching 2,900-3,100°C. The daily temperature variation of 14–15°C during August and September facilitates nutrient accumulation in crops. The dry autumn climate further enhances mung bean drying and color development, improving overall quality.
Research by Yu et al. (2019) indicates that Baicheng City has experienced significant climate change over the past two decades, with markedly rising temperatures and an increasing trend in high-temperature days. Precipitation shows a linear decrease, while the maximum consecutive rainfall duration has extended. Baicheng Station recorded the highest number of frost days, decreasing from northwest to southeast. Localized torrential rains frequently occur across all regions.
3.2. Data Source
This study employed stratified random sampling in 2018 and 2019 to select survey participants from food legumes farmers in Baicheng City, Jilin Province of China. Field surveys were conducted across 19 townships in five counties within Baicheng City. To mitigate potential data biases arising from farmers' comprehension or illiteracy, the survey utilized one-on-one, face-to-face interviews with adult food legumes farmers possessing full cognitive and behavioral capacity. The questionnaire comprised four main sections: basic information on food legumes farmers, land management practices, food legumes cultivation techniques, market access services, and climate change issues. A total of 460 completed questionnaires were collected.
3.3. Sample Description
From the sample area distribution (Table 3), Da'an City has 30 households, accounting for 6.52% of the total sample; Taobei District has 41 households, accounting for 8.91% of the total sample; Taonan District has 146 households, accounting for 31.74% of the total sample; Tongyu County has 178 households, accounting for 38.7% of the total sample; and Zhenlai County has 65 households, accounting for 14.13% of the total sample.
From the sample characteristics (Table 4), male heads of households dominate food legumes cultivation, accounting for 98.48%. Among food legumes farmers, 367 individuals aged 35–59 constitute the primary age group, accounting for 79.78%. Educational attainment primarily consists of primary and junior high school levels, comprising 38.48% and 47.17% respectively. Household size predominantly ranges from 1 to 3 members, accounting for 58.26%. A significant proportion of households have annual incomes of 90,000 yuan or higher, representing 38.73%. The 2018 survey collects data from 233 households, while the 2019 survey collects data from 227 households.
4. Empirical Analysis
4.1. Model Specification
Whether food legumes farmers purchase agricultural insurance (Y) is influenced by factors such as their perception of climate change (X₁), individual characteristics (X₂), household characteristics (X₃), land management characteristics (X₄), and external environment (X₅). Since the dependent variable is a binary choice variable, a binary probit model is employed for analysis. The empirical model is:
Where represents the regress coefficient for each variable, denotes variables influencing food legumes farmers' agricultural insurance purchase decisions, and is the core independent variable in this study. Prob(=1) represents the probability of observing agricultural insurance purchase, and Φ denotes the cumulative distribution function of the standard normal distribution. Note that the coefficients from probit regression differ from those in OLS regression; marginal effects must be further calculated to determine the impact of X on Y.
4.2. Variable Definition and Description
Explained variable. Whether agricultural insurance is purchased.
Explanatory variable. Food legumes farmers' perception of climate change refers to their perception of four categories: changes in the average annual temperature over the past five years, changes in the average annual precipitation, the severity of drought, and the severity of frost.
Control variables. These encompass four categories: individual characteristics (age, education level), household characteristics (household size, total household income), operational characteristics (proportion of food legumes planting area relative to total cultivated land), and external environment (membership in food legumes production cooperatives, experience of yield reduction).
Specific variable definitions and descriptions are provided in Table 5. As shown in Table 5, 39% of food legumes farmers have purchased agricultural insurance. They perceive that the average annual temperature has risen over the past five years, average annual precipitation has decreased, and the severity of droughts and frosts has increased. Regarding individual characteristics, the average age of food legumes farmers is approximately 48.27 years, with an average education level of 7.96 years—equivalent to the second year of junior high school. For household characteristics, the average household size is 3 persons, and the average log of total household income is 11.09. In terms of operational characteristics, food legumes account for about 41% of cultivated land area. Regarding external conditions, 32% of food legumes farmers participate in production cooperatives, while 74% have experienced adverse weather during critical growing periods, resulting in reduced agricultural yields. The final column of Table 5 displays the variance inflation factor (VIF) values for each variable. All VIF values were below 10, with an average of 1.33, indicating no multicollinearity issues among the variables.
4.3. Empirical Results
This study employs STATA 17.0 statistical software to perform probit model regression. The mean variance inflation factor (VIF) is 1.33, indicating no multicollinearity issues among variables. The likelihood ratio test assesses model validity, yielding a p-value below 0.001 and an adjusted R-squared (R²) ranging from 0.258 to 0.416, confirming the constructed model's satisfactory fit. Since the regression coefficients of a binary probit model do not reflect the marginal effects of influencing factors, it is more reasonable to use the marginal probability dy/dx to represent the marginal impact of marginal changes in each explanatory variable on food legumes farmers' purchase of agricultural insurance. The probit model regression results are shown in Table 6. Columns (1) to (3) display the results of progressively adding more control variables, while Column (4) shows the marginal effects corresponding to the regression in Column (3).
Perception of Climate Change. Using column (3) as the baseline regression result, empirical evidence indicates that two climate change perception variables—Temperature and Frost, significantly influence food legumes farmers' purchase of agricultural insurance. The coefficient for perceived annual average temperature change is negatively significant at the 10% level. When food legumes farmers perceive a decrease in temperature, their probability of purchasing agricultural insurance increases by 5.8%. The coefficient for perceived frost severity is positively significant at the 1% level. When farmers perceive an increase in frost severity, their probability of purchasing agricultural insurance rises by 18.2%. Perceptions of annual average precipitation changes and drought severity do not significantly influence food legumes farmers' agricultural insurance purchases.
Individual Characteristics. Empirical results indicate that farmers' age and education level do not significantly affect insurance purchase decisions, likely because agricultural insurance is mandated by local industrial poverty alleviation policies.
Household Characteristics. Column (2) results indicate that the number of family members has a significant positive effect on food legumes farmers' insurance purchase, while total household income has no significant impact.
Operational Characteristics. The proportion of food legumes planting area relative to total cultivated land has a negative but insignificant effect on insurance purchase.
External Factors. Participation in food legumes production cooperatives and experiencing yield reductions significantly and positively influence food legumes farmers' purchase of agricultural insurance, both passing the 1% significance level test. When food legumes farmers join production cooperatives, their probability of purchasing agricultural insurance increases by 40.1%. If food legumes farmers experienced climate-induced yield reductions during critical growing periods in the past five years, their probability of purchasing agricultural insurance increases by 11.8%.
4.4. Robustness Test
Robustness test results are shown in Table 7. Column (5) presents the results of the probit model. Columns (6) and (7) replace the probit model with logit and OLS regression models, respectively, to test the robustness of the estimation results. Column (8) replaces the two perception variables—perceived drought severity(Drought) and perceived frost severity(Frost)—with the number of drought occurrences(Drought_2) and the number of frost occurrences(Frost_2), respectively. The logit and OLS models indicate that farmers' perceptions of annual average temperature changes and frost severity still significantly influence their agricultural insurance purchasing behavior, consistent with the probit model results. After replacing the two perception variables, perceptions of annual average temperature changes and frost occurrence frequency maintain consistent effects with the probit model. Results for other variables also align with the probit model findings. In summary, the empirical results of this study are relatively robust.
5. Conclusions and Discussion
5.1. Conclusions
This study employs a binary probit model to examine how food legumes farmers' perceptions of climate change influence their adoption of agricultural insurance as an adaptation measure. The analysis is based on questionnaire data collected from 460 food legumes farming households in Baicheng City, Jilin Province of China. Results indicate that farmers' perception on climate change significantly influence their agricultural insurance purchase behavior. Those perceiving lower temperatures and more severe frosts are more inclined to purchase insurance, while perceptions of precipitation changes and drought severity show no significant effect. Additionally, household size, membership in food legumes production cooperatives, and prior experience with yield losses exert significant positive effects on insurance purchase. Conversely, factors such as age, education level, total household income, and the proportion of food legumes acreage relative to total cultivated land show no significant influence on insurance adoption, potentially due to the policy-driven nature of agricultural insurance.
5.2. Discussion
Although this study empirically reveals the impact of climate change perceptions on the adoption of agricultural insurance by food legumes farmers, certain limitations exist in the research process. First, the sample is restricted to 460 food legumes farming households in Baicheng City, Jilin Province of China, representing a relatively limited coverage that may not fully reflect farmer behavior in other food legumes producing regions of China or under different climatic conditions. Second, the cross-sectional data approach makes it difficult to capture the dynamic evolution between farmers' perceptions and insurance purchasing behavior. Third, the measurement of climate change perceptions primarily relies on farmers' subjective perceptions, potentially introducing recall bias or social desirability bias. Fourth, although the model controlled for multiple variables, it may still have omitted certain potential influencing factors, such as farmers' risk attitudes, insurance product knowledge, and credit accessibility. Furthermore, agricultural insurance purchasing behavior may be influenced by external factors like local policy incentives and insurer promotion efforts, which are not fully incorporated into this study's analytical framework. Future research could expand the sample to include farmers from additional provinces, diverse climatic zones, and different crop types, conducting regional comparative analyses to test the generalizability of findings. Simultaneously, constructing panel data through multi-year tracking surveys would better identify the causal relationships and dynamic mechanisms linking climate change perceptions to insurance adoption behavior.
5.3. Recommendations
Through multi-channel and multi-format outreach and education, enhance food legumes farmers' awareness of climate change. Governments at all levels, rural communities, and public welfare organizations can utilize diverse methods (public service announcements, educational training, etc.) and channels (online/offline platforms, internet TV/mobile devices, books/brochures, etc.) to disseminate knowledge about the impacts of meteorological disasters and corresponding response measures. This will improve farmers' understanding of climate change, strengthen their risk management awareness, and optimize their adaptive behaviors in purchasing agricultural insurance.
Build a multi-stakeholder meteorological risk defense mechanism involving government, enterprises, and farmers to enhance food legumes farmers' capacity to respond to climate change. Strengthen communication and cooperation among farmers, communities, and regions to establish robust meteorological disaster early warning systems and weather forecasting networks. Improve the accuracy of meteorological services to meet the needs of food legumes farmers.
Encourage food legumes farmers to join economic cooperatives and deepen the driving role of cooperative organizations. Leverage the advantages of food legumes cooperatives in information gathering, knowledge dissemination, technology diffusion, and scale organization to provide farmers with technical guidance on climate change adaptation. This will enhance farmers' awareness and capacity for prevention, helping them respond scientifically and accurately to climate change risks.
Author Contributions
Conceptualization, Y.L., M.L. and Y.L.; methodology, Y.L. and M.L.; software, Y.L. and M.L.; formal analysis, Y.L. and M.L.; investigation, J.M.; resources, Y.L. and J.M.; data curation, Y.L., M.L. and Y.L.; writing—original draft preparation, Y.L., M.L., Y.L., J.Z. and J.M.; writing—review and editing, Y.L. and M.L.; visualization, Y.L. and M.L.; supervision, Y.L.; project administration, Y.L.; funding acquisition, Y.L. All authors have read and agreed to the published version of the manuscript.
Funding
This research was funded by the National key R&D Program of China, grant number 2023YFF0805904.
Data Availability Statement
The data is available by contacting the author Yarong Lyu.
Acknowledgments
The authors have reviewed and edited the output and take full responsibility for the content of this publication.
Conflicts of Interest
The authors declare no conflicts of interest.
References
- Below, T., Artner A., Siebert R., and Sieber S. 2010. Micro-level Practices to Adapt to Climate Change for African Small-scale Farmers: A Review of Selected Literature. IFPRI Discussion Papers 55: 488.
- Bian, Yingying, and Naiping Song. 2014. Farmers' environmental perception and adaptation of different livelihood strategies in ecotone:a case of Wanjigou village, Yanchi County, Ningxia. Journal of Zhejiang University(Agriculture and Life Sciences) 40: 210-222. (In Chinese).
- Bryan, E., Deressa T. T., Gbetibouo G. A., and Ringler C. 2009. Adaptation to Climate Change in Ethiopia and South Africa: Options and Constraints. Environmental Science & Policy 12: 413-426.
- Chang, Genying, Fupeng Huang, Man Li, and Guojing Li. 2012. Public Perception of Climate Change and Their Support of Climate Policy in China:Based on Global Surveys and in Comparison with USA. Geographical Science 32: 1481-1487. (In Chinese).
- Chen, Honglin, Jing Tian, Zhendong Zhu, Yaowen Zhang, Qiaomin Chen, Sumei Zhou... and Xuzhen Cheng. 2021. Current Status and Future Prospective of Food Legumes Production and Seed Industry in China. Scientia Agricultura Sinica 54: 493-503. (In Chinese).
- Chen, Zihao, and Hao Hu. 2023. The Impact of Farmers’ Perceptions of Climate Change on Insurance Purchase Behavior: Evidence from Peach Farmers in China. Journal of Nanjing Agricultural University(Social Sciences Edition) 23: 178-190. (In Chinese).
- Chu, Chunyan, Tingting Wang, Li Chen, Qingtong Yang, Yan Wang, and Yulan Bai. 2024. The Relationship Between Climate Change and Phenological Periods and Perception of Farmers:A Case Study of Sanjiang Plain. Journal of Agriculture 14: 79-86. (In Chinese).
- Cui, Yongwei, Conghui Du, and Linke Hou. 2012. Current Status and Research Progress of Agricultural Adaptation Practices under Climate Change. World Agriculture 11: 25-29. (In Chinese).
- Deressa, T. T., Hassan R. M., Ringler C., Alemu T., and Yesuf M. 2009. Determinants of Farmers' Choice of Adaptation Methods to Climate Change in the Nile Basin of Ethiopia. Global Environmental Change: Human and Policy Dimension 19: 248-255. [CrossRef]
- Deressa, T. T., Hassan R. M., Ringler C., Alemu T., and Yesuf M. 2009. Determinants of Farmers' Choice of Adaptation Methods to Climate Change in the Nile Basin of Ethiopia. Global Environmental Change 19: 248-255. [CrossRef]
- Du, Peng. 2011. Empirical Study on Farmer's Agricultural Insurance Demand:An Investigation on 432 Farmers in Hubei Province. Issues in Agricultural Economy 32: 78-83+112. (In Chinese).
- Feng, Xiaolong, Mingyue Liu, Xuexi Huo, and Zongxing Chen. 2017. The Effects of Farmers' Adaptation to Climate Change on Agricultural Production:A Case Study on Apple Farmers in Shaanxi. Chinese Rural Economy 3: 31-45. (In Chinese).
- Feng, Xiaolong, Yingjie Zhu, and Jun Li. 2024. Credit Constraints, the Grassland Ecological Compensation Policy, and Herders' Adaptive Behaviors to Climate Change. China Population,Resources and Environment 34: 93-101. (In Chinese).
- Feng, Xiaolong, Zongxing Chen, and Xuexi Huo. 2016. Factors Influencing Farmers' Adapting Behavior to Drought: Based on 1079 Apple Household Survey Data. Journal of Arid Land Resources and Environment 30: 43-49. (In Chinese).
- Fu, Jin, Yiwei Jian, Xuhui Wang, Laurent Li, Philippe Ciais, Jakob Zscheischler, Yin Wang, Yanhong Tang, Christoph Müller, Heidi Webber, Bo Yang, Yali Wu, Qihui Wang, Xiaoqing Cui, Weichen Huang, Yongqiang Liu, Pengjun Zhao, Shilong Piao, and Feng Zhou. 2023. Extreme Rainfall Reduces One-twelfth of China’s Rice Yield over the Last Two Decades. Nature Food 4: 416–426.
- Gao, Renjie, Yan Yang, and Meitu Wang. 2025. Analysis of Apple Growers’ Climate Adaption Behavior in Shanxi Province of China. Chinese Journal of Agricultural Resources and Regional Planning 1-16. (In Chinese).
- Grothmann, T., and Patt A. 2005. Adaptive Capacity and Human Cognition: the Process of Individual Adaptation to Climate Change. Global Environmental Change 15: 199–213. [CrossRef]
- Hou, Zhirui, Qiong Chen, Qiang Zhou, Fenggui Liu, and Weidong Ma. 2018. The perception of climate change and adaptation strategies of farmers in the northeast edgemountianous of the Tibetan Plateau: a case of the middle reach of the Huangshui River. Climate Change Research 14: 175-181. (In Chinese).
- Jose, A Gomez-Limon, and Ruben Granado-Diaz. 2023. Assessing the Demand for Hydrological Drought Insurance in Irrigated Agriculture. Agricultural Water Management 276: 108054.
- Kabir, M. J., Alauddin M., and Crimp S. 2017. Farm-level Adaptation to Climate Change in Western Bangladesh: An Analysis of Adaptation Dynamics, Profitability and Risks. Land Use Policy 64: 212-224. [CrossRef]
- Kurukulasuriya, P. 2007. Economic Impact of Climate Change on African Agriculture. Policy Research Working Paper 5: 1-25.
- Li, Dan, Ying Hu, and Biao Ma. 2017. Factors Influencing Demand for Weather Index Insurance from the Perspective of Product Intrinsic Value: An Empirical Analysis Based on 700 Farmhouseholds in Heilongjiang Province. Jiangsu Agricultural Sciences 45: 302-306. (In Chinese).
- Li, Xiliang, Xiangyang Hou, Yong Ding, and Yanting Yin. 2013. The Response Process to Extreme Climate Events of the Household Compound System in the Northern Slope of Tianshan Mountain. Acta Ecologica Sinica 33: 5353-5362.
- Liu, Libo, Xinwei Wang, and Jiancheng Gao. 2018. Survey on Farmers' Willingness to Pay for Agricultural Insurance in Zhangjiakou City, Hebei Province. Modern Business Trade Industry 39: 71-73. (In Chinese).
- Liu, Wei. 2023. Climate Change, Income Mobility and Income Inequality of Farmers. Journal of Agrotechnical Economics 7: 124-144. (In Chinese).
- Liu, Yansui, Yu Zhao, and Yurui Li. 2025. Impacts of climate change on agricultural areal systems and the mitigation strategies. Chinese Science Bulletin 17: 6123-6136. (In Chinese). [CrossRef]
- Lv, Yarong, and Shufen Chen. 2010. Analysis of Farmers' Perceptions of Climate Change and Adaptive Behaviors. Chinese Rural Economy 7: 75-86. (In Chinese).
- Mccarthy N. 2003. Demand for Rainfall-index Based Insurance: A Case Study from Morocco. EPTD discussion papers.
- Meng, Yuan, Li Zhou, and Hanxi Wu. 2018. Analysis of Factors Influencing Demand for Weather Index Insurance. China Market 19: 49-50+84. (In Chinese).
- Rahman, Md. S., Zulfiqar F., Ullah H., Himanshu S. K., and Datta A. 2023. Farmers’ Perceptions, Determinants of Adoption, and Impact on Food Security: Case of Climate Change Adaptation Measures in Coastal Bangladesh. Climate Policy 23: 1257–1270. [CrossRef]
- Schlenker, W., and Roberts M. J. 2009. Nonlinear Temperature Effects Indicate Severe Damages to U.S. Crop Yields under Climate Change. Proceedings of the National Academy of Sciences of the United States of America 106: 15594-15598. [CrossRef]
- Seres, C. 2010. Agriculture in Upland Regions is Facing the Climatic Change: Transformations in the Climate and How the Livestock Farmers Perceive Them; Strategies for Adapting the Forage System. Fourrages 204: 297-306.
- Shang, Yan, Tao Xiong, and Chongguang Li. 2020. Risk Perception, Risk Attitude, and Farmers' Willingness to Adopt Risk Management Tools: The Case of Agricultural Insurance and “Insurance Plus Futures”. China Rural Survey 5: 52-72. (In Chinese).
- Smit, B., and Skinner M W. 2002. Adaptation Options in Agriculture to Climate Change: A Typology. Mitigation and Adaptation Strategies for Global Change 7: 85- 114. [CrossRef]
- Wang, Guoping, Siyuan He, Qingwen Min, Wenjun Jiao, Moucheng Liu, and Lun Yang. 2022. Farmers′ Adaptation Strategies to Climate Risk:A Review. Journal of Ecology and Rural Environment 38: 137-146. (In Chinese).
- Wang, Yaru, Xueyan Zhao, Qin Zhang, and Li Luo. 2016. Farmers' Climate Change Adaptation Strategies in an Ecologically Vulnerable Alpine Region: A Case of Gannan Plateau. Geographical Research 35: 1273-1287. (In Chinese).
- Wheeler, S. A., Nauges C., and Zuo A. 2021. How Stable are Australian Farmers ’ Climate Change Risk Perceptions? New Evidence of the Feedback Loop between Risk Perceptions and Behaviour. Global Environmental Change 68: 102274. [CrossRef]
- Wheeler, S., Zuo A., and Bjornlund H. 2013. Farmers' Climate Change Beliefs and Adaptation Strategies for A Water Scarce Future in Australia. Global Environmental Change 23: 537-547. [CrossRef]
- Wu, Tingting. 2015. Empirical Analysis of Farmers' Adaptation to Climate Change in Southern Rice Areas of China—— Based on Household Survey Data in Jiangsu and Anhui Provinces. Chinese Journal of Eco-Agriculture 23: 1588- 1596. (In Chinese).
- Yu, Xiujuan, Heng Wu, and Haosu Wang. 2019. Analysis of Climate Change in Baicheng City Over the Past 20 Years. Agriculture of Jilin 07: 103. (In Chinese).
- Yun, Yaru, Xiuqi Fang, and Qing Tian. 2009. Peasants' Perception on Climate Change——A Case Study on Mohe County in Heilongjiang Province. Climate Change Research 5: 117-121. (In Chinese).
- Yun, Yaru, Xiuqi Fang, Qing Tian, and Xuezhen Zhang. 2009. Peasants′Perception and Cognition to Climate Change in Mohe County,Heilongjiang Province. Geographical Science 29: 745-749. (In Chinese).
- Zhang, Huijie, Yongtian Guo, Junling Zhou, Shumin Wang, and Xuzhen Cheng. 2012. Analysis of the Causes Behind Recent Price Fluctuations in Mung Beans. Issues in Agricultural Economy 33: 30-34. (In Chinese).
- Zhao, Xueyan, and Bing Xue. 2016. Farmer's perception and adaptation intention for climate change in high-cold eco-fragile region: A case of Gannan Plateau,China. Chinese Journal of Applied Ecology 27: 2329-2339. (In Chinese).
- Zhao, Xueyan, Yaru Wang, Qin Zhang, Li Luo, and Bing Xue. 2016. Farmers' Choice of Adaptation Strategies to Climate Change in Shiyang River Basin. Journal of Northwest Normal University(Natural Science) 52: 127-134. (In Chinese).
Figure 1.
Mung Bean Production in Jilin Province, 2012–2022. Source: Annual Data from the National Bureau of Statistics of China, https://data.stats.gov.cn/easyquery.htm?cn=E0103.
Figure 1.
Mung Bean Production in Jilin Province, 2012–2022. Source: Annual Data from the National Bureau of Statistics of China, https://data.stats.gov.cn/easyquery.htm?cn=E0103.
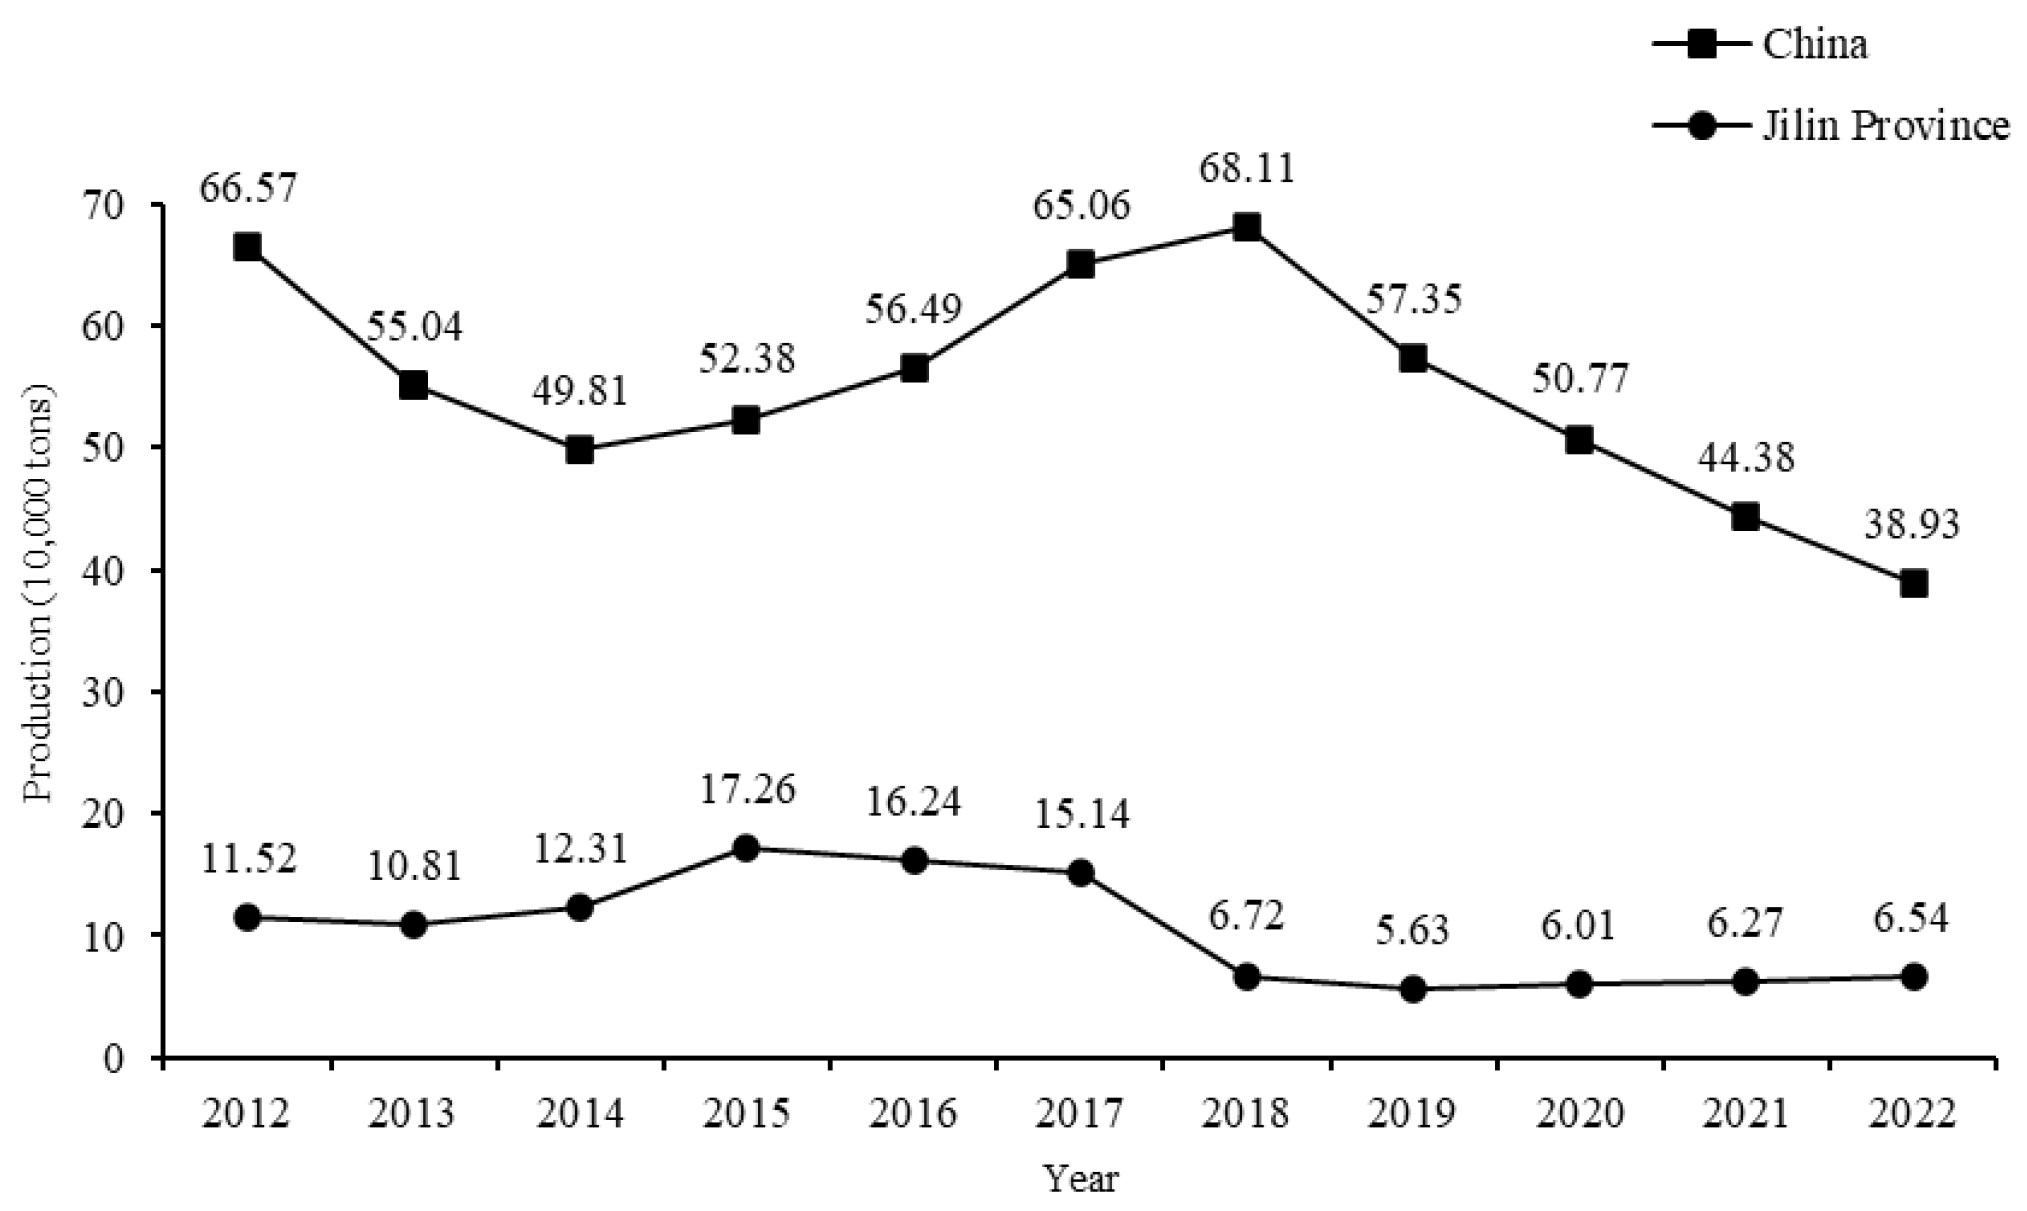
Figure 2.
Annual Average Temperature in Baicheng City, Jilin Province, 2012–2024. Source: National Environmental Information Center, National Oceanic and Atmospheric Administration, https://www.ncei.noaa.gov/data/global-summary-of-the-day/archive/.
Figure 2.
Annual Average Temperature in Baicheng City, Jilin Province, 2012–2024. Source: National Environmental Information Center, National Oceanic and Atmospheric Administration, https://www.ncei.noaa.gov/data/global-summary-of-the-day/archive/.
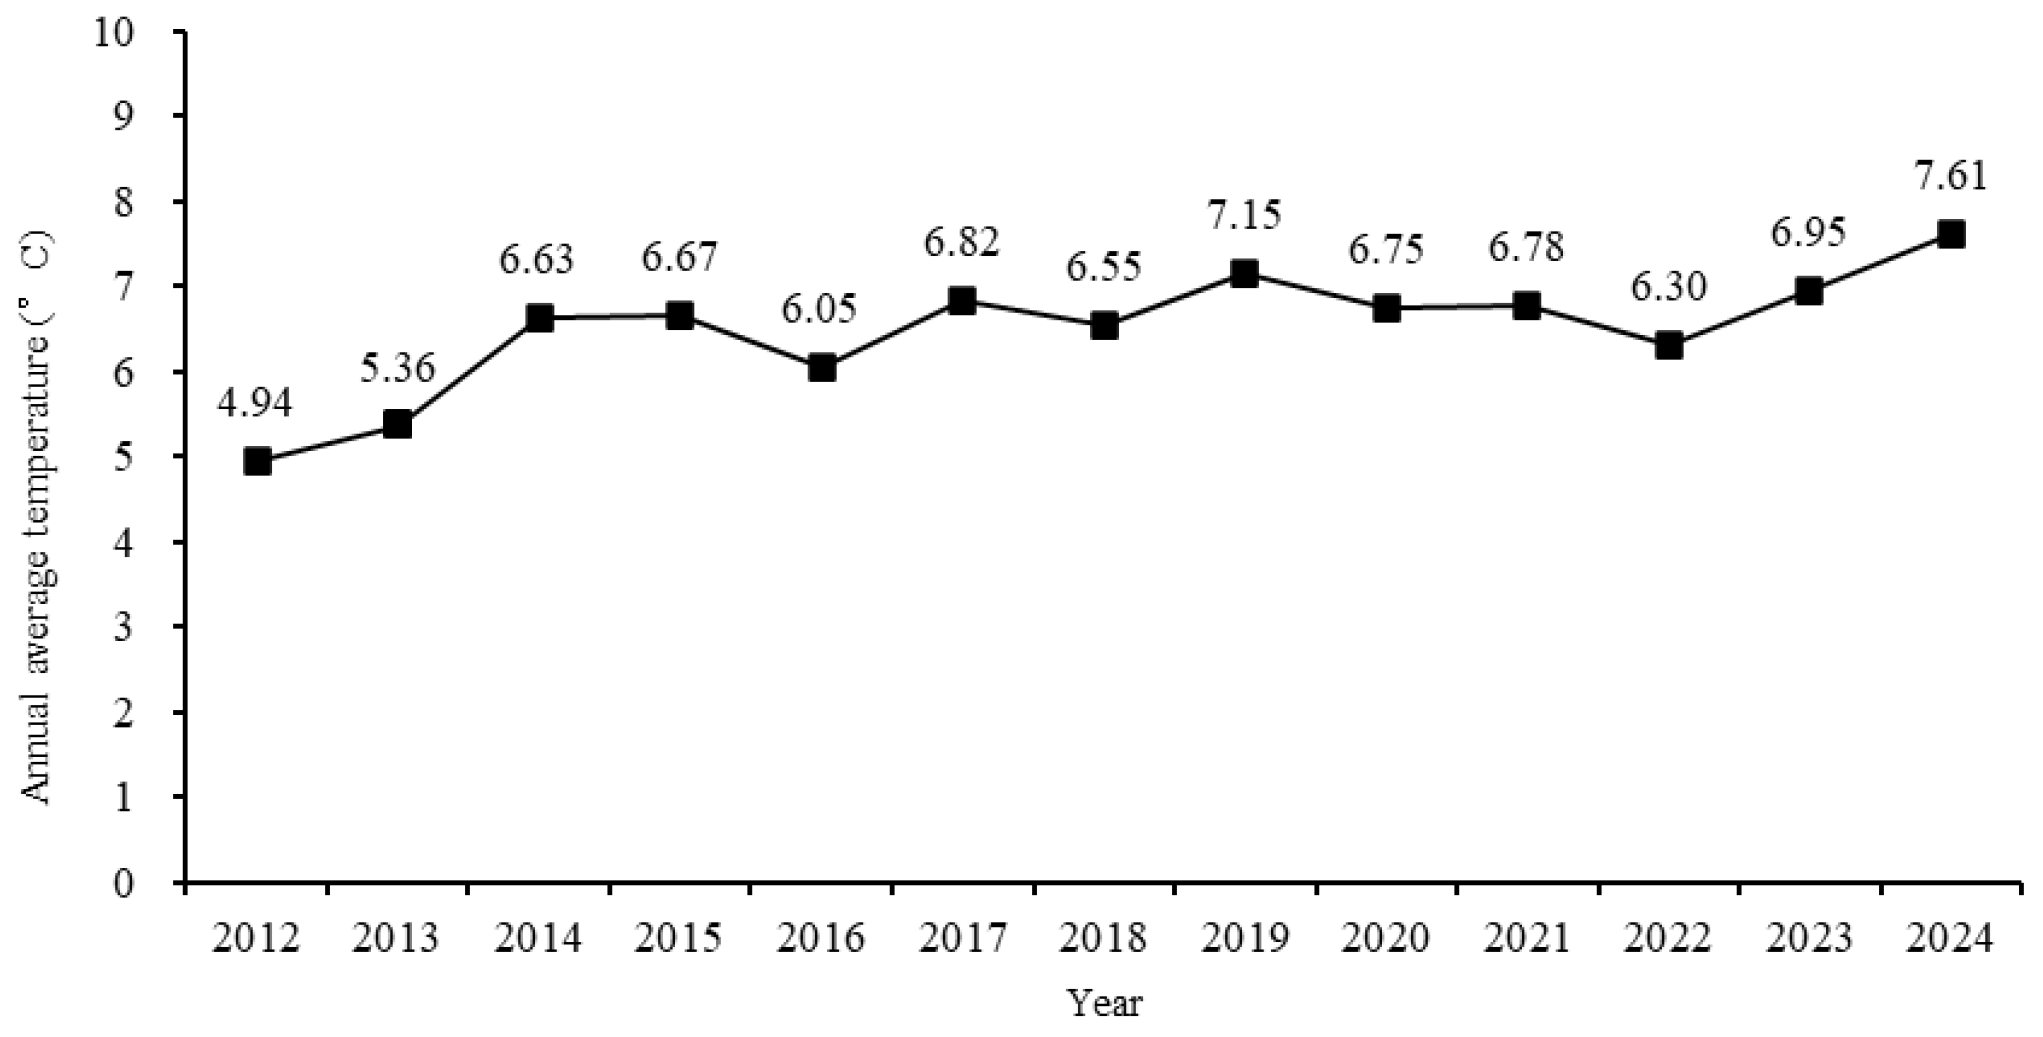
Figure 3.
Annual Average Precipitation in Baicheng City, Jilin Province, 2012–2024. Source: Peng Shouzhang. (2020). China 1km Resolution Monthly Precipitation Dataset (1901–2024). National Qinghai-Tibet Plateau Science Data Center, https://doi.org/10.5281/zenodo.3114194.
Figure 3.
Annual Average Precipitation in Baicheng City, Jilin Province, 2012–2024. Source: Peng Shouzhang. (2020). China 1km Resolution Monthly Precipitation Dataset (1901–2024). National Qinghai-Tibet Plateau Science Data Center, https://doi.org/10.5281/zenodo.3114194.
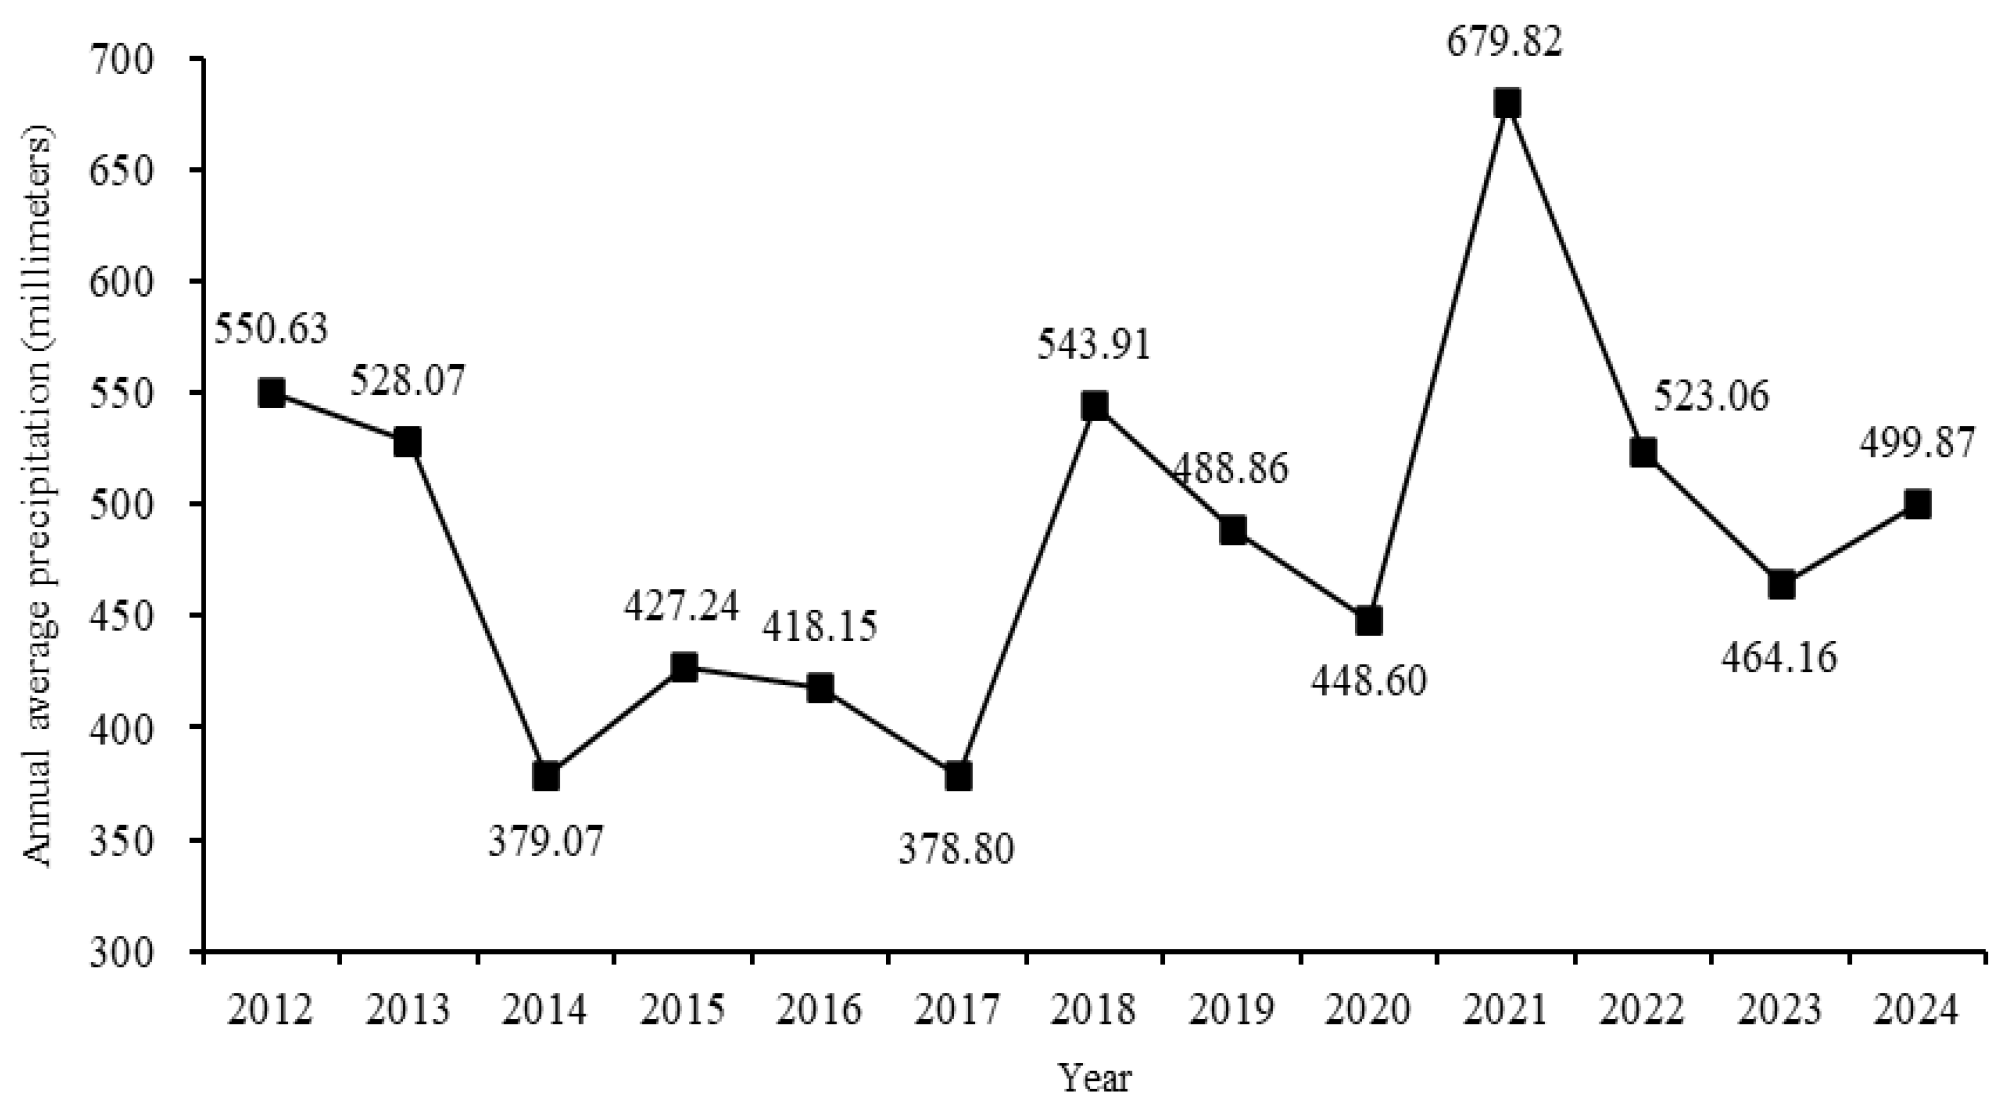

Table 1.
The Development of Agricultural Insurance in China.
| Year | Event | Significance |
|---|---|---|
| 1930s | the oxen mutual cooperative insurance in He County, Anhui Province in 1934 and the Beibei Livestock Insurance Society in Chongqing in 1939 | the earliest practice of agricultural insurance in China |
| 2004 | the Central Document No. 1 explicitly called for the first time to “accelerate the establishment of a policy-based agricultural insurance system” | address the slow development of agricultural insurance |
| 2007 | the central government officially launched a pilot program for agricultural insurance premium subsidies | enter a phase of rapid policy-driven development |
| 2013 | implementation of the Regulations on Agricultural Insurance | enter the path of standardized and law-based development |
| 2019 | issuance of the “Guiding Opinions on Accelerating the High-Quality Development of Agricultural Insurance” | clarify the direction for high-quality development of agricultural insurance |
Table 2.
Agricultural Natural Disaster Situation in Jilin Province, 2012–2023.
| Year | Drought (10,000 hectares) | Flooding (10,000 hectares) | hail damage (10,000 hectares) |
|---|---|---|---|
| 2023 | 0.0 | 22.8 | 3.3 |
| 2022 | 0.0 | 16.7 | 2.6 |
| 2021 | 4.4 | 11.6 | 8.4 |
| 2020 | 12.7 | 4.0 | 7.0 |
| 2019 | - | 28.6 | 12.5 |
| 2018 | 109.9 | 1.7 | 16.3 |
| 2017 | 62.5 | 44.9 | 13.3 |
| 2016 | 52.4 | 7.1 | 6.1 |
| 2015 | 70.0 | 2.4 | 12.2 |
| 2014 | 182.7 | 2.4 | 8.9 |
| 2013 | - | 47.2 | 19.8 |
| 2012 | 30.4 | 7.0 | 5.2 |
Source: Jilin Province Statistical Yearbooks for 2015, 2018, 2021, and 2024.
Table 3.
Sample Distribution.
| County | Town | Sample | Percentage |
|---|---|---|---|
| Da'an City | Chagan Town | 3 | 6.52 |
| Shaoguo Town | 27 | ||
| Taobei District | Daobao Town | 14 | 8.91 |
| Lingxia Town | 27 | ||
| Taonan District | Dongsheng Village | 37 | 31.74 |
| Anding Town | 23 | ||
| Wafang Town | 22 | ||
| Treasure Village | 8 | ||
| Najin Town | 54 | ||
| Wild Horse Village | 2 | ||
| Tongyu County | Wulanhua Town | 58 | 38.7 |
| Shuanggang Town | 3 | ||
| Xinxing Village | 61 | ||
| Xinhua Town | 20 | ||
| Zhanyu Town | 26 | ||
| Hongxing Town | 10 | ||
| Zhenlai County | Jianping Town | 25 | 14.13 |
| Zhenlai Town | 12 | ||
| Heiyupao Town | 28 | ||
| Total | 460 | 100 |
Table 4.
Sample Description.
| Characteristics | Category | Sample | Percentage |
|---|---|---|---|
| Household Head Gender | Male | 453 | 98.48 |
| Female | 7 | 1.52 | |
| Age | 15–34 years old | 43 | 9.35 |
| 35–59 years old | 367 | 79.78 | |
| 60 years old and above | 50 | 10.87 | |
| Education | Illiterate | 12 | 2.61 |
| Elementary School | 177 | 38.48 | |
| Junior high school | 217 | 47.17 | |
| High school and above | 54 | 11.74 | |
| Number of household members | 1-3 person | 268 | 58.26 |
| 4-6 person | 189 | 41.09 | |
| 7-9 person | 3 | 0.65 | |
| Total household income | 0–30,000 yuan | 97 | 21.23 |
| 30,000–60,000 yuan | 96 | 21.00 | |
| 60,000–90,000 yuan | 87 | 19.04 | |
| 90,000 yuan and above | 177 | 38.73 | |
| Year | 2018 | 233 | 50.65 |
| 2019 | 227 | 49.35 |
Table 5.
Variable Definition and Descriptive Statistical Analysis.
| Variable Name |
Variable Definition |
Variable Characteristics |
Mean | SD | Min | Max | VIF |
|---|---|---|---|---|---|---|---|
| Insurance | Whether to purchase agricultural insurance | Categorical variable, 1=Yes, 0=No | 0.39 | 0.488 | 0.00 | 1.00 | — |
| Temperature | Perception of average annual temperature changes over the past five years | Categorical variable, -1 = decrease; 0 = unchanged; 1 = increase | 0.41 | 0.840 | -1.00 | 1.00 | 1.17 |
| Precipitation | Perception of average annual precipitation changes over the past five years | Categorical variable, -1 = decrease; 0 = unchanged; 1 = increase | -0.27 | 0.895 | -1.00 | 1.00 | 1.94 |
| Drought | Perception of drought severity over the past five years | Categorical variable, -1 = alleviated; 0 = unchanged; 1 = aggravated | 0.43 | 0.836 | -1.00 | 1.00 | 1.98 |
| Frost | Perception of frost severity over the past five years | Categorical variable, -1 = alleviated; 0 = unchanged; 1 = aggravated | 0.05 | 0.878 | -1.00 | 1.00 | 1.32 |
| Age | age | Actual variable, actual age (unit: years) | 48.27 | 9.574 | 21.00 | 74.00 | 1.30 |
| Education | Level of education | Actual variable, 0 = illiterate, 6 = elementary school, 9 = junior high school, 12 = high school and above (unit: years) | 7.96 | 2.360 | 0.00 | 12.00 | 1.06 |
| Population | Number of family members | Actual variable, actual number of people (unit: persons) | 3.46 | 1.138 | 1.00 | 8.00 | 1.25 |
| Income | Total household income | Actual variable, the logarithm of total household income | 11.09 | 1.158 | 7.40 | 15.42 | 1.30 |
| Proportion | The proportion of cultivated land used for planting food legumes | Actual variable, actual proportion (unit: %) | 0.41 | 0.603 | 0.01 | 11.25 | 1.06 |
| Cooperative | Whether to join the food legumes production cooperative | Categorical variable, 1=Yes, 0=No | 0.32 | 0.466 | 0.00 | 1.00 | 1.23 |
| Experience | Whether to experience a yield reduction | Categorical variable, 1=Yes, 0=No | 0.74 | 0.441 | 0.00 | 1.00 | 1.05 |
Note: Mean VIF = 1.33.
Table 6.
Baseline Regression Results.
| (1) | (2) | (3) | (4) | |
|---|---|---|---|---|
| Insurance | Insurance | Insurance | Marginal Effect | |
| Temperature | -0.3260*** | -0.2922*** | -0.2178** | -0.0578** |
| (0.0810) | (0.0815) | (0.0899) | (0.0237) | |
| Precipitation | 0.0717 | 0.0226 | 0.1581 | 0.0436 |
| (0.1016) | (0.1031) | (0.1150) | (0.0313) | |
| Drought | 0.0298 | 0.0051 | 0.0169 | 0.0142 |
| (0.1139) | (0.1169) | (0.1266) | (0.0333) | |
| Frost | 0.8211*** | 0.8137*** | 0.6894*** | 0.182*** |
| (0.0849) | (0.0872) | (0.0937) | (0.0239) | |
| Age | -0.0057 | -0.0052 | -0.00163 | |
| (0.0077) | (0.0082) | (0.00173) | ||
| Education | -0.0088 | -0.0207 | -0.00525 | |
| (0.0327) | (0.0319) | (0.00801) | ||
| Population | 0.1859*** | 0.1070 | 0.0321** | |
| (0.0676) | (0.0694) | (0.0156) | ||
| Income | 0.0476 | 0.0144 | -0.000495 | |
| (0.0642) | (0.0729) | (0.0149) | ||
| Proportion | -0.2763 | -0.00719 | ||
| (0.3251) | (0.0119) | |||
| Cooperative | 1.3179*** | 0.401*** | ||
| (0.1650) | (0.0495) | |||
| Experience | 0.5026*** | 0.118*** | ||
| (0.1665) | (0.0357) | |||
| Constant | -0.2964*** | -1.1474 | -1.1566 | |
| (0.0875) | (0.9990) | (1.0900) | ||
| N | 460 | 457 | 457 | |
| chi2 | 132.2149 | 138.5215 | 179.2103 | |
| r2_p | 0.2582 | 0.2835 | 0.4158 |
Note: T statistics in parentheses *p<0.1,**p<0.05,***p<0.01.
Table 7.
Robustness Test Results.
| (5) | (6) | (7) | (8) | |
|---|---|---|---|---|
| Perception of | Probit Model |
Logit Model |
OLS Model |
Replace Explanatory Variables |
| Temperature | -0.2178** | -0.3928** | -0.0578** | -0.2136** |
| (0.0899) | (0.1592) | (0.0237) | (0.0895) | |
| Precipitation | 0.1581 | 0.2707 | 0.0436 | 0.1870* |
| (0.1150) | (0.2074) | (0.0313) | (0.1111) | |
| Drought | 0.0169 | 0.0388 | 0.0142 | |
| (0.1266) | (0.2287) | (0.0333) | ||
| Frost | 0.6894*** | 1.2145*** | 0.1815*** | |
| (0.0937) | (0.1703) | (0.0239) | ||
| Drought_2 | 0.0931 | |||
| (0.1232) | ||||
| Frost_2 | 0.6424*** | |||
| (0.0952) | ||||
| Age | -0.0052 | -0.0127 | -0.0016 | -0.0045 |
| (0.0082) | (0.0145) | (0.0017) | (0.0082) | |
| Education | -0.0207 | -0.0345 | -0.0053 | -0.0253 |
| (0.0319) | (0.0579) | (0.0080) | (0.0320) | |
| Population | 0.1070 | 0.1973 | 0.0321** | 0.1079 |
| (0.0694) | (0.1240) | (0.0156) | (0.0692) | |
| Income | 0.0144 | -0.0141 | -0.0005 | 0.0278 |
| (0.0729) | (0.1315) | (0.0149) | (0.0739) | |
| Proportion | -0.2763 | -0.5101 | -0.0072 | -0.2561 |
| (0.3251) | (0.5772) | (0.0119) | (0.3156) | |
| Cooperative | 1.3179*** | 2.2701*** | 0.4006*** | 1.3212*** |
| (0.1650) | (0.3009) | (0.0495) | (0.1650) | |
| Experience | 0.5026*** | 0.8295*** | 0.1183*** | 0.4917*** |
| (0.1665) | (0.2993) | (0.0357) | (0.1654) | |
| Constant | -1.1566 | -1.3904 | 0.2145 | -1.2876 |
| (1.0900) | (1.9410) | (0.2177) | (1.1130) | |
| N | 457 | 457 | 457 | 457 |
| chi2 | 179.2103 | 139.4261 | 170.3134 | |
| r2_p | 0.4158 | 0.4148 | 0.4076 |
Note: T statistics in parentheses *p<0.1,**p<0.05,***p<0.01.
Disclaimer/Publisher’s Note: The statements, opinions and data contained in all publications are solely those of the individual author(s) and contributor(s) and not of MDPI and/or the editor(s). MDPI and/or the editor(s) disclaim responsibility for any injury to people or property resulting from any ideas, methods, instructions or products referred to in the content. |
© 2026 by the authors. Licensee MDPI, Basel, Switzerland. This article is an open access article distributed under the terms and conditions of the Creative Commons Attribution (CC BY) license (http://creativecommons.org/licenses/by/4.0/).
Copyright: This open access article is published under a Creative Commons CC BY 4.0 license, which permit the free download, distribution, and reuse, provided that the author and preprint are cited in any reuse.


