
Submitted:
23 April 2025
Posted:
24 April 2025
You are already at the latest version
Abstract
Climate variability discourages smallholders from adopting yield-enhancing inputs, perpetuating low agricultural productivity. Weather Index Insurance (WII) could mitigate this, but empirical evidence remains inconsistent, with most insights drawn from controlled experiments lacking real-world scalability. Using observational data from Kenyan smallholders across diverse agroecological zones, this study employs instrumental variable regression to assess WII's influence on agricultural input adoption and use intensity. Results demonstrate that WII significantly increases adoption and intensification of improved inputs but displaces traditional practices, with effects mediated by gender, financial access, and infrastructure. However, WII's efficacy diminishes under extreme drought and in high-fertility soils, revealing threshold-dependent climate resilience shaped by local agroecological conditions. Our results demonstrate that WII's productivity benefits are context-dependent, urging policies that combine insurance with agroecological targeting and complementary interventions like credit access to achieve sustainable agricultural transformation.
Keywords:
Weather Index Insurance
; input intensification
; smallholder farmers
; climate resilience
1. Background
Sub-Saharan Africa faces escalating climate risks, with agricultural losses surpassing $15 billion annually due to droughts, floods, and changing rainfall patterns since 2000 (FAO, 2023). Smallholder farmers, who contribute 60% of the region's food production and rely predominantly on rainfed systems, bear the brunt of these shocks (World Bank, 2023). In Kenya, where 98% of agriculture depends on rainfall and only 5% of farms are irrigated, climate models predict a 20–40% yield decline in staple crops by 2050 under current adaptation pathways (Kenya National Bureau of Statistics, 2022; IPCC, 2023). This threatens food security for 10 million smallholder households (Government of Kenya, 2023) underscoring the urgent need for solutions that mitigate climate risks and sustain productivity.
Historically, agricultural intensification drove food security gains, as seen in Asia's Green Revolution (Pingali and Sunder, 2017). However, climate change has destabilized this model in rainfed systems. Kenyan farmers, for instance, reduce fertilizer use by 30–50% during droughts, sacrificing potential yield gains of 4–6 tons per hectare (Sheahan et al., 2013). This behavior aligns with prospect theory, which asserts that smallholders prioritize loss avoidance over profit maximization in uncertain conditions (Schröder and Gilboa Freedman, 2020). While strategies like crop diversification or distress sales provide short-term relief (Janzen and Carter, 2019), they incur long-term costs. Droughts lower agricultural wages by 40% and asset values by 60%, reinforcing cycles of poverty (Meza et al., 2021). Effective institutional interventions must, therefore, decouple climate risk from productivity losses.
Agricultural insurance could bridge this gap, but traditional models struggle in developing economies. Moral hazard and adverse selection inflate costs by 30–50% (Powell and Goldman, 2014), while covariate risks necessitate expensive reinsurance (Kuhn et al., 2016). Due to fiscal constraints, subsidized schemes in Kenya reach only 3% of farmers (Central Bank of Kenya, 2023). Weather Index Insurance (WII) offers a promising alternative. Its design reduces administrative costs by 60% relative to indemnity-based models (World Bank, 2011) minimizes moral hazard through automated triggers and mitigates adverse selection via standardized parameters. Importantly, WII's transparency facilitates global reinsurance against catastrophic risks, enhancing insurer solvency (Sun, 2022; Benso et al., 2023).
Despite promising pilot results, the causal mechanisms linking Weather Index Insurance (WII) to sustained agricultural productivity remain contested. While WII's role in mitigating climate risks is well-established (Benso et al., 2023), its secondary function as a catalyst for modern input adoption, critical for breaking low-yield equilibria, lacks consistent empirical support. Some studies show that WII reduces financial stress, enabling higher adoption rates of fertilizers and improved seeds among insured smallholders (Isaboke et al., 2016; Belissa, 2024). Others find negligible effects, particularly in the absence of complementary interventions such as credit access and extension services (Mobarak and Rosenzweig, 2013; Castaing and Gazeaud, 2022). This divergence highlights contextual heterogeneity, such as variations in risk perception, index design, and behavioral responses, which existing literature has yet to disentangle.
Three limitations undermine the policy relevance of current WII research. First, an overreliance on controlled experiments neglects real-world barriers, including distrust of insurers and liquidity constraints that make premiums unaffordable (Aizaki et al., 2021; Tang et al., 2021). Second, the focus on enrollment drivers and farmer preferences overlooks input use intensity, a critical factor in yield impacts (Liu et al., 2019; Aizaki et al., 2021). Third, most evaluations ignore agroecological diversity. WII designs effective in humid highlands often fail in arid lowlands due to mismatches between index triggers and crop phenology (Dalhaus et al., 2018).
This study advances the WII research field through three key contributions. First, we bridge the gap between controlled experiments and real-world conditions by analyzing observational data from Kenyan smallholders across multiple WII programs and agroecological zones. This isolates how behavioral and environmental factors shape WII's effectiveness, addressing a critical gap in RCT-dominated literature. Second, we move beyond binary measures of input adoption to quantify WII's impact on input-use intensity (Kg/acre) for both modern and traditional inputs, testing its potential for sustainable agricultural intensification. Third, we translate our findings into actionable recommendations for design improvements that enhance scalability across diverse farming systems in Kenya and similar regions globally. Our results inform Kenya's National Agricultural Insurance Program while refining theoretical frameworks at the intersection of climate-risk finance, behavioral economics, and resilient food systems.
2. Weather Index Insurance in Kenya
Weather Index Insurance (WII) has become a cornerstone of climate risk management for Kenyan smallholders, with operational schemes since the late 2000s (Sibiko and Qaim, 2020). The Kilimo Salama ("Safe Farming") Program, launched in 2009, is a model for WII in sub-Saharan Africa, integrating mobile technology and input-linked coverage to reduce basis risk and administrative costs, which have hindered traditional insurance models (International Finance Corporation, 2015; Seuret, 2010). Under this model, farmers who purchase insured inputs, such as hybrid maize seeds or fertilizers from approved suppliers, are automatically enrolled in WII, with premiums typically ranging from 10% to 20% of input costs, which raises retail prices proportionally (Seuret, 2010).
Enrollment is facilitated via SMS with product-packaging codes or agro-dealer networks, ensuring geotagged plot alignment with nearby weather stations (Sibiko and Qaim, 2020). Payouts are triggered when rainfall, measured by automated weather stations, deviates from predefined thresholds during key crop growth phases. For example, a payout may occur if rainfall falls below 200mm over an 8-week sowing period for maize. Claims are processed through mobile money (M-Pesa) within 14 days, enabling farmers to replant or smooth consumption in response to adverse weather (Seuret, 2010).
Despite these advancements, WII uptake remains low, with only 12.7% of eligible smallholders enrolled as of 2022 (Kenya National Bureau of Statistics, 2022). Barriers to wider adoption include liquidity constraints and uneven weather station coverage, with only 62% of Kenya's agro-zones having reliable weather station density as of 2021 (Kenya Meteorological Department (KMD), 2023). These constraints, along with other structural barriers, limit the effectiveness and reach of WII. Kenya's Agriculture Sector Transformation Strategy (ASTS 2019–2029) prioritizes WII expansion through partnerships involving insurers like APA, Jubilee, and the Kenya Agricultural Insurance Programme (KAIP) (Government of Kenya, 2019). Despite policy efforts, persistent low WII uptake reflects systemic barriers. Integrating WII with targeted infrastructure and risk-contingent financing could bridge the gap between ambition and smallholder realities.
3. Methodology
3.1. Study Area
This study was conducted in Njoro Sub-County, Kenya (0°19′53″S, 35°56′31″E), a region that exemplifies the challenges of rainfed smallholder agriculture in climate-vulnerable areas. Over 70% of the population relies on rainfed maize farming as their staple crop and primary income source, making livelihoods highly sensitive to weather variability. Spanning 713 km², Njoro comprises six administrative wards: Mau-Narok, Mauche, Kihingo, Nesuit, Lare, and Njoro. With an altitude ranging from 1,300 to 2,000 meters above sea level, the climate is characterized by temperatures between 25 and 30.5°C and annual rainfall of 850–1,000 mm. However, recurrent droughts and erratic rainfall have led to 30–50% maize yield reductions in recent decades (Government of Kenya, 2022), exacerbating food insecurity and poverty. This highlights a critical gap in smallholders' capacity to manage escalating climate risks. Focusing on Njoro's maize systems, this study seeks to identify scalable risk-mitigation strategies that balance agroecological resilience, economic feasibility, and policy relevance for similar contexts across East Africa.
3.2. Sampling Procedure
A multi-stage sampling approach was used to select 400 smallholder maize farmers from Njoro Sub-County (see Figure 1). The sub-county was first stratified into six administrative wards, from which four, Kihingo, Lare, Nesuit, and Njoro, were purposively selected. These wards were chosen based on the proportion of households engaged in maize farming, according to the Ministry of Agriculture and Livestock Development (2023), and participation in Weather Index Insurance (WII) initiatives. Within the selected wards, 20 villages were proportionally sampled based on the area cultivated with maize. Respondents were randomly selected within these villages to ensure a representative sample across the study area.
3.3. Data Collection and Management
The study employed a rigorous mixed-methods approach to ensure validity and reliability. Primary data were collected through direct field observations and structured farmer interviews, allowing for real-time cross-verification of responses. Empirical methods were supplemented by a systematic literature review of peer-reviewed journals and government reports to strengthen the theoretical grounding and align the study with existing evidence. Instrument reliability was tested with a pilot study (n=30) conducted in Njoro Sub-County, which identified ambiguities in the survey instrument. These insights led to refinements that enhanced clarity and internal consistency. Data was collected by trained enumerators with agricultural expertise, reducing potential measurement error. Stata 17 was used for quantitative analysis, with statistical significance set at α=0.05 for hypothesis testing.
3.4. Empirical Framework
Smallholder farmers' adoption of productivity-enhancing inputs is critical for poverty reduction, yet underinvestment persists due to unmitigated weather risks. This study uses an IV-Probit model to examine how Weather Index Insurance (WII) influences input adoption in Njoro Sub-County, Kenya. Unobserved factors, such as risk preferences or latent trust in institutions, may jointly influence farmers' decisions about WII adoption and input use, biasing standard probit estimates through endogeneity (Sande and Ghosh, 2018). The IV-Probit model addresses endogeneity by using instrumental variables (IVs) that meet two conditions: relevance (a strong correlation with WII adoption) and exclusion (no direct effect on input use, except through WII) (Bastardoz et al., 2023). Two IVs are used in this study. First, distance to the nearest weather station influences WII adoption because proximity affects basis risk, the discrepancy between actual farm losses and insurance payouts. Farmers farther from weather stations face higher basis risk, undermining trust in WII and reducing adoption (Jensen et al., 2018). Second, insurance product training enhances farmers' understanding of WII's mechanisms, promoting trust and increasing uptake (Fonta et al., 2018). Importantly, both IVs are plausibly exogenous. Distance is determined by geographic location, and training programs are randomized across villages, minimizing direct effects on input decisions. The IV-Probit model was estimated in two stages as follows:
First-stage regression (endogenous variable equation)
The endogenous variable (WII adoption) is estimated using the exogenous variables and instruments.
where: is the endogenous variable from the first stage (WII adoption), is a vector of exogenous variables (e.g., farmer characteristics), is a vector of instrumental variables (distance to the weather station, training on insurance products), and are estimated parameter values and is the error term in the first-stage equation.
Second-stage regression (outcome equation)
The fitted values from the first stage (WII adoption) are used to estimate the effect on the outcome variable (input adoption).
where: is the latent dependent variable (input adoption), are the fitted values of the endogenous variable from the first stage (WII adoption), is the vector of exogenous covariates, and are parameter estimates and is the error term.
4. Results and Discussion
4.1. Weather Index Insurance and Adoption of Agricultural Inputs
4.1.1. Descriptive Statistics of Insured and Non-Insured Smallholder Farmers
This section presents descriptive statistics comparing smallholder farmers who purchased Weather Index Insurance (WII) and those who did not. Results in Table 1 show systematic differences between insured and non-insured smallholders, highlighting how socio-economic, institutional, and behavioral factors influence WII adoption. Insured farmers generally are older (p < 0.05), more educated (p = 0.081), and have greater farming experience (p < 0.01). These findings align with life-cycle models of technology adoption, which suggest that accumulated knowledge enhances the uptake of risk management tools (Taherdoost, 2018).
Economic capacity is a key driver. Insured farmers earn 71% higher annual incomes (p < 0.001), consistent with global evidence that financial resources enable participation in formal risk mechanisms (World Bank, 2025). In contrast, non-insured farmers face significant financial constraints (p < 0.05), echoing findings that even modest premiums exclude the most vulnerable (IFA, 2021). Household dynamics further differentiate the two groups. Insured farmers have larger families (p < 0.01), suggesting that labor pooling aids premium payment, and they cultivate larger landholdings (p < 0.001), supporting the idea that asset ownership incentivizes insurance uptake (Janzen and Carter, 2019). Behaviorally, insured farmers display higher risk tolerance (62.05% vs. 14.96% engage in lottery games; p < 0.001), reinforcing the link between risk appetite and insurance participation (Maccheroni et al., 2023).
Institutional access disparities highlight systemic barriers. Insured farmers live closer to financial services (p < 0.001) and weather stations (p < 0.001), underscoring the role of physical infrastructure in financial inclusion. Their greater participation in farmer groups (p < 0.01) and insurance training (p < 0.001) illustrates how social networks reduce information asymmetries. A slight advantage in market proximity (p < 0.05) suggests indirect incentives for adoption through improved information flows.
Weather-related experiences reveal paradoxes. Despite reporting fewer yield losses (p < 0.05), insured farmers experienced fewer weather shocks (p < 0.001), which may indicate better ex-ante risk management or differing shock perceptions. With near-universal access to weather information (98.75%), these findings suggest that awareness alone is insufficient for adoption, supporting calls for complementary interventions (Aizaki et al., 2021).
These results demonstrate that economic capacity, physical access, behavioral factors, and institutional linkages drive WII adoption. The significantly lower yield losses among insured farmers suggest that WII protects productivity against climate shocks. However, the puzzle of insured farmers reporting fewer losses despite fewer shocks highlights a gap that warrants further investigation. These insights emphasize that scaling WII’s benefits requires not only financial and infrastructural investments but also targeted behavioral and institutional interventions to bridge adoption disparities.
4.1.2. Descriptive Statistics of General Input Use Patterns Among Insured and Non-Insured Farmers
Table 2 presents descriptive statistics comparing input utilization between smallholder farmers who purchased Weather Index Insurance (WII) and those who did not, reflecting general patterns of input use. The results show significant differences in input use, risk management strategies, and agricultural intensification practices between insured and non-insured farmers. Insured farmers apply 58.98 kg/acre of chemical fertilizer, almost ten times the rate of non-insured farmers (6.13 kg/acre, p < 0.001), aligning closely with agronomic recommendations for maize (Sheahan et al., 2013). This suggests WII mitigates risk aversion and liquidity constraints, enabling more efficient input use (Benso et al., 2023).
A substitution effect is observed in organic inputs. Insured farmers use less manure (p < 0.05) and apply smaller quantities (p < 0.001). This likely results from increased access to synthetic fertilizers and the labor-intensive nature of manure application. The lower standard deviation in manure use among insured farmers (19.28 vs. 36.61) indicates more standardized, precision-driven farming.
Technological disparities are evident in seed selection. Insured farmers overwhelmingly adopt improved maize varieties (p < 0.001) and use three times as much seed (p < 0.001), perhaps leveraging climate-adapted genetics to maximize germination rates (Cacho et al., 2020). In contrast, non-insured farmers rely on traditional seeds (p < 0.001), compensating for poor germination by using more seeds (7.69 kg/acre vs. 2.69 kg/acre, p < 0.001).
Labor market participation also differs significantly. Insured farmers hire labor more frequently (p < 0.001) and use nearly double the number of person-days (32.36 vs. 17.45, p < 0.001), reflecting expanded cultivation and more intensive farming practices. These increased labor inputs correlate with an 84% yield advantage (16.44 vs. 8.94 bags/acre, p < 0.001), demonstrating that WII enables synergistic effects from combined inputs. Despite significant differences in cultivation scale (p < 0.001), the number of plots remains similar (p = 0.565), indicating that insured farmers consolidate their operations rather than fragment them. Yield-per-acre comparisons (p < 0.001) confirm that intensification goes beyond simply scaling up land area.
These findings demonstrate that WII encourages smallholders to adopt capital- and knowledge-intensive production practices, moving away from traditional risk-coping mechanisms while fostering resilient, high-productivity systems. They also highlight WII’s transformative potential as a financial safety net and a catalyst for sustainable intensification.
4.1.3. Descriptive Statistics of Input Use Patterns for Active Users Among Insured and Non-Insured Farmers
Building on the previous analysis of general input use patterns, this section examines the quantities of inputs used by farmers who actively utilize them, comparing insured and non-insured groups. The findings reveal that WII participation systematically alters input application intensity among smallholder farmers, as seen in stark contrasts between insured and non-insured producers (Table 6). Insured farmers apply 99% more chemical fertilizer (67.99 kg/acre vs. 34.14 kg/acre, p < 0.001), consistent with the risk-mitigation hypothesis that insurance reduces perceived investment risks for costly, yield-enhancing inputs (Karlan et al., 2014). This trend holds across all fertilizer users (60.35 kg/acre), with insured farmers driving overall intensification, a pattern also observed in contexts where financial tools ease liquidity constraints (Suri, 2011).

Table 3.
Descriptive analysis of input use among active users for insured and non-insured farmers.
| Total | Insured | Not Insured | p-value | |||||
| No. of users | Mean usage | No. of users | Mean usage | No. of users | Mean usage | |||
| Chemical fertilizer quantity (kg/acre) | 186 | 60.35 | 144 | 67.99 | 42 | 34.14 | 0.000*** | |
| Manure quantity (kg/acre) | 196 | 53.00 | 71 | 35.56 | 125 | 62.90 | 0.000*** | |
| Improved maize seed quantity (kg/acre) | 238 | 10.16 | 149 | 11.40 | 89 | 8.08 | 0.000*** | |
| Traditional maize seed quantity (kg/acre) | 279 | 8.05 | 78 | 5.73 | 201 | 8.95 | 0.000*** | |
Notes: Each variable is presented with its mean and number of farmers (in parentheses). ***, **, and * denote statistically significant mean differences between sub-groups at the 1%, 5%, and 10% significance levels. 'acre' denotes the unit of land measurement, and 'kg' denotes kilograms.
In contrast, non-insured farmers rely 77% more on manure (62.90 kg/acre vs. 35.56 kg/acre, p < 0.001), reflecting risk-coping strategies shaped by limited capital access and a strong aversion to financial exposure. Their preference for slower-release organic inputs, despite their lower efficiency, underscores how liquidity constraints perpetuate suboptimal nutrient management (Sheahan et al., 2013). The intermediate average usage (53.00 kg/acre) further reveals heterogeneous risk tolerance, even among uninsured farmers.
Seed selection further highlights this divide. Insured farmers use 41% more improved seeds (11.40 kg/acre vs. 8.08 kg/acre, p < 0.001), leveraging climate-resilient varieties to maximize planting efficiency, an approach linked to higher yields under weather volatility (Cacho et al., 2020). In contrast, non-insured farmers apply 56% more traditional seeds (8.95 kg/acre vs. 5.73 kg/acre, p < 0.001), compensating for poor germination rates or adhering to labor-intensive broadcast methods. These differences highlight how WII accelerates the shift from subsistence to market-integrated farming systems. The consistently significant differences (p < 0.001) across all inputs underscore WII's role in promoting agricultural modernization, reducing reliance on low-efficiency inputs, and encouraging capital-intensive intensification. These findings show that WII stabilizes incomes and actively reconfigures smallholder production systems, driving them toward higher productivity and sustainability.
4.1.4. The Effectiveness of Weather Index Insurance in Promoting Input Adoption
This section builds on the descriptive analysis of input use patterns among insured and non-insured farmers, employing more robust inferential methods to assess Weather Index Insurance (WII) effects on input adoption. The IV-Probit model addresses endogeneity by using distance to the nearest weather station and training on insurance as instruments for WII uptake, as they satisfy exclusion restrictions(see the empirical framework for details). The primary focus is on the second-stage regression, where fitted values from the first stage (WII adoption) estimate input adoption. The first stage confirms the relevance of the instrumental variables, ensuring exogenous variation for unbiased estimation in the second stage. In this stage, the outcome variable was modeled as a binary input, where '1' indicates adoption of modern (chemical fertilizer and improved seeds) or traditional inputs (manure and traditional seeds), and '0' indicates non-adoption.
Table 4.
Regression analyses of the role of Weather Index Insurance in promoting input adoption.
| Variables | First stage regression | Second-stage regression | |||||||||
| WII uptake | Chemical fertilizer | Manure | Improved maize seeds | Traditional maize seeds | |||||||
| Coefficients (Robust S.E.) | p-value | Coefficients (Robust S.E.) | p-value | Coefficients (Robust S.E.) | p-value | Coefficients (Robust S.E.) | p-value | Coefficients (Robust S.E.) | p-value | ||
| Distance to the nearest weather station | -3.731 (0.622) | 0.000*** | - | - | - | - | - | - | - | - | |
| Training on insurance products | 2.977 (0.512) | 0.000*** | - | - | - | - | - | - | - | - | |
| WII uptake | - | - | 1.230 (0.366) | 0.001*** | -0.383 (0.304) | 0.208 | 1.001 (0.327) | 0.002*** | -1.249 (0.330) | 0.000*** | |
| Age | 0.189 (0.185) | 0.306 | -0.083 (0.098) | 0.401 | 0.041 (0.088) | 0.64 | 0.038 (0.098) | 0.697 | -0.127 (0.093) | 0.171 | |
| Age squared | -0.002 (0.002) | 0.267 | 0.001 (0.001) | 0.472 | 0.000 (0.001) | 0.819 | 0.000 (0.001) | 0.720 | 0.001 (0.001) | 0.149 | |
| Gender | 0.514 (0.348) | 0.139* | 0.030 (0.172) | 0.86 | 0.298 (0.148) | 0.044** | -0.100 (0.165) | 0.544 | 0.046 (0.171) | 0.787 | |
| Schooling | -0.143 (0.048) | 0.003*** | -0.019 (0.024) | 0.446 | -0.013 (0.019) | 0.494 | -0.004 (0.023) | 0.858 | -0.036 (0.020) | 0.073 * | |
| Training on agri-production technology | -0.926 (0.476) | 0.052* | 0.476 (0.202) | 0.019** | 0.006 (0.182) | 0.976 | -0.017 (0.228) | 0.939 | 0.232 (0.200) | 0.246 | |
| Total land owned | -0.490 (0.186) | 0.009*** | 0.288 (0.126) | 0.022** | -0.023 (0.097) | 0.816 | 0.176 (0.138) | 0.200 | -0.034 (0.102) | 0.74 | |
| Land leased out | -0.756 (0.248) | 0.002*** | 0.058 (0.120) | 0.63 | 0.074 (0.099) | 0.455 | 0.192 (0.138) | 0.164 | 0.000 (0.100) | 0.996 | |
| Wealth | 0.445 (0.153) | 0.004*** | 0.194 (0.076) | 0.010*** | -0.056 (0.065) | 0.392 | 0.299 (0.077) | 0.000*** | -0.189 (0.069) | 0.006*** | |
| Household off-farm labor members | -0.157 (0.074) | 0.034** | 0.023 (0.040) | 0.566 | 0.019 (0.035) | 0.589 | 0.086 (0.042) | 0.043** | -0.004 (0.039) | 0.927 | |
| Household farm labor members | -0.189 (0.192) | 0.325 | -0.088 (0.088) | 0.315 | 0.023 (0.068) | 0.732 | 0.033 (0.080) | 0.681 | 0.054 (0.086) | 0.532 | |
| Rear livestock | 1.322 (0.388) | 0.001*** | 0.004 (0.192) | 0.983 | 0.116 (0.154) | 0.448 | -0.207 (0.185) | 0.263 | 0.073 (0.176) | 0.681 | |
| Distance to nearest market (km) | -0.863 (0.245) | 0.000*** | -0.077 (0.103) | 0.453 | -0.020 (0.085) | 0.813 | -0.118 (0.095) | 0.211 | -0.059 (0.099) | 0.555 | |
| Road condition | -0.497 (0.262) | 0.058* | 0.299 (0.121) | 0.013** | -0.197 (0.108) | 0.068* | 0.058 (0.124) | 0.637 | -0.166 (0.118) | 0.159 | |
| Size of the largest maize plot (acres) | 2.327 (0.608) | 0.000*** | -0.365 (0.252) | 0.147 | -0.042 (0.197) | 0.831 | -0.223 (0.265) | 0.401 | 0.257 (0.214) | 0.231 | |
| Land leased in | 0.470 (0.578) | 0.416 | 0.363 (0.229) | 0.114 | -0.188 (0.217) | 0.386 | -0.025 (0.248) | 0.919 | 0.086 (0.237) | 0.716 | |
| Soil fertility | 0.427 (0.361) | 0.237 | -0.342 (0.203) | 0.091* | 0.129 (0.148) | 0.384 | 0.482 (0.163) | 0.003*** | -0.155 (0.167) | 0.354 | |
| Financial constraints | 0.432 (0.647) | 0.505 | -0.764 (0.411) | 0.063* | -0.087 (0.333) | 0.794 | -0.376 (0.413) | 0.362 | -0.335 (0.359) | 0.352 | |
| Drought 2022 | -0.557 (0.609) | 0.361 | 0.218 (0.253) | 0.389 | -0.589 (0.220) | 0.008*** | 0.262 (0.262) | 0.317 | -0.708 (0.286) | 0.013** | |
| Drought 2023 | -2.016 (0.595) | 0.001*** | -1.434 (0.323) | 0.000*** | 0.153 (0.215) | 0.477 | -1.429 (0.475) | 0.003*** | 0.082 (0.237) | 0.73 | |
| High-yield - weather-sensitive | 0.328 (0.444) | 0.46 | 0.071 (0.180) | 0.694 | -0.307 (0.166) | 0.065* | 0.125 (0.197) | 0.523 | -0.317 (0.177) | 0.073* | |
| Weather Information | -2.301 (0.987) | 0.020*** | -0.385 (0.823) | 0.64 | 0.568 (0.537) | 0.29 | -1.443 (0.745) | 0.053* | 0.252 (0.703) | 0.72 | |
| Constant | 10.168 (5.581) | 0.068* | 3.437 (2.710) | 0.205 | -0.996 (2.266) | 0.66 | 0.447 (2.603) | 0.864 | 6.052 (2.424) | 0.013** | |
| Wald Chi-squared | 100.21*** | 130.1*** | 46.43*** | 129.51*** | 98.83*** | ||||||
| Wald test of exogeneity | - | 7.58*** | 0.77 | 0.29** | 0.08 | ||||||
Notes: Coefficients are shown with robust standard errors (S.E.) in parentheses; ***, **, and * indicate statistical significance at the 1%, 5%, and 10% levels, respectively. "km" stands for kilometers, and "acres" denotes the unit of land measurement.
IV-Probit results show significant treatment effects. Marginal effects at the sample means indicate that WII adoption increases chemical fertilizer use by 123 percentage points (p < 0.01) and improved seed adoption by 10.01 percentage points (coefficient = 1.001, p < 0.01). While manure adoption remains statistically insignificant (p = 0.208), insured farmers replace traditional seeds with modern, insured alternatives (p < 0.01). This substitution aligns with agricultural transformation theory, suggesting that financial products like WII alter the risk-return tradeoff, promoting technology adoption (Karlan et al., 2014).
A comparative analysis of the coefficients reveals that WII adoption has a stronger effect on chemical fertilizer use than improved maize seed adoption (p < 0.01). This supports Carter's capital constraint hypothesis, which posits that WII alleviates liquidity barriers for high-cost inputs like fertilizers (Carter et al., 2016), which typically require 3–5 times the seasonal expenditure of seeds. Farmers prioritize inputs with the steepest financial constraints when risk is mitigated. In contrast, WII adoption reduces traditional seed use (p < 0.01), consistent with Karlan et al. (2014) finding that insured farmers shift toward modern inputs to reduce downside risk. The negligible effect on manure (p = 0.208) suggests that WII does not uniformly promote all inputs, highlighting the role of input-specific economic characteristics, such as cost and substitutability, in shaping adoption patterns (Emerick et al., 2016). These findings underscore that WII's impacts are context-dependent. When risk is mitigated, farmers allocate resources toward higher-return, capital-intensive technologies.
Gender significantly influences input adoption, with women 29.8 percentage points more likely to use manure (p < 0.05). This aligns with findings by Feliciano (2019) on gendered agroecological practices, where women's roles in resource management and livestock care lead them to favor organic inputs. However, this preference may also result from structural constraints, as women often face barriers to accessing credit, land, and markets for modern inputs (Agarwal, 2003). In contrast, education shows a marginally significant negative association with traditional seed adoption (p < 0.1), supporting human capital theory, which suggests educated farmers use networks and market access to adopt improved varieties (Wossen et al., 2015). These patterns highlight the complex relationship between social stratification and agricultural modernization.
Wealth strongly influences input adoption. A one-unit increase in wealth raises the probability of using chemical fertilizers by 19.4 percentage points (p < 0.01) and adopting improved seeds by 29.9 percentage points (p < 0.001), while reducing traditional seed use by 18.9 percentage points (p < 0.01). This supports the risk-coping hypothesis, which suggests that wealthier farmers, with greater liquidity and assets, exhibit higher risk tolerance for adopting productivity-enhancing technologies (Dercon and Christiaensen, 2011). However, this wealth-driven intensification may pose sustainability challenges. Heavy reliance on chemical fertilizers risks long-term soil health and may widen productivity gaps between resource-rich and resource-poor farmers (Ficiciyan et al., 2018).
The effectiveness of Weather Index Insurance (WII) depends on complementary institutional support. Agricultural training boosts chemical fertilizer adoption by 47.6 percentage points (p < 0.05), demonstrating that technical knowledge complements financial risk mitigation. This finding supports the dual constraint framework, where WII alleviates liquidity barriers (Cole et al., 2013) while extension services fill agronomic knowledge gaps (Lei and Yang, 2024). Notably, training has no significant effect on traditional inputs, suggesting that extension programs are more effective in promoting complex, knowledge-intensive technologies like fertilizers rather than simpler inputs like seeds, consistent with trends in Sub-Saharan Africa (Anderson et al., 2020). This differential impact suggests that combining insurance with input-specific training may be more effective than standalone programs, particularly for capital-intensive technologies requiring financial security and technical expertise.
The allocation of household labor to off-farm activities significantly influences agricultural input decisions through opportunity cost mechanisms. Households engaged in off-farm work are 2.21 percentage points less likely to use chemical fertilizers (p < 0.10), supporting Ellis's (2000) theory that labor markets compete with time-sensitive farm operations like fertilizer application. This labor substitution effect does not extend to improved seed adoption (p > 0.10), consistent with Suri's hypothesis (Suri, 2011) that labor-constrained farmers prioritize labor-saving technologies over inputs that require intensive management. This selective adoption pattern aligns with findings from India's National Rural Employment Guarantee Scheme, where off-farm income increased fertilizer opportunity costs but did not affect hybrid seed uptake (Nandy et al., 2021). These results suggest that labor market integration shifts input portfolios toward less management-intensive technologies.
Farm scale also plays a key role in input adoption. Larger farms are 28.8 percentage points more likely to use chemical fertilizers than smallholdings (p < 0.05), supporting the minimum efficient scale hypothesis (McAuliffe, 2015), where bulk procurement and mechanized application make fertilizers economically viable only above certain operational thresholds. This effect mirrors Brazil's agricultural transformation, where fertilizer application rates tripled on farms over 10 hectares (Assunção and Braido, 2007). In contrast, manure adoption remains unaffected by scale (p > 0.10), indicating that manure, a labor-intensive yet low-capital input, is still viable for smallholders. Its low cost and no scale requirements allow its continued use despite agricultural modernization (Sadeghpour and Afshar, 2024).
Transport infrastructure reshapes input adoption through cost reduction and market integration. Improved road conditions increase chemical fertilizer use by 29.9 percentage points (p < 0.05) while reducing manure use by 19.7 percentage points (p < 0.05), demonstrating infrastructure's polarizing effect. This aligns with global evidence that road development lowers fertilizer costs while accelerating the abandonment of labor-intensive organic practices (Shamdasani, 2021). The lack of significant effect on seed adoption (p = 0.15) highlights that infrastructure impacts inputs differently; transport improvements primarily affect fertilizer use, while labor opportunity costs drive manure adoption. These polarizing effects present sustainability trade-offs. Fertilizer use boosts short-term yields but may undermine long-term soil health in vulnerable agroecosystems (Gao et al., 2022). This underscores the need for policies that balance productivity gains with soil preservation, offering a Pareto improvement over blanket subsidies.
Farmers demonstrate complex soil fertility management strategies that challenge universal input use patterns. High-fertility soils increase improved seed adoption by 48.2 percentage points (p < 0.01) while reducing synthetic fertilizer use by 34.2 percentage points (p < 0.10), revealing a substitution effect where natural soil fertility reduces dependence on purchased inputs. This supports Marenya’s findings in western Kenya (Marenya and Barrett, 2009), where smallholders selectively applied fertilizer to marginal soils, leveraging natural fertility when crop responses plateaued, contradicting the complementarity assumed in many WII programs. These results highlight the inefficiency of blanket input prescriptions, suggesting that soil-test-based targeting could enhance nutrient-use efficiency, as shown by Phiri et al. (2021) in Zimbabwe.
Financial constraints are the primary barrier to modern input adoption. Capital-constrained households are 76.4 percentage points less likely to use fertilizer (p < 0.10), nearly double the positive impact of WII participation. This confirms liquidity constraints as the critical adoption bottleneck, supporting observations by Sheahan et al. (2013) that input timing and credit access outweigh risk mitigation. While WII addresses risk-related barriers, its effectiveness is limited by capital scarcity, as seen in Ethiopia (Tofu et al., 2022). These findings underline the need for complementary financial instruments, such as input credit or harvest-contingent repayment, to fully unlock WII's potential, in line with Karlan et al. (2014) framework on liquidity's role in agricultural technology adoption.
The relationship between drought severity and WII efficacy follows a nonlinear threshold pattern. During the moderate 2022 drought, traditional inputs (manure: −58.9 percentage points; traditional seeds: −70.8 percentage points) collapsed, while modern inputs remained stable among insured farmers, confirming WII's ability to sustain adoption under moderate stress. However, the extreme 2023 drought overwhelmed WII's protective mechanisms, causing sharp declines in modern input use. This bifurcated response aligns with Carter et al. (2016) threshold models, highlighting a vulnerability in index-based insurance systems. These findings emphasize the urgent need to redesign WII to maintain effectiveness under escalating climate extremes, especially with the projected increase in drought frequency and severity (IPCC, 2022).
4.1.5. Effect of Weather Index Insurance on Agricultural Input Quantities for Active Users
This analysis moves beyond binary adoption metrics by quantifying how Weather Index Insurance (WII) reshapes input intensification under climate risk. We employ a two-stage instrumental variables (IV) approach, ensuring causal identification with strong first-stage validity (p<0.001) and confirming the exclusion restriction through Wu-Hausman tests. Heteroscedasticity-robust standard errors and endogeneity tests support the robustness of our estimates, mitigating potential biases (Table 5).
Results in Table 5 show that WII induces asymmetric input substitution, consistent with the loss-aversion framework of prospect theory (Shin et al., 2022). Farmers increase high-yield inputs, fertilizers (+28.7 kg/acre, p < 0.001) and improved seeds (+2.6 kg/acre, p < 0.05), while reducing traditional risk-mitigating practices like manure (−27.0 kg/acre, p < 0.001) and traditional seeds (−2.9 kg/acre, p < 0.05). This aligns with Karlan et al. (2014) liquidity hypothesis, where WII payouts alleviate credit constraints, enabling the adoption of productivity-enhancing technologies. However, the near-symmetric trade-off between fertilizer and manure adoption suggests competing risk-management strategies. WII promotes short-term yield maximization at the potential expense of soil health, echoing concerns about "technological lock-in" (Magrini et al., 2019). These findings extend Sibiko and Qaim (2020) by quantifying input-level trade-offs, revealing unintended effects where WII boosts productivity but may exacerbate soil degradation, a critical issue for sustainable intensification (Gao et al., 2022).
Age also mediates input use, challenging conventional adoption narratives. Older farmers apply 5.5 kg/acre more fertilizer (p < 0.01) and 0.5 kg/acre more improved seeds (p < 0.05) for each additional year of age. This suggests a long-term risk-return calculus where experience outweighs initial risk aversion. In contrast, younger farmers' slower adoption reflects liquidity constraints or shorter planning horizons despite their presumed adaptability (Rizzo et al., 2024). These generational differences highlight the limitations of one-size-fits-all programs. Integrating older farmers' experiential knowledge with targeted techno-financial support for younger farmers could better balance productivity and sustainability.
Gender significantly shapes agricultural input allocation. Female-managed plots apply 8.99 kg/acre more chemical fertilizer (p < 0.01) but 0.78 kg/acre less traditional seed (p < 0.05) than male-managed plots. These differences arise from two key factors: gendered labor roles and risk preferences. Women's dual farm-household roles prioritize labor-saving inputs, as chemical fertilizers reduce planting and maintenance demands compared to traditional seeds (Doss, 2015). Additionally, women's greater responsibility for household food security leads to a preference for yield-stabilizing strategies, with chemical fertilizers offering more predictable harvests than traditional seeds, which are vulnerable to pests and climate variability (Doss, 2015). These findings underscore how structural gender disparities, beyond access, shape input decisions, with implications for designing labor-efficient and risk-contingent agricultural technologies.
Liquidity constraints further influence input use. Financial scarcity reduces chemical fertilizer application by 16.7 kg/acre (p < 0.01) and increases manure use by 8.18 kg/acre (p < 0.05). This substitution effect reflects a broader trend where cash-limited farmers prioritize affordability over agronomic efficiency, especially in regions with underdeveloped input markets (Tofu et al., 2022). Manure is a soil amendment and a liquidity buffer, requiring no upfront cash and often sourced from on-farm biomass (Sadeghpour and Afshar, 2024). This highlights the limitations of input promotion programs that overlook household capital constraints, suggesting that financial instruments like input credit are essential for enabling fertilizer adoption among resource-poor farmers.
Climate shocks also shape input decisions. While the 2022 drought had no detectable effect, the prolonged 2023 drought reduced manure use by 6.59 kg/acre (p < 0.05) and increased improved maize seed adoption by 1.11 kg/acre (p < 0.1). This shift aligns with models of sequential climate shocks, where short-term droughts are buffered by savings or informal insurance, but prolonged exposure depletes adaptive reserves (Touch et al., 2024). The increased adoption of drought-tolerant seeds and reduced manure use reflect a risk-avoidance strategy typical of smallholders facing recurrent climate stress (Cacho et al., 2020). The nonlinear nature of these effects underscores that climate adaptation policies must account for the duration of shocks, as single-year interventions may miss the cumulative erosion of resilience under consecutive droughts.
Access to weather forecasts increased manure application by 11.12 kg per acre (p < 0.05), demonstrating how climate information supports adaptive input optimization. Manure's dual benefits, as a drought-resistant soil amendment and a low-risk investment during rainfall uncertainty (Sadeghpour and Afshar, 2024), explain this effect. Weather-informed farmers prioritize low-capital, locally adaptable inputs over volatile, capital-intensive ones, particularly in rainfed systems where climate forecasts improve organic input efficacy (Guido et al., 2020).
These findings highlight the complex interplay of financial, gendered, and agroecological factors in shaping input decisions under climate extremes. Weather Index Insurance (WII) alleviates liquidity and risk constraints, prompting farmers to adopt yield-enhancing practices consistent with risk-averse behavior under climate uncertainty. Notably, input substitution follows nonlinear thresholds. Short-term climate shocks prompt minimal change, but prolonged droughts shift adoption toward modern inputs. This observation, absent from traditional adoption models, shows how farmers' decisions evolve with cumulative climate stress.
5. Conclusion and Policy Recommendations
Agricultural intensification is critical for poverty reduction and food security, yet weather shocks disrupt smallholder farmers' ability to invest in yield-enhancing inputs. Weather Index Insurance (WII) has emerged as a potential solution to mitigate these risks, but its effectiveness in promoting sustained input use remains debated. This study demonstrates that WII accelerates both the adoption and intensification of inputs, specifically chemical fertilizers (+28.7 kg/acre) and improved maize seeds (+2.6 kg/acre), while displacing traditional, low-yield alternatives like manure (−27 kg/acre) and local seeds (−2.9 kg/acre). This dual effect underscores a dilemma: insurance designed to mitigate risk may inadvertently amplify vulnerability by incentivizing input monocultures and eroding agroecological resilience.
Socio-economic and environmental factors such as gender disparities, financial constraints, and infrastructure influence WII’s effectiveness. While our findings support prior studies on WII's positive effects, they reveal critical nonlinearities. For example, female-headed households retain manure despite adopting WII, suggesting rational adaptation (manure's drought resilience) or exclusion from input markets, insights overlooked by standard adoption models. In contrast, households with off-farm income use WII to invest more in high-yield inputs, reflecting a divergence in adaptive capacity that mirrors broader rural financial inequalities. Spatial disparities further reveal infrastructure's polarizing role. improved roads increase chemical fertilizer use and reduce manure use, underscoring the need for geographically adaptive insurance to avoid entrenching unsustainable input dependencies in marginalized areas.
Modern input use was resilient to moderate drought (2022) but declined during severe drought (2023), demonstrating WII's threshold-dependent effectiveness, consistent with climate adaptation models. Farmers deviated from standardized risk models, substituting inputs based on localized risk perceptions, retaining traditional seeds in drought-prone areas despite insurance. In high-fertility soils, WII's influence weakened further, highlighting how agroecological conditions shape the impact of financial interventions. These findings challenge one-size-fits-all resilience models, emphasizing the interplay of biophysical thresholds and local adaptation in determining WII's effectiveness.
These insights advance three theoretical contributions. First, WII's impact on input use is shaped by risk-liquidity interdependence, where liquidity often outweighs risk reduction in marginal environments. Second, socio-economic and agroecological factors influence farmers' responses to WII, highlighting heterogeneous adaptation pathways that challenge monolithic policy solutions. Third, the 2022–2023 drought dichotomy demonstrates that WII's stabilizing effects collapse beyond critical shock thresholds, revealing nonlinear climate resilience that calls for policy redesign to address extreme climate events.
The findings emphasize that Weather Index Insurance (WII) must evolve from a standalone risk-transfer tool to a key component of climate-resilient agricultural systems. Policies should prioritize context-sensitive designs that address local infrastructure gaps, gendered access barriers, and agroecological conditions. For instance, pairing WII with agroecological safeguards, such as premium discounts for maintaining soil organic matter or bundled credit for hybrid fertilizers, can preserve resilient practices like manure use. Gender-responsive delivery, including targeted extension programs and flexible repayment schedules, can also address divergent adaptation pathways between male- and female-headed households.
WII's threshold-dependent effectiveness requires layered resilience strategies to anticipate extreme climate shocks. National agricultural policies should integrate WII with broader safety nets, such as shock-responsive social protection and community seed banks, to prevent input use collapse during severe droughts, as observed in 2023. Public-private partnerships, supported by digital infrastructure, can enhance last-mile delivery in underserved areas, while insurance literacy programs ensure farmers understand WII's limitations. Policymakers can balance short-term risk reduction with long-term sustainability by embedding WII within adaptive agroecologically informed systems, aligning with SDGs on zero hunger and climate action.
Despite the valuable insights of this study, key questions remain, including why female farmers retain manure under WII, whether due to risk aversion, cultural factors, or adaptive strategies, and how WII affects long-term soil carbon. Additionally, the reluctance of younger farmers to adopt modern inputs, despite higher education, warrants further investigation. The cross-sectional design limits causal inferences, and reliance on self-reported data may introduce bias. Future research should employ mixed methods (behavioral experiments, soil monitoring) and quasi-experimental designs to assess causality, alongside longitudinal studies to quantify the hidden costs of lost agroecological practices. Expanding studies to agroecological transition zones, such as semi-arid irrigating regions, would further test WII's adaptability across diverse farming systems.
References
- Agarwal, B. Gender and Land Rights Revisited: Exploring New Prospects via the State, Family and Market. Journal of Agrarian Change 2003, 3, 184–224. [Google Scholar] [CrossRef]
- Aizaki, H.; Furuya, J.; Sakurai, T.; Mar, S.S. Measuring farmers’ preferences for weather index insurance in the Ayeyarwady Delta, Myanmar: a discrete choice experiment approach. Paddy and Water Environment 2021, 19, 307–317. [Google Scholar] [CrossRef]
- Anderson, C.; Reynolds, T.; Biscaye, P.; Patwardhan, V.; Schmidt, C. Economic Benefits of Empowering Women in Agriculture: Assumptions and Evidence. The Journal of Development Studies 2020, 57, 1–16. [Google Scholar] [CrossRef]
- Assunção, J.J.; Braido, L.H.B. Testing Household-Specific Explanations for the Inverse Productivity Relationship. American Journal of Agricultural Economics 2007, 89, 980–990. [Google Scholar] [CrossRef]
- Bastardoz, N.; Matthews, M.J.; Sajons, G.B.; Ransom, T.; Kelemen, T.K.; Matthews, S.H. Instrumental variables estimation: Assumptions, pitfalls, and guidelines. The Leadership Quarterly 2023, 34, 101673. [Google Scholar] [CrossRef]
- Belissa, T.K. Effects of weather index insurance adoption on household food consumption and investment in agricultural inputs in Ethiopia. Journal of Agriculture and Food Research 2024, 16, 101043. [Google Scholar] [CrossRef]
- Benso, M.R.; Gesualdo, G.C.; Silva, R.F.; Silva, G.J.; Castillo Rápalo, L.M.; Navarro, F.A.R.; Marques, P.A.A.; Marengo, J.A.; Mendiondo, E.M. Review article: Design and evaluation of weather index insurance for multi-hazard resilience and food insecurity. Nat. Hazards Earth Syst. Sci. 2023, 23, 1335–1354. [Google Scholar] [CrossRef]
- Cacho, O.J.; Moss, J.; Thornton, P.K.; Herrero, M.; Henderson, B.; Bodirsky, B.L.; Humpenöder, F.; Popp, A.; Lipper, L. The value of climate-resilient seeds for smallholder adaptation in sub-Saharan Africa. Climatic Change 2020, 162, 1213–1229. [Google Scholar] [CrossRef]
- Carter, M.R.; Cheng, L.; Sarris, A. Where and how index insurance can boost the adoption of improved agricultural technologies. Journal of Development Economics 2016, 118, 59–71. [Google Scholar] [CrossRef]
- Castaing, P.; Gazeaud, J.J.P.R.W.P. (2022). Do Index Insurance Programs Live up to their Promises? Aggregating Evidence from Multiple Experiments.
- Central Bank of Kenya. (2023). Report on the Agriculture Sector Survey - September 2023. Retrieved from Kenya: https://www.centralbank.go.ke/uploads/market_perception_surveys/974885965_Agriculture%20Sector%20Survey%20September%202023.pdf.
- Dalhaus, T.; Musshoff, O.; Finger, R. Phenology Information Contributes to Reduce Temporal Basis Risk in Agricultural Weather Index Insurance. Scientific Reports 2018, 8, 46. [Google Scholar] [CrossRef]
- Dercon, S.; Christiaensen, L. Consumption risk, technology adoption and poverty traps: Evidence from Ethiopia. Journal of Development Economics 2011, 96, 159–173. [Google Scholar] [CrossRef]
- Doss, C. (2015). Women and Agricultural Productivity: What Does the Evidence Tell us?
- Emerick, K.; de Janvry, A.; Sadoulet, E.; Dar, M.H. Technological Innovations, Downside Risk, and the Modernization of Agriculture. American Economic Review 2016, 106, 1537–1561. [Google Scholar] [CrossRef]
- FAO (2023). The impact of disasters on agriculture and food security: Avoiding and reducing losses through investment in resilience. Retrieved from Rome:.
- Feliciano, D. A review on the contribution of crop diversification to Sustainable Development Goal 1 “No poverty” in different world regions. Sustainable Development 2019, 27, 795–808. [Google Scholar] [CrossRef]
- Ficiciyan, A.; Loos, J.; Sievers-Glotzbach, S.; Tscharntke, T. More than Yield: Ecosystem Services of Traditional versus Modern Crop Varieties Revisited. Sustainability 2018, 10. [Google Scholar] [CrossRef]
- Fonta, W.M.; Sanfo, S.; Kedir, A.M.; Thiam, D.R. Estimating farmers’ willingness to pay for weather index-based crop insurance uptake in West Africa: Insight from a pilot initiative in Southwestern Burkina Faso. Agricultural and Food Economics 2018, 6, 11. [Google Scholar] [CrossRef]
- Gao, R.; Duan, Y.; Zhang, J.; Ren, Y.; Li, H.; Liu, X.; Zhao, P.; Jing, Y. Effects of long-term application of organic manure and chemical fertilizer on soil properties and microbial communities in the agro-pastoral ecotone of North China. Frontiers in Environmental Science 2022, 10. Retrieved from https://www.frontiersin.org/journals/environmental-science/articles/10.3389/fenvs.2022.993973.
- Government of Kenya. (2019). Government of Kenya (GoK). (2019). Agriculture Sector Transformation and Growth Strategy (ASTS) 2019–2029. Ministry of Agriculture, Livestock, Fisheries, and Cooperatives. Retrieved from https://www.kilimo.go.ke/.
- Government of Kenya. (2022). Nakuru County First County Integrated Development Plan (2018–2022): Kenya Vision 2030 – Towards a Globally Competitive and Prosperous Nation. Retrieved from https://nakuru.go.ke/wp-content/uploads/2022/03/CIDP-2018-2022-Final.pdf.
- Government of Kenya. (2023). National Climate Risk Assessment Report 2023: Impacts on Agriculture and Food Security. Retrieved from https://www.kilimo.go.ke/.
- Guido, Z.; Zimmer, A.; Lopus, S.; Hannah, C.; Gower, D.; Waldman, K.; Krell, N.; Sheffield, J.; Caylor, K.; Evans, T. Farmer forecasts: Impacts of seasonal rainfall expectations on agricultural decision-making in Sub-Saharan Africa. Climate Risk Management 2020, 30, 100247. [Google Scholar] [CrossRef]
- IFA (2021). The hidden risks of being poor: The poverty premium in insurance. Retrieved from https://actuaries.org.uk/media/tpjkodcw/september-2021-the-hidden-risks-of-being-poor.pdf.
- International Finance Corporation. (2015). Agriculture and Climate Risk Enterprise (ACRE) - Kilimo Salama - Kenya, Rwanda, Tanzania. Retrieved from https://documents.worldbank.org/pt/publication/documents-reports/documentdetail/858031490693709582/agriculture-and-climate-risk-enterprise-kilimo-salama-kenya-rwanda-tanzania.
- IPCC (2022). Climate Change 2022: Impacts, Adaptation, and Vulnerability. Retrieved from.
- IPCC (2023). Climate change 2023: Synthesis report. Contribution of Working Groups I, II, and III to the Sixth Assessment Report (AR6). Retrieved from https://www.ipcc.ch/report/ar6/syr/.
- Isaboke, H.; Qiao, Z.; Nyarindo, W. The effect of weather index based micro-insurance on food security status of smallholders. Agricultural and Resource Economics: International Scientific E-Journal 2016, 2, 5–21. [Google Scholar] [CrossRef]
- Janzen, S.A.; Carter, M.R. After the Drought: The Impact of Microinsurance on Consumption Smoothing and Asset Protection. American Journal of Agricultural Economics 2019, 101, 651–671. [Google Scholar] [CrossRef]
- Jensen, N.D.; Mude, A.G.; Barrett, C.B. How basis risk and spatiotemporal adverse selection influence demand for index insurance: Evidence from northern Kenya. Food Policy 2018, 74, 172–198. [Google Scholar] [CrossRef]
- Karlan, D.; Osei, R.; Osei-Akoto, I.; Udry, C. Agricultural Decisions after Relaxing Credit and Risk Constraints *. The Quarterly Journal of Economics 2014, 129, 597–652. [Google Scholar] [CrossRef]
- Kenya Meteorological Department (KMD). (2023). State of Kenya's Climate 2023. Retrieved from.
- Kenya National Bureau of Statistics. (2022). Economic Survey 2022. Retrieved from Kenya: https://www.knbs.or.ke/download/economic-survey-2022/.
- Kuhn, S.; Hazell, P.; Hess, U. (2016). Innovations and Emerging Trends in Agricultural Insurance.
- Lei, X.; Yang, D. (2024). Cultivating Green Champions: The Role of High-Quality Farmer Training in Sustainable Agriculture. Journal of the Knowledge Economy. [CrossRef]
- Liu, X.; Tang, Y.; Ge, J.; Miranda, M.J. Does experience with natural disasters affect willingness-to-pay for weather index insurance? Evidence from China. International Journal of Disaster Risk Reduction 2019, 33, 33–43. [Google Scholar] [CrossRef]
- Maccheroni, F.; Marinacci, M.; Wang, R.; Wu, Q. (2023). Risk Aversion and Insurance Propensity.
- Magrini, M.-B.; Béfort, N.; Nieddu, M. (2019). Chapter 24 - Technological Lock-In and Pathways for Crop Diversification in the Bio-Economy. In G. Lemaire, P.C.D.F. Carvalho, S. Kronberg, & S. Recous (Eds.), Agroecosystem Diversity (pp. 375–388): Academic Press.
- Marenya, P.P.; Barrett, C.B. Soil quality and fertilizer use rates among smallholder farmers in western Kenya. Agricultural Economics 2009, 40, 561–572. [Google Scholar] [CrossRef]
- McAuliffe, R.E. (2015). Minimum Efficient Scale. In Wiley Encyclopedia of Management (pp. 1–1).
- Meza, I.; Eyshi Rezaei, E.; Siebert, S.; Ghazaryan, G.; Nouri, H.; Dubovyk, O.; Gerdener, H.; Herbert, C.; Kusche, J.; Popat, E.; Rhyner, J.; Jordaan, A.; Walz, Y.; Hagenlocher, M. Drought risk for agricultural systems in South Africa: Drivers, spatial patterns, and implications for drought risk management. Science of The Total Environment 2021, 799, 149505. [Google Scholar] [CrossRef]
- Mobarak, A.M.; Rosenzweig, M.R. Informal Risk Sharing, Index Insurance, and Risk Taking in Developing Countries. American Economic Review 2013, 103, 375–380. [Google Scholar] [CrossRef]
- Nandy, A.; Tiwari, C.; Kundu, S. India’s Rural Employment Guarantee Scheme – How does it influence seasonal rural out-migration decisions? Journal of Policy Modeling 2021, 43, 1181–1203. [Google Scholar] [CrossRef]
- Phiri, K.; Mbongeni, N.; Innocent, M.S.; Mkhokheli, S.; Nyathi, D. Understanding climate smart agriculture and the resilience of smallholder farmers in Umguza district, Zimbabwe. Cogent Social Sciences 2021, 7, 1970425. [Google Scholar] [CrossRef]
- Pingali, P.; Sunder, N. Transitioning Toward Nutrition-Sensitive Food Systems in Developing Countries. 2017, 9, 439–459. [CrossRef]
- Powell, D.; Goldman, D. (2014). Moral Hazard and Adverse Selection in Private Health Insurance.
- Rizzo, G.; Migliore, G.; Schifani, G.; Vecchio, R. Key factors influencing farmers’ adoption of sustainable innovations: a systematic literature review and research agenda. Organic Agriculture 2024, 14, 57–84. [Google Scholar] [CrossRef]
- Sadeghpour, A.; Afshar, R.K. Livestock manure: From waste to resource in a circular economy. Journal of Agriculture and Food Research 2024, 17, 101255. [Google Scholar] [CrossRef]
- Sande, J.B.; Ghosh, M. Endogeneity in survey research. International Journal of Research in Marketing 2018, 35, 185–204. [Google Scholar] [CrossRef]
- Schröder, D.; Gilboa Freedman, G. Decision making under uncertainty: the relation between economic preferences and psychological personality traits. Theory and Decision 2020, 89, 61–83. [Google Scholar] [CrossRef]
- Seuret, E. ( 2010). Kilimo Salama: Micro crop insurance through mobile. Retrieved from http://kilimosalama.wordpress.
- Shamdasani, Y. Rural road infrastructure & agricultural production: Evidence from India. Journal of Development Economics 2021, 152, 102686. [Google Scholar] [CrossRef]
- Sheahan, M.; Black, R.; Jayne, T.S. Are Kenyan farmers under-utilizing fertilizer? Implications for input intensification strategies and research. Food Policy 2013, 41, 39–52. [Google Scholar] [CrossRef]
- Shin, S.; Magnan, N.; Mullally, C.; Janzen, S. Demand for Weather Index Insurance among Smallholder Farmers under Prospect Theory. Journal of Economic Behavior & Organization 2022, 202, 82–104. [Google Scholar] [CrossRef]
- Sibiko, K.W.; Qaim, M. Weather index insurance, agricultural input use, and crop productivity in Kenya. Food Security 2020, 12, 151–167. [Google Scholar] [CrossRef]
- Sun, Y. (2022). Enhanced Weather-Based Index Insurance Design for Hedging Crop Yield Risk. Frontiers in Plant Science, Volume 13 - 2022. Retrieved from https://www.frontiersin.org/journals/plant-science/articles/10.3389/fpls.2022.895183.
- Suri, T. Selection and Comparative Advantage in Technology Adoption. Econometrica 2011, 79, 159–209. [Google Scholar] [CrossRef]
- Taherdoost, H. A review of technology acceptance and adoption models and theories. Procedia Manufacturing 2018, 22, 960–967. [Google Scholar] [CrossRef]
- Tang, Y.; Cai, H.; Liu, R. Farmers’ Demand for Informal Risk Management Strategy and Weather Index Insurance: Evidence from China. International Journal of Disaster Risk Science 2021, 12, 281–297. [Google Scholar] [CrossRef]
- Tofu, D.A.; Woldeamanuel, T.; Haile, F. Smallholder farmers’ vulnerability and adaptation to climate change induced shocks: The case of Northern Ethiopia highlands. Journal of Agriculture and Food Research 2022, 8, 100312. [Google Scholar] [CrossRef]
- Touch, V.; Tan, D.K.Y.; Cook, B.R.; Liu, D.L.; Cross, R.; Tran, T.A.; Utomo, A.; Yous, S.; Grunbuhel, C.; Cowie, A. Smallholder farmers’ challenges and opportunities: Implications for agricultural production, environment and food security. Journal of Environmental Management 2024, 370, 122536. [Google Scholar] [CrossRef]
- World Bank. (2011). Weather index insurance for agriculture: Guidance for development practitioners. Agriculture and Rural Development Discussion Paper 50. Retrieved from https://documents.worldbank.org/curated/en/590721468155130451/pdf/662740NWP0Box30or0Ag020110final0web.pdf.
- World Bank. (2023). Climate shocks and agriculture: A review of losses and adaptation in Sub-Saharan Africa (147832). Retrieved from Washington, DC: https://openknowledge.worldbank.org/handle/10986/39873.
- World Bank. (2025). Financial inclusion overview. Retrieved from https://www.worldbank.org/en/topic/financialinclusion/overview.
- Wossen, T.; Berger, T.; Di Falco, S. Social capital, risk preference and adoption of improved farm land management practices in Ethiopia. Agricultural Economics 2015, 46, 81–97. [Google Scholar] [CrossRef]
Figure 1.
Map of Njoro Sub-County.
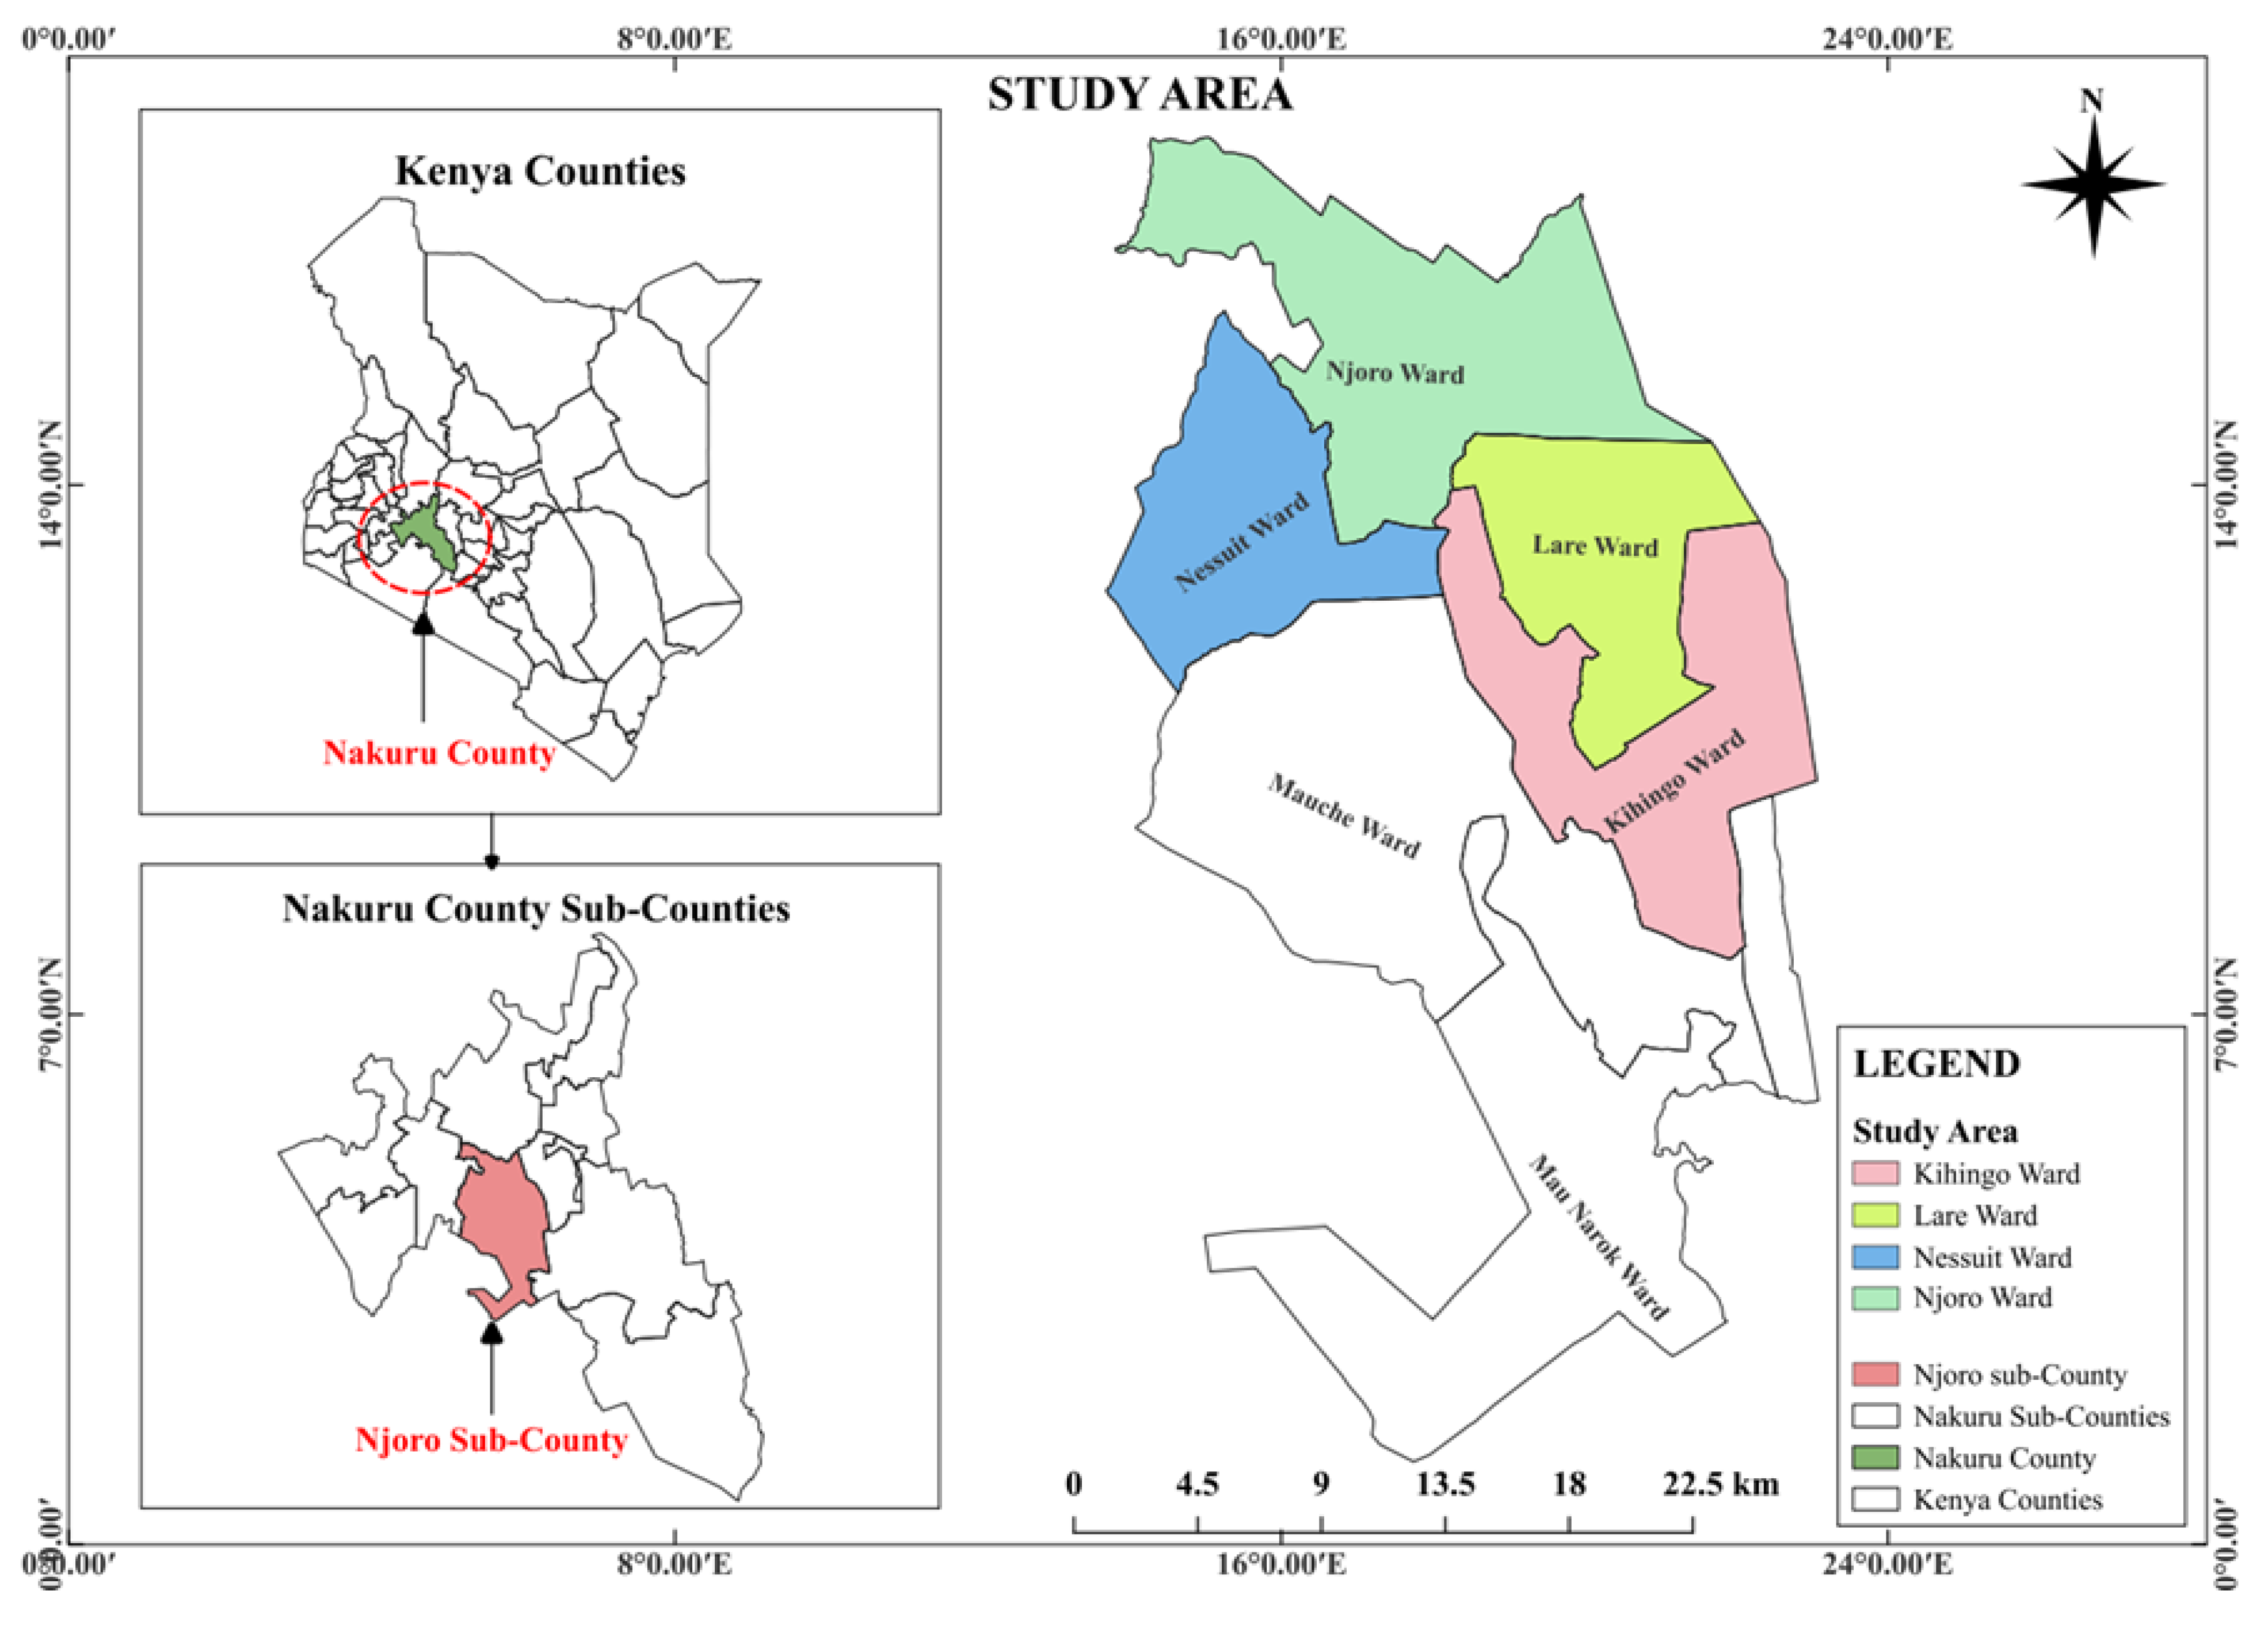
Table 1.
Descriptive statistics of insured and non-insured smallholder farmers.
| Variables | Total (N=400) |
Insured (N=166) | Non-insured (n=234) | p-value |
| Mean (SD) | Mean (SD) | Mean (SD) | ||
| Socio-economic characteristics | ||||
| Age | 49.38 (8.29) | 50.60 (7.65) | 48.52 (8.62) | 0.013** |
| Gender (%) | 69.75 (45.93) | 74.10 (43.81) | 66.67 (47.14) | 0.111 |
| Schooling (years) | 13.37 (4.20) | 13.81 (4.47) | 13.06 (3.99) | 0.081* |
| Household size | 6.07 (2.47) | 6.45 (2.55) | 5.80 (2.37) | 0.009*** |
| Log of annual average income (ksh) | 12.78 (0.63) | 13.03 (0.58) | 7.61 (0.62) | 0.000*** |
| Participation in lottery games (%) | 34.50 (47.54) | 62.05 (48.53) | 14.96 (35.67) | 0.000*** |
| Experienced financial constraints (%) | 95.50 (20.73) | 92.77 (25.90) | 97.44 (15.81) | 0.027** |
| Farm characteristics | ||||
| Maize farming (years) | 14.66 (10.66) | 16.51 (10.16) | 13.35 (10.83) | 0.003*** |
| Total land owned (acres) | 1.77 (1.38) | 2.32 (1.59) | 1.38 (1.05) | 0.000*** |
| Number of plots | 1.34 (1.22) | 1.41 (0.95) | 1.41 (1.38) | 0.565 |
| Institutional characteristics | ||||
| Accessed loan (credit) (%) | 39.00 (48.77) | 39.16 (48.81) | 38.89 (48.75) | 0.957 |
| Farmer group membership (%) | 50.75 (50.00) | 59.04 (49.18) | 44.87 (49.74) | 0.005*** |
| Distance to nearest market (km) | 2.61 (0.97) | 2.47 (0.93) | 2.72 (0.99) | 0.010** |
| Distance to financial institution (km) | 2.93 (1.54) | 1.47 (0.54) | 3.97 (1.12) | 0.000*** |
| Distance to weather station (km) | 2.86 (1.28) | 1.80 (0.58) | 3.61 (1.11) | 0.000 *** |
| Weather index insurance training (%) | 23.25 (42.24) | 43.37 (49.56) | 8.97 (2.86) | 0.000*** |
| Weather/Weather-shock-related characteristics | ||||
| Experienced weather shocks (%) | 77.75 (41.59) | 50.00 (50.00) | 97.44 (15.81) | 0.000*** |
| Access to weather information (%) | 98.75 (11.11) | 99.40 (7.74) | 98.29 (12.96) | 0.326 |
| Average yield loss to weather shocks | 83.78 (36.86) | 75.51 (43.00) | 87.88 (32.64) | 0.017*** |
Notes: Means and standard deviations (SD) are shown in parentheses for each variable. ***, **, and * indicate that the difference in means between sub-groups is statistically significant at 1%, 5%, and 10%, respectively. km denotes kilometres.
Table 2.
Descriptive statistics of general input use patterns among insured and non-insured farmers.
Table 2.
Descriptive statistics of general input use patterns among insured and non-insured farmers.
| Variables | Total | Insured (n=166) |
Non-insured (n=234) |
p-value |
| (n=400) | ||||
| Mean (SD) | Mean (SD) | Mean (SD) | ||
| Used chemical fertilizer (%) | 46.50 (49.94) | 86.75 (34.01) | 17.95 (38.46) | 0.000*** |
| Chemical fertilizer quantity (kg/acre) | 28.06 (35.80) | 58.98 (33.47) | 6.13 (15.39) | 0.000*** |
| Used manure (%) | 49.00 (50.05) | 42.77 (49.62) | 53.42 (49.88) | 0.036** |
| Manure quantity (kg/acre) | 25.97 (31.92) | 15.21 (19.28) | 33.60 (36.61) | 0.000*** |
| Used improved maize seeds (%) | 59.50 (49.15) | 89.76 (30.41) | 38.03 (48.65) | 0.000*** |
| Improved maize seeds (kg/acre) | 6.04 (5.59) | 10.23 (4.24) | 3.07 (4.41) | 0.000*** |
| Used traditional maize seeds (%) | 69.75 (45.99) | 46.99 (50.06) | 85.90 (34.88) | 0.000*** |
| Traditional maize seeds (kg/acre) | 5.62 (4.81) | 2.69 (3.46) | 7.69 (4.56) | 0.000*** |
| Hired labor (%) | 83.00 (37.61) | 95.78 (20.16) | 73.93 (43.99) | 0.000*** |
| Labor (person-days/acre) | 23.64 (15.37) | 32.36 (13.63) | 17.45 (13.42) | 0.000*** |
| Average maize yield (bags/acre) | 12.05 (5.56) | 16.44 (5.26) | 8.94 (3.15) | 0.000*** |
| Cultivated maize (acres) | 1.16 (0.67) | 1.49 (0.67) | 0.92 (0.56) | 0.000*** |
| Number of maize plots | 1.39 (1.22) | 1.34 (0.95) | 1.41 (1.38) | 0.565 |
Notes: Each variable is presented with its mean and standard deviation (SD) (in parentheses). ***, **, and * denote statistically significant mean differences between sub-groups at the 1%, 5%, and 10% significance levels. 'Acre' refers to the unit of land measurement, and 'kg' signifies kilograms.
Table 5.
Analysis of the impact of Weather Index Insurance on agricultural input quantities for active users.
Table 5.
Analysis of the impact of Weather Index Insurance on agricultural input quantities for active users.
| first stage | Chemical fertilizer (kg/acre) |
Manure (kg/acre) |
Improved maize seeds (kg/acre) |
Traditional maize seeds (kg/acre) |
||||||
| Variables | Coefficient (Robust S.E.) | p-value | Coefficient (Robust S.E.) | p-value | Coefficient (Robust S.E.) | p-value | Coefficient (Robust S.E.) | p-value | Coefficient (Robust S.E.) | p-value |
| Distance to the nearest weather station | -3.731 (0.622) | 0.000*** | ||||||||
| Training on insurance products | 2.977 (0.512) | 0.000*** | ||||||||
| WII uptake | - | 28.767 (5.736) | 0.000*** | -27.072 (4.350) | 0.000*** | 2.549 (0.539) | 0.000*** | -2.851 (0.637) | 0.000*** | |
| Age | 0.189 (0.185) | 0.306 | 5.511 (2.677) | 0.041** | 1.456 (1.998) | 0.467 | 0.455 (0.263) | 0.086* | -0.063 (0.288) | 0.827 |
| Age squared | -0.002 (0.002) | 0.267 | -0.055 (0.026) | 0.038** | -0.015 (0.019) | 0.449 | -0.004 (0.003) | 0.113 | 0.001 (0.003) | 0.823 |
| Gender | 0.514 (0.348) | 0.139 | 8.987 (4.441) | 0.045** | 1.276 (4.189) | 0.761 | 0.493 (0.428) | 0.251 | -0.784 (0.450) | 0.082* |
| Schooling | -0.143 (0.048) | 0.003*** | -0.393 (0.527) | 0.457 | 0.711 (0.508) | 0.163 | 0.073 (0.051) | 0.154 | 0.020 (0.050) | 0.689 |
| Training on Agri-production technology | -0.926 (0.476) | 0.052* | -2.060 (4.019) | 0.609 | -1.090 (3.471) | 0.754 | 0.275 (0.398) | 0.49 | 0.357 (0.619) | 0.565 |
| Total land owned | -0.490 (0.186) | 0.009*** | -0.133 (2.236) | 0.953 | 0.101 (1.949) | 0.959 | 0.280 (0.224) | 0.213 | 0.127 (0.265) | 0.633 |
| Land leased out | -0.756 (0.248) | 0.002*** | -1.449 (2.435) | 0.553 | 0.373 (2.075) | 0.857 | -0.255 (0.230) | 0.268 | 0.178 (0.348) | 0.609 |
| Wealth | 0.445 (0.153) | 0.004*** | 0.439 (1.842) | 0.812 | 0.163 (1.722) | 0.925 | 0.215 (0.168) | 0.203 | -0.169 (0.210) | 0.42 |
| Household off-farm labor members | -0.157 (0.074) | 0.034** | -0.498 (0.861) | 0.564 | 0.384 (0.642) | 0.55 | 0.063 (0.083) | 0.453 | -0.044 (0.103) | 0.671 |
| Household farm labor members | -0.189 (0.192) | 0.325 | -0.824 (2.018) | 0.684 | -3.581 (1.608) | 0.027** | -0.370 (0.177) | 0.037** | -0.225 (0.205) | 0.275 |
| Rear livestock | 1.322 (0.388) | 0.001*** | 0.526 (4.494) | 0.907 | -1.646 (3.939) | 0.677 | 0.249 (0.408) | 0.542 | 0.611 (0.477) | 0.202 |
| Distance to nearest market (km) | -0.863 (0.245) | 0.000*** | 2.219 (2.381) | 0.353 | 2.602 (1.944) | 0.182 | -0.132 (0.211) | 0.532 | 0.367 (0.245) | 0.134 |
| Road condition | -0.497 (0.262) | 0.058* | 1.846 (3.394) | 0.587 | 2.872 (2.666) | 0.283 | 0.087 (0.299) | 0.772 | 0.171 (0.315) | 0.588 |
| Size of the largest maize plot (acres) | 2.327 (0.608) | 0.000*** | 3.519 (3.793) | 0.355 | 1.993 (4.674) | 0.67 | -0.331 (0.444) | 0.457 | 0.431 (0.603) | 0.475 |
| Land leased in | 0.470 (0.578) | 0.416 | 1.469 (6.191) | 0.813 | 0.087 (6.108) | 0.989 | 0.823 (0.608) | 0.178 | 0.000 (0.679) | 0.988 |
| Soil fertility | 0.427 (0.361) | 0.237 | 1.825 (4.136) | 0.66 | -0.814 (3.619) | 0.822 | 0.408 (0.406) | 0.316 | -0.626 (0.426) | 0.143 |
| Financial constraints | 0.432 (0.647) | 0.505 | -16.677 (6.096) | 0.007*** | 8.180 (4.484) | 0.070* | 0.510 (0.615) | 0.408 | 0.937 (0.800) | 0.243 |
| Drought 2022 | -0.557 (0.609) | 0.361 | 0.716 (5.511) | 0.897 | 2.831 (3.862) | 0.464 | 0.563 (0.529) | 0.288 | 0.533 (0.629) | 0.397 |
| Drought 2023 | -2.016 (0.595) | 0.001*** | -1.183 (4.395) | 0.788 | -6.593 (3.859) | 0.089* | -1.106 (0.447) | 0.014** | 0.683 (0.615) | 0.268 |
| High-yield - weather-sensitive | 0.328 (0.444) | 0.46 | 4.256 (4.218) | 0.314 | 4.203 (3.736) | 0.262 | -0.288 (0.412) | 0.485 | -0.471 (0.532) | 0.376 |
| Weather Information | -2.301 (0.987) | 0.020** | 10.772 (7.164) | 0.135 | 11.122 (5.673) | 0.052* | 0.697 (0.939) | 0.459 | 1.154 (1.578) | 0.465 |
| Constant | 10.168 (5.581) | 0.068* | -108.060 (73.545) | 0.144 | -9.880 (53.265) | 0.853 | -6.560 (6.539) | 0.317 | 6.881 (7.670) | 0.37 |
| Endogeneity testa | χ² = 0.987 | χ² = 0.653 | χ² = 0.819 | χ² = 0.534 | ||||||
| Heteroscedasticity testb | χ² = 2.75* | χ² = 2.84* | χ² = 26.88*** | χ² = 7.64** | ||||||
Notes: Coefficients are shown with robust standard errors (S.E.) in parentheses; ***, **, and * indicate statistical significance at the 1%, 5%, and 10% levels, respectively. "km" stands for kilometres, and "acres" denotes the unit of land measurement. a. Durbin-Wu-Hausman test statistic; b. Pagan-Hall test statistic.
Disclaimer/Publisher’s Note: The statements, opinions and data contained in all publications are solely those of the individual author(s) and contributor(s) and not of MDPI and/or the editor(s). MDPI and/or the editor(s) disclaim responsibility for any injury to people or property resulting from any ideas, methods, instructions or products referred to in the content. |
© 2025 by the authors. Licensee MDPI, Basel, Switzerland. This article is an open access article distributed under the terms and conditions of the Creative Commons Attribution (CC BY) license (http://creativecommons.org/licenses/by/4.0/).
Copyright: This open access article is published under a Creative Commons CC BY 4.0 license, which permit the free download, distribution, and reuse, provided that the author and preprint are cited in any reuse.


