Submitted:
29 January 2026
Posted:
29 January 2026
You are already at the latest version
Abstract
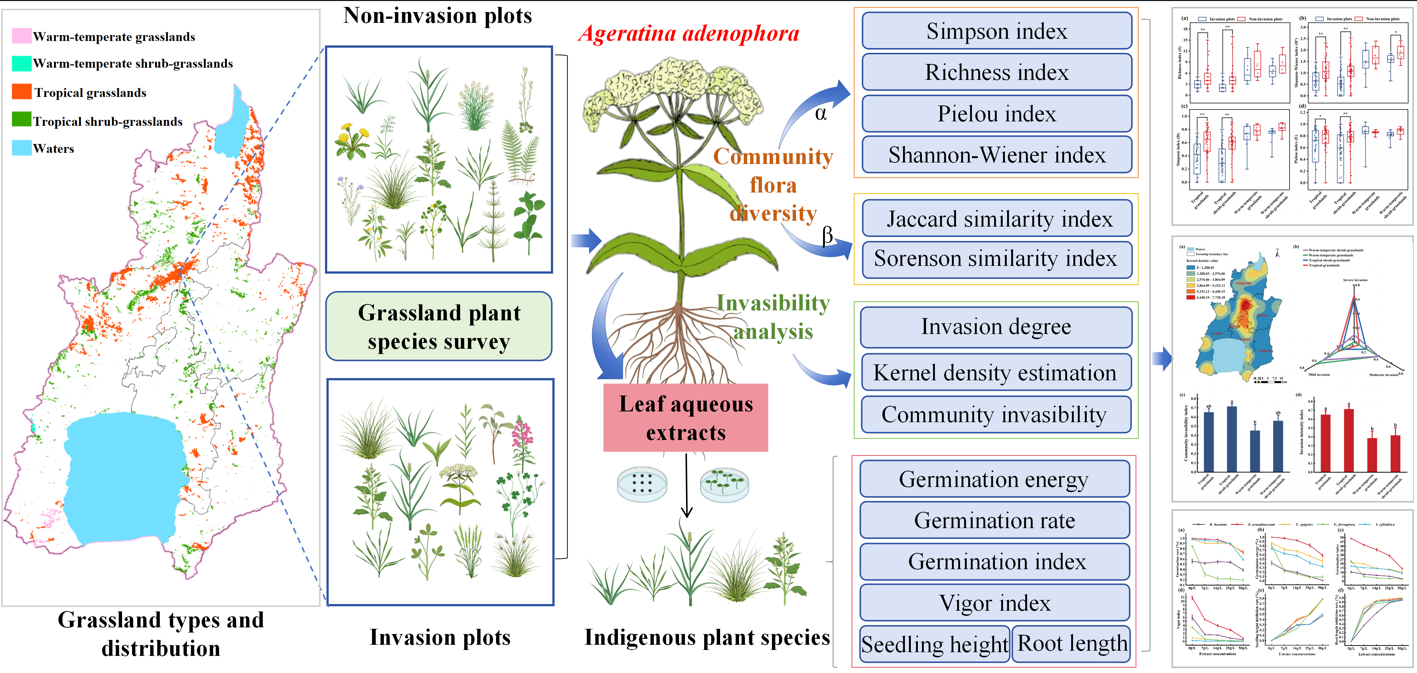
Grasslands degradation, a critical ecological problem worldwide, threatening ecosystem integrity and functional service. Although previous studies have documented the drivers regarding climate change, overgrazing and anthropogenic perturbation, research concerning invasive alien plant impact on grassland ecosystem remains insufficient. The present study, integrating of pairwise field investigation -Ageratina adenophora invasion and non-invasion plots across heterogeneous grassland types (tropical grasslands, TG; tropical shrub-grasslands, TS; warm-temperate grasslands, WG; and warm-temperate shrub-grasslands, WS) and A. adenophora-indigenous plants phytotoxicity bioassay, aims to assess the invasibility and resilience of heterogeneous grassland landscape to A. adenophora invasion. The field investigation demonstrated the greater vulnerability of TG and TS to A. adenophora invasion, whereas WG and WS possessing higher resilience. In addition, regression analysis revealed significant reductions of Shannon-Wiener index and Pielou index as the A. adenophora important value reach the threshold 0.36. Bioassay showed that A. adenophora aqueous extracts inhibit seeds germination and seedlings growth of recipient plants, with Saccharum arundinaceum exhibiting the highest tolerance to A. adenophora stress. In summary, our finding not only highlights the flora communities dynamics and invasibility of diverse grasslands driven by A. adenophora invasion in the subtropic regions but also verifies S. arundinaceum potential for A. adenophora replacement management.
Keywords:
Ageratina adenophora
; important value
; indigenous plant
; interspecific competition
; replacement management
; semi‐natural grasslands
1. Introduction
The grasslands, cover approximately 26% of the global terrestrial area, playing a crucial role in ecosystem service of maintaining biodiversity, carbon sequestration, climate regulation, and biogeochemical cycles [1,2,3,4]. In China, grassland occupy approximately 40 % of the national land area, equivalent to more than 263 million hectares [5]. Semi-natural grasslands, serve as habitats for indigenous herbaceous plants, are characterized as either unimproved or grazed herd pastures that account for 80.59 % of the national grassland area and are predominantly distributed across Tibet, Inner Mongolia, Xinjiang, Qinghai, Gansu, Sichuan, and Yunnan Province [6]. It has been widely recognized that the functional services of ecological barriers offered by grassland play a positive role in ecological conservation and defense against alien plant invasion [7,8,9]. However, both theoretical understanding and practical implementation remain insufficient, constraining the effectiveness of related projects and policies [10].
Yunnan Province, one of the global biodiversity hot spots, located in southwestern China and bordering South and Southeast Asian countries, contains semi-natural grasslands that not only provide pasture and habitat for livestock and diverse wildlife but also serve as ecological barriers against alien invasive organisms migrating from Vietnam, Laos, and Myanmar [11,12]. However, with the rapid growth of China-ASEAN international travel and merchandise importation, the potential risk of invasive alien pests unintentionally introduced into Yunnan and inland increased.
Ageratina adenophora, one of the most aggressive alien Asteraceae species, has raised serious concern among both the public and the academic community worldwide [13,14,15]. In China, A. adenophora was first introduced from Myanmar to Lincang, a prefecture of Yunnan Province, in the 1940s, and rapidly spread inland along the southwestern monsoon [16]. The impact of A. adenophora invasion on plant communities exhibits a complex process and uncertain consequences. Generally, following the alien invasion exacerbate, it leads to a decline in the diversity of native plant species [17,18]. However, in certain cases, the invasion of A. adenophora can also exert a positive effect by increasing the species richness within the native range [19,20]. Consequently, the question arose: besides of geographical proximity and climatic similarity, how the landscape and invasion stage drive local flora composition dynamics? Thus, considering the contradictory perspectives and the insufficient researches focusing on semi-natural grasslands, a multidimensional study addressing the long-term invasion impact of A. adenophora on plant species diversity of grassland ecosystems is required.
It is widely recognized that maintaining the level of species diversity is crucial for sustaining ecosystem stability and integrity [21,22,23]. In addition, species diversity represents a fundamental characteristic of grasslands and an important indicator for assessing the functions of grassland ecosystems [24,25,26]. Therefore, assessing plant species diversity in grasslands facilitates a comprehensive understanding of floral community dynamics and structural attributes [27,28]. Although numerous government-initiated programs and related research have recently achieved considerable progress in managing grasslands alien species, studies focusing on diverse tropic/subtropic semi-natural grasslands addressing diversity loss in long-term invasion scenario, remain comparatively limited. In addition, the invasibiliy and resilience of diverse grassland types to A. adenophora invasion is still not well described yet. Hence, to address this research gap concerning the long-term impact of A. Adenophora on grasslands, the present study, conducted in the semi-natural grasslands of Chengjiang County in central Yunnan, integrates field surveys and laboratory bioassays to: 1) clarify the invasibility of diverse grassland landscapes under long-term A. adenophora invasion; 2) determine the phytotoxic effects of A. adenophora on coexisting indigenous plant species; and 3) assess the feasibility and propose biological solutions using indigenous plant replacement for A. adenophora management.
2. Material and Methods
2.1. Study Area
Chengjiang County, located in central Yunnan Province, China, at geographic coordinates 24° 29′−24° 55′ N and 102° 47′−103° 04′ E, has a mountainous administrative area of 773 km2. It is renowned for Fuxian Lake, the largest national deep freshwater lake, which plays an important role in local ecological preservation and regional climate regulation.
The county includes 3,600 hm2 of grassland, encompassing four grassland types: tropical grasslands (TG), tropical shrub–grasslands (TS), warm-temperate grasslands (WG), and warm-temperate shrub–grasslands (WS) (Figure 1; Table S1). The region experiences a monsoon climate characteristic of the central subtropical plateau, with an annual precipitation ranging from 872 to 1028 mm (Figure 2a) and annual temperature range of 11.14–17.35 ℃ (Figure 2b). It is a typical hilly area in the central Yunnan Plateau, with a maximum slope of 65° (Figure 2c) and predominantly east–northwest slope orientation (Figure 2d). The highest elevation, 2802 m, is found at Mount Liangwangshan, while the lowest elevation, 1282 m, occurs at the confluence of the Nanpanjiang and Haikou Rivers.
2.2. Investigation Methods and Data Collection
2.2.1. Plot Design and Investigation
The survey was conducted in the Chengjiang grasslands between June and September 2023. Based on the grassland types (TG, TS, WG, and WS) and corresponding acreage,pairwise plots- invasion plot and corresponding non–invasion plot belonging to identical grassland types with similar ecological characteristics (elevation, slope, and slope aspect) were sequentially investigated. Specifically, in each 0.5 hm2 plot, the simple random sampling method was applied to establish five small quadrats (1 × 1 m) [29]. The invasion plot area covered approximately 0.5% of each grassland type to ensure maximum representativeness. During the survey, the abundance, height, and coverage of plant species were documented, along with ecological indicators, longitude, latitude, and elevation. Plant height was measured using a scale with an accuracy of 1 mm, whereas abundance was visually assessed by counting the above–ground parts of individual plants.
2.2.2. Meteorologic and Geographic Data Sources
Climate variables were obtained from the World Climate Database (https://www.worldclim.org/), extracting two variables: annual mean temperature and annual precipitation. The Spatial Analyst tool in ArcGIS 10.8 was used for sampling and extracting climate data. Topographic variables were derived from the Geospatial Data Cloud (http://www.gscloud.cn/), where DEM data, slope, and aspect analyses were performed using the 3D Analyst tool in ArcGIS 10.8.
2.3. Effect of A. Adenophora Aqueous Extract on Indigenous Plants’ Seedling Growth
Herbaceous species with high occurrence frequency found in both invasion and non–invasion plots were selected as recipient plants against A. Adenophora extracts stress, including Imperata cylindrica, Saccharum arundinaceum, Eragrostis ferruginea, Calamagrostis epigeios, and Rumex hastatus. Plants of A. adenophora and seeds of the recipient plants were collected from the invasion plots. Fresh leaves of A. adenophora were shade–dried, ground, and sieved through a 40–mesh sieve. An aqueous extract was prepared by soaking 5 g of leaf tissue in 100 mL of distilled water for 48 hr, followed by filtration through two layers of gauze to obtain a 50 g/L extract. Extract concentrations of 25, 14, and 7 g/L were prepared by dilution with distilled water, while distilled water served as the control. Each concentration was dissolved in agar at 10 g/L with heating. Then, 20 mL of the agar solution was poured into 9-cm-diameter petri dishes containing five layers of filter paper to create agar–based germination substrates. The seeds of herbaceous plants were surface–sterilized in 0.1% (w/v) NaClO solution for 10 min, rinsed thoroughly with distilled water three times, and air–dried. Fifty seeds of each herbaceous species were placed on filter paper for the germination assay, with five replicates per extract concentration, including the control. The seeds were then cultivated in an intelligent artificial climate chamber (PRX–1200B, Ningbo Saifu Experimental Instrument) under 16 hr of illumination, 8 hr of darkness, at a temperature of 25 ± 1 ℃, and relative humidity of 90% ± 0.8 (%RH). Germination counts were recorded daily for each treatment. On the 20th day of cultivation, 30 seedlings per treatment were randomly selected for root length and shoot height measurements. An additional 20 seedlings per treatment were harvested to determine fresh weight. Germination and seedling vigor were calculated based on the following formulas [30]:
Where N3 is the number of seeds germinated on the 3rd day; Ntotal is the total seeds tested; Ngerm is the cumulative number of germinated seeds; Gt is the number of seeds germinated on t day; Dt is the number of days to germination; W is the average fresh weight (g) of 20 seedlings.
2.4. Data Analysis
The Kernel Density Estimation (KDE) analysis was conducted using ArcGIS 10.8 to clarify and visualize the spatial distribution and relative abundance of A. adenophora in grasslands. The variation in density was measured using an established distance decay function, which was employed to explore the distribution and changing characteristics of density hot spots within spatial regions [31]. The invasion intensity index and community invasibility index were calculated to assess the invasion intensity of A. adenophora and the degree of community invasibility [32].
where ni is the number of individuals of species i in the plot; N is the total number of all species in the individual plot; Pi is the observed relative abundance of A. adenophora in one invaded plot; MaxPi is the maximum of the relative abundance of A. adenophora among all invaded plots.
The similarity index was utilized to compare differences in species abundance and community composition across various plots along latitude and longitude gradients to validate whether biodiversity distribution adheres to gradient variation patterns. The Jaccard similarity index was applied to examine differences between all plots, and species were quantified based on presence–absence data. β-diversity was also assessed using the Sorensen similarity index [34,35].
where a denote the number of species recorded in invasion plots; b is the number of species in non-invasion plots; c is the number of species common to both plots.
Microsoft Excel 2019 was used for data organization and for calculating Alpha and Beta diversity. IBM SPSS Statistics 26 was utilized to perform a one-way ANOVA test, with results expressed as mean values and standard errors, as well as Pearson and Spearman correlation analyses. Origin 2021 was employed for plotting figures, while ArcGIS 10.8 was employed for extracting data and mapping the climate and topography of the survey plots, as well as for kernel density estimation (KDE) analysis.
3. Results
3.1. KDE Analysis of the Local-Scale Geographic Spatial Pattern of A. adenophora
The KDE analysis revealed that A. adenophora distributed in a mosaic and unevenly scattered pattern across six townships in the grasslands. Higher density values, ranging from 5152 to 7728, converged in the region spanning three townships, Yousuo, Jiucun, and Fenglu, which are located either in central municipal townships or rural–urban fringe areas. In contrast, the areas of Haikou, Longjie, and Yangzong, which are mainly rural and distant from downtown or major communication lines, exhibited comparatively lower density, with an approximate average kernel density value of 3560 (Figure 3a). This result confirmed that transportation convenience and anthropogenic disturbances exacerbated the propagation of A. adenophora through human-mediated seed dispersal [36].
3.2. Comparative Analysis of A. adenophora Invasion Degree in Different Grassland Types
A total of 28 invasive plots of A. adenophora were investigated. Statistically, the invasion plots were categorized as 27.14% mildly invasive, 18.57% moderately invasive, and 54.29% severely invasive plots. Among the different grassland types, TG (10 plots) and TS (14 plots) exhibited the highest proportions of severe invasion (66.00% and 60.00%, respectively). In contrast, WG and WS, with 2 plots each, were predominantly mildly invaded, at rates of 60.00% and 50.00%, respectively (Figure 3b). The results indicated that the invasion degree in both TG and TS was higher than that in WG and WS, demonstrating that TG and TS experienced greater damage caused by A. adenophora invasion.
3.3. The Community Invasibility Variation of Individual Grassland Types
The grassland community invasibility analysis revealed that the community invasibility index followed a descending order-TS > TG > WS > WG (p < 0.05) (Figure 3c). In contrast, although TS exhibited the highest average invasion intensity index, the differences among grasslands were not significant (Figure 3d). This finding indicated that, compared to WG and WS, both TS and TG were more vulnerable to A. adenophora invasion, possessing stronger community adaptability and invasion competitiveness.
3.4. Plant Community Comparison Between Invasion and Non-Invasion Grasslands
Although both invasion (I) and non-invasion (N) plots share several plant species (common species), the statistics consistently demonstrated a reduction in plant species numbers in invasion plots across all grassland types (Figure 4a). Cluster analysis showed that plant species can be divided into four complementary clades (Figure 4b, c). Specifically, for WT and WS, A. adenophora invasion significantly altered community composition, with both grassland types comprising more species in non-invasion plots than in the corresponding invasion plots. For example, in WG, 33 species were identified, 23 and 29 species were documented in the invasion plots and non-invasion plots, respectively (Figure 4a). Remarkably, three species were present in invasion plots but absent in non-invasion plots, e.g A. adenophora, Phragmites australis and Ipomoea purpurea. In contrast, nine species were present in non-invasion plots but absent in invasion plots, including Rubus parvifolius, Pennisetum alopecuroides, Malvastrum coromandelianum, Dodonaea viscosa, Lespedeza bicolor, Cynoglossum furcatum, Origanum vulgare, Lactuca tatarica, and Capillipedium parviflorum (Figure 4b). Similarly, in WS, 29 species were recorded, with 21 and 25 species in invasion and non-invasion plots, respectively (Figure 4a). Invasion plots exclusively contained four species (A. adenophora, D. viscosa, Potentilla discolor, and Clinopodium megalanthum), while eight species (Erigeron canadensis, Eragrostis pilosa, Gentiana cruciata, Pistacia weinmanniifolia, Dipsacus asper, Bothriochloa ischaemum, Argentina lineata, and Aegopodium podagraria) occurred only in non-invasion plots (Figure 4b). These results indicated that WG and WS consisted of heterogeneous plant species among inter-grassland types and that A. adenophora invasion squeezed native plants from habitats and distinctly altered community composition.
Differing from WG and WS, the TG and TS grasslands comprised more abundant plant species. The greater number of plant species in these two grassland types indicated that they possessed higher plant species richness. Figure 4c indicates that in TG, 85 species were found, with 38 and 80 species in invasion plots and non-invasion plots, respectively (Figure 4a). Exceptionally, A. adenophora, Phytolacca acinosa, Clematis yunnanensis, Cynoglossum amabile, and Artemisia selengensis existed only in invasion plots, whereas Cymbopogon goeringii, Rubus rosifolius, Oenothera biennis, Trifolium repens, Urena lobata, Lotus corniculatus and Fagopyrum dibotrys were identified only in non-invasion plots. In addition, E. ferruginea, R. hastatus, Bidens pilosa, S. arundinaceum, S. scandens, I. cylindrica, A. argyi, and 31 other species coexisted in both plot types (Figure 4c). In TS, 98 species were identified. Among them, 42 and 89 species were discovered in invasion and non-invasion plots, respectively (Figure 4a). Specifically, nine species were found only in invasion plots, such as A. adenophora, Dodonaea viscosa, Buddleja officinalis, Datura stramonium, Phytolacca acinosa, Clematis yunnanensis, Equisetum arvense, Urtica fissa, and Ipomoea purpurea. In contrast, 56 species existed only in non-invasion plots. Similar to TG, 33 species were identified in both invasion and non-invasion plots (Figure 4c).
The investigation results demonstrated distinct plant species compositions across different grassland types, reflecting the drastically diversified ecogeography in the survey area. Generally, TG and TS fostered a more diverse flora than WG and WS (Figure 4a). In all grassland types, over 20 plant species coexisted in both invasion and non-invasion plots.
3.5. Alpha Diversity
Alpha diversity analysis showed that the Richness index (S) was higher in non-invasion than in invasion plots across all grassland types. Specifically, for TG and TS, there were highly significant differences (p < 0.01) between the pairwise plots (Figure 5a). Likewise, regarding the Shannon-Wiener index (H′), all grassland types exhibited a trend similar to the Richness index between non-invasion and invasion plots, for WS, there was a significant difference (p < 0.05) between them (Figure 5b). The Simpson index (D) was higher in non-invasion plots than in invasion ones across all grassland types, indicating that A. adenophora invasion decreased species diversity within individual grassland communities. Except for WG and WS, there were highly significant difference (p < 0.01) between invasion and non-invasion plots in TG and TS (Figure 5c). The Pielou index (E) of non-invasion plots was higher than that of invasion plots, except for WG, meanwhile it exhibited a significant difference (p < 0.05) between invasion and non-invasion plots in TG, and for TS, there was a highly significant difference (p < 0.01) between them. Among these four grassland types, the difference between the Pielou indices of WG plots showed the highest variation, resulting in an opposite trend (Figure 5d). Based on these results, it was implied that both TG and TS were more vulnerable to A. adenophora invasion than WG and WS.
3.6. Beta Diversity
The invasion and non-invasion plots of TG and TS exhibited moderate dissimilarity with Jaccard similarity indices of 0.2185 and 0.2012, respectively (Table 1). WG and WS also exhibited moderate dissimilarity with Jaccard similarity indices of 0.2698 each. This indicates that the invasion of A. adenophora remarkably altered grassland community assembly, as reflected by the greater differences in species composition and the reduction in the number of commonly shared species.
Sorenson similarity analysis showed moderate dissimilarity between the invasion and no-invasion plots of TG and TS, with similarity indices of 0.3587 and 0.3350, respectively (Table 2). There was moderate dissimilarity between WG and WS, with Sorenson’s similarity indices both being 0.4250. These values were consistent with Jaccard’s similarity indices, indicating that the invasion of A. adenophora resulted in a decrease in plant species diversity within the A. adenophora-invaded grassland community.
3.7. The Regression Analysis Between A. adenophora Importance Values (IV) and Grassland Flora Alpha Diversity
The regression analysis results showed that, within the invaded plots, there was a highly significant linear relationship between A. adenophora IVs and the Simpson index (R2 = 0.8922) (Figure 6c), followed by the Shannon-Wiener index (Figure 6a) (R2 = 0.8226), the Richness index (Figure 6b) (R2 = 0.6336), and the Pielou index (Figure 6d) (R2 = 0.5958). Specifically, it demonstrated that both of Shannon-Wiener index and Pielou index inverted U-shaped correlated with IVs of A. adenophora, and once IVs increase and reach the shreshold 0.36 would decrease these two indices (Figure 6a,d). These findings revealed that A. adenophora invasion exerted a sophisticated effect on grassland community dynamics, the IVs of A. adenophora, the extent of invasion significantly shaping flora composition assemblage.
Meanwhile, A. adenophora’s importance values were significantly positively correlated with longitude (p < 0.01). In contrast, they were significantly negatively correlated with annual precipitation, with a coefficient of 0.17 (p < 0.01) (Figure 6e). These results indicated that the colonization and invasion degree of A. adenophora were determined by multiple ecogeographical factors, including altitude, average annual temperature and annual precipitation.
3.8. The Inhabitory Effect of A. adenophora Aqueous Extracts on Seedling Growth of Native Plants
For screening potential native plant species in grassland, five herbaceous species with economic value and ecological importance, I. cylindrica, S. arundinaceum, E. ferruginea, C. epigeios, and R. hastatus, identified in both invasion and no-invasion plots (Figure 4b,c), were selected for laboratory bioassay. The results showed that germination rates (Figure 7a), germination energy (Figure 7b), germination index (Figure 7c), and vigor index (Figure 7d) of the five plants decreased with increasing concentrations of A. adenophora leaf aqueous extract. Specifically, the aqueous extract exerted an inhibitory effect on seedling height and root length of all tested plants (Figure 7e,f). However, S. arundinaceum exhibited the best integrative performance across five indices: germination rate, germination energy, germination index, vigor index, and seedling height inhibition rate. These results indicated that S. arundinaceum demonstrated the highest tolerance to A. adenophora leaf aqueous allelochemicals.
The seedling growth index of indigenous plant species under A. adenophora leaf aqueous extract stress likely reflects these species’ richness and competitiveness within A. adenophora-invaded plots. Spearman correlation analysis was conducted between the seedling growth indices of the screened native plant species and corresponding field data to verify this hypothesis. Table 3 indicates that, except for Rumex hastatus and Imperata cylindrica, germination energy, vigor index, seedling height, and root length were correlated with relative density and height of S. arundinaceum, C. epigeios, and E. ferruginea (Table 3).
4. Discussions
4.1. The Impact of A. adenophora Invasion on the Grassland Plant Diversity
A considerable body of literature has reported that A. adenophora is capable of adapting to a diverse range of habitats, such as uncultivated land, cropland, woodland, and roadsides [17,18,37]. Generally, within three to five years of invasion, native herbaceous plants are directly or indirectly affected by competitive exclusion, leading to the exclusive community formation by A. adenophora. This process results in a decrease in the number and abundance of native species within the invaded habitats. In the present survey, all A. adenophora-invaded grassland plots exhibited a trend of decreasing plant species richness, indicating that the invasion has significantly altered the species composition and structure of the grassland ecosystem. Therefore, the declining or absent native plant species in the invaded plots were squeezed from the original grassland patches (Figure 4b,c). Alpha diversity analysis revealed that in A. adenophora-invaded plots, the Pielou index, Richness index, Shannon–Wiener index, and Simpson index were significantly lower than those of the non-invaded plots across different grassland types. Similar studies have also demonstrated that plant species index decreased significantly or very significantly in habitats severely invaded by A. adenophora [38,39]. Under conditions of abundant ecological niches in specific ecosystems, A. adenophora invasion can facilitate the colonization of indigenous plant species [40]. Similarly, in the present investigation, some indigenous plant species such as D. viscosa, P. discolor, and C. megalanthum were found in invasion plots but were absent in non-invaded ones (Figure 4b,c).
Beta diversity indices are defined to assess the degree of change in species composition within biocoenosis across environmental gradients, reflecting not only the distribution of species diversity within a region but also the relationship between species and their environment [41]. In the present research, Beta diversity analysis of plants showed that the Jaccard similarity index and Sorenson similarity index exhibited moderate dissimilarity between the invasion and non-invasion plots of TG and TS, whereas they exhibited high dissimilarity in WG and WS. In conclusion, the dissimilarity of Beta diversity across different grassland types is probably associated with the sophisticated invasion process of A. adenophora and the specific species composition of each grassland type. In addition, low species similarity within an ecosystem indicates high variation in species composition, a low number of shared species, and high variability in species turnover [42]. The present findings provide complementary evidence that A. adenophora possesses remarkable adaptive, competitive, and invasive abilities compared to co-occurring plant species in grasslands of differing ecosystem types and species richness, potentially resulting in varied consequences depending on the invaded grassland type.
4.2. The Relationship Between A. adenophora Importance Values and Flora Community Diversity
The investigation of invasion plots showed that the importance values of A. adenophora range from 0.09 to 1.00 across all grassland types. Nonlinear curve-fitting regression analysis indicated that as the importance value of A. adenophora increased and reached the threshold of 0.36, the Shannon-Wiener and Pielou indices peaked, after which the alpha diversity index gradually declined (Figure 6a and Figure 6d). This finding implied that, within a specific threshold, an A. adenophora community with a lower importance value facilitates the maintenance of indigenous flora diversity. This is consistent with previous research showing that biological invasions usually decrease biodiversity on a global scale but increase species diversity on a regional scale [43,44]. Although substantial observations have been documented in numerous contexts, the mechanisms underlying these phenomena are worth investigating through interspecific allelopathic assays between endangered grassland plant species and A. adenophora.
4.3. The Allelopathic Effect of A. adenophora on the Native Plants
The aggressive competitiveness of A. adenophora is attributed to its secretion of allelochemicals that suppress adjacent plant species in the ecosystem. It revealed that volatile compounds in its root secretions negatively affect seed germination in other plants [45]. Previous research reported that the aqueous extract of A. adenophora leaves inhibited Triticum aestivum, Lens culinaris, Pinus roxburghii, Brassica campestris, and Quercus leucotrichophora in terms of seed germination and seedling development efficiency [46,47]. Despite the inhibitory potential of A. adenophora, in the present study, both invasive and non-invasive plots commonly shared a certain number of plant species (Figure 4b,c). Therefore, it was rationally speculated that these coexisting indigenous plants can be more tolerant to the hydrosoluble allelochemicals in A. adenophora leaf tissue. One of the recipient native plant species, S. arundinaceum showed strong tolerance against A. adenophora stress. A correlation analysis between the seedling growth indices obtained from the bioassay and their growth indices (relative density, relative height, and relative coverage) indicates that the indicators of seed germination and seedling growth of native plants indirectly reflect the in situ population conditions (relative height, relative cover, and others) in grasslands. Therefore, it is rationally speculated that the use of A. adenophora-indigenous plant allelopathic bioassay results can estimate individual native plant species communities in situ within an A. adenophora-invaded ecosystem. However, more intensive research is required to provide supporting evidence.
Using indigenous plants with economic or ecological value in replacement control approaches have been validated a promising alternative for IAP management. For example, Sonneratia apetala and S. caseolaris have been utilized to control Spartina alterniflora through alternative planting while promoting the restoration of native mangrove forests [48]. In the present study, the recipient plant S. arundinaceum, characterized by conspicuous tillering potential, multipurpose use, strong tolerance to diverse eco-geographical conditions, and genetic relation to sugarcane, combined with its superior tolerance to A. adenophora leaf aqueous extracts, makes it the optimal candidate for replacement control of A. adenophora. However, long-term localized field experiments are still required for further validation.
Supplementary Materials
The following supporting information can be downloaded at the website of this paper posted on Preprints.org. Table S1: Statistic of grasslands types and acreage in Chengjiang County; Table S2: Effects of A. adenophora leaf extracts on seedling height and root length of native plants.
Author Contributions
Conceptualization, L.Z. and L.G.; Methodology, L.Z.; Writing-Original draft preparation, L.Z.; Investigation, L.Z., Q.Z., N.P., L.X., Y.W., S.W. and Y.X.; Data curation, L.G., Q.Z. and N.P.; Visualization, L.Z., L.X. and S.L.; Validation, L.G. and L.X.; Supervision, Y.X., D.W. and S.W.; Resources, Y.X. and Y.W.; Writing-Reviewing and Editing, L.Z., L.G., D.W. and Y.X.; All authors have read and agreed to the published version of the manuscript.
Funding
This work was supported by the National Natural Science Foundation of China (Grant numbers: 31760500); Pests Survey of Chengjiang County Grasslands (Grant numbers: H20210198); and Yunnan Biodiversity Conservation Foundation (Grant numbers: YNBCF202401).
Data Availability
All data generated and analyzed during this study are included in this published article and its supplementary information files, further inquiries can be directed to the corresponding author. The software and codes used in this study were described in the methods section.
Acknowledgments
The authors are grateful to Zhengping Ju and Yunxue Huang in the field survey instruction and ArcGIS technical assistance and to the survey collaborative convenience provided by Forestry and Grassland Ministration of Chengjiang County. The authors are thankful to the editor and reviewers for their valuable comments and suggestions which helped in improving the quality of the manuscript.
Competing Interests
The authors declare no conflicts of interest.
References
- Bai, Y.; Cotrufo, M.F. Grassland soil carbon sequestration: Current understanding, challenges, and solutions. Sci. 2022, 377, 603–608. [Google Scholar] [CrossRef] [PubMed]
- Fang, J.; Xiong, K.; Chi, Y.; Song, S.; He, C.; He, S. Research advancement in grassland ecosystem vulnerability and ecological resilience and its inspiration for improving grassland ecosystem services in the Karst desertification control. Plants 2022, 11, 1290. [Google Scholar] [CrossRef] [PubMed]
- Liu, Z.; Zhou, Q.; Ma, Q.; Kuang, W.; Daryanto, S.; Wang, L.; Wu, J.; Liu, B.; Zhu, J.; Cao, C.; et al. Scale effect of climate factors on soil organic carbon stock in natural grasslands of northern China. Ecol. Indic. 2023, 146, 109757. [Google Scholar] [CrossRef]
- Liu, P.; Chi, Y.; Huang, Z.; Zhong, D.; Zhou, L. Multidimensional response of China’s grassland stability to drought. Glob. Ecol. Conserv. 2024, 52, e02961. [Google Scholar] [CrossRef]
- Li, J.; Huang, L.; Cao, W.; Wang, J.; Fan, J.; Xu, X.; Tian, H. Benefits, potential and risks of China’s grassland ecosystem conservation and restoration. Sci. Total. Environ. 2023, 905, 167413. [Google Scholar] [CrossRef]
- Ministry of Natural Resources. People’s republic of China, main data bulletin of the third national land survey. Xinhua news agency. 2021. Available online: http://www.mnr.gov.cn/dt/ywbb/202108/t20210826_2678340.html.
- Guido, A.; Altesor, A.; Cayssials, V.; Lezama, F.; Mello, A.L.; Paruelo, J.; Baeza, S. Patterns and drivers of alien plant invasion in Uruguayan grasslands. J. Veg. Sci. 2024, 35, e13306. [Google Scholar] [CrossRef]
- Onandia, G.; Schittko, C.; Ryo, M.; Bernard-Verdier, M.; Heger, T.; Joshi, J.; Kowarik, I.; Gessler, A. Ecosystem functioning in urban grasslands: The role of biodiversity, plant invasions and urbanization. PloS one 2019, 14, e0225438. [Google Scholar] [CrossRef]
- Cheng, C.; Liu, Z.; Song, W.; Chen, X.; Zhang, Z.; Li, B.; van Kleunen, M.; Wu, J. Biodiversity increases resistance of grasslands against plant invasions under multiple environmental changes. Nat. Commun. 2024, 15, 4506. [Google Scholar] [CrossRef]
- Wang, X.; Wang, X.; Zhang, X.; Zhou, J.; Jia, Z.; Ma, J.; Yao, W.; Tu, Y.; Sun, Z.; Wei, Y. Ecological barriers: An approach to ecological conservation and restoration in China. Ambio 2024, 53, 1077–1091. [Google Scholar] [CrossRef]
- Xie, B.; Jones, P.; Dwivedi, R.; Bao, L.; Liang, R. Evaluation, comparison, and unique features of ecological security in southwest China: A case study of Yunnan Province. Ecol. Indic. 2023, 153, 110453. [Google Scholar] [CrossRef]
- Liu, F.; Zhang, Q.; Wang, J.; Liu, Y.; Wang, W.; Li, S. Ecological security assessment of Yunnan Province, China in the context of Production-Living-Ecological space division. Ecol. Evol. 2024, 14, e70131. [Google Scholar] [CrossRef]
- Tang, S.; Pan, Y.; Wei, C.; Li, X.; Lü, S. Testing of an integrated regime for effective and sustainable control of invasive Crofton weed (Ageratina adenophora) comprising the use of natural inhibitor species, activated charcoal, and fungicide. Weed Biol. Manage. 2019, 19, 9–18. [Google Scholar] [CrossRef]
- Changjun, G.; Yanli, T.; Linshan, L.; Bo, W.; Yili, Z.; Haibin, Y.; Xilong, W.; Zhuoga, Y.; Binghua, Z.; Bohao, C. Predicting the potential global distribution of Ageratina adenophora under current and future climate change scenarios. Ecol. Evol. 2021, 11, 12092–12113. [Google Scholar] [CrossRef] [PubMed]
- Ren, Z.; Okyere, S.K.; Wen, J.; Xie, L.; Cui, Y.; Wang, S.; Wang, J.; Cao, S.; Shen, L.; Ma, X.; et al. An Overview: The Toxicity of Ageratina adenophora on Animals and Its Possible Interventions. Int. J. Mol. Sci. 2021, 22, 11581. [Google Scholar] [CrossRef] [PubMed]
- State Environmental Protection Administration. List of the first batch of invasive alien species in China. 2003. Available online: https://www.mee.gov.cn/gkml/zj/wj/200910/t20091022_172155.html.
- Kumar, M.; Garkoti, S.C. People’s perception and awareness towards plant invasion, its impacts on forest ecosystem services and livelihood: A tale of Central Himalayas. Environ. Manage. 2025, 75, 33–45. [Google Scholar] [CrossRef]
- Tang, C.Q.; Du, M.R.; Wang, H.C.; Shi, Y.C.; Zeng, J.L.; Xiao, S.L.; Han, P.B.; Wen, J.R.; Yao, S.Q.; Peng, M.C.; et al. An unprotected vulnerable relict subtropical conifer-Keteleeria evelyniana: Its forests, populations, growth and endangerment by invasive alien plant species in China. Plant divers. 2024, 46, 648–660. [Google Scholar] [CrossRef]
- Gribben, P.E.; Poore, A.G.B.; Thomsen, M.S.; Quesey, P.; Weschke, E.; Wright, J.T. Habitat provided by native species facilitates higher abundances of an invader in its introduced compared to native range. Sci. Rep. 2020, 10, 6385. [Google Scholar] [CrossRef]
- Capinha, C.; Essl, F.; Porto, M.; Seebens, H. The worldwide networks of spread of recorded alien species. Proc. Natl. Acad. Sci. 2023, 120, e2201911120. [Google Scholar] [CrossRef]
- Chun, J.H.; Lee, C.B. Partitioning the regional and local drivers of phylogenetic and functional diversity along temperate elevational gradients on an East Asian peninsula. Sci. Rep. 2018, 8, 2853. [Google Scholar] [CrossRef]
- Han, W.; Chen, L.; Su, X.; Liu, D.; Jin, T.; Shi, S.; Li, T.; Liu, G. Effects of soil physico-chemical properties on plant species diversity along an elevation gradient over alpine grassland on the Qinghai-Tibetan Plateau, China. Front. Plant Sci. 2022, 13, 822268. [Google Scholar] [CrossRef]
- Lv, S.; Wang, Z.; Liu, H.; Zhang, F.; Zhang, H. Changes of plant diversity under different functional classifications in desert steppe. Glob. Ecol. Conserv. 2025, e03851. [Google Scholar] [CrossRef]
- Whittaker, R.J. Meta-analyses and mega-mistakes: Calling time on meta-analysis of the species richness-productivity relationship. Ecology 2010, 91, 2522–2533. [Google Scholar] [CrossRef] [PubMed]
- Li, W.; Shen, Y.; Wang, G.; Ma, H.; Yang, Y.; Li, G.; Huo, X.; Liu, Z. Plant species diversity and functional diversity relations in the degradation process of desert steppe in an arid area of northwest China. J. Environ. Manage. 2024, 365, 121534. [Google Scholar] [CrossRef] [PubMed]
- Ye, K.; Li, J.; Liang, Z.; Zhao, X.; Luo, H.; Chen, Z.; Du, P.; Wu, K.; Qiao, R.; Hu, J. Overgrazing impacts plant species diversity in alpine wetlands indirectly by altering its environmental dependency. Glob. Ecol. Conserv. 2025, 59, e03532. [Google Scholar] [CrossRef]
- Natalia, R.; Sergey, K.; Michał, S.; Xianyong, C.; Snezhana, Z. Postglacial history of the Steppe Altai: Climate, fire and plant diversity. Quat. Sci. Rev. 2020, 249, 106616. [Google Scholar] [CrossRef]
- Oishi, Y. Factors that shape the elevational patterns of plant diversity in the Yatsugatake Mountains, Japan. Ecol. Evol. 2021, 11, 4887–4897. [Google Scholar] [CrossRef]
- Shiyomi, M.; Takahashi, S.; Yoshimura, J. A measure for spatial heterogeneity of a grassland vegetation based on the beta-binomial distribution. J. Veg. Sci. 2000, 11, 627–632. [Google Scholar] [CrossRef]
- García-Locascio, E.; Valenzuela, E.I.; Cervantes-Avilés, P. Impact of seed priming with Selenium nanoparticles on germination and seedlings growth of tomato. Sci. Rep. 2024, 14, 6726. [Google Scholar] [CrossRef]
- Windyaraini, D.H.; Nurcahyo, R.W.; Umniyati, S.R.; Widayani, P.; Hadisusanto, S. Spatial study of dengue and its association with livestock farming in Bantul Regency, Yogyakarta Province, Indonesia. Vet. World 2024, 17, 2667–2674. [Google Scholar] [CrossRef]
- Wang, C.; Wei, M.; Wang, S.; Wu, B.; Cheng, H. Erigeron annuus (L.) Pers. and Solidago canadensis L. antagonistically affect community stability and community invasibility under the co-invasion condition. Sci. Total Environ. 2020, 716, 137128. [Google Scholar] [CrossRef]
- Brown, K.A.; Scatena, F.N.; Gurevitch, J. Effects of an invasive tree on community structure and diversity in a tropical forest in Puerto Rico. For. Ecol. Manage. 2006, 226, 145–152. [Google Scholar] [CrossRef]
- Sorenson, T. A method of establishing groups of equal amplitudes in plant sociology based on similarity of species content and its application to analyses of the vegetation on Danish Commons. Kongelige danske videnskabernes selskab. Biologiske Skrifter 1948, 5, 1–34. Available online: https://api.semanticscholar.org/CorpusID:135206594.
- Tefera, Y.; Lulekal, E.; Warkineh, B. Human-forest interaction of useful plants in the Wof Ayzurish Forest, North Showa Zone, Ethiopia: Cultural significance index, conservation, and threats. J. Ethnobiol. Ethnomed. 2025, 21, 16. [Google Scholar] [CrossRef] [PubMed]
- Zhang, K.; Gu, R.; Yang, Y.; Yan, J.; Ma, Y.; Shen, Y. Recent distribution changes of invasive Asteraceae species in China: A five-year analysis (2016-2020). J. Environ. Manage. 2025, 376, 124445. [Google Scholar] [CrossRef] [PubMed]
- Niu, H.B.; Liu, W.X.; Wan, F.H.; Liu, B. An invasive aster (Ageratina adenophora) invades and dominates forest understories in China: Altered soil microbial communities facilitate the invader and inhibit natives. Plant soil 2007, 294, 73–85. [Google Scholar] [CrossRef]
- Horvitz, N.; Wang, R.; Zhu, M.; Wan, F.H.; Nathan, R. A simple modeling approach to elucidate the main transport processes and predict invasive spread: River-mediated invasion of A geratina adenophora in China. Water Resour. Res. 2014, 50, 9738–9747. [Google Scholar] [CrossRef]
- Jia, G.; Xue, Y. The invasive inhabit diversity of Eupatorium adenophorum and Eupatorium odoratum in Guangxi. Ecol. Environ. 2011, 20, 819–823. [Google Scholar] [CrossRef]
- Potgieter, L.J.; Shrestha, N.; Cadotte, M.W. Prioritizing sites for terrestrial invasive alien plant management in urban ecosystems. Ecol. Solut. Evid. 2022, 3, e12160. [Google Scholar] [CrossRef]
- Tuomisto, H. A diversity of beta diversities: Straightening up a concept gone awry. Part 1. Defining beta diversity as a function of alpha and gamma diversity. Ecography 2010, 33, 2–22. [Google Scholar] [CrossRef]
- Albrecht, J.; Peters, M.K.; Becker, J.N.; Behler, C.; Classen, A.; Ensslin, A.; Ferger, S.W.; Gebert, F.; Gerschlauer, F.; Helbig-Bonitz, M.; et al. Species richness is more important for ecosystem functioning than species turnover along an elevational gradient. Nat. Ecol. Evol. 2021, 5, 1582–1593. [Google Scholar] [CrossRef]
- Timsina, B.; Shrestha, B.B.; Rokaya, M.B.; Münzbergová, Z. Impact of Parthenium hysterophorus L. invasion on plant species composition and soil properties of grassland communities in Nepal. Flora. Morphol. Distrib. Funct. Ecol. Plants 2011, 206, 233–240. [Google Scholar] [CrossRef]
- Zhang, L.M.; Tan, X.; Dong, Z. Effects of Alternanthera philoxeroides invasion on plant diversity in the riparian zones of downtown Chongqing in the Three Gorges Reservoir area. Journal of Grassland Industry 2022, 31, 13–25. [Google Scholar] [CrossRef]
- Darji, T.B.; Adhikari, B.; Pathak, S.; Neupane, S.; Thapa, L.B.; Bhatt, T.D.; Pant, R.R.; Pant, G.; Pal, K.B.; Bishwakarma, K. Phytotoxic effects of invasive Ageratina adenophora on two native subtropical shrubs in Nepal. Sci. Rep. 2021, 11, 13663. [Google Scholar] [CrossRef]
- Das, M.B.B.; Acharya, B.D.; Saquib, M.; Chettri, M.K. Effect of aqueous extract and compost of invasive weed Ageratina adenophora on seed germination and seedling growth of some crops and weeds. J. Biodivers. Conserv. Bioresour. Manage. 2018, 4, 11–20. [Google Scholar] [CrossRef]
- Khatri, K.; Negi, B.; Bargali, K.; Bargali, S.S. Toxicological assessment of invasive Ageratina adenophora on germination and growth efficiency of native tree and crop species of Kumaun Himalaya. Ecotoxicology 2024, 33, 697–708. [Google Scholar] [CrossRef]
- Zhou, T.; Liu, S.; Feng, Z.; Liu, G.; Gan, Q.; Peng, S. Use of exotic plants to control Spartina alterniflora invasion and promote mangrove restoration. Sci. Rep. 2015, 5, 12980. [Google Scholar] [CrossRef]
Figure 1.
Overview of study area in grasslands of Chengjiang County. WG, warm-temperate grasslands; WS, warm-temperate shrub-grasslands; TG, tropical grasslands; TS, tropical shrub-grasslands.
Figure 1.
Overview of study area in grasslands of Chengjiang County. WG, warm-temperate grasslands; WS, warm-temperate shrub-grasslands; TG, tropical grasslands; TS, tropical shrub-grasslands.
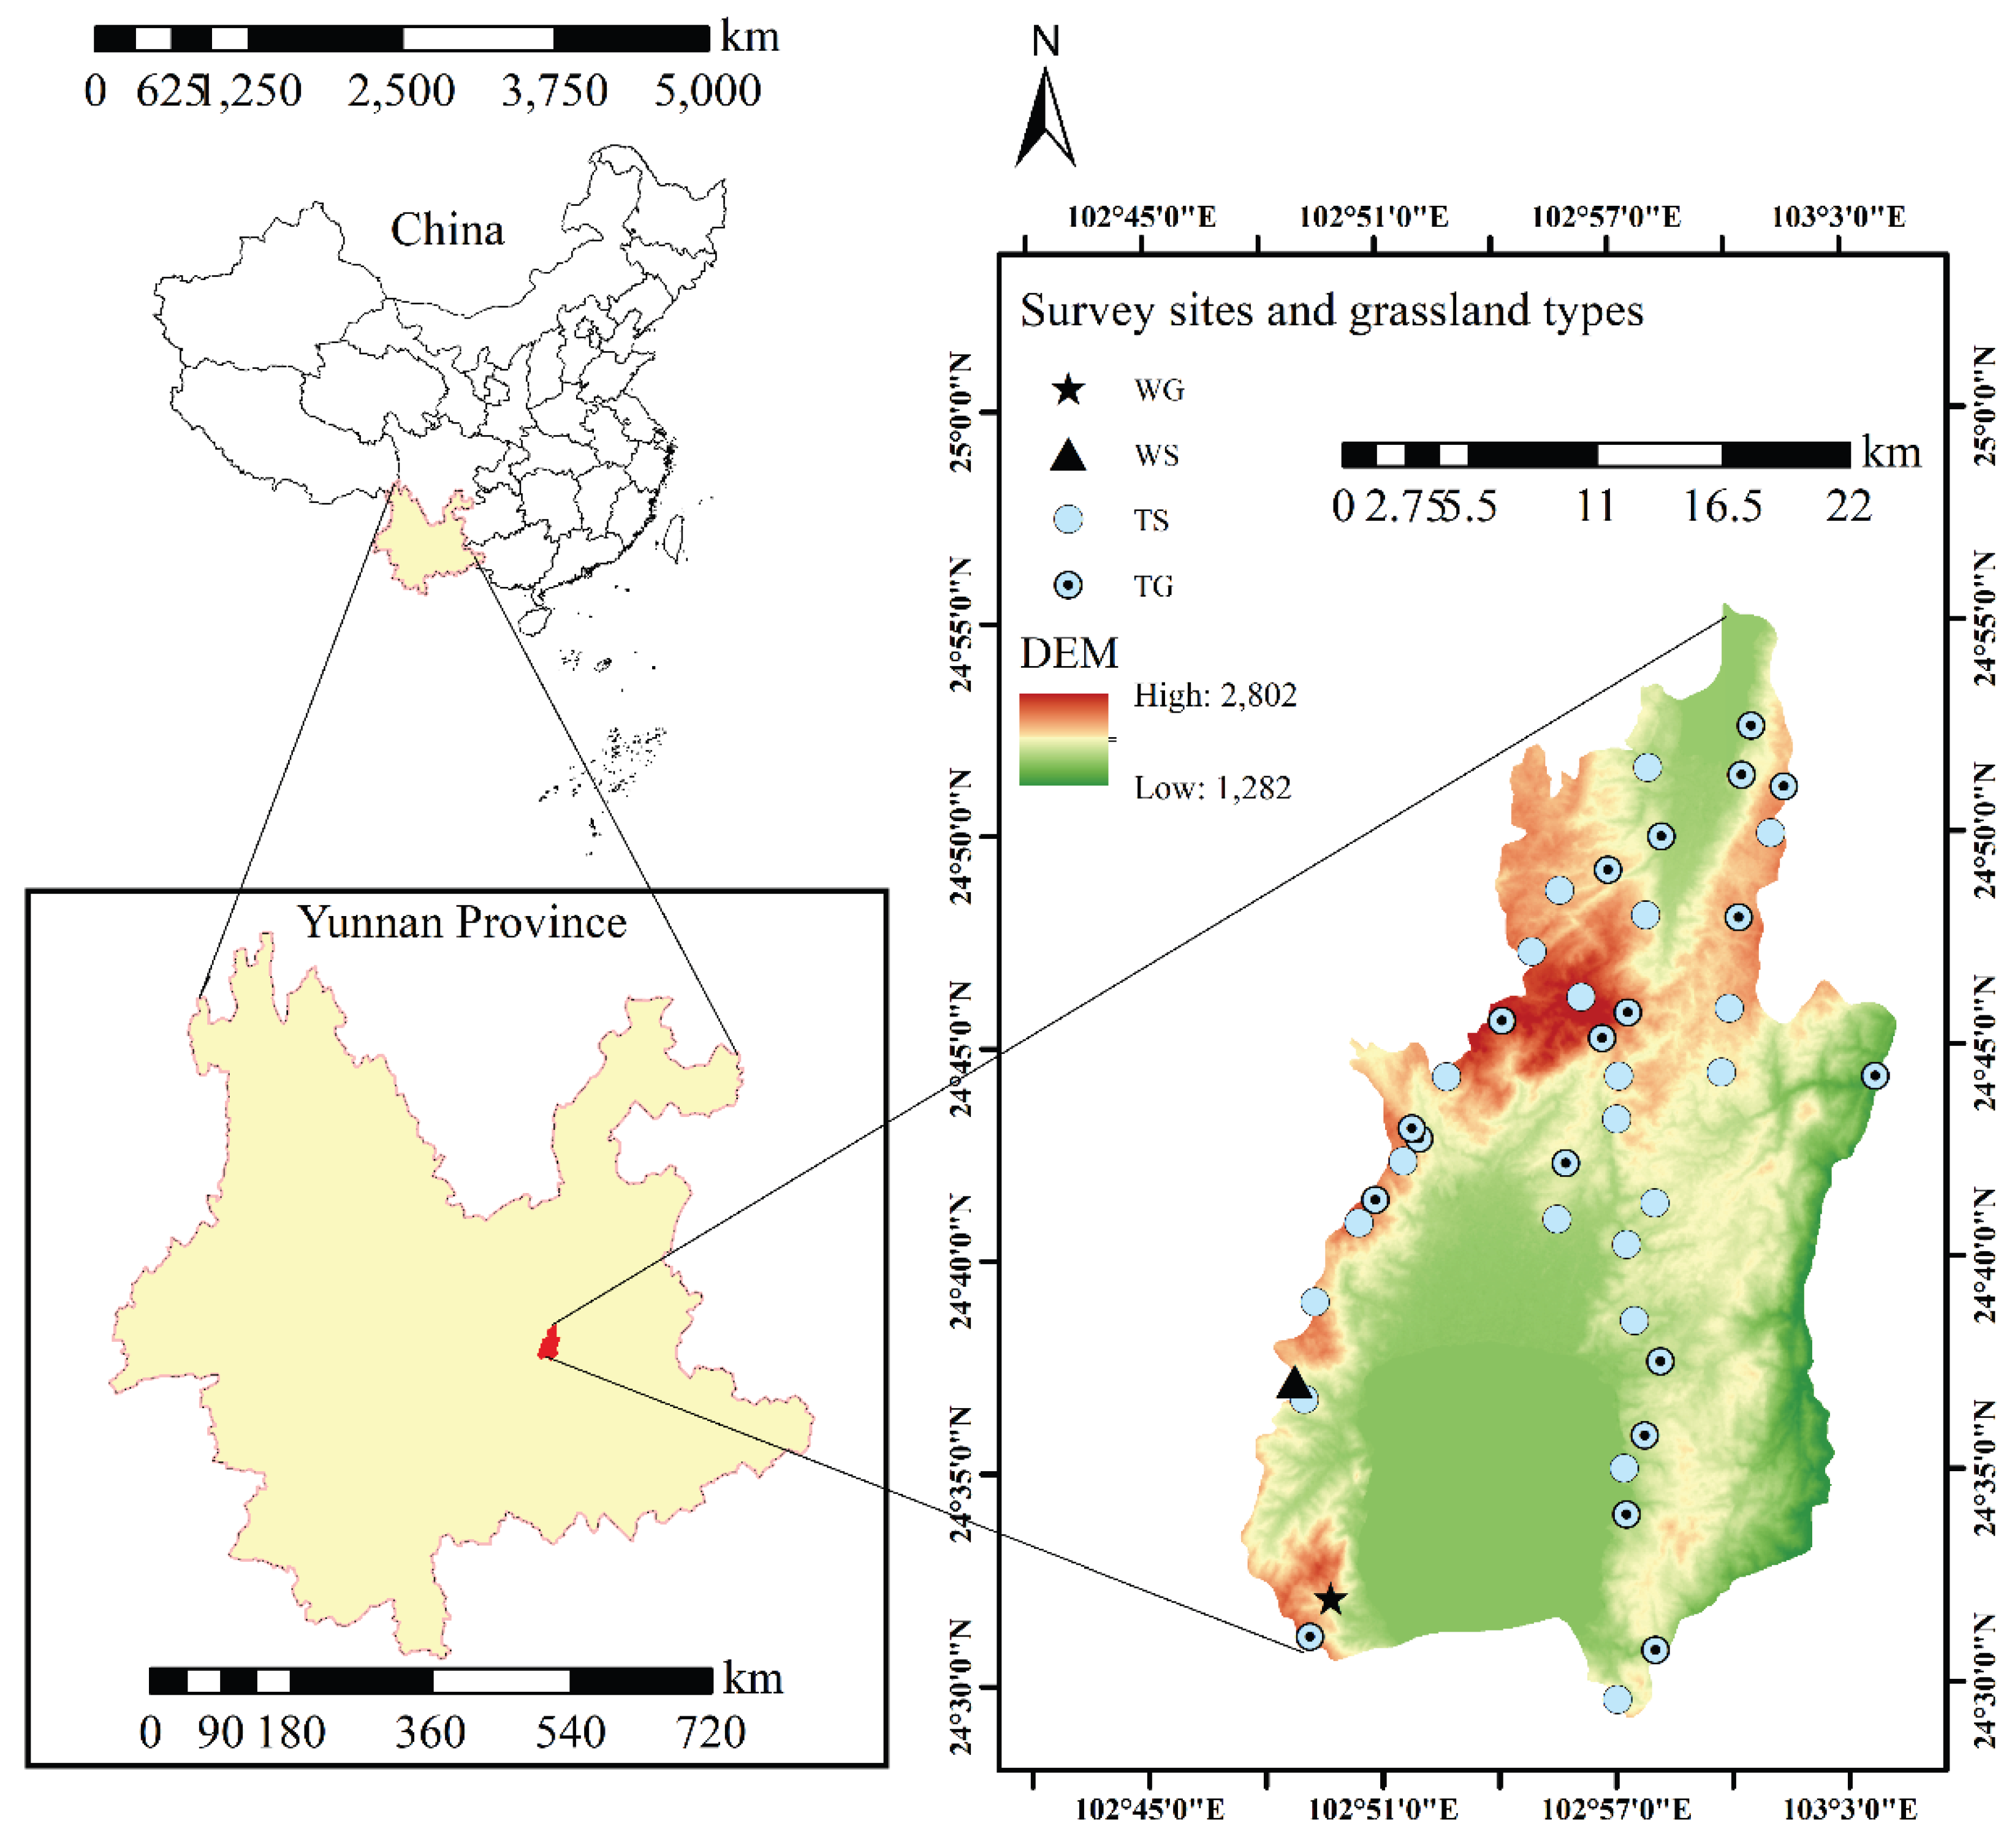
Figure 2.
Topographical and climatic features of Chengjiang County, Yunnan Province. (a), Annual precipitation; (b), Annual average temperature; (c), Slope; (d), Slope aspect. The data cited from the world data climate database (https://www.worldclim.org/) and geospatial data cloud (http://www.gscloud.cn/).
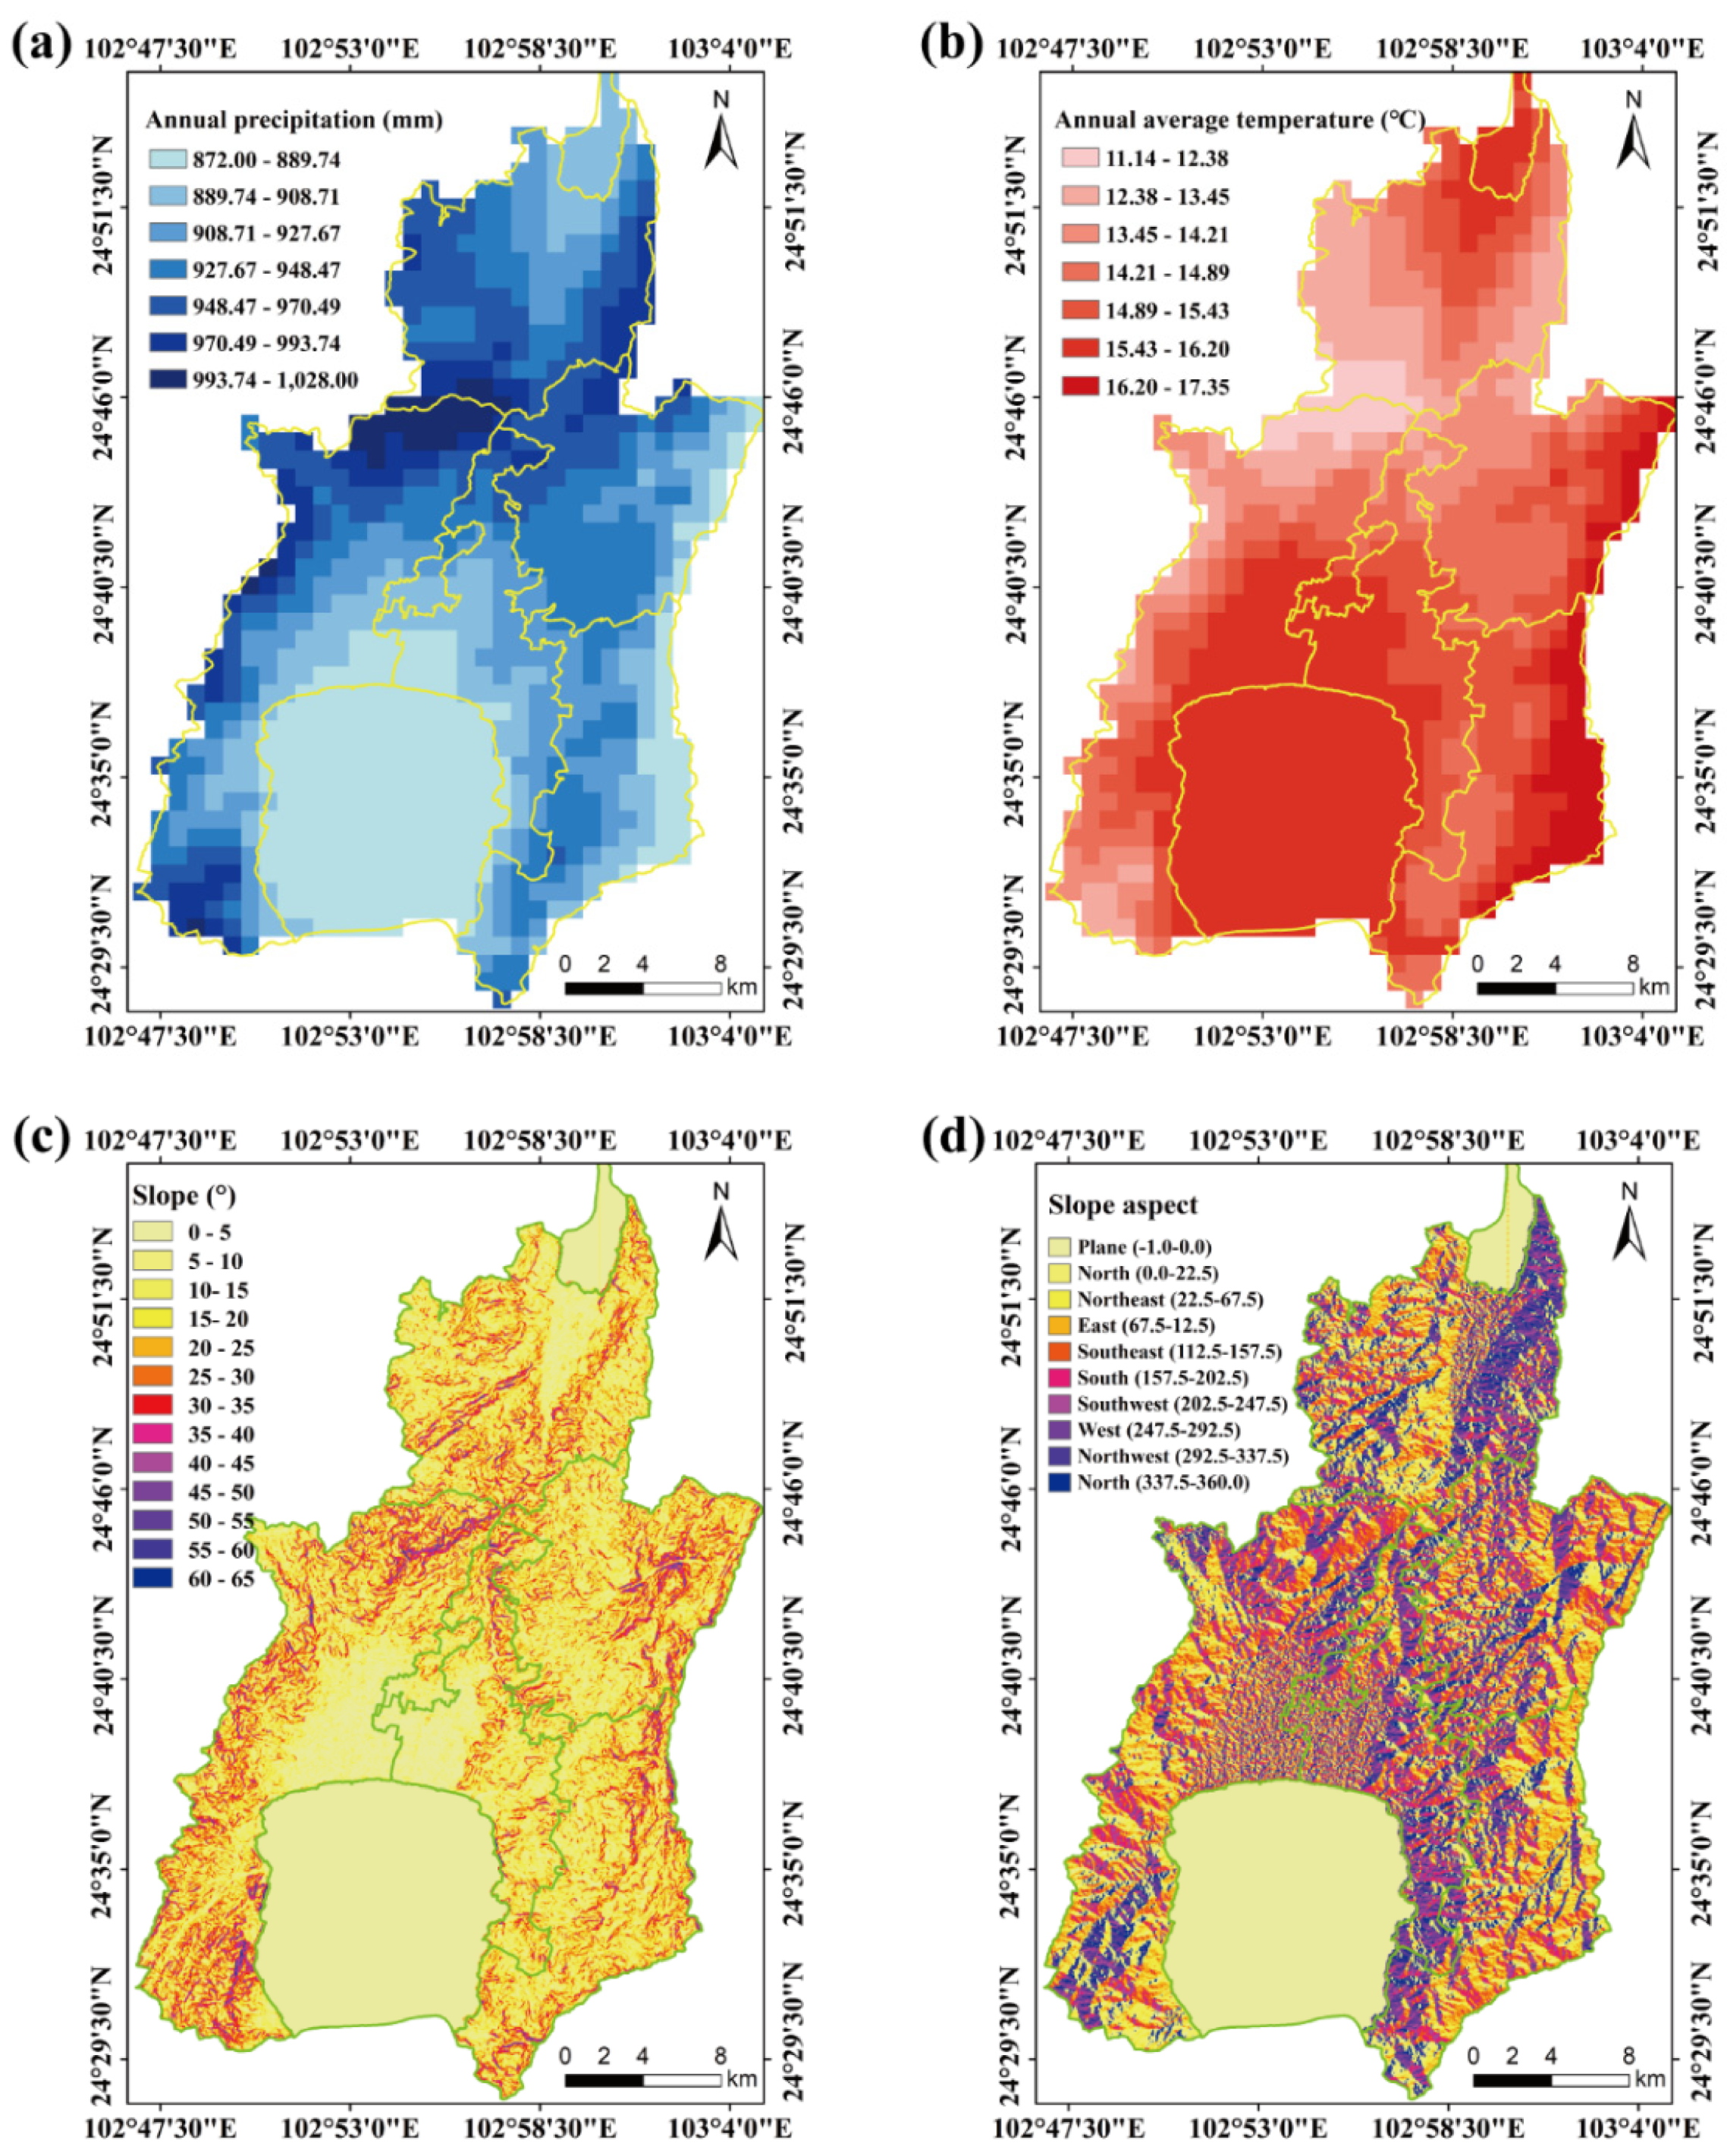
Figure 3.
Community invasibility and invasion intensity analysis of A. adenophora in the grasslands of Chengjiang County. (a), Schematic kernel density estimation analysis of A. adenophora distribution in Chengjiang grasslands by using ArcGIS; (b), Invasion degree of A. adenophora in different grassland types; (c), Community invasibility index of different grassland types; (d), invasion intensity index of A. adenophora in different grassland types.
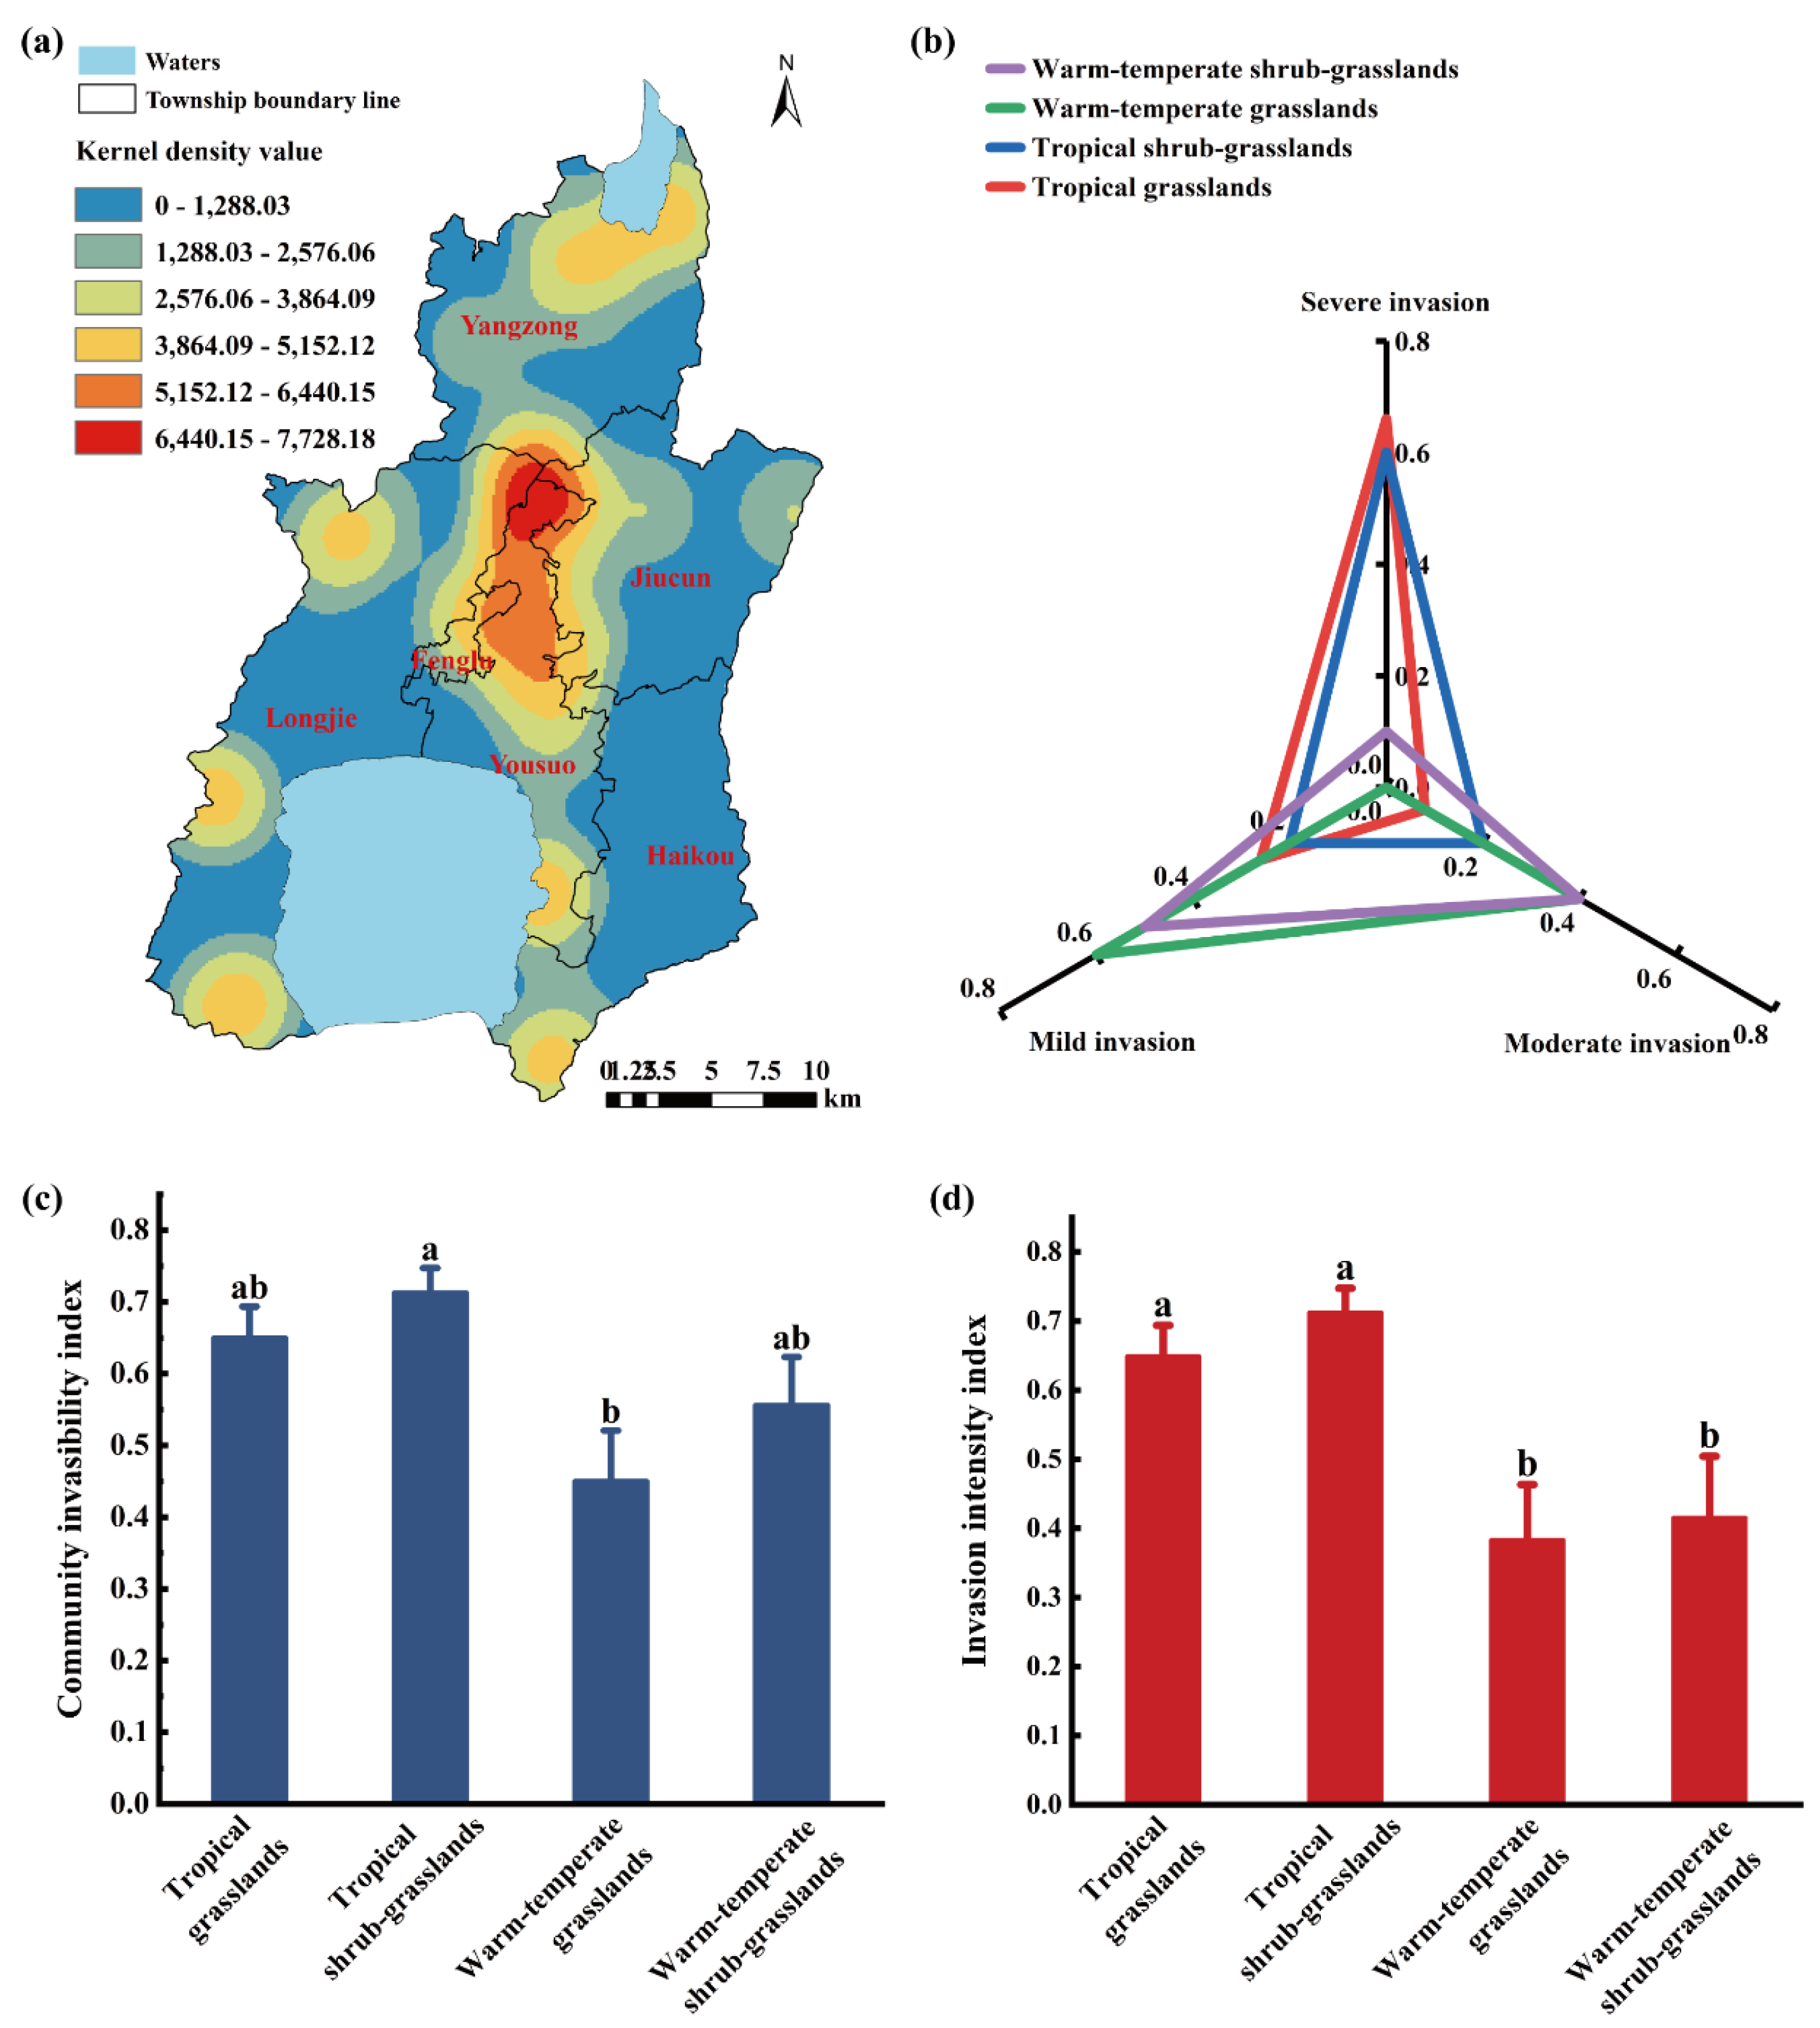
Figure 4.
Plant species composition in different grassland community. (a), Species number; (b), Clustering analysis of plant species composition in WG and WS; (c), Clustering analysis of plant species composition in TG and TS. (the upright scale represents plant species frequency in plots; I, invasion plots; N, Non-invasion plots).
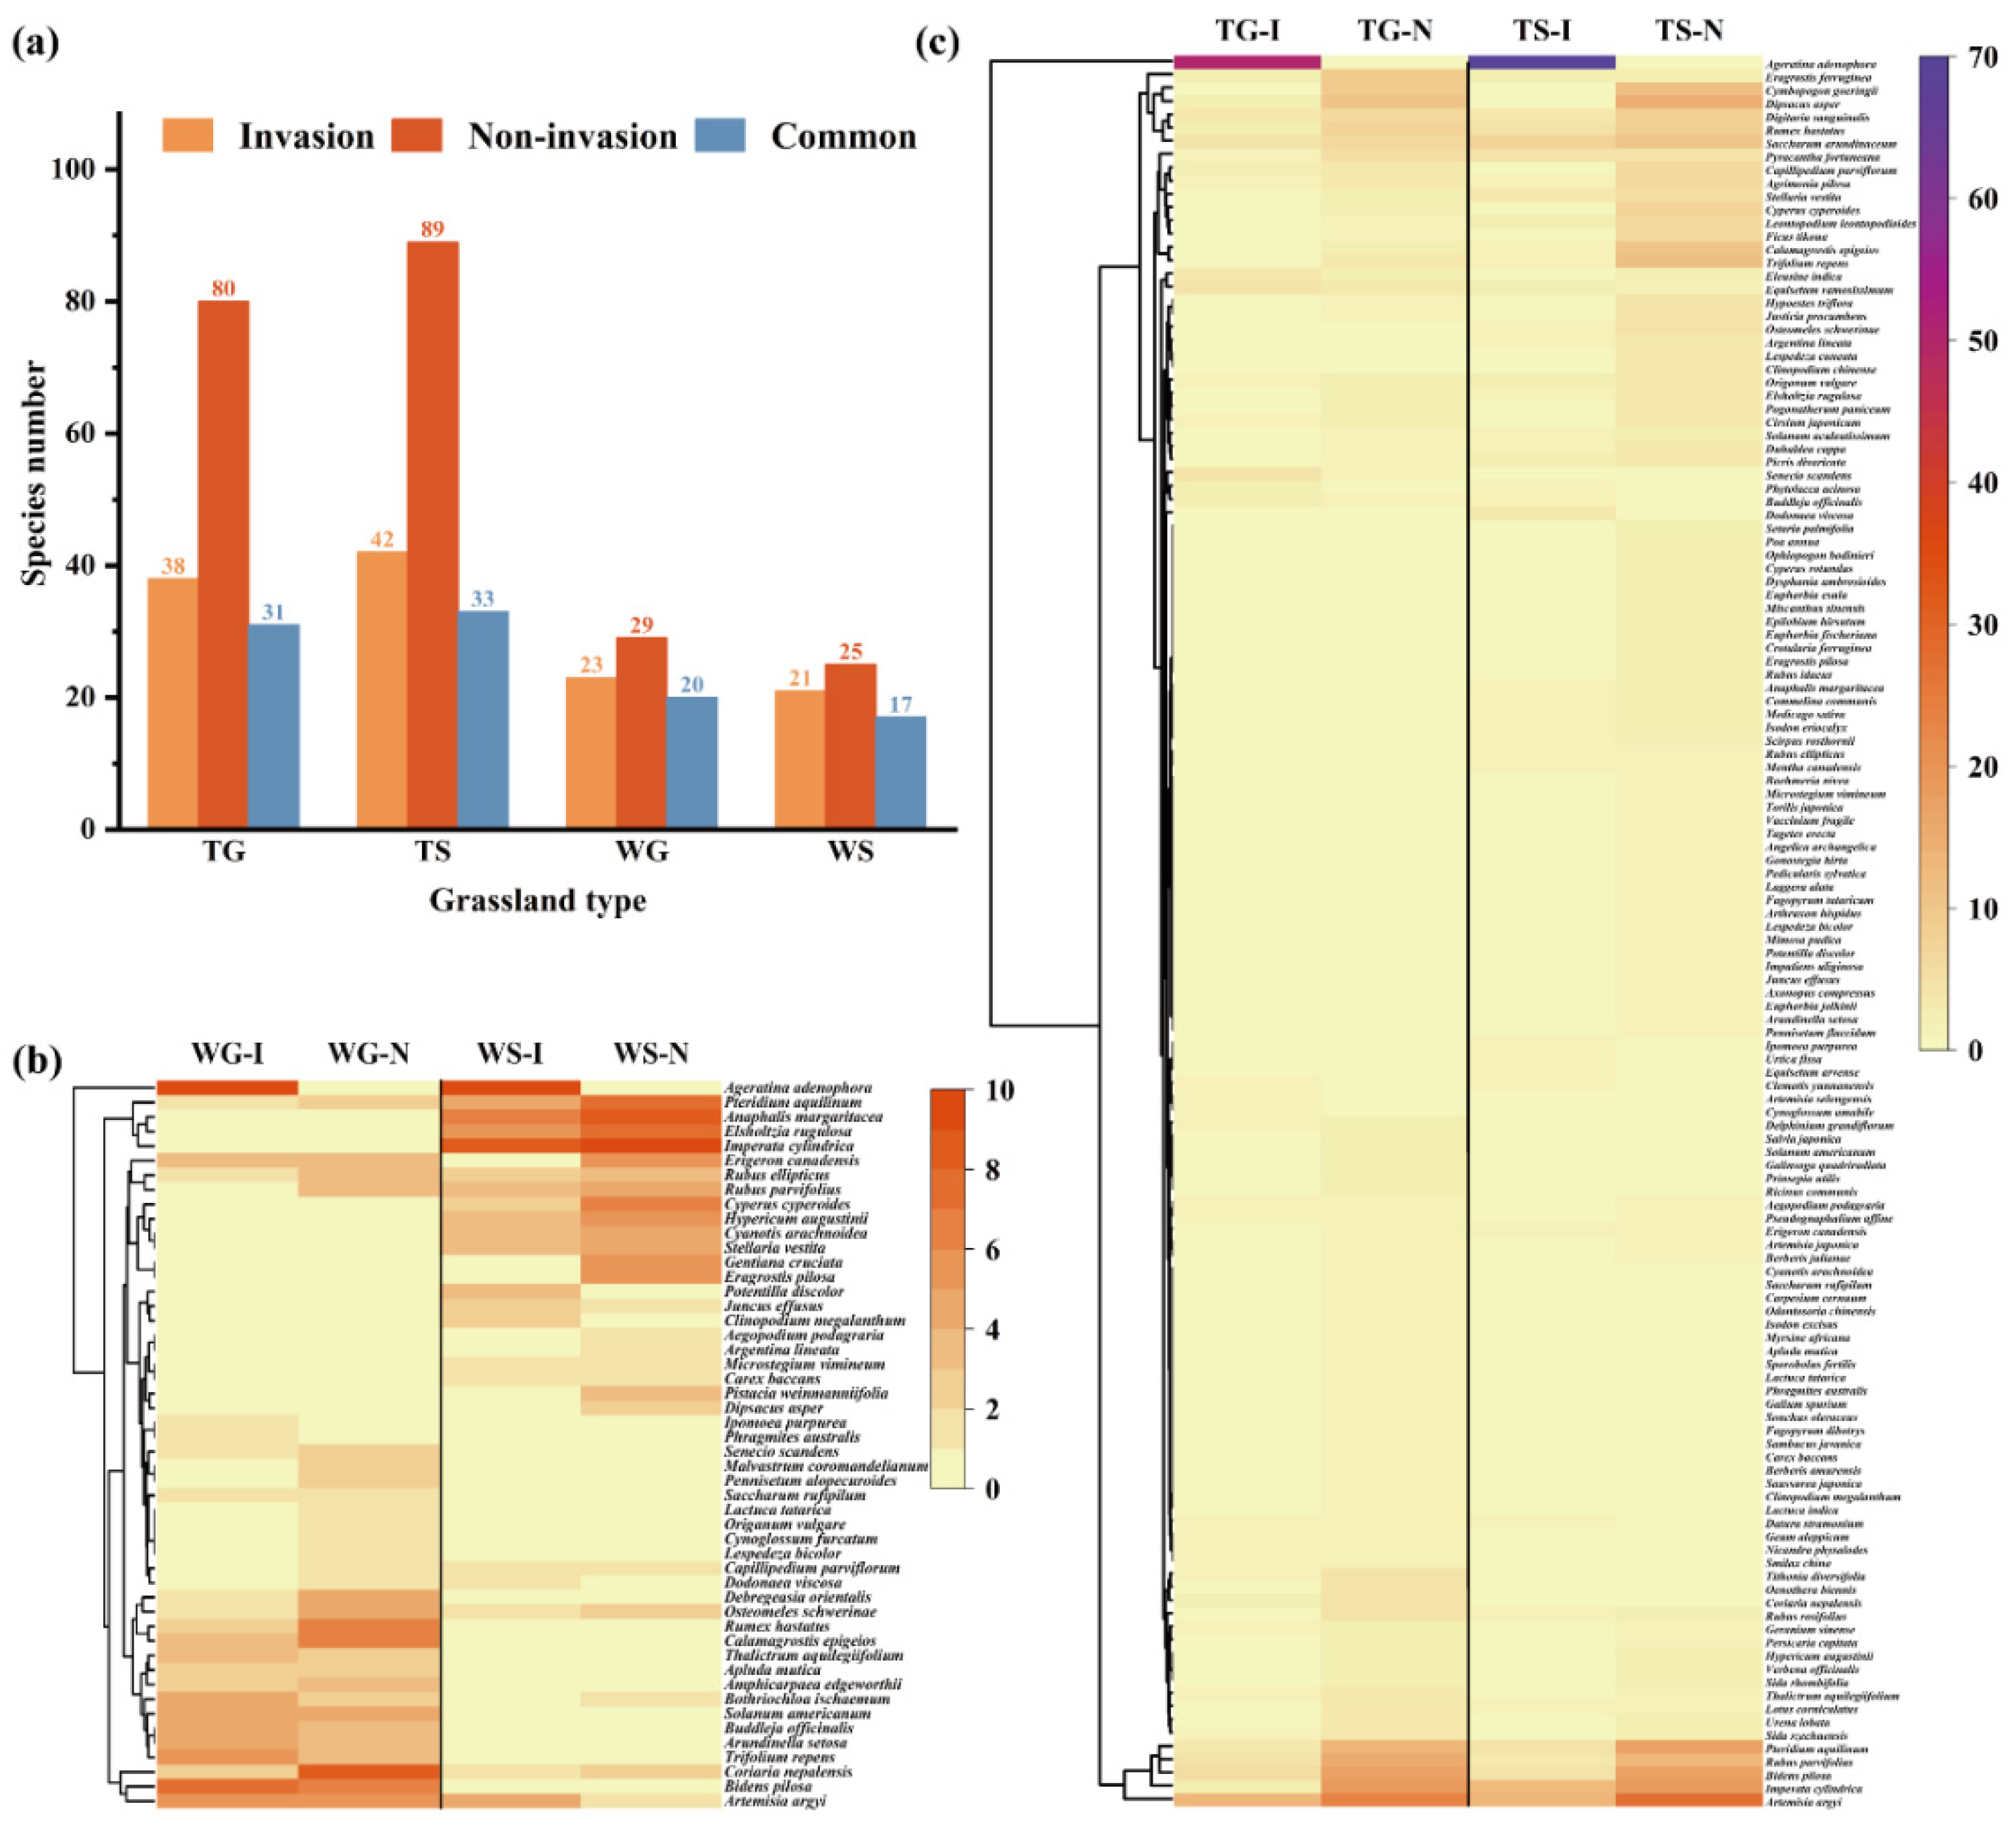
Figure 5.
Alpha diversity comparison between grassland types. (a), Richness index; (b), Shannon-Wiener index; (c), Simpson index; (d), Pielou index. * indicates significant difference (p < 0.05); ** exhibits highly significant difference (P < 0.01).
Figure 5.
Alpha diversity comparison between grassland types. (a), Richness index; (b), Shannon-Wiener index; (c), Simpson index; (d), Pielou index. * indicates significant difference (p < 0.05); ** exhibits highly significant difference (P < 0.01).
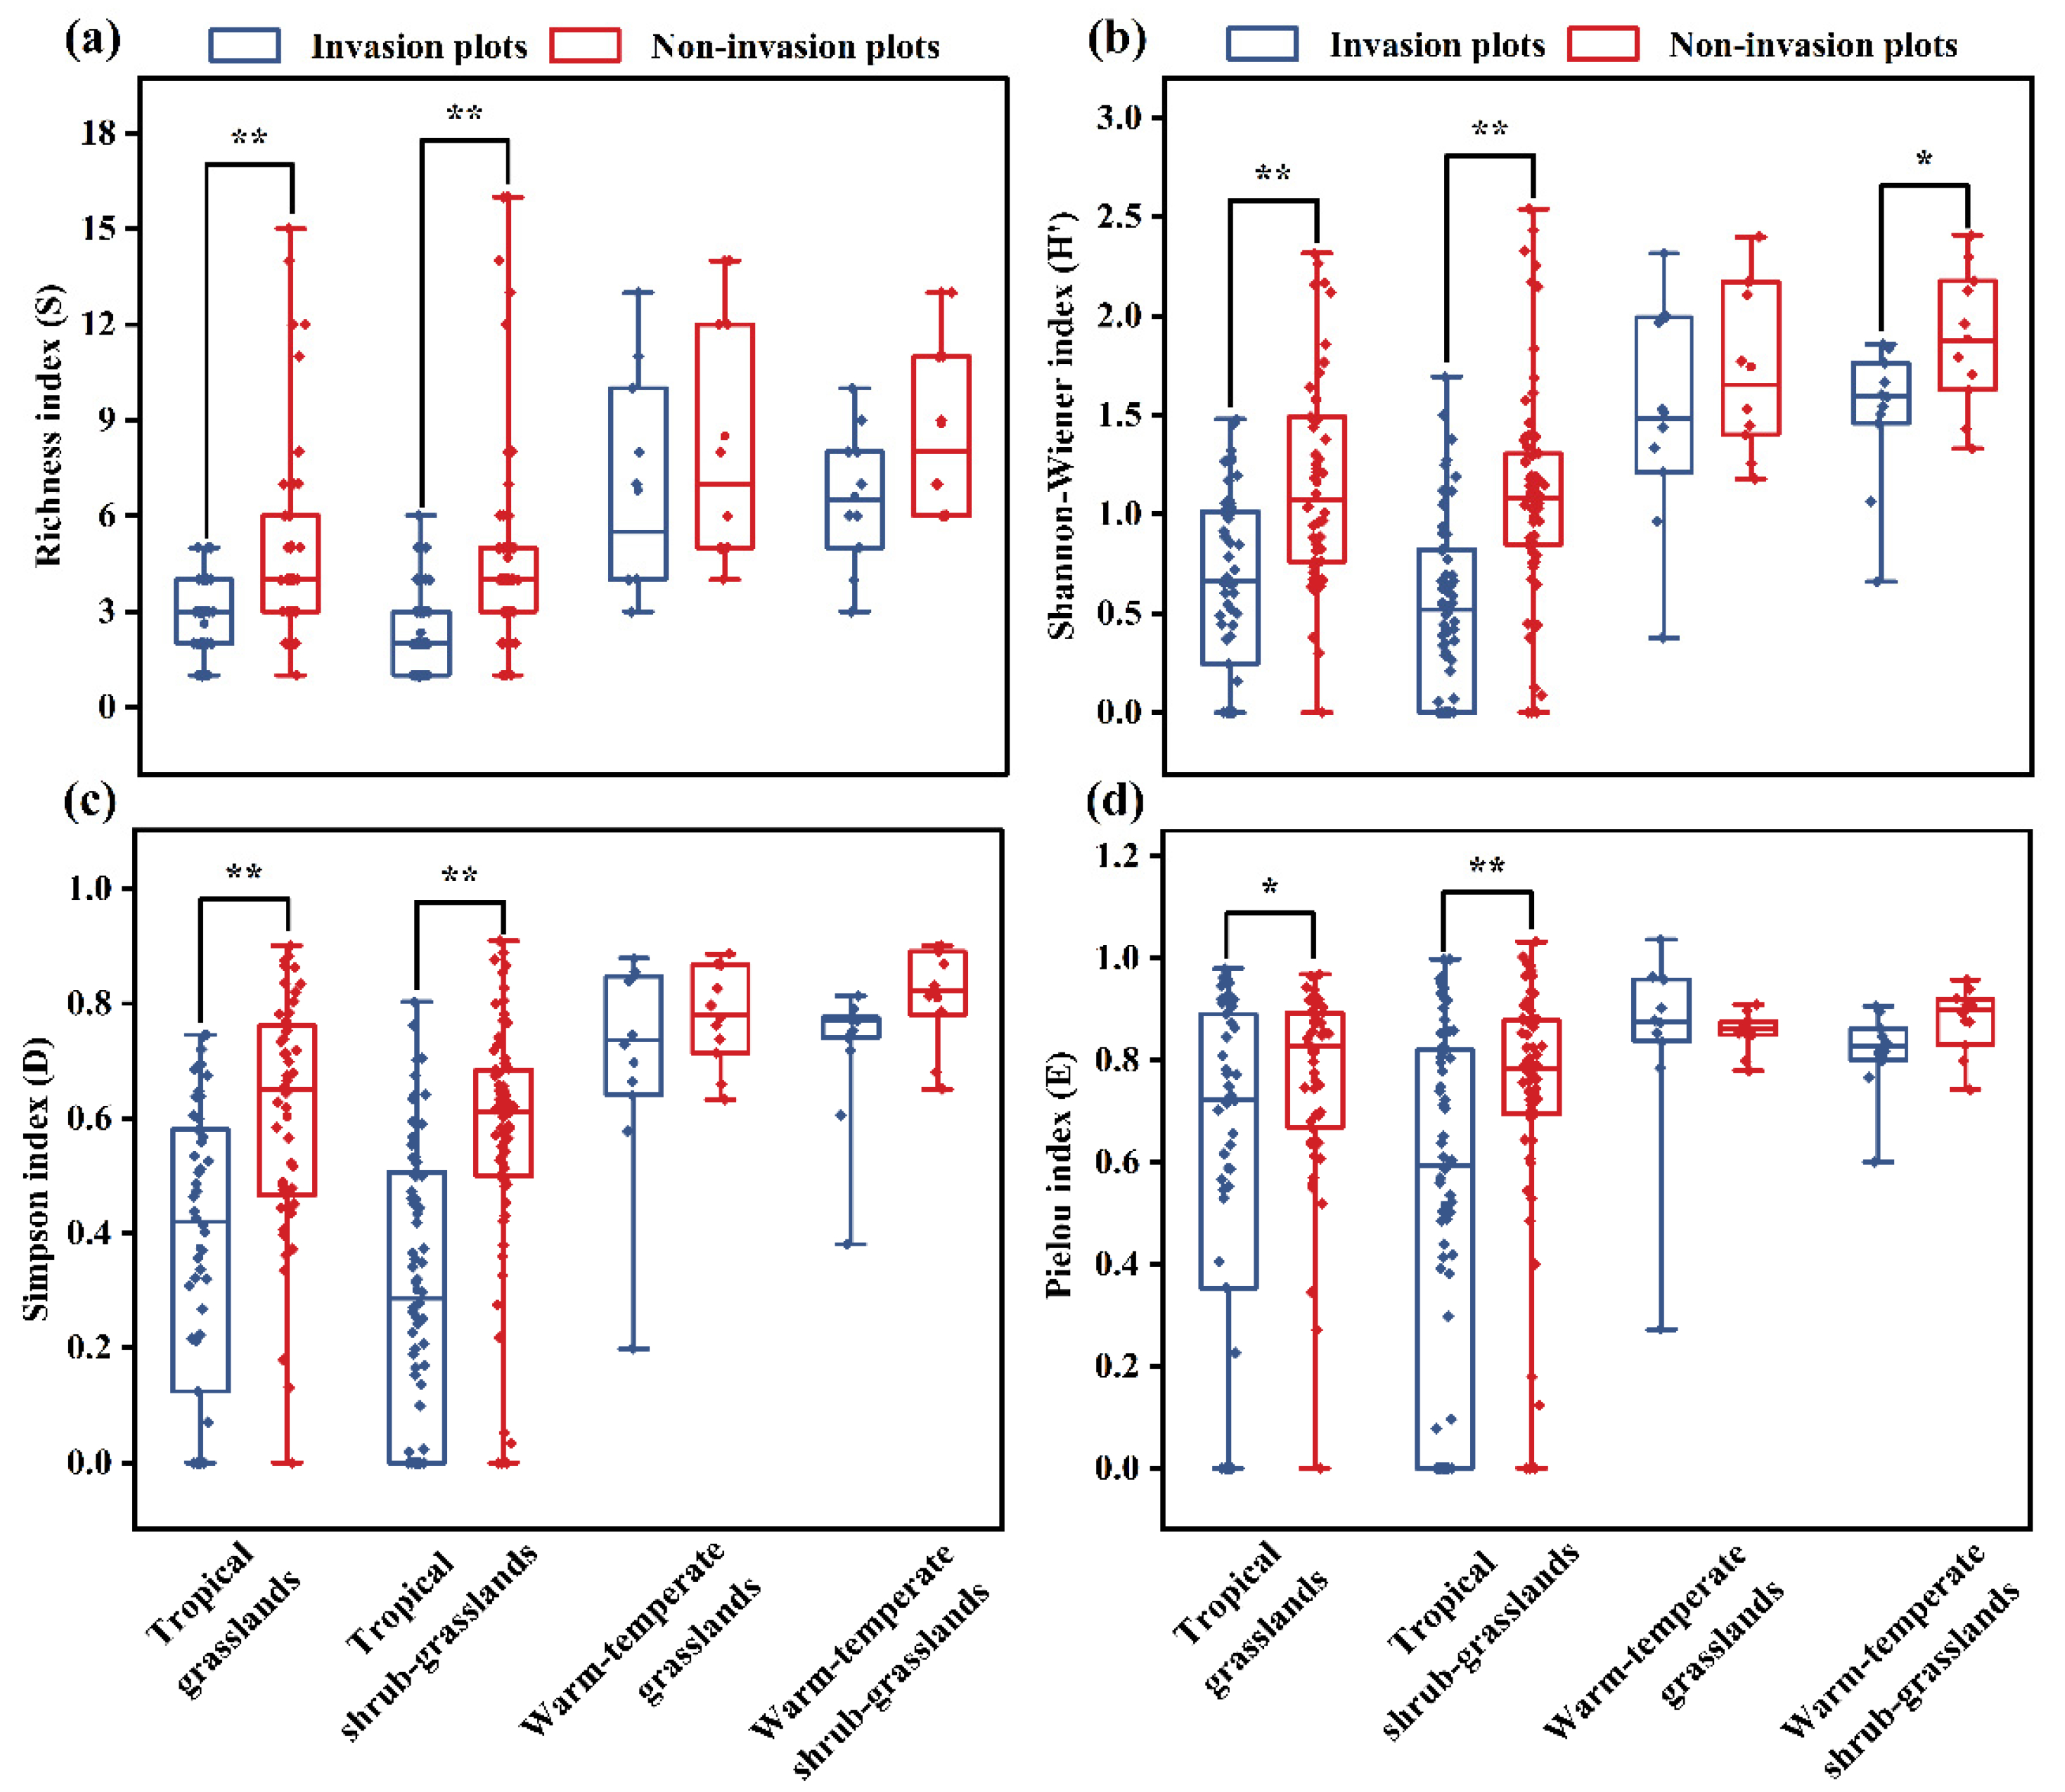
Figure 6.
Regression analysis of A. adenophora important value and Alpha diversity. (a), Shannon-Wiener index; (b), Richness index; (c), Simpson index; (d), Pielou index; (e), Correlation analysis between important value and ecological indicators of A. adenophora distribution (* p≤0.05, ** p≤0.01, *** p≤0.001; IV, important value of A. adenophora; Long, longitude; Lat, latitude; H, altitude; T, average annual temperature; P, annual precipitation; S, slope; A, slope aspect).
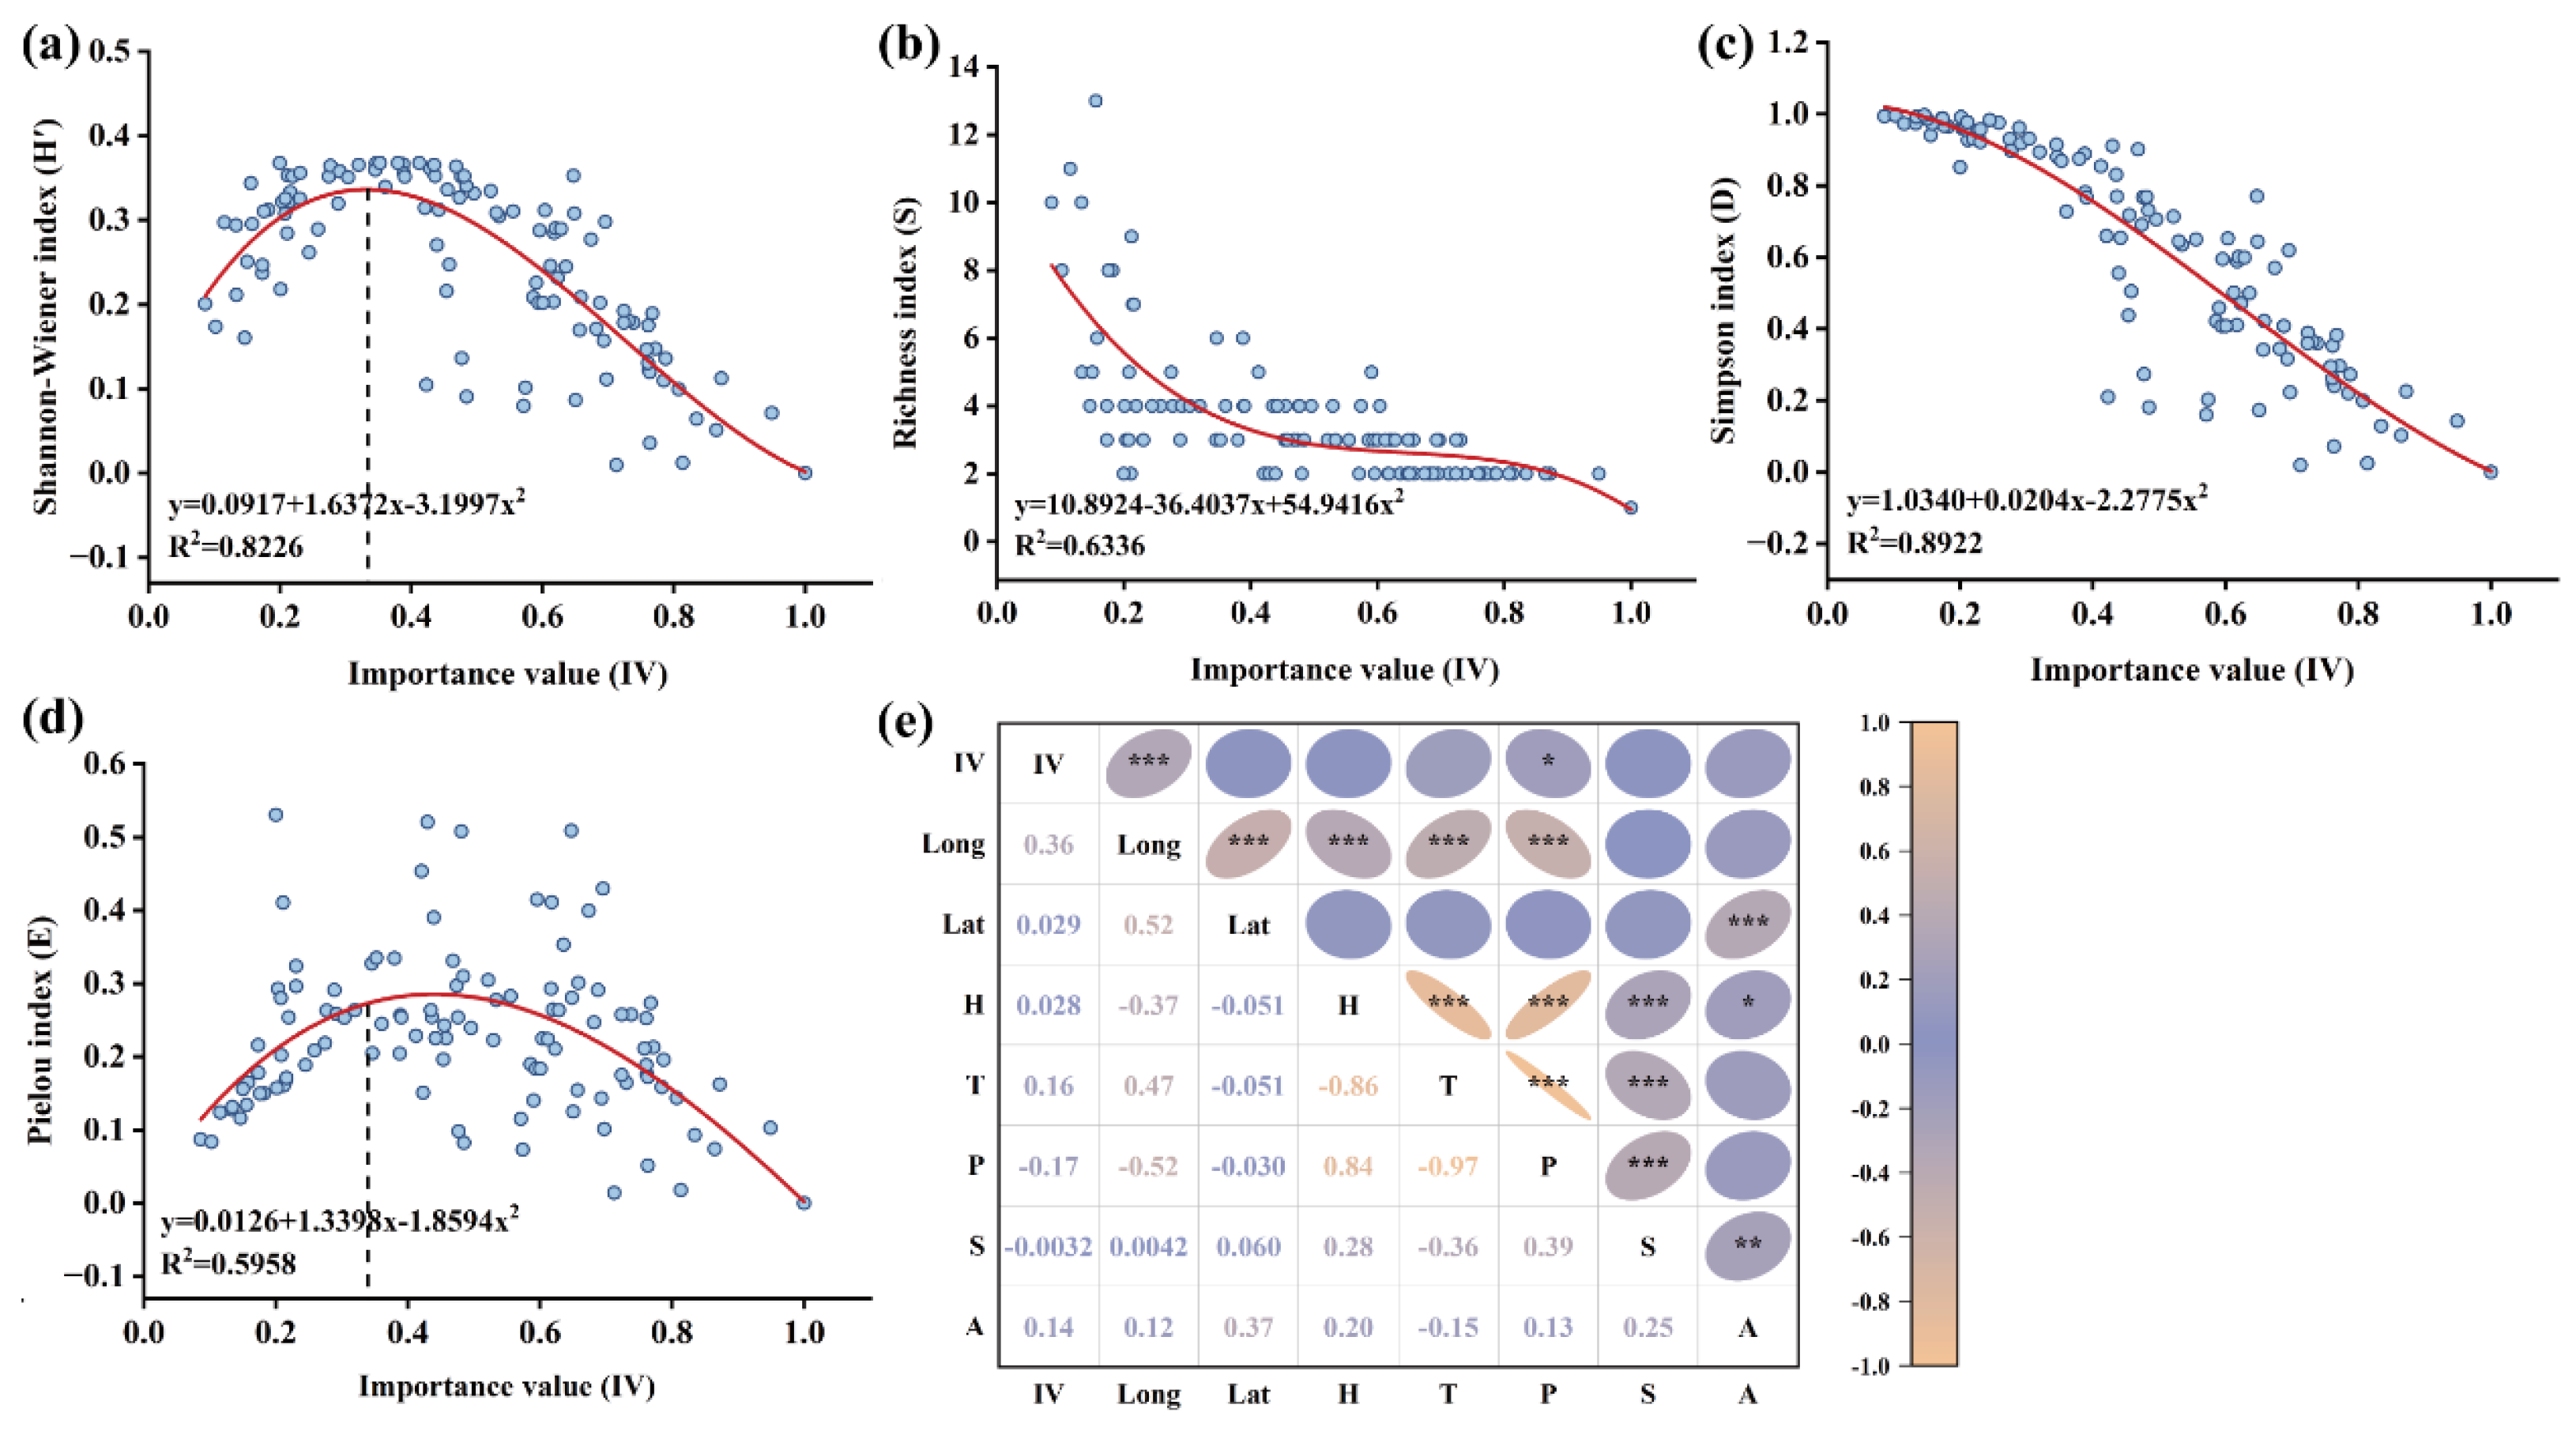
Figure 7.
Allelopathic effect of A. adenophora leaf aqueous extract on the growth of native plants. (a), Germination rate; (b), Germination energy; (c), Germination index; (d), Vigor index; (e), Seedling height inhibition rate; (f), Root length inhibition rate.
Figure 7.
Allelopathic effect of A. adenophora leaf aqueous extract on the growth of native plants. (a), Germination rate; (b), Germination energy; (c), Germination index; (d), Vigor index; (e), Seedling height inhibition rate; (f), Root length inhibition rate.
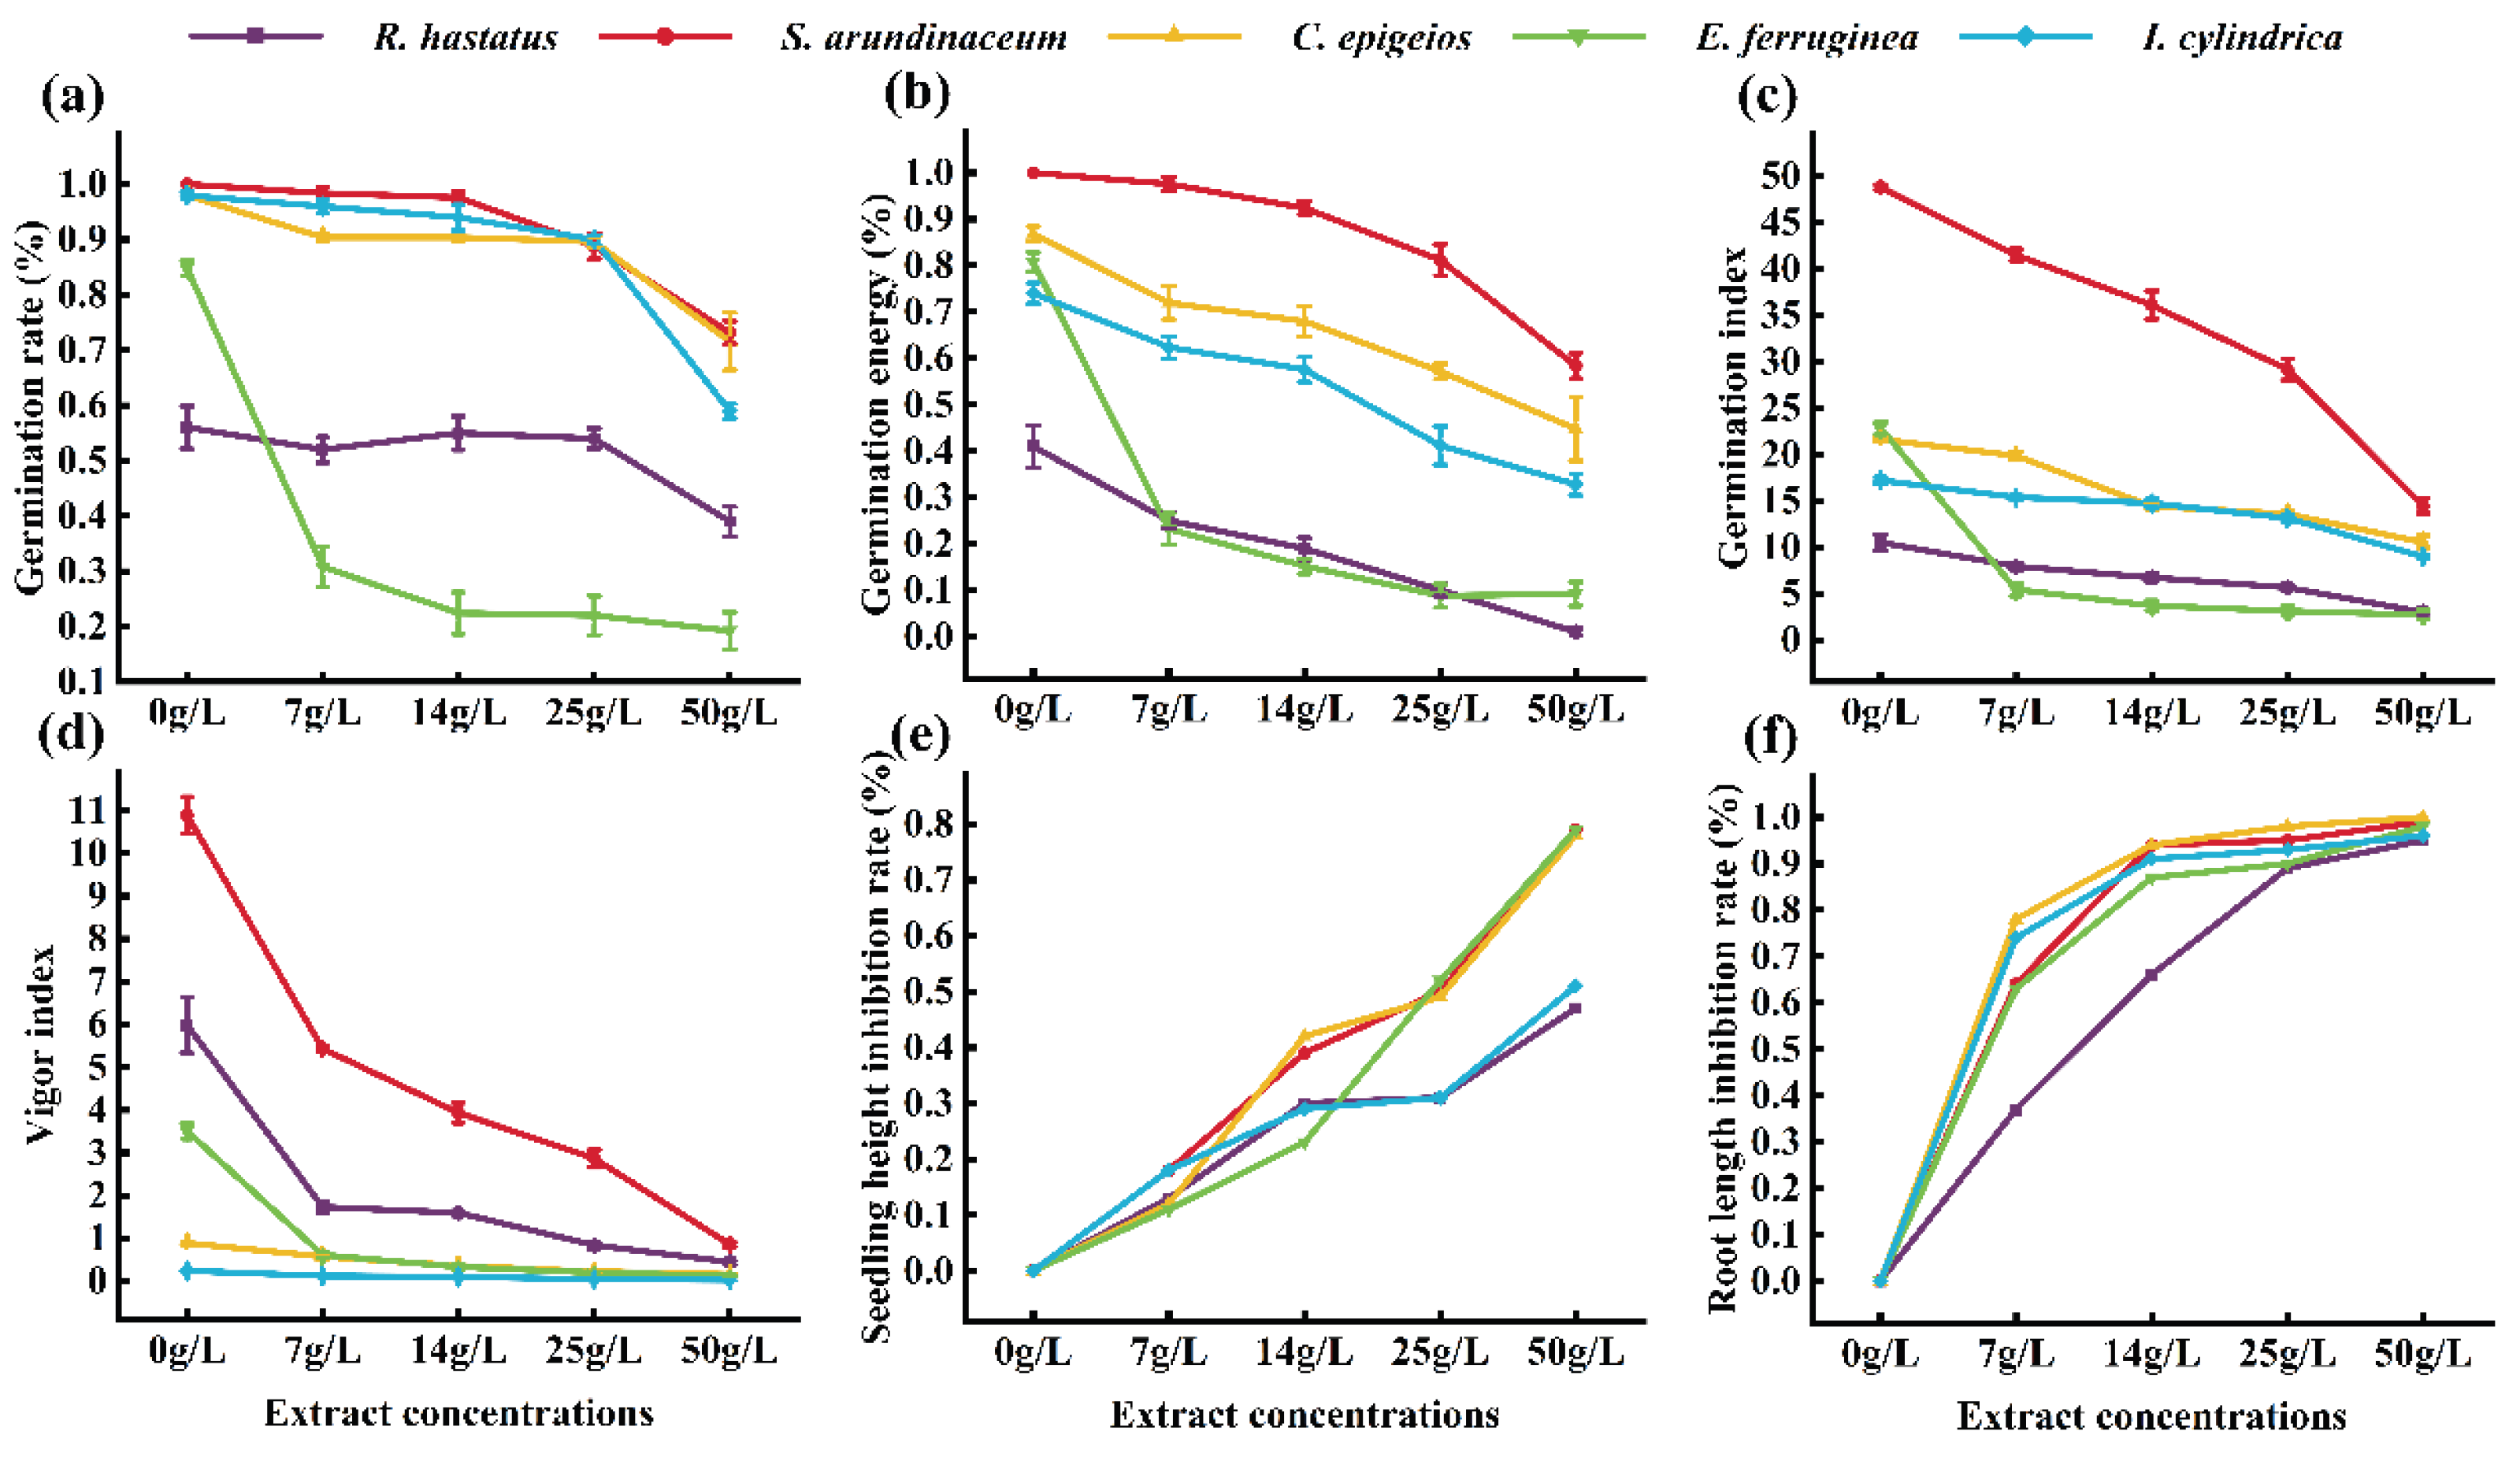

Table 1.
Effects of A. adenophora invasion on the Jaccard similarity index of the grassland community.
Table 1.
Effects of A. adenophora invasion on the Jaccard similarity index of the grassland community.
| TG-I | TG-N | TS-I | TS-N | WG-I | WG-N | WS-I | WS-N | |
|---|---|---|---|---|---|---|---|---|
| TG-I | — | 0.2185 | 0.1919 | 0.1533 | 0.1558 | 0.1548 | 0.1370 | 0.1930 |
| TG-N | — | 0.1757 | 0.2066 | 0.1271 | 0.1417 | 0.1140 | 0.1176 | |
| TS-I | — | 0.2012 | 0.1558 | 0.1548 | 0.1370 | 0.1930 | ||
| TS-N | — | 0.0820 | 0.1128 | 0.1200 | 0.1364 | |||
| WG-I | — | 0.2698 | 0.1200 | 0.1296 | ||||
| WG-N | — | 0.1228 | 0.1148 | |||||
| WS-I | — | 0.2698 | ||||||
| WS-N | — |
Note: I, invasive plots; N, Non-invasive plots; the same as below.
Table 2.
Sorenson similarity index of the pairwise plots of the grassland community.
| TG-I | TG-N | TS-I | TS-N | WG-I | WG-N | WS-I | WS-N | |
|---|---|---|---|---|---|---|---|---|
| TG-I | — | 0.3587 | 0.3220 | 0.2659 | 0.2697 | 0.2680 | 0.2410 | 0.3235 |
| TG-N | — | 0.2989 | 0.3424 | 0.2256 | 0.2483 | 0.2047 | 0.2105 | |
| TS-I | — | 0.3350 | 0.2697 | 0.2680 | 0.2410 | 0.3235 | ||
| TS-N | — | 0.1515 | 0.2027 | 0.2143 | 0.2400 | |||
| WG-I | — | 0.4250 | 0.2143 | 0.2295 | ||||
| WG-N | — | 0.2188 | 0.2059 | |||||
| WS-I | — | 0.4250 | ||||||
| WS-N | — |
Table 3.
Correlation analysis between native plant seedling growth indices and investigation indicators in invasion plots.
Table 3.
Correlation analysis between native plant seedling growth indices and investigation indicators in invasion plots.
| Plants | Indices | Germination Rate | Germination Energy | Germination Index | Vigor Index | Seedling Height | Root Length |
|---|---|---|---|---|---|---|---|
| Rumex hastatus | relative density | -0.06 | 0.11 | 0.10 | 0.22 | 0.20 | 0.11 |
| relative height | 0.06 | 0.08 | 0.14 | 0.06 | 0.08 | 0.10 | |
| relative coverage | 0.16 | 0.17 | 0.19 | 0.13 | 0.16 | 0.17 | |
| Saccharum arundinaceum | relative density | 0.28 | 0.37* | 0.27 | 0.31* | 0.53** | 0.33* |
| relative height | -0.26 | -0.30* | -0.25 | -0.29 | -0.35* | -0.28 | |
| relative coverage | 0.27 | 0.17 | 0.24 | 0.23 | 0.07 | 0.18 | |
| Calamagrostis epigeios | relative density | -0.27 | -0.19 | -0.34* | -0.32* | -0.23 | -0.40** |
| relative height | 0.05 | -0.07 | -0.21 | -0.08 | -0.18 | -0.20 | |
| relative coverage | 0.21 | 0.34 | 0.48 | 0.36 | 0.37 | 0.48 | |
| Eragrostis ferruginea | relative density | -0.23 | -0.22 | -0.27 | -0.34* | -0.50** | -0.40* |
| relative height | -0.09 | -0.05 | -0.08 | -0.07 | -0.10 | -0.06 | |
| relative coverage | -0.05 | 0.04 | -0.01 | 0.08 | 0.29 | 0.28 | |
| Imperata cylindrica | relative density | -0.08 | 0.04 | 0.01 | 0.09 | 0.08 | 0.18 |
| relative height | -0.12 | 0.05 | -0.01 | -0.15 | -0.31 | -0.06 | |
| relative coverage | -0.08 | -0.19 | -0.15 | 0.09 | 0.08 | 0.08 |
* indicates significant difference (p < 0.05); ** exhibits highly significant difference (P < 0.01).
Disclaimer/Publisher’s Note: The statements, opinions and data contained in all publications are solely those of the individual author(s) and contributor(s) and not of MDPI and/or the editor(s). MDPI and/or the editor(s) disclaim responsibility for any injury to people or property resulting from any ideas, methods, instructions or products referred to in the content. |
© 2026 by the authors. Licensee MDPI, Basel, Switzerland. This article is an open access article distributed under the terms and conditions of the Creative Commons Attribution (CC BY) license.
Copyright: This open access article is published under a Creative Commons CC BY 4.0 license, which permit the free download, distribution, and reuse, provided that the author and preprint are cited in any reuse.


