Submitted:
28 January 2026
Posted:
29 January 2026
You are already at the latest version
Abstract
There is a growing demand for alternative low cost and sustainable weed management technology suitable for aerobic and organic farming. In this study, 915 MHz microwave radiation was explored as an alternative technology for weed management. The specific objective was to identify the microwave power and energy levels required to inactivate weedy rice at various soil depths and to understand the impact of the treatment on soil physicochemical properties and the microbiome. Microwave power levels of 10, 20, and 30 kW were tested on soil depths of 2.5 cm, 8.9 cm, and 15.2 cm. Untreated soil samples were used as controls. The total germinability index (TGI) decreased significantly with increased power and reduced soil depth. The TGI ranged from 0.84 (10 kW for 15.2 cm soil depth) to 0 (20 kW for 2.5 cm soil depth or 30 kW for 8.9 cm soil depth). For 8.9 cm of soil depth, 176 to 265 kJ/kg of energy was sufficient to inactivate 80-100% of weeds. For 15.2 cm of soil treated with 30 kW for 30 seconds (188 kJ/kg), approximately 80% reductions in TGI and 64% in germination were observed compared to the control. Re-garding soil physicochemical properties, minimal differences were found due to mi-crowave treatments. The microwave treatment had no impact on soil total bacteria, whereas ammonia-oxidizing archaea and ammonia-oxidizing bacteria showed signifi-cant reductions as compared to control. Therefore, 915 MHz microwave heating can be a useful alternative technology for weedy rice management in rice fields. However, the technology needs to be tested in the field to optimize the energy required to achieve complete inactivation of a broad spectrum of weeds.
Keywords:
microwave
; weedy rice
; weed management
; rice
; soil physicochemical properties
; soil microbiome
1. Introduction
Rice is the third major cereal produced globally (502.98 million metric tons of milled rice) in 2022/23 behind corn and wheat [1]. In 2022, the U.S. was ranked amongst the top five largest exporters of rice [2] with almost 50% of U.S. rice produced in the state of Arkansas [3]. Rice farmers in Arkansas face many challenges that lead to lower profitability that include extreme weather conditions (mainly precipitation and high-nighttime temperature), crop management practices (irrigation timing and amount, herbicide and fertilizer application type, amount, and timing), and post-harvest drying and storage practices. Managing weeds is considered one of the most problematic factors and often leads to huge financial losses [4].
Common weeds found in Arkansas rice production include Echinochloa spp., weedy relatives of rice or weedy rice (Oryza spp.), Leptochloa spp., and Cyperus spp. [5]. Because of its similarity to cultivated rice, weedy rice is the most devastating and most difficult-to-control [6].” It has been demonstrated that weedy rice in the United States may absorb 60% of all applied N after it is established in fields, leading to a reduction of up to 80% in rice yields [7]. A case study by Durand-Morat et al. [6]to understand the monetary impact of the weedy rice in the U.S. rice production system found that from 2002 to 2014, losses in a moderate infestation scenario total 5.7 million tons of rice with a $457 million economic impact per year. The ensuing production loss in the U.S. is sufficient to feed 12 million people per year.
Rice weeds including weedy rice are primarily managed with flooding and herbicides use. Herbicides like Clearfield® (CL) are considered as one of the most effective for controlling weedy rice and used in the U.S. rice fields with CL rice cultivars. Similarly, in 2018, Provisia rice cultivars that were used in rotation with CL cultivars were effective in managing weedy rice [6]. Crop rotation of rice with soybean was also used as an effective tool in the U.S. [8]. However, herbicide resistance of weedy rice is a current threat to the established CL rice production system to manage weedy rice in the U.S [8]. Herbicide resistance of weeds is a global problem and despite having at least 11 herbicide modes of action used in rice, there are about 170 unique cases of weed resistance globally, which involve resistance to multiple herbicide modes of action in each population [9]. Transplanting rice into flooded fields is another weedy rice management practice that is effectively deployed for long in Asian countries [6]. U.S. rice production typically uses direct seeding followed by flooding, which promotes weedy rice emergence; however, maintaining extensive flooding after seeding helps suppress its growth effectively. However, there is a gradual, but steady shift to dry direct seeding with aerobic rice culture (row rice production) to preserve water [10]. This has aggravated the weedy rice problem along with most other rice weeds. Against this backdrop, the need for novel tools for integrated weed management is critical.
Field soil irradiation using microwave (MW) can be a feasible and herbicide-free way to achieve weed seedbank depletion. Most past studies have shown that the pre-emergence MW irradiation of the soil was effective in reducing weed infestation [11,12,13,14]. Applying controlled MW energy to weed seeds can cause cellular damage, leading to a reduction in seed germination and viability [15]. The volumetric heating mechanism that is associated with MW offers quick heat transmission to the soil [16]. The dielectric characteristics of the soil have the greatest impact on MW energy absorption [17]. Other factors that impact MW energy absorption are the soil moisture content [11] bulk density [18] organic matter content, [19] texture [20], and specific heat capacity.
The implementation of MW treatment for weed seed control offers several advantages: (1) environmental safety: unlike chemical herbicides, MW energy does not leave behind residual toxic substances, making it a more environmentally friendly weed control method; (2) support for organic agriculture: the technology could replace the less effective organic herbicides used in organic crop production, and enable successful nonchemical weed management; (3) targeted application: MW can be directed precisely to weed-infested areas, minimizing collateral damage to non-target species such as soil microbes; and (4) soil conservation: MW treatments can be applied without disturbing the soil structure, thus preserving the existing soil microbiota. Although the application of microwave offers these advantages, successful implementation requires extensive testing to optimize the MW energy levels for different weed species, seed bank depths, soil physicochemical properties, and environmental parameters including air temperature, humidity, and wind speed. In addition, the recommendations need to factor in impacts of the MW treatments on soil nutrients and beneficial soil microbes.
Microwave treatments were effective in inactivating the germ or reproductive part of seeds in soil [21]. Previously, at a depth of 2.5 cm and a soil moisture content of 6.5%, Wayland [22] treated wheat and radish seeds in situ and found that increasing energy density had a greater effect on reducing seed germination capacity than increasing exposure time. Furthermore, Menges and Wayland [23] contrasted post-emergence herbicides (methazoal, propachlor, and perfluidone) for weed control in onion production with MW energy densities between 450 and 7200 kJ m-2. Their data indicated that MW radiation (3600 kJ m-2) significantly reduced weed growth. In addition, MW caused less crop damage (18%) than herbicide spray (85%). The effects of MW on oat and weed seeds in soil at various moisture levels were investigated by Barker and Craker [24] They concluded that after 120 seconds of irradiation, soil temperature reached to 90°C weed seed relative emergence ranged between 0 to 15%.
To date, no research has been done on utilizing 915 MHz MW to test pre-emergence weedy rice eradication on Arkansas rice soil. Also, the impact of MW treatment on soil nutrients as well as microbiota is not well understood. Therefore, the objectives of this study were to understand the 1) impact of different levels of MW power on weedy rice germination at various soil depths, and 2) impact of MW power levels on the treated soil physicochemical properties and microbiome.
2. Materials and Methods
2.1. Soil sampling
Weedy rice infested soil (soil collected from an area that does have a history of weedy rice infestation) was collected from a farm in Humnoke, Arkansas. The soil was Perry clay with physicochemical properties as mentioned in Table 1. All tests were performed in the Fayetteville agricultural diagnostic laboratory.
The soil samples were placed in containers with lid and further sealed with plastic wrap, then conditioned to approximately 35% soil moisture content (wet basis) to mimic soil moisture in rice fields during sowing. Moisture content was measured using ASTM Standard D2216-19 oven drying method using 105°C oven temperature for 24 h [25].
2.2. Microwave heating and soil temperature measurement
The industrial microwave system (Model No. AMT2448.05, Industrial Microwave Systems, AMTEK, Cedar Rapids, IA) used for the study is a 915 MHz microwave tunnel dryer configured with a conveyor belt. This system is designed to deliver high-power microwave energy for industrial-scale applications. The 915 MHz microwave frequency was chosen for its superior penetration depth and efficiency in heating moist soils compared to the more surface-limited 2.45 GHz systems (Bruce, 2022). While 915 MHz requires larger equipment, its ability to uniformly heat deeper soil layers makes it better suited for large-scale applications like soil treatment, where deeper energy distribution is essential.
The key components of the system include a 75-kW generator, a 1.2-m-long drying oven, and an integrated console for operation and control. The conveyor-fed tunnel design allows for consistent and continuous processing of soil samples under uniform conditions. The oven contains multiple antennas specifically designed for 915 MHz wave radiation, which are configured to optimize the distribution of microwave energy. In this system, six antennas are installed along the 1.2 m length of the oven to achieve a multimode structure of the applied microwaves. The multimode nature of the system ensures a more uniform energy deposition across the soil sample, reducing the likelihood of significant hot-spot generation. The antennas are strategically positioned to maximize overlapping of microwave modes and improve overall heating uniformity.
The drying chamber itself is a metallic enclosure with dimensions designed to enhance multimode operation. The chamber width (1 m) and height (1 m) are sufficiently large to support a broad range of modes, which contributes to minimizing uneven heating. The configuration and performance of this system are critical in understanding the heating patterns observed during soil treatment. The multimode nature of the drying chamber ensures that energy is distributed evenly, though some surface-dominant heating was still evident due to the high attenuation of microwaves in moist soil. This design also minimizes microwave leakage and ensures safety during operation.
Soil to be treated was transferred to a polypropylene tray and a 10 cm by 20 cm pile with desired height (soil depth) was made before treatment. Soil temperature during the treatment were measured using fiber optic cable temperature datalogger (Neoptix Reflex-4, Canada). Two fiber optic cables were placed within the soil pile relatively towards the top and bottom center. Soil surface temperature was also measured just after microwave treatment using a thermal imaging camera (Model: FLIR E 60, FLIR Systems AB, Sweden). Treatment duration was fixed to 30 seconds. After treatment, soil was mixed using a spatula and allowed to cool for 2 minutes before bagging in labeled plastic bags. After cooling, samples were then tested for germination, physicochemical attributes and microbial analyses.
2.3. Experimental design
Microwave power, and soil depth, were the factors tested for total germinability index, soil physicochemical and microbial properties. Table 2 below shows the factors and levels used in the design of experiments. Control samples (1.3 cm soil depth) with no microwave treatment were used to compare with treated soil. Complete randomization was done before experimentation to reduce any manual error and bias. This study used two replicates per treatment, balancing logistical constraints with robust statistical methods. Future studies with additional replicates could further enhance reliability.
2.4. Greenhouse for germination analyses
Soil samples after microwave treatment were subjected to tests for the analysis of seed germination. A greenhouse was used in which the air temperature ranged from 23°C to 37°C. Samples were placed in 5-cm deep containers (10 cm wide and 20 cm long) with drainage holes at the bottom. The second container was used for 15.2 cm deep samples for allowing ease in seed germination. The containers were soaked in water to achieve full saturation and then drained to remove gravitational water. This would represent the ‘field water holding capacity’ of the container. Weed emergence was assessed over two weeks (14 days). Emerged weeds were counted on Day 7 and Day 14; seedlings were removed after each count, and the soil in each pot was thoroughly mixed at Day 1 and Day 7 to facilitate germination of all viable, non-dormant seeds. All emerged species were identified visually and counted as germinated. For infested soil samples, data normalization of the total number of germinated seeds was done to counter the variability posed due to difference in initial level of infestation in soil samples. Comparison of the level of germination in infested samples after treatments were done by calculating the total germinability index (TGI) using equation 1.
(1)
Where,
Gi is the total number of germinated seeds of ith sample,
Gmin is the minimum total number of germinated seeds in all samples, and
Gmax is the maximum total number of germinated seeds in all samples.
2.5. Soil physiochemical properties and microbial quantification
Separate set of experiments were conducted to understand the impact of microwave treatments on soil physicochemical properties and microbes without affecting germination results. These samples were collected separately a day before samples used for germination analyses to avoid any bias due to storage duration. The same field was used to source these samples as used in germination tests. Samples were transported in an insulated box from the field to the laboratory and were stored immediately in -20°C freezer and thawed before experiments. After each experiment was done using the design shown in Table 2, two 10 grams subsamples, one each for physicochemical properties and microbes, were taken after mixing treated soil sample with a spatula. Subsamples were transferred to -20°C cooler immediately, and after all experiments were completed, all subsamples were sent to the University of Arkansas’ Fayetteville Agricultural Diagnostic Laboratory, Fayetteville, AR for soil physicochemical attributes analyses and soil microbial testing laboratory for microbes quantification, respectively. The physicochemical properties measured include soil pH, electrical conductivity, soil composition (silt, clay and sand), macronutrients (P, K, Mg, S, Na, Ca) and micronutrients (Fe, Mn, Zn, Cu and B). For soil microbes quantification, total bacteria count was measured to give an idea of the overall impact of treatment on microbes, and ammonia oxidizing archaea (AOA) and ammonia oxidizing bacteria (AOB) were chosen to be measured for their role in denitrification.
2.6. Data analysis
Data obtained from the experiments were subjected to analysis of variance (ANOVA) using JMP Pro 17 statistical software (JMP Pro 17, SAS Institute, Cary, NC) with complete randomization (F-test). The normality of data and homogeneity of variance were examined. The ANOVA was done to see the effect of microwave power and soil depth on the total germinability index, soil physicochemical attributes, and soil microbial data. Tukey’s HSD was used to compare the levels of each factor. The level of significance for the analysis was set at a 95% confidence level. The control soil samples at a fixed soil depth of 1.3 cm were used as numerical reference with no statistical comparison to treated soil samples.
3. Results
3.1. Impact of microwave energy on soil temperature
Table 3 shows the soil temperature as a function of microwave power and soil depth. For a constant soil depth of 2.5 cm, as power increased from 10 kW to 30 kW, soil temperature increased from 77.5°C to 95.5°C. Similar increments were observed for 8.9 cm and 15.2 cm soil depths. Increasing power at constant soil depth increased the specific energy supplied to the soil (Table 3). This led to more friction in water molecules within the soil, generating heat and resulting in higher temperatures. However, with the increase in soil depth at a particular power level, overall soil temperature reduced. This reduction is attributed to the lower specific energy that the soil received.
Microwave penetration depth is a key factor influencing the uniformity and effectiveness of soil heating. At 915 MHz, the penetration depth depends on the dielectric properties of the soil, which are influenced by moisture content, temperature, and bulk density (Metaxas and Meredith, 1983). Soils with higher moisture content, such as those used in this study (35% wet basis), exhibit greater attenuation of microwave energy due to increased dielectric losses.
For 10 kW, 20 kW, and 30 kW, the soil temperature reduced from 77.5°C to 38.6°C, 92.3°C to 41.3°C, and 95.5°C to 58.3°C as the soil depth increased from 2.5 cm to 15.2 cm, respectively. These temperature variations are consistent with the calculated specific energy values and illustrate the effect of microwave energy dissipation with depth. The initial moisture content further contributed to this gradient, as water molecules absorbed a significant portion of the microwave energy, limiting its penetration.
Soil surface temperature after a 30-second treatment also showed similar trends for temperature changes with varying microwave power and soil depth (Figure 1). It can be observed through Figure 1 that the microwave treatment had a uniform heating capability, with low deviation of surface temperatures captured at three points of measurement except from edges where soil and air interacted to create a temperature gradient. These observations align with theoretical principles and explain the patterns of germination and total germinability index (TGI) observed in the study. Surface-dominant heating patterns at greater depths, such as 15.2 cm, are consistent with prior studies on microwave heating in moist soils [17]. Optimizing microwave power and duration could improve heating uniformity and penetration depth for practical field applications
3.2. Impact of microwave energy on total germinability index (TGI)
The microwave power and soil depth had a significant effect on the TGI (Table 4). TGI ranged from 0.84 (10 kW for 15.2 cm soil depth) to 0 (20 kW for 2.5 cm soil depth or 30 kW for 8.9 cm soil depth) (Figure 2). TGI increased as soil depth increased, and power decreased. The control with no microwave treatment showed TGI of 1 that was numerically higher than that of any other treated soil. The minimum TGI for 2.5 cm, 8.9 cm and 15.2 cm of soil depth were 0, 0, and 0.18 attained at 20 kW, 30 kW and 30 kW power treatment for 30 sec, respectively. In terms of specific energy, farmers can inactivate weedy rice completely for soil layer of up to 2.5 cm using 400 kJ/kg or lower. Even 200 kJ/kg showed promise to do a complete inactivation as 10 kW treatment was not significantly different from 20 kW in terms of TGI (Table 3 and figure 2). For 8.9 cm of soil, 176 to 265 kJ/kg resulted in complete inactivation (Table 3 and figure 2). For 15.2 cm soil, more than 188 kJ/kg specific energy is needed to do 100% inactivation.
3.3. Impact of microwave energy on soil physiochemical properties
Soil physicochemical properties along with p-value showing the treatment impact on them are reported in Table 5. Overall, minimal differences were found for microwave treated soil as compared to the control. In general, soil pH, phosphorus, calcium, magnesium, sulphur, sodium, iron, zinc, copper, boron, percentage loss on ignition, total nitrogen, and total carbon, all these properties were not changed as compared to non-treated soil. Properties that changed significantly were soil pH due to power levels, electrical conductivity due to change in soil depth, potassium due to power levels and soil depth, manganese was impacted by soil depth (Table 5). All these differences as indicated by p values seem to be with only a few treatments and control. These differences can also occur due to climate change, land use and land management [26].
3.4. Impact of microwave energy on soil microbes
The soil total bacteria, ammonia oxidizing archaea (AOA) and ammonia oxidizing bacteria (AOB), results are mentioned in Table 6. P values show there was no significant impact of microwave treatments on the levels of total bacteria and AOA, however, for AOB, there was significance. Looking at the mean values of total bacteria, the only significant difference as compared to control was that of soil treated with 10 kW power for 30 sec. This could be due to the gentler increase in soil temperature after 10 kW and 30 sec treatment that accelerated the growth of bacteria. For AOA, most of the treatments except 10 kW for 30 sec showed significantly lower AOA values as compared to control. Auyeung et al. [27] and Waghmode et al. [28] mentioned in their study that with heating soil, AOA numbers reduced significantly. For AOB as well, similar reductions were observed where sample after all treatment showed significant reduction as compared to the control. However, these changes are expected just after heating and soil microbial community numbers can be enhanced naturally or with fertilizer use as reported by past studies [29,30,31,32]
4. Discussion
The study aimed to identify the efficacy of using 915 MHz microwave heating of soil to eradicate weedy rice and other weed seeds from rice fields. Different microwave power and soil depth were tested with weedy rice infested soil. Increasing power at constant soil depth increased the specific energy supplied to the soil generating heat and thus, higher soil temperature was attained. However, for 10 kW, 20 kW and 30 kW, the soil temperature reduced from 77.5°C to 38.6°C, 92.3°C to 41.3°C, and 95.5°C to 58.3°C as the soil depth increased from 2.5 to 15.2 cm, respectively. The microwave power and soil depth had a significant effect on the TGI that ranged from 0.84 (10 kW for 15.2 cm soil depth) to 0 (20 kW for 2.5 cm soil depth or 30 kW for 8.9 cm soil depth). TGI increased as soil depth increased, and power decreased. For soil physicochemical properties, minimal differences were found due to microwave treatments. The soil total bacteria were not impacted by microwave treatment, whereas ammonia oxidizing archaea (AOA) and ammonia oxidizing bacteria (AOB) had significant reductions in treatments compared to non-treated soil. With the concept of technology proven to be successful in inactivating weedy rice seeds without compromising soil nutrients and microbiota, farmers can have an alternative technology that reduces the use of pesticides.
Author Contributions
Kaushik Luthra contributed in conceptualization, methodology, software, validation, data curation, writing—original draft preparation. Devisree Chukkapalli contributed in writing review and editing. Bindu Regonda contributed in investigation. Chris Isbell contributed in conceptualization and methodology. Griffiths Atungulu contributed in conceptualization, methodology, software, validation, data curation, resources, writing—review and editing, supervision and project administration.
Funding
This research received no external funding.
Institutional Review Board Statement
Not applicable.
Informed Consent Statement
Not applicable.
Data Availability Statement
The original contributions presented in this study are included in the article/supplementary material. Further inquiries can be directed to the corresponding author(s).
Acknowledgments
The authors acknowledge the efforts by Cason Frisby with experiments and Dr. Nilda burgos at the University of Arkansas for providing the greenhouse for germination study. The authors also acknowledge the University of Arkansas Division of Agriculture and Department of Food Science. This study was based on work supported in part by the United States Department of Agriculture National Institute of Food and Agriculture Hatch Act Funding..”
Conflicts of Interest
The authors declare no conflicts of interest.
References
- Shahbandeh, M. Grain production worldwide 2022/23, by type. Statista. 2023a. Available online: https://www.statista.com/statistics/263977/ (accessed on 28 September 2023).
- Shahbandeh, M. Rice – statistics & facts. Statista. 2023b. Available online: https://www.statista.com/topics/1443/rice/#topicOverview// (accessed on 28 September 2023).
- UAEX. University of Arkansas Division of Agriculture, Cooperative Extension Service. 2023. Available online: https://www.uaex.uada.edu/farm-ranch/crops-commercial-horticulture/rice/ (accessed on 28 September 2023).
- Chauhan, B.S. Grand challenges in weed management. Frontiers in Agronomy 2020, 1, 3. [Google Scholar] [CrossRef]
- Kraehmer, H.; Jabran, K.; Mennan, H.; Chauhan, B.S. Global distribution of rice weeds–a review. Crop Protection 2016, 80, 73–86. [Google Scholar] [CrossRef]
- Durand-Morat, A.; Nalley, L.L.; Thoma, G. The implications of red rice on food security. Global Food Security 2018, 18, 62–75. [Google Scholar] [CrossRef]
- Roma-Burgos, N.; Norman, R.J.; Gealy, D.R.; Black, H. Competitive N uptake between rice and weedy rice. Field crops research 2006, 99, 96–105. [Google Scholar] [CrossRef]
- Roma-Burgos, N.; Butts, T.R.; Werle, I.S.; Bottoms, S.; Mauromoustakos, A. Weedy rice update in Arkansas, USA, and adjacent locales. Weed Science 2021, 69, 514–525. [Google Scholar] [CrossRef]
- Roma-Burgos, N.; Heap, I.M.; Rouse, C.E.; Lawton-Rauh, A.L. Evolution of herbicide-resistant weeds. In Chapter 6; Korres, NE, Burgos, NR, Duke, SO, Eds.; CRC Press, Taylor & Francis Group, 2019; pp. Pages 92–132. [Google Scholar]
- Ziska, L.H.; Gealy, D.R.; Burgos, N.; Caicedo, A.L.; Gressel, J.; Lawton-Rauh, A.L.; Merotto, A., Jr. Weedy (red) rice: an emerging constraint to global rice production. Advances in agronomy 2015, 129, 181–228. [Google Scholar]
- Nelson, S.O. A review and assessment of microwave energy for soil treatment to control pests. Trans. ASAE 1996, 39, 281–289. [Google Scholar] [CrossRef]
- Sartorato, I.; Zanin, G.; Baldoin, C.; De Zanche, C. Observations on the potential of microwaves for weed control. Weed Res. 2006, 46, 1–9. [Google Scholar] [CrossRef]
- Brodie, G.; Ryan, C.; Lancaster, C. The effect of microwave radiation on prickly paddy melon (Cucumis myriocarpus). International Journal of Agronomy 2012, 2012, 287608. [Google Scholar] [CrossRef]
- Brodie, G.; Khan, M.J.; Gupta, D.; Foletta, S.; Bootes, N. Microwave weed and soil treatment in agricultural systems. AMPERE Newsletter 2017, 93, 9–17. [Google Scholar]
- Khan, M.J.; Brodie, G.I. Microwave weed and soil treatment in rice production. Rice Crop. Curr. Dev 2018, 99–127. [Google Scholar]
- Mavrogianopoulos, G.N.; Frangoudakis, A.; Pandelakis, J. Energy efficient soil disinfestation by microwaves. Journal of agricultural engineering research 2000, 75, 149–153. [Google Scholar] [CrossRef]
- Ulaby, F.T.; Batlivala, P.P.; Dobson, M.C. Microwave backscatter dependence on surface roughness, soil moisture, and soil texture: Part I. Bare soil. IEEE Trans. Geosci. Electron. 1978, 16, 286–295. [Google Scholar] [CrossRef]
- Dobson, M.C.; Ulaby, F.T.; Hallikainen, M.T.; El-Rayes, M.A. Microwave dielectric behavior of wet soil-Part II: Dielectric mixing models. IEEE Transactions on geoscience and remote sensing 1985, 1, 35–46. [Google Scholar] [CrossRef]
- O’Neill, P.E.; Jackson, T.J. Observed effects of soil organic matter content on the microwave emissivity of soils. Remote Sensing Environ. 1990, 31, 175–182. [Google Scholar] [CrossRef]
- Brodie, G.; Ryan, C.; Lancaster, C. Microwave technologies as part of an integrated weed management strategy: A review. International Journal of Agronomy 2012, 2012, 636905. [Google Scholar] [CrossRef]
- Brodie, G.; Hamilton, S.; Woodworth, J. An assessment of microwave soil pasteurization for killing seeds and weeds. Plant Prot. Qtly 2007, 22, 143–149. [Google Scholar]
- Wayland, J.R.; Davis, F.S.; Merkle, M.G. Toxicity of an UHF device to plant seeds in soil. Weed Sci. 1973, 21, 161–162. [Google Scholar] [CrossRef]
- Menges, R.M.; Wayland, J.R. UHF electromagnetic energy for weed control in vegetables. Weed Sci. 1974, 22, 584–590. [Google Scholar] [CrossRef]
- Barker, A.V.; Craker, L.E. Inhibition of weed seed germination by microwaves. Agron. J. 1991, 83, 302–305. [Google Scholar] [CrossRef]
- Barker, A.V.; Craker, L.E. Inhibition of weed seed germination by microwaves. Agron. J. 1991, 83, 302–305. [Google Scholar] [CrossRef]
- Bojko, O.; Kabala, C. Transformation of physicochemical soil properties along a mountain slope due to land management and climate changes—A case study from the Karkonosze Mountains, SW Poland. Catena 2016, 140, 43–54. [Google Scholar] [CrossRef]
- Auyeung, D.N.; Martiny, J.B.; Dukes, J.S. Nitrification kinetics and ammonia-oxidizing community respond to warming and altered precipitation. Ecosphere 2015, 6, 1–17. [Google Scholar] [CrossRef]
- Waghmode, T.R.; Chen, S.; Li, J.; Sun, R.; Liu, B.; Hu, C. Response of nitrifier and denitrifier abundance and microbial community structure to experimental warming in an agricultural ecosystem. Frontiers in microbiology 2018, 9, 474. [Google Scholar] [CrossRef]
- Guo, J.; Ling, N.; Chen, H.; Zhu, C.; Kong, Y.; Wang, M.; Guo, S. Distinct drivers of activity, abundance, diversity and composition of ammonia-oxidizers: evidence from a long-term field experiment. Soil Biology and Biochemistry 2017, 115, 403–414. [Google Scholar] [CrossRef]
- Khan, M.J.; Jurburg, S.D.; He, J.; Brodie, G.; Gupta, D. Impact of microwave disinfestation treatments on the bacterial communities of no-till agricultural soils. European Journal of Soil Science 2020, 71, 1006–1017. [Google Scholar] [CrossRef]
- Scarlett, K.; Denman, S.; Clark, D.R.; Forster, J.; Vanguelova, E.; Brown, N.; Whitby, C. Relationships between nitrogen cycling microbial community abundance and composition reveal the indirect effect of soil pH on oak decline. The ISME Journal 2021, 15, 623–635. [Google Scholar] [CrossRef] [PubMed]
- Niu, Y.; Yang, X.; Hao, S.; Hei, Z.; Chen, B.; Hu, H.; Chen, Y. Temperate grassland soil nitrifiers are more sensitive to nitrogen addition than simulated warming. Applied Soil Ecology 2024, 195, 105214. [Google Scholar] [CrossRef]
Figure 1.
Soil surface temperature after 30-sec microwave treatment (A) 15.2 cm at 10 kW, (B) 15.2 cm at 20 kW, (C) 15.2 cm at 30 kW, (D) 2.5 cm at 30 kW, (E) 8.9 cm at 30 kW, and (F) 15.2 cm at 30 kW. Soil was placed on the tray in a rectangular arrangement of 10 cm by 20 cm.
Figure 1.
Soil surface temperature after 30-sec microwave treatment (A) 15.2 cm at 10 kW, (B) 15.2 cm at 20 kW, (C) 15.2 cm at 30 kW, (D) 2.5 cm at 30 kW, (E) 8.9 cm at 30 kW, and (F) 15.2 cm at 30 kW. Soil was placed on the tray in a rectangular arrangement of 10 cm by 20 cm.
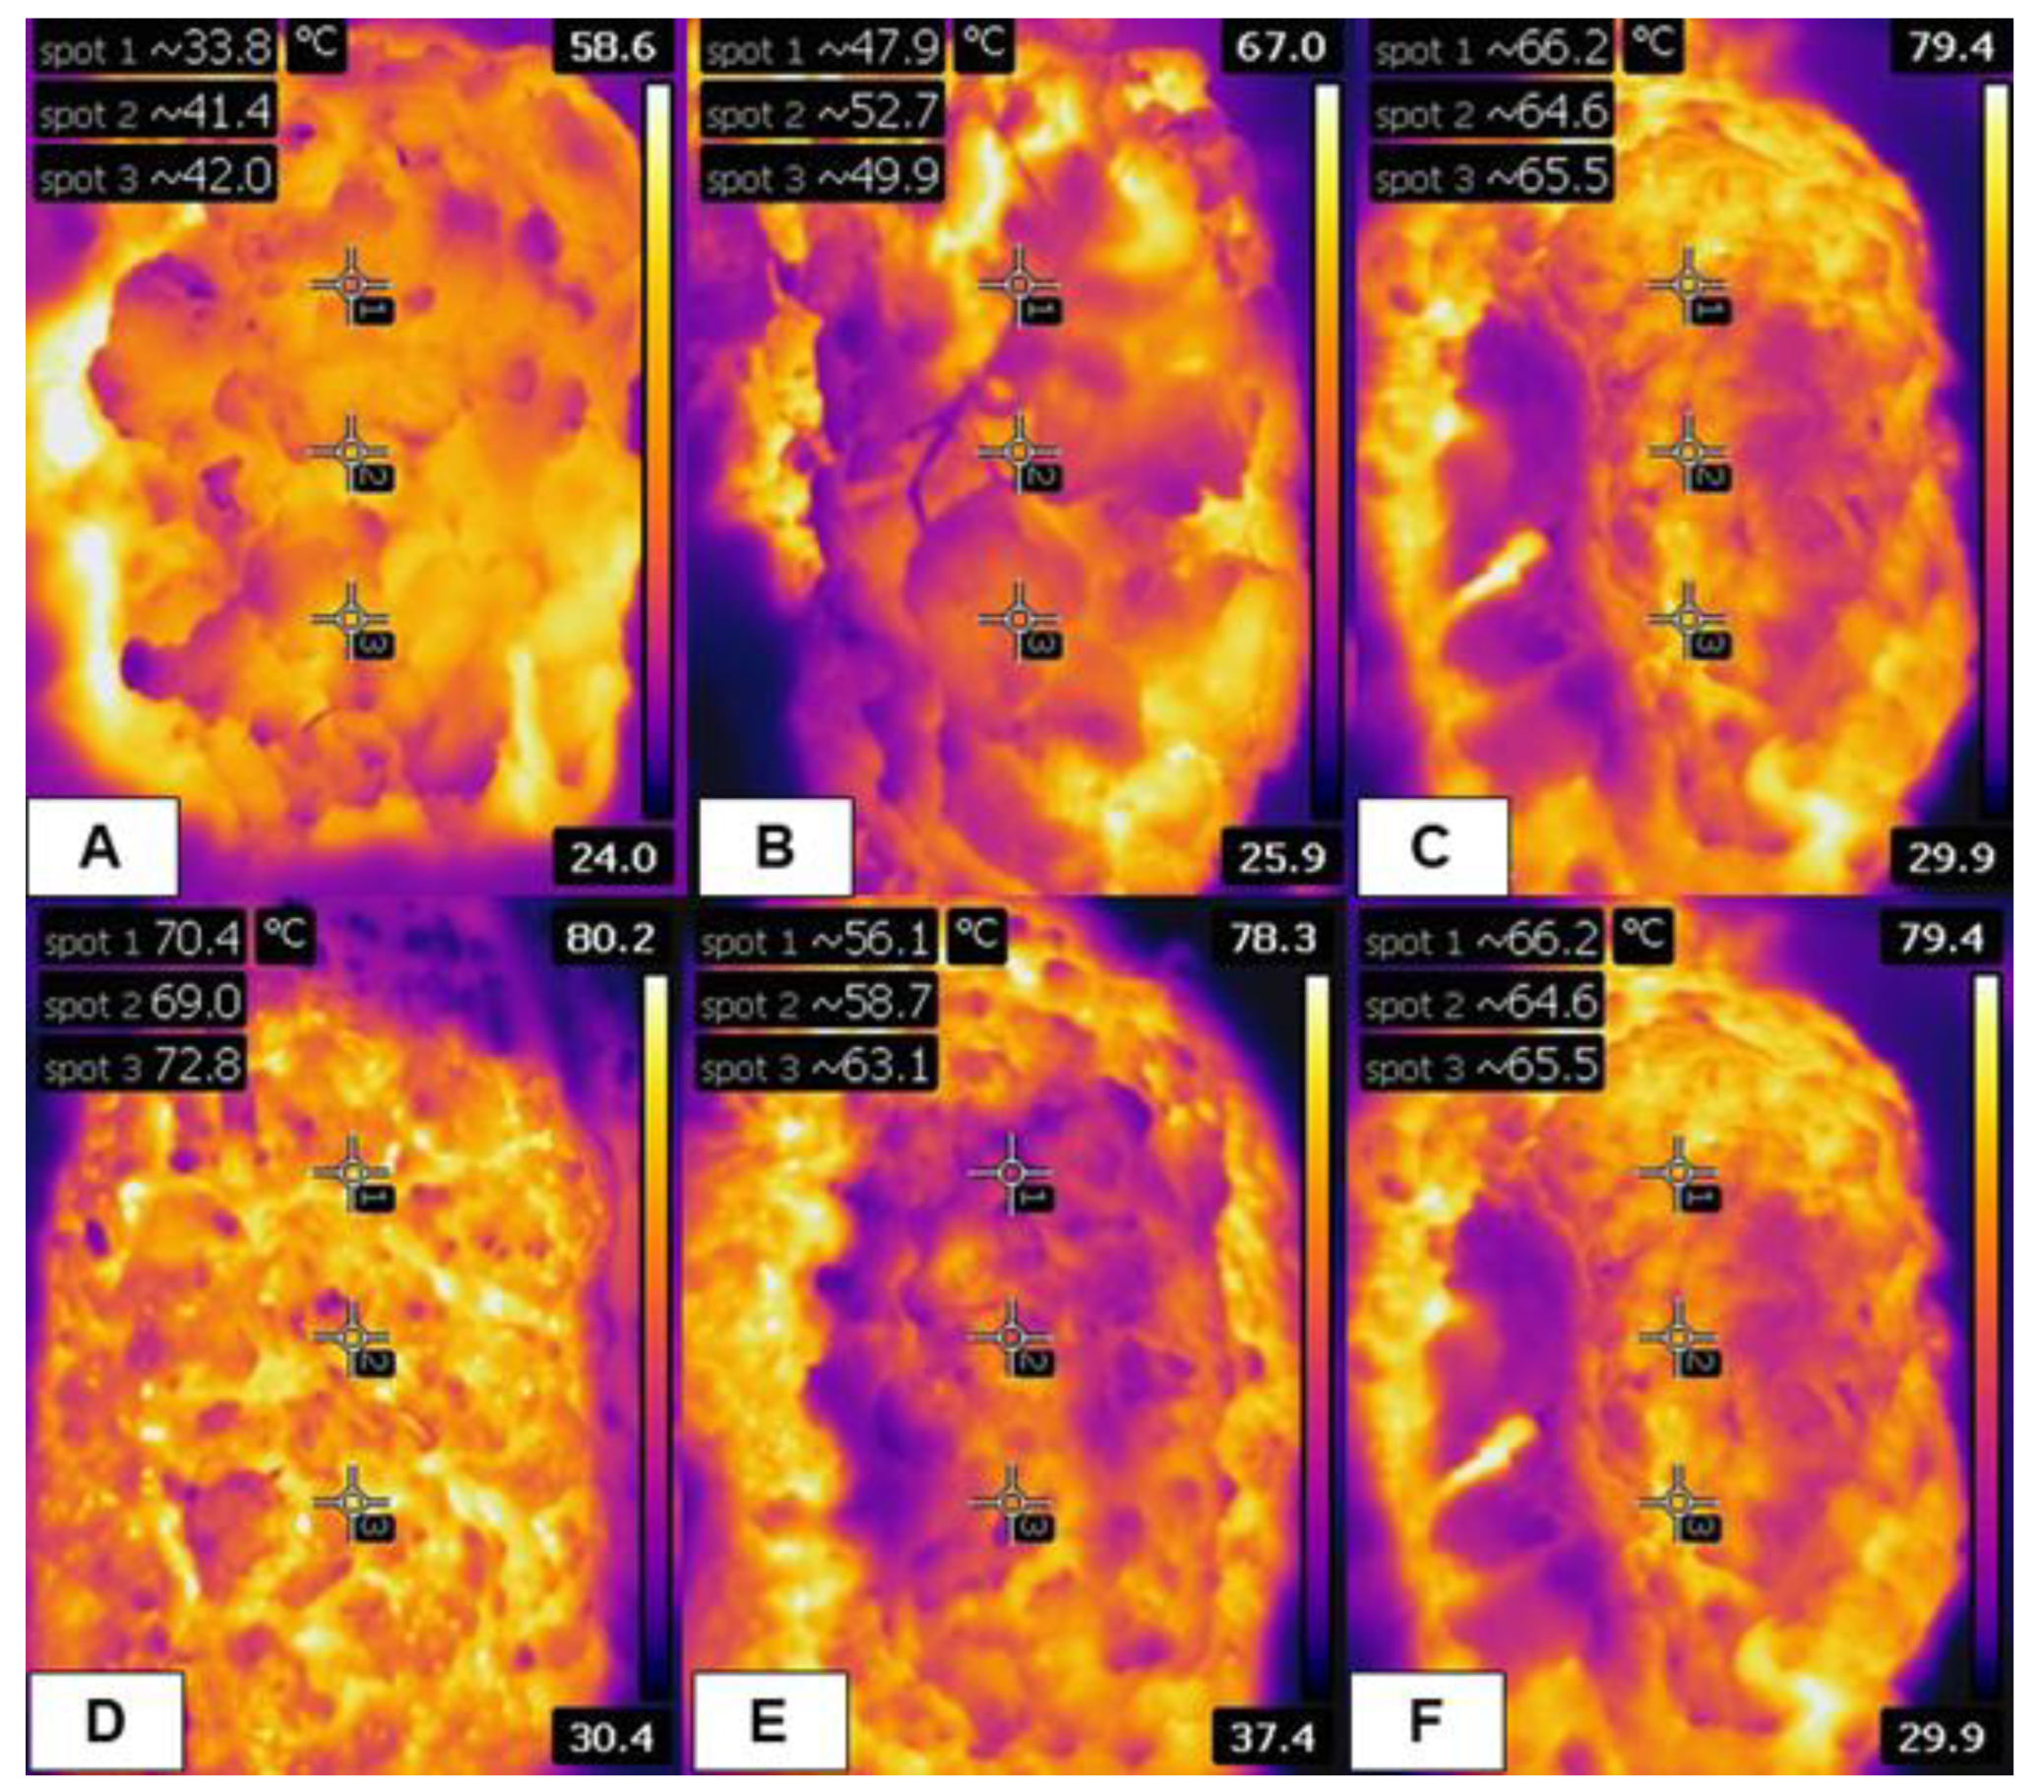
Figure 2.
Total germinability index of microwave treated soil determined after 14 days in greenhouse. Bars not connected with a common letter are statistically different.
Figure 2.
Total germinability index of microwave treated soil determined after 14 days in greenhouse. Bars not connected with a common letter are statistically different.
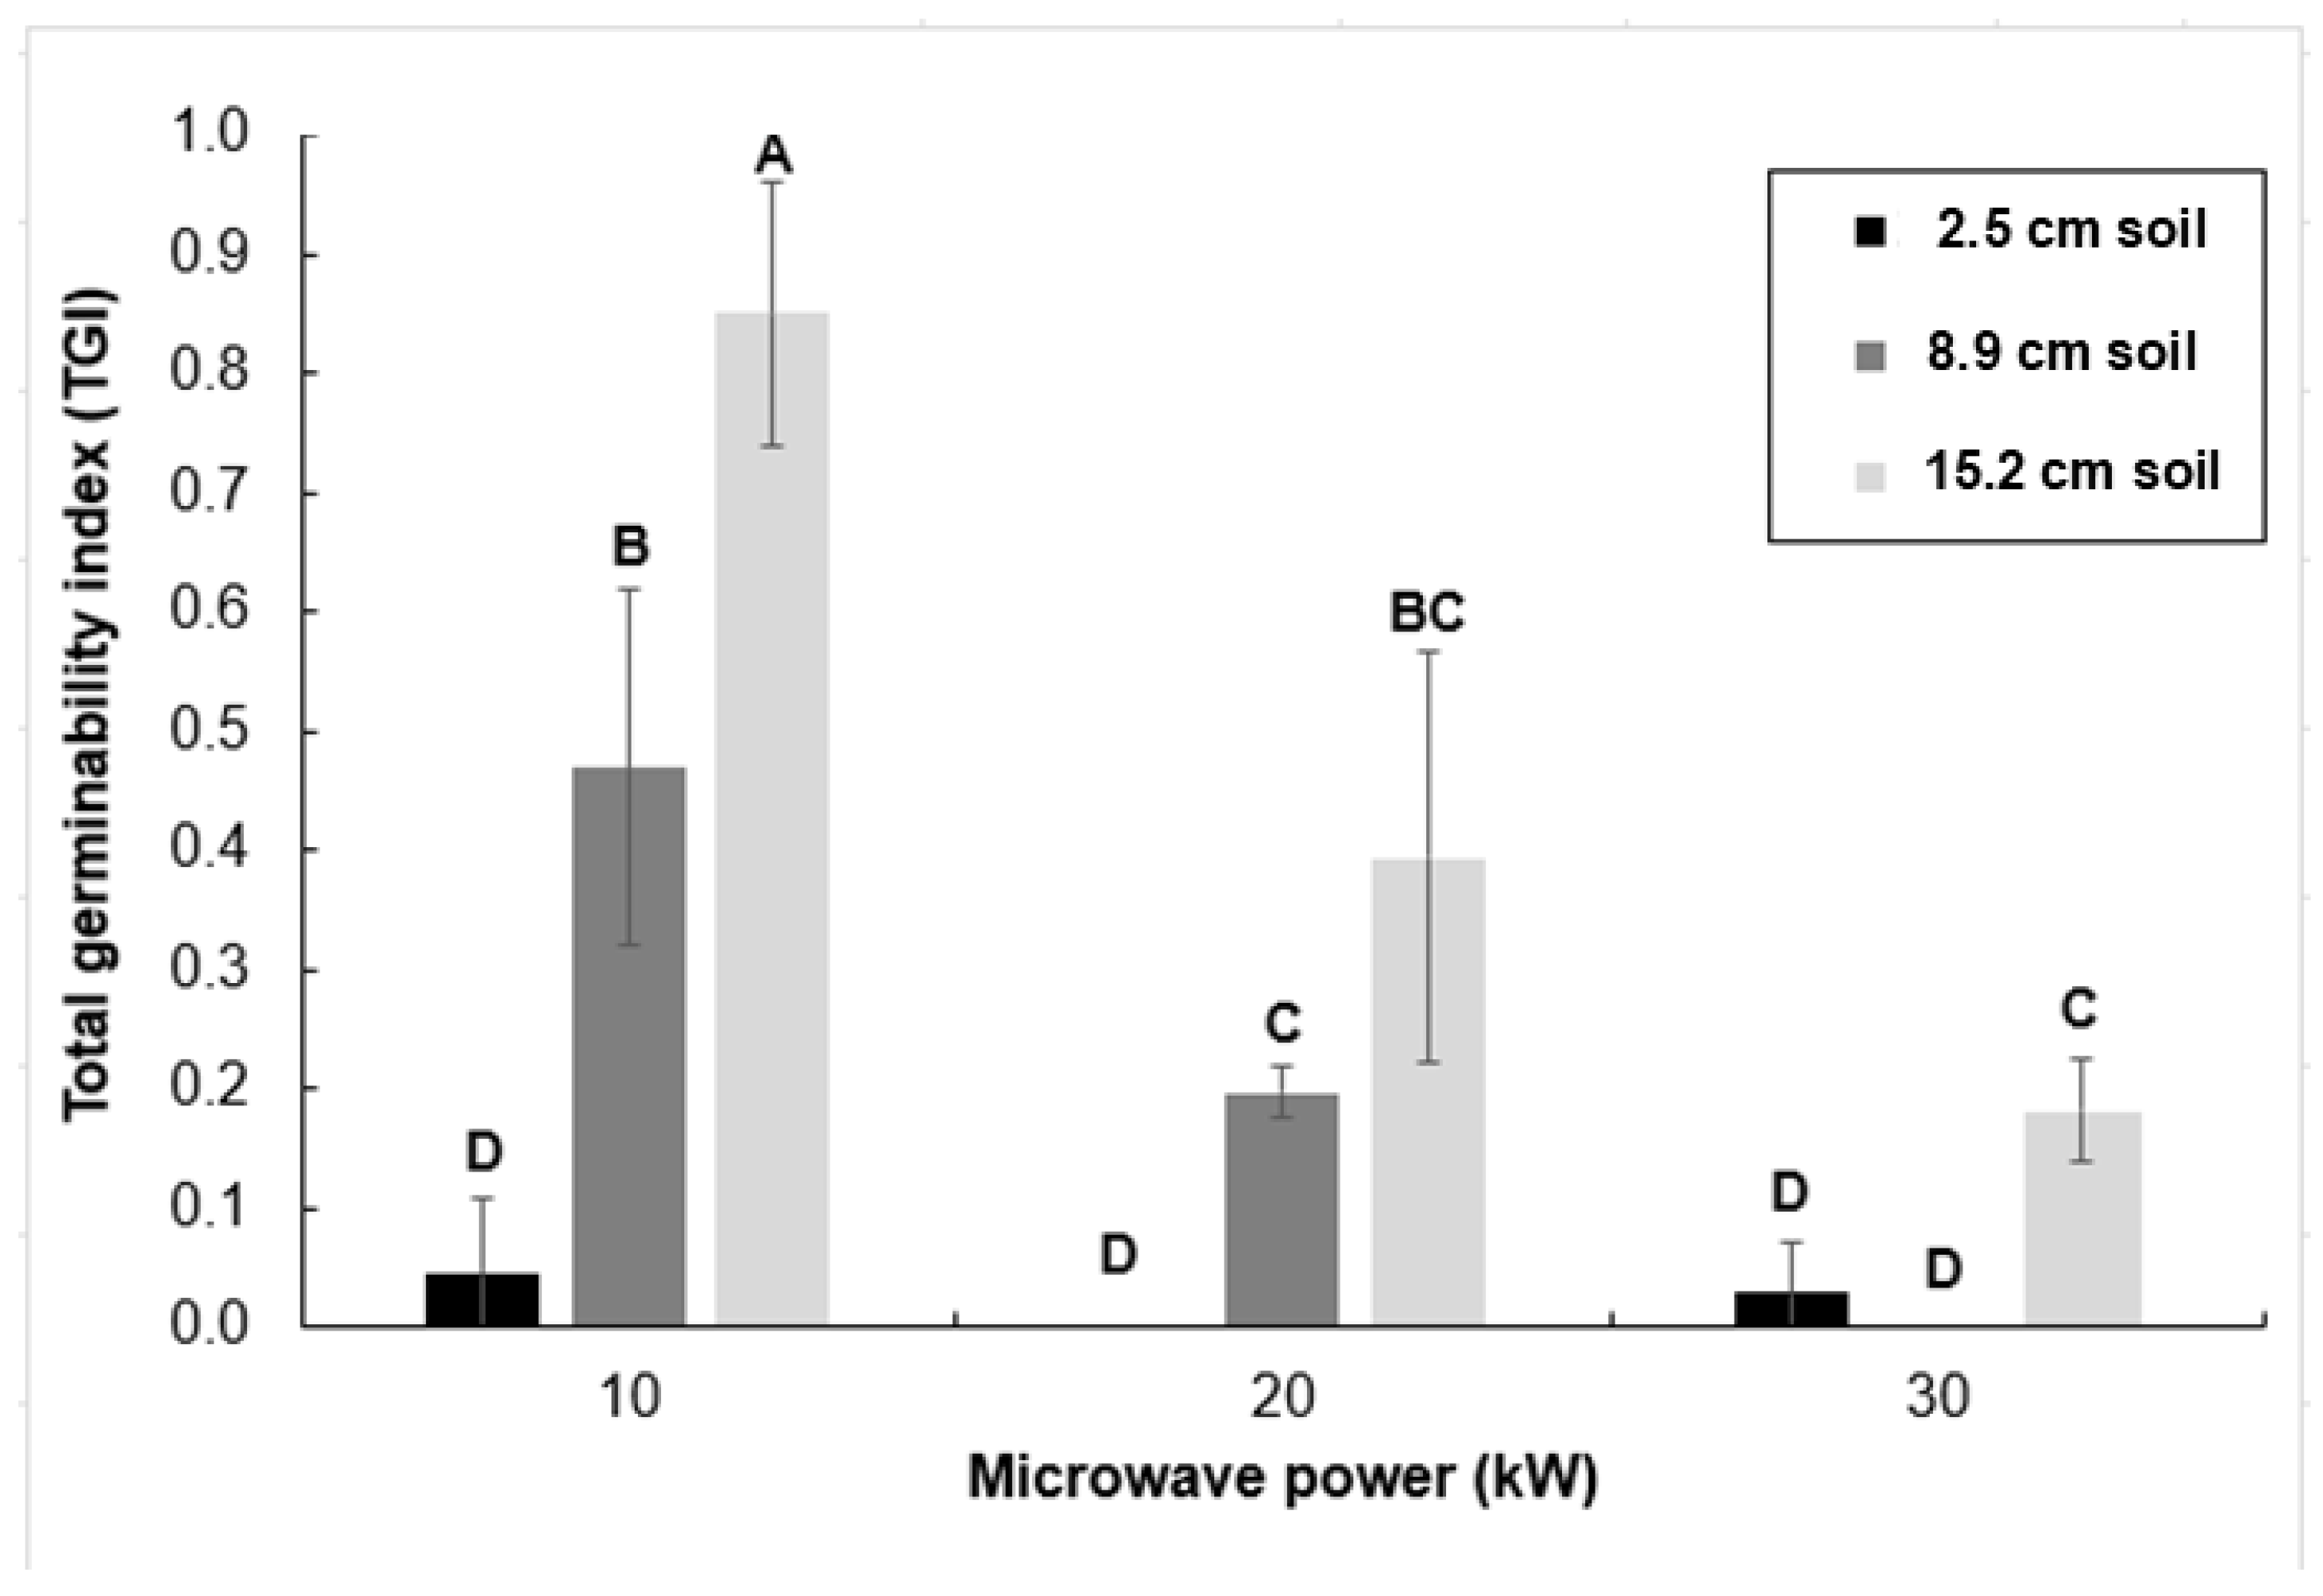

Table 1.
Physicochemical properties of soil sample collected for experiments.
| Properties | Soil sample |
| pH | 6.7 |
| EC (μmhos/cm) | 529.0 |
| P (mg/kg) | 31.2 |
| K (mg/kg) | 275.3 |
| Ca (mg/kg) | 3810.2 |
| Mg (mg/kg) | 977.6 |
| S (mg/kg) | 36.2 |
| Na (mg/kg) | 123.4 |
| Fe (mg/kg) | 335.5 |
| Mn (mg/kg) | 366.2 |
| Zn (mg/kg) | 3.0 |
| Cu (mg/kg) | 2.7 |
| B (mg/kg) | 1.4 |
| Percentage Loss on Ignition | 5.8 |
| Total Nitrogen (%) | 0.2 |
| Total Carbon (%) | 2.9 |
Table 2.
Experimental design for experiments conducted.
| Factors | Levels | Total number of experiments |
| Microwave power (kW) | 10, 20 and 30 | 3×3×2 = 18 |
| Soil depth (cm) | 2.5, 8.9 and 15.2 | |
| Replication | 1 and 2 |
Table 3.
Specific energy and soil temperature for each 30-sec microwave treatment.
| Microwave power (kW) |
Soil depth (cm) |
Soil volume (cm3) |
Soil mass (kg) |
Specific energy (kJ/kg soil) |
Soil temperature (°C)* |
| 10 | 2.5 | 500 | 1.5 | 200 | 77.5 |
| 10 | 8.9 | 1780 | 3.4 | 88 | 40.9 |
| 10 | 15.2 | 3040 | 4.8 | 63 | 38.6 |
| 20 | 2.5 | 500 | 1.5 | 400 | 92.3 |
| 20 | 8.9 | 1780 | 3.4 | 176 | 53.6 |
| 20 | 15.2 | 3040 | 4.8 | 125 | 41.3 |
| 30 | 2.5 | 500 | 1.5 | 600 | 95.5 |
| 30 | 8.9 | 1780 | 3.4 | 265 | 70.0 |
| 30 | 15.2 | 3040 | 4.8 | 188 | 58.3 |
* Mean value determined after 30 seconds from data recorded near surface and at bottom of soil pile on the tray.
Table 4.
Statistical analysis (F-test) to determine the significance of factors on the total germinability index (TGI) of soil after microwave treatment.
Table 4.
Statistical analysis (F-test) to determine the significance of factors on the total germinability index (TGI) of soil after microwave treatment.
| Factors | Levels | P-value |
| Microwave power (kW) | 10, 20 and 30 | 0.0009* |
| Soil depth (cm) | 2.5, 8.9, 15.2 | 0.0003* |
| Replication | 1 and 2 | 0.3533 |
*Signifies statistical significance at 95% level of confidence.
Table 5.
P-value showing impact of microwave power and soil depth on soil physicochemical properties and mean values of properties in soil treated for different levels of microwave power and soil depth. Treatment duration was fixed to 30 sec for these tests.
Table 5.
P-value showing impact of microwave power and soil depth on soil physicochemical properties and mean values of properties in soil treated for different levels of microwave power and soil depth. Treatment duration was fixed to 30 sec for these tests.
| Soil physicochemical properties | P-value* | Mean values of soil physicochemical properties for treated soil (MW power-Soil depth) | ||||||||||
| MW power | Soil depth | 10 kW-2.5 cm | 10 kW-8.9 cm | 10 kW-15.2 cm | 20 kW-2.5 cm | 20 kW-8.9 cm | 20 kW-15.2 cm | 30 kW-2.5 cm | 30 kW-8.9 cm | 30 kW-15.2 cm | Control # | |
| Soil pH | 0.0083* | 0.8148 | 6.6 b | 6.6 b | 6.6 b | 6.5 b | 6.7 ab | 6.7 ab | 6.8 a | 6.8 a | 6.8 a | 6.7 ab |
| Electrical Conductivity (μmhos/cm) | 0.0873 | 0.0307* | 465.0 b | 500.0 ab | 516.0 ab | 497.5 ab | 519.5 ab | 567.0 a | 510.5 ab | 498.0 ab | 517.5 ab | 529.0 ab |
| Phosphorus (mg/kg) | 0.2354 | 0.6804 | 31.8 b | 34.0 ab | 33.7 ab | 35.0 a | 34.6 ab | 32.8 b | 34.8 ab | 34.0 ab | 34.2 ab | 31.2 b |
| Potassium (mg/kg) | 0.0459* | 0.0138* | 263.8 b | 292.7 ab | 296.0 ab | 264.1 b | 262.9 b | 315.1 a | 259.3 b | 258.5 b | 266.0 b | 275.3 b |
| Calcium (mg/kg) | 0.6229 | 0.3466 | 3724.5 a | 3909.9 a | 3854.5 a | 3807.2 a | 3753.2 a | 4071.3 a | 3969.2 a | 3852.4 a | 3921.1 a | 3810.2 a |
| Magnesium (mg/kg) | 0.7329 | 0.4565 | 969.5 a | 1054.9 a | 989.5 a | 951.0 a | 936.1 a | 1062.4 a | 1023.4 a | 982.8 a | 1023.8 a | 977.6 a |
| Sulphur (mg/kg) | 0.5758 | 0.4557 | 30.6 a | 37.4 a | 34.4 a | 39.5 a | 35.5 a | 41.0 a | 50.4 a | 31.9 a | 30.9 a | 36.2 a |
| Sodium (mg/kg) | 0.7734 | 0.5843 | 121.8 a | 132.2 a | 123.6 a | 126.1 a | 119.1 a | 136.7 a | 134.4 a | 123.6 a | 130.5 a | 123.4 a |
| Iron (mg/kg) |
0.5742 | 0.5728 | 371.9 a | 312.0 b | 349.0 b | 336.0 b | 342.8 b | 323.9 b | 316.4 b | 324.6 b | 344.5 b | 335.5 b |
| Manganese (mg/kg) | 0.1021 | 0.0151* | 168.6 ab | 287.8 a | 349.6 a | 63.0 b | 246.2 ab | 181.0 ab | 123.1 | 187.3 ab | 274.7 a | 366.2 a |
| Zinc (mg/kg) |
0.4121 | 0.7018 | 3.0 a | 3.2 a | 3.2 a | 3.0 a | 3.1 a | 2.9 a | 3.3 a | 3.1 a | 3.0 a | 3.0 a |
| Copper (mg/kg) | 0.6767 | 0.3384 | 2.1 a | 3.4 a | 2.8 a | 2.4 a | 2.7 a | 2.9 a | 3.1 a | 3.0 a | 2.8 a | 2.7 a |
| Boron (mg/kg) | 0.7832 | 0.1711 | 1.8 a | 1.5 a | 1.5 a | 1.7 a | 1.6 a | 1.7 a | 1.6 a | 1.7 a | 1.6 a | 1.4 a |
| Percentage Loss on Ignition | 0.4149 | 0.2857 | 6.1 a | 5.4 a | 6.2 a | 6.3 a | 5.9 a | 5.9 a | 5.6 a | 5.5 a | 5.9 a | 5.8 a |
| Total Nitrogen (%) | 0.6445 | 0.5574 | 0.3 a | 0.2 a | 0.3 a | 0.3 a | 0.2 a | 0.3 a | 0.2 a | 0.2 a | 0.2 a | 0.2 a |
| Total Carbon (%) | 0.4922 | 0.5354 | 3.0 a | 2.6 a | 3.0 a | 3.2 a | 2.9 a | 2.9 a | 2.7 a | 2.7 a | 2.8 a | 2.9 a |
* p-values < 0.05 are considered to show statistical significance. # control samples were non microwave treated soil with a fixed soil depth of 1.3 cm. Standard deviations as measured by duplicates were not mentioned in the table for better readability. However, differences amongst same row were calculated based on standard deviations as an outcome of LS means student’s t test. Values connected in the same row with common letters were not statistically different.
Table 6.
P-value showing impact of microwave power and treatment duration on total bacteria, ammonia oxidizing archaea (AOA) and ammonia oxidizing bacteria (AOB), and mean values of these in soil treated for different levels of microwave power and treatment duration. Soil depth was fixed to 15.2 cm for these tests.
| Soil Microbes | P-value* | Mean values of soil microbes for treated soil (MW power-duration) | |||||||||
|---|---|---|---|---|---|---|---|---|---|---|---|
| Treatment (MW power-duration) | 10 kW-30 sec | 10 kW-60 sec | 10 kW-90 sec | 20 kW-30 sec | 20 kW-60 sec | 20 kW-90 sec | 30 kW-30 sec | 30 kW-60 sec | 30 kW-90 sec | Control # | |
| Total bacteria (copies per g of soil) | 0.0767 | 4.1*108 a | 3.5*108 ab | 2.7*108 abc | 0.7*108 c | 1.7*108 bc | 2.1*108 abc | 2.6*108 abc | 2.0*108 abc | 0.8*108 c | 1.4*108 bc |
| AOA (copies per g of soil) | 0.1313 | 2.7*107 ± ab | 2.4*106 ± bc | 4.2*105 c | 1.1*104 c | 1.7*104 c | 8.9*104 c | 4.4*104 c | 4.1*105 c | 2.9*105 c | 3.0*107 a |
| AOB (copies per g of soil) | <0.0001* | 1.7*108 b | 3.5*107 b | 3.7*107 b | 4.2*107 ± b | 2.4*107 b | 2.0*107 b | 2.7*107 b | 1.8*107 b | 9.7*106 b | 9.1*108 a |
* p-values < 0.05 are considered to show statistical significance. # control samples were non microwave treated soil with a fixed soil depth of 1.3 cm. Standard deviations as measured by duplicates were not mentioned in the table for better readability. Values connected in the same row with common letters were not statistically different.
Disclaimer/Publisher’s Note: The statements, opinions and data contained in all publications are solely those of the individual author(s) and contributor(s) and not of MDPI and/or the editor(s). MDPI and/or the editor(s) disclaim responsibility for any injury to people or property resulting from any ideas, methods, instructions or products referred to in the content. |
© 2026 by the authors. Licensee MDPI, Basel, Switzerland. This article is an open access article distributed under the terms and conditions of the Creative Commons Attribution (CC BY) license (http://creativecommons.org/licenses/by/4.0/).
Copyright: This open access article is published under a Creative Commons CC BY 4.0 license, which permit the free download, distribution, and reuse, provided that the author and preprint are cited in any reuse.


