
Submitted:
30 December 2024
Posted:
31 December 2024
You are already at the latest version
Abstract
The aim is to investigate the long-term impact of tillage technologies combined with the continuous application of straw and green manure on the sustainability of agroecosystems. Methods: Soil shear resistance was determined in the 0–10 and 10–25 cm soil layers with a Geonor 72,410 hardness tester after the sowing of spring rape and barley or after the resumption of winter wheat vegetation (beginning, middle, and end of the vegetation period) at 10 locations in the field. Soil moisture and temperature were measured in the 0–10 cm soil layer in 10 field locations. A portable soil respiration system LI–8100A with camera 8100–103 was used. Soil moisture was measured with the appendage 8100–204 and soil temperature—with the appendage 8100–203. The measurements started after the sowing of spring rape and barley, before harvest, or after the resumption of winter wheat vegetation and were carried out until autumn at fortnightly intervals in ten locations in the field. Soil CO2 emission (μmol m−2 s−1) was determined by IRGA (Infrared Gas Analyzer). A portable soil respiration system LI–8100A with camera 8100–103 was used. Results: The results showed that reduced tillage systems, compared to conventional deep plowing, resulted in higher soil moisture retention and lower CO2 emissions, showing potential for sustainable agroecosystem management.
Keywords:
shear resistance
; CO2 emissions
; soil
; tillage
; soil temperature
; soil moisture
1. Introduction
Mechanical tillage affects all the physical properties of the soil, such as soil moisture, the weather regime, nutrient supply to plants, etc. Soil’s physical properties affect the formation of the biological potential of the crop and its yield. Soil shear resistance is dependent on many factors: humus content, soil granulometric composition, porosity, hardness, density, as well as freeze-thaw processes [1]. Soil shear resistance is influenced by the geometry (root diameter and length) and distribution of plant roots and rooting characteristics [2].
Soil physical properties are altered by the simplification of tillage and direct sowing into stubble [3,4]. Report that in a light loam on sandy loam underlain by morainic clay in a deeper gleyic saturated loamy soil, replacing deep plowing (23–25 cm) with shallow plowing (12–14 cm) or deep, shallow, no-till technology did not result in any significant difference in soil moisture at different stages of the development of a barley crop [5].
Research has shown that the application of no-till technologies conserves soil moisture [6,7], which is one of the main factors determining the productivity of crops [8].Was found that deep and shallow loosening increased the moisture content in the upper layer of the soil studied, while the opposite trend was observed in the deeper (10–25 cm) layer [9,10]. With decreasing tillage intensity, the moisture content of the soil layer decreased from 14.1 to 13.7%. The moisture content also decreased in the 10–15 cm soil layer in a similar study, obtained the same trends [11].
Ambient temperature is related to soil temperature [12,13]. Intensive tillage practices warm the soil more quickly. Minimum tillage ensures optimal soil temperature conditions during the plant vegetation period [14]. Soil temperature influences many processes that occur in nature [15]. Soil temperature influences the rate and energy of root system development in cultivated plants. The subsequent growth and development of the plant depend on the root system [16]. Biochemical processes, such as the transport of dissolved organic carbon, are dependent on soil temperature [17], and the length of the crop vegetation period is also dependent on soil temperature [15,18,19], the duration of decomposition of soil organic matter [20], the rate of mineralization [17] (Haei et al., 2013), and the uptake of nutrients by plants [21,22].
With the changing climate, especially the drying of the climate, the European Environment Agency and the Centre for Environmental Research emphasize the importance of studying the water content of arable soils to increase soil moisture through agriculture. Research on soil moisture conservation is currently one of the most important topics [23].
Carbon stocks and soil physical properties are also affected by the tillage intensity. Research suggests that improving plant organic nutrition could improve the sustainability of agroecosystems. The use of crop residues needs to be optimized under Lithuanian soil and climate conditions [24].
Scientists argue that correct agronomic practices through farming systems can improve the carbon exchange between the soil and the atmosphere, increasing C sequestration and reducing CO2 emissions to the atmosphere [25,26,27].
Agricultural activity alters the nature and intensity of CO2, N2O, CH4 gas cycling, plant productivity, and photosynthetic activity [28,29,30]. The results obtained by researchers are very contradictory: some claim that the intensification of agricultural activity increases the intensity of GHG fluxes [31,32,33], while others claim that it reduces it [32], or that there is no difference in GHG concentrations [34].
CO2 can accumulate in the soil and act as a source of gas emissions. Photosynthesis contains organic matter and CO2 is incorporated as organic carbon. Deep plowing disrupts the soil structure and increases soil aeration, plant residues are incorporated into the soil mineralization and organic carbon oxidation processes, and more CO2 is released from the soil. By direct sowing into uncultivated soils and leaving all crop residues on the soil surface, we can increase the carbon content of the topsoil [35]. The release of CO2 from the soil is enhanced by soil microflora, fauna, and plant roots [36]. Soil carbon is limited and is part of the total carbon cycle. Carbon moves through the atmosphere, the terrestrial biosphere, and the oceans. Nature has a unique carbon cycle: plants absorb CO2 from the atmosphere through photosynthesis, make their tissues from the carbon, and return it to the atmosphere when they die. CO2 stays in the atmosphere for quite a long time (50 to 200 years), depending on how quickly it is returned to the land or oceans. About 60% of greenhouse gases are carbon dioxide. To reduce the greenhouse effect, it is necessary to sequester carbon in the soil. This can be done by incorporating manure or crop residues into the soil, increasing biodiversity, or using organic mulches [37].
The use of simplified tillage systems or direct sowing into uncultivated soil preserves the basic mechanical and physical soil properties and reduces labor time, fuel consumption, and costs. No-tillage reduces negative environmental impacts and the release of greenhouse gases from the soil [38]. The argue that intensive tillage increased CO2 emissions from soil. Other researchers have argued that no-tillage reduces the release of CO2 from soil [39]. Argue that CO2 emissions depend not only on the choice of tillage method but also on the soil composition [40].
Continuous deep tillage harms many soil properties: it promotes the formation of a soil tread at the boundary between the soil and the subsoil, and it decreases the humus content, which leads to lower yields of crops [41].
The Aim to evaluate the long-term impact of different tillage technologies combined with the continuous application of straw and green manure on soil physical and chemical properties and CO₂ emissions, aiming to identify sustainable agricultural practices that ensure agroecosystem stability and productivity.
2. Materials and Methods
2.1. Study Sites
The stationary experiment was set up in 1999 at the Experimental Station of VMU Agriculture Academy. The studies were carried out in 2019–2023. The field soil of the experiment is a deeper gleyic saturated loamy soil according to the Lithuanian soil classification (LTDK–99) [42], and according to the international classification (IUSS Working Group WRB, 2022) it is Epieutric Endocalcaric Endogleyic Planosol (Endoclayic, Aric, Drainic, Humic, Episiltic).
Experimental variants. The experiment was set up in a split-plot design with 4 replicates, and 48 fields in total. The size of the fields was 102 m2 (6 m × 17 m) for the baseline and 30 m2 (15 m × 2.0 m) for the reference. In the experiment, the crops were heated in the following order: spring rape, winter wheat, barley. In one part of the experiment, the straw was removed (S0) and in the other part it was chopped and spread (S1). All tillage systems were tested in both the no-straw and the straw-spread backgrounds.
Factor A. Straws
- Without straw (S0);
- Straw chopped and spread (S1).
Factor B. Tillage systems
- Stubble shaved and plowed in autumn at a depth of 23–25 cm (control, deep plowing, CP);
- Stubble shaved and plowed in autumn at a depth of 10–12 cm (shallow plowing, SP);
- Stubble shaved in autumn with a disc cultivator to a depth of 8–10 cm (shallow cultivation in autumn, SC);
- Stubble left over winter and shaved before sowing with a disc cultivator at a depth of 4–5 cm (stubble left over winter, SOW);
- Direct sowing of cover crops on uncultivated land and shallow loosening with a disc cultivator to a depth of 4–5 cm (no-till with cover crops, NTC);
- Direct sowing on uncultivated land without cover crops (NT).
After harvesting the pre-crop (except for spring rape), the straw was removed in one part of the experiment (S0) and chopped and spread in the other part (S1). All tillage systems were investigated in both the background without straw and the background with straw spread.
2.2. Soil Shear Resistance
Soil shear resistance was determined in the 0–10 and 10–25 cm soil layers with a Geonor 72,410 hardness tester after the sowing of barley or after the resumption of winter wheat vegetation (at the beginning, middle, and end of the vegetation period) at 10 locations of the reference field. However, in 2019, it was impossible to determine the shear resistance due to unfavorable climatic conditions.
2.3. Soil Temperature and Moisture
Soil moisture and temperature were measured in the 0–10 cm soil layer at 10 field locations. A portable soil respiration system LI–8100A with camera 8100–103 was used. Soil moisture was measured with the appendage 8100–204 and soil temperature—with the appendage 8100–203. The measurements started after the sowing of spring rape and barley, before harvest, or after the resumption of winter wheat vegetation, and were carried out until autumn at fortnightly intervals in ten locations in the field.
2.4. CO2 Emissions from Soil
CO2 emissions (μmol m−2 s−1) from soil were determined by the IRGA (Infra-Red Gas Analyzer) method. A portable soil respiration system LI-8100A with camera 8100–103 was used. In each reference field, 20 cm diameter rings were staked in the spring, and measurements were taken at the beginning, middle, and end of the vegetation period. CO2 emissions from the soil were measured from 8 a.m. to 11 a.m. and from 2 p.m. to 5 p.m.
2.5. Statistical Analysis
Experimental data were analyzed using a two-factor analysis of variance (ANOVA) based on the methodology using the SYSTAT 12 statistical software package, version 12 (SPSS Inc., Chicago, IL, USA). The significance of differences among the treatments was determined using the least significant difference (LSD) test. The inter-causality of the tested variables was estimated through the correlation–regression analysis method using STAT ENG software. The probability levels indicating significant differences between specific treatments and the control treatment were denoted as follows: *—when 0.010 < p ≤ 0.050 (significant at the 95% probability level); **—when 0.001 < p ≤ 0.010 (significant at the 99% probability level); and ***—when p ≤ 0.001 (significant at the 99.99% probability level).
3. Results and Discussion
3.1. CO2 Emissions from Soil
During the 2019 spring rape vegetation period (24 May, 26 July), measurements in fields without straw (S0) and no-till (CP), no-till with cover crops (NTC), and no-till with cover crops (NTC) resulted in a higher release of CO2 from the soil by 5.2% to 12.6% (Figure 1).
However, measurements in the middle of the crop vegetation period (26 June) showed the opposite trend. During the period studied (24 May, 26 June), in the fields where the pre-crop straw was chopped and spread (S1), the no-till technology with cover crops (NTC) showed a higher CO2 emission (from 4.1 to 40.0%). The measurements on 26 July in the fields with no-till with cover crops (NTC) and no-till without cover crops (NT) showed a lower CO2 emission from the soil of 18.5 to 22.1%.
During the 2020 winter wheat vegetation period (10 May, 27 April, 10 August), measurements on fields where straw was removed (S0) and chopped and spread (S1) by no-till with cover crops (NTC) showed an increase of 1.1 to 1.6% in the release of CO2 from the soil in comparison to deep plowing (CP) (Figure 2).
The application of no-till technology without cover crops (NT) revealed quite different trends.
In a study from 2013 to 2015, it was found that straw incorporation had no significant effect on the release of CO2 from the soil compared to deep plowing [43]. Similar results were obtained in our experiment. In 2019 and 2020, no significant differences were found in all fields where different tillage systems were applied. These observations support the results reported who suggested that such changes in CO2 emissions during the growing season may be related to root and soil respiration rates [44].
In the spring barley vegetation period of 2021 (12 May), measurements in fields where straw was removed (S0) and chopped and spread (S1) using no-till without cover crops (NT) and with cover crops (NTC) showed a higher release of CO2 from the soil (between 1.6% and 2.5%) in comparison to deep plowing (CP) (Figure 3).
Measurements made later (17 July, 3 August) showed that no-till with cover crops (NTC) and no-till without cover crops (NT) showed a lower release of CO2 from the soil (between 1.6% and 2.4%) compared to deep plowing (CP) fields.
The release of CO2 in the soil occurs as a result of biochemical processes closely related to the biological activity of microorganisms and root respiration. Autotrophic soil respiration originates from roots and the rhizosphere and is most affected by fine root biomass, soil temperature, C partitioning, and nutrient availability [45,46]. CO2 emissions from the soil are an important indicator for assessing the environmental impact of tillage practices. Our data show that the use of minimum tillage and leaving straw residues in the soil resulted in significantly lower CO2 emissions compared to conventional deep plowing. These results are similar to the findings of and other researchers [47,48], who suggest that the accumulation of organic matter in the soil and lower soil mechanical compaction reduces microbial activity and thus CO2 emissions.
In 2019, in the fields where the straw was chopped and spread (S1), a linear, very strong, negative, and statistically significant correlation between soil CO2 emission (24 May 2019), (26 June 2019) and density (30–35 cm), (5–10 cm) was established (r = −0.99, y = 7.824 − 2.627x, p < 0.05), (r = −0.99, y = 1.663 − 0.09x, p < 0.05). A linear, very strong, negative, and statistically significant correlation was found between the soil CO2 emission (26 June 2019) and the stocks of microbiota (0–10 cm) (r = −0.99, y = 956.263 − 128.526x, p < 0.05) as well as stocks of microbiota (10–25 cm) (r = −0.99, y = 528.316 − 88.632x, p < 0.05). A linear, very strong, positive, and statistically significant correlation between soil CO2 emission (26 June 2019) and water retention (−4 hPa) (5–10 cm) was found, as well as water retention (−10 hPa) (5–10 cm) (r = 0.99, y = 0.272 + 0.034x, p < 0.05).
In 2020, in the fields where the straw was chopped and spread (S1), a linear very strong, positive, and statistically significant correlation was found between soil CO2 emissions (27 May 2020) and mobile humic substances (10–25 cm) (r = 1.0, y = 4.853 + 13.141x, p < 0.01).
In 2021, in the fields where the straw was removed (S0), a linear, very strong, positive, and statistically significant correlation was found between soil CO2 emission (12 May 2021) and organic carbon content (0–10 cm) (r = 0.99, y = −2.479 + 2.322x, p < 0.05), as well as organic carbon stocks (0–10 cm) (r = 0.99, y = −2.462 + 0.17x, p < 0.05). The data are from the dissertation [47].
3.2. Soil Shear Resistance
For the 2020 winter wheat crop, it was found that for the whole study period, soil shear resistance was 1.1 to 1.3 times higher in the soil layers with the straw removed (S0) when the shallow autumn cultivation (SC) was applied compared to deep plowing (CP) (Figure 4). In the previous year of our study (2014), we found similar trends when the same crop was grown (adapted from Steponavičienė et al. 2020). Measurements taken on 27 May in fields where straw was removed (S0) and where straw was chopped and spread (S1) using no-till with cover crops (NTC) and without cover crops (NT) and leaving stubble over winter (SOW) showed a significantly higher soil shear resistance of 1.3 to 1.5 times in the soil layers studied compared to deep plowing (CP). In our previous studies, it was found that, in the winter wheat crop, different tillage technologies had a significant effect on the soil shear resistance in both the 0–10 and 10–25 cm soil layers tested. Compared to deep plowing, simplified tillage systems increased soil shear resistance in the 0–10 cm soil layer from 14.6% to 64.5% and in the deeper 10–25 cm layer—from 49.8% to 71.7% (see publication II) [49]. Based on these data, recent studies have revealed the different effects of different tillage methods on soil strength and structure. Their study compared different tillage practices with conventional tillage and found that all other tillage systems significantly increased soil shear strength [50].
Researchers found that soil shear resistance was significantly higher in both fields with straw removed and straw chopped and spread under different reduced tillage systems [51]. Other states that a considerable influence of tillage systems was found in the upper (0–10 cm) soil layer studied [52]. Significantly higher soil shear resistance was found in the soil shallowly cultivated in autumn with a cultivator with flat-cut colters and disc implements, shallowly with a rotary cultivator before sowing cultivated soil, after shallow application of green manure with a rotary cultivator in spring, and in direct sowing in uncultivated soil compared with deep plowing.
In 2021, measurements in spring barley crops on 12 May and 3 August in the fields where straw was removed (S0) and where it was chopped and spread (S1) using both no-till with cover crops (NTC) and without cover crops (NT) and leaving stubble over winter (SOW), the soil layers studied showed a shear resistance of 1.0 to 1.5 times higher than that of the deep plowing (CP) method (Figure 4). Similar trends were found in the upper soil layer during the studies in 2015 (adapted from Steponavičienė et al., 2020). In the deeper soil layer, no soil shear resistance was determined due to unsuitable meteorological conditions and very hard soils. In our previous studies, we found that the influence of tillage systems on shear resistance, compared to deep plowing, in the upper 0–10 cm soil layer studied, was significantly higher after loosening the soil with a rotary cultivator before sowing −12.9%; 14.0% after shallow application of green manure with a rotary cultivator in the spring; and 11.3% after direct sowing in uncultivated fields (see Paper II) (Steponavičienė et al., 2020). However, measurements in these fields on 17 July showed the opposite trend. These findings highlight the positive effect of straw incorporation into soil on shear strength [53].
Shear resistance was one of the main indicators of soil physical properties measured. Our data show that minimum tillage and the use of cover crops reduce soil density and shear resistance, making it easier for plant roots to grow. This result is consistent with studies who also reported that minimum tillage improves soil porosity and structure [25,32]. However, it should be stressed that some of our results show a higher shear resistance in shallow plowing zones, which may be related to inadequate plowing depths or soil compositional characteristics. Similar results, where minimum tillage did not provide the expected benefits, are found in the studies [54,55].
In the fields where straw was chopped and spread (S1), a linear very strong negative, and statistically significant correlation was found between soil shear resistance (2020) (r = −0.99, y = 81.06 − 10.941x, p < 0.01) and the organic carbon content (r = −0.99, y = 681.25 − 0.81x, p < 0.05) in the organic carbon pool in the 0–10 cm soil layer. The data are from the dissertation [47].
3.3. Soil Moisture
Soil moisture is an important factor in assessing soil health and has a major impact on plant development. Water supply plays a critical role in facilitating crop physiological processes [56]. During the 2019 spring rape vegetation period (24 May, 26 June, and 26 July), measurements in the fields where straw was removed (S0) using no-till without cover crops (NT) showed a higher soil moisture content (between 0.02 and 1.26 percentage points) compared to the deep plowing (CP) fields (Figure 5). Similar results were found [57] i.e., that reducing tillage intensity improves soil moisture retention.
During the study period (24 May, 26 June), higher soil moisture content (between 0.59 and 1.85 percentage points) was found in the fields where the straw was chopped and spread (S1), in the no-till without cover crops (NT) and with cover crops (NTC). On 24 May, in the no-till with cover crops (NTC) fields, the soil moisture content was significantly higher (0.82 percentage points) compared to deep plowing (CP) (Figure 5).
In the 2020 winter wheat vegetation period (10 April), measurements in the fields where straw was removed (S0) with no-till without cover crops (NT) and with cover crops (NTC) showed a significantly lower soil moisture content of 1.25 to 1.45 percentage points compared to deep plowing (CP) fields (Figure 6). Measurements taken later (27 May, 10 August) showed an increase in soil moisture (from 0.68 to 1.43 percentage points) in the simplified tillage systems compared to the deep plowing (CP) fields.
In the 2020 winter wheat crop, measurements of soil moisture content on 10 April in the fields where straw was chopped and spread (S1) using no-till with cover crops was significantly higher (0.74 percentage points). The measurements on 10 August showed a significantly higher soil moisture content (3.42 to 4.58 percentage points) in the fields with cover crops (NTC) and without cover crops (NT) compared to deep plowing (CP) (Figure 6).
In the spring barley vegetation period in 2021 (17 July), measurements in the fields with removed straw (S0) using no-till without cover crops (NT) and with cover crops (NTC) technologies showed a significantly lower soil moisture content (1.51 to 2.38 percentage points compared to the deep plowing (CP) (Figure 7). Measurements taken later (3 August) showed an increase in soil moisture (from 0.74% percentage points) in the no-till with cover crops (NTC) compared to deep plowing (CP) fields.
In the spring barley crop, measurements (12 May, 17 July, 3 August) in the fields where straw was chopped and spread (S1) using no-till with cover crops (NTC) and no-till without cover crops (NT) showed a lower soil moisture content (0.10 to 3.35 percentage points) compared to deep plowing (CP) (Figure 7).
Soil moisture is an important indicator for evaluating tillage systems, especially during drought. Our data show that leaving straw residues and cover crops helps to conserve higher soil moisture. Our results are in line with other researchers [18,19], who showed that the use of organic mulches and the retention of soil cover can significantly improve soil water content. However, it is important to note that different agroecological conditions may lead to different results and further research is needed to assess the effectiveness of these methods in different environments [58,59].
In 2019, a linear very strong negative and statistically significant correlation (r = 0.99, y = −22.421 − 0.048x, p < 0.05) was found between soil moisture (26 July 2019) and the persistence of aggregates in the 0–10 cm soil layer in the fields where straw was removed (S0). In the fields where straw was chopped and spread (S1), a linear very strong positive, and statistically significant correlation was found between soil moisture (26 June 2019) (r = 0.99, y = 6.129 + 4.861x, p < 0.05) and organic carbon content (r = 0.99, y = 6.113 + 0.239x, p < 0.05) in the organic carbon pool in the 10–25 cm layer of soil. A linear very strong negative and statistically significant correlation was found between soil moisture (26 July 2019) (−r = 1.0, y = 22.324 − 2.282x, p < 0.05) and soil density (15–20 cm).
In 2020, in the fields from which straw was removed (S0), a linear very strong positive and statistically significant correlation was found between soil moisture (10 August 2020) (r = 1.0, y = 220.861 + 0.05x, p < 0.05) and organic carbon content (10–25 cm) (r = 1.0, y = 20.861 + 0.05x, p < 0.05) as well as organic carbon stocks. In the fields where straw was chopped and spread (S1), a linear very strong positive, and statistically significant correlation was found between soil moisture (10 August 2020) (r = 0.99, y = 14.927 + 22.0x, p < 0.05) and mobile humic substances in the 10–25 cm soil layer.
In 2021, a linear very strong positive and statistically significant correlation was found between soil moisture (12 May 2021) (r = 1.0, y = 10.258 + 0.003x, p < 0.01) and the crop emergence after 10 days in the fields where straw was removed (S0). In the fields where straw was chopped and spread (S1), a linear very strong positive, and statistically significant correlation was found between soil moisture (12 May 2021) and spring barley yield (r = 0.99, y = 10.269 + 0.184x, p < 0.05). A linear, very strong positive, and statistically significant correlation was found between soil moisture (17 July 2021) (r = 0.99, y = −46.145 + 4.782x, p< 0.05) and spring barley yield. The data are from the dissertation [47].
3.4. Soil Temperature
Soil temperature is a critical factor in agricultural activities because it affects seed germination, composition, flowering, and various plant developmental activities [60]. During the 2019 spring rape vegetation period (24 May, 26 July), measurements in fields with straw removed (S0) and no-till technologies without cover crops (NT) as well as with cover crops (NTC) showed lower soil temperatures (1.05 to 8.81%) compared to deep plowing (CP) fields (Figure 8). The measurements taken on 26 June showed higher soil temperatures (8.81 to 16.78%) in the reduced tillage fields.
In the spring rape crop, measurements (24 May, 26 June, 26 July) in the fields where the pre-crop straw was chopped and spread (S1) using the no-till technology without cover crops (NT) showed a lower soil temperature (1.50 to 4.34%) compared to the deep plowing (CP) (Figure 8).
During the 2020 winter wheat vegetation period (10 August), measurements in fields where straw was removed (S0) and chopped and spread (S1) using no-till technology without cover crops (NT) and with cover crops (NTC) showed significantly lower soil temperatures (11.53 to 14.26%) compared to deep plowing (CP) fields (Figure 9).
During the whole study period (10 April, 27 May, 10 August), the soil temperature was lower (0.68 to 1.43%) in the fields where straw was removed (S0) using no-till with cover crops (NTC) compared to the deep plowing (CP) fields (Figure 9).
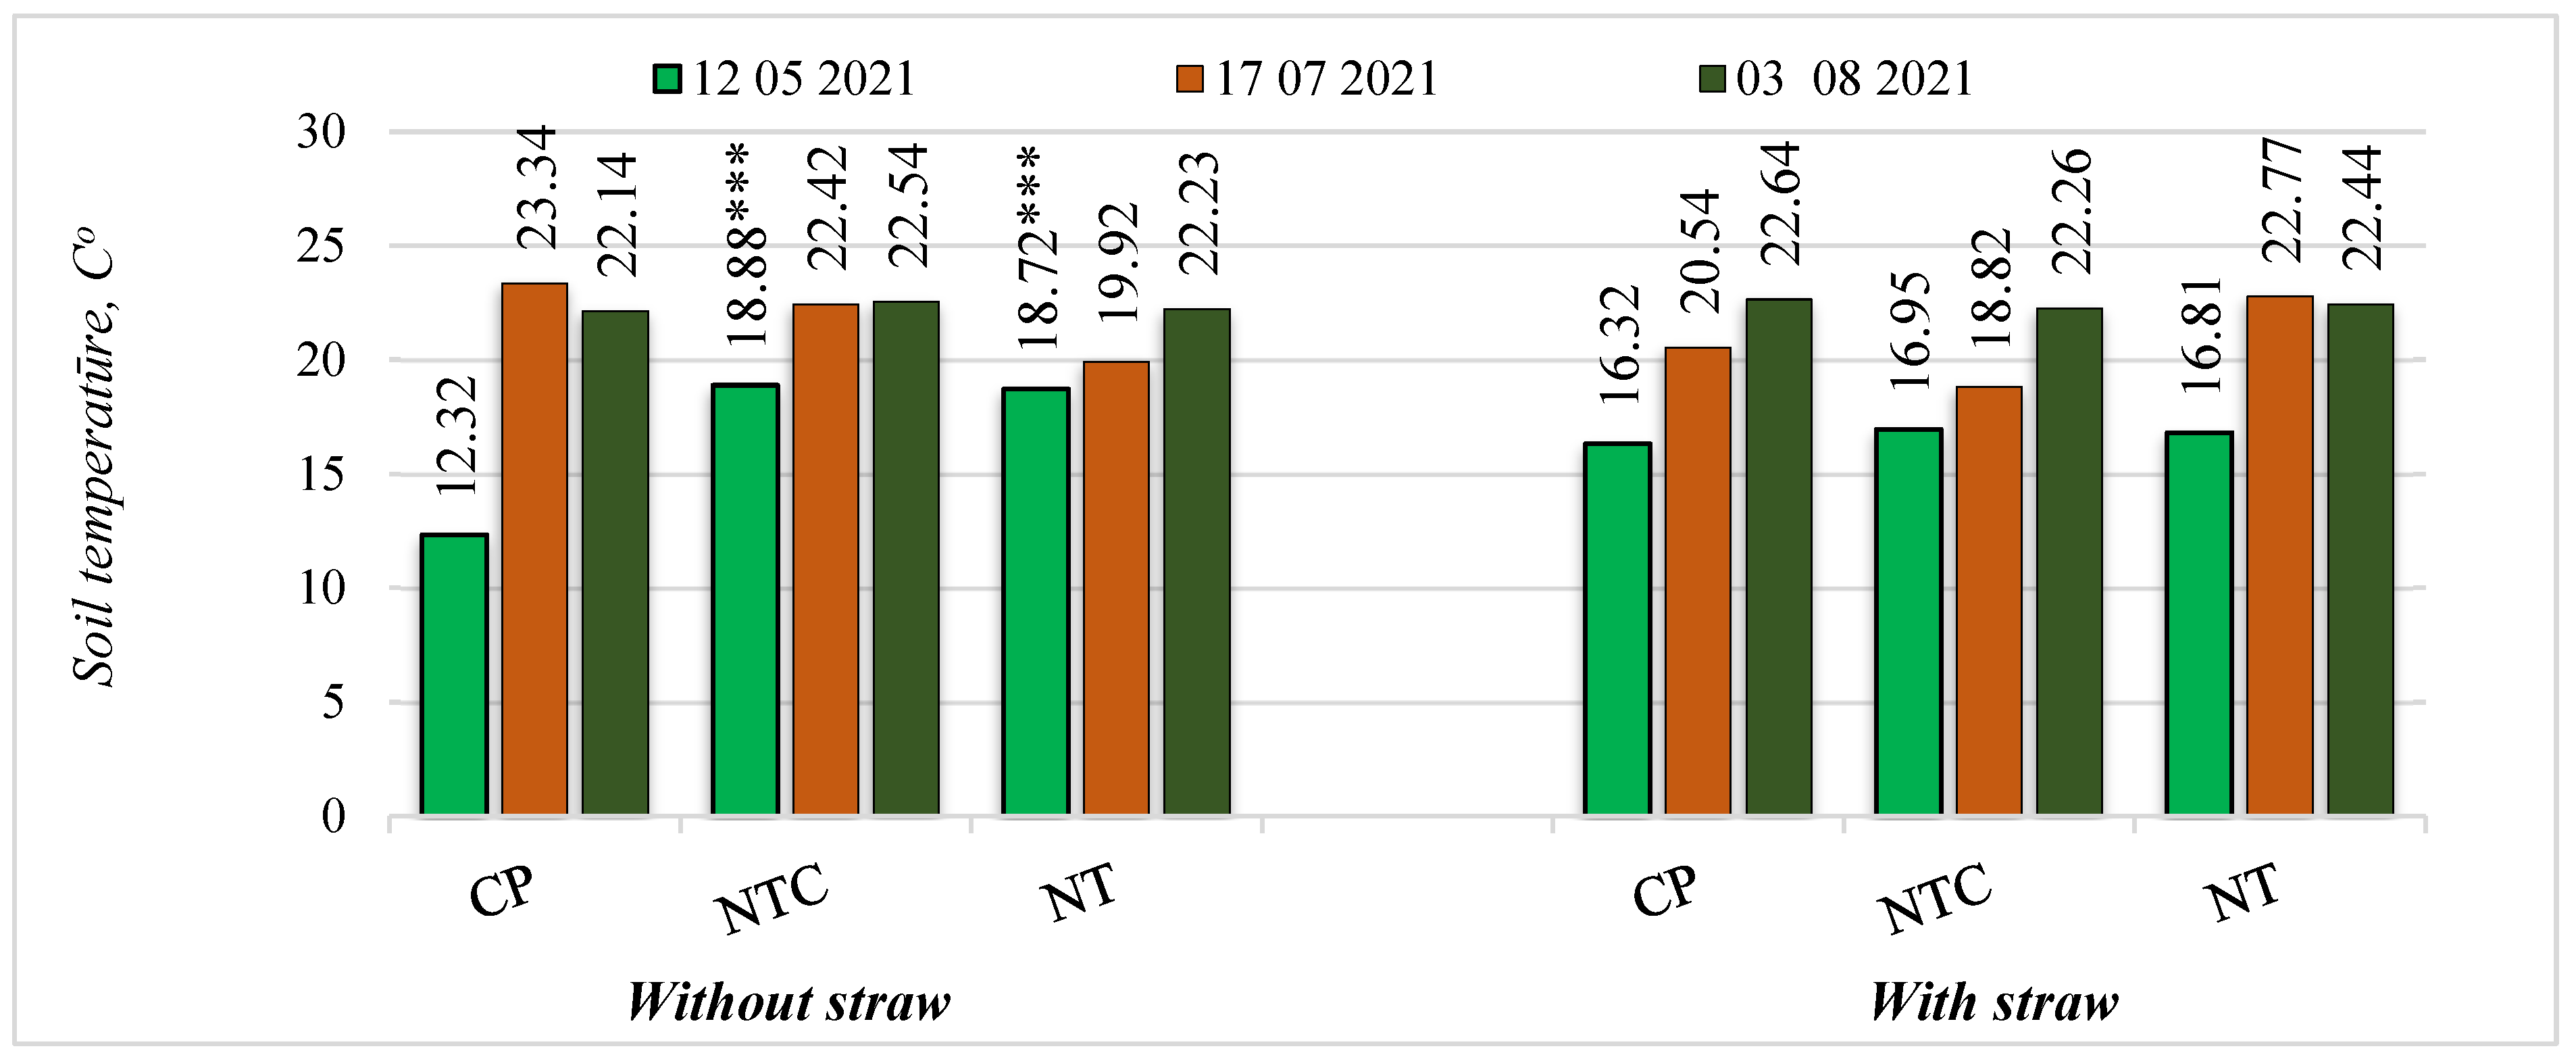
In the spring barley vegetation period of 2021 (12 May), measurements in the fields where straw was removed (S0) using no-till without cover crops (NT) and no-till with cover crops (NTC) showed significantly higher soil temperatures (51.95 to 53.25%) compared to the deep plowing (CP) fields (Figure 10).
In the spring barley crop, measurements (12 May, 17 July, 3 August) in the fields where straw was chopped and spread (S1) showed quite different trends. Measurements on 3 August in the no-till without cover crops (NT) and no-till with cover crops (NTC) fields showed lower soil temperatures (0.88 to 1.68%) compared to deep plowing (CP) (Figure 10).
Our study shows that sustainable tillage practices can have a positive impact on soil properties and reduce negative environmental impacts. However, local soil and climatic characteristics, as well as different agrotechnical conditions, need to be considered to fully assess the sustainability and effectiveness of these systems. Such an approach allows for a better understanding and implementation of agricultural practices that not only improve plant productivity but also contribute to environmental protection.
In 2019, in the fields where straw was chopped and spread (S1), a linear very strong positive and statistically significant correlation was found between soil temperature (26 June 2019) (r = 0.99, y = 15.01 + 0.039x, p < 0.05) and the sucrase activity in the 0–10 cm soil layer.
In 2020, in the fields where straw was removed (S0), a linear very strong negative and statistically significant correlation was found between soil temperature (10 August 2020) (−r = 1.0, y = 30.733 − 3.773x, p < 0.05) and the organic carbon content in the 0–10 cm soil layer and the organic carbon accumulation in the 0–10 cm soil layer (−r = 0.99, y = 30.695 − 2.760x, p < 0.05).
In 2021, a linear very strong positive, and statistically significant correlation was found between soil temperature (12 May 2021) and the sucrase activity (r = 1.0, y = 9.56 + 7.977x, p < 0.01) in the 10–25 cm soil layer as well as the urease activity in the 0–10 cm layer (r = 0.99, y = 4.735 + 0.196x, p < 0.05) in the fields where straw was removed (S0). A linear very strong negative and statistically significant correlation was found between soil temperature (12 May 2021) (r = 1.0, y = 66.228 − 151.68x, p < 0.01) and the water temperature (−4 hPa) in the 5–10 cm soil layer. The data are from the dissertation [47].
4. Conclusions
A long-term study has shown that different tillage systems, including deep and shallow plowing and direct sowing, have different effects on soil physical properties. Shallow plowing and direct sowing are characterized by higher soil moisture retention and lower CO2 emissions, indicating the sustainability of these practices and their potential to reduce greenhouse gas emissions. In this case, deeper plowing (conventional method) often resulted in higher CO2 emissions and lower moisture content compared to alternative methods. This suggests that conventional tillage methods may be inefficient in terms of sustainability due to more intensive soil aeration and higher organic matter decomposition.
The use of intercropping and leaving straw on the field after harvesting increased soil organic carbon stocks and improved soil structure. These practices were associated with lower CO2 emissions and higher moisture retention compared to fields where these materials were removed or not used. Chopping and spreading straw acted as an effective mulching practice, conserving moisture, and maintaining lower soil temperatures, which is particularly important during dry periods.
Optimization of tillage practices, including reduced intensity plowing techniques and the use of organic matter (e.g., straw and cover crops), has demonstrated its potential to significantly improve soil properties and reduce greenhouse gas emissions. This shows that enhancing the sustainability of agroecosystems is possible through changing agricultural practices. Research has shown that sustainable agricultural practices can not only improve soil properties but also increase plant productivity through better root development and nutrient availability.
Further research is needed across different agroecological zones to identify the specific effects of tillage systems under different climatic and soil conditions. This will help to develop region-specific guidelines that are adapted to local farming conditions.
Funding
This research received no external funding.
Institutional Review Board Statement
Not applicable.
Informed Consent Statement
Not applicable.
Conflicts of Interest
The authors declare no conflict of interest.
References
- Juchnevičienė, A.; Raudonius, S.; Avižienytė, D.; Romaneckas, K.; Bogužas, V. Ilgalaikio supaprastinto žemės dirbimo ir tiesioginės sėjos įtaka žieminių kviečių pasėliui. Žemės Ūkio Mokslai 2012, 19, 139–150. [Google Scholar] [CrossRef]
- Meng, S.; Zhao, G.; Yang, Y. Impact of plant root morphology on rooted-soil shear resistance using triaxial testing. Adv. Civil Eng. 2020, 2020, 1–13. [Google Scholar] [CrossRef]
- De Vita, P.; Di Paolo, E.; Fecondo, G.; Di Fonzo, N.; Pisante, M. No-tillage and conventional tillage effects on durum wheat yield, grain quality and soil moisture content in southern Italy. Soil Tillage Res. 2007, 92, 69–78. [Google Scholar] [CrossRef]
- Rudinskienė, A., Marcinkevičienė, A., Velička, R., & Steponavičienė, V. (2024). The effects of incorporating caraway into a multi-cropping farming system on the crops and the overall agroecosystem. Agronomy, 14(3), 625.
- Briones, M. J. I., & Schmidt, O. (2017). Conventional tillage decreases the abundance and biomass of earthworms and alters their community structure in a global meta-analysis. Global change biology, 23(10), 4396-4419.
- Skuodienė, R. The influence of primary soil tillage, deep loosening and organic fertilizers on weed incidence in crop. Žemdirbystė 2016, 103, 135–142. [Google Scholar] [CrossRef]
- Romaneckas, K.; Sarauskis, E.; Masilionyte, L.; Sakalauskas, A.; Pilipavicius, V. Įvairių žemės dirbimo būdų įtaka dumbluoto priemolio Luvisol vandens kiekiui cukrinių runkelių (Beta vulgaris L.) pasėliuose. Žemės Ūkio Mokslai 2013, 18.
- Kateriji, N.; Mastrorilli, M.; Lahmer, F.; Maalouf, F.; Oweis, T. Faba bean productivity in saline–drought conditions. Eur. J. Agron. 2011, 35, 2–12. [Google Scholar] [CrossRef]
- Steponavičienė, V., Butkevičienė, L. M., Bogužas, V., Kerdokas, T. (2021). The influence of biological preparations and their mixtures on soil agrochemical properties in winter wheat. In Rural Development: Proceedings of the International Scientific Conference (pp. 38-42).
- Kristó, I., Jakab, P., Irmes, K., Rácz, A., Vályi-Nagy, M., & Tar, M. (2021). The effect of soil tillage process on soil physical parameters, yiled of oil seed rape and profitability of production. Research Journal of Agricultural Science, 53(1).
- Valujeva, K., Pilecka-Ulcugaceva, J., Skiste, O., Liepa, S., Lagzdins, A., & Grinfelde, I. (2022). Soil tillage and agricultural crops affect greenhouse gas emissions from Cambic Calcisol in a temperate climate. Acta Agriculturae Scandinavica, Section B—Soil & Plant Science, 72(1), 835-846.
- Darguza, M., & Gaile, Z. (2023). The Productivity of Crop Rotation Depending on the Included Plants and Soil Tillage. Agriculture, 13(9), 1751.
- Blanco-Canqui, H., & Wortmann, C. S. (2020). Does occasional tillage undo the ecosystem services gained with no-till? A review. Soil and Tillage Research, 198, 104534.
- Zhang, Y.; Li, J. The effects of rotating conservation tillage with conventional tillage on soil properties and grain yields in winter wheat-spring maize rotations. Agric. For. Meteorol. 2018, 263, 107–117. [Google Scholar] [CrossRef]
- Lehnert, M. Factors affecting soil temperature as limits of spatial interpretation and simulation of soil temperature. Acta Univ. Palacki. Olomuc. Geogr. 2014, 45, 5–21. [Google Scholar]
- Amare, G.; Desta, B. Coloured plastic mulches: Impact on soil properties and crop productivity. Chem. Biol. Technol. Agric. 2021, 8. [Google Scholar] [CrossRef]
- Haei, M.; Öquist, M.G.; Kreyling, J.; Ilstedt, U.; Laudon, H. Winter climate controls soil carbon dynamics during summer in boreal forests. Environ. Res. Lett. 2013, 8, 024017. [Google Scholar] [CrossRef]
- Euskirchen, E.; Mcguire, A.D.; Kicklighter, D.W.; Zhuang, Q.; Clein, J.S.; Dargaville, R.J.; Dye, D.G.; Kimball, J.S.; McDonald, K.C.; Melillo, J.M.; et al. Importance of recent shifts in soil thermal dynamics on growing season length, productivity, and carbon sequestration in terrestrial high latitude ecosystems. Glob. Chang. Biol. 2006, 12, 731–750. [Google Scholar] [CrossRef]
- Öquist, M.G.; Laudon, H. Winter soil frost conditions in boreal forests control growing season soil CO2 concentration and its atmospheric exchange. Glob. Chang. Biol. 2008, 14, 2839–2847. [Google Scholar] [CrossRef]
- Davidson, E.A.; Janssens, I.A. Temperature sensitivity of soil carbon decomposition and feedbacks to climate change. Nature 2006, 440, 165–173. [Google Scholar] [CrossRef] [PubMed]
- Bhattacharya, A. Effect of low-temperature stress on germination, growth, and phenology of plants: A review. In Physiological Processes in Plants under Low Temperature Stress; Springer: Singapore, 2022; pp. 1–106. [Google Scholar]
- Tian, Y., Schindlbacher, A., Malo, C. U., Shi, C., Heinzle, J., Kengdo, S. K.,… & Wanek, W. (2023). Long-term warming of a forest soil reduces microbial biomass and its carbon and nitrogen use efficiencies. Soil Biology and Biochemistry, 184, 109109.
- Report EUR 25186 EN; The State of Soil in Europe: A Contribution of the JRC to the European Environment Agency’s Environment State and Outlook Report—SOER 2010. European Commission: Luxembourg, 2012; p. 76.
- Panday, D., Bhusal, N., Das, S., & Ghalehgolabbehbahani, A. (2024). Rooted in nature: The rise, challenges, and potential of organic farming and fertilizers in agroecosystems. Sustainability, 16(4), 1530.
- Lal, R. Challenges and opportunities in soil organic matter research. Eur. J. Soil Sci. 2009, 60, 158–169. [Google Scholar] [CrossRef]
- Smith, C.R.; Baco, A.R. Ecology of whale falls at the deep-sea floor. In Oceanography and Marine Biology; CRC Press: Boca Raton, FL, USA, 2003; pp. 319–333. [Google Scholar]
- Liu, Y., Zhou, X., Du, C., Liu, Y., Xu, X., Ejaz, I.,… & Sun, Z. (2023). Trade-off between soil carbon emission and sequestration for winter wheat under reduced irrigation: The role of soil amendments. Agriculture, Ecosystems & Environment, 352, 108535.
- Lal, R. Carbon sequestration. Philos. Trans. R. Soc. B Biol. Sci. 2008, 363, 815–830. [Google Scholar] [CrossRef]
- Kuzyakov, Y.; Blagodatskaya, E. Microbial hotspots and hot moments in soil: Concept & review. Soil Biol. Biochem. 2015, 83, 184–199. [Google Scholar]
- Sokol, N.W.; Slessarev, E.; Marschmann, G.L.; Nicolas, A.; Blazewicz, S.J.; Brodie, E.L.; Firestone, M.K.; Foley, M.M.; Hestrin, R.; Hungate, B.A.; et al. Life and death in the soil microbiome: How ecological processes influence biogeochemistry. Nat. Rev. Microbiol. 2022, 20, 415–430. [Google Scholar] [CrossRef] [PubMed]
- Reicosky, D.C.; Lindstrom, M.J.; Schumacher, T.E.; Lobb, D.E.; Malo, D.D. Tillage-induced CO2 loss across an eroded landscape. Soil Tillage Res. 2005, 81, 183–194. [Google Scholar] [CrossRef]
- Al-Kaisi, M.M.; Yin, X. Tillage and crop residue effects on soil carbon and carbon dioxide emission in corn-soybean rotations. J. Environ. Qual. 2005, 34, 437–445. [Google Scholar] [CrossRef]
- Chatskikh, D.; Olesen, J.; Hansen, E.M.; Elsgaard, L.; Peterse, B.M. Effects of reduced tillage on net greenhouse gas fluxes from loamy sand soil under winter crops in Denmark. Agric. Ecosyst. Environ. 2008, 128, 117–126. [Google Scholar] [CrossRef]
- Elder, J.W.; Lal, R. Tillage effects on gaseous emissions from an intensively farmed organic soil in North Central Ohio. Soil Tillage Res. 2008, 98, 45–55. [Google Scholar] [CrossRef]
- Jurevics, A. (2024). Slash and stump harvest–effects on site C and N, and productivity of the subsequent forest stand. Acta Universitatis Agriculturae Sueciae, (2024: 64).
- Dhadli, H. S., Brar, B. S., & Black, T. A. (2015). Influence of crop growth and weather variables on soil CO2 emissions in a maize-wheat cropping system. Agric. Res. J, 52(3), 28-34.
- Ruan, Y., Kuzyakov, Y., Liu, X., Zhang, X., Xu, Q., Guo, J., … & Ling, N. (2023). Elevated temperature and CO2 strongly affect the growth strategies of soil bacteria. Nature Communications, 14(1), 391.
- Steponavičienė, V., Butkevičienė, L. M., Bogužas, V., Kerdokas, T. (2021). The influence of biological preparations and their mixtures on soil agrochemical properties in winter wheat. In Rural Development: Proceedings of the International Scientific Conference (pp. 38-42).
- ur Rehman, S., Ijaz, S. S., Raza, M. A., Din, A. M. U., Khan, K. S., Fatima, S., … & Ansar, M. (2023). Soil organic carbon sequestration and modeling under conservation tillage and cropping systems in a rainfed agriculture. European Journal of Agronomy, 147, 126840.
- Valujeva, K., Pilecka-Ulcugaceva, J., Skiste, O., Liepa, S., Lagzdins, A., & Grinfelde, I. (2022). Soil tillage and agricultural crops affect greenhouse gas emissions from Cambic Calcisol in a temperate climate. Acta Agriculturae Scandinavica, Section B—Soil & Plant Science, 72(1), 835-846.
- Panagos, P., De Rosa, D., Liakos, L., Labouyrie, M., Borrelli, P., & Ballabio, C. (2024). Soil bulk density assessment in Europe. Agriculture, Ecosystems & Environment, 364, 108907.
- Buivydaitė, V.; Vaičys, M.; Juodis, J.; Motuzas, A.J. Lietuvos Dirvožemių Klasifikacija; Lietuvos Žemės Ūkio Universitetas: Kaunas, Lithuania, 2001; p. 34. [Google Scholar]
- Steponavičienė, V.; Žiūraitis, G.; Rudinskienė, A.; Jackevičienė, K.; Bogužas, V. Long-Term Effects of Different Tillage Systems and Their Impact on Soil Properties and Crop Yields. Agronomy 2024, 14, 870. [Google Scholar] [CrossRef]
- Jans, W.W.; Jacobs, C.M.; Kruijt, B.; Elbers, J.A.; Barendse, S.; Moors, E.J. Carbon Exchange of a maize (Zea mays L.) Crop: Influence of Phenology. Agric. Ecosyst. Environ. 2010, 139, 316–324. [Google Scholar]
- Hopkins, F.; Gonzalez-Meler, M.A.; Flower, C.E.; Lynch, D.J.; Czimczik, C.; Tang, J.; Subke, J.A. Ecosystem-Level Controls on Root-Rhizosphere Respiration. New Phytol. 2013, 199, 339–351. [Google Scholar] [CrossRef] [PubMed]
- Wang, Q.; Zhang, W.; Sun, T.; Chen, L.; Pang, X.; Wang, Y.; Xiao, F. N and P Fertilization Reduced Soil Autotrophic and Heterotrophic Respiration in a Young Cunninghamia Lanceolata Forest. Agric. For. Meteorol. 2017, 232, 66–73. [Google Scholar] [CrossRef]
- Davidson, E.A.; Janssens, I.A. Temperature sensitivity of soil carbon decomposition and feedbacks to climate change. Nature 2006, 440, 165–173. [Google Scholar] [CrossRef]
- Feiza, V., Feizienė, D., Sinkevičienė, A., Bogužas, V., Putramentaitė, A., Lazauskas, S.,… & Steponavičienė, V. (2015). Soil water capacity, pore-size distribution and CO2 e-flux in different soils after long-term no-till management. Zemdirb. Agric, 102(1), 3-14.
- Sinkevičius, A. (2023). Žemės dirbimo technologijų ilgalaikis poveikis agroekosistemų tvarumui (Doctoral dissertation).
- Zhu, L.; Liao, Q.; Wang, Z.; Chen, J.; Chen, Z.; Bian, Q.; Zhang, Q. Prediction of soil shear Strength parameters using combined data and different machine learning models. Appl. Sci. 2022, 12, 5100. [Google Scholar] [CrossRef]
- Steponavičienė, V.; Bogužas, V.; Sinkevičienė, A.; Skinulienė, L.; Sinkevičius, A.; Klimas, E. Soil physical state as influenced by long-term reduced tillage, no-tillage and straw management. Žemdirbystė 2020, 107, 195–202. [Google Scholar] [CrossRef]
- Page, K. L., Dang, Y. P., & Dalal, R. C. (2020). The ability of conservation agriculture to conserve soil organic carbon and the subsequent impact on soil physical, chemical, and biological properties and yield. Frontiers in sustainable food systems, 4, 31.
- Klik, A.; Rosner, J. Long-term experience with conservation tillage practices in Austria: Impacts on soil erosion processes. Soil Tillage Res. 2020, 203, 104669. [Google Scholar] [CrossRef]
- Kairytė, M.; Stevens, R.L.; Trimonis, E. Provenance of silt and clay within sandy deposits of the Lithuanian coastal zone (Baltic Sea). Mar. Geol. 2005, 218, 97–112. [Google Scholar] [CrossRef]
- Rudinskienė, A., Marcinkevičienė, A., Velička, R., & Steponavičienė, V. (2024). The effects of incorporating caraway into a multi-cropping farming system on the crops and the overall agroecosystem. Agronomy, 14(3), 625.
- Faqir, Y., Qayoom, A., Erasmus, E., Schutte-Smith, M., & Visser, H. G. (2024). A review on the application of advanced soil and plant sensors in the agriculture sector. Computers and Electronics in Agriculture, 226, 109385.
- Daly, E. J., Kim, K., Hernandez-Ramirez, G., & Klimchuk, K. (2023). The response of soil physical quality parameters to a perennial grain crop. Agriculture, Ecosystems & Environment, 343, 108265.
- Priori, S., Pellegrini, S., Vignozzi, N., & Costantini, E. A. (2020). Soil physical-hydrological degradation in the root-zone of tree crops: problems and solutions. Agronomy, 11(1), 68.
- Trabelsi, M., Mandart, E., Le Grusse, P., & Bord, J. P. (2016). How to measure the agroecological performance of farming in order to assist with the transition process. Environmental Science and Pollution Research, 23, 139-156.
- Mottet, A., Bicksler, A., Lucantoni, D., De Rosa, F., Scherf, B., Scopel, E.,… & Tittonell, P. (2020). Assessing transitions to sustainable agricultural and food systems: a tool for agroecology performance evaluation (TAPE). Frontiers in Sustainable Food Systems, 4, 579154.
Figure 1.
CO2 emission from the soil in spring rape crop 2019. Note: Factor A: S0—Without a straw, S1—With a straw. Factor B: CP—Conventional plowing, NTC—No-till with cover crops, NT—No-till without cover crops. No significant differences at p > 0.05.
Figure 1.
CO2 emission from the soil in spring rape crop 2019. Note: Factor A: S0—Without a straw, S1—With a straw. Factor B: CP—Conventional plowing, NTC—No-till with cover crops, NT—No-till without cover crops. No significant differences at p > 0.05.
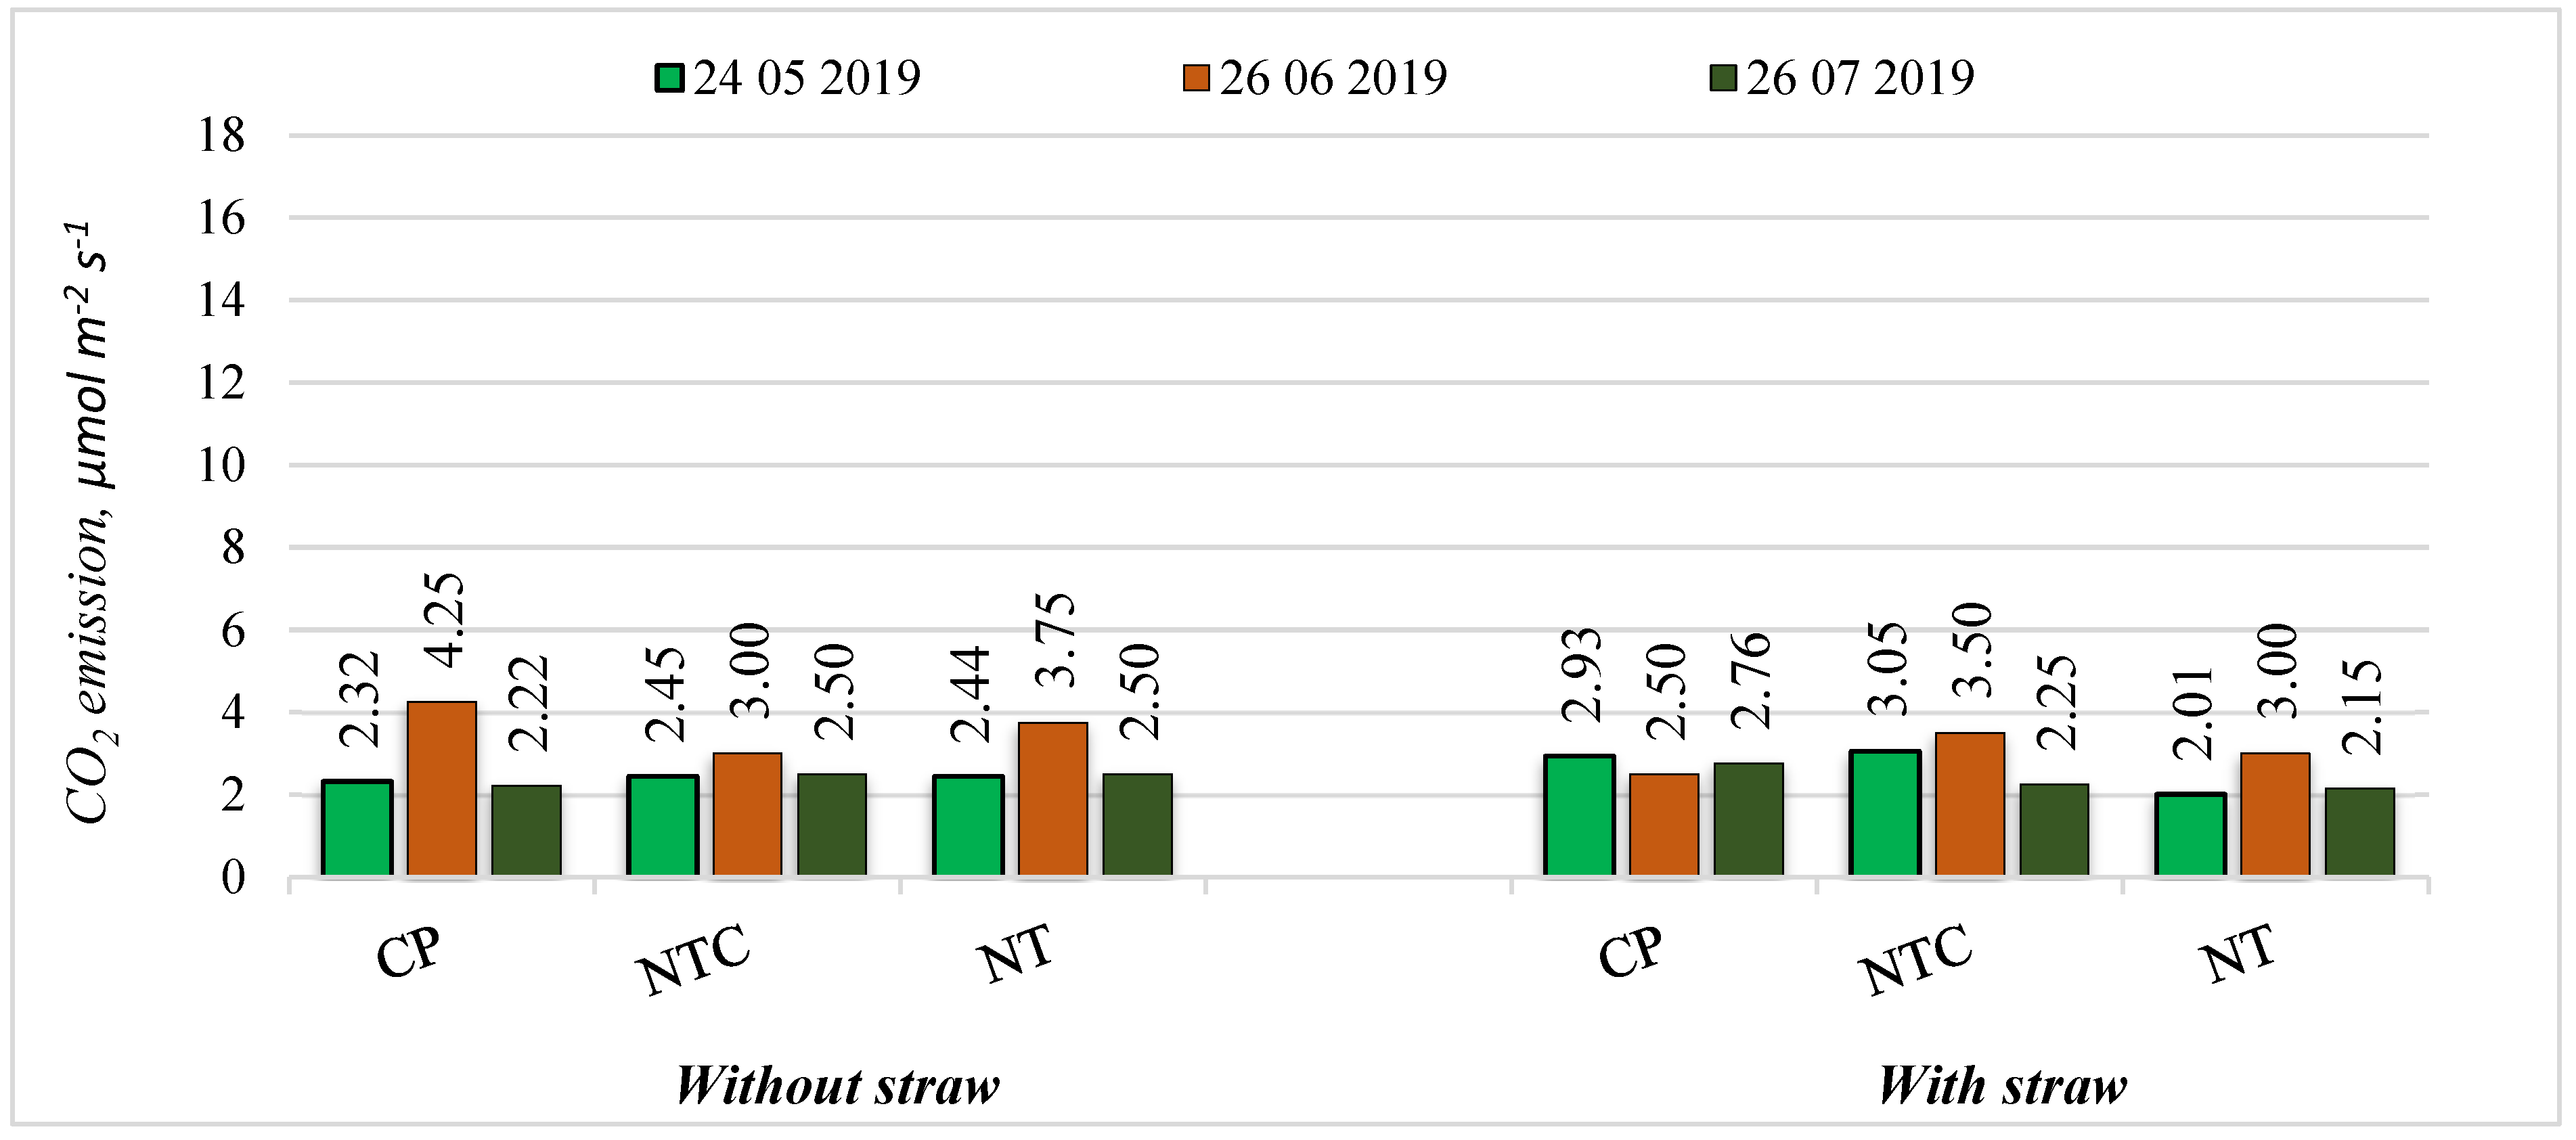
Figure 2.
CO2 emission from the soil in winter wheat crop in 2020. Note: Factor A: S0—Without a straw, S1—With a straw. Factor B: CP—Conventional plowing, NTC—No-till with cover crops, NT—No-till without cover crops. No significant differences at p > 0.05; Fisher LSD test vs. control.
Figure 2.
CO2 emission from the soil in winter wheat crop in 2020. Note: Factor A: S0—Without a straw, S1—With a straw. Factor B: CP—Conventional plowing, NTC—No-till with cover crops, NT—No-till without cover crops. No significant differences at p > 0.05; Fisher LSD test vs. control.
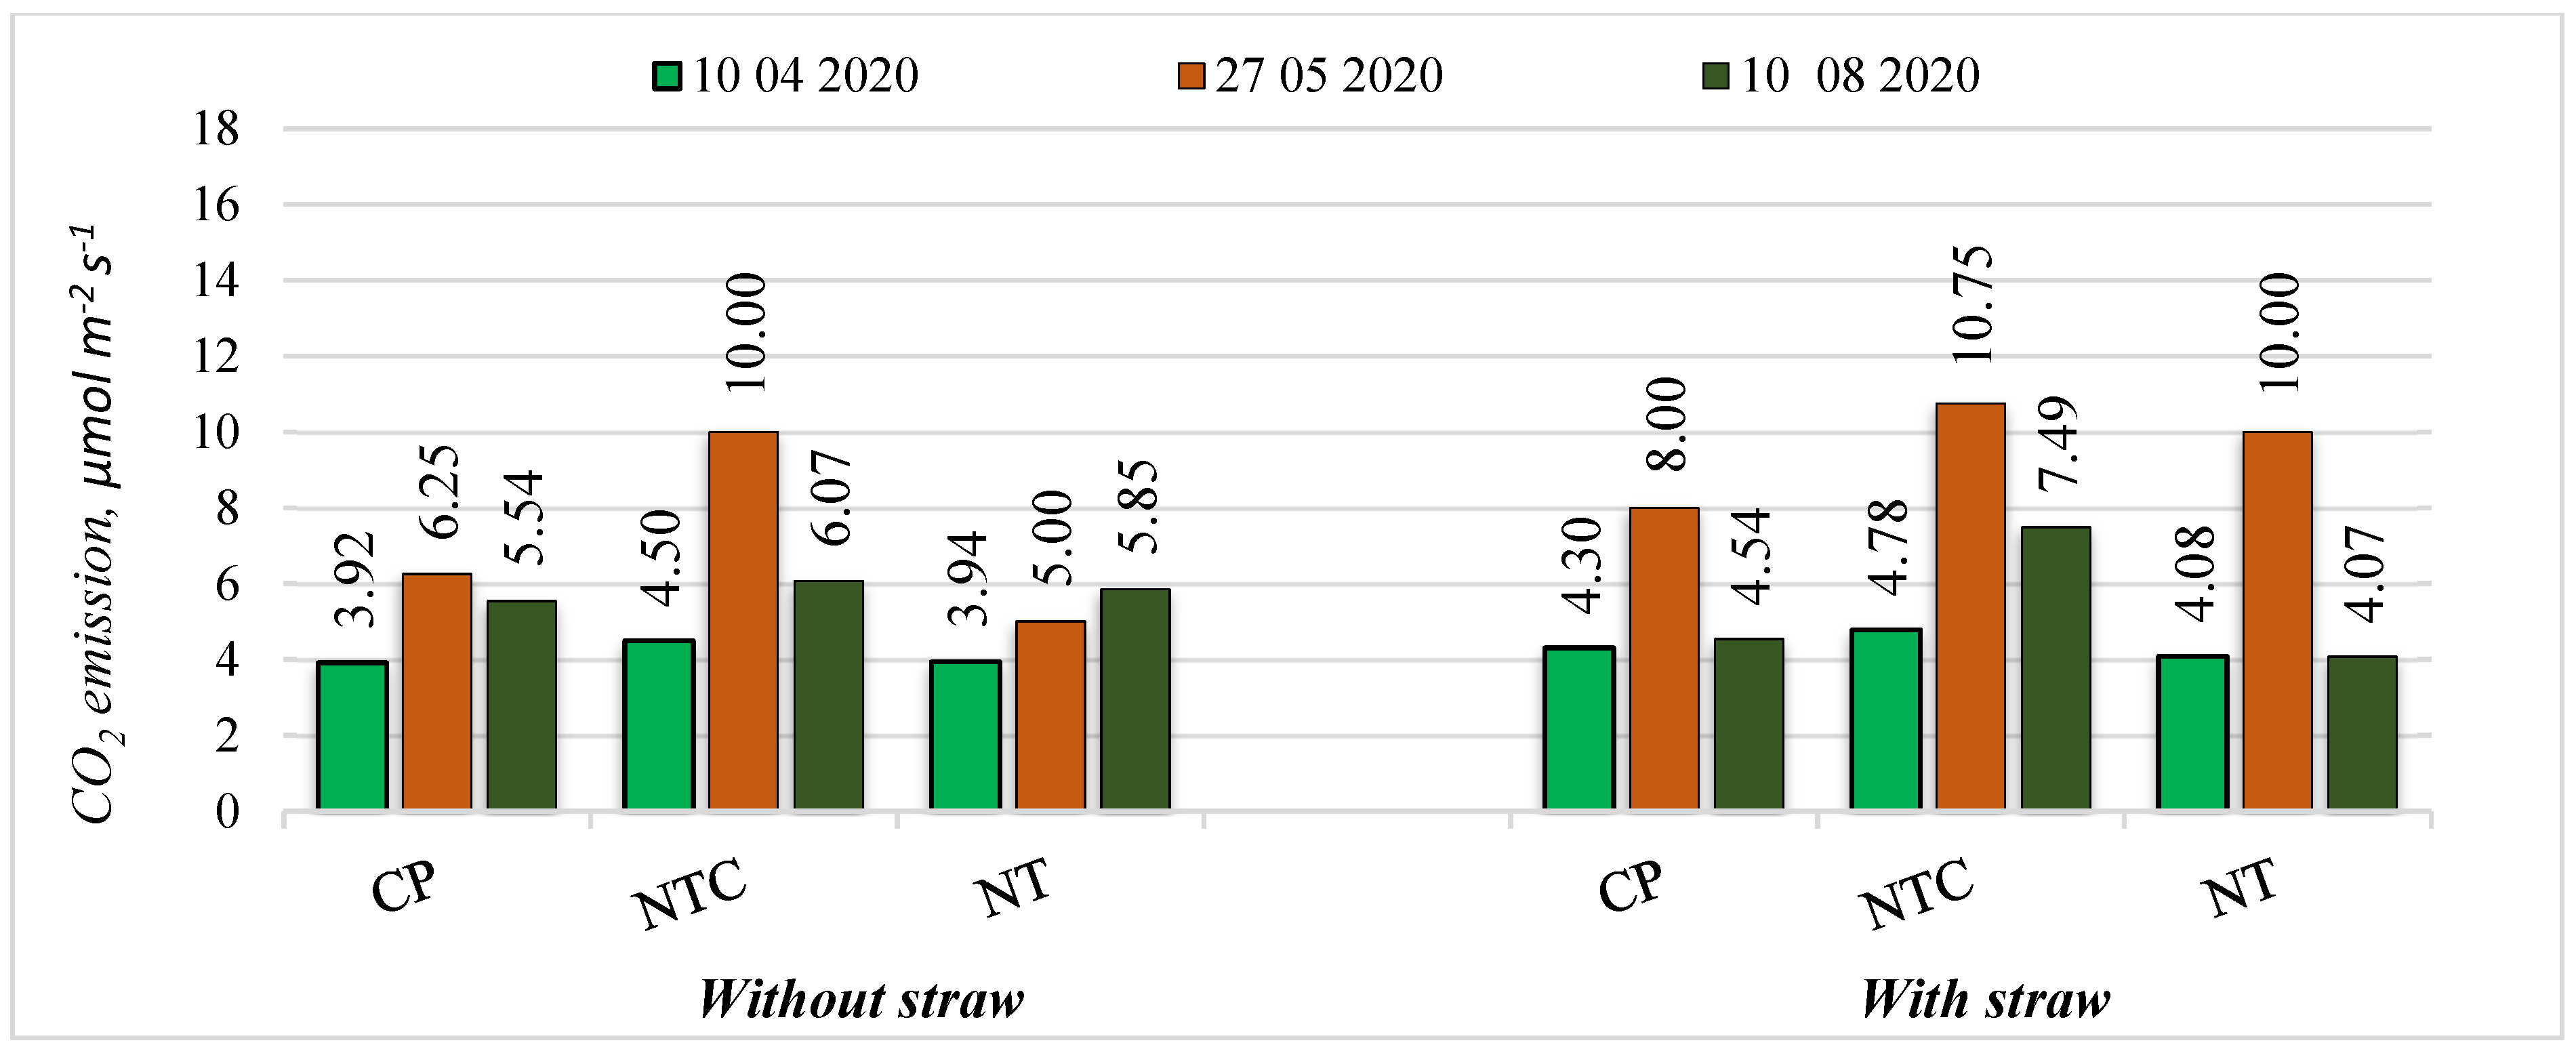
Figure 3.
CO2 emission from the soil in spring barley crop in 2021. Note: Factor A: S0—Without a straw, S1—With a straw. Factor B: CP—Conventional plowing, NTC—No-till with cover crops, NT—No-till without cover crops. Differences significant at *—p ≤ 0.05 > 0.01, ***—p ≤ 0.001.
Figure 3.
CO2 emission from the soil in spring barley crop in 2021. Note: Factor A: S0—Without a straw, S1—With a straw. Factor B: CP—Conventional plowing, NTC—No-till with cover crops, NT—No-till without cover crops. Differences significant at *—p ≤ 0.05 > 0.01, ***—p ≤ 0.001.
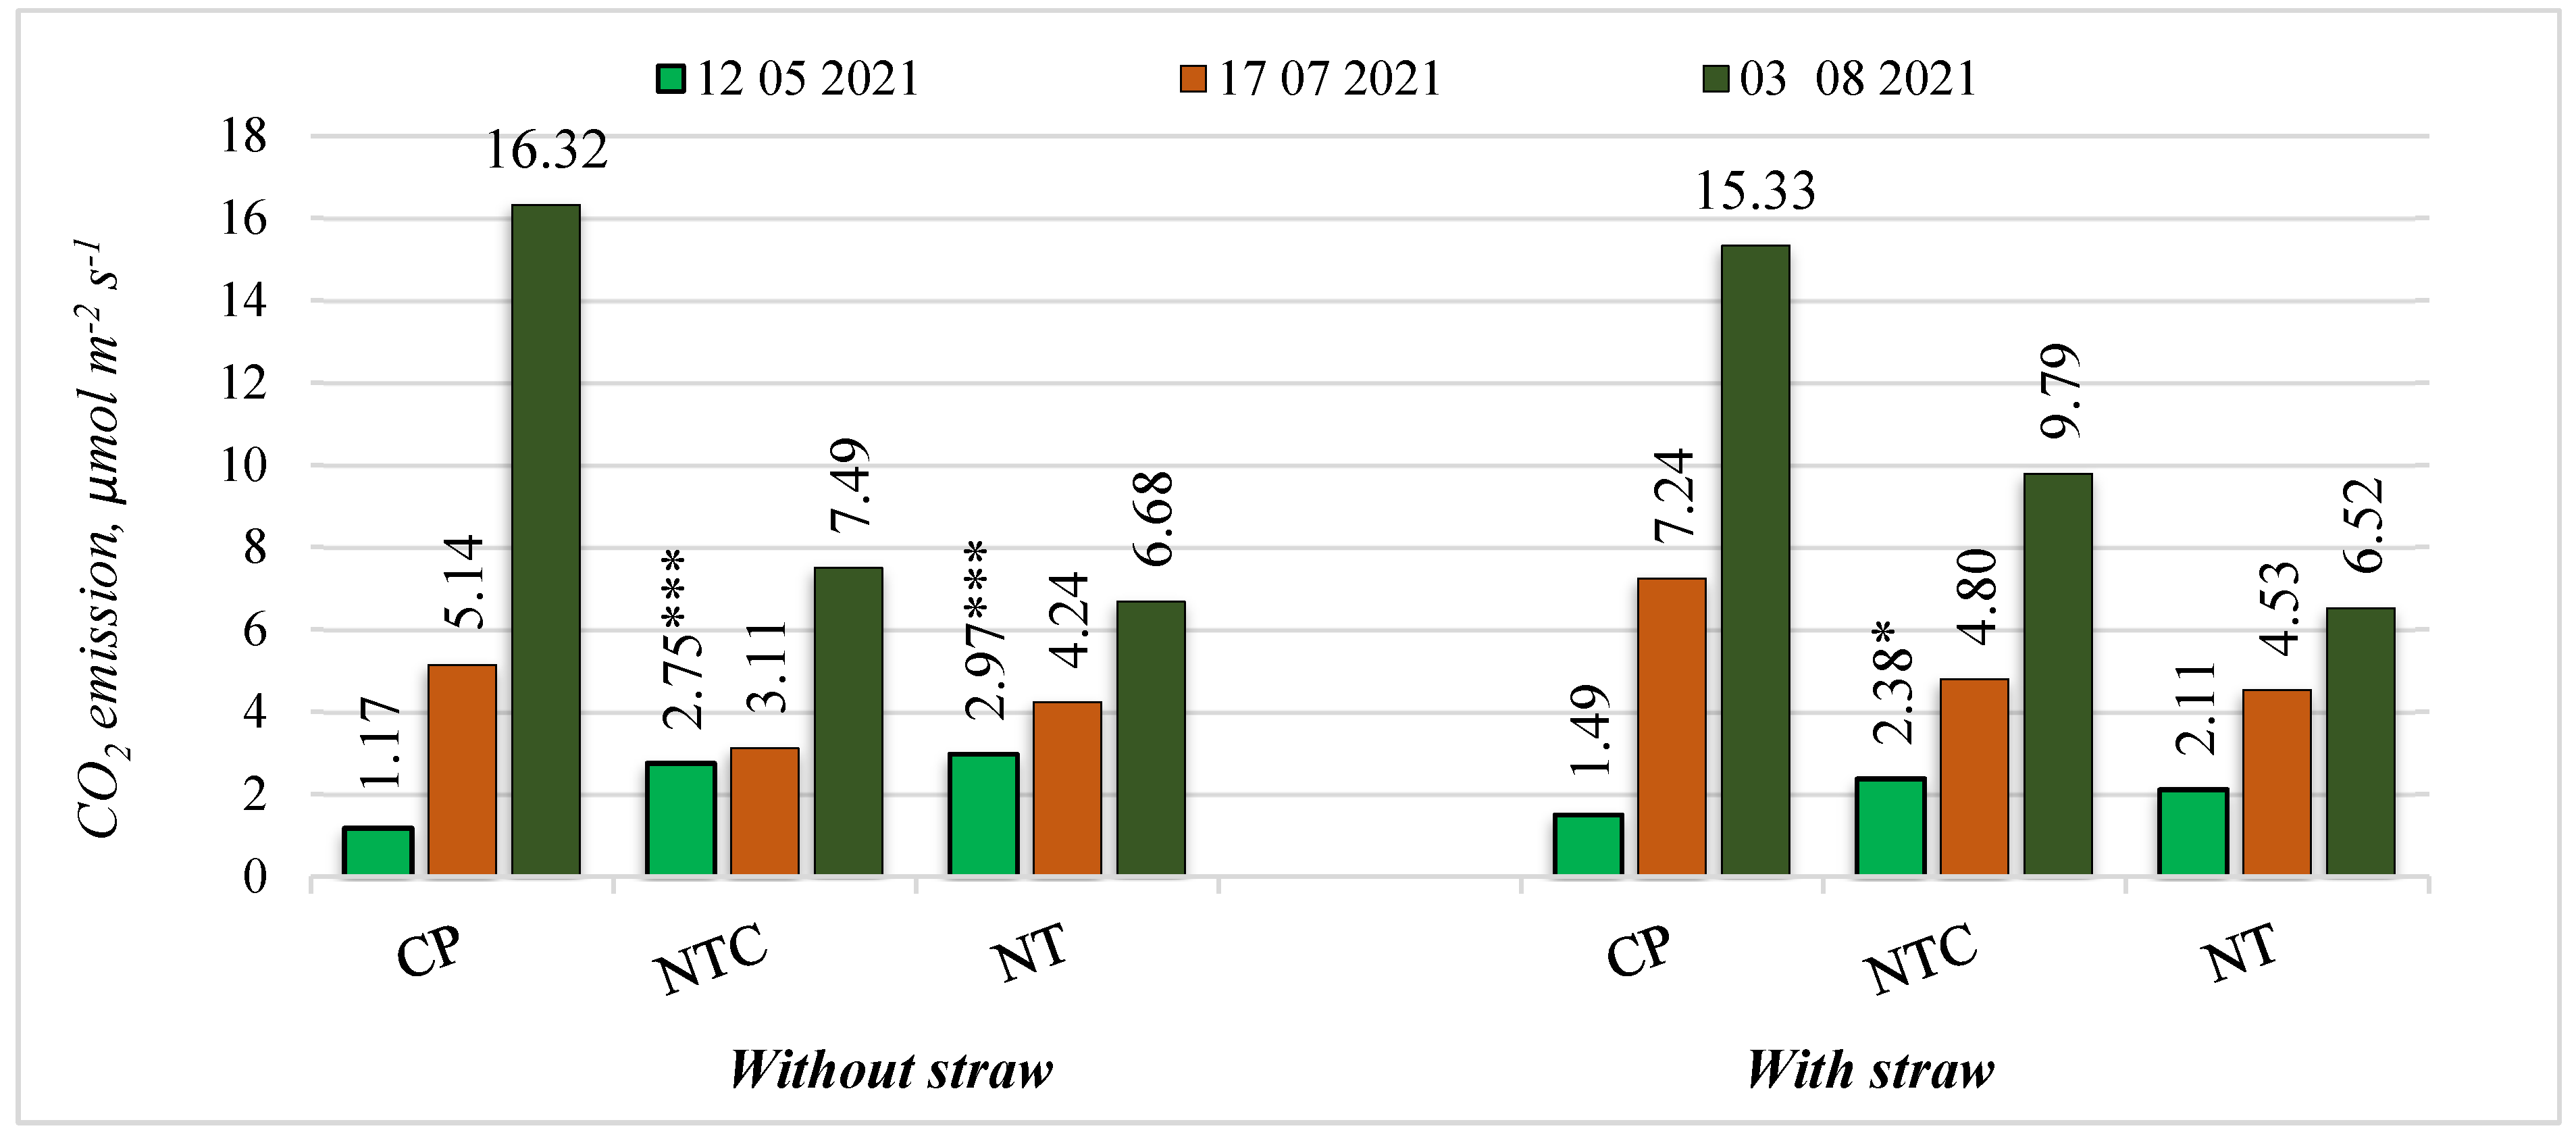
Figure 4.
Soil shear resistance in different soil layers in 2020–2021 (2014–2015). Note: Factor A: S0—Without a straw, S1—With a straw. Factor B: CP—Conventional plowing, SP—Shallow plowing, SC—Shallow cultivation, SOW—Stubble over winter, NTC—No-till with cover crops, NT—No-till without cover crops. Differences significant at *—p ≤ 0.05 > 0.01, **—p ≤ 0.01 > 0.001 and ***—p ≤ 0.001.
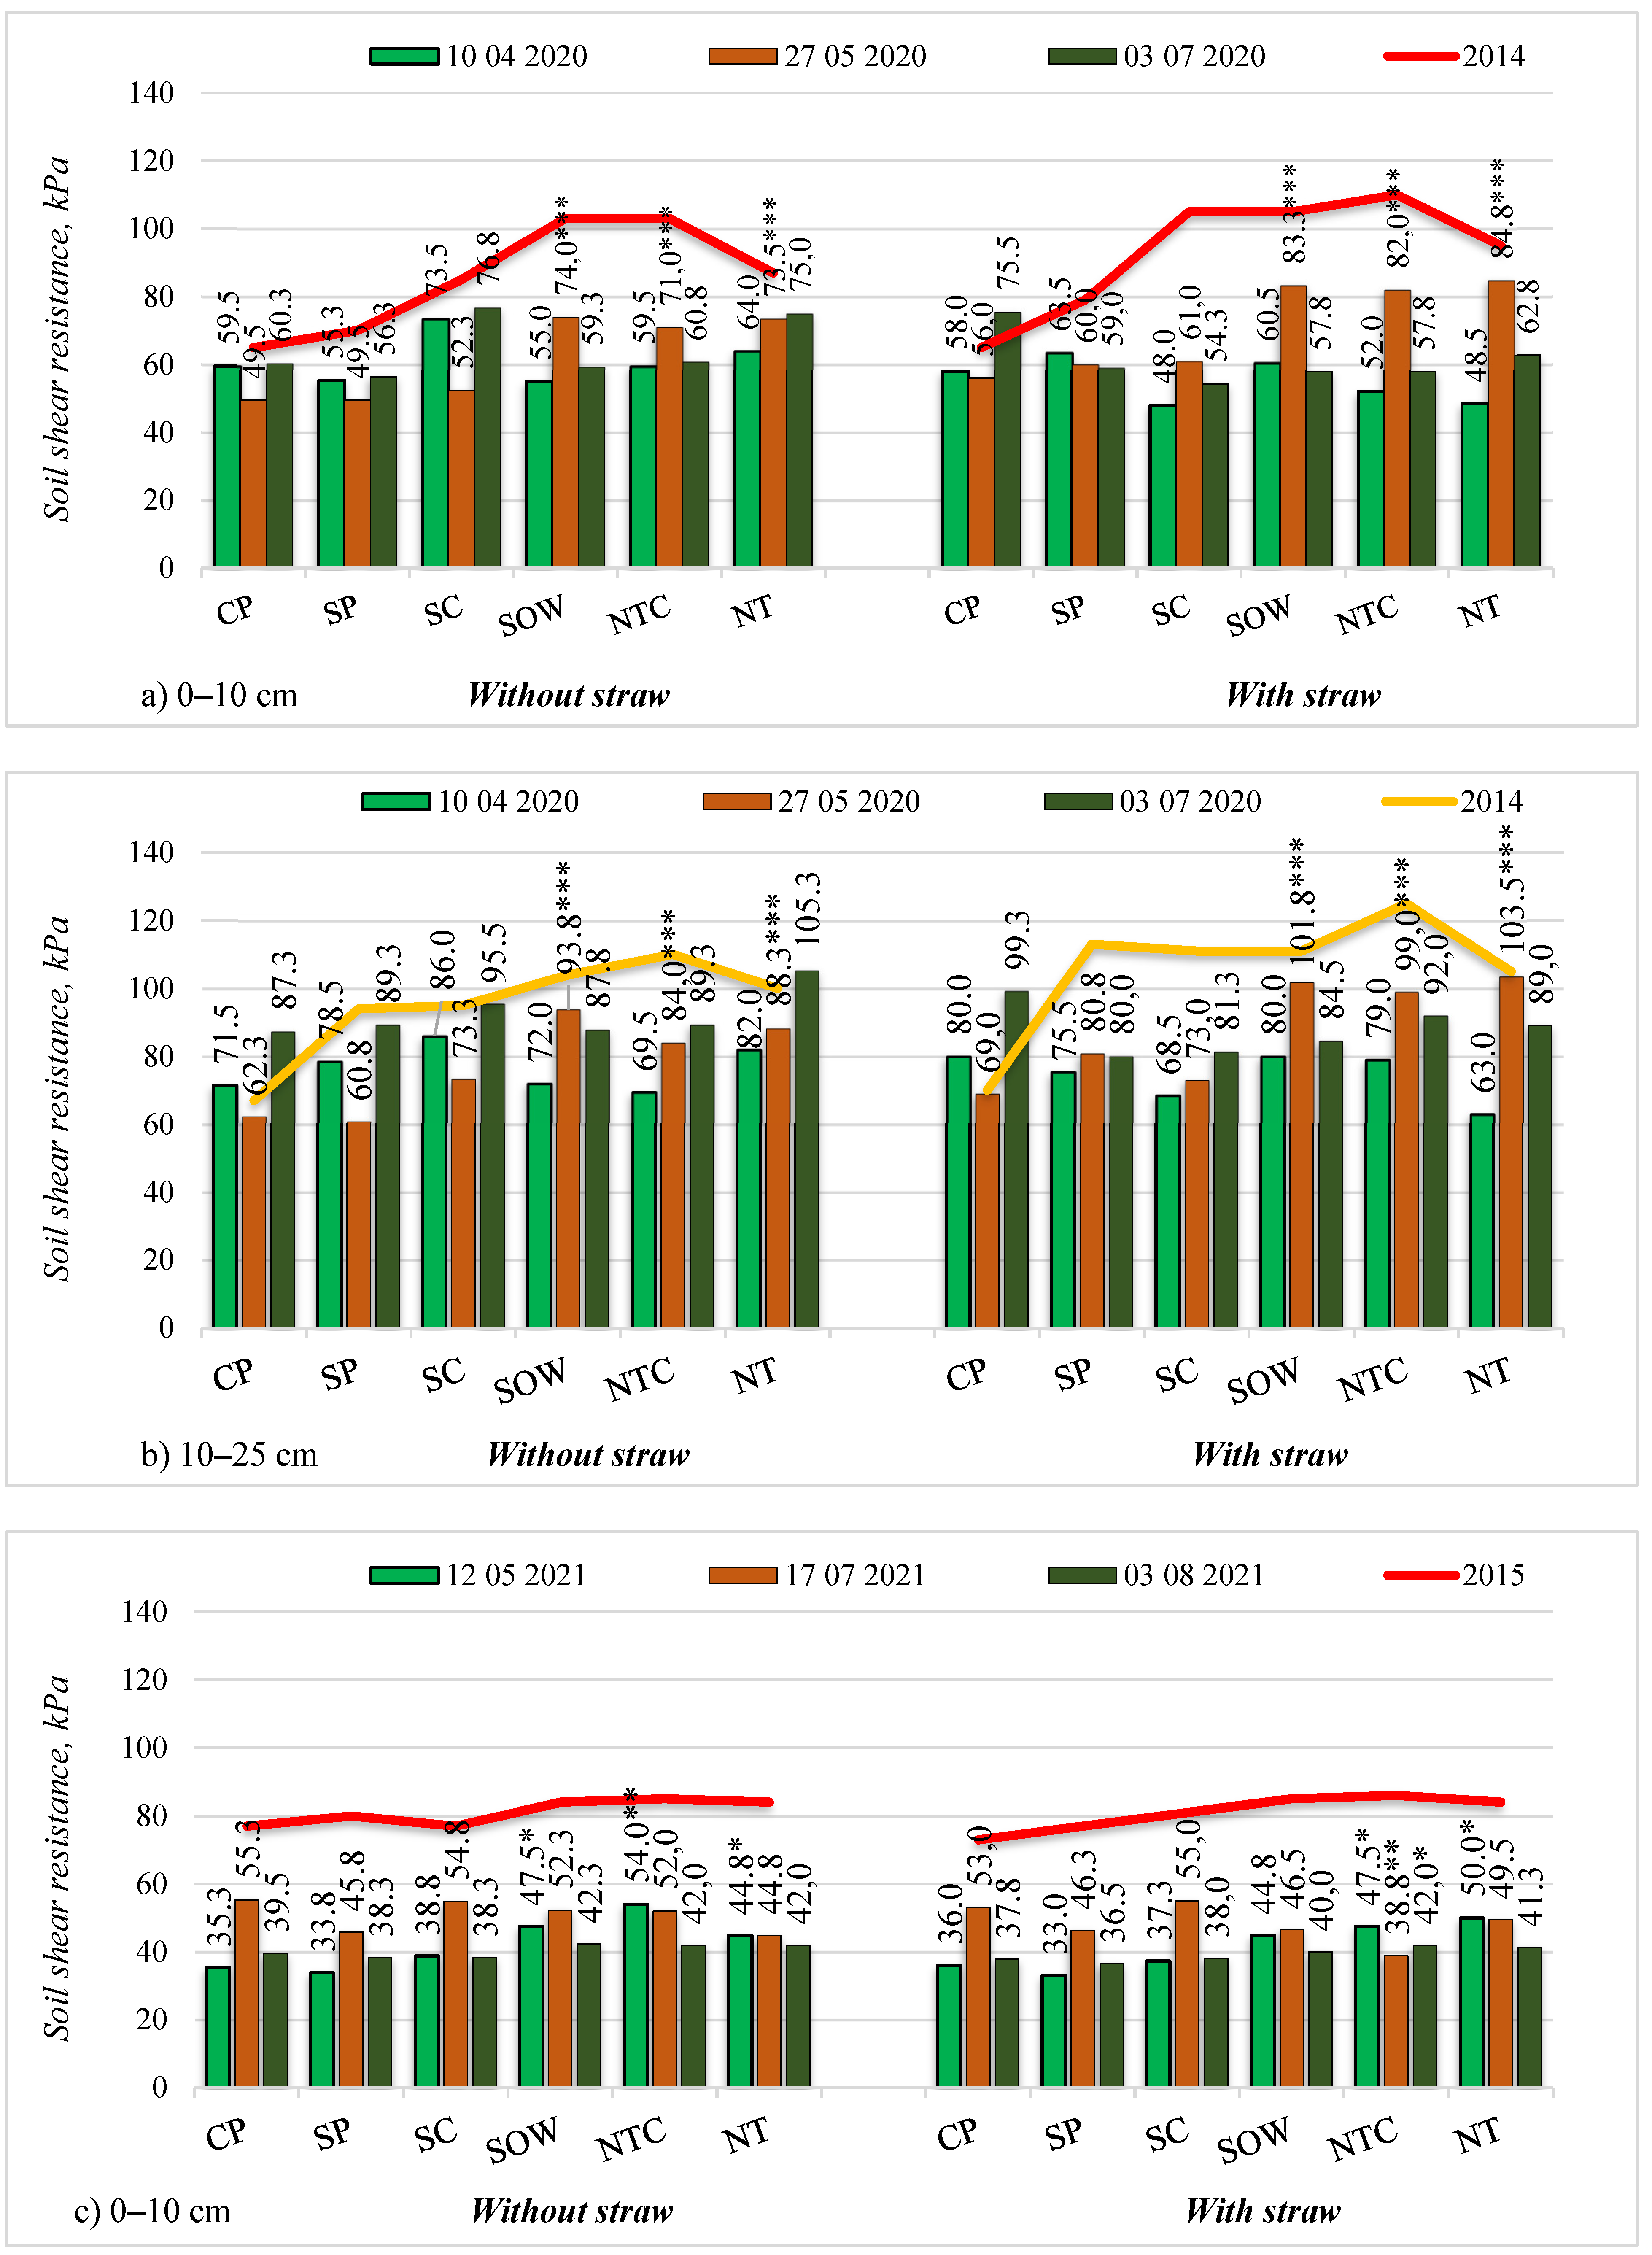
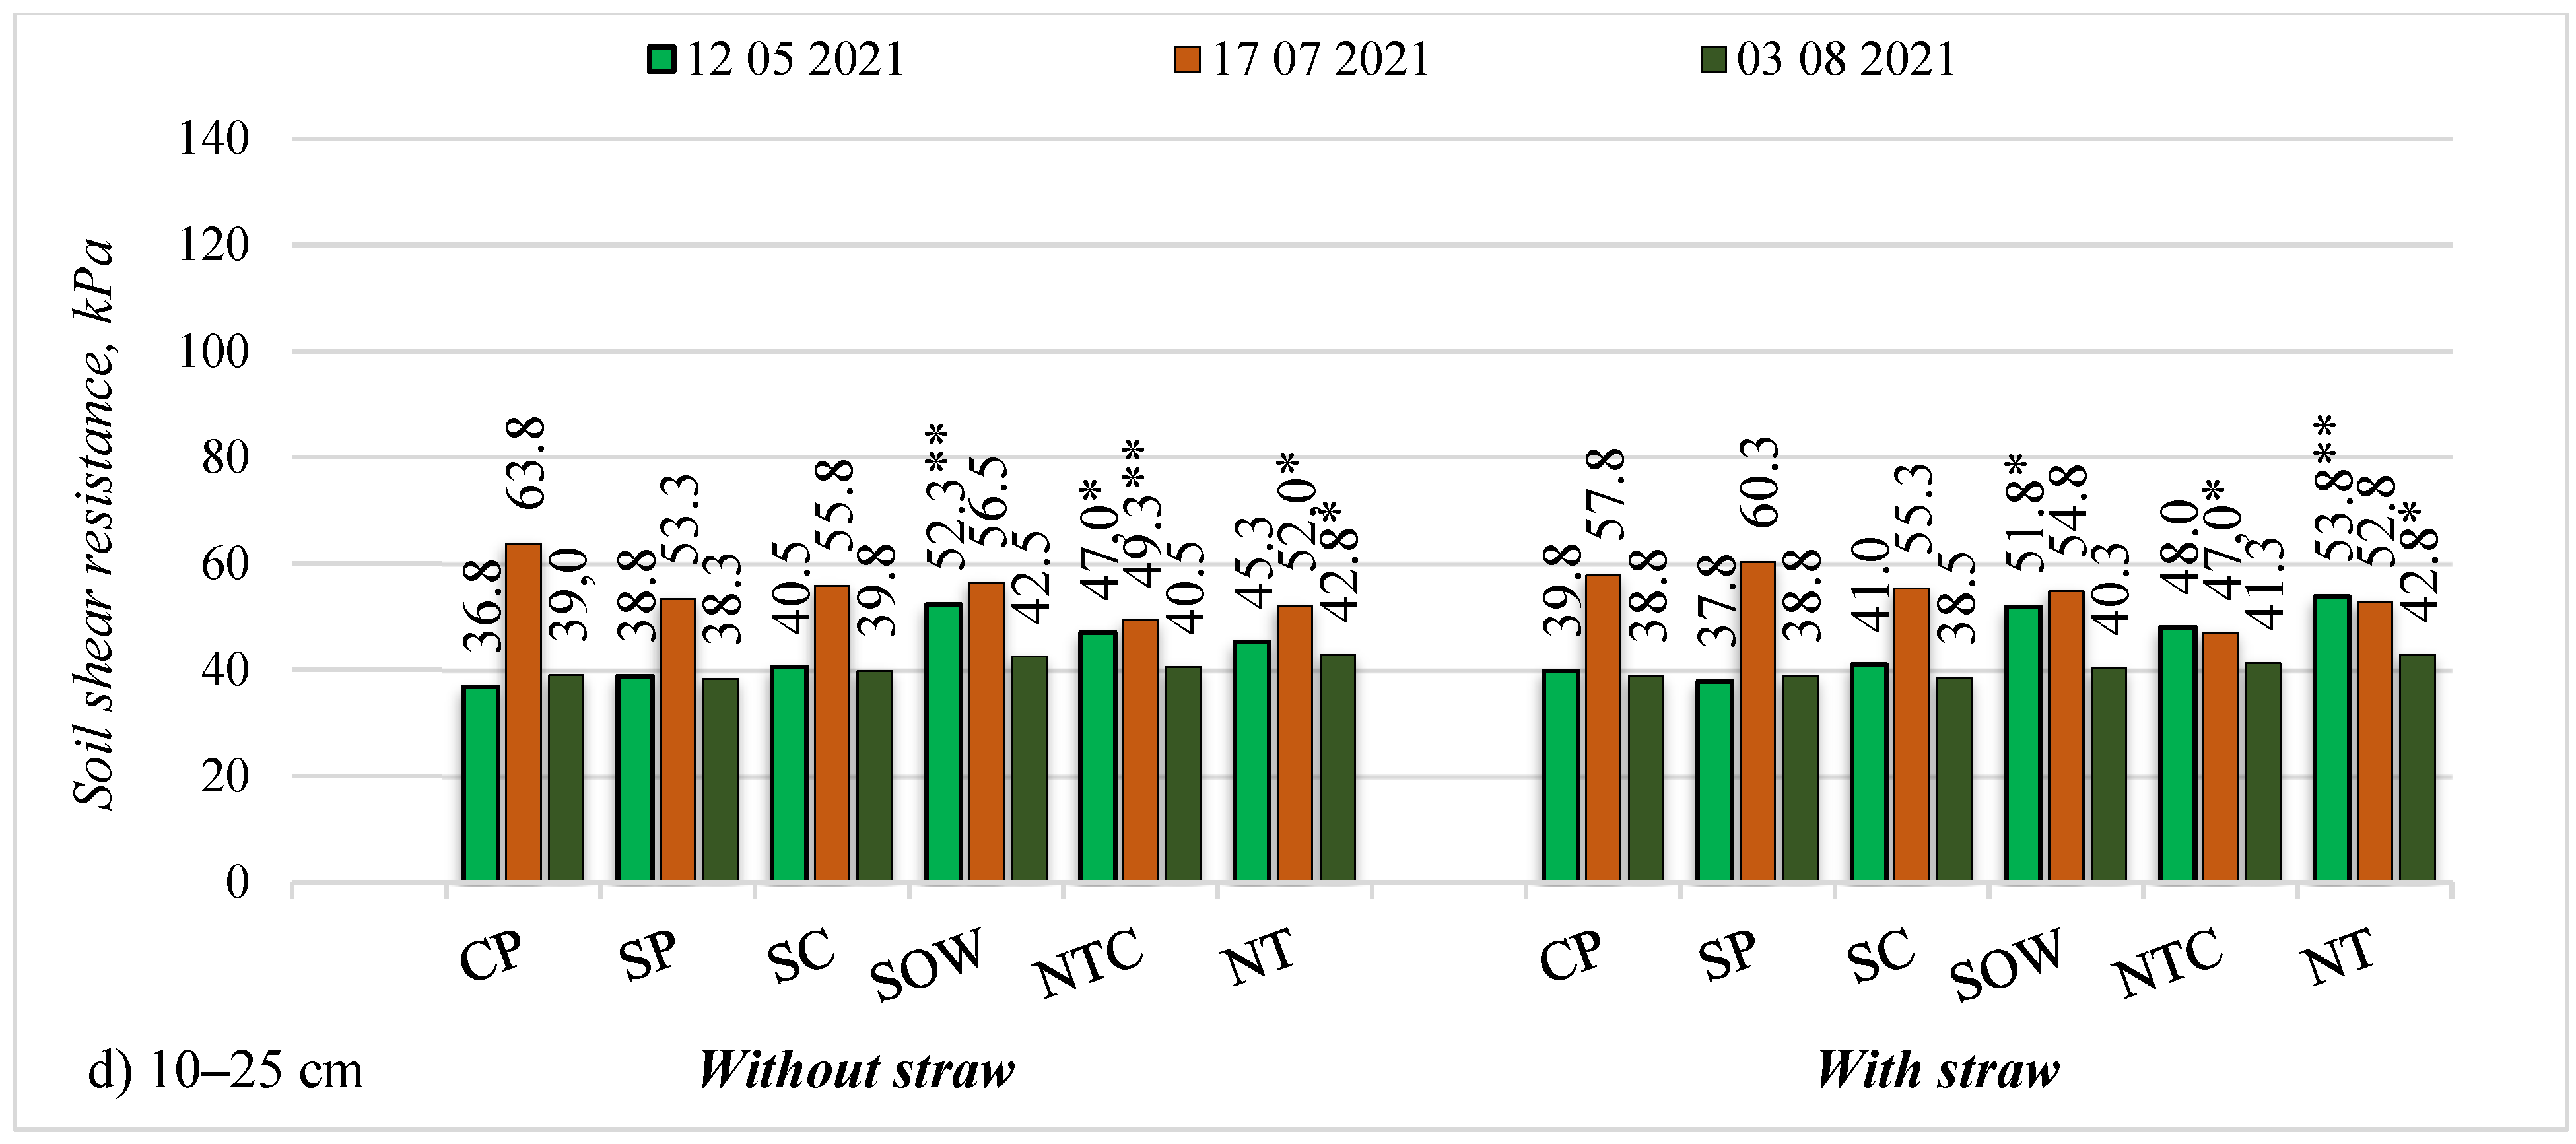
Figure 5.
Soil moisture during the plant vegetation period in 2019. Note: Factor A: S0—Without a straw, S1—With a straw. Factor B: CP—Conventional plowing, NTC—No-till with cover crops, NT—No-till without cover crops. Differences significant at **—p ≤ 0.01 > 0.001.
Figure 5.
Soil moisture during the plant vegetation period in 2019. Note: Factor A: S0—Without a straw, S1—With a straw. Factor B: CP—Conventional plowing, NTC—No-till with cover crops, NT—No-till without cover crops. Differences significant at **—p ≤ 0.01 > 0.001.
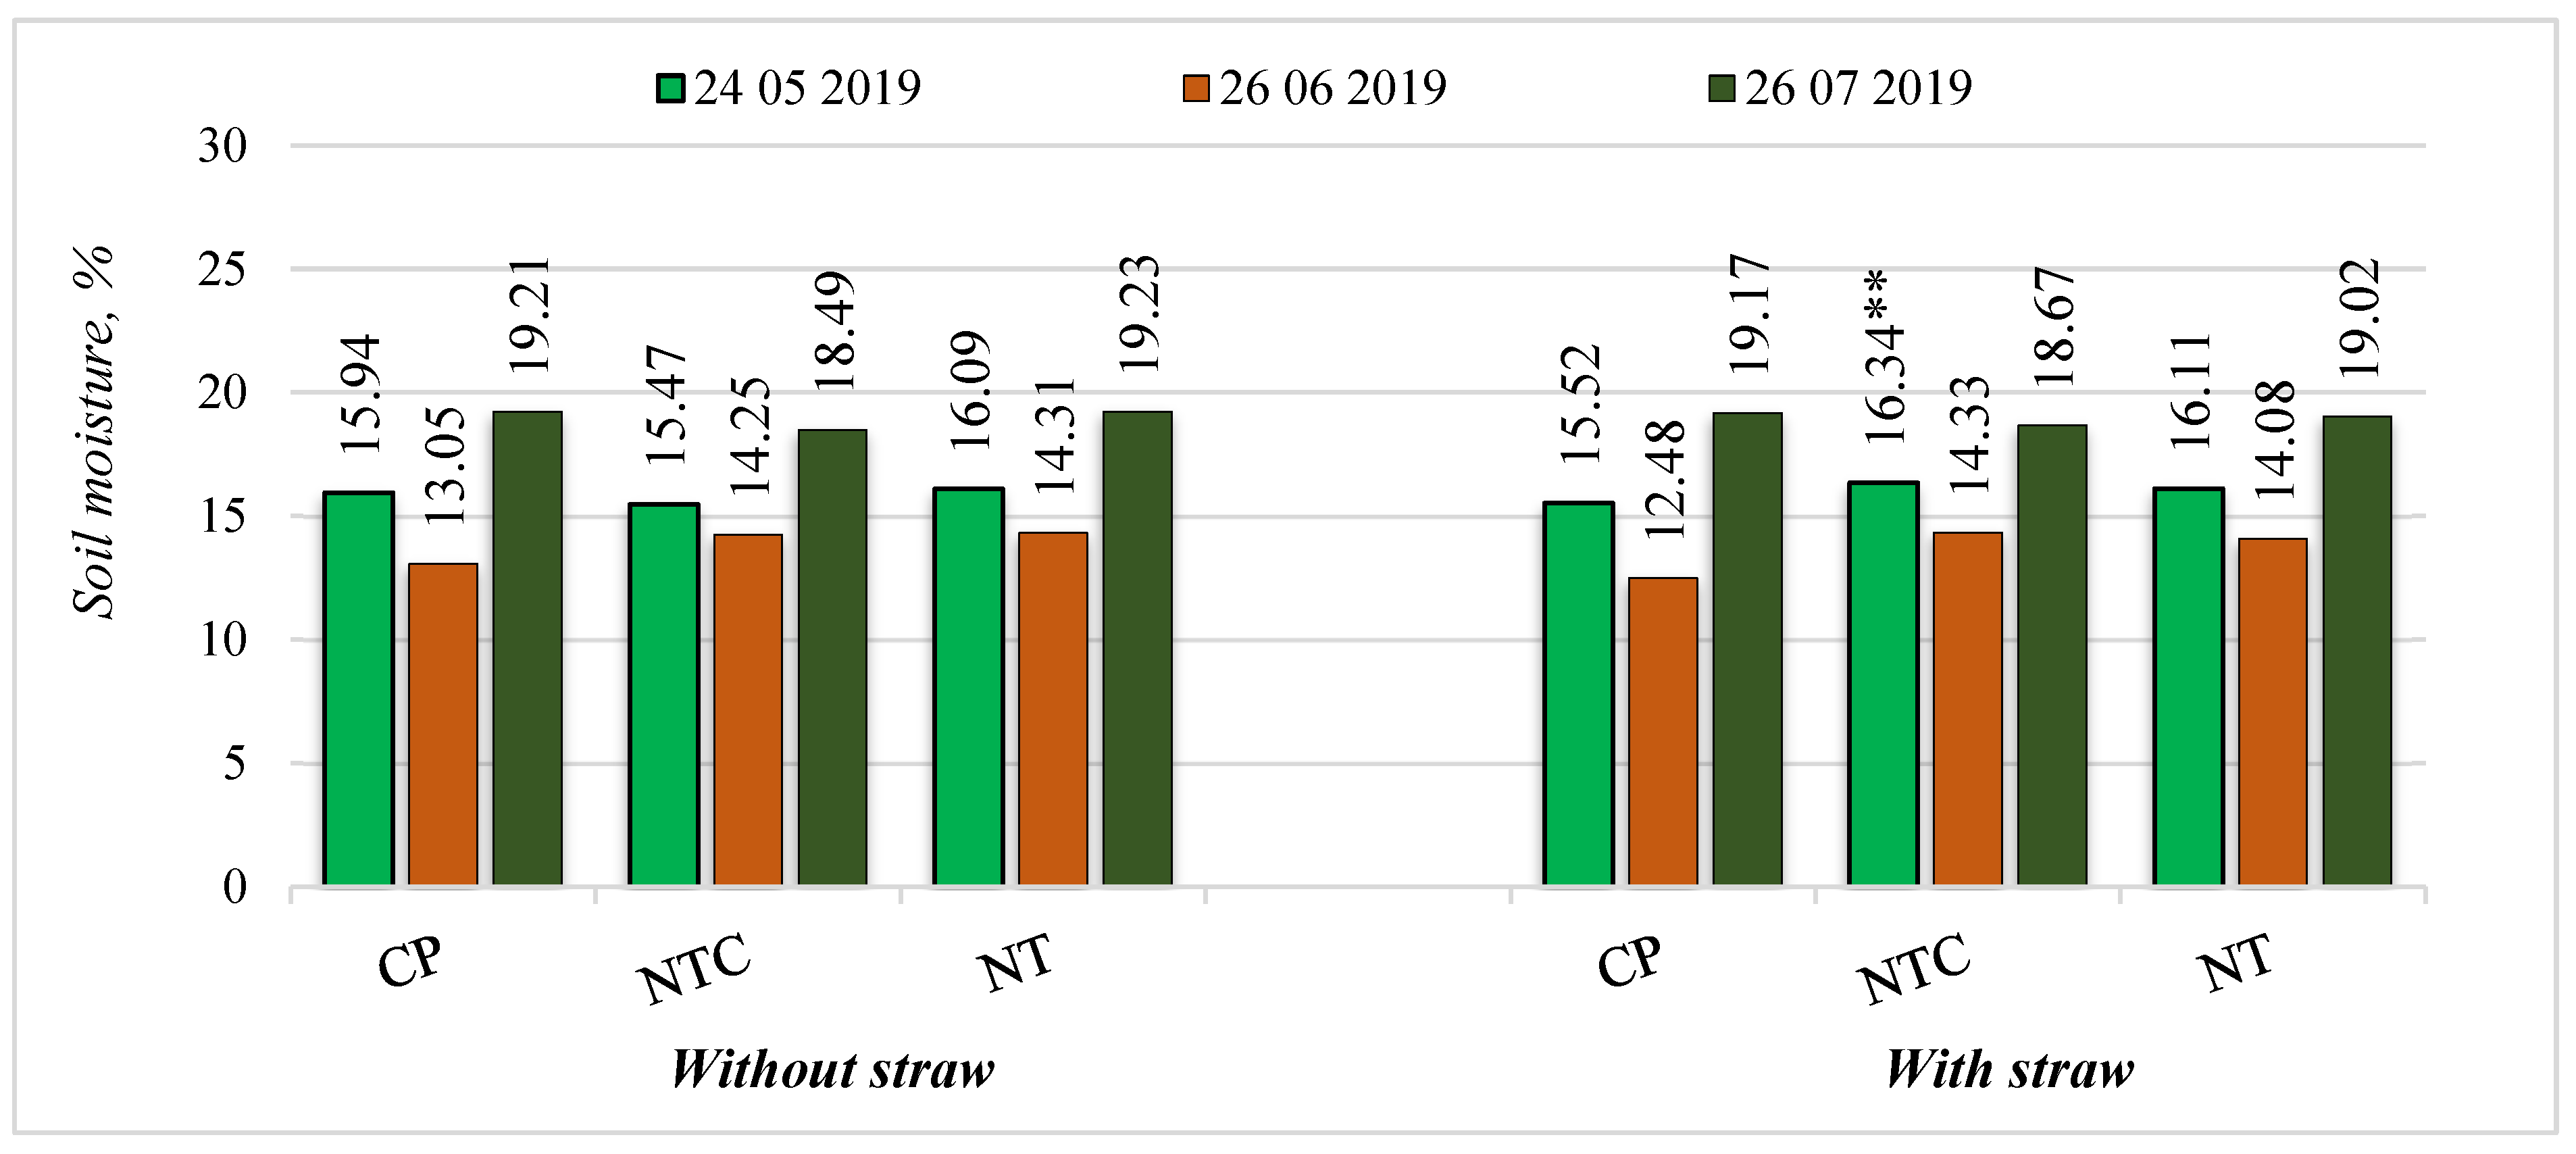
Figure 6.
Soil moisture during the plant vegetation period in 2020. Note: Factor A: S0—Without a straw, S1—With a straw. Factor B: CP—Conventional plowing, NTC—No-till with cover crops, NT—No-till without cover crops. Differences significant at *—p ≤ 0.05 > 0.01, **—p ≤ 0.01 > 0.001 and ***—p ≤ 0.001.
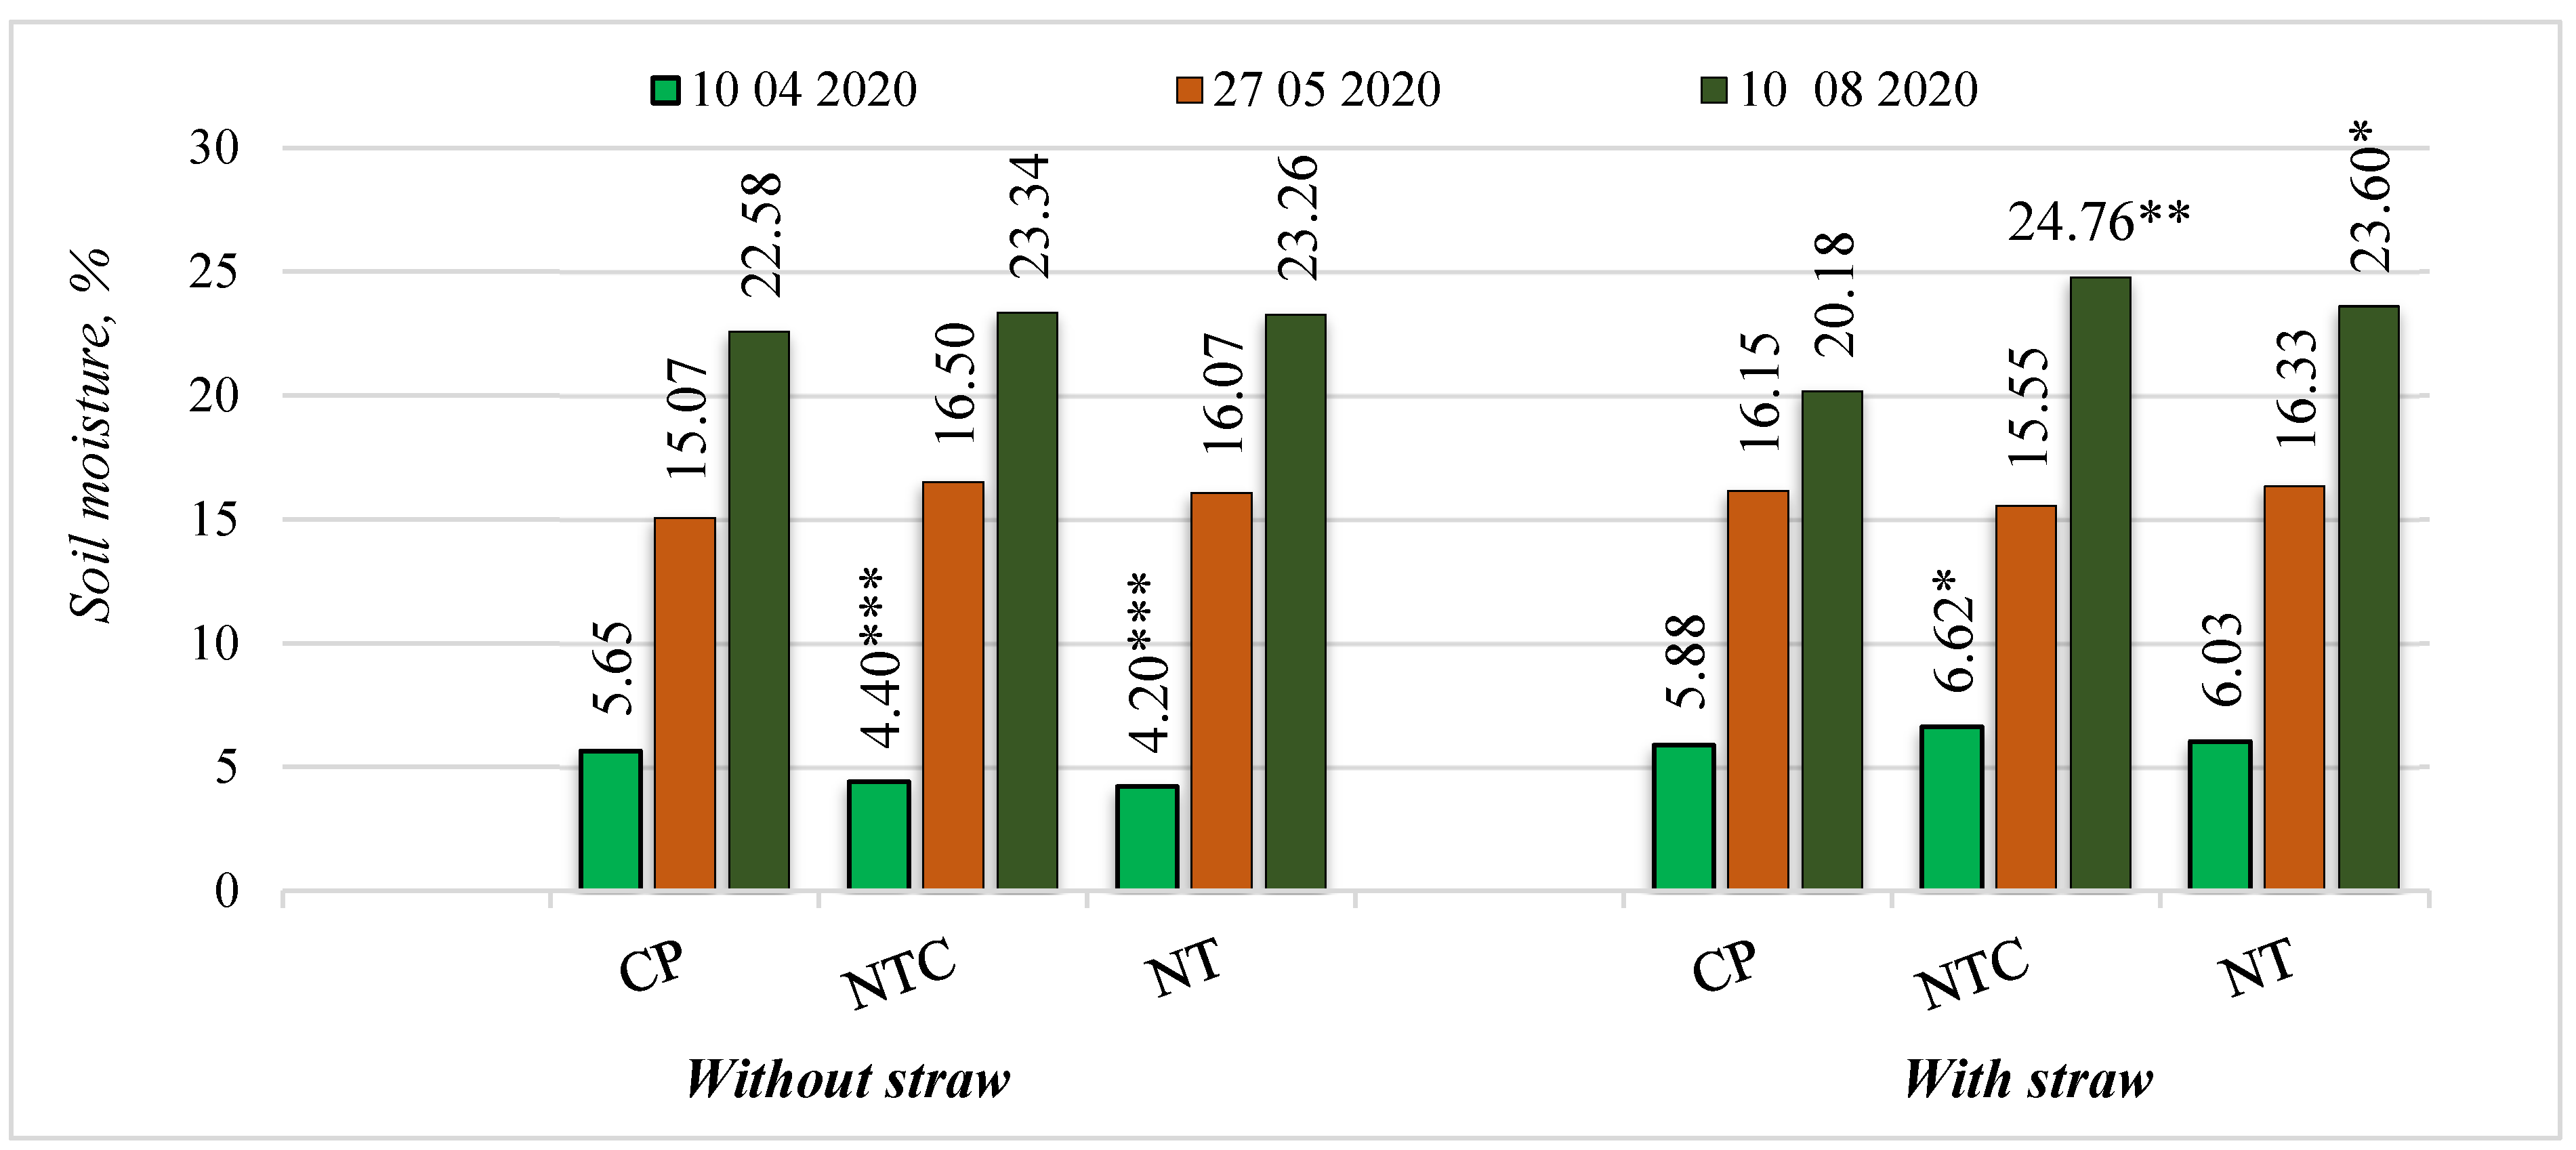
Figure 7.
Soil moisture during the plant vegetation period in 2021. Note: Factor A: S0—Without a straw, S1—With a straw. Factor B: CP—Conventional plowing, NTC—No-till with cover crops, NT—No-till without cover crops. Differences significant at *—p ≤ 0.05 > 0.01, **—p ≤ 0.01 > 0.001 and ***—p ≤ 0.001.
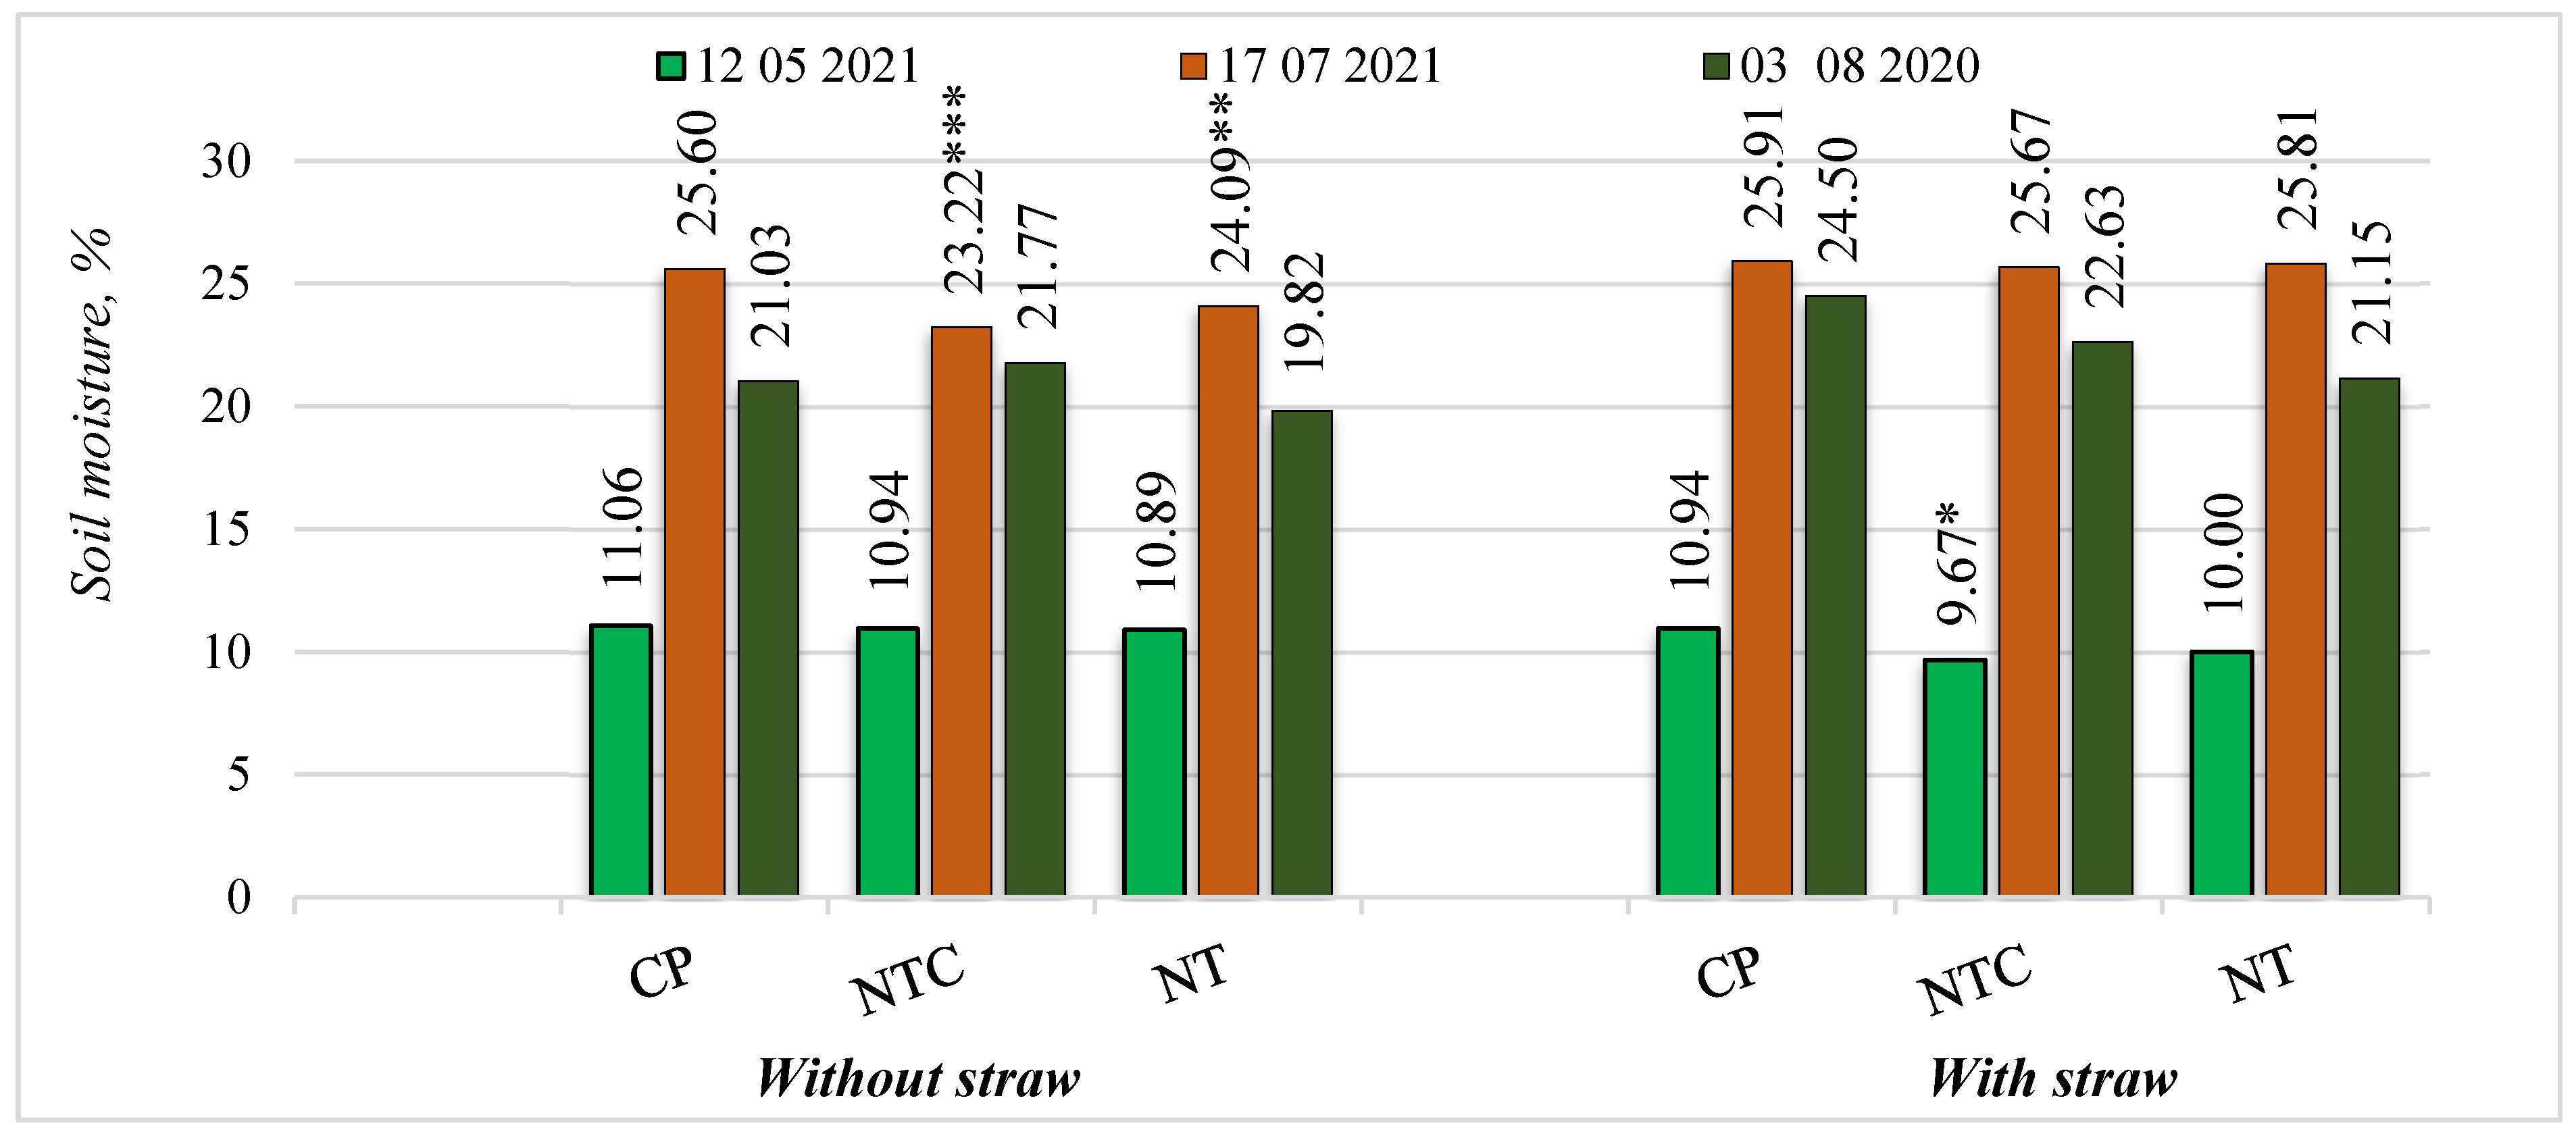
Figure 8.
Soil temperature during the plant vegetation period in 2019. Note: Factor A: S0—Without a straw, S1—With a straw. Factor B: CP—Conventional plowing, NTC—No-till with cover crops, NT—No-till without cover crops. Differences significant at **—p ≤ 0.01 > 0.001.
Figure 8.
Soil temperature during the plant vegetation period in 2019. Note: Factor A: S0—Without a straw, S1—With a straw. Factor B: CP—Conventional plowing, NTC—No-till with cover crops, NT—No-till without cover crops. Differences significant at **—p ≤ 0.01 > 0.001.
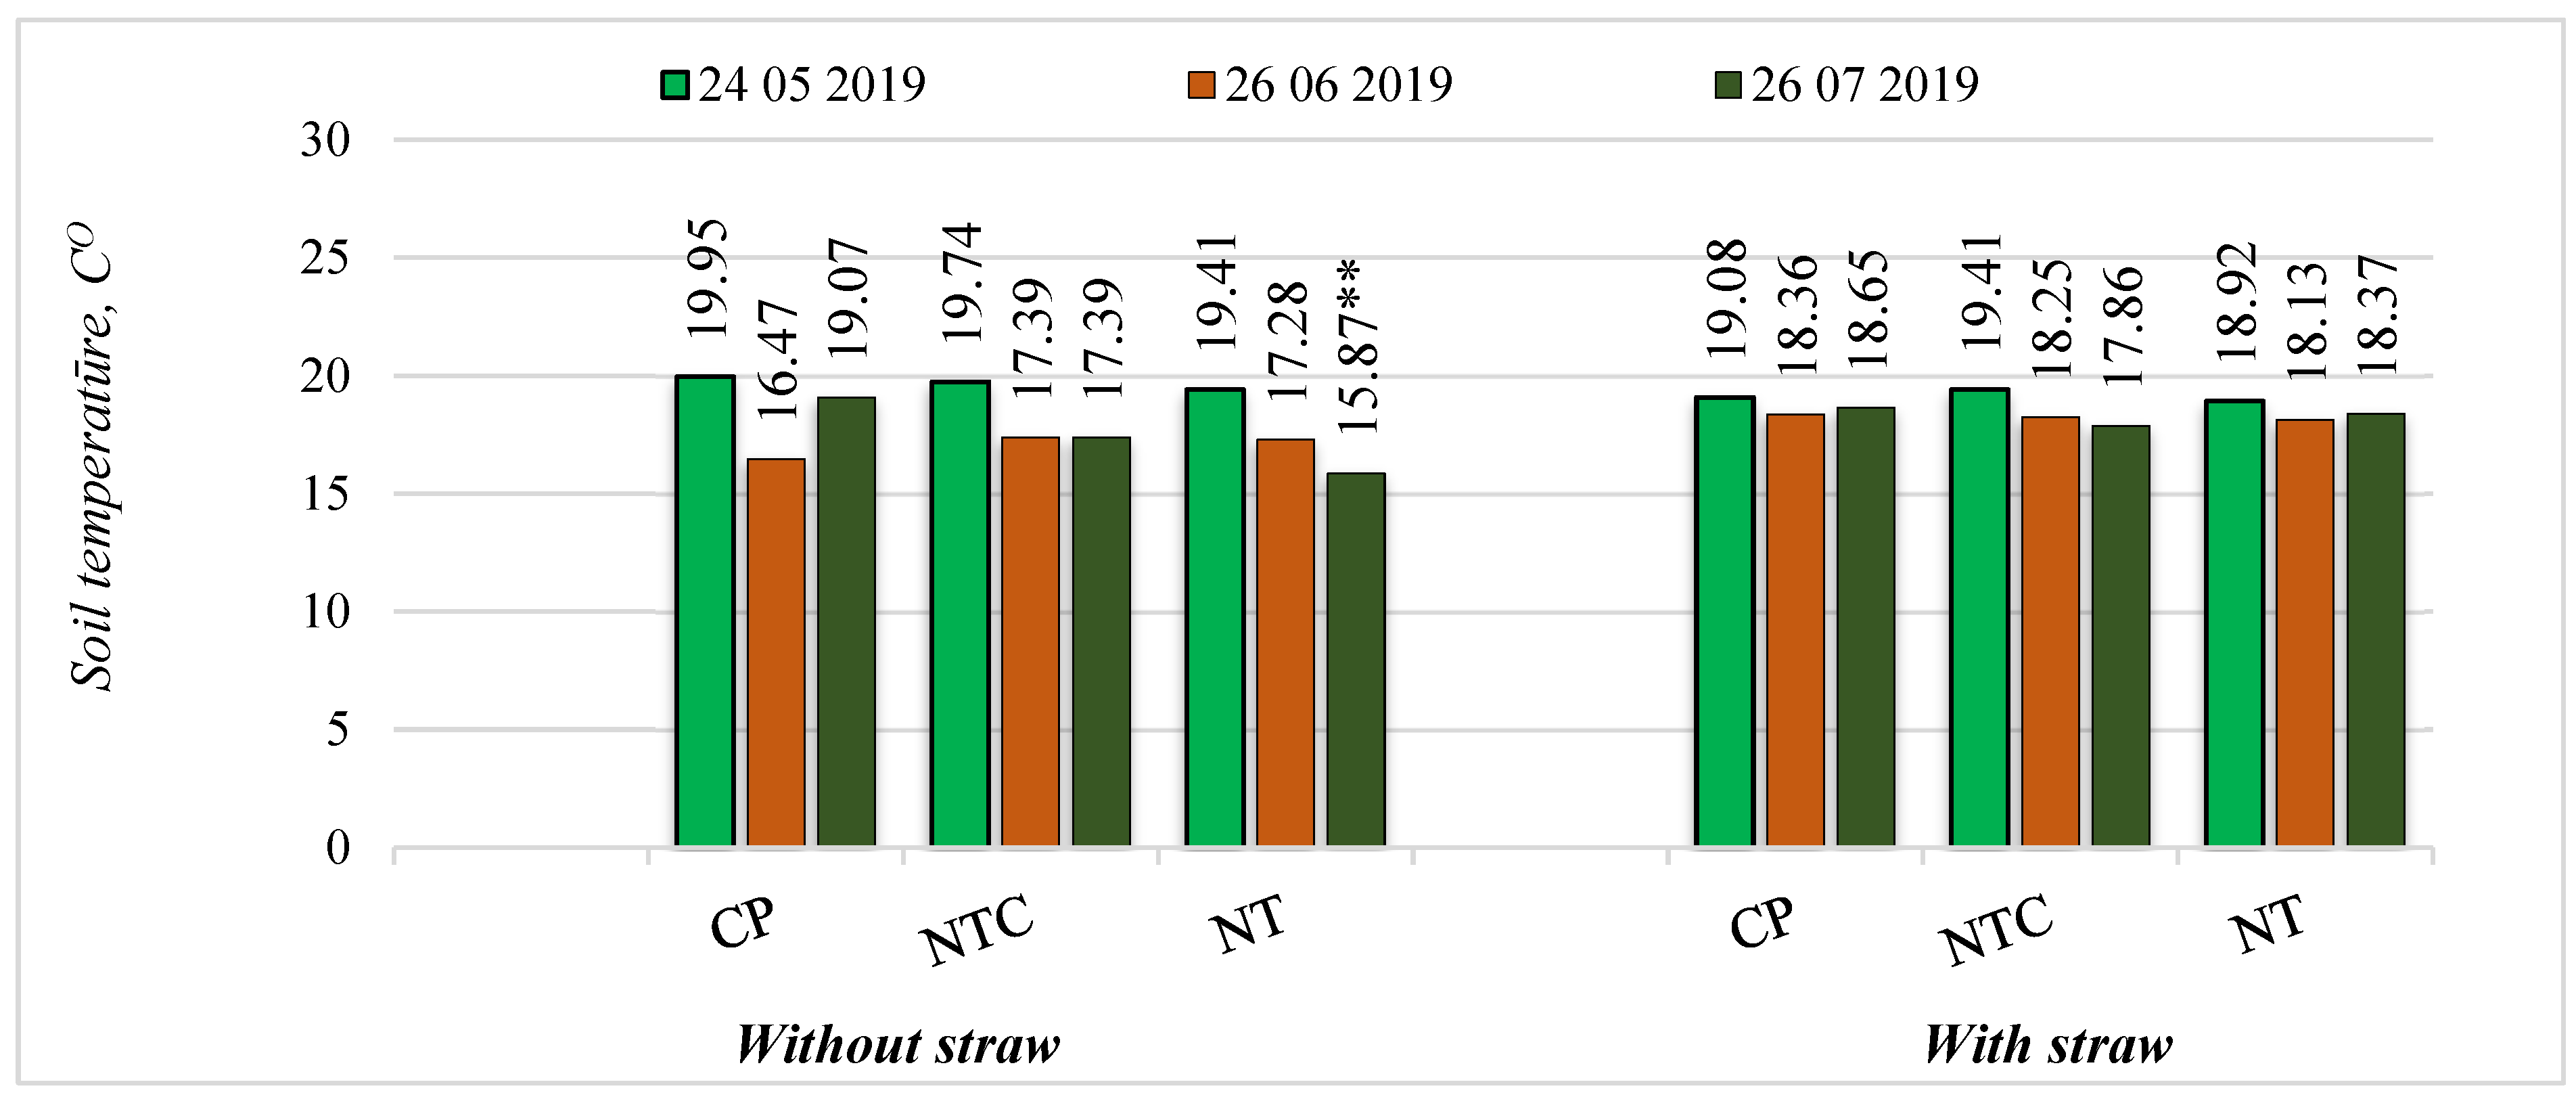
Figure 9.
Soil temperature during the plant vegetation period in 2020. Note: Factor A: S0—Without a straw, S1—With a straw. Factor B: CP—Conventional plowing, NTC—No-till with cover crops, NT—No-till without cover crops. Differences significant at *—p ≤ 0.05 > 0.01, **—p ≤ 0.01 > 0.00.
Figure 9.
Soil temperature during the plant vegetation period in 2020. Note: Factor A: S0—Without a straw, S1—With a straw. Factor B: CP—Conventional plowing, NTC—No-till with cover crops, NT—No-till without cover crops. Differences significant at *—p ≤ 0.05 > 0.01, **—p ≤ 0.01 > 0.00.
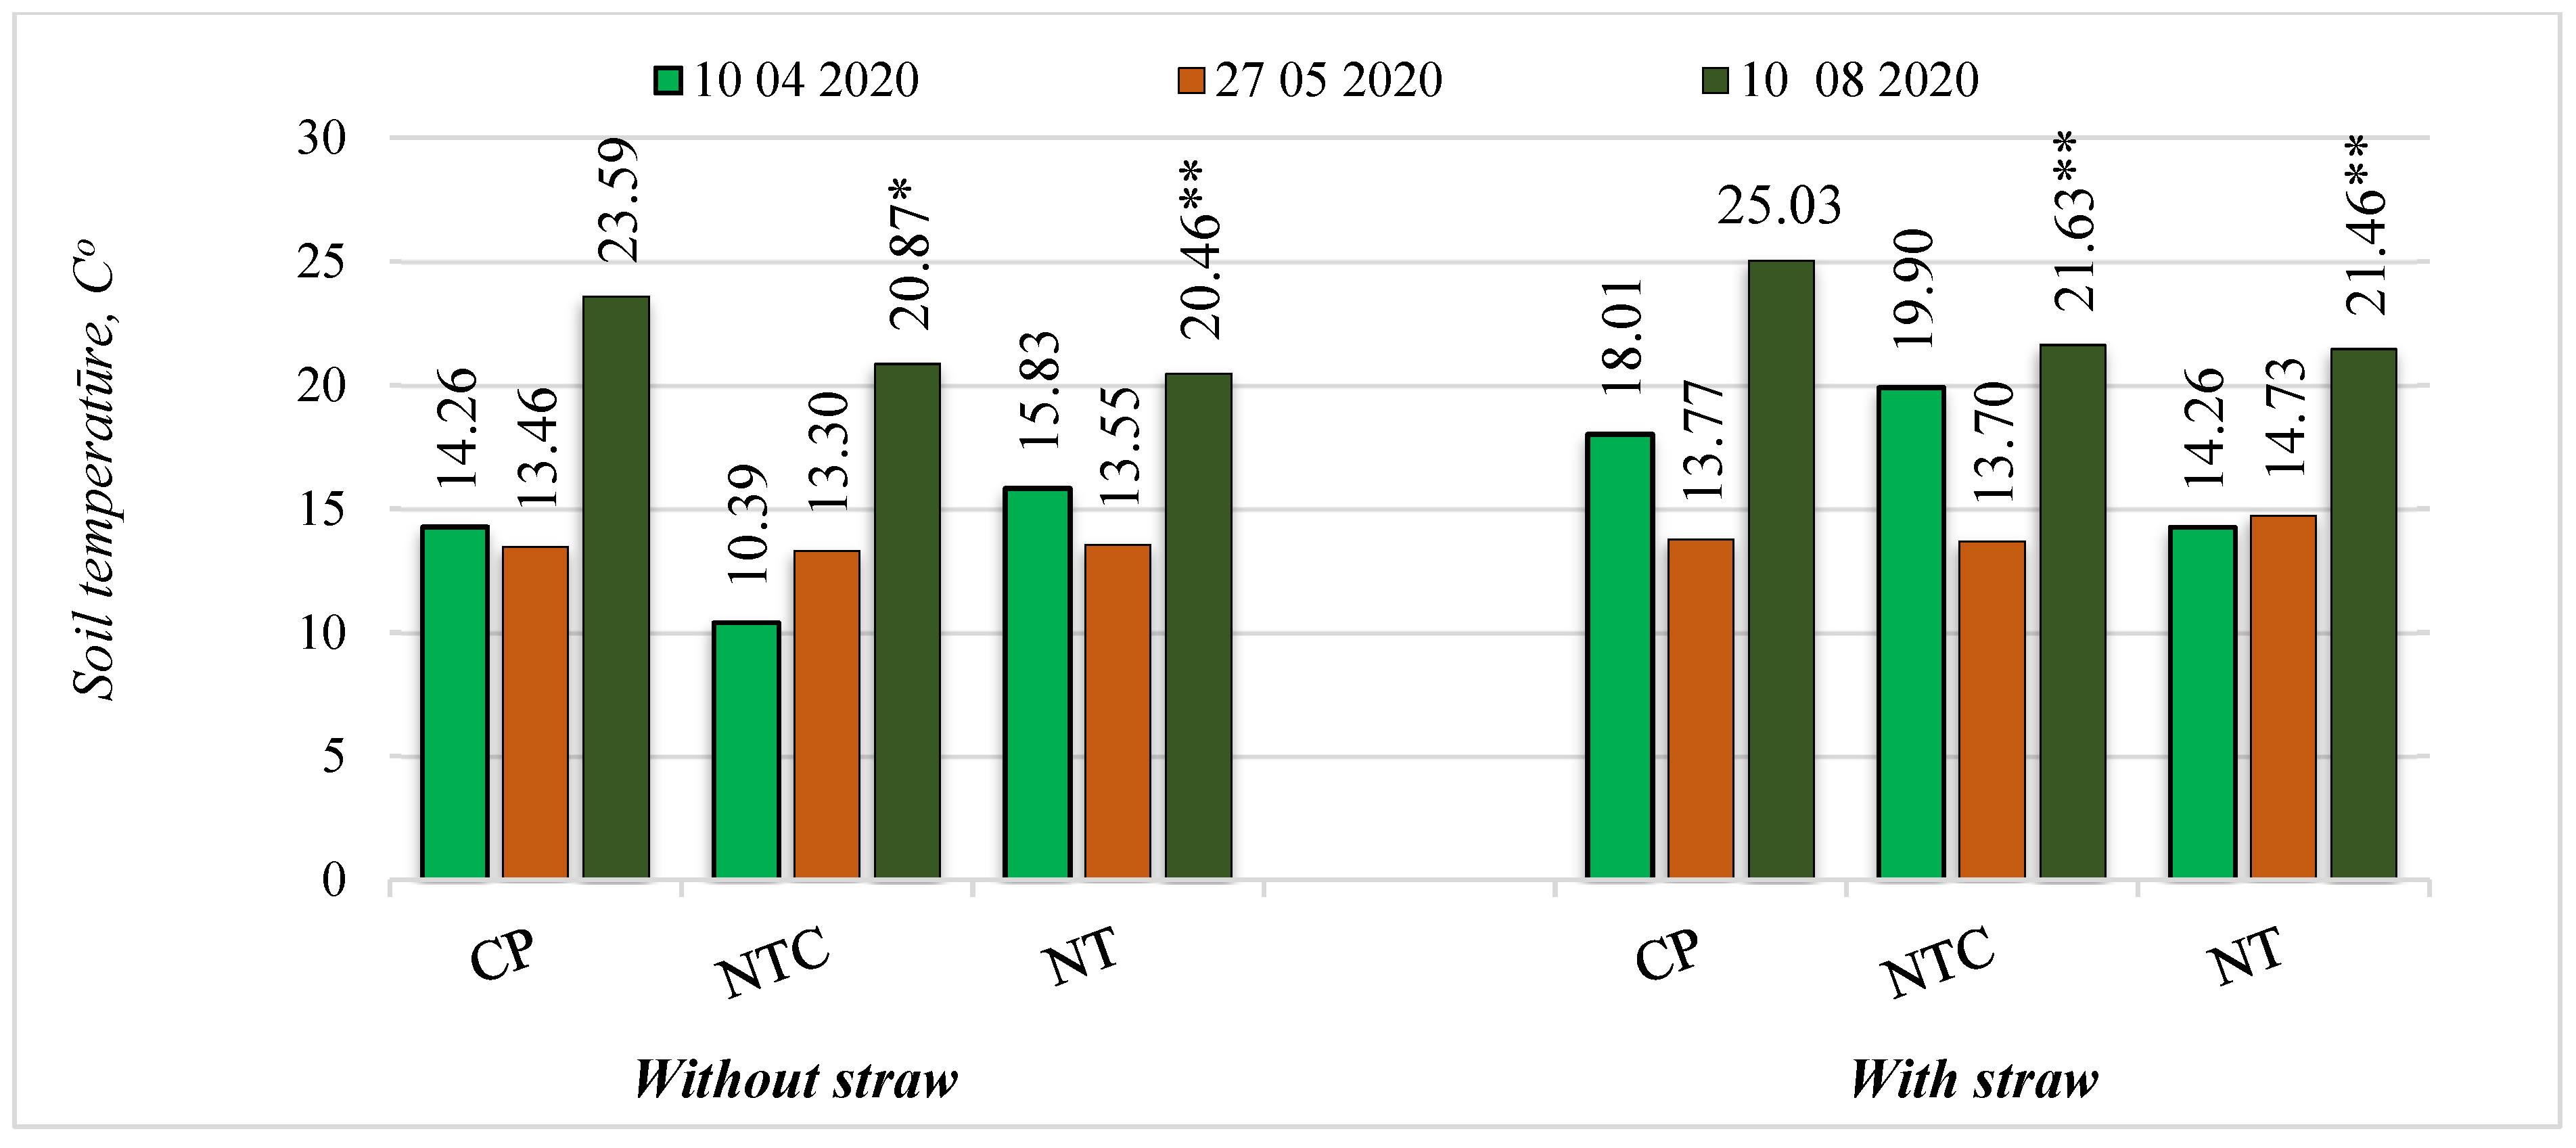
Figure 10.
Soil temperature during the plant vegetation period in 2021. Note: Factor A: S0—Without a straw, S1—With a straw. Factor B: CP—Conventional plowing, NTC—No-till with cover crops, NT—No-till without cover crops. Differences significant at ***—p ≤ 0.001.
Figure 10.
Soil temperature during the plant vegetation period in 2021. Note: Factor A: S0—Without a straw, S1—With a straw. Factor B: CP—Conventional plowing, NTC—No-till with cover crops, NT—No-till without cover crops. Differences significant at ***—p ≤ 0.001.
Disclaimer/Publisher’s Note: The statements, opinions and data contained in all publications are solely those of the individual author(s) and contributor(s) and not of MDPI and/or the editor(s). MDPI and/or the editor(s) disclaim responsibility for any injury to people or property resulting from any ideas, methods, instructions or products referred to in the content. |
© 2024 by the authors. Licensee MDPI, Basel, Switzerland. This article is an open access article distributed under the terms and conditions of the Creative Commons Attribution (CC BY) license (https://creativecommons.org/licenses/by/4.0/).
Copyright: This open access article is published under a Creative Commons CC BY 4.0 license, which permit the free download, distribution, and reuse, provided that the author and preprint are cited in any reuse.


