Submitted:
26 January 2026
Posted:
27 January 2026
You are already at the latest version
Abstract
This article introduces a new multi functional DC-DC converter-based smart energy management system utilizing Solar PV and Wind sources for Electric Vehicle applications. To promote efficient battery charging, discharging, and enhanced protection from faults, an artificial neural network (ANN) approach is incorporated. The primary feature of the ANN controller is to detect faults in the EV battery for timely intervention. In comparison with existing topologies, the proposed converter can efficiently operate under dynamic conditions and promotes better stability. In addition, the operating principle, modes of operation, design analysis, and control strategy have also been incorporated. The performance of the proposed system is evaluated through MATLAB Simulink software. Furthermore, to validate the system’s performance, a 1kW hardware prototype was built, developed, and tested to verify the effectiveness and feasibility of the system.
Keywords:
electric vehicle
; multifunctional
; DC‐DC converter
; battery management
; neural network
; solar PV system
1. Introduction
Utilizing renewable sources such assolar photovoltaic systems, wind energy, fuel cells, supercapacitors, has made it easier and significantly contributed to the transportation sector by reducing harmful emissions and fossil fuel consumption. Power electronics converters acts as main interface for power transfer in vehicles such as BEV, PHEV, and fuel type vehicles. This article [1] briefly discusses on electric vehicle power converters, circuit topologies, and DC-AC power converters for both present and future electric vehicle technologies.To satisfy the operational requirements such as wide voltage range, higher efficiency, and bidirectional capability, multifunctional converters are mostly employed, which improves reliability and efficiencyof the system [2].In this study [3], multiple- output converters are preferred due to their reduction in power losses, component reduction, and higher power density.Integration of a bidirectional AC/DC and DC/DC converters in electric vehicle applications is investigated in many studies, which achieves higher power density and efficiency.Parameterssuch as switching frequency,number of components, and output voltage gain are compared with existing topologies and reviewed in the kinds of literature [4,5].
Multifunctional converters can manage grid power quality and perform multiple power conversion functions were studied [6]. Its additional features include vehicle-to-vehicle charging, low-power auxiliary supplies, and motoring and single-phase charging methods [7]. In [8], a multifunctional bidirectional converter is introduced to achieve high-efficiency power conversion in various forms with an efficiency of 92%. A three-port converter can enhance both power density and reliability by integrating the onboard charger with low-voltage converters. The main advantage of multifunctional integrated converters is to facilitate onboard charging and low-voltage conversion for auxiliary loads in electric vehicles [9,10]. Whereas, bidirectional converters usually form as a hybrid system that supports battery condition monitoring, fault detection, thermal management, and efficiency optimization [11,12]. But it cannot employ multiple sources for the charging system. In this study, a structure utilizing dual sources is analyzed for electric vehicle applications without the need for any additional auxiliary circuit [13]. Bidirectional topologies, PWM isolated converters, dual-active-bridge converters, and resonant converters have played a prominent role in the electric vehicle sector andwere discussed briefly [14].The literaturebriefly reviews recent advances of deep learning techniques, predictive control, hybridoptimizationmethods, fuzzy logic, and neural network approaches in power electronics, which substantially improve efficiency and performance of the converters [15,16]. Among all control techniques, Artificial neural networks (ANN) are generally considered as a smart power management strategy (PMS) controller to coordinate renewable energy use and monitor fuel efficiency in hybrid-type electric vehicles [17]. In [18], an interleaved step-up converter iscoupled via a central capacitor for battery charging and discharging by combining all switching intervals. A better energy management strategy that uses various renewables, loads, and EV batteries to maintain system stability through a power converter [19].Therefore, incorporating a battery management system in a multifunctional converter can help to protect both the vehicle and the battery in safety aspects [20]. This converter [21] employs a supercapacitor-based energy storage system for connecting the DC bus involving electric vehicles.The topology [22] utilizes boost and buck-boost configurations for both the PV system and the battery sources, where the power balance is achieved through conventional controllers.However, it cannot able to satisfy the necessary load requirements. Therefore, an integrated multifunctional converter is introduced [23] to achieve higher power density for electric vehicle applications, with an efficiency of about 92.5%. To extract maximum power and to supply both DC and AC loads, a single-stage multifunctional converter is desirable.By integrating multiple energy sources with smart grids, multifunctional converters are designed, which improveboth reliability and system feasibility [24,25].To improve the conversion efficiency and reduce conduction losses in power components, multiple operating stages are performed by a multifunctional isolated converter. In [26,27], a multiwindingflyback transformer can interface multiple sources and loads to operate undervarious operating modes with anefficiency of 91% to 93%. However, transformer-based structures increase the complexity and cost of the system.
A backstage power circuit in a multifunctional power converter is commonly employed to improve the efficiency and achieve low harmonics output waveforms for various critical loads. Voltage regulations can be further improved by employing a phase-shift control and PWM control schemes in converters [28,29].To allow flexible integration of multiple functions in grid-connected PV systems, an advanced controller is needed to enhance the power quality and reduction in THD [30]. In [31],the converter can operate in all modes, such as charging, propulsion, and regenerative braking modes, to facilitate effective power management and allow more flexible control.In this study [32], the authors have approached a PID controller- based power factor correction strategy to step- up or step- down the load voltages, but it was limited to perform in non-linear applications.So, a bidirectional structure is employedin a multifunctional converter to vary the voltage and power requirements between the sources and loads [33]. Without the need of any additional isolation transformers, thisconfiguration can easily attain higher gain voltages, and its fine-tuning of duty cycles is performed by an effective control scheme [34]. This article [35] briefly discusses about ahybrid converter-based topology to deliver a stable, efficient, continuous power supply towards the uninterrupted power operations by using a conventional PID control strategy. However, ANN algorithmtrained PWM signals can easily control switching operations, ensure stable DC output,optimize duty cycles, and timing intervals by providing efficient operation [36]. Moreover, performing dynamic response conditions in multifunctional converters can regulate active power transfer based on load requirements and promote bidirectional power flow between the AC and DC interface [37]. A high-performance boost converter in [38] regulated by a conventional controller to provide a stable DC voltage and power under fluctuating source conditions.But, the combination of a solar PV system, battery, and a DC link capacitor always forms a sustainable power supply unit, which efficiently manages load changes and source variations by regulating efficient power management [39]. The article [40] briefly discusses an internet-distributed energy management strategy for plug-in- hybrid electric vehicles to deal with challenges faced in the real-time global optimization process.
Among all conventional controllers such as PID, Fuzzy, PSO, the ANN controller is mostly preferred to reduce mean-squared error and voltage fluctuations by maintaining a constant DC link voltage amid load and irradiance variations. It also helps to simplify control complexity under non-linear load conditions [41,42]. An MPPT-based ANN controller is discussed in this article, which achieves a higher voltage conversion ratio with a duty cycle range of 60% [43]. To promote automotive battery safety due to the large amount of heat generation, a Multi-U channel technique is carried out in this study based on heat generation and temperature distribution [44]. To achieve simultaneous power management, an ANN controller is utilized in the multifunctional converter, and its performance is evaluated under various modes in this study [45]. So,Artificial neural networks (ANN) are primarily used for fault detection and isolation of faulty switches under abnormal conditions, thereby improving the reliability and productivity. ANN-type controllers can easily attain better power balancing between the generation and load under dynamic response conditions compared with conventional controllers [46,47]. Additionally, to achieve a good response time, better energy management, and efficiency in hybrid energy systems under transient conditions, these types of controllers are employed.
Among the various kinds of existing literature, interleaved, single port, and bidirectional configurations with conventional controllers face limitations related to hybridizing renewable sources, efficiency, load regulation, dynamic response and control stability. To overcome these challenges, this article introduces a new multifunctional converter-based hybrid energy storage system that leverages PV and wind sources to enhance energy management and load control for DC microgrid applications. The schematic diagram of the converter is shown in Figure 1.
Key aspects of the proposed configuration are represented as follows,
- Hybridization of multiple sources can satisfy the needs of load demand.
- Improved efficiencyofabout 95.4% at 50% duty cycle range,maintains load voltage regulation during variation in load from 1k to 47k, and employment ofthe ANN approach can estimate the fault tolerance in the EV battery.
- To maintain power balance and system stability in islanded DC microgrids, Dump loads are utilized.
- Compared with the conventional controllers, the system can achieve higher power density due to its faster dynamic response and enhanced reliability through its fault detection performance as low as 5 to 15ms.
- A transformer-less structure reduces complexity in control and overall system cost, and its bidirectional operation can efficiently manage energy flow between the EV battery and DC bus.
The proposed optimized controller,Artificial Neural Network (ANN), can efficiently monitor the battery management system in electric vehicles. This article can be organized into the following sections. Section II represents the principle and operating modes. Design guidelines, modelling, and stress calculation are presented in Section III. ANN architecture, control strategy, and simulation results discussionare detailed in Section IV. Section V presents the experimental results and discussions. Section VI presents the discussions and the future scope of the proposed system. Finally, Section VII concludes this article.
2. Principle and Operating Modes
The principle of the multifunctional system, comprising solar PV, wind, and a battery storage unit, and its modes of operation under CCM conditions, are elaborated in this section. The proposed configuration in Figure 2 shows a cascaded structure that comprises a boost converter powered with a PV system developed with aninductor (L1), a single switch (Q1), a diode (D7), and a capacitor (C1). It is followed by a buck converter at the load side comprising L2, D8, and C2to supply the load (Ro). A bidirectional converter with a battery storage unit consists of switches (Q3, Q4) and an inductor L3, which allows the battery to either charge or discharge from the DC bus. The wind generator provides AC power by a three-phase rectifier andthen filtered by a capacitor C to provide a stable rectified DC output.
The system can operate in six modes. In this configuration, the PV source connects to a conventional boost to elevate the voltage to the common DC bus. The AC voltage from the Wind Energy Conversion System (WECS) is converted into DC by using a PWM rectifier. The wind source also supplies maximum power to the DC bus. The system also incorporates a driver circuit for control interfacing and employs an auxiliary load for excess energy usage. An Artificial Neural Network (ANN) controller is trained to detect faults in the EV battery and displays the fault level for timely intervention. It also enhances the system's responsiveness under fault conditions, ensuring optimal battery life and overall system reliability during charging operations.
The DC bus functions as the main power distribution point, providing energy to auxiliary loads in an electric vehicle and to the EV battery. In this configuration, the battery charges via a bidirectional converter, which also allows power to flow back to the grid (V2G). A buck converter gradually suppresses thehigher voltage to a lower value for the vehicle's auxiliary loads.
2.1. Operating Modes
2.1.1. PV and Wind
In this mode, both PV and Wind provide power to the common DC bus. The mode of operation is presented in Figure 3. Here, the wind power is converted into rectified DC using a three-phase rectifier circuit.
The switch Q1 is operated to charge the inductor L1 during the Onstate and then discharges its energy to charge the capacitor C1, which directly feeds into the DC bus in the Off state. Capacitor ‘C’energy discharges to the DC bus. The charging process is specified by a green line, and the red colour specifies the discharging process.
2.1.2. PV Mode
During this mode, presented in Figure 4, PV alone supplies sufficient power to the DC bus. The switch Q1 is operated to charge the inductor L1 from the PV source during the Onstate and discharge its energy to charge the capacitor C1, which directly feeds into the DC bus during the Off state. Here, the charging process is specified by a green solid line, and the red colour specifies the discharging process.
2.1.3. Wind Mode
During this mode, Wind alone supplies a rectified DC power to DC bus via boost converter. Capacitor C1stored energy flowing to DC bus during the Off state. Here, green line indicates the charging process. In this condition, the PV system remains disconnected. The operating mode is presented in Figure 5.
2.1.4. Battery Charging Mode
In this mode shown in Figure 6, the switch Q2 is operated, and Q3 remains Off in the bidirectional converter to charge the inductor L3 from the DC bus. L3stored energy is discharged to battery and operates in boost mode.
2.1.5. Battery Discharging Mode
During this mode, switch Q3 is operated, and Q2 stays in the Offstate during the On period to discharge the energy stored in inductor L3 from the DC bus. During the Off period, Q2 remains Off and Q3 stays On. This system operates in buck mode. The operating mode is presented in Figure 7.
2.1.6. Grid Fault or Islanded Mode
During this mode, the buck converter reduces the higher voltage from the grid source to a lower voltage to supply the auxiliary loads. The inductor L2 charges during the On state and discharges during the Off state to charge the capacitor C2, respectively. Here, the mode of operation is shown in Figure 8.The detailed switching look-up table for all modes is presented in Table 1.
3. Design Guidelines, Stress Analysis, and Modelling
The inductors and capacitors are designed by considering the ripple factors and based on the voltage and current across them. The comparative analysis of ripple factor specifications is detailed in Table 2.
3.1. Design Considerations
3.1.1. Parameter Design on Inductors
During the On state, by applying the Volt-Sec principle, inductances are designed by considering 20% ripple at 50kHz, given as
Here, is the switching frequency, is the inductor current ripple,Vsis the source voltage, and D is the duty cycle, respectively.
3.1.2. Parameter Design on Capacitors
By applying the Amp-Sec theory, capacitances are designed by considering the capacitor voltage ripple as 10% given by,
3.2. Power Switch Selection
To determine the cost and efficiency of the converter, switch voltage is an essential factor. Here, the load voltage is always kept lower than the switch voltage, but equals the capacitor voltage.
3.3. Modelling of PV Systems, Irradiance Variation, and Wind Energy Source
The PV system is modelled using a single-diode equivalent circuit, where the irradiance variation is introduced through the photo-generated current proportional to solar irradiance. The wind source is modelled using a standard aerodynamic turbine model where wind speed variations are introduced dynamically.The PV system model consists of a current source, a diode, a series resistance, and a shunt resistance.
The PV module output current can be represented by the following equation,
Here, Rs is the series resistance, Rsh is the shunt resistance, V is the voltage, I is the current, n is the diode ideality factor, Io is the diode's reverse saturation current, and Ns is the number of cells in series.The modelling of irradiance is computed through the photo-generated current, which is directly proportional to the solar irradiance. The generated current can be represented as,
Here, G is the instantaneous solar irradiance, Gref is 1000W/m2, T is the temperature, and αT is the temperature coefficient of current. While, the wind source is modelled by using a standard aerodynamic turbine model, where the mechanical power generated is expressed as,
Here,is air density, is tip-speed ratio, Cp is power coefficient, is blade pitch angle, and w is wind speed.
3.4. Stress Analysis Calculation
The voltage and current stress analysis of all switches and diodes is detailed in this section. Current and voltage ratings of all the power components are derived from this analysis. Voltage and current stresses across the switches and diodes can be calculated during the switch-off state under steady-state operation. The maximum voltage stress equals the DC-link voltage, while the current stresses are estimated based on inductor currents. Peak values are determined by considering the inductor current ripple under CCM, ensuring proper component rating selection. Table 3 shows the voltage and current stresses across all power components in various modes. In the following table, VDC represents DC voltage, IPV stands for PV current, ILoad is load current, Ibat is battery current, IAC is AC current, and VAC is AC voltage.
4. Control Algorithm and Simulation Results
4.1. Artificial Neural Network (ANN) Control Strategy
An Artificial Neural Network (ANN) is generally considered an artificial intelligence (AI) tool inspired by the structure and function of neurons in the human brain. It is primarily applicable for predicting non-linear systems. For analyzing dynamic modeling, regression problems, system identifications, and fault detection, an ANN strategy is commonly employed. The proposed system incorporates a multi-layer feedforward neural network (NN), which is applied for fault estimation, where the elements of the NN network are divided into layers. The ANN architecture comprises of input layers, hidden layers, and output layers. The finite accuracy of the model can be improved by increasing the hidden layers, based on its requirements. The equation for the ANN structure model can be represented as follows,
Here, Xirepresents the input data of the NN, and Wi represents the weightage and b the bias vector component. The activation function is applied to get an accurate output based on its desired input. In feedforward networks, the output layer cells are applied as the input of the next layer. The network output is finally computed between the hidden and output layers.The backpropagation technique is carried out to generate a decent output by reducing the error signal. This method is used to train the weights of the multi-layer feedforward network. If the network has ‘n’ inputs, ‘m’ neurons, and one output, the ANN backpropagation structure can be stated as follows,
The output signal can be computed as follows,
Here is the input factor, and are hidden layers of output and input. ‘b’ represents the bias factors of the hidden and output layers, respectively. ‘w’ represents the connection weights and ‘y’ represents the final computed output. The layered structure of the proposed artificial neural network algorithm is presented in Figure 9.It has one hidden layer,and its sigmoid function can be represented as,
ThisANN approach is incorporated ina bidirectional converter to analyze the battery side fault detection. The controller receives battery voltage and current as training datasets. After calculating the bias factors and weights, the well-tuned ANNs can be implemented in the proposed system. The mean squared error (MSE) and the correlation coefficient (R) should convergefrom 1 and 0 in order to achieve accuracy.
Here, is the desired value and is the estimated value. ANN outputs and inputs are used to estimate the data, then trained and validated for the converter performance. The backpropagation algorithm is incorporated, which has two inputs in the input layer, 10 hidden neurons in the hidden layer, and the generated output in the output layer. Their targets are classified as training, validation, and testing parts as 70%, 15%, and 15% at 4 epochs, respectively. The training process reached a minimum gradient at 0.0201 by usingthe Levenberg-Marquardt algorithm. The trained data at 4 epochs is displayed in Figure 10. Here, the Mean Squared Error (MSE) is reached at 2.961e-04 for training, 4.100e-04 for validation, and 1.568e-04 for testing, respectively.
To evaluate the ANN- based fault detection for each fault and operating condition, the response time of the fault detection and the steady-state fault estimation error can be represented as,
The neurons in the hidden layer can be regulated,and their performance curve is shown in Figure 11. The best performance is validated at epoch 1 of 0.00041003.
An error can be computed between the difference of the targets and outputs. The distribution of prediction errors across training, validation, and testing can be represented by a histogram plot shown in Figure 12.
The trained regression plot using ANN structure is displayed in Figure 13, which proves that the data aretrained using the Levenberg-Marquardt algorithm, and the value of R indicates the network is performed with the zero error predicted outcomes for each corresponding target. The detailed flowchart of the ANN structure for the proposed system is represented in Figure 14.
Figure 15 illustrates the schematic of the overall control strategy of the configuration. Between the reference input and the control variable at every sampling instant, an errorsignal is computed. Using a trial-and-error method, it computes a generalized control action, which is a switching pulse (D) for Q2 and Q3 of the converter. The controller monitors battery voltage and current parameters and displays a fault level output, indicating the severity or type of fault. It does not apply to monitor grid parameters directly. The grid fault detection mechanism uses conventional relay-based methods to monitor voltage and frequency thresholds. The controller initiates the switch operation for mode 6 to isolate the load and maintain the power supply via the buck converter.A conventional PI controller is integrated into the PWM rectifier circuit and in the boost converter to compare the reference DC voltage with the actual voltage, adjusting the PWM duty cycle to maintain the desired DC voltage level.Solar PV system specifications are tabulated in Table 4, and its performance characteristics curve is shown in Figure 16. The battery energy storage system (BESS) specifications are shown in Table 5, and Table 6 represents the specifications of the simulation parameters.
4.2. Simulation Results
The simulation results are generated and executed using MATLAB Simulink and presented in this section. Figure 17 representsa Simulink model including a PV system, a Wind source, a PWM rectifier, a battery storage system, and a DC microgrid. PV sourceis integrated with a boost structure, controlled by a PI controller, which simulates PV’s dynamic behavior atvarious temperature, irradiance conditionsto maximize the power output.
The Simulink model of a wind energy system comprising a PWM rectifier, which converts AC power to regulated DC power using a voltage regulator and measures its maximum power output, shown in Figure 18.
Figure 19 represents the Simulink model of the ANN controllerfor fault detection integrated with a bidirectional converter toprovidecontrol compensation. It also provides feedback regulation through voltage and current compensators.
Figure 20 shows the solar PV irradiance waveform, which remains constant at 900W/m2 and increases to 1000W/m2 after 0.45s, respectively.
In Figure 21, the input current of the boost converter is measured at 27A and decreases to12A at each stepinput. After 0.45s, the current again remains constant at 27A. However, load current remains constant at 10A, respectively.
The boost converter’s source andload voltage waveformsare displayed in Figure 22.Here,the system measuresthe input voltage at440V DC, and after 0.25s, it slightly reaches 450V and then 500V with respect to each step change. However, the load voltage maintains at constant 600V DC, respectively.
The waveform of wind source AC outputlies in range between 500V to -500V range and its corresponding PWM rectified DC output of 600V reaches steady state at 0.1s is presented in Figure 23.
The corresponding battery characteristics are shown in Figure 24. It showsthat the SOC remains stable at 60% between 0to 0.6 s, where the voltage decreases at 0.3s and remains constant at 10V, respectively.
Figure 25 represents the fault level waveform using ANN controller, where the fault level decreases rapidly at 0.3s and then slightly increases. The time taken during the fault injection is approximately 0.30s, and the ANN controller output deviation occurs at 0.305s.
Therefore, the response time and true positive rate (TPR) can be calculated as,
Here, is the number of detected fault events, and is the number of faults not detected by the ANN controller.
Finally, the system DC link voltage is achieved at 600V and remains constant after 0.1s as shown in Figure 26.
4.3. Power Loss Analysis and Efficiency Calculation
Power loss analysis plays a substantial role in the converter efficiency calculation. The loss distribution of the proposed system is displayed in Figure 27. The switching and conduction loss will occur during the switch or diode ‘On’position, and it can be expressed as follows,
The semiconductor losses depend on,
MOSFET's total losses are calculated as, The diode power loss is calculated by the following expression,
Diode losses are calculated as, Also, the capacitors and inductor losses are expressed as,
The rectifier losses can be expressed as,
Hence, the total power loss can be calculated as,
The converter efficiency can be calculated as,
Total system efficiency =
A performance comparative table of the ANN controller with other existing controllers ispresented in Table 7. The performance comparison of the proposed converter with the state-of-the-art converters is presented in Table 8. The comparison is made based on the number of components, gain, switching frequency, and efficiency.
5. Experimental Results
5.1. Experimental Setup
Ascaled-down version of a 200W experimental setuphas beendeveloped and built in the laboratory, directly scalable to the 1kW system as shown in Figure 28,to verify and validate the effectiveness and converterperformance.Here, galvanic isolation is not needed due to its low operating voltage and power ratings. The hardware specifications arepresented in Table 9. The solar PV source is integrated with the boost–buck converter configuration to power the common DC bus. Bridge rectifier-1 is incorporated to convert the AC power to DC power, due to the non-availability of PV power.Bridge rectifier-2 is used for the conversion of AC to DC to amplify and power the driver circuits. Bridge rectifier-3 is incorporated for the wind source converting AC to DC power, integrated with the boost-buck configuration to power the DC bus. A 4-channel digital storage oscilloscope (DSO) is used to capture the results, while LCDs show the real-time data effectively. The overall configuration demonstrates the integration of solar PV energy and wind energy conversion, power management, and monitoring for effective energy utilization.
On the source side, the PV system produces the nominal DC voltage ranging from 30V to 40V, corresponding to 150W, while the wind source, implemented with the BR101 Rectron-bridge rectifier, is limited to 150W to ensure safe operation under laboratory conditions. The maximum load power is approximately 200W, aligning with the combined generation capacity and storage limits. This harmonized converter topology can prevent sustained DC bus overvoltage, reduce battery stress, and ensure reliable operation across all modes.
The hardware prototype is shown in Figure 29. The DSPIC30F4011 microcontroller controls the switching periods of MOSFET power devices. The optimized weights and trained data are loaded into the DSPIC30F4011 microcontroller. The control algorithm is then converted into C code, compiled, and embedded onto the chip. The controller utilizes an embedded Artificial Neural Network (ANN) to process real-time data and generate appropriate control outputs.This modulation technique controls the gate signals of MOSFETs in the boost-buck and bidirectional configurations, which enables precise voltage boosting.During experimental validation, the following parameters are controlled and monitored to ensure repeatability and reliability.
The nominal value of irradiance is measured at 1000W/m2, with an allowable variation of 2%. The ambient temperature should be maintained at 25 °C with an allowable variation of 2 °C, and the PV module temperature should be maintained at 25 °C. The load type preferred in this proposed converter is a dump resistive load, with a variation from 1 kΩ to 47 kΩ, lasting from 0.3 sec to 0.6 sec. The semiconductor devices and the passive components are selected with recommended safety margins to ensure reliable operation under transient and faulty conditions. The voltage and current ratings are selected 1.3 to 1.5 times higher than the maximum calculated stress, while the thermal limits are maintained below 80% of the device-rated junction temperature.
Additionally, it incorporates dead-time insertion to prevent shoot-through in the switching devices.A control signal computed fromthe MPPT technique is then sent tothe TLP250 drive circuit, which activates its internal LED. This LED emits light, which is detected by the photo detector within the TLP250.Upon detection, the output transistor is triggered, allowing a high current to flow to the gate of the power device. This energizes the MOSFET (S1), which enables it to switch on and off rapidly to adjust the boost converter operation.
5.2. Experimental Results and Discussion
The experimental results are recorded using a 4-channel Digital Storage Oscilloscope (DSO). The boost converter's output response is shown in Figure 30. Here, the solid blue line represents a steady-state PV input voltage of 34V, measured at 10V/div, while the pink line indicates a DC bus voltage of approximately 36.10V, measured at 10V/div.During the load variation from 1k to 47k, the system consistently maintains a steady voltage of 36.10Vat 50V/div and remains stable, as shown in Figure 31.
Boost converter switching pulse ‘S1’ waveform and L1current waveform are shown in Figure 32. DSO displays a solidblue waveform where the duty cycle ranges at 60%. The time periodindicatesthe signal changes over time in a periodic pattern. The inductor current measures at 2A, respectively.
The converter is measured for variation in duty cycle from 60% to 40% with PV input voltage of 34V,measuredat 10V/div. The switching pulse ‘Q1’ waveform at 50V/div,and L1 current waveform at 5A/div are shown in Figure 33. The generated DC bus load voltage is shown in Figure 34, measured at 36.10V with a 20V/div scale, whilemaintaining constant voltage regulation.
Theconverter’sswitching pulse waveform of ‘S2’ and ‘S3’in bidirectional mode are displayed in Figure 35. The solid blue and pink lines represent the switching pulses over the period of time. The blue lineindicatesthe duty cycle ranges at 50% of ‘S2’, where the pink line indicates the duty cycle ranges at 50% of ‘S3’, respectively. The battery voltage is measured at 12V, and the DC bus voltage is measured at 36.10V, respectively.
To validate the transient conditions of the system, the converter is measured at variation in load changes from 1k to 47k at 20V/div, shown in Figure 36. The converter always maintains better voltage regulation at the load side and improved stability under dynamic response conditions. Finally, the overall performance curve of the system is presented in Figure 37.
6. Discussion
The proposed smart energy management strategy incorporating grid, storage, and dump resistive load can provide an optimal solution for maximizing renewable energy utilization, improving overall system efficiency, enhancing the stability of the DC bus voltage, ensuring reliable operation under all conditions, while balancing the cost and performance of the system.
The simulation and experimental findings of the suggested system are discussed in Table 10, together with the parameters interpretation and similarity. The proposed system lessens stress and extends the battery's lifespan by modifying charging modes according to the battery condition. In order to reduce charging time without sacrificing safety, it dynamically adjusts voltage and current. Furthermore, it ensures safe and dependable charging in a variety of circumstances, minimizing energy loss and enhancing performance while maintaining optimal power delivery throughout the charging cycle. The use of cutting-edge deep learning techniques for more accurate fault detection and predictive control in EV batteries is part of the research's future scope. The system's efficiency can be further improved by increasing its compatibility with various renewable energy sources. The proposed ANN-based controller can be extended through integration with IoT and cloud-based monitoring platforms to overcome the limitations of remote fault diagnosis, scalable monitoring of multiple converters, and adaptive ANN retraining using long term operational data. This will enhance the system scalability, support predictive maintenance, and improve reliability in large-scale PV and microgrid applications.
7. Conclusions
A new multifunctional converter-based smart energy management system utilizing Solar PV and Wind sources for Electric Vehicle applications is introduced in this article.To promote efficient battery charging, discharging, and enhanced protection from faults, an artificial neural network (ANN) approach is incorporated. The multifunctional structureincreases efficiency by upto 95.4%, lowers voltage regulation error to less than 1%, andincorporates an ANN approach, which allowsreal-time monitoring, intervention, and estimation of faults within 15ms. In comparison with existing topologies, the suggested converter significantlyperforms under dynamicresponse scenariosand promotes improved stability. Theconverter’s performance is evaluated through the MATLAB Simulink toolbox.In addition, a 1kW hardware prototype was built, developed, tested, and validated the reliability of the system.
Author Contributions
Conceptualization, N.K.M ; methodology, G.H.; software, V.H.; validation, N.K.M., G.H. and V.H.; formal analysis, G.H. and V.H.; investigation, N.K.M.; resources, S.N.K.; data curation, N.K.M; writing—V.R; writing—review and editing, V.R.; visualization, V.R; supervision, N.K.M; project administration, S.N.K; funding acquisition, S.N.K. All authors have read and agreed to the published version of the manuscript.
Data Availability Statement
Not applicable.
Acknowledgments
The authors have reviewed and edited the output and take full responsibility for the content of this publication.
Conflicts of Interest
The authors declare no conflicts of interest.
Abbreviations
The following abbreviations are used in this manuscript:
| EV | Electric Vehicle |
| WECS | Wind Energy Conversion System |
| ANN | Artificial Neural Network |
| PWM | Pulse Width Modulation |
| PV | Photovoltaic |
| SOC | State of Charging |
| LED | Light Emitting Diode |
| VMC | Voltage Multiplier Cell |
| MPPT | Maximum Power Point tracker |
| PID | Proportional-Integral-Derivative |
References
- Sayed, K.; Almutairi, A.; Albagami, N.; Alrumayh, O.; Abo-Khalil, A.G.; Saleeb, H. A Review of DC-AC Converters for Electric Vehicle Applications. Energies 2022, 15, 1241. [Google Scholar] [CrossRef]
- Kim, I.; Park, J.W. Multifunctional Integrated DC–DC Converter for Electric Vehicles. IEEE Transactions on Power Electronics 2024, vol. 39(no. 6), 7252–7263. [Google Scholar] [CrossRef]
- Litrán, S.P.; Durán, E.; Semião, J.; Díaz-Martín, C. Multiple-Output DC–DC Converters: Applications and Solutions. Electronics 2022, 11, 1258. [Google Scholar] [CrossRef]
- Pan, L.; Zhang, C. An Integrated Multifunctional Bidirectional AC/DC and DC/DC Converter for Electric Vehicles Applications. Energies 2016, 9, 493. [Google Scholar] [CrossRef]
- Martinez-Vera, E; Banuelos-Sanchez, P. Review of Bidirectional DC-DC Converters and Trends in Control Techniques for Applications in Electric Vehicles. IEEE Latin America Transactions 2024, vol. 22(no. 2), 144–155. [Google Scholar] [CrossRef]
- Shi, C.; Wang, S. A Study on the Device Topology and Control Strategy of a Hybrid Three-Port Photovoltaic Energy Storage Grid-Connected Converter. Electronics 2025, 14, 1966. [Google Scholar] [CrossRef]
- Maurya, V.P; Singh, R.K. A Multifunction Power Converter with Multimode Capabilities for Low Power Electric Vehicles. IEEE Transactions on Power Electronics 2025, vol. 40(no. 9), 13778–13791. [Google Scholar] [CrossRef]
- BurakTekgun; DidemTekgun; Alan, Irfan. A multi-functional quasi-single stage bi-directional charger topology for electric vehicles. Ain Shams Engineering Journal 2024, Volume 15(Issue 3), 102471. [Google Scholar] [CrossRef]
- Dhananjaya, M.; Potnuru, D.; Manoharan, P.; Alhelou, H.H. Design and Implementation of Single-Input-Multi-Output DC-DC Converter Topology for Auxiliary Power Modules of Electric Vehicle. IEEE Access 2022, vol. 10, 76975–76989. [Google Scholar] [CrossRef]
- Kim, I.; Park, J.W. Multifunctional Integrated DC–DC Converter for Electric Vehicles. IEEE Transactions on Power Electronics 2024, vol. 39(no. 6), 7252–7263. [Google Scholar] [CrossRef]
- Challoob, A.F.; Bin Rahmat, N.A.; A/L Ramachandaramurthy, V.K.; Humaidi, AJ. Energy and battery management systems for electrical vehicles: A comprehensive review & recommendations. Energy Exploration & Exploitation 2023, 42(1), 341–372. [Google Scholar] [CrossRef]
- Dini, P.; Saponara, S.; Colicelli, A. Overview on Battery Charging Systems for Electric Vehicles. Electronics 2023, 12, 4295. [Google Scholar] [CrossRef]
- Rajeswari, V.; Mohanty, N.K. A Robust Controller for a Novel Single-Switch Non-Isolated Converter with Low-Order Ripples for Electric Vehicle Chargers. Sustainability 2024, 16, 10463. [Google Scholar] [CrossRef]
- Wang, Z.; Su, X.; Zeng, N.; Jiang, J. Overview of Isolated Bidirectional DC–DC Converter Topology and Switching Strategies for Electric Vehicle Applications. Energies 2024, 17, 2434. [Google Scholar] [CrossRef]
- Recalde, A.; Cajo, R.; Velasquez, W.; Alvarez-Alvarado, M.S. Machine Learning and Optimization in Energy Management Systems for Plug-In Hybrid Electric Vehicles: A Comprehensive Review. Energies 2024, 17, 3059. [Google Scholar] [CrossRef]
- Lipu, M.S.H.; Mamun, A.A.; Ansari, S.; Miah, M.S.; Hasan, K.; Meraj, S.T.; Abdolrasol, M.G.M.; Rahman, T.; Maruf, M.H.; Sarker, M.R.; et al. Battery Management, Key Technologies, Methods, Issues, and Future Trends of Electric Vehicles: A Pathway toward Achieving Sustainable Development Goals. Batteries 2022, 8, 119. [Google Scholar] [CrossRef]
- Kalaivani, P.; Joice, C.S. Design and modelling of a neural network-based energy management system for solar PV, fuel cell, battery and ultracapacitor-based hybrid electric vehicle. ElectrEng 2024, 106, 689–709. [Google Scholar] [CrossRef]
- Leal, W, C.;Godinho, M,O.; Bastos, R, F.; de Aguiar, C, R.; Fuzato, G, H, F.; Machado, R, Q. Cascaded Interleaved DC–DC Converter for a Bidirectional Electric Vehicle Charging Station. IEEE Transactions on Industrial Electronics 2024, vol. 71(no. 4), 3708–3717. [CrossRef]
- Wang, T.; Zhang, J.; Li, X.; Chen, S.; Ma, J.; Han, H. The Control Strategies for Charging and Discharging of Electric Vehicles in the Vehicle–Grid Interaction Modes. World Electr. Veh. J. 2024, 15, 468. [Google Scholar] [CrossRef]
- Milton, C.; Sivarani, T. S. Monarch butterfly optimization based energy management system for electric vehicle with interleaved landsman converter. Automatika 2024, 66(1), 43–68. [Google Scholar] [CrossRef]
- De Melo, R. R.; Tofoli, F. L.; Daher, S.; Antunes, F. L. M. Interleaved bidirectional DC–DC converter for electric vehicle applications based on multiple energy storage devices. Electrical Engineering 2020, 102(4), 2011–2023. [Google Scholar] [CrossRef]
- Ma, Lin; Sun, Kai; Teodorescu, R; Guerrero, J; XinminJin, M. An integrated multifunction DC/DC converter for PV generation systems. IEEE International Symposium on Industrial Electronics; 2010; pp. 2205–2210. [Google Scholar] [CrossRef]
- Pan, L.; Zhang, C. An Integrated Multifunctional Bidirectional AC/DC and DC/DC Converter for Electric Vehicles Applications. Energies 2016, 9, 493. [Google Scholar] [CrossRef]
- Goud, P.C.D.; Gupta, R. Dual-mode control of multi-functional converter in solar PV system for small off-grid applications. IET Power Electronics 2019, 12, 2851–2857. [Google Scholar] [CrossRef]
- Osheba, M.S.; Lashine, A.E.; Mansour, A.S. Design, implementation and performance evaluation of multi-function boost converter. Sci Rep 2023, 13, 4276. [Google Scholar] [CrossRef] [PubMed]
- Wu, Y.-E.; Hong, R.-R. Multi-Functional Isolated Three-Port Bidirectional DC/DC Converter for Photovoltaic Systems. Sustainability 2022, 14, 11169. [Google Scholar] [CrossRef]
- Avila, A.; Garcia-Bediaga, A.; Alzuguren, I; Vasić, M; Rujas, A. A Modular Multifunction Power Converter Based on a MultiwindingFlyback Transformer for EV Application. IEEE Transactions on Transportation Electrification 2022, vol. 8(no. 1), 168–179. [Google Scholar] [CrossRef]
- Ozdemir, E.; Kavaslar, F. A new multifunctional power converter for grid connected residential photovoltaic applications. IEEE Energy Conversion Congress and Exposition 2009, 2650–2656. [Google Scholar] [CrossRef]
- Wu, H.; Xu, P.; Hu, H.; Zhou, Z.; Xing, Y. Multiport Converters Based on Integration of Full-Bridge and Bidirectional DC–DC Topologies for Renewable Generation Systems. IEEE Transactions on Industrial Electronics 2014, vol. 61(no. 2), 856–869. [Google Scholar] [CrossRef]
- RicsaAlhassaneSoumana; JumaSaulo, Michael; MainaMuriithi, Christopher. New control strategy for multifunctional grid-connected photovoltaic systems. Results in Engineering2022 2022, Volume 14, 100422. [Google Scholar] [CrossRef]
- Singh, A.K.; Pathak, M.K. Single-stage ZETA-SEPIC-based multifunctional integrated converter for plug-in electric vehicles. IET Electr. Syst. Transp. 2018, 8, 101–111. [Google Scholar] [CrossRef]
- Laksono, A.B.; MulyoUtomo, W.; NurAtikah, A.I.; Abu Bakar, A.; Bachri, A.; Widjanarko. Battery Charger with Bridgeless Power Factor Correction using PID-ANN Controller. IEEE 2nd International Conference on Electrical Engineering, Computer and Information Technology (ICEECIT), Jember, Indonesia, 2024; pp. 257–261. [Google Scholar] [CrossRef]
- Alrubaie, A.J.; Swadi, M.; Salem, M.; Richelli, A.; Bughneda, A.; Kamarol, M. Systematic Review of Bidirectional, Multiport Converter Structures and Their Derivatives: A Case Study of Bidirectional Dual Input Dual Output Converters. Energies 2024, 17, 1575. [Google Scholar] [CrossRef]
- Ashok, B.; Michael, P.A. Integration of cascaded controllers for super-lift Luo converter with buck converter in solar photovoltaic and electric vehicle. Analog IntegrCirc Sig Process 2024, 118, 449–466. [Google Scholar] [CrossRef]
- Margaret Amutha, W.; Srinivasan, P. Hybrid Falcon Optimization Algorithm-PID Controller Based Wind Powered Improved Bridgeless CUK Converter for Telecom Applications. Arab J SciEng 2025, 50, 17863–17872. [Google Scholar] [CrossRef]
- Suresh, K.; Parimalasundar, E.; Arunraja, A. Design and Implementation of universal converter using ANN controller. Sci Rep 2025, 15, 3501. [Google Scholar] [CrossRef]
- Kumar, A.N.; Rakesh, K.; SrikanthGoud, B. A dynamic multi-objective control strategy for bidirectional PV grid integration with power quality improvement and intelligent energy management. Energy Exploration & Exploitation 2025, 0(0). [Google Scholar] [CrossRef]
- Sinha, D.; Majumder, S.; Bandyopadhyay, C.; Sharma, H.K. Arithmetic Harris Hawks-Based Effective Battery Charging from Variable Sources and Energy Recovery Through Regenerative Braking in Electric Vehicles, Implying Fractional Order PID Controller. Fractal Fract. 2025, 9, 525. [Google Scholar] [CrossRef]
- Ganesan; Balasubramanian; Susaikani; Augusti Lindiya; Nallusamy; Subashini; Dharmalingam; Uma; Prabaharan; Natarajan. Particle Swarm Optimization Controlled High-Gain Three-Port DC–DC Converter With Reduced Switches and Passive Elements for Electrical Vehicle Charging Station. International Journal of Energy Research 2025, 5599077, 18 pages. [Google Scholar] [CrossRef]
- Zhang, Yi; Xu, Shiyu; Song, Yize; Qi, Wenjie; QiangGuo; Li, Xu. Real-Time Global Optimal Energy Management Strategy for Connected PHEVs Based on Traffic Flow Information. IEEE Transactions on Intelligent Transportation Systems 2024, vol. 25(no. 12), 20032–20042. [Google Scholar] [CrossRef]
- Okwako, O.E.; Lin, Z.-H.; Xin, M.; Premkumar, K.; Rodgers, A.J. Neural Network Controlled Solar PV Battery Powered Unified Power Quality Conditioner for Grid Connected Operation. Energies 2022, 15, 6825. [Google Scholar] [CrossRef]
- Mahar, H.; Munir, H.M.; Soomro, J.B.; Akhtar, F.; Hussain, R.; Elnaggar, M.F.; Kamel, S.; Guerrero, J.M. Implementation of ANN Controller Based UPQC Integrated with Microgrid. Mathematics 2022, 10. [Google Scholar] [CrossRef]
- Subbulakshmy, R.; Palanisamy, R.; Alshahrani, S.; Saleel, C.A. Implementation of Non-Isolated High Gain Interleaved DC-DC Converter for Fuel Cell Electric Vehicle Using ANN-Based MPPT Controller. Sustainability 2024, 16, 1335. [Google Scholar] [CrossRef]
- Qi, Wenjie; Lan, Peng; Yang, Jiaxing; Chen, Yong; Zhang, Yuemeng; Wang, Guojian; Peng, Fei; Hong, Jichao. Multi-U-Style micro-channel in liquid cooling plate for thermal management of power batteries. Applied Thermal Engineering 2024, Volume 256, 123984. [Google Scholar] [CrossRef]
- Sankarananth, S.; Sivaraman, P. Performance enhancement of multi-port bidirectional DC-DC converter using resilient backpropagation neural network method. Sustainable Computing: Informatics and Systems2022 2022, Volume 36, 100783. [Google Scholar] [CrossRef]
- Akpolat, A.N. Dynamic Stabilization of DC Microgrids Using ANN-Based Model Predictive Control. IEEE Transactions on Energy Conversion 2022, vol. 37(no. 2), 999–1010. [Google Scholar] [CrossRef]
- Ramu, Senthil Kumar; IndragandhiVairavasundaram; BalakumarPalaniyappan; Bragadeshwaran, Ashok; BelqasemAljafari. Enhanced energy management of DC microgrid: Artificial neural networks-driven hybrid energy storage system with integration of bidirectional DC-DC converter. Journal of Energy Storage 2024, Volume 88, 111562. [Google Scholar] [CrossRef]
Figure 1.
Pictorial representation of the configuration.
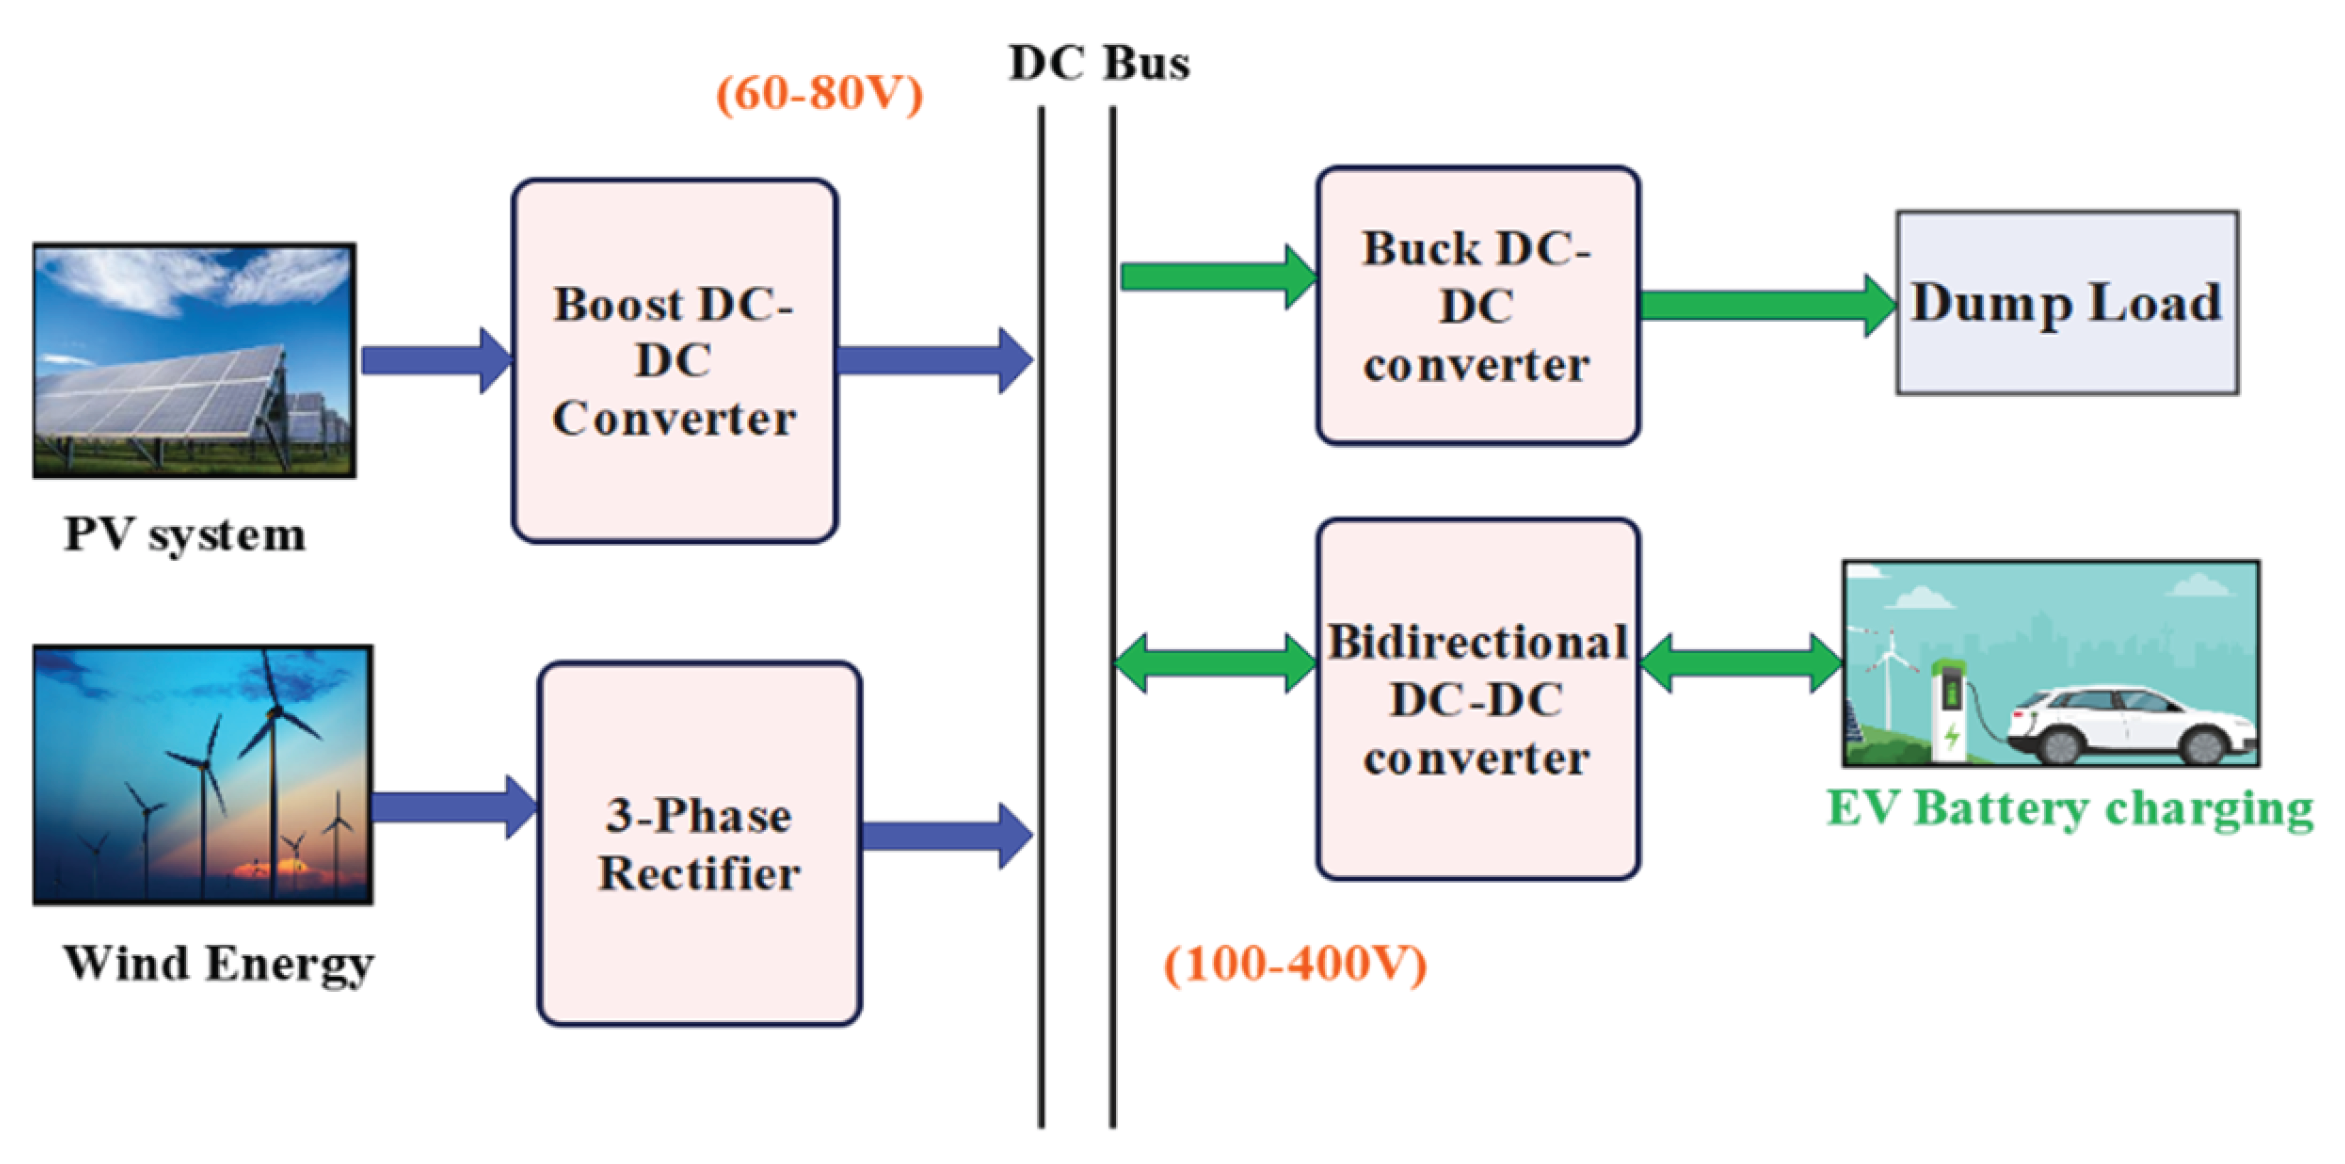
Figure 2.
Converter topology.
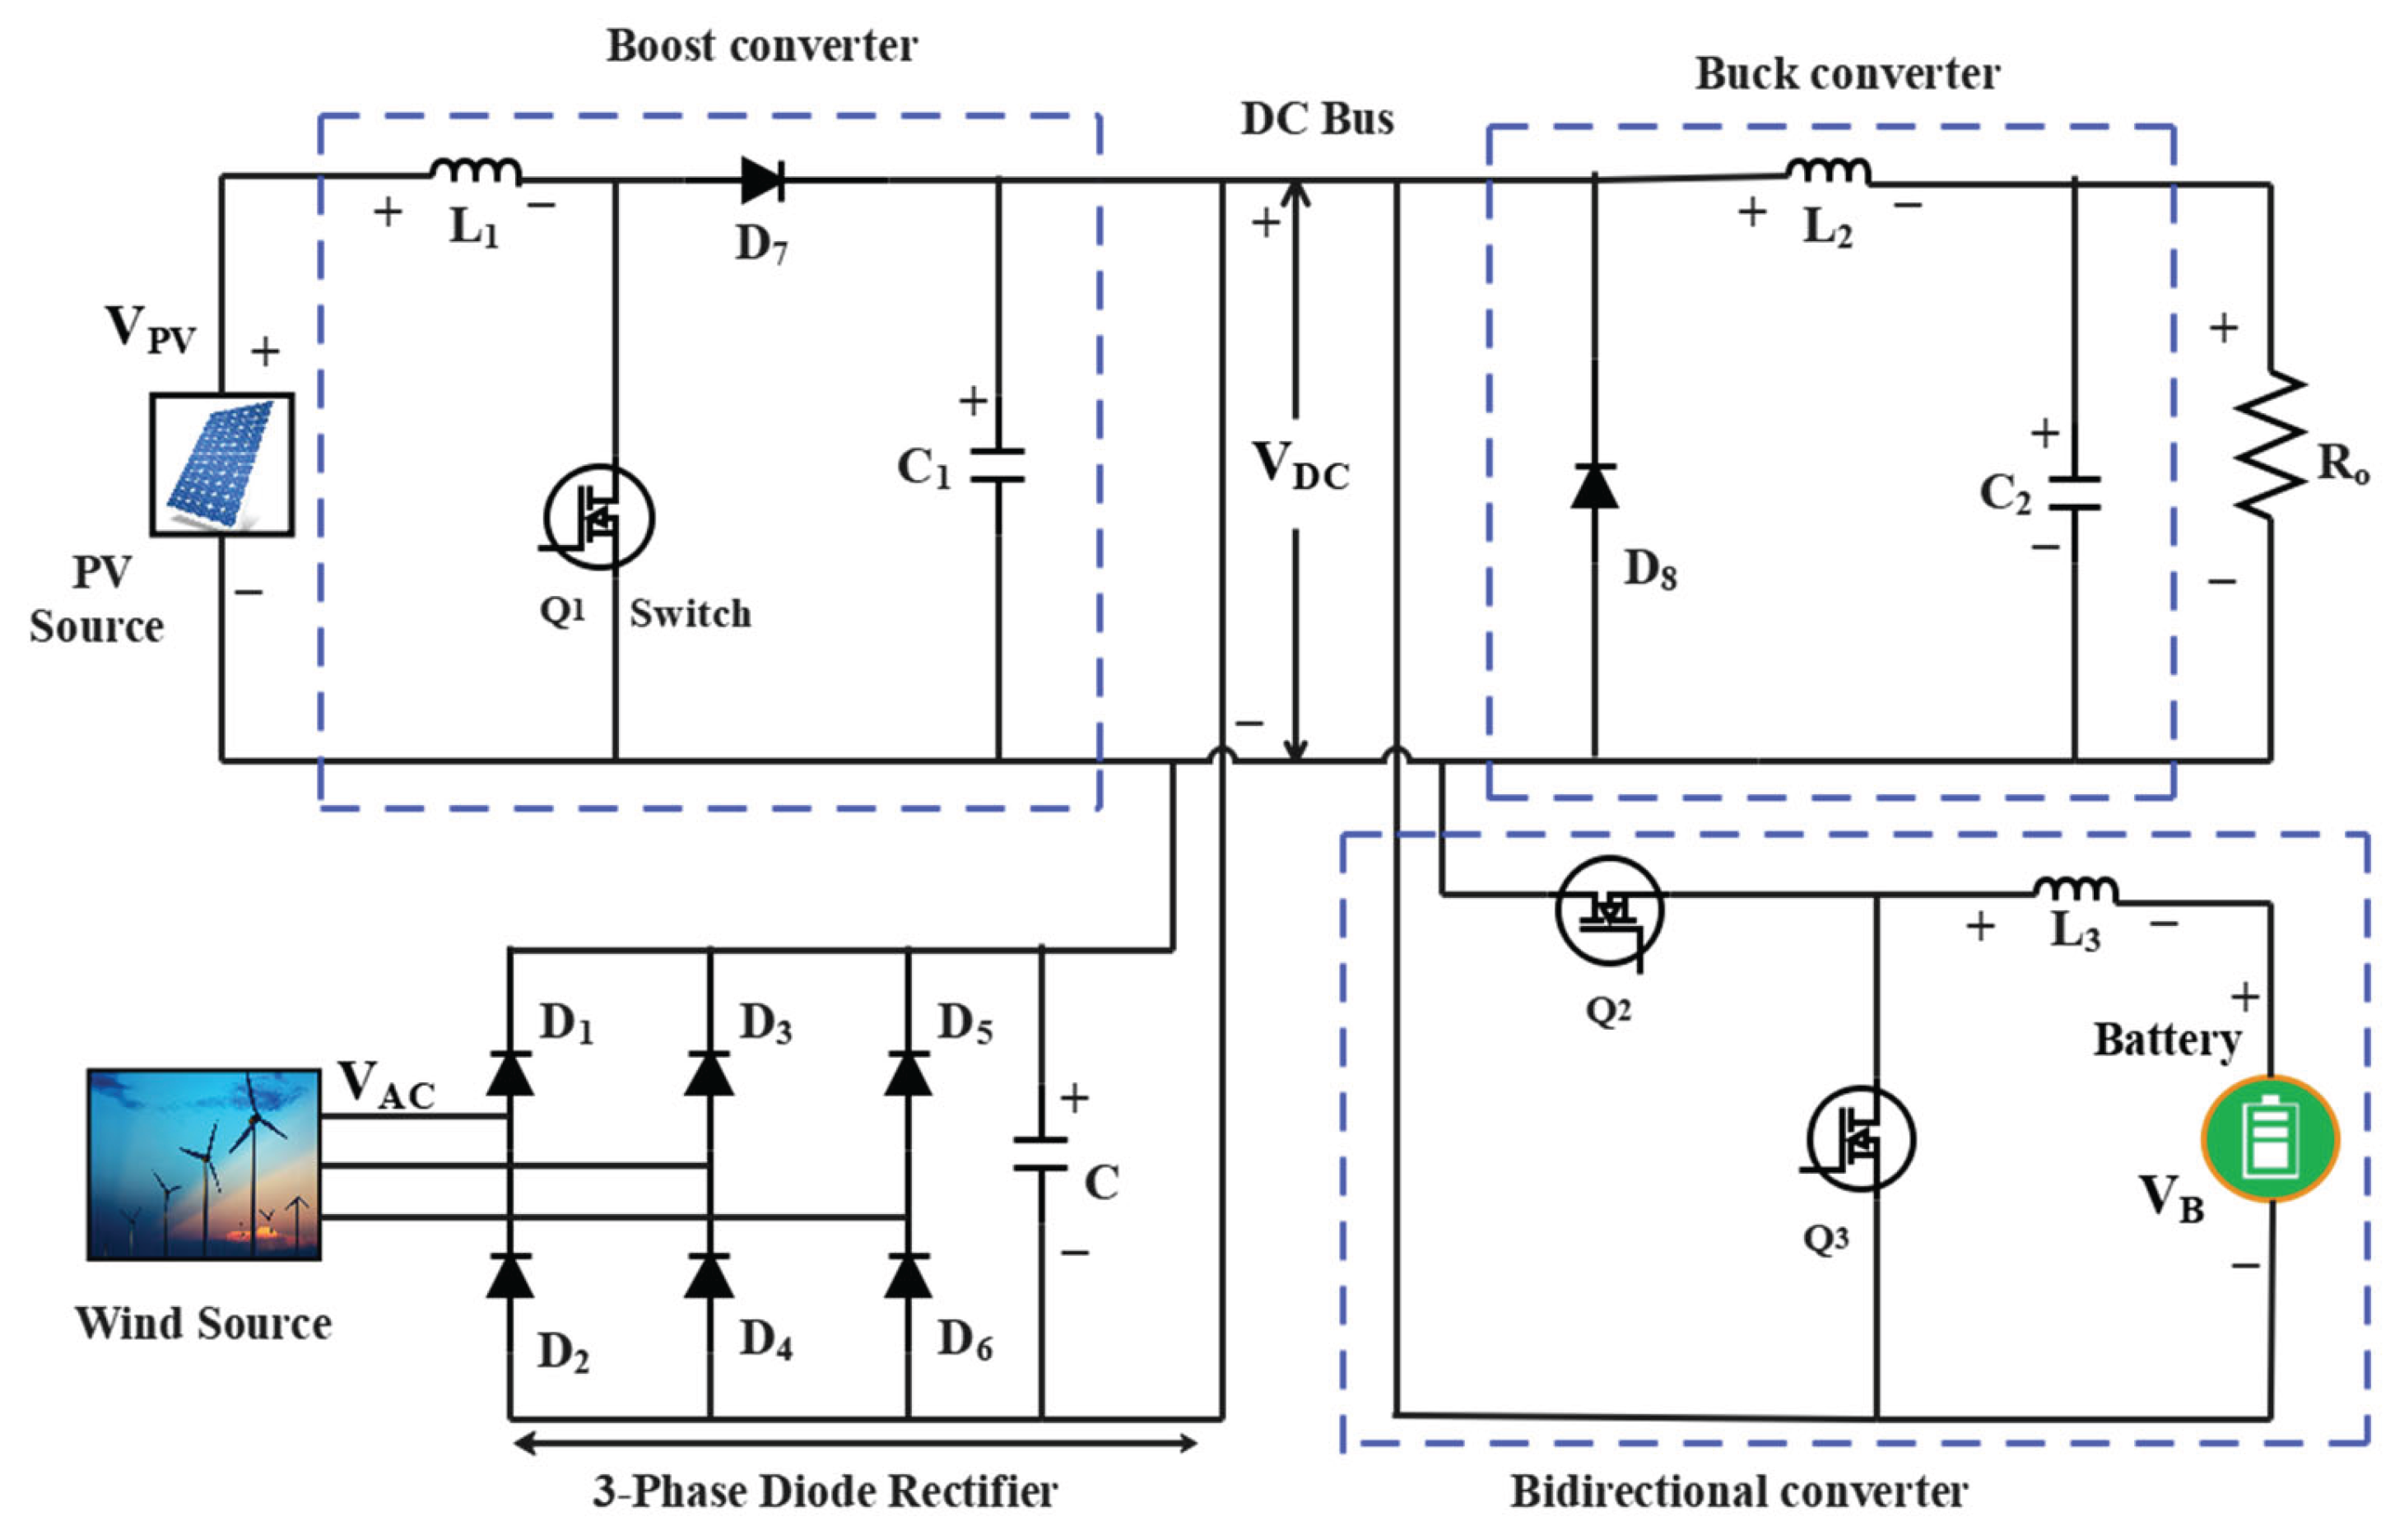
Figure 3.
PV and Wind Mode.
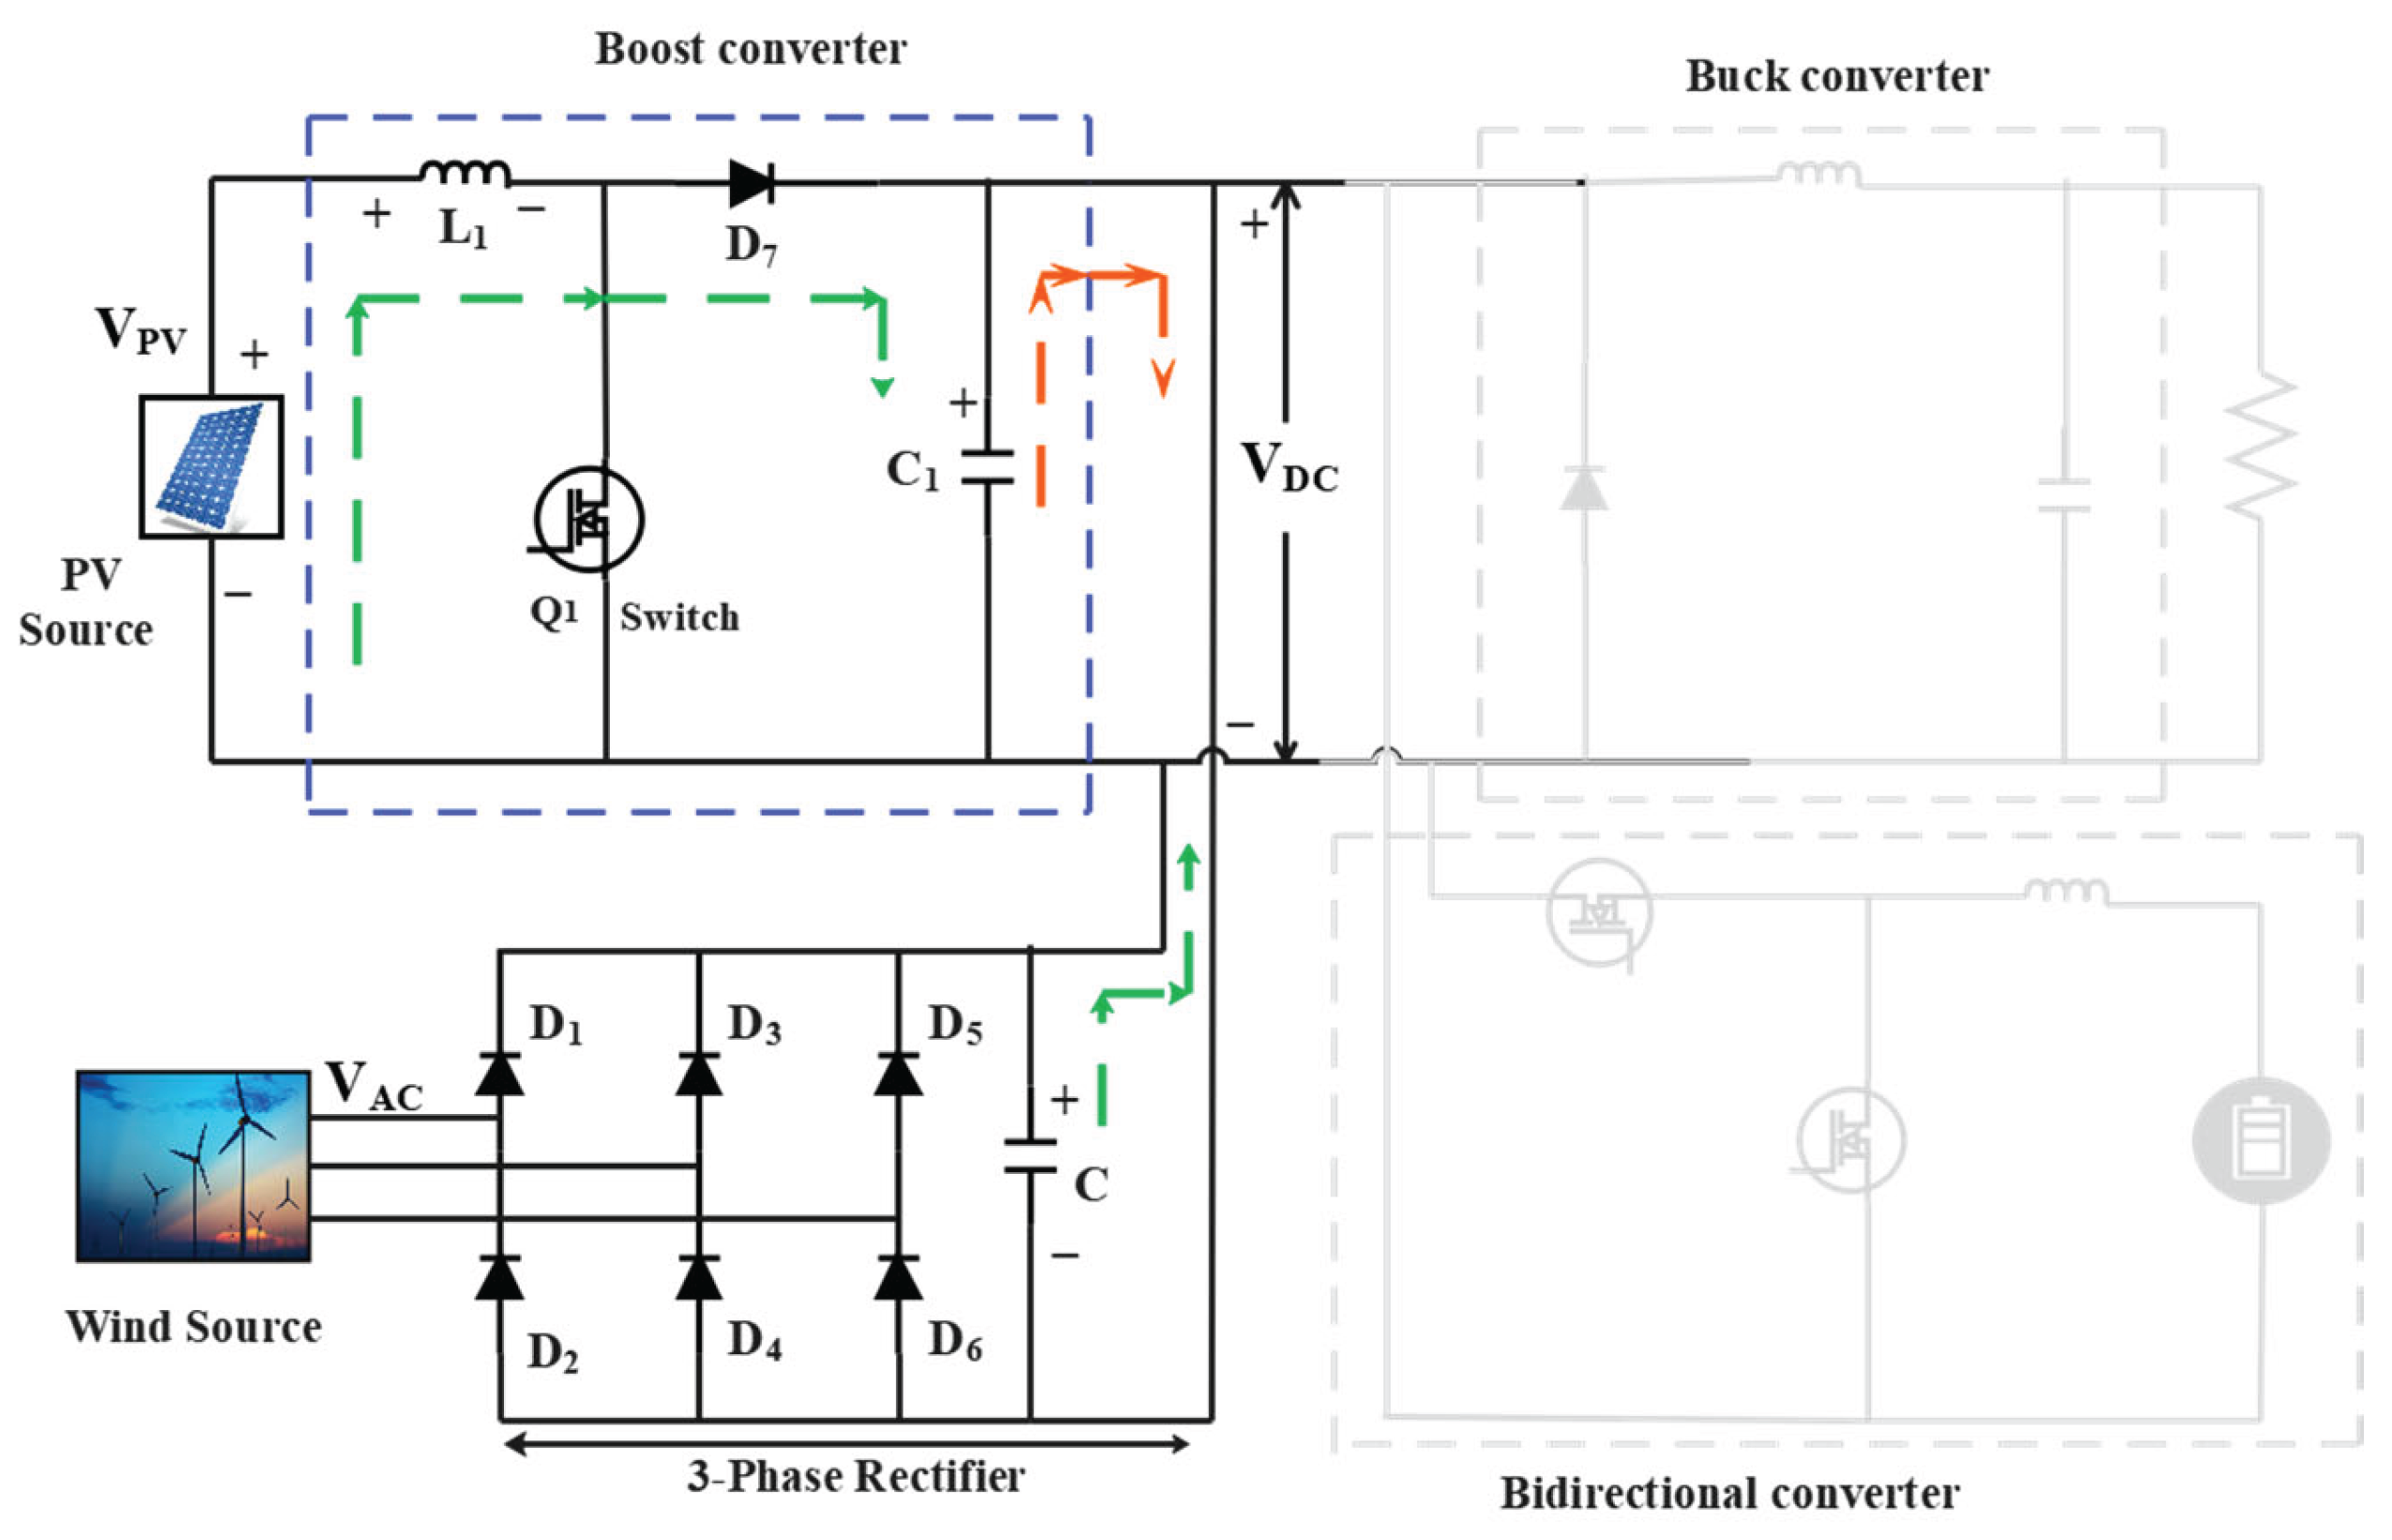
Figure 4.
PV Mode.
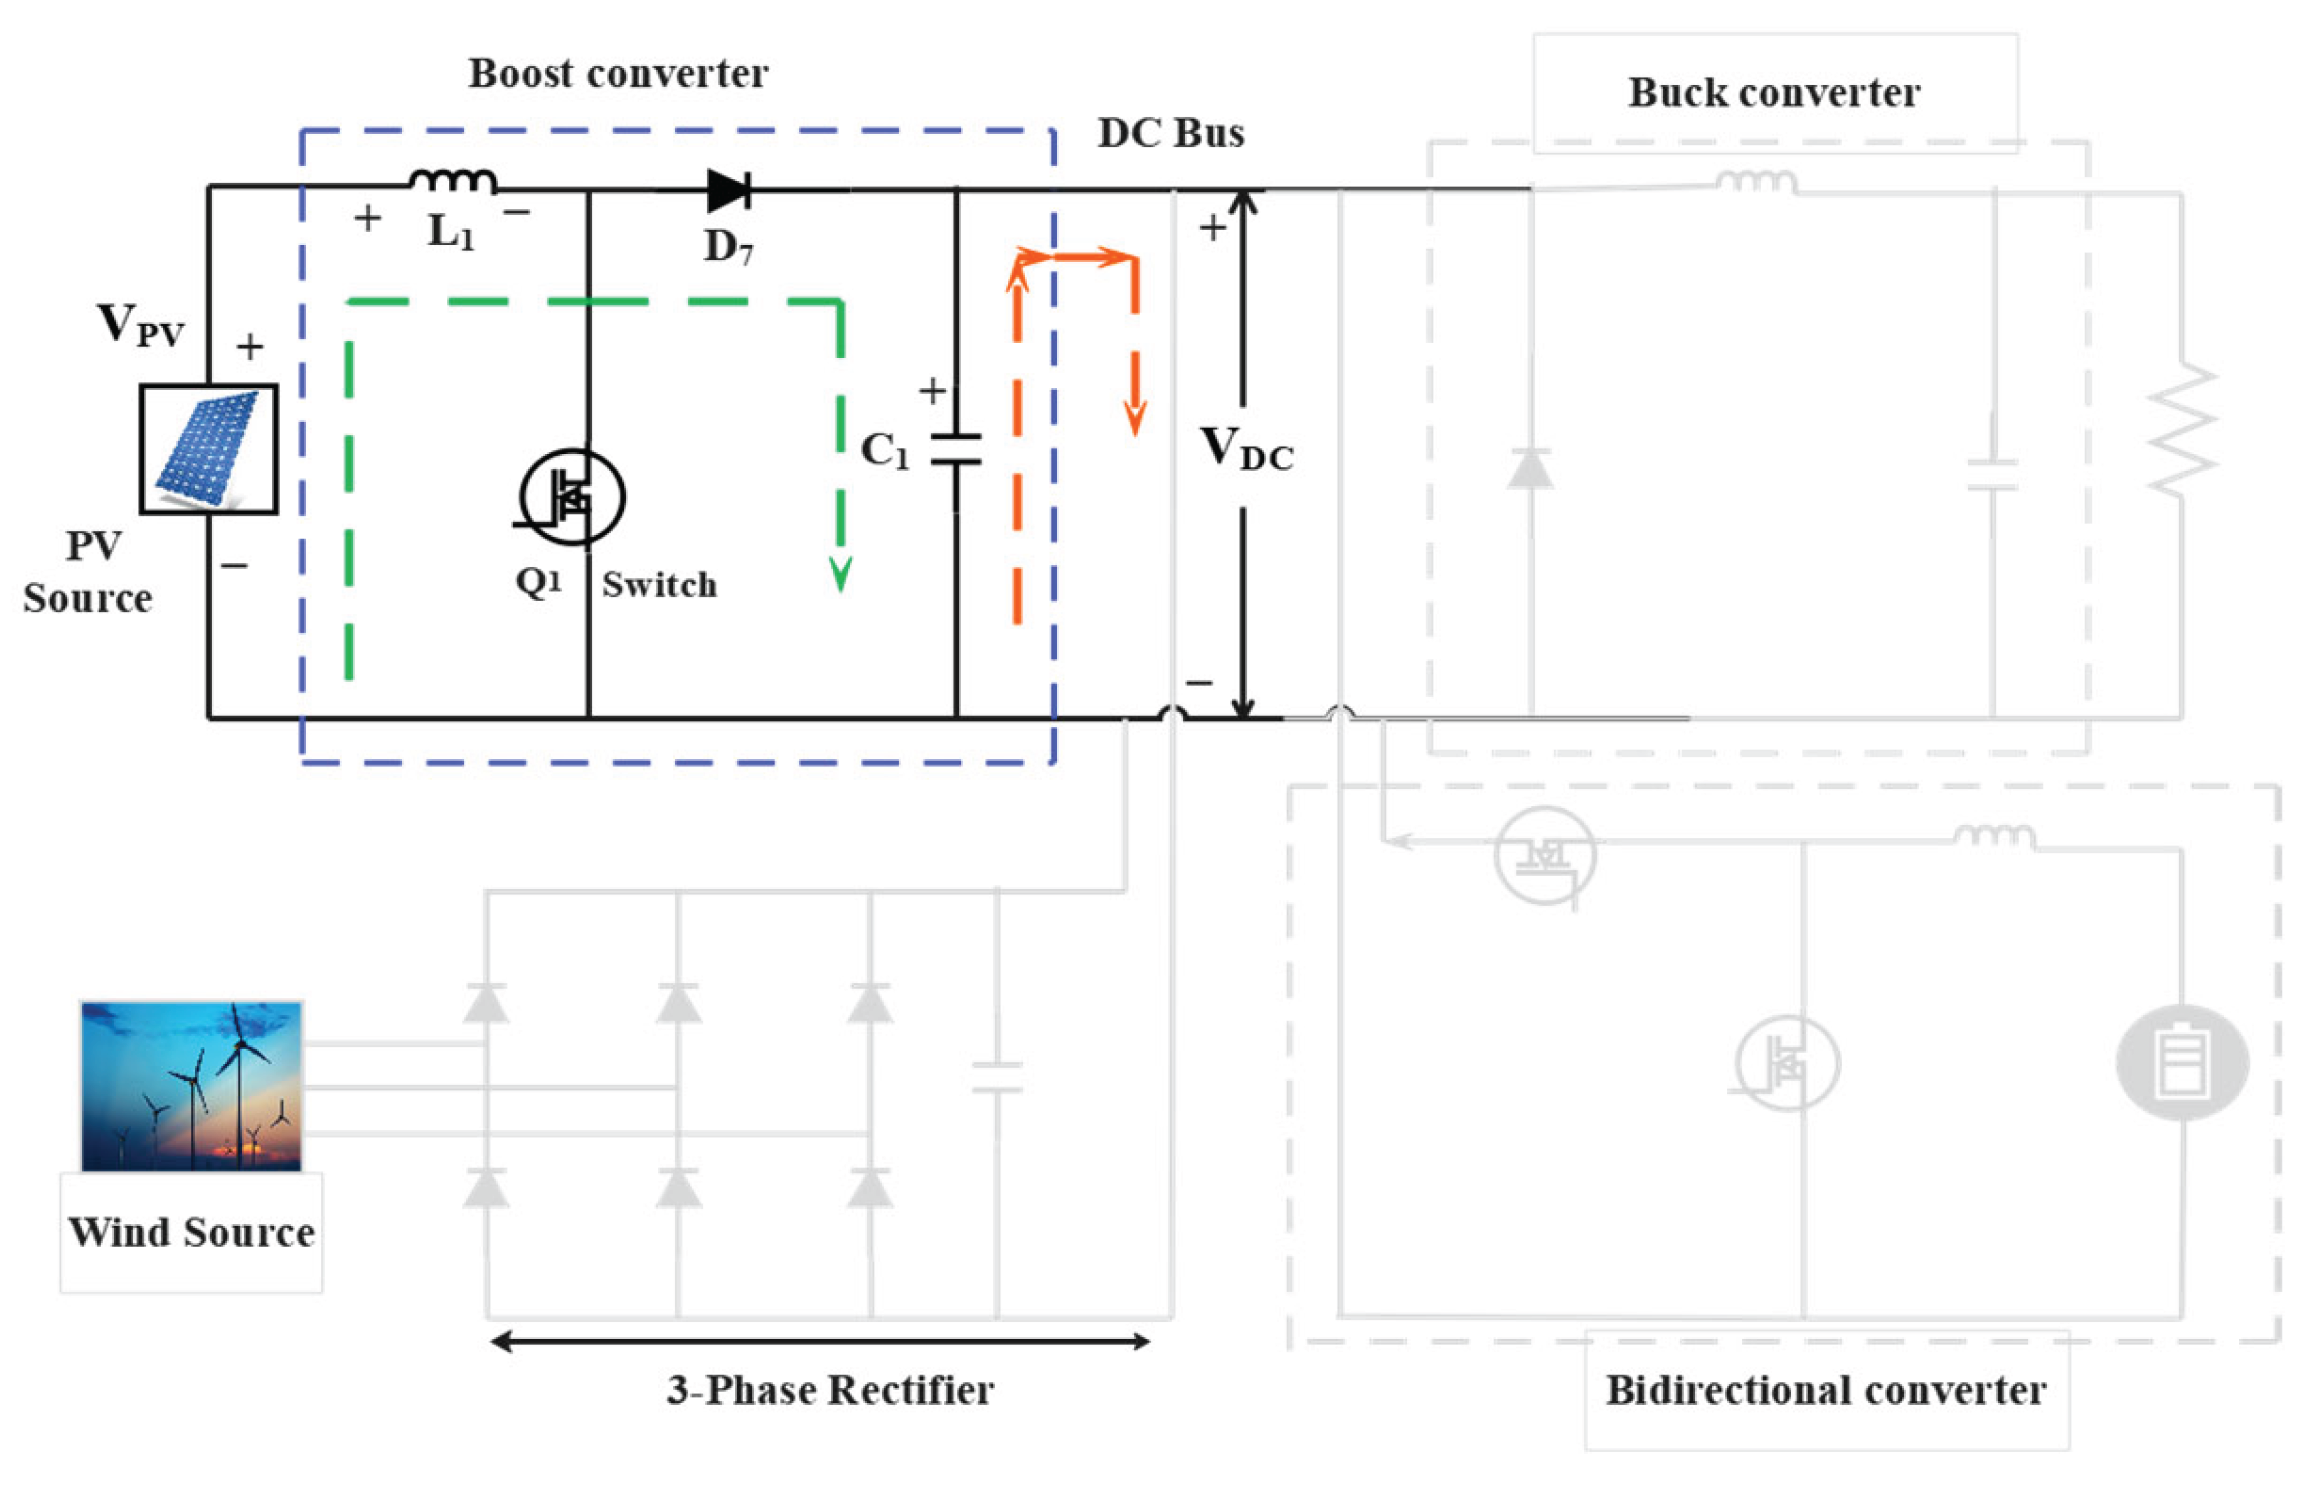
Figure 5.
Wind Mode.
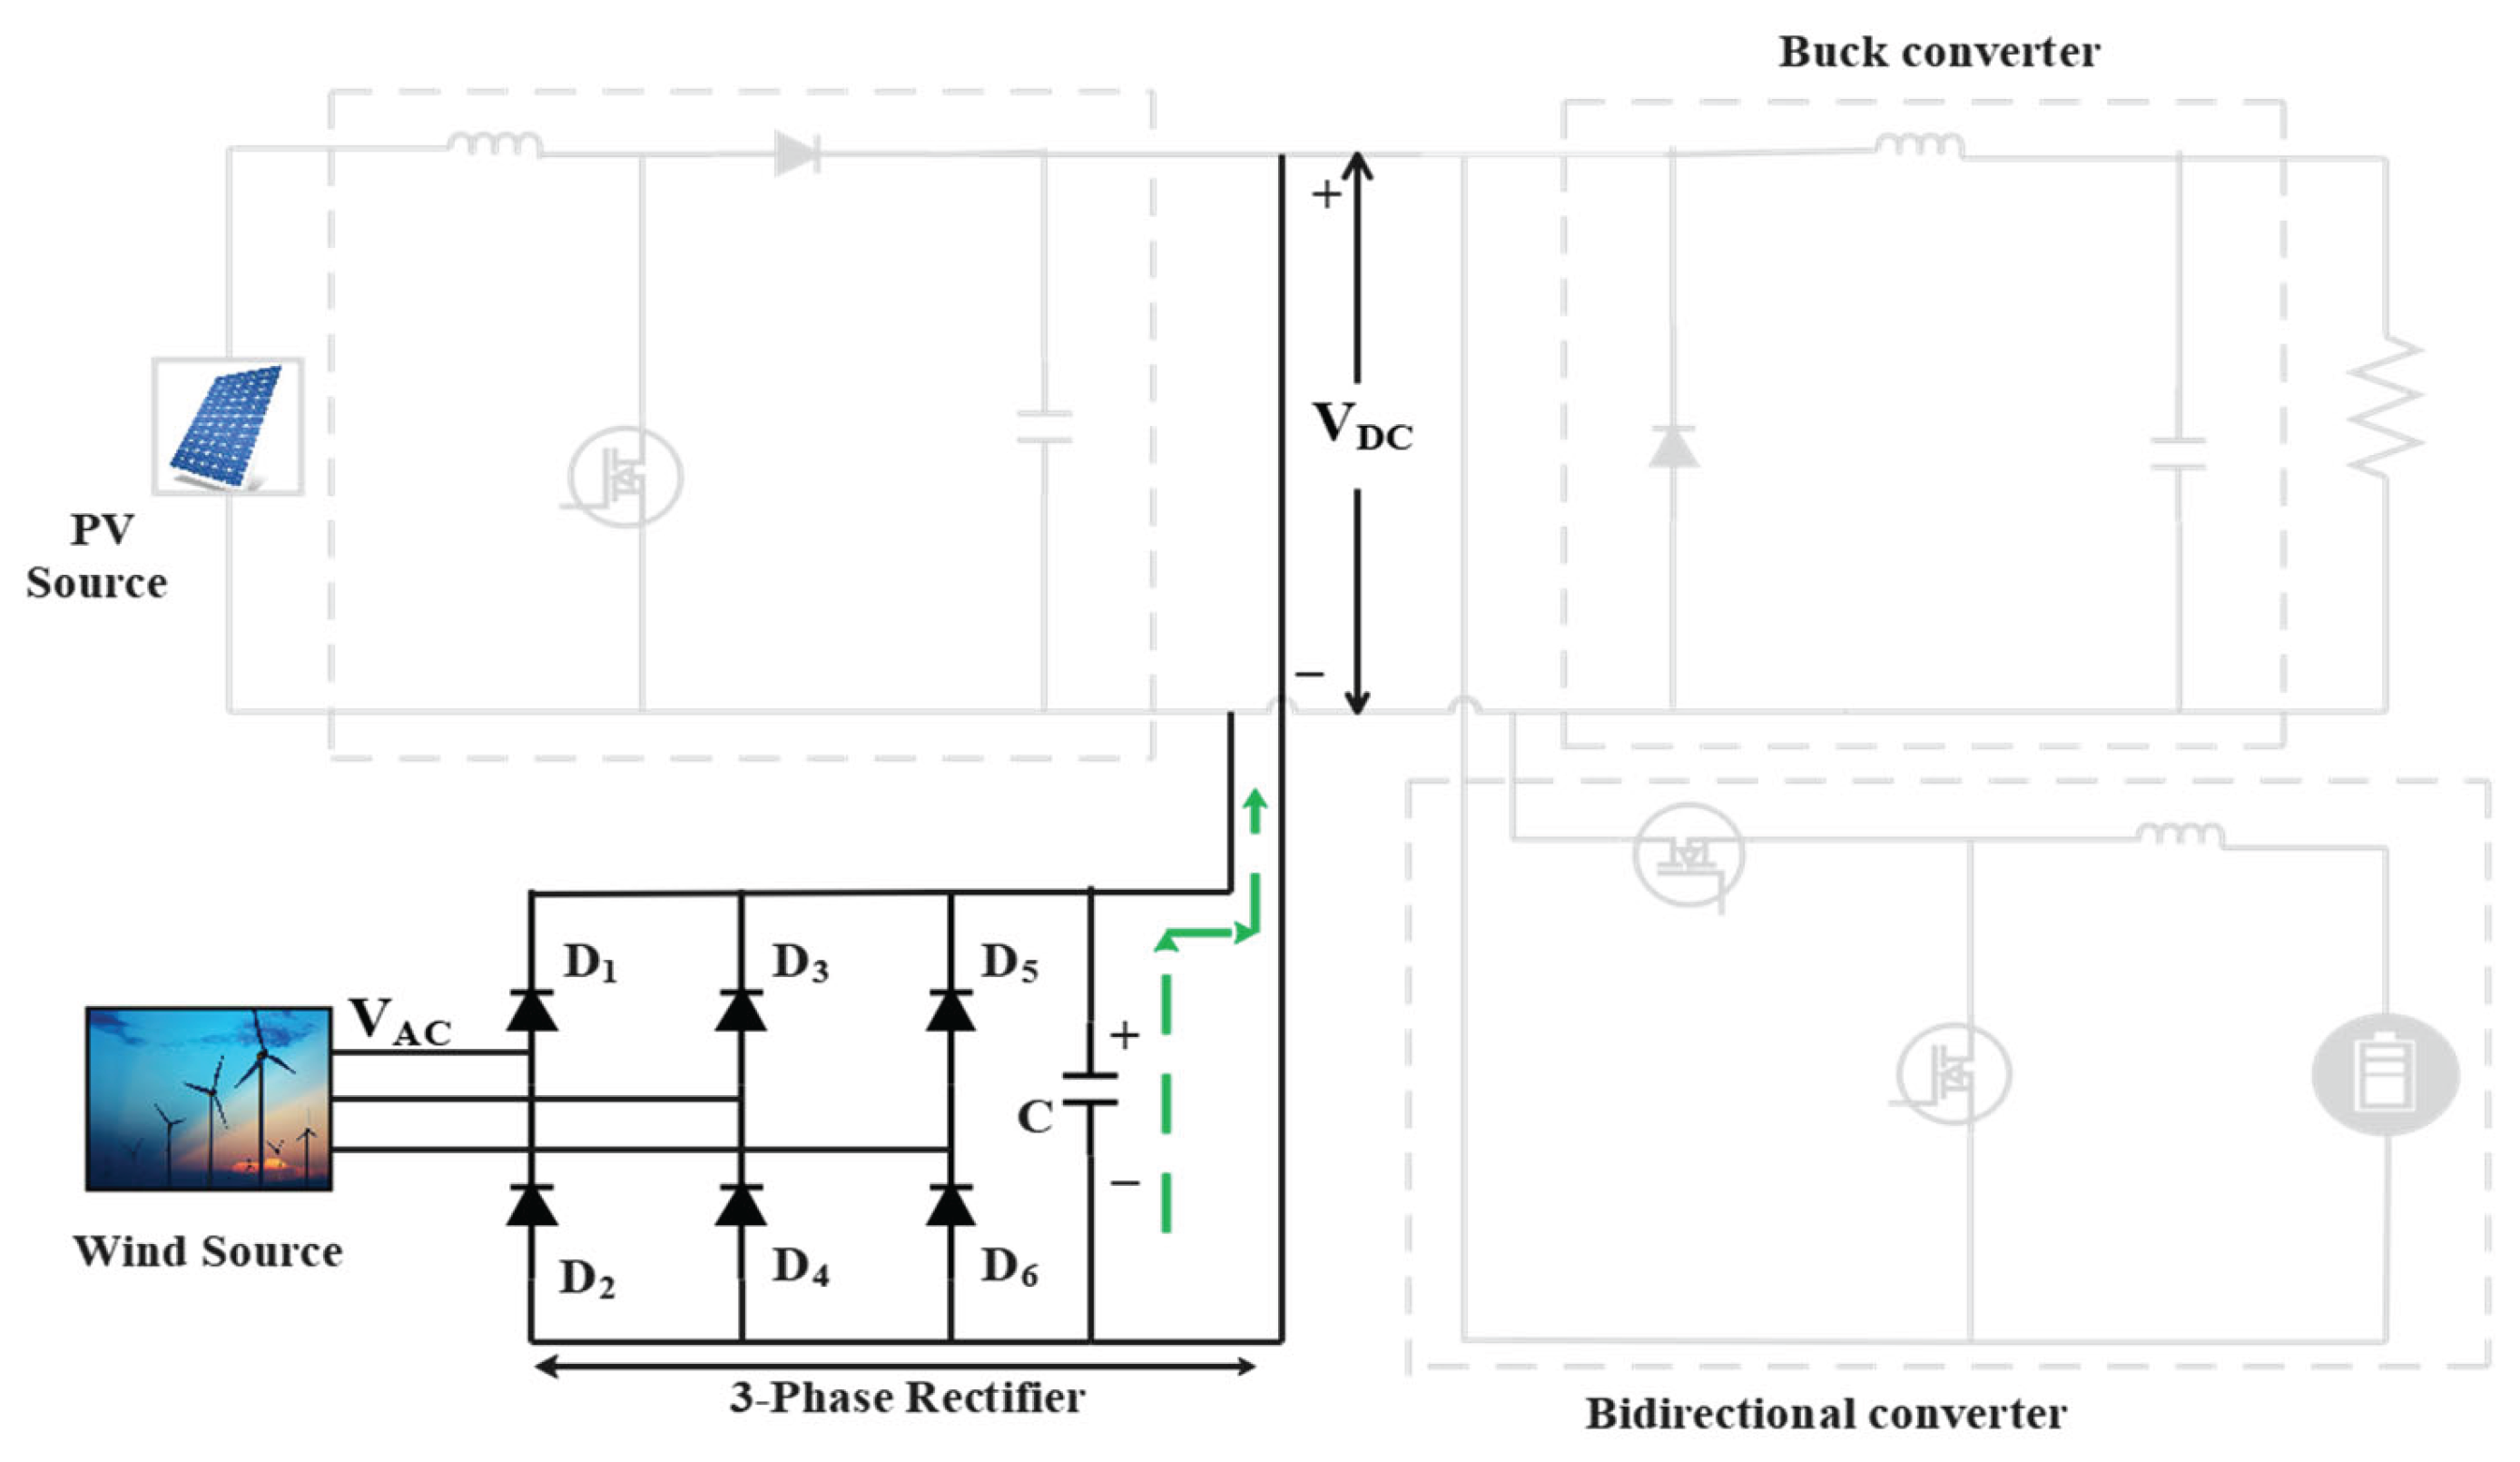
Figure 6.
Battery Charging Mode (G2V).
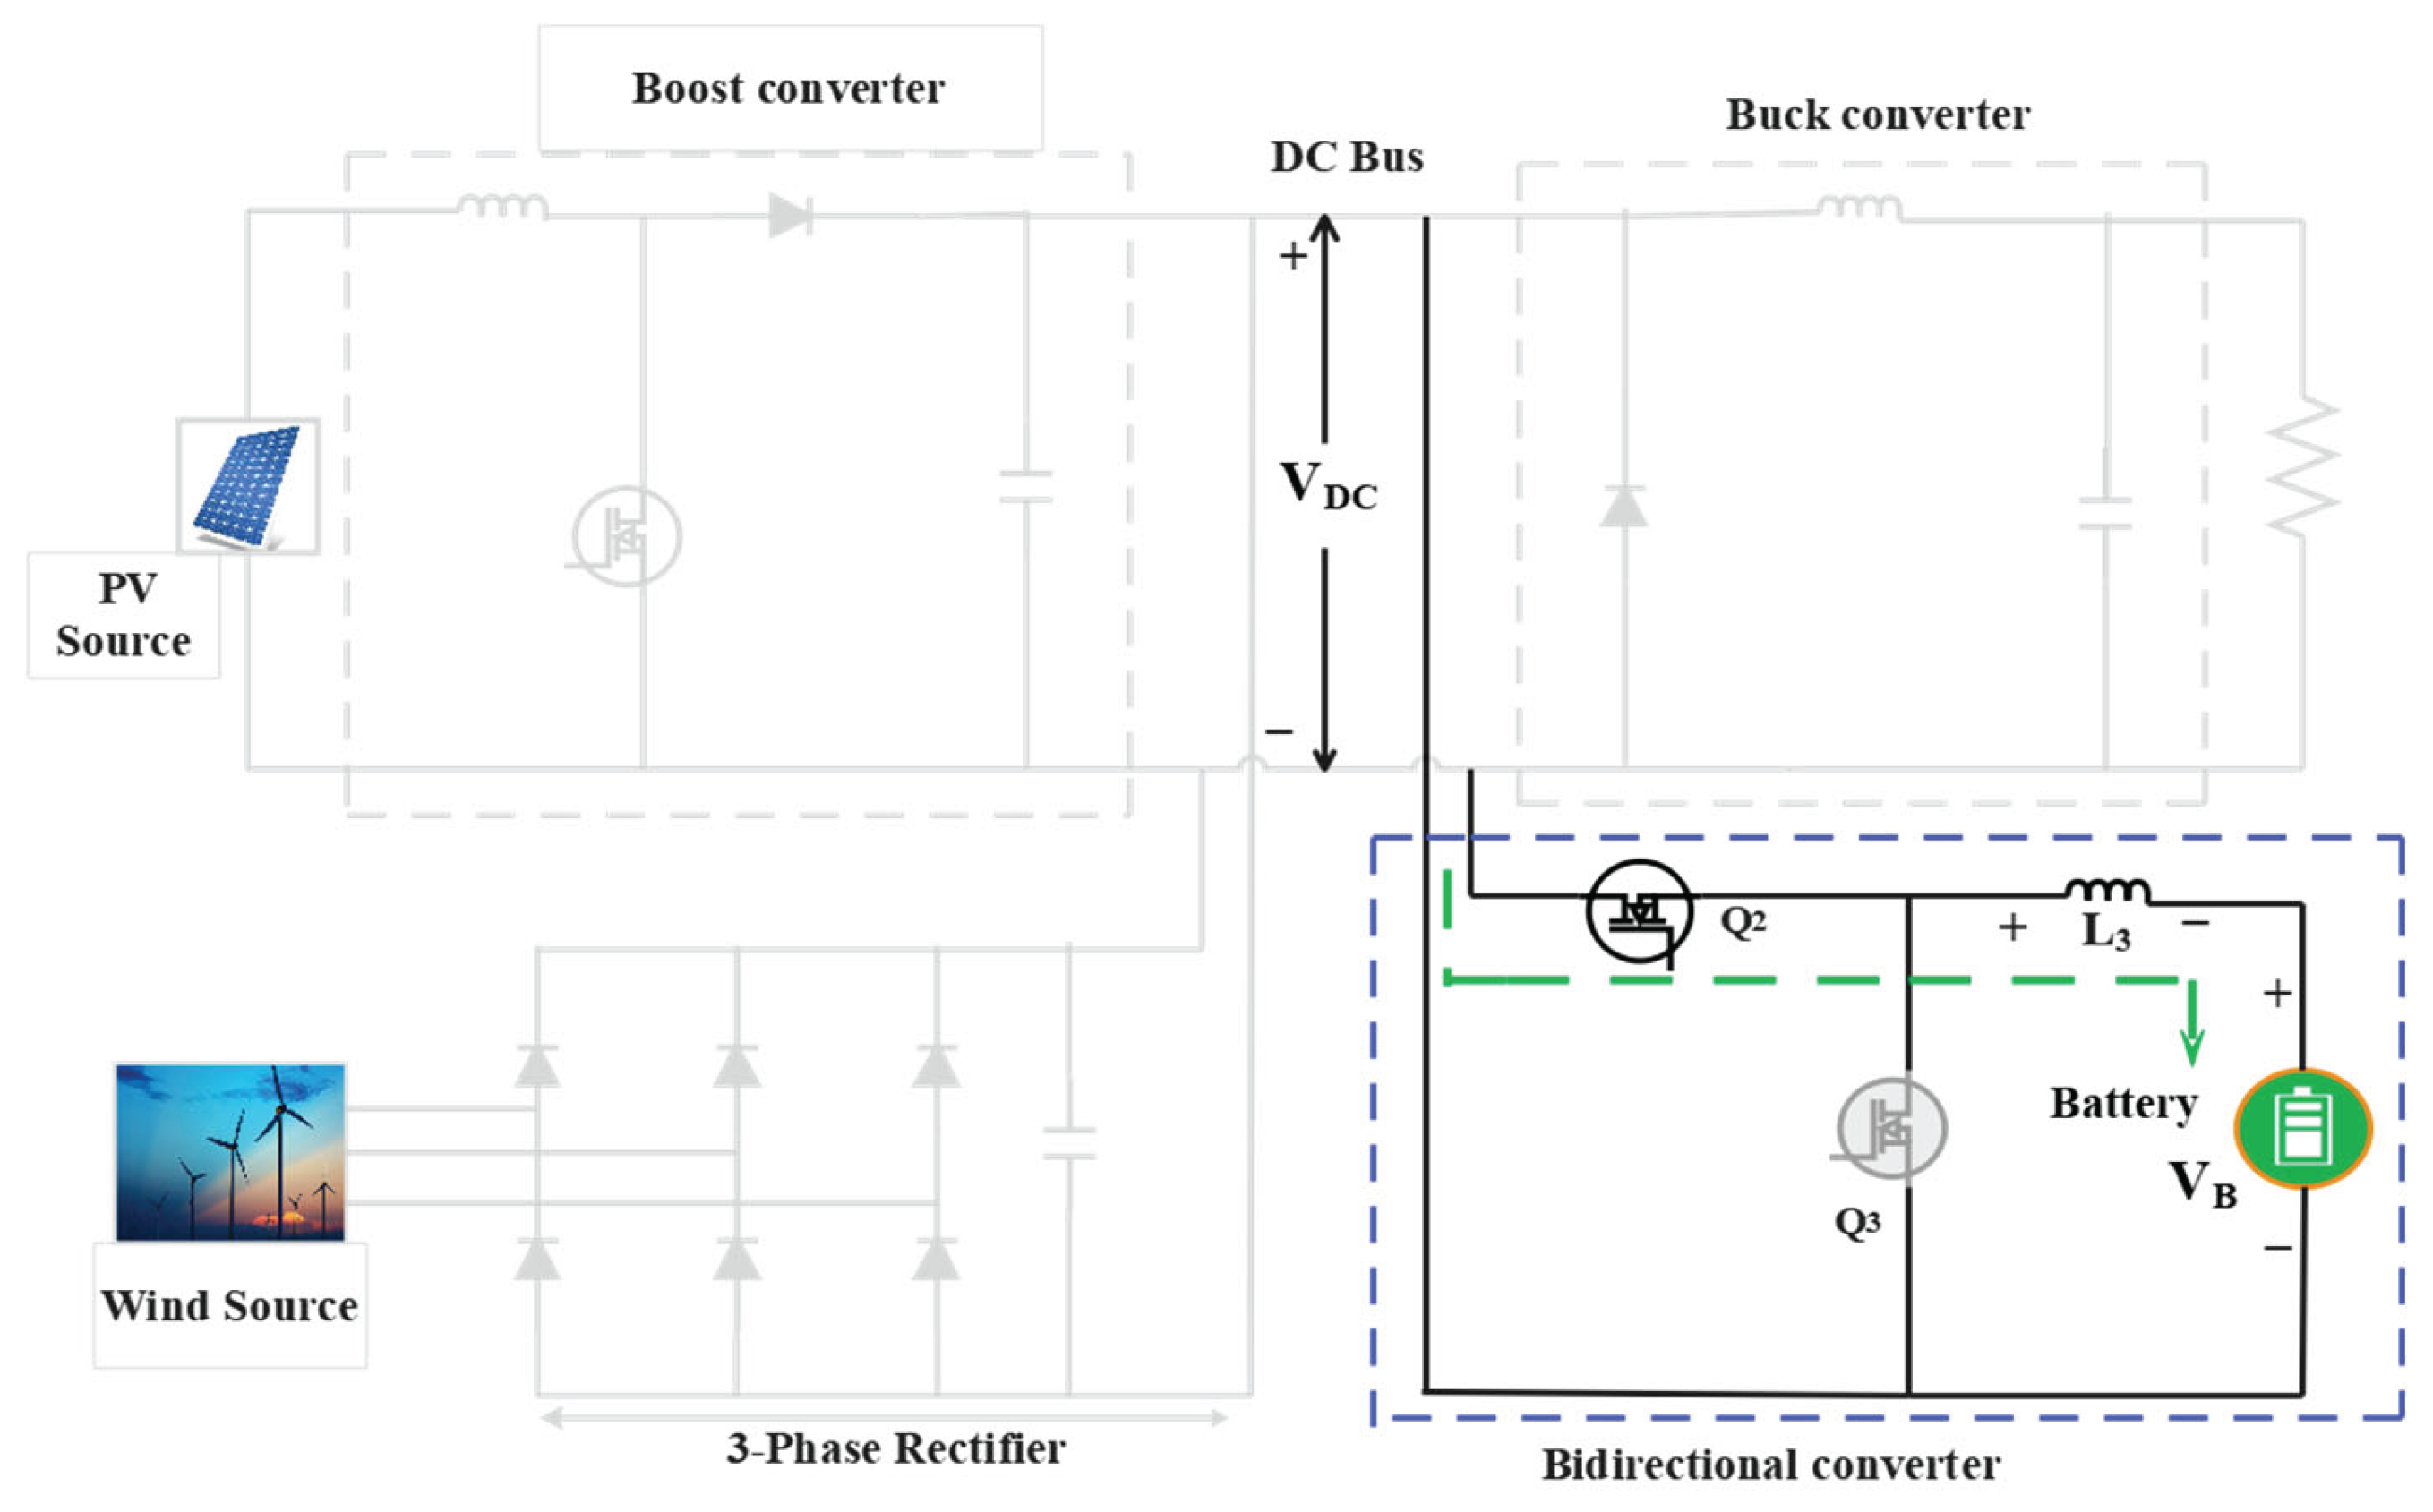
Figure 7.
Battery Discharging Mode (V2G).
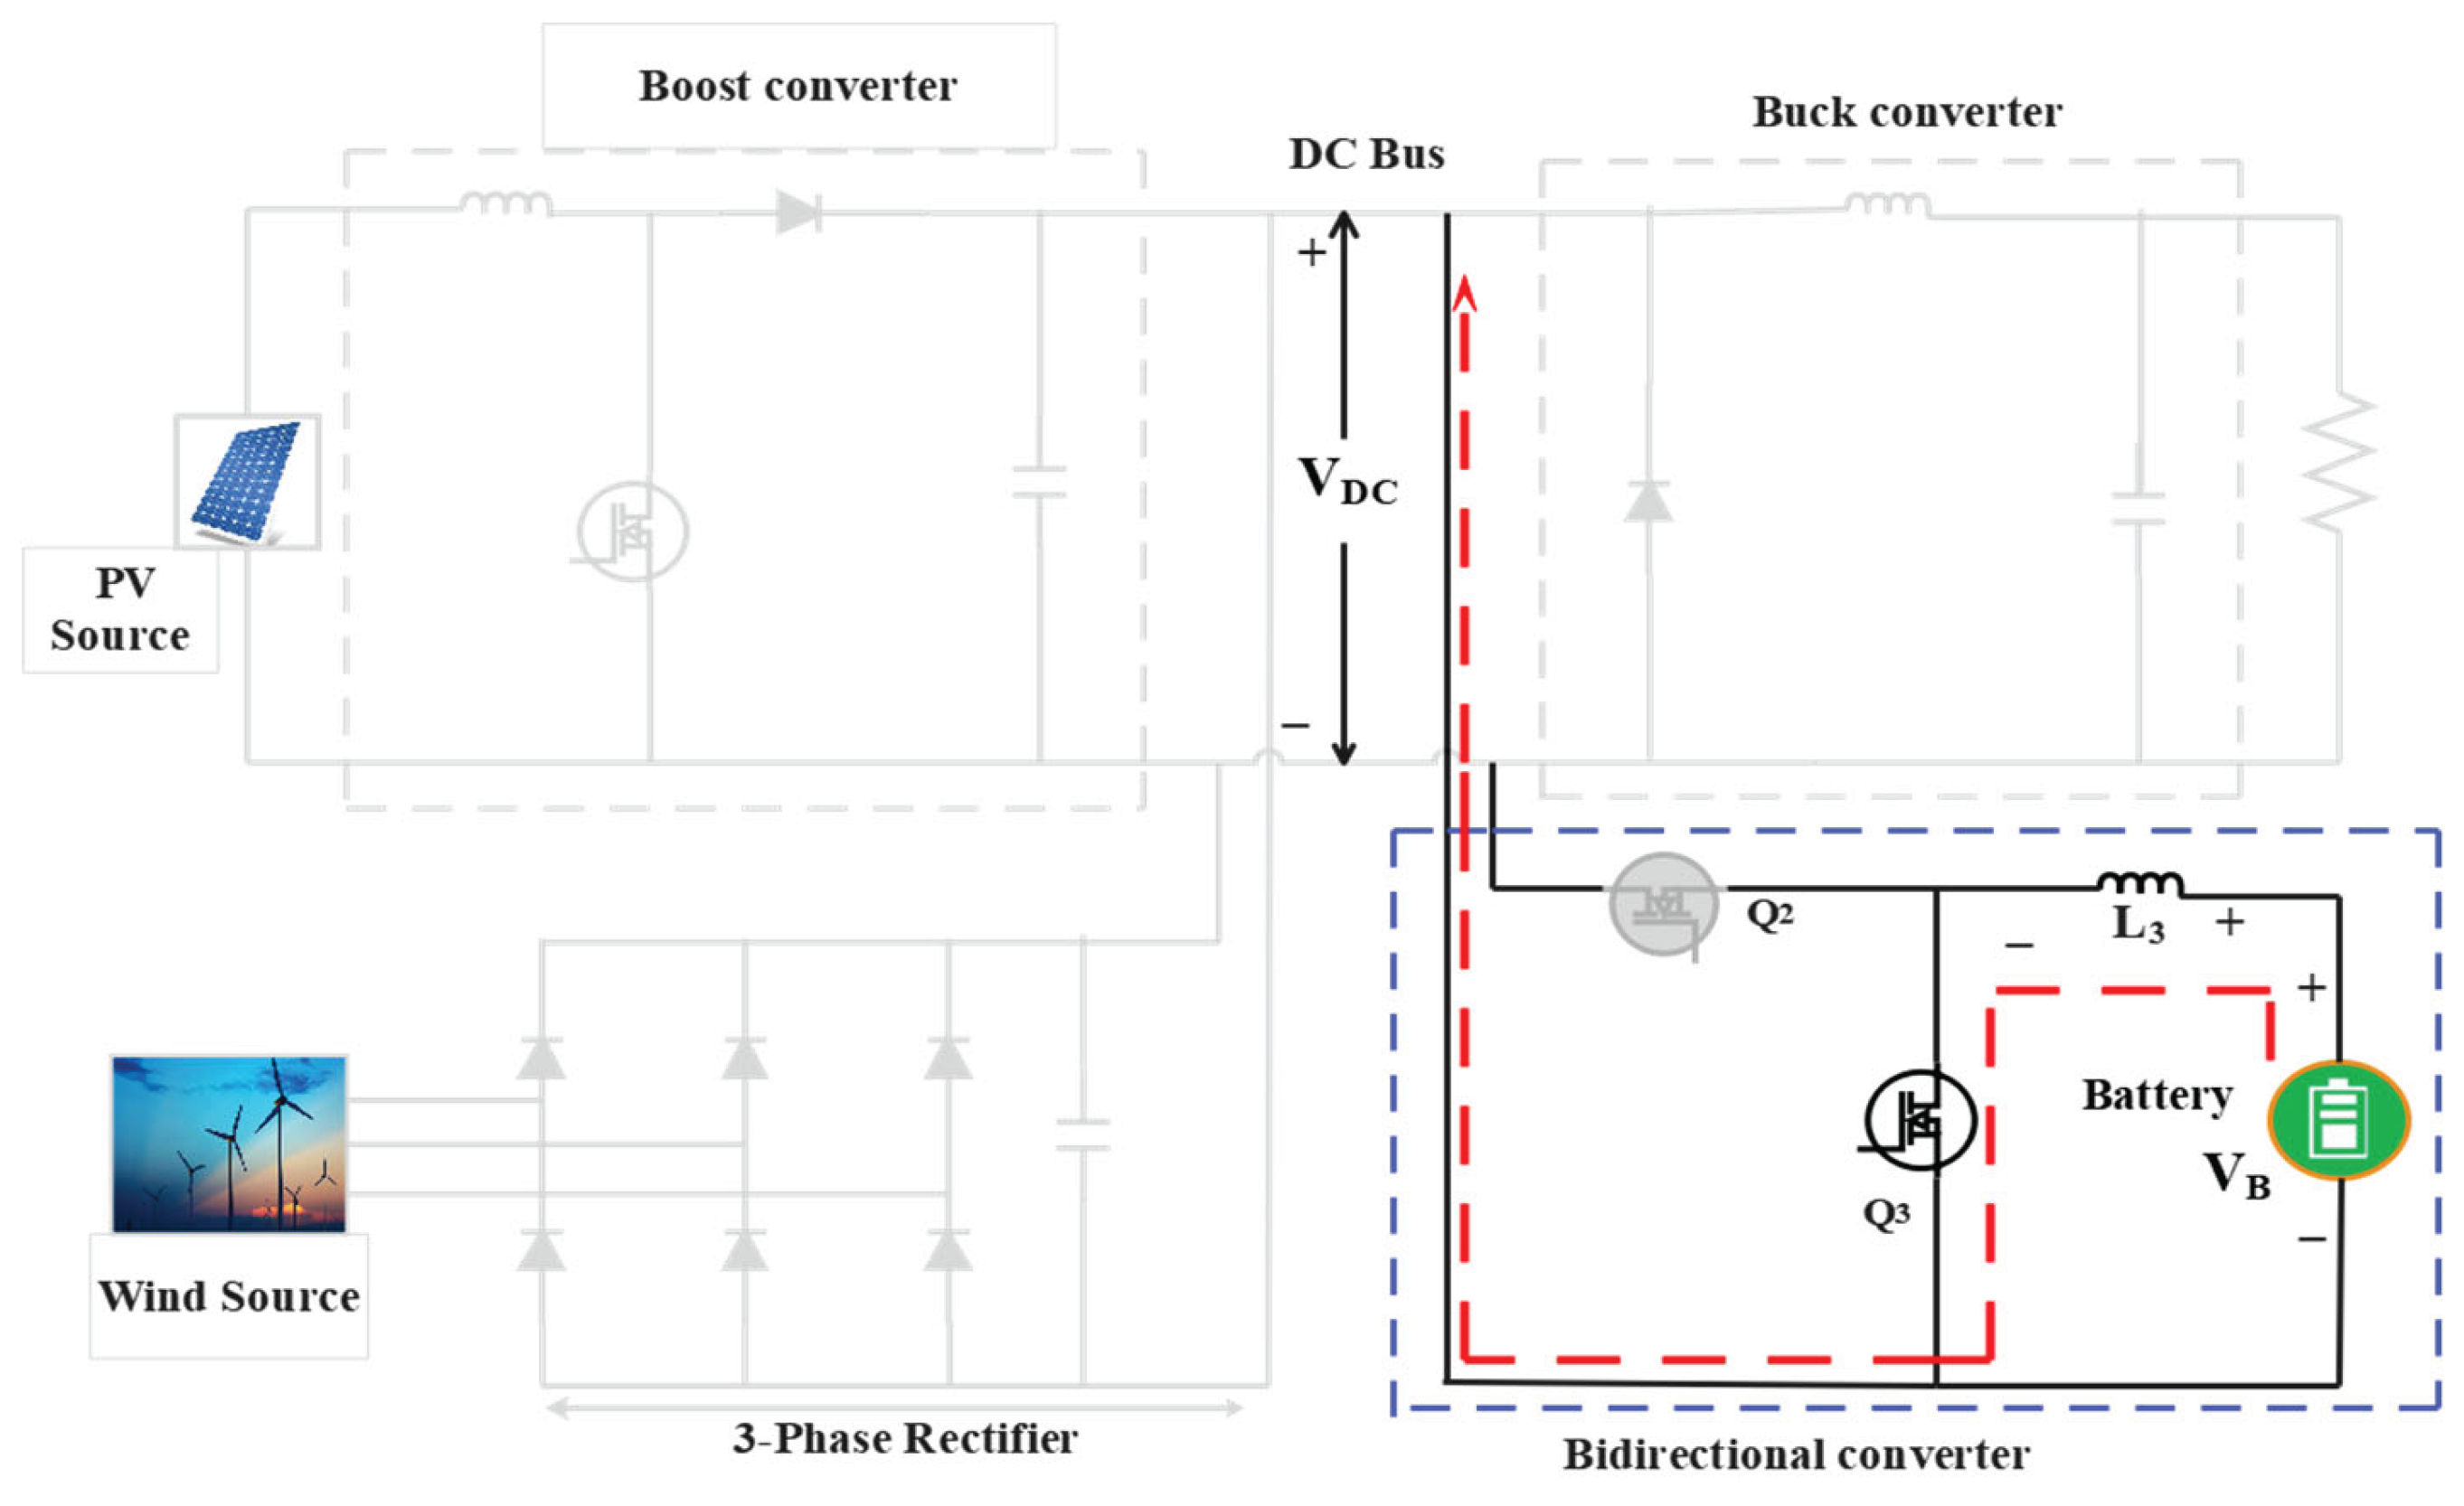
Figure 8.
Grid fault or Islanded Mode.
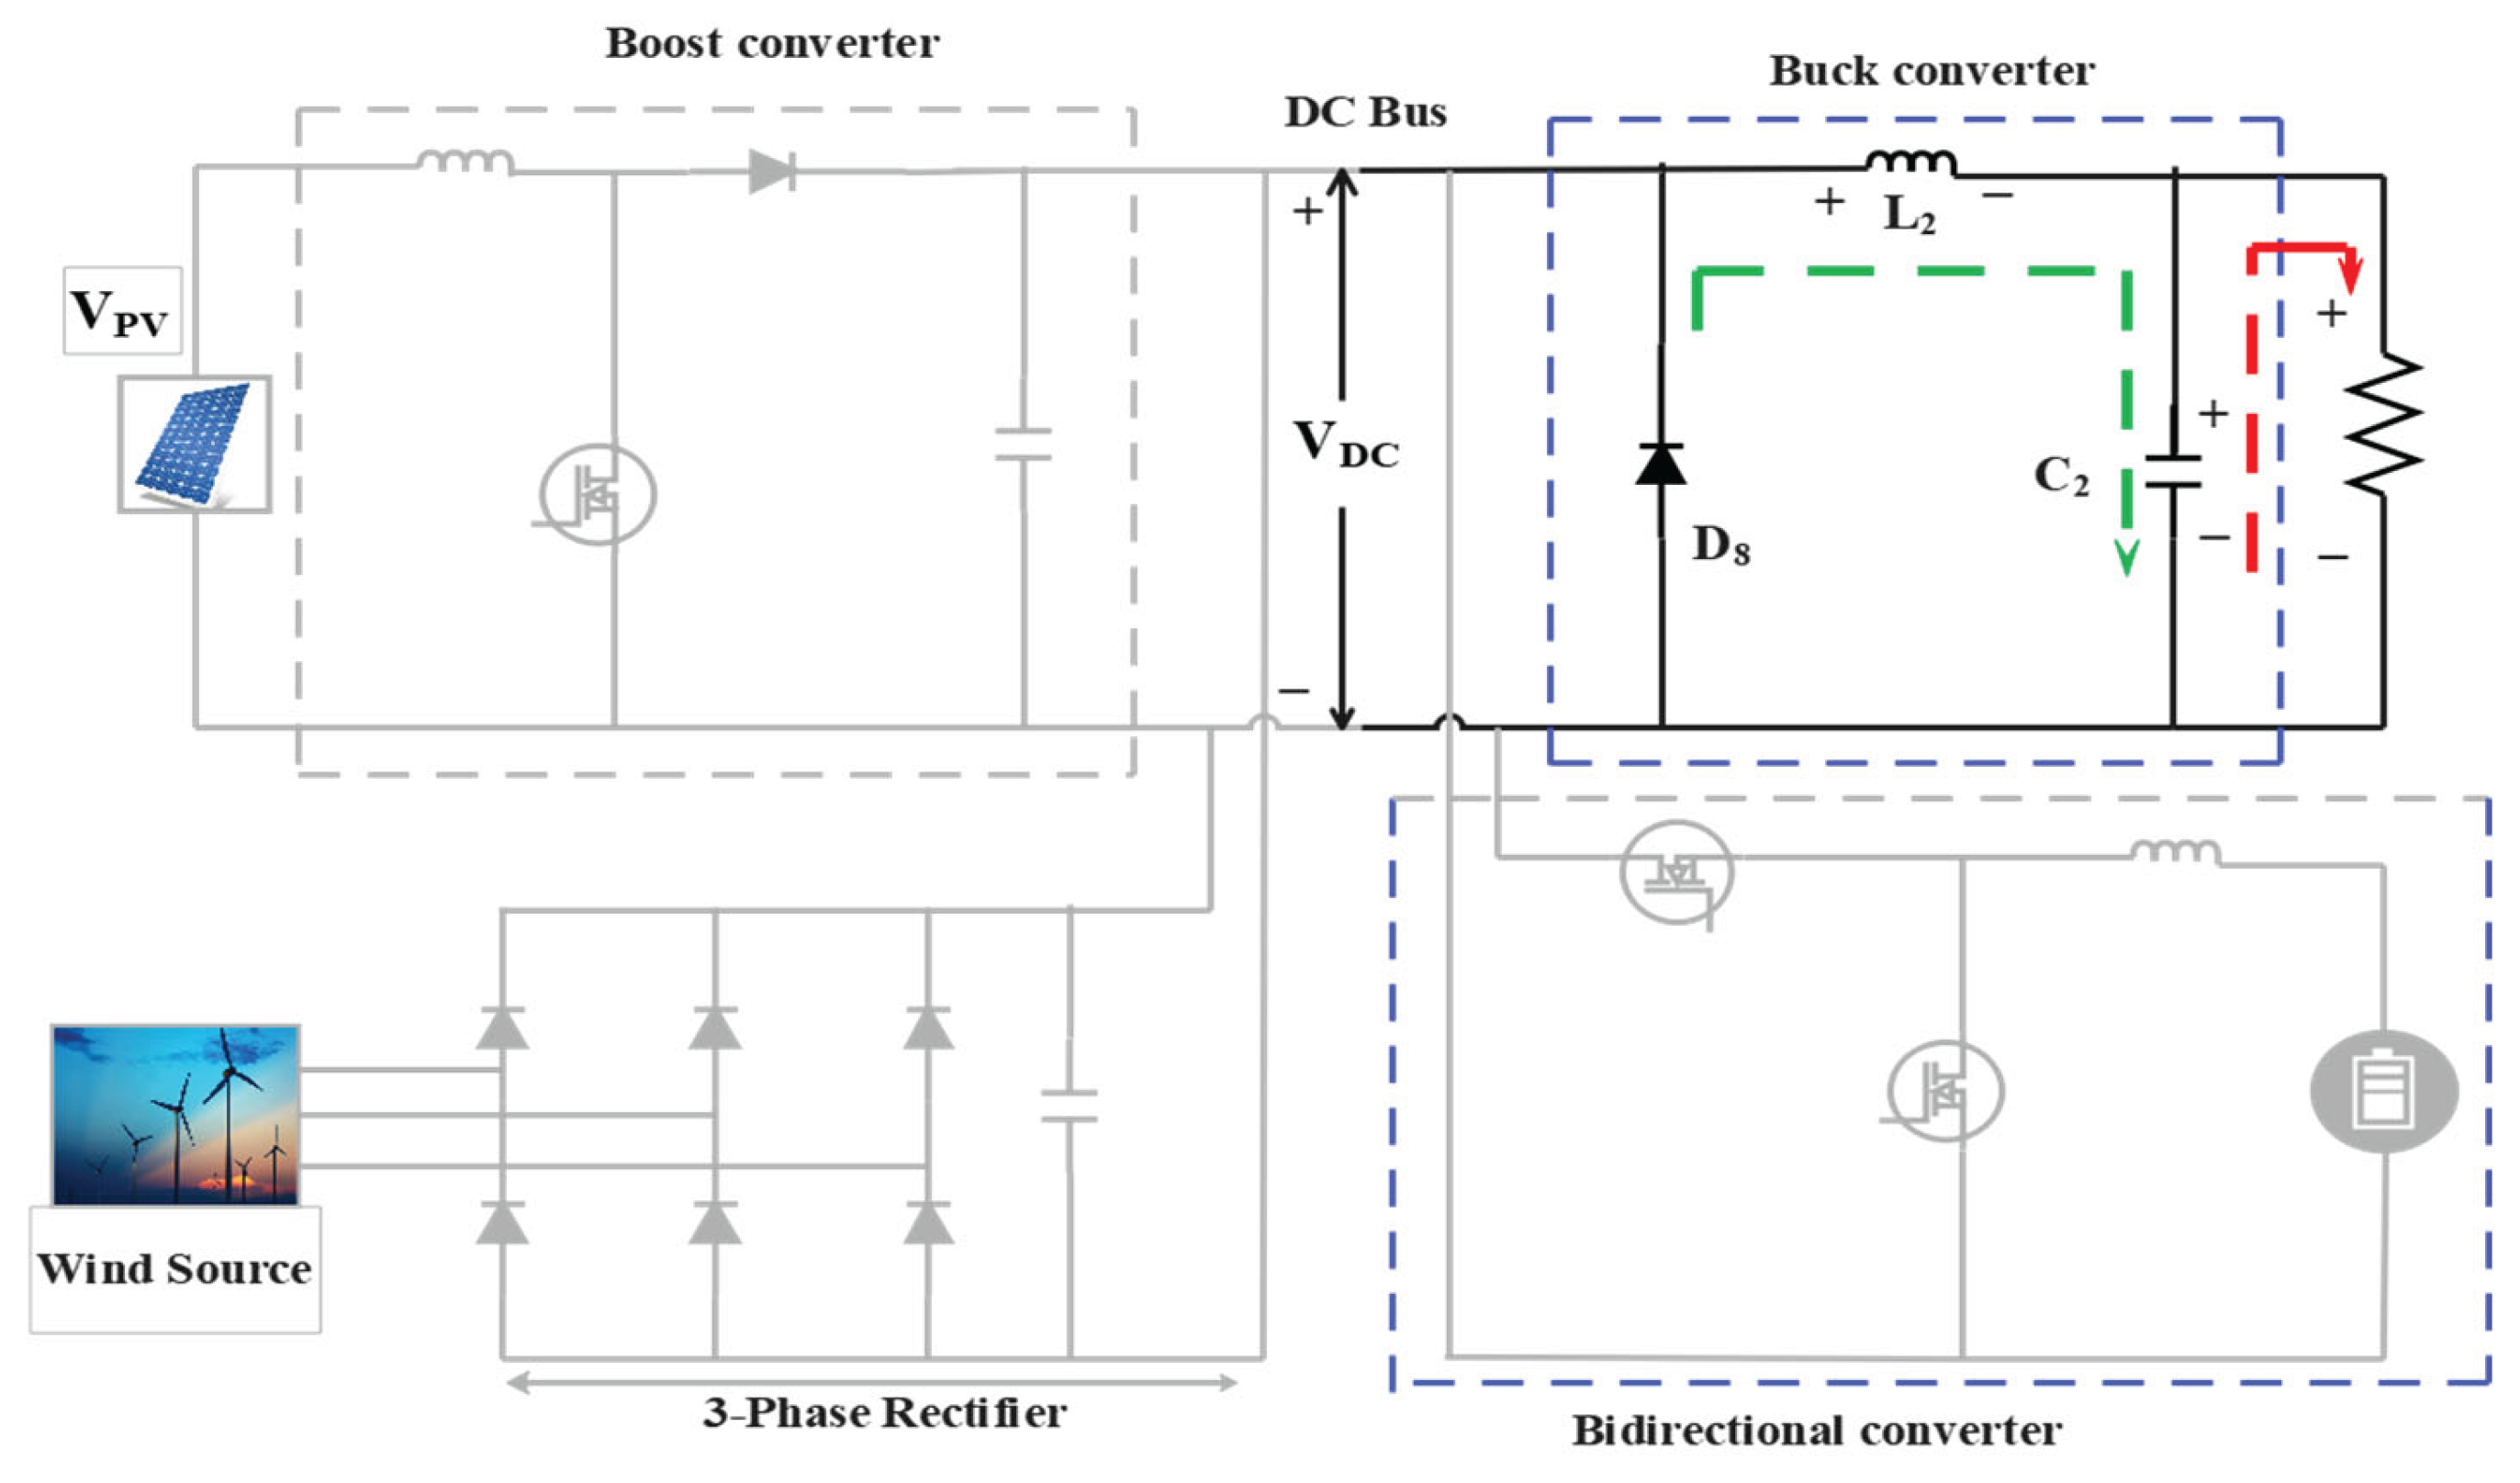
Figure 9.
MATLAB ANN structure for the system.
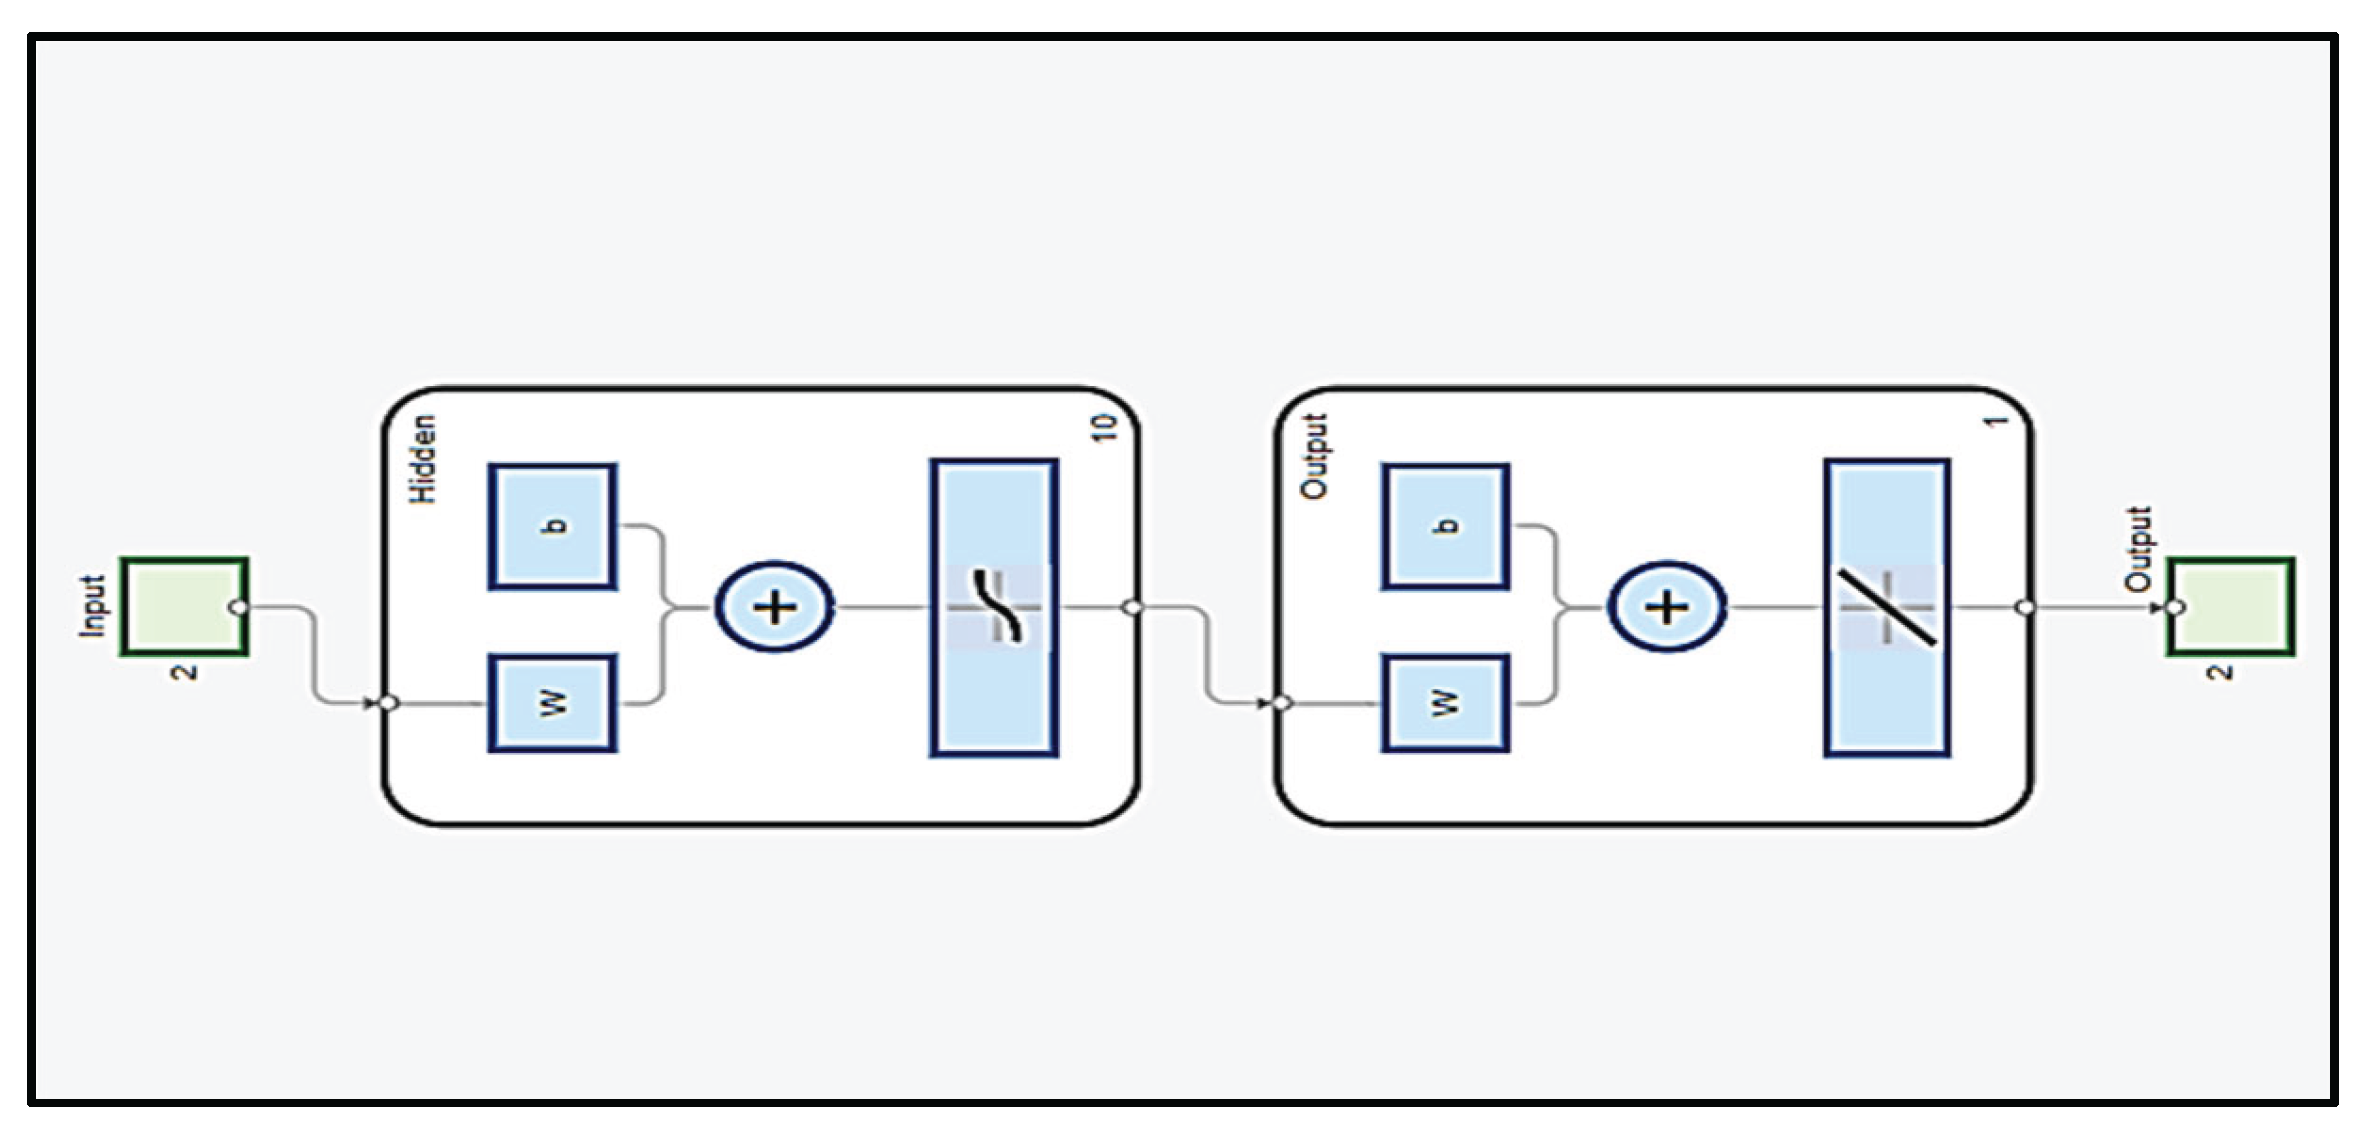
Figure 10.
Trained data of the ANN structure.
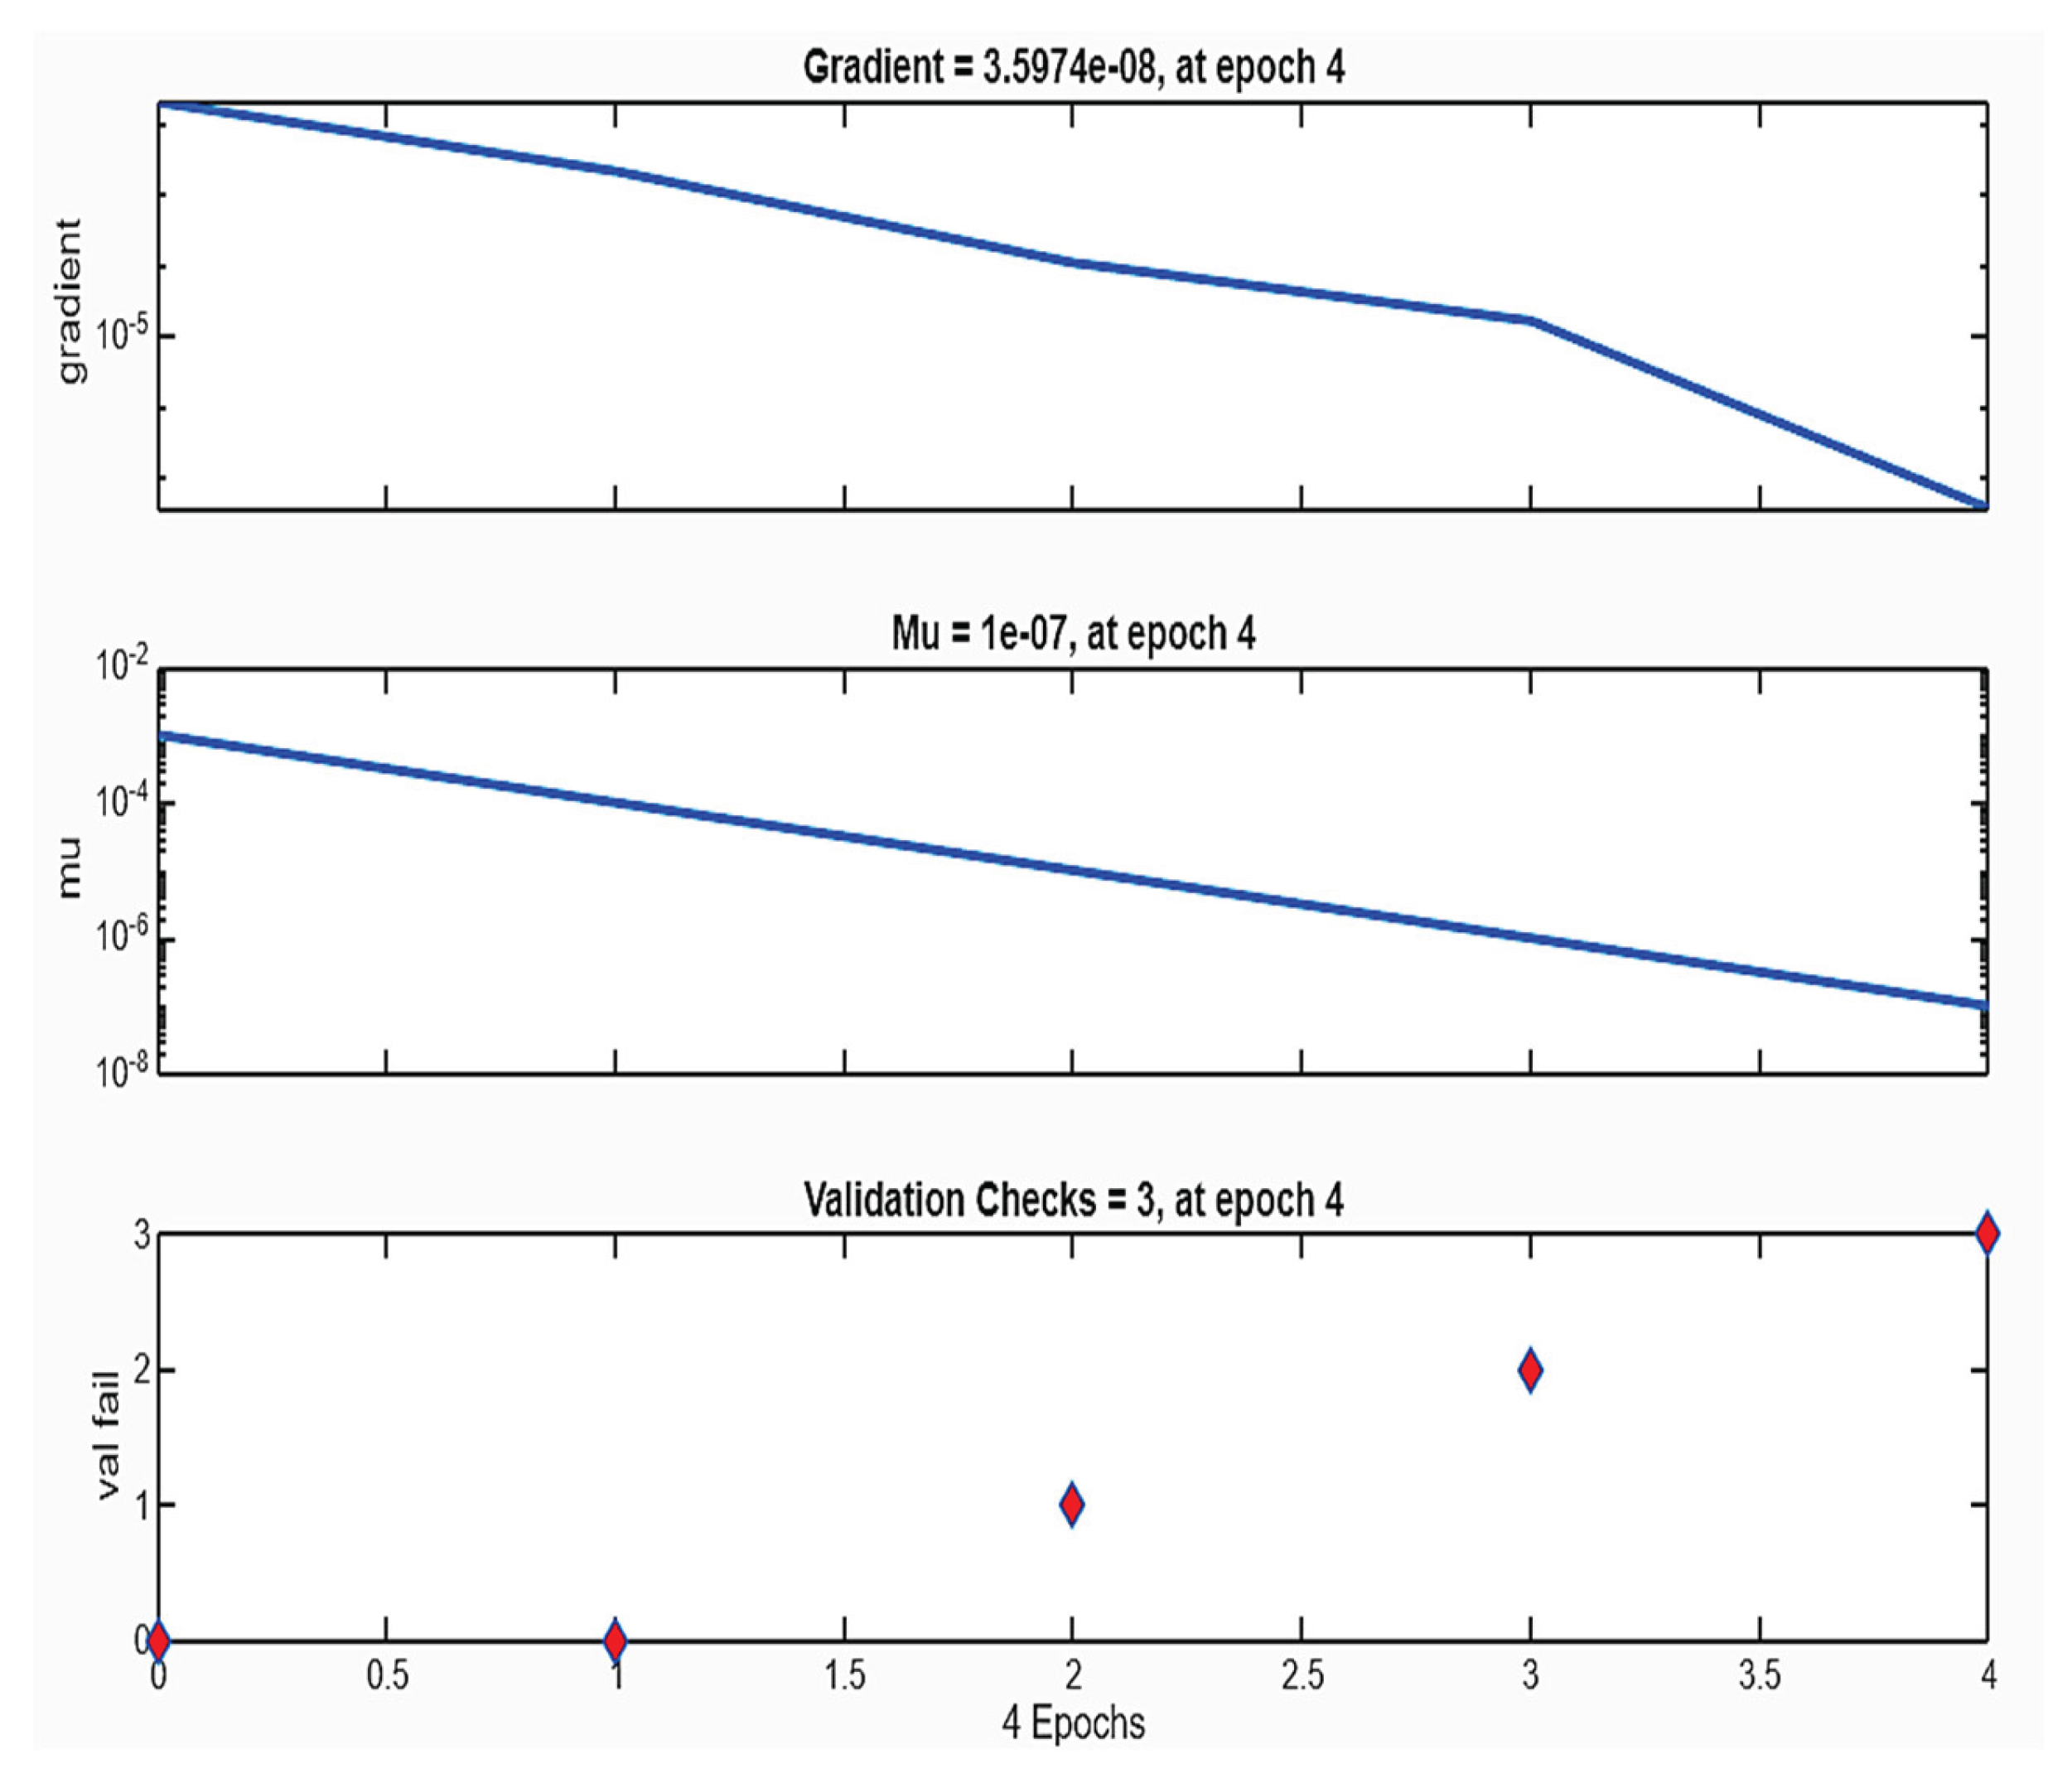
Figure 11.
Performance curve of the system using an ANN structure.
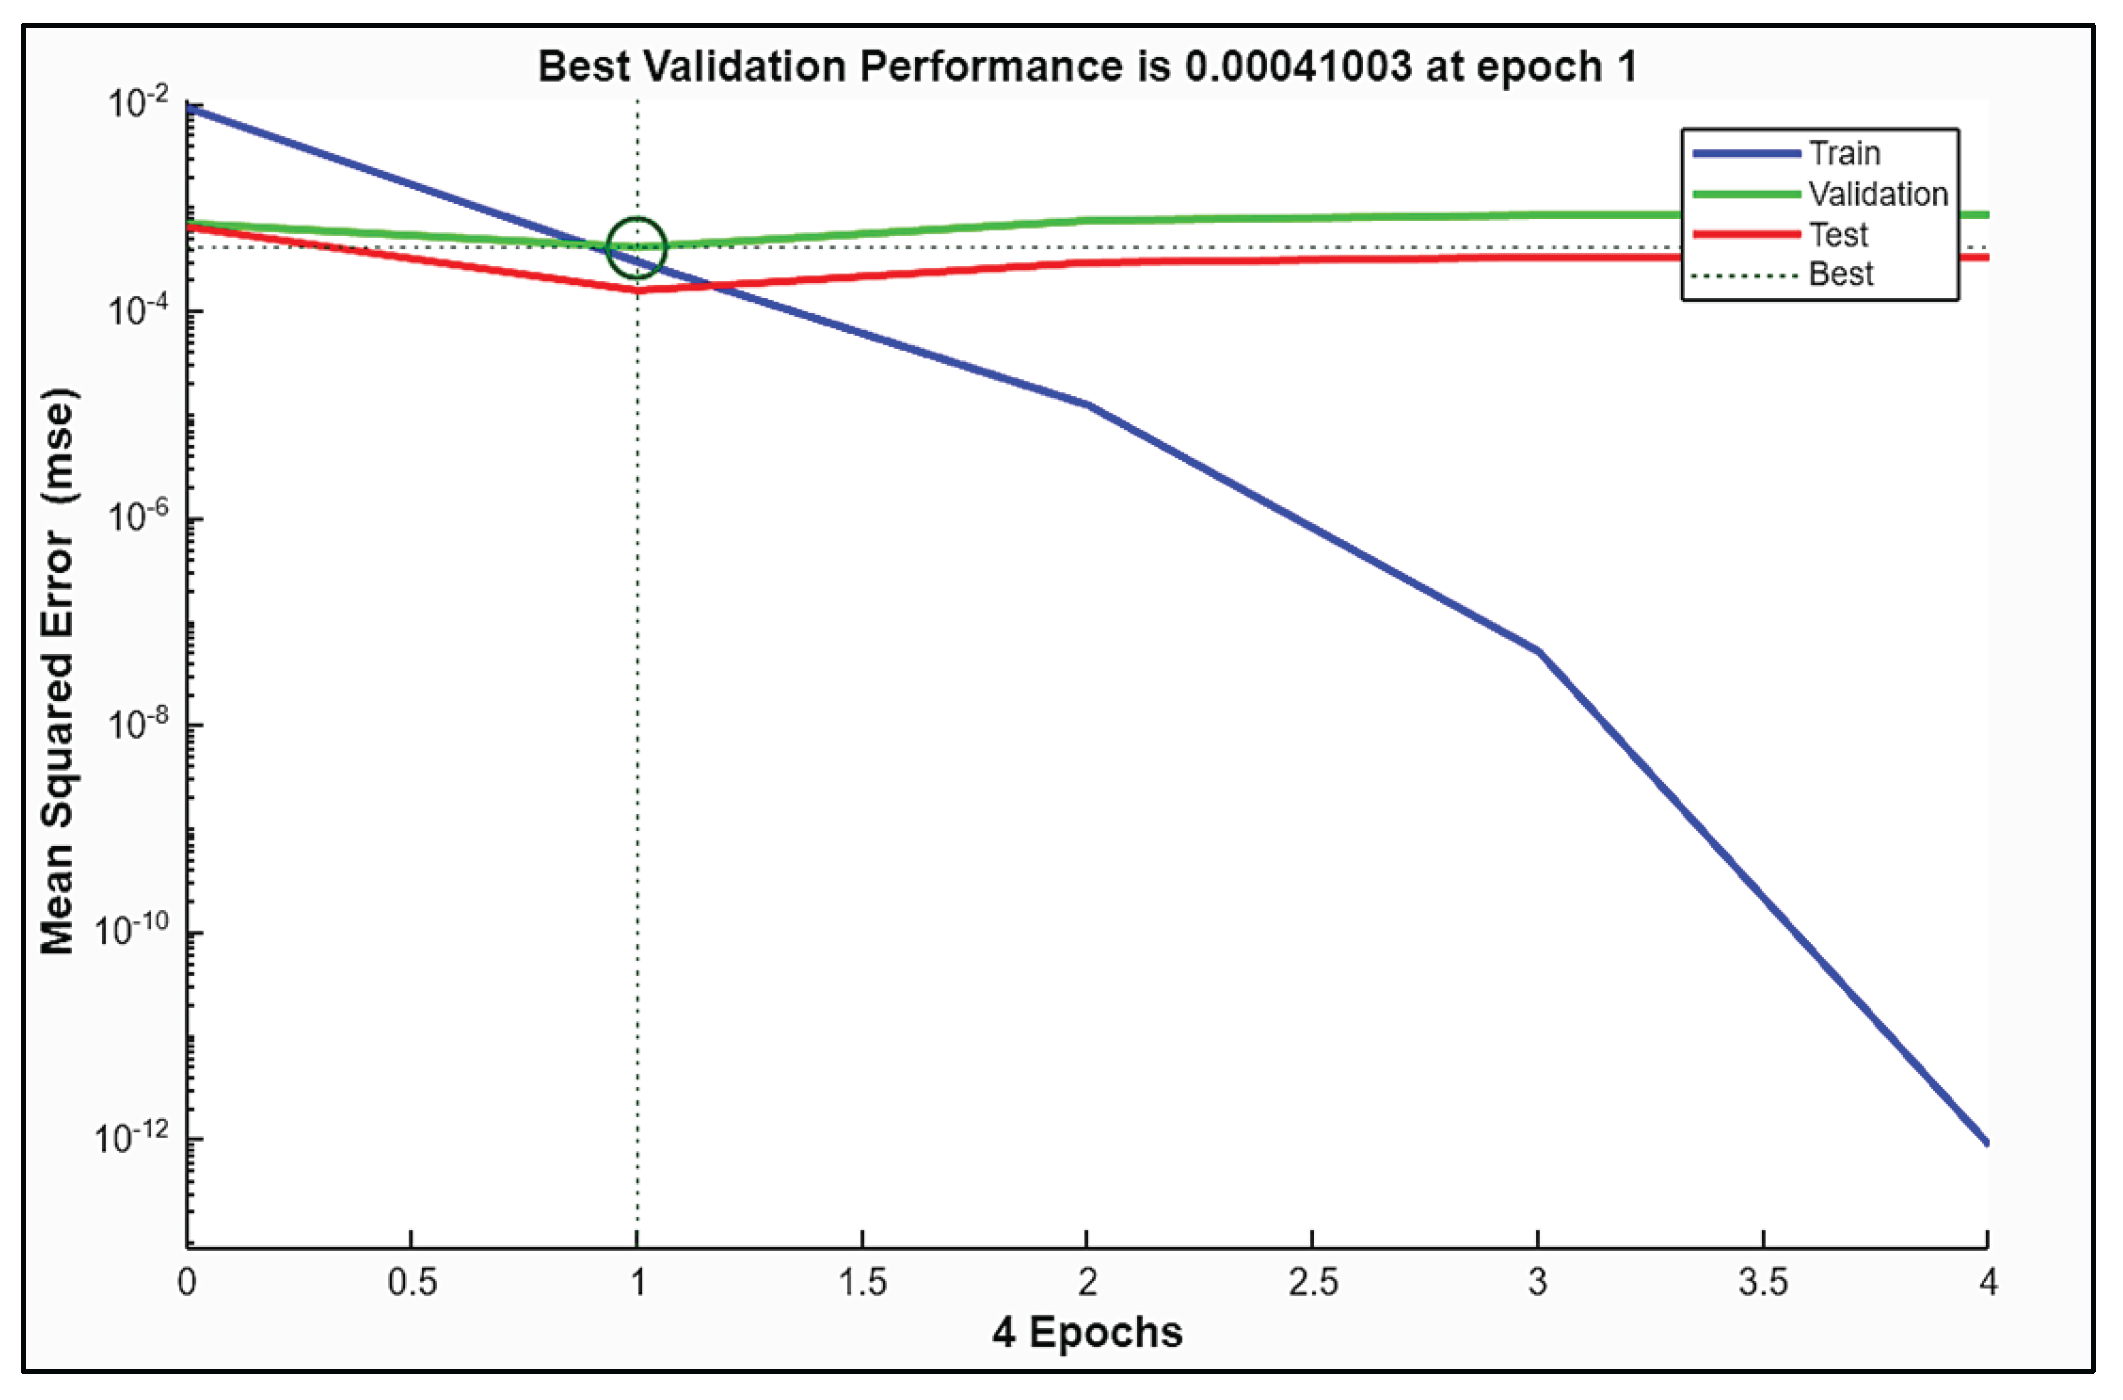
Figure 12.
Histogram plot of the ANN training.
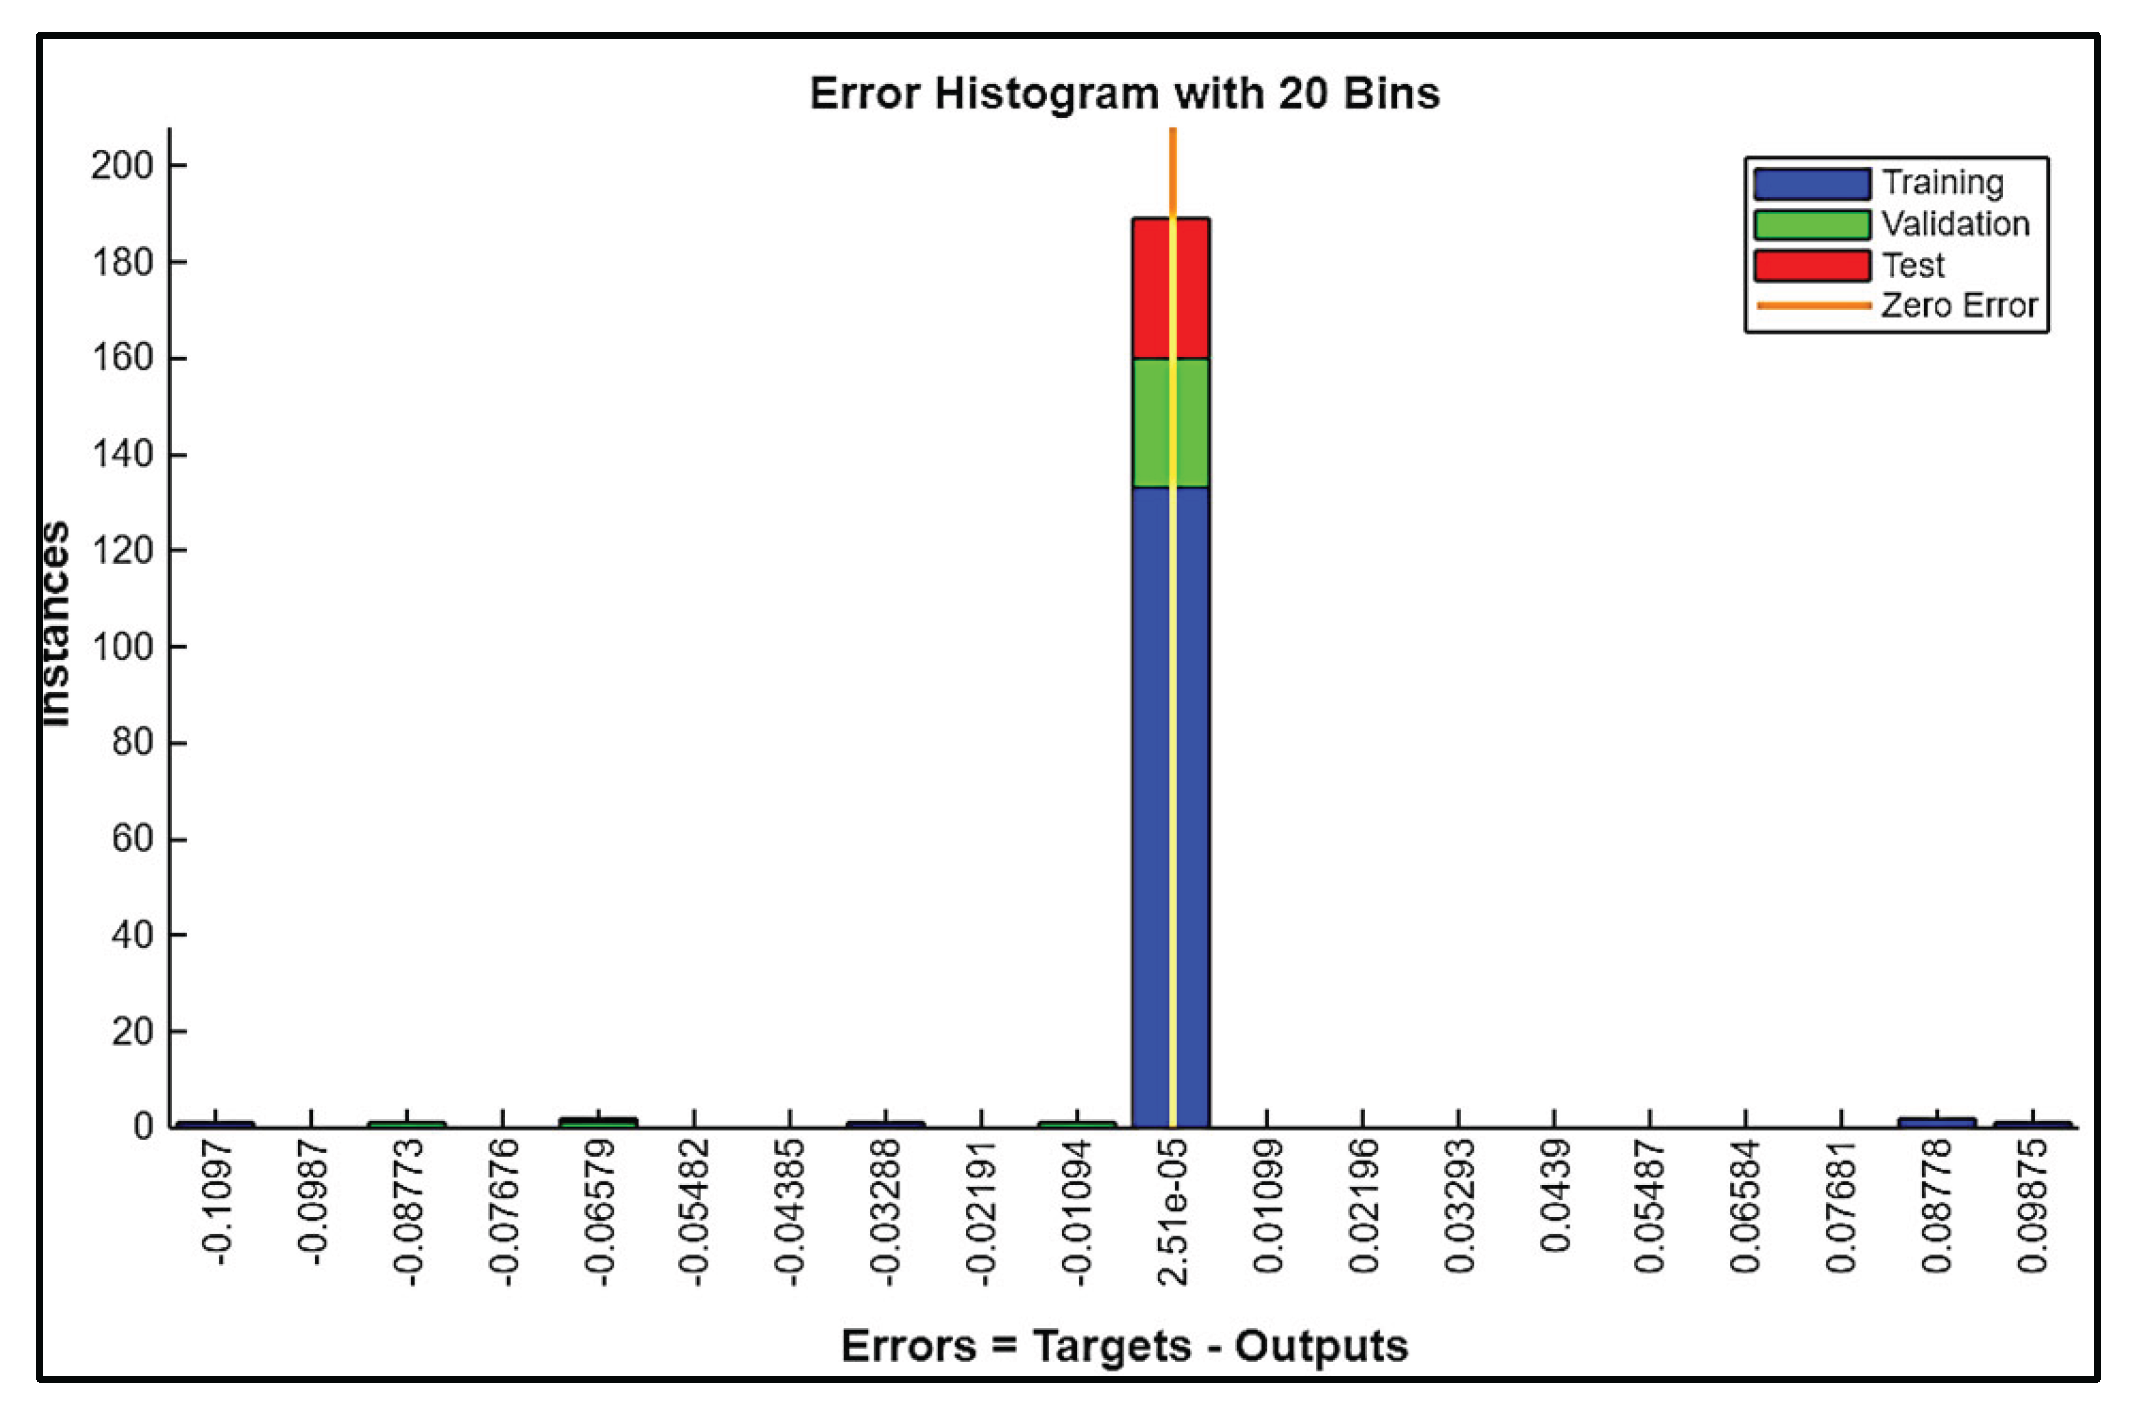
Figure 13.
Regression plot using ANN.
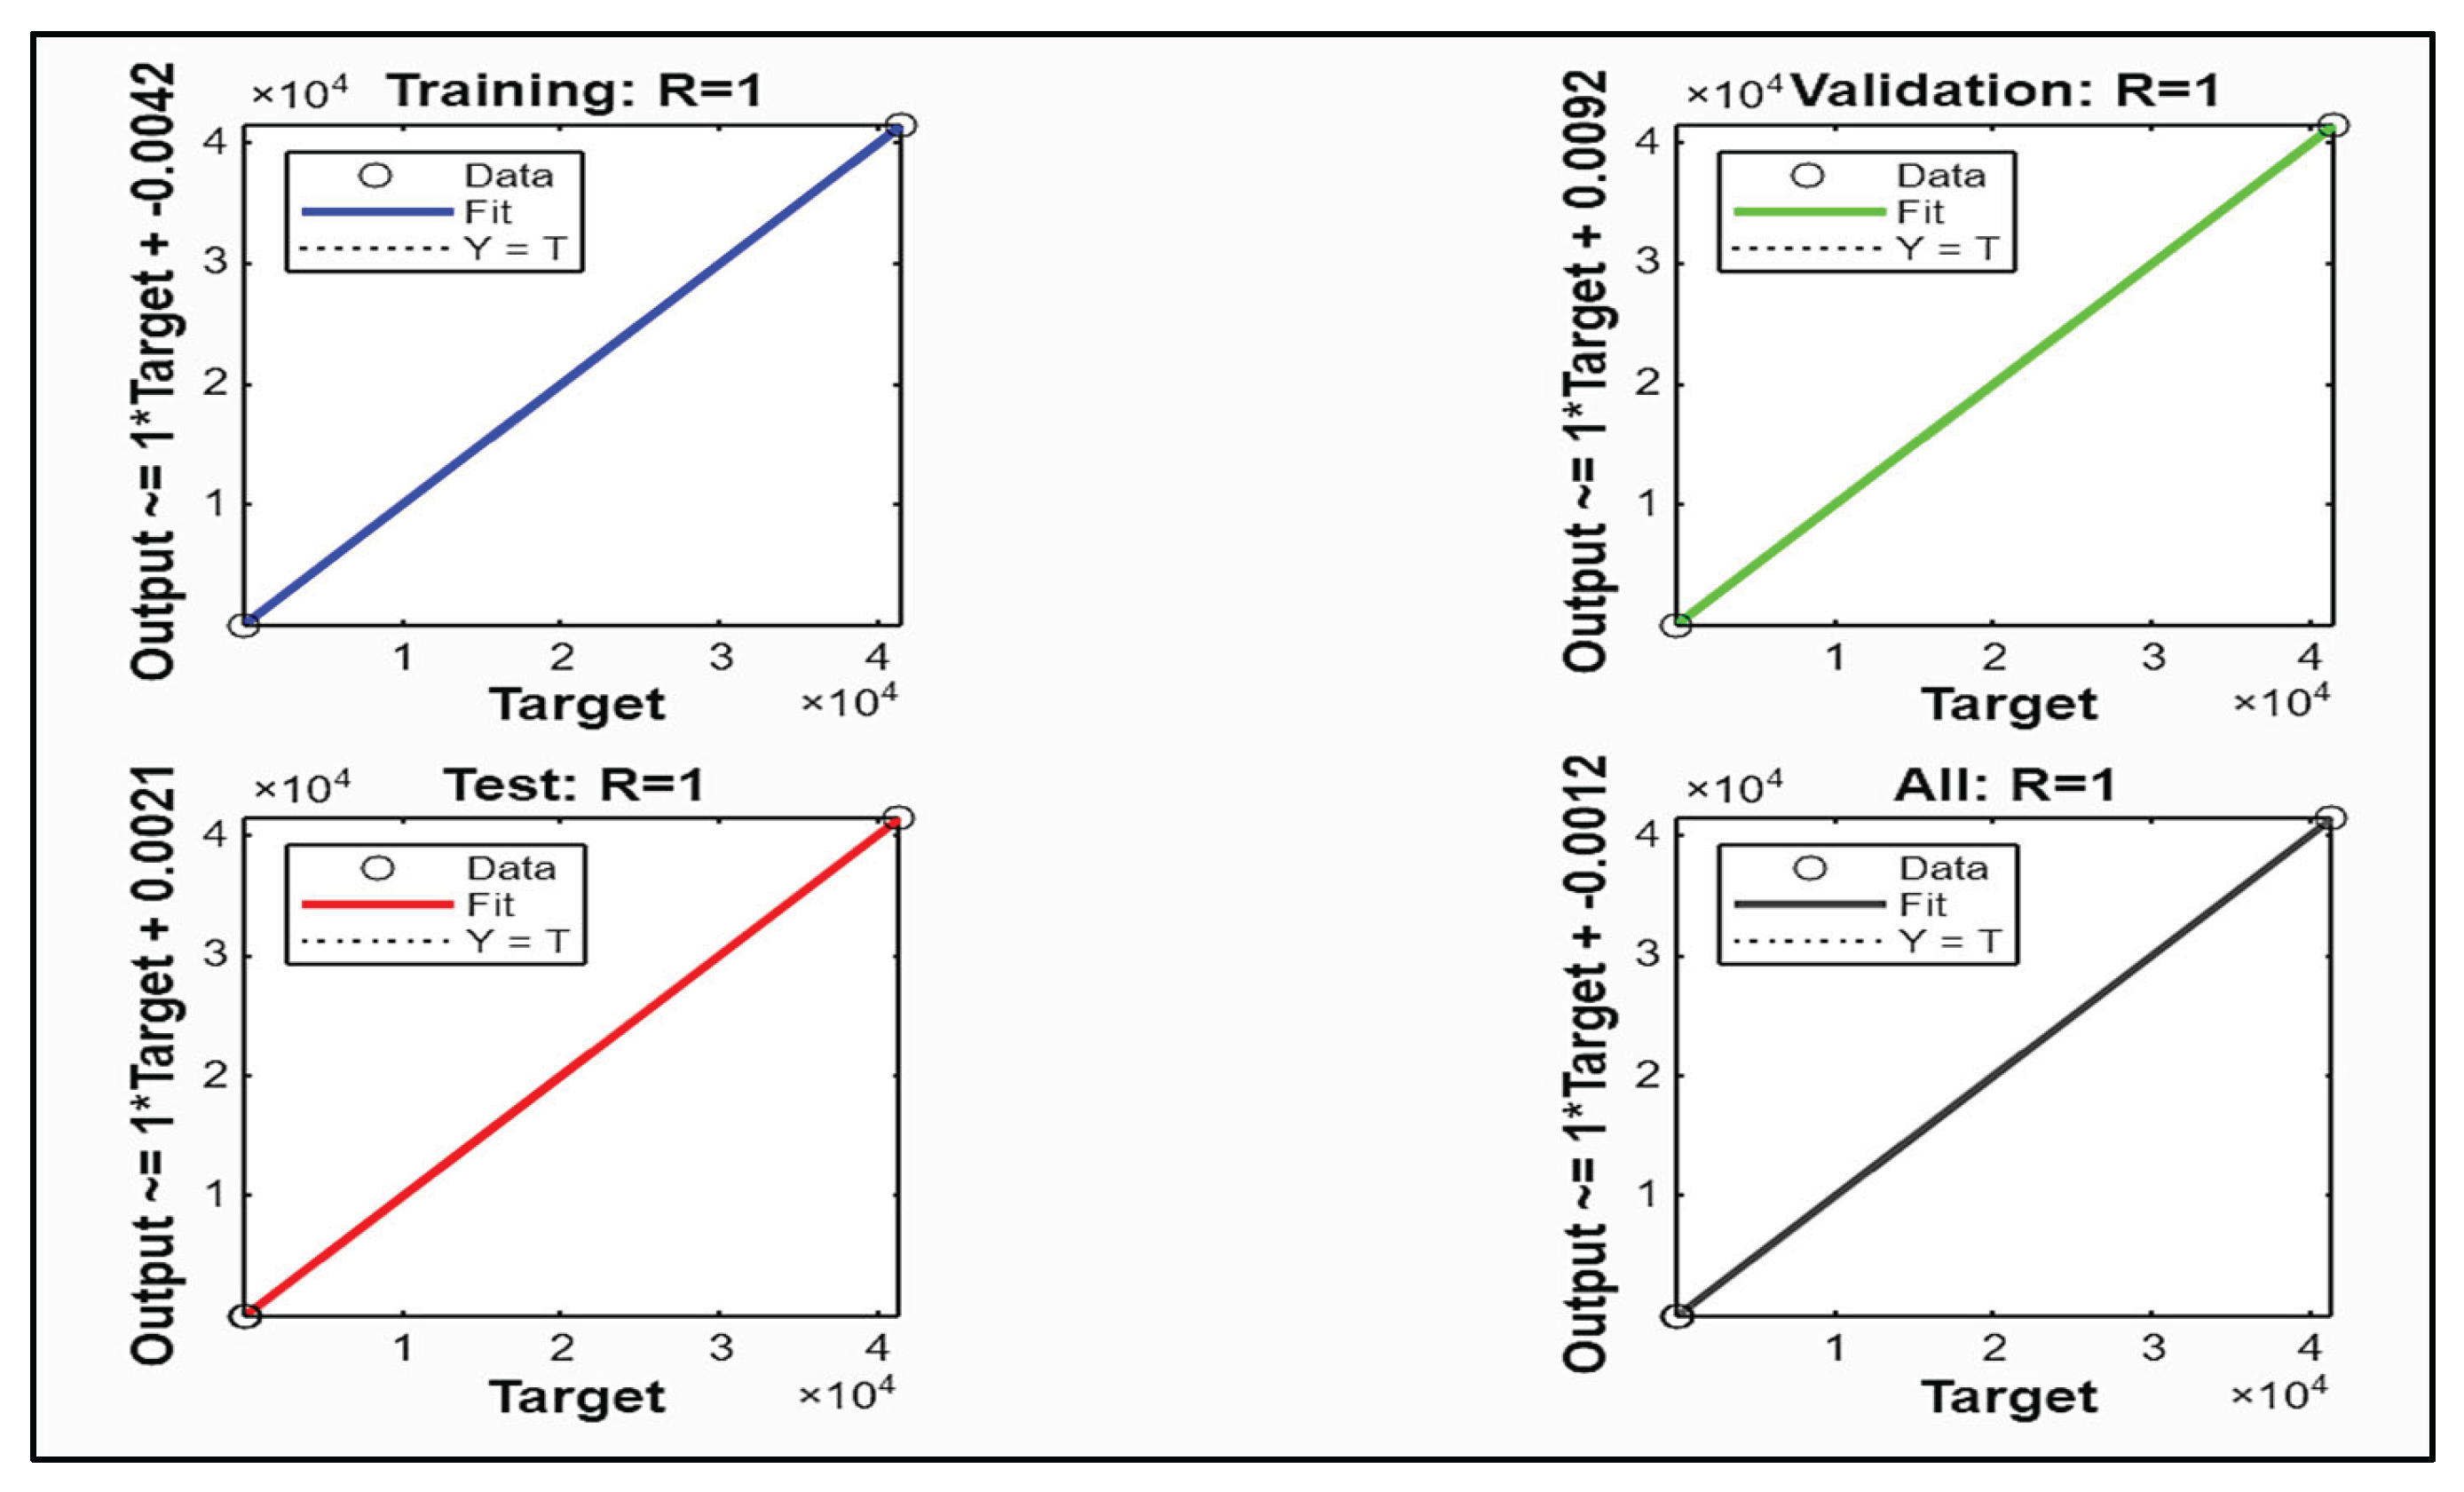
Figure 14.
Flowchart of ANN- based battery fault tolerance algorithm.
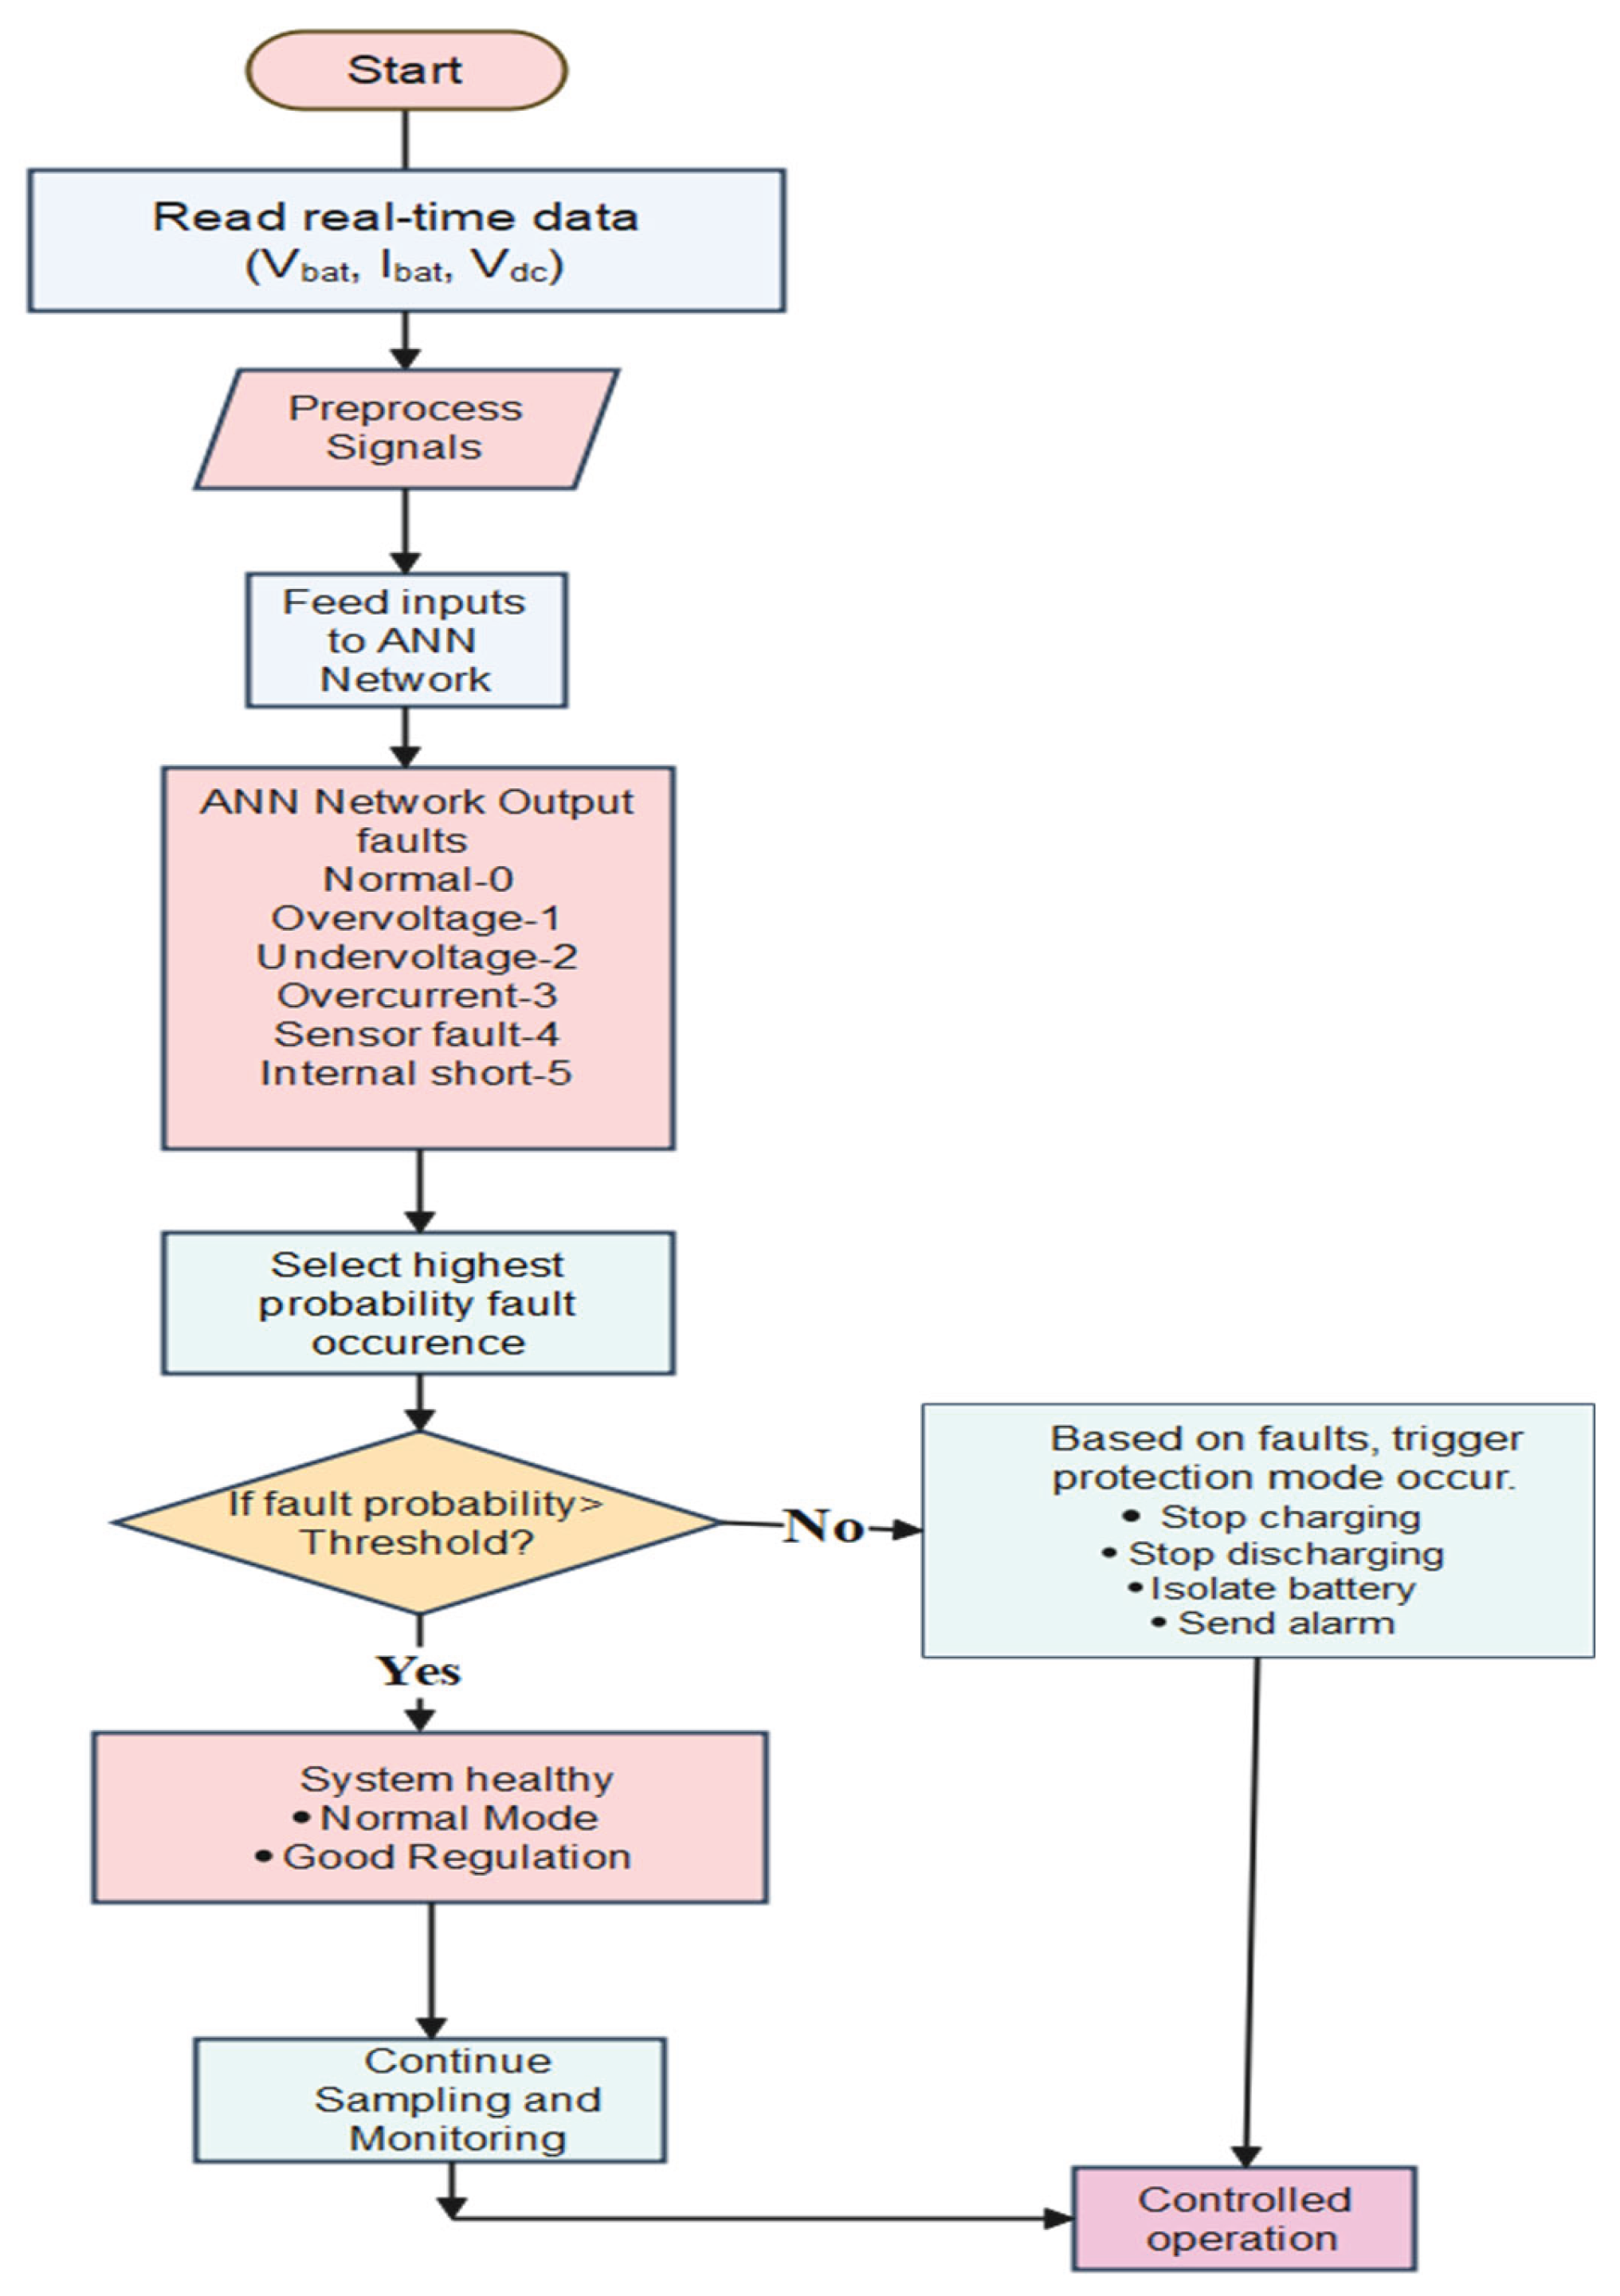
Figure 15.
Schematic controller strategy of the multifunctional converter.
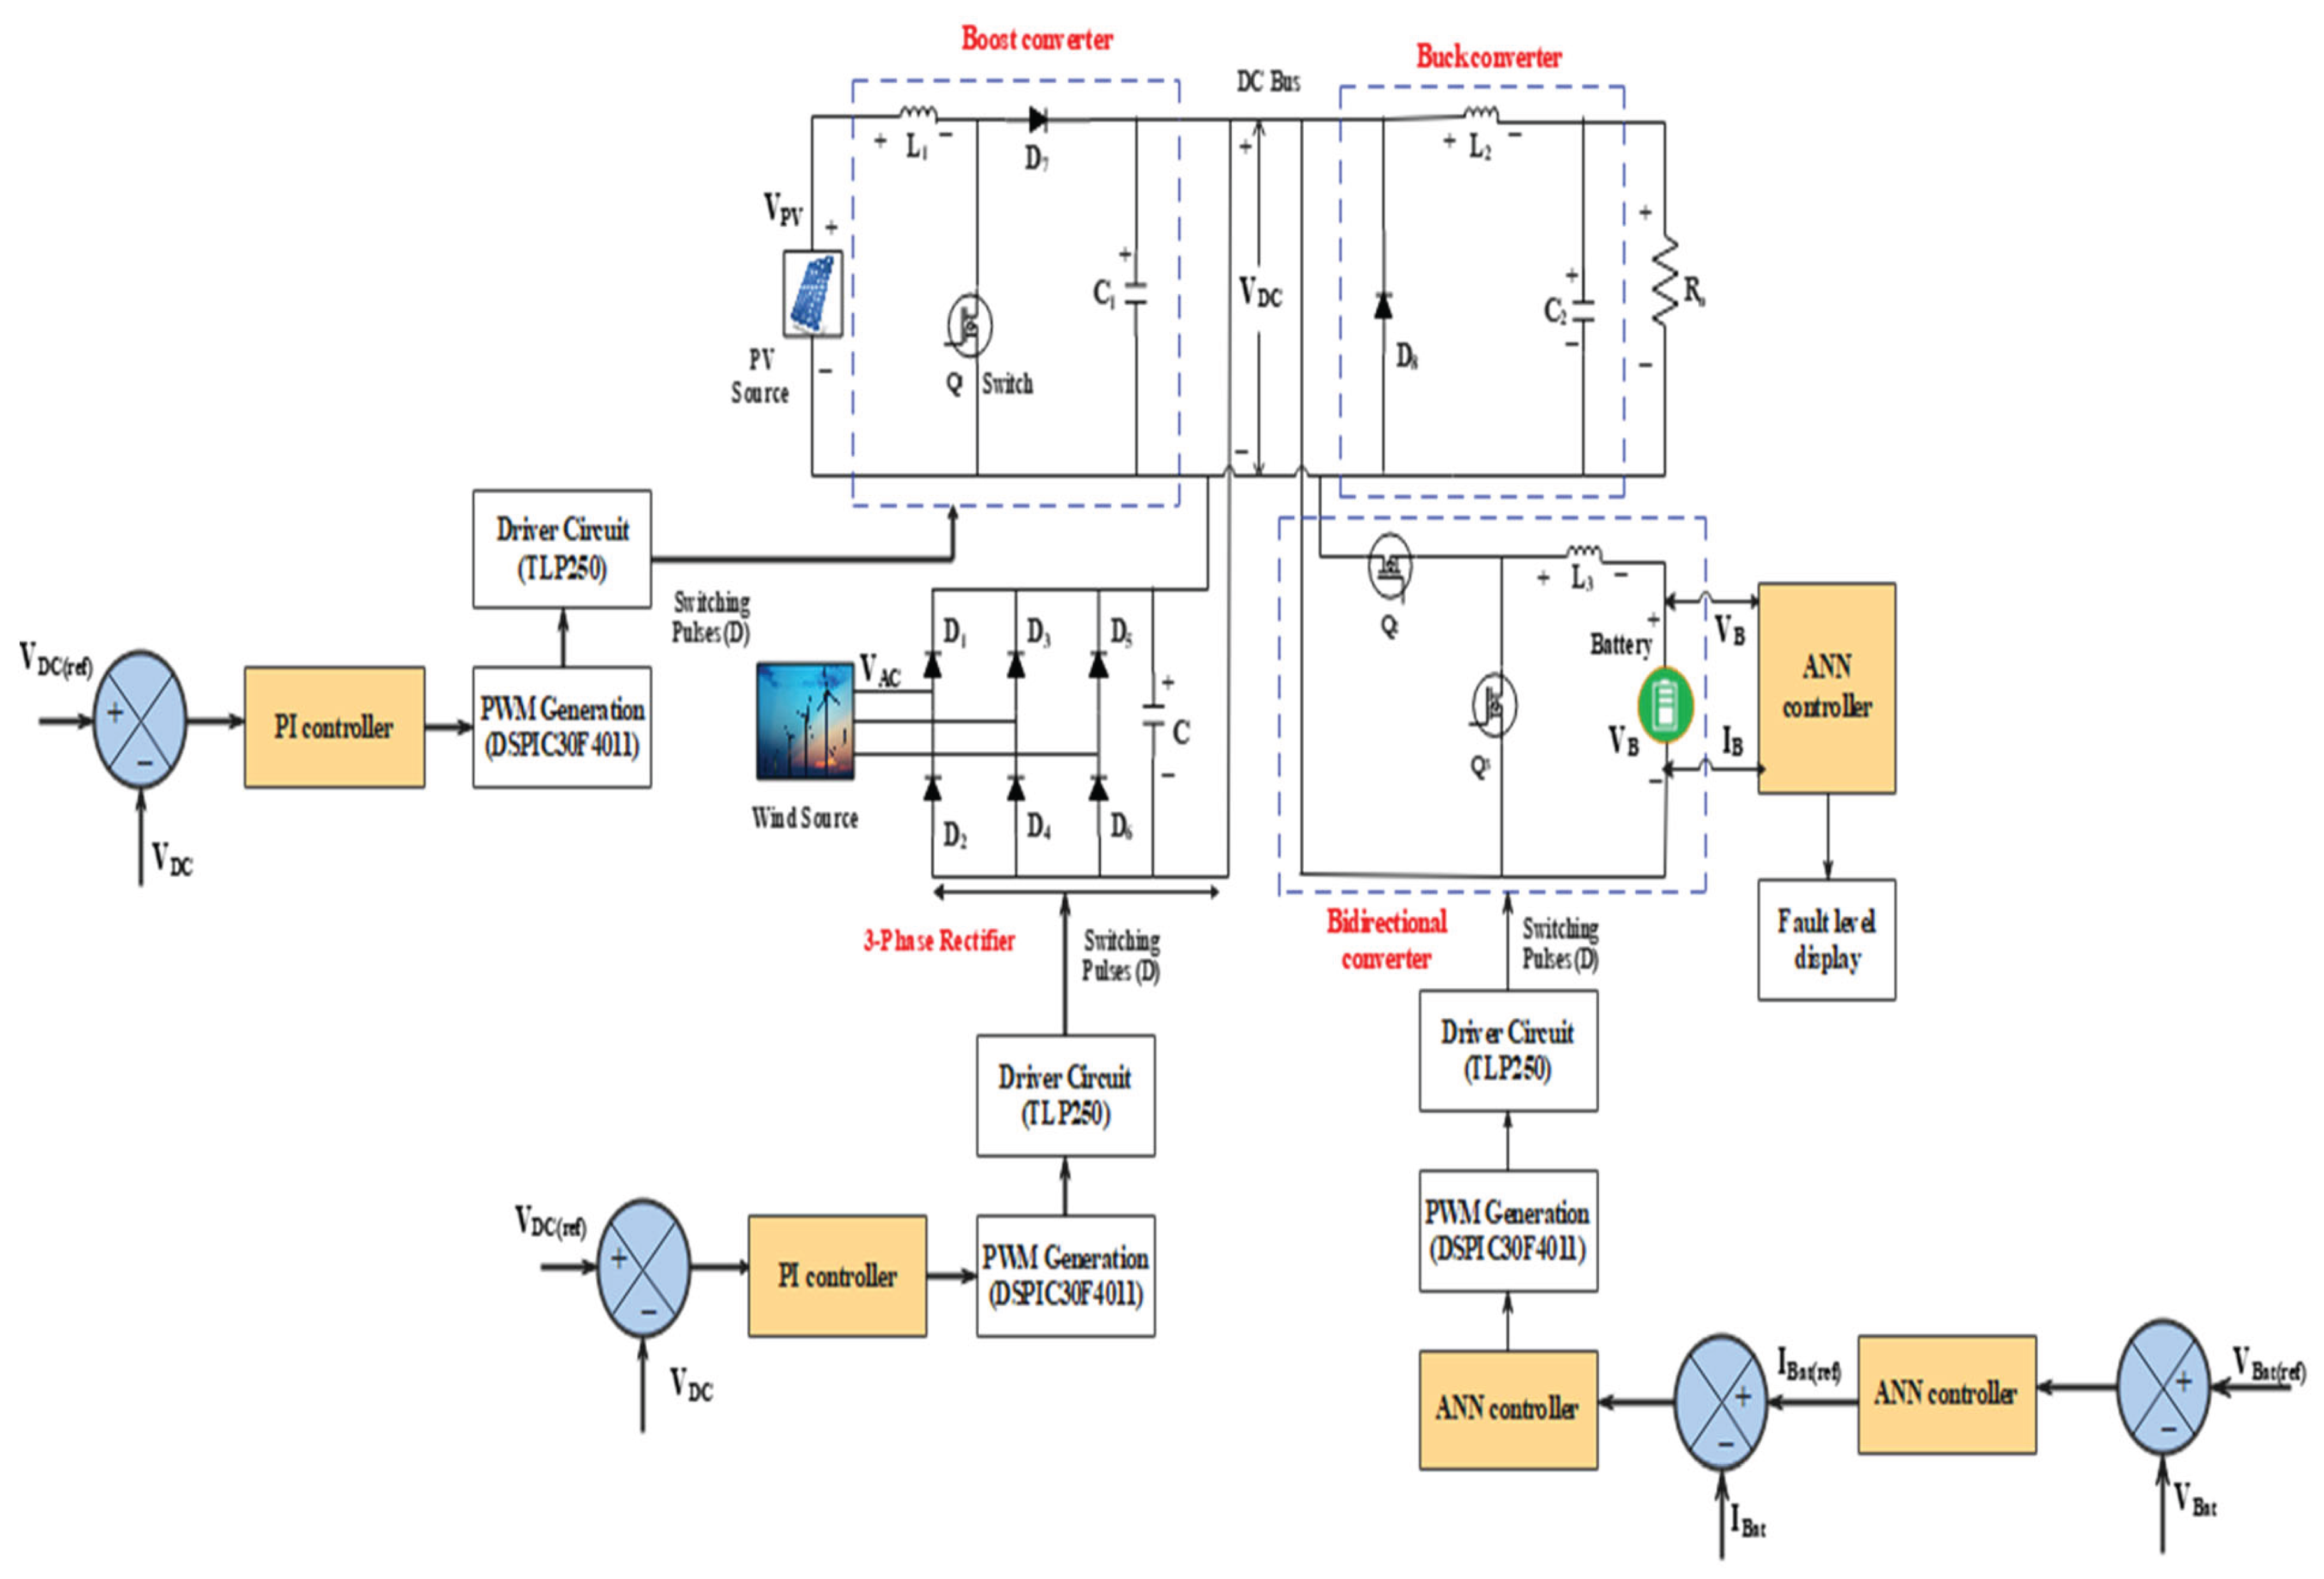
Figure 16.
Current and voltage characteristics of the PV system with dependence on irradiance and temperature.
Figure 16.
Current and voltage characteristics of the PV system with dependence on irradiance and temperature.
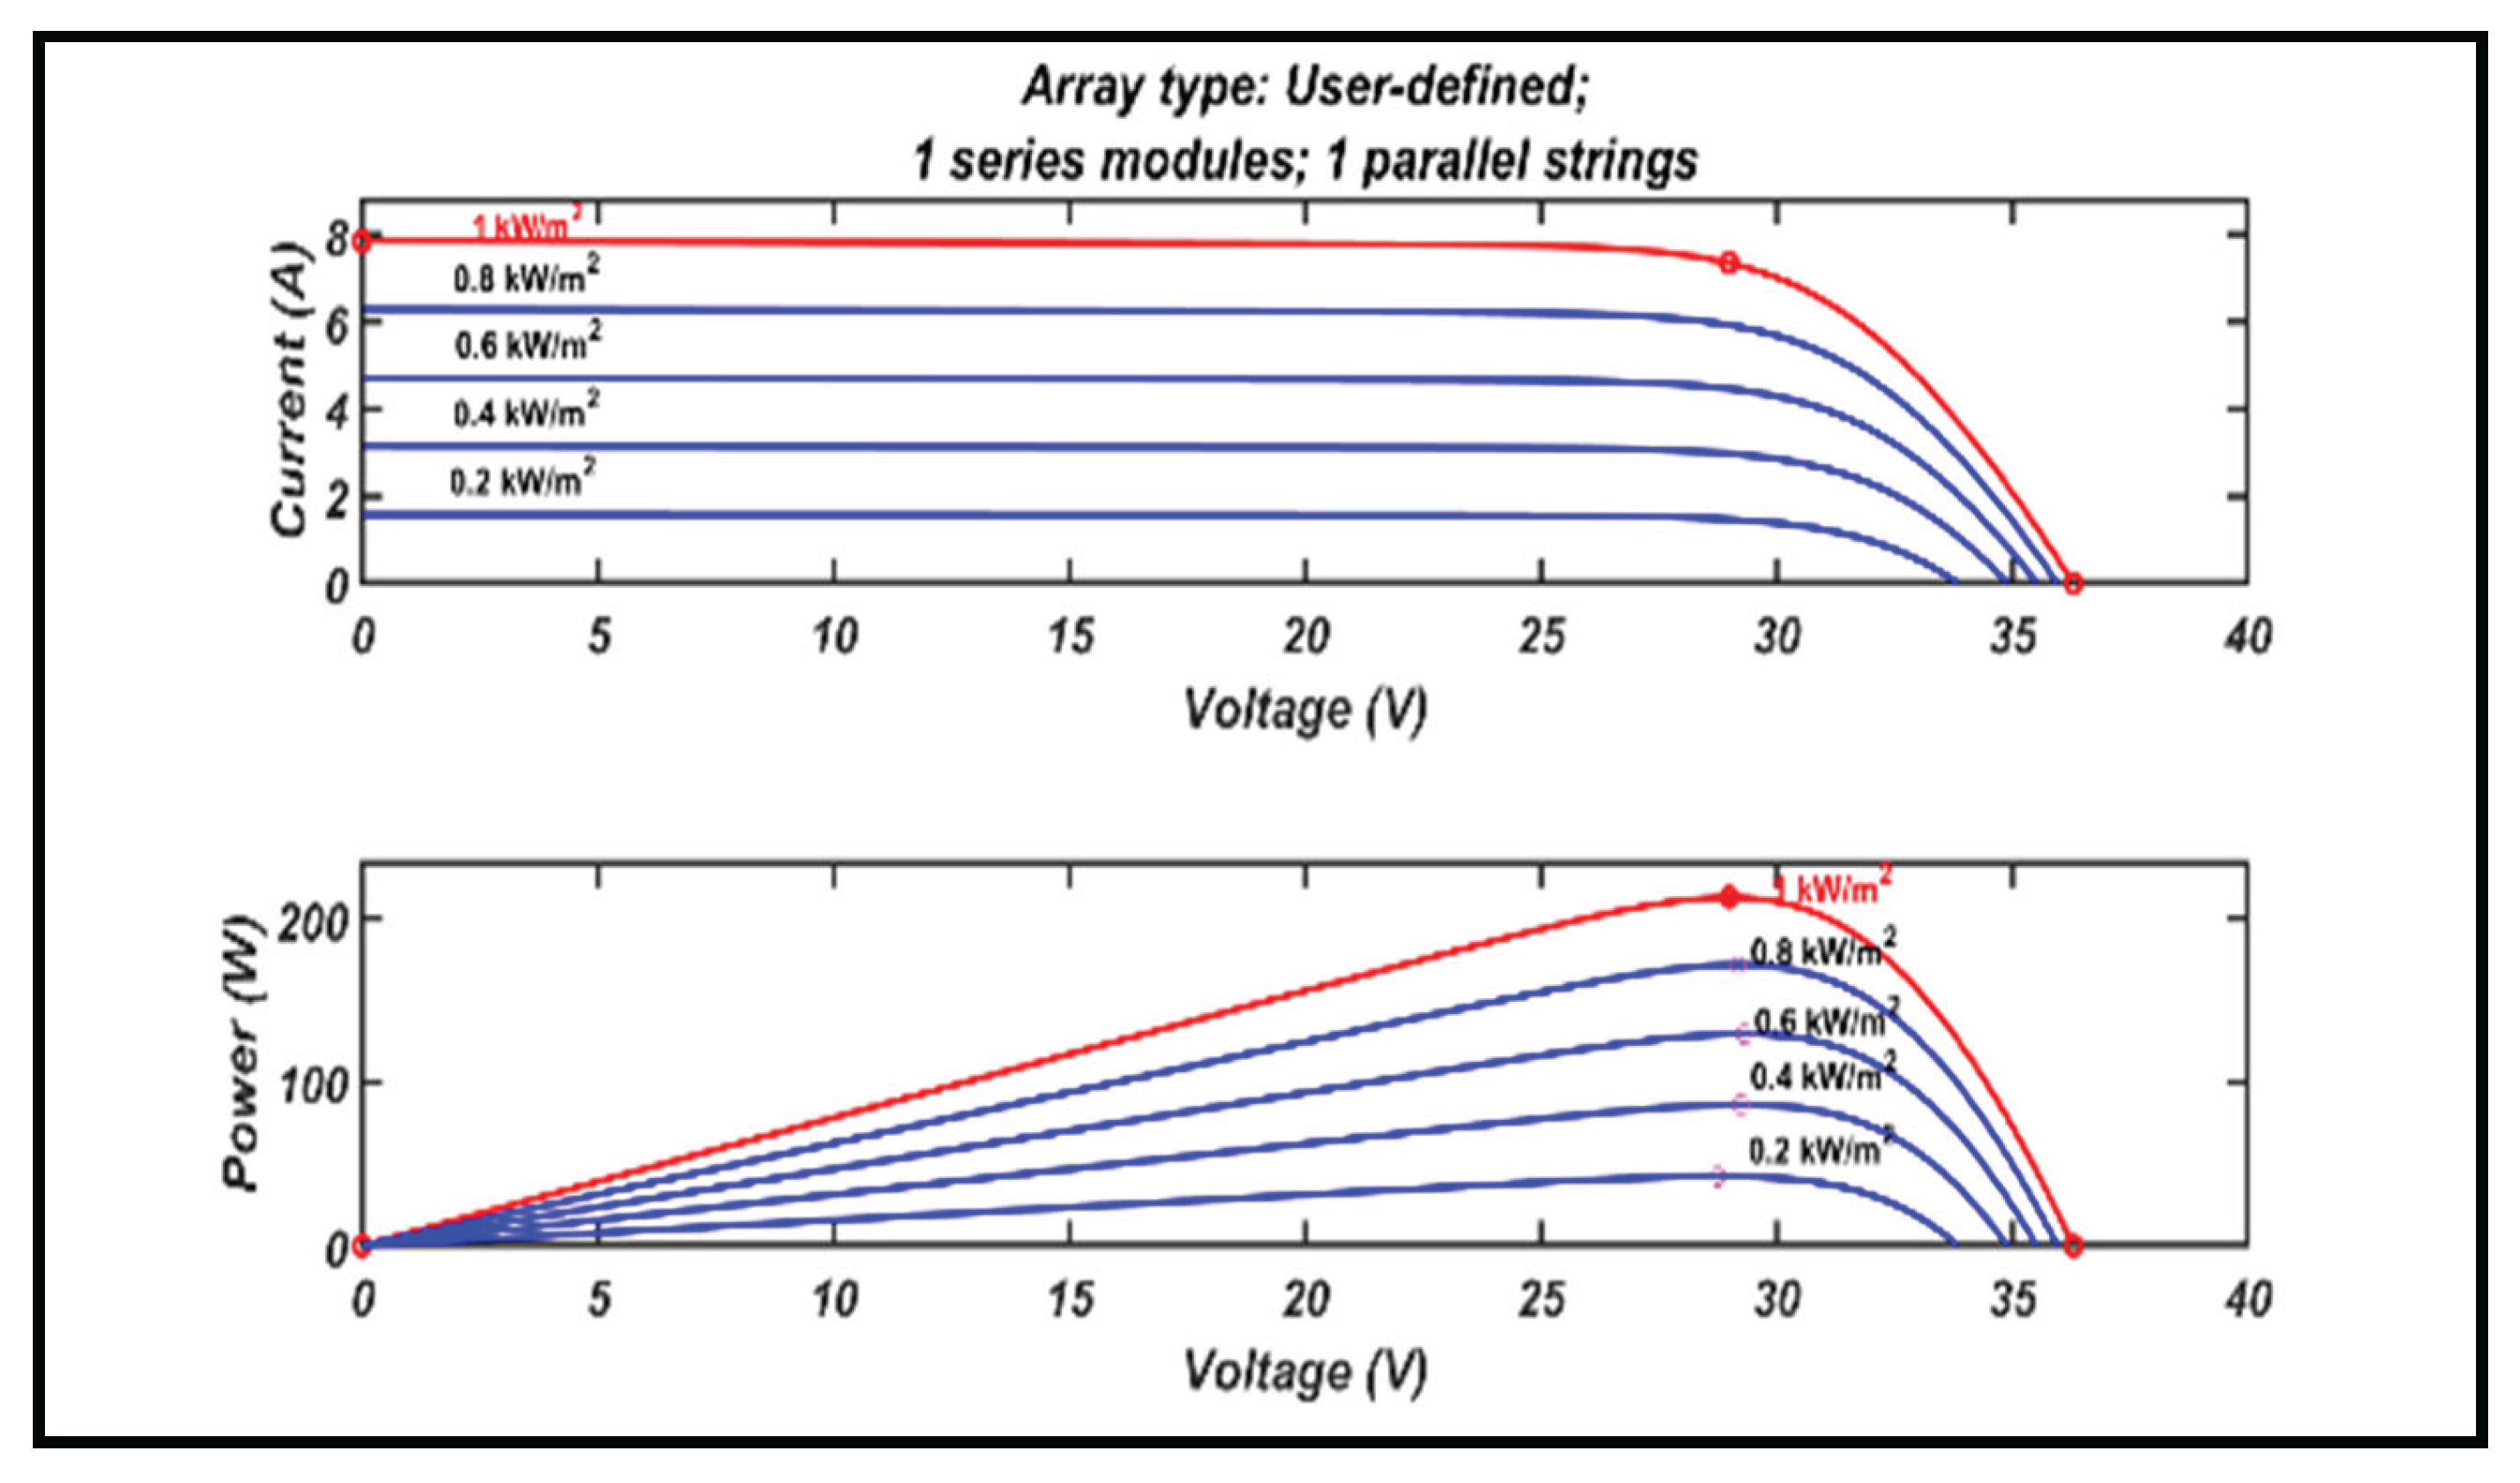
Figure 17.
Simulink model of the system.
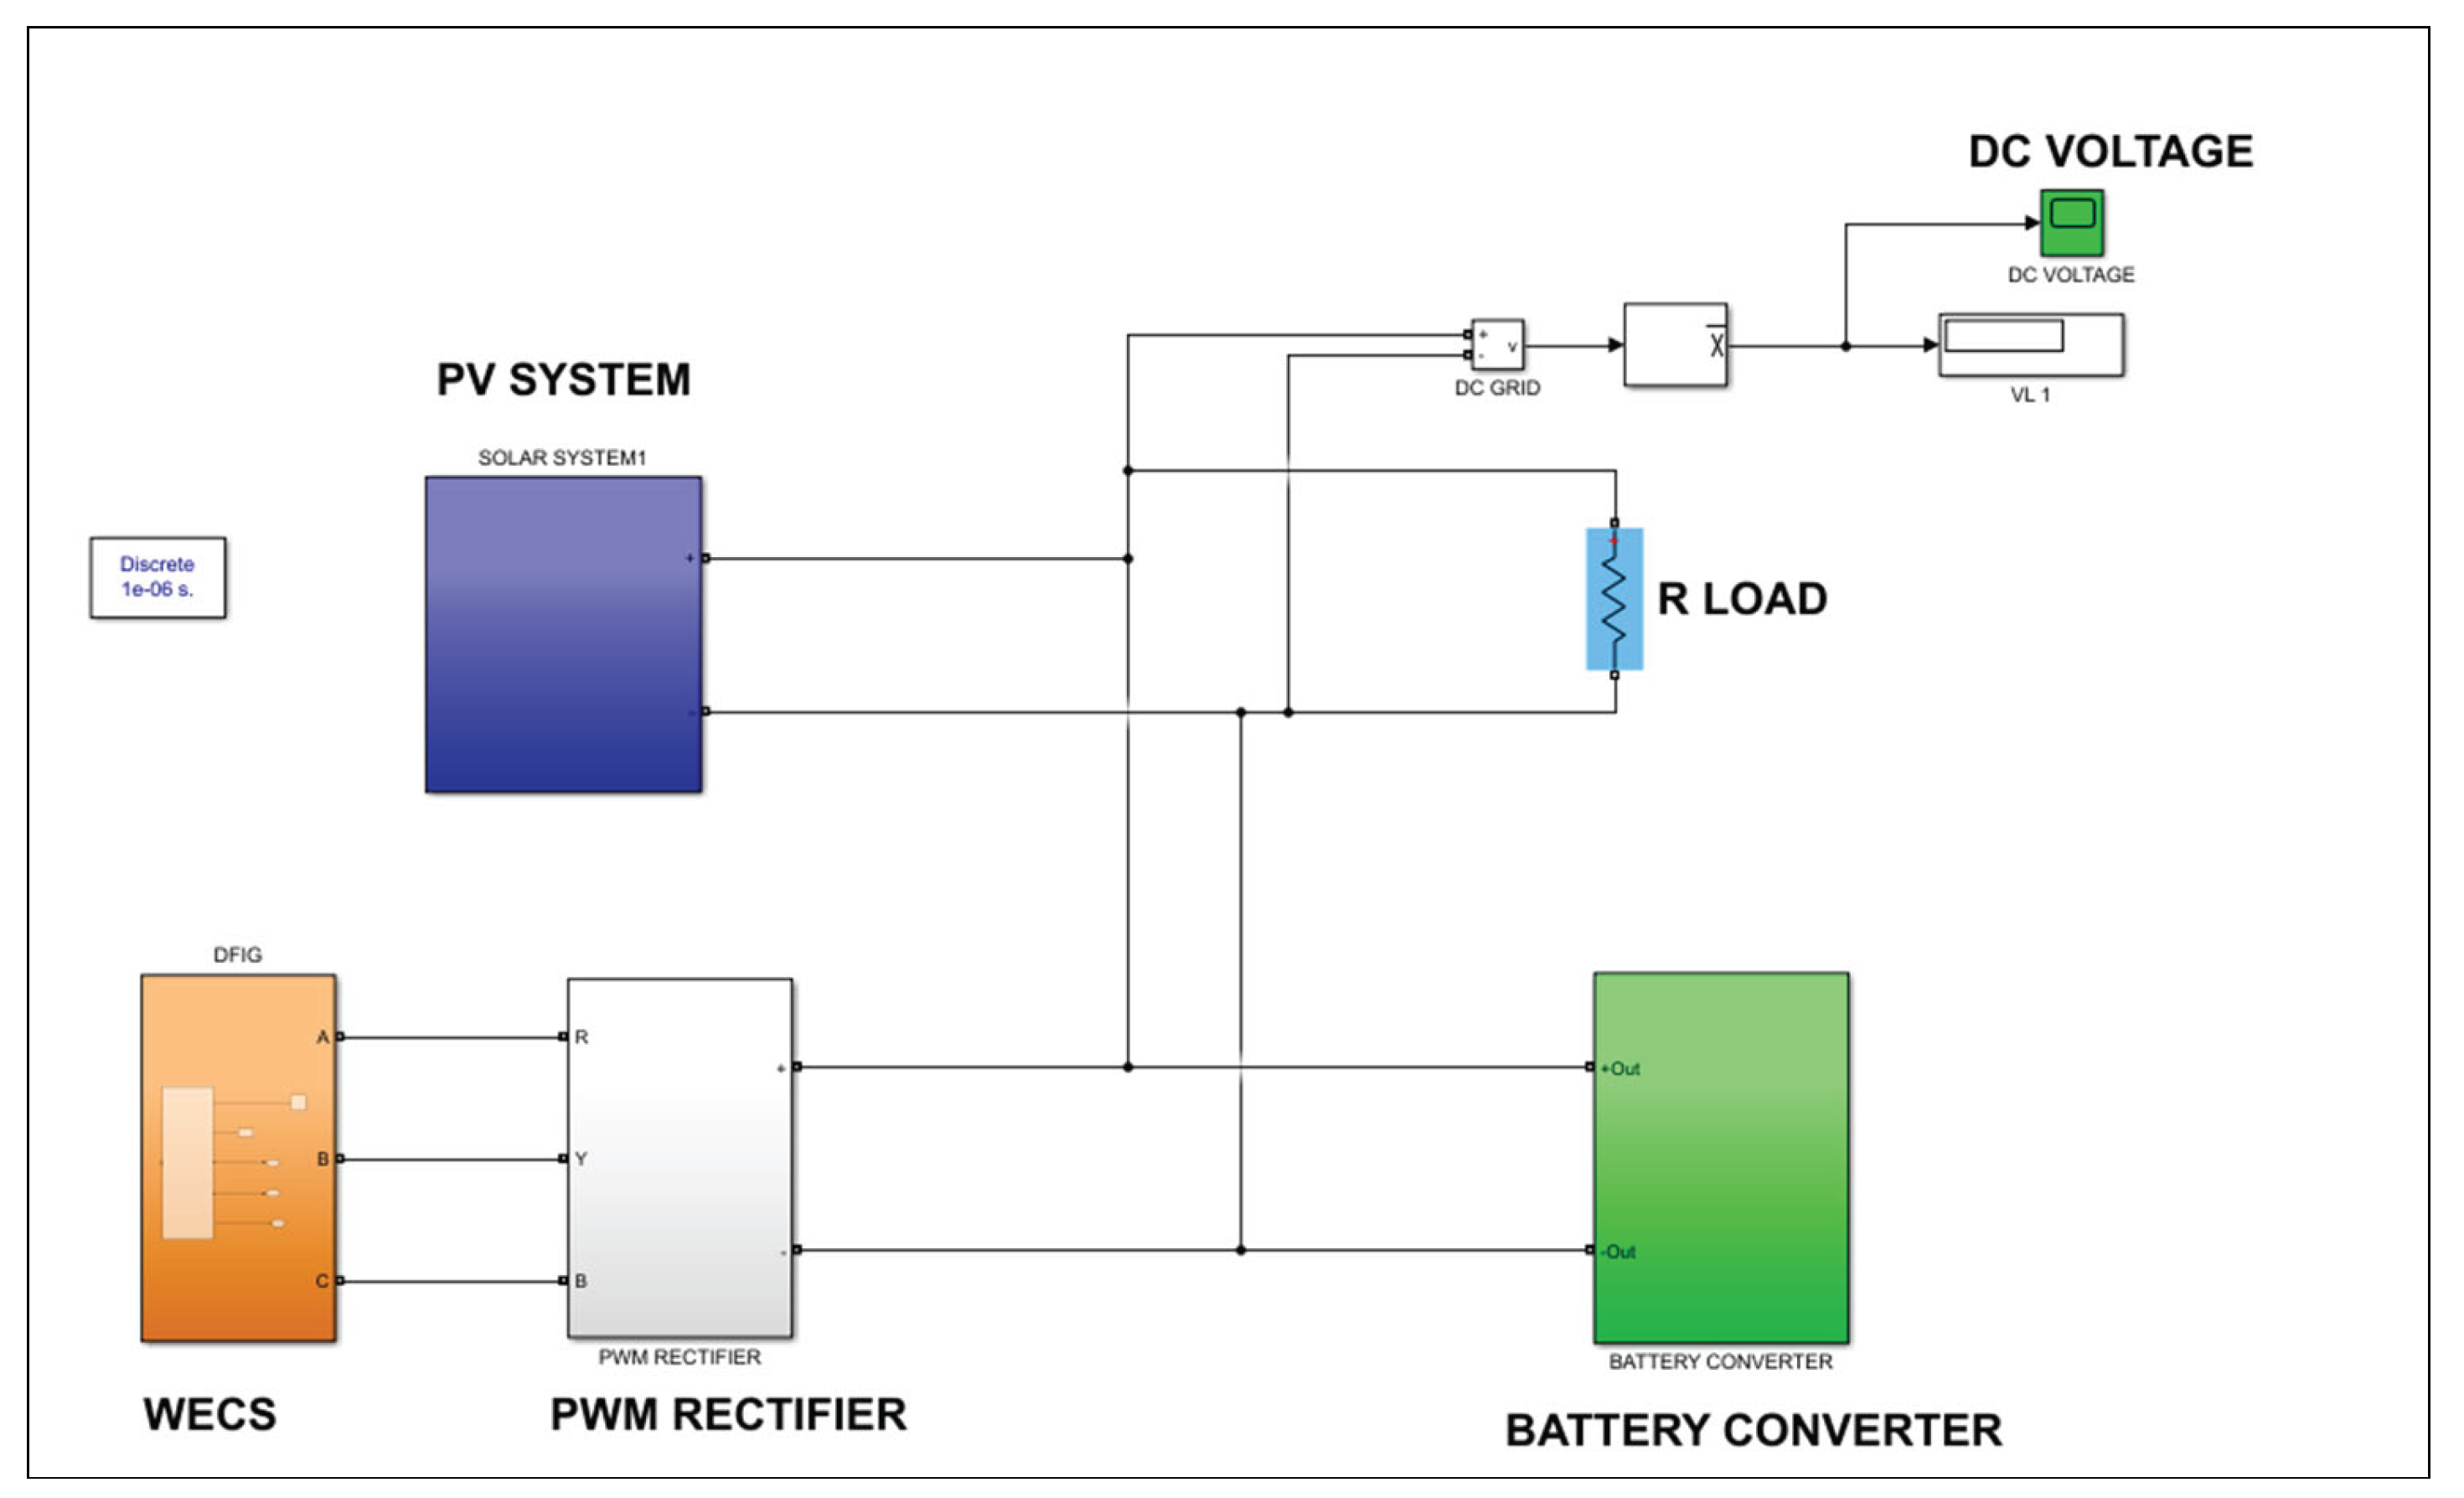
Figure 18.
Simulation of a Wind Energy Conversion System (WECS) with PWM rectifier.
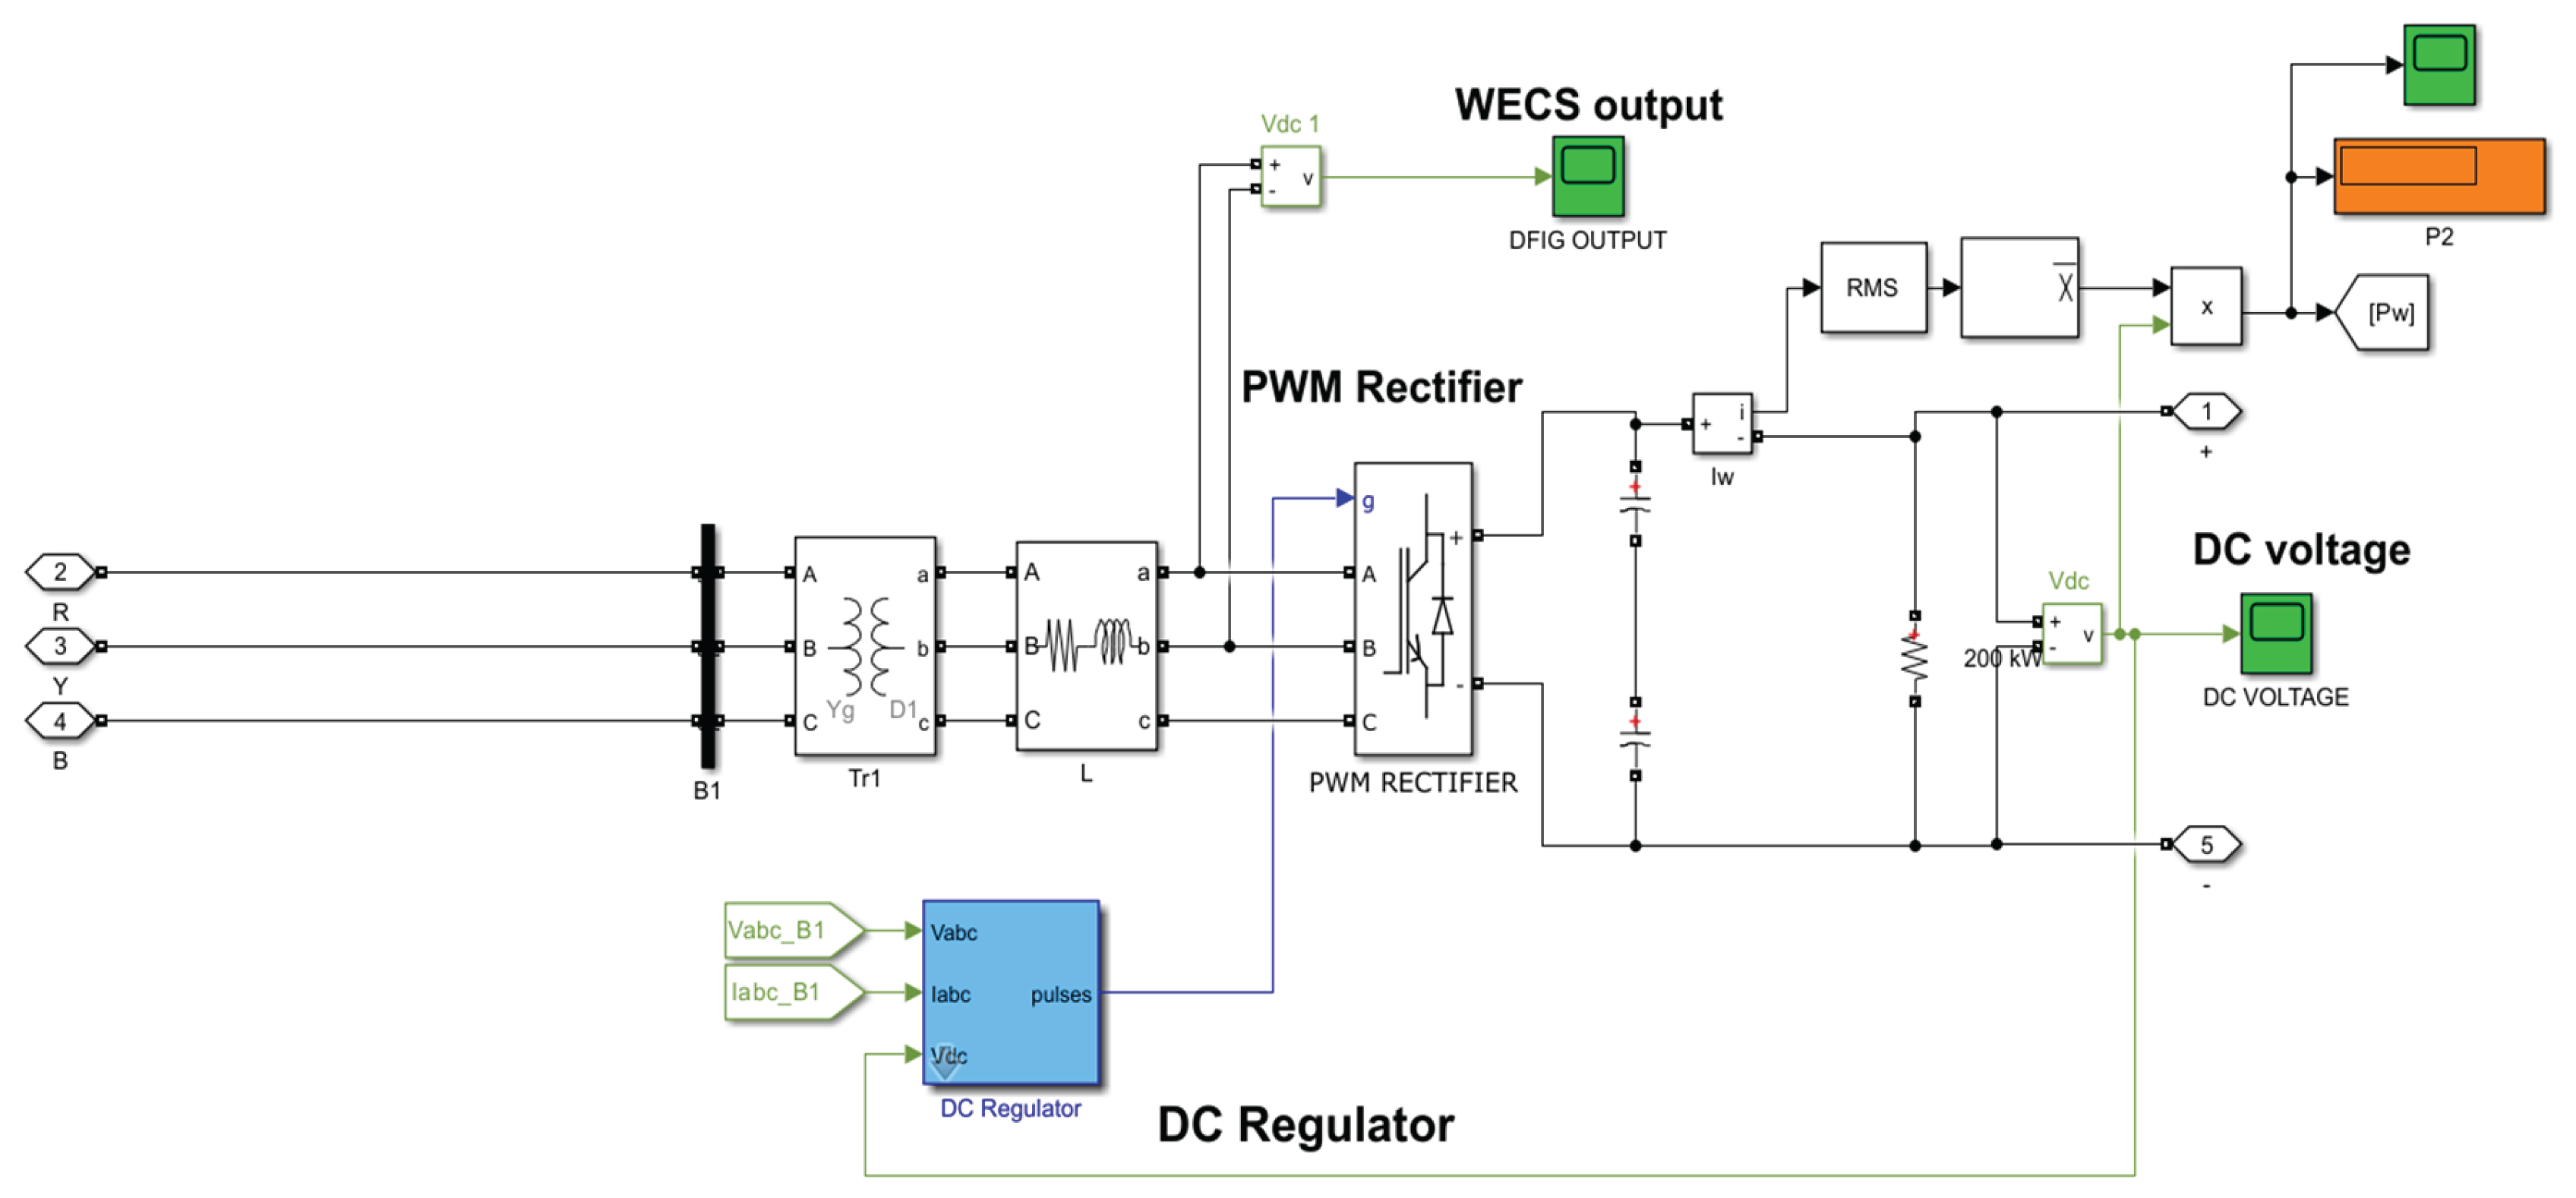
Figure 19.
Simulation circuit of fault detection using an ANN controller.
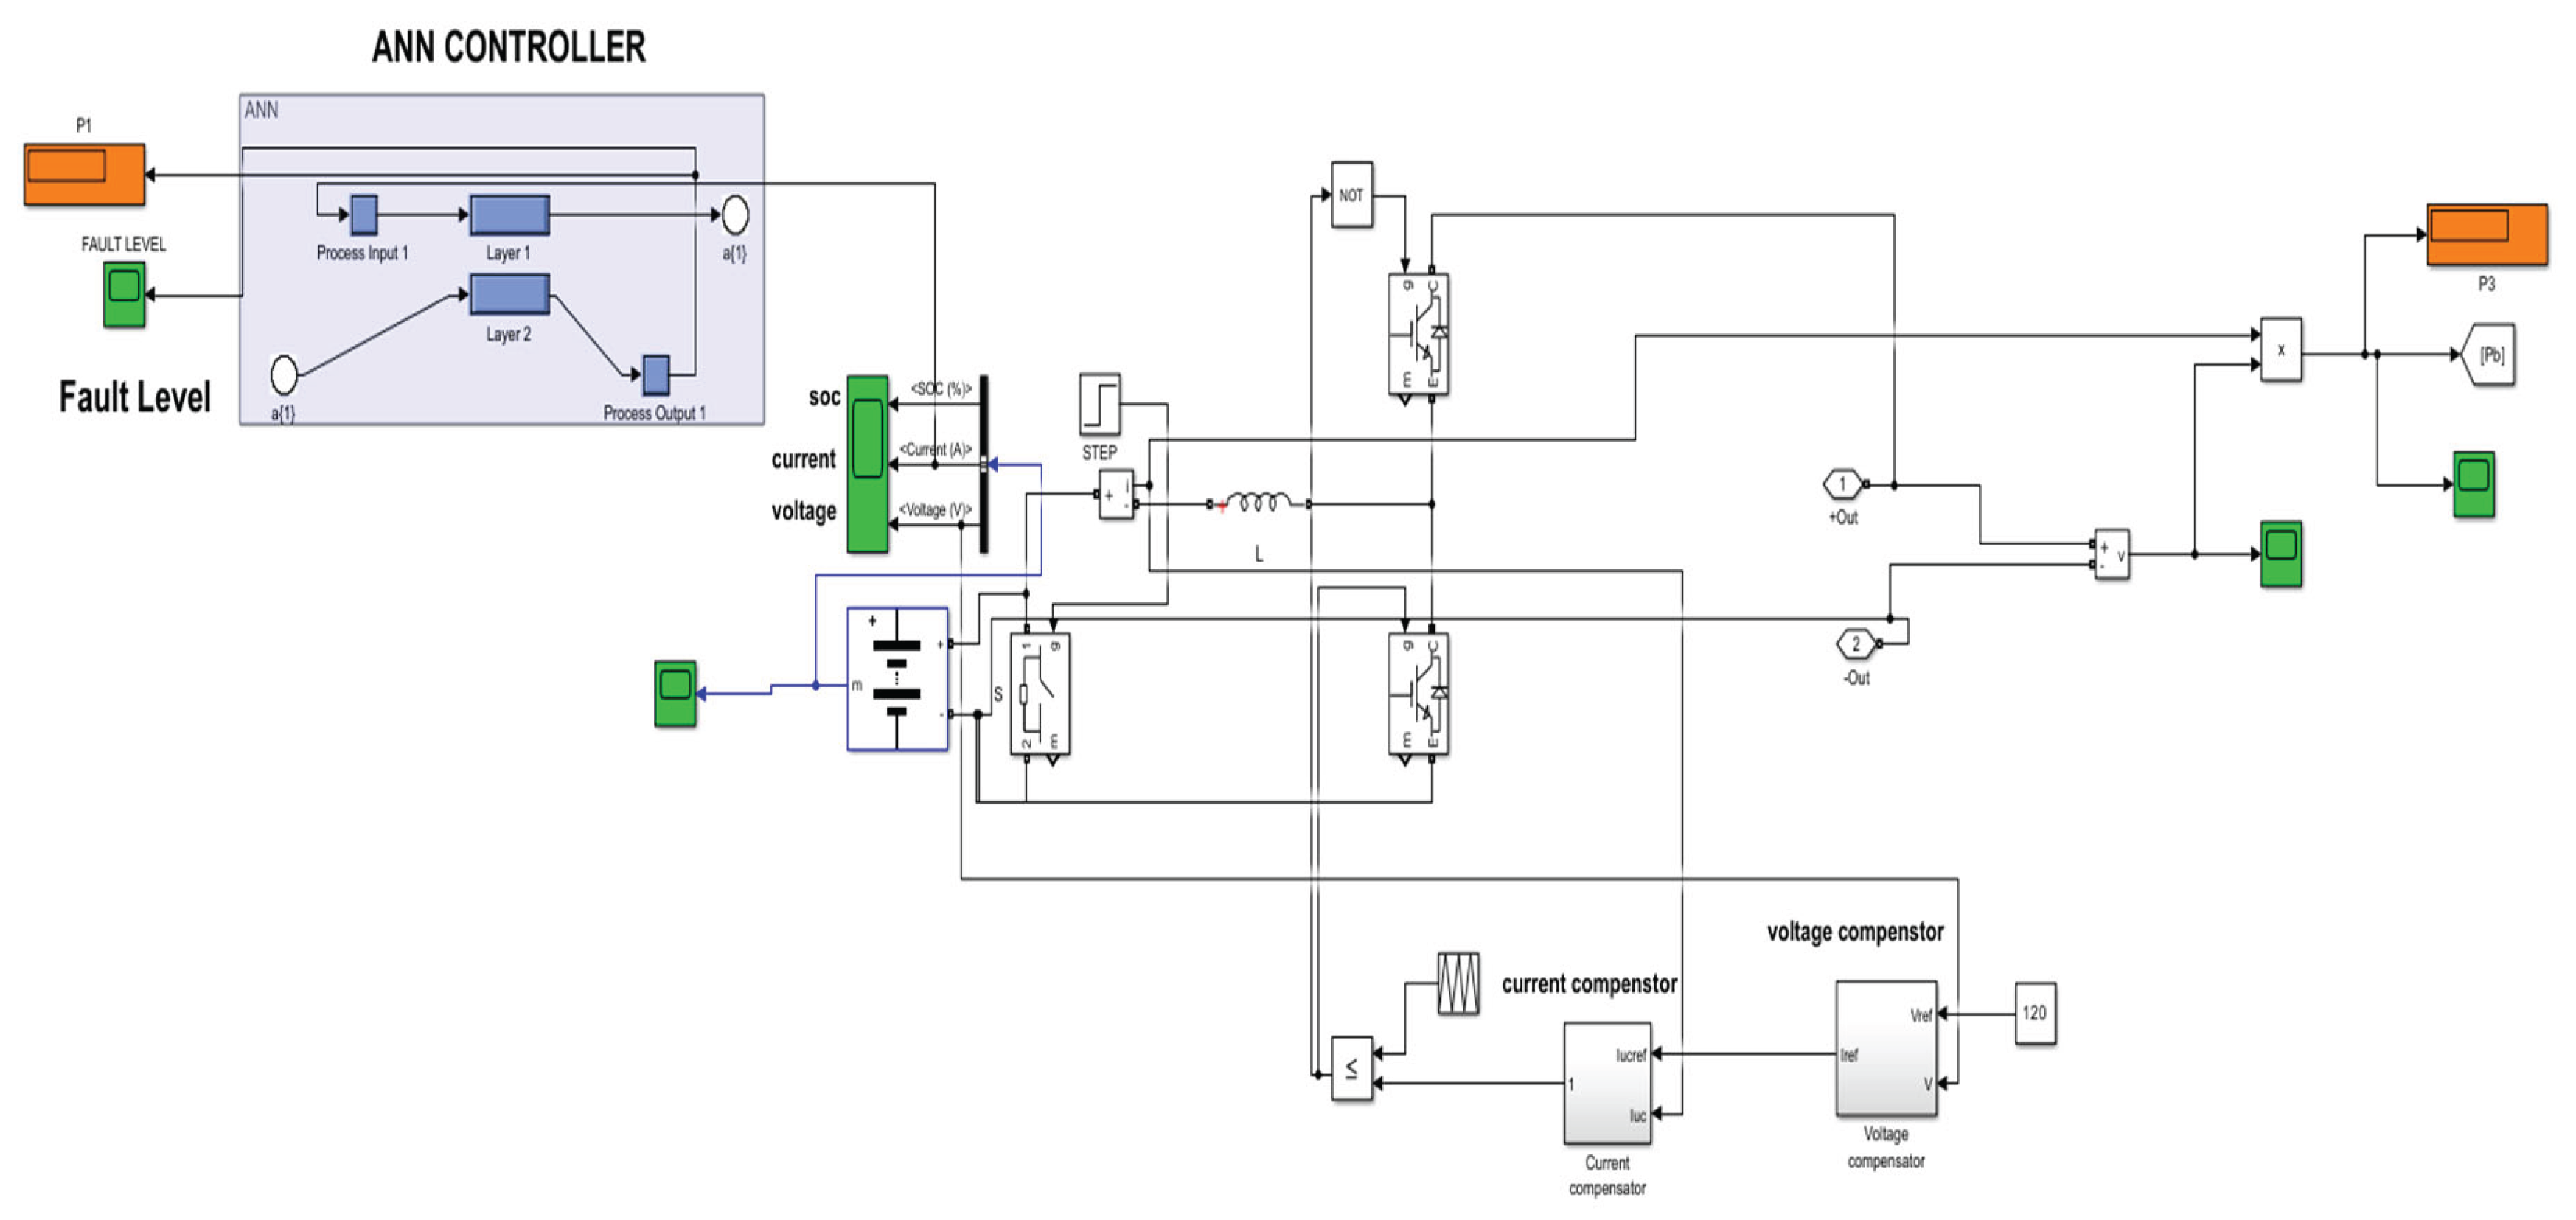
Figure 20.
Solar PV irradiance waveform.
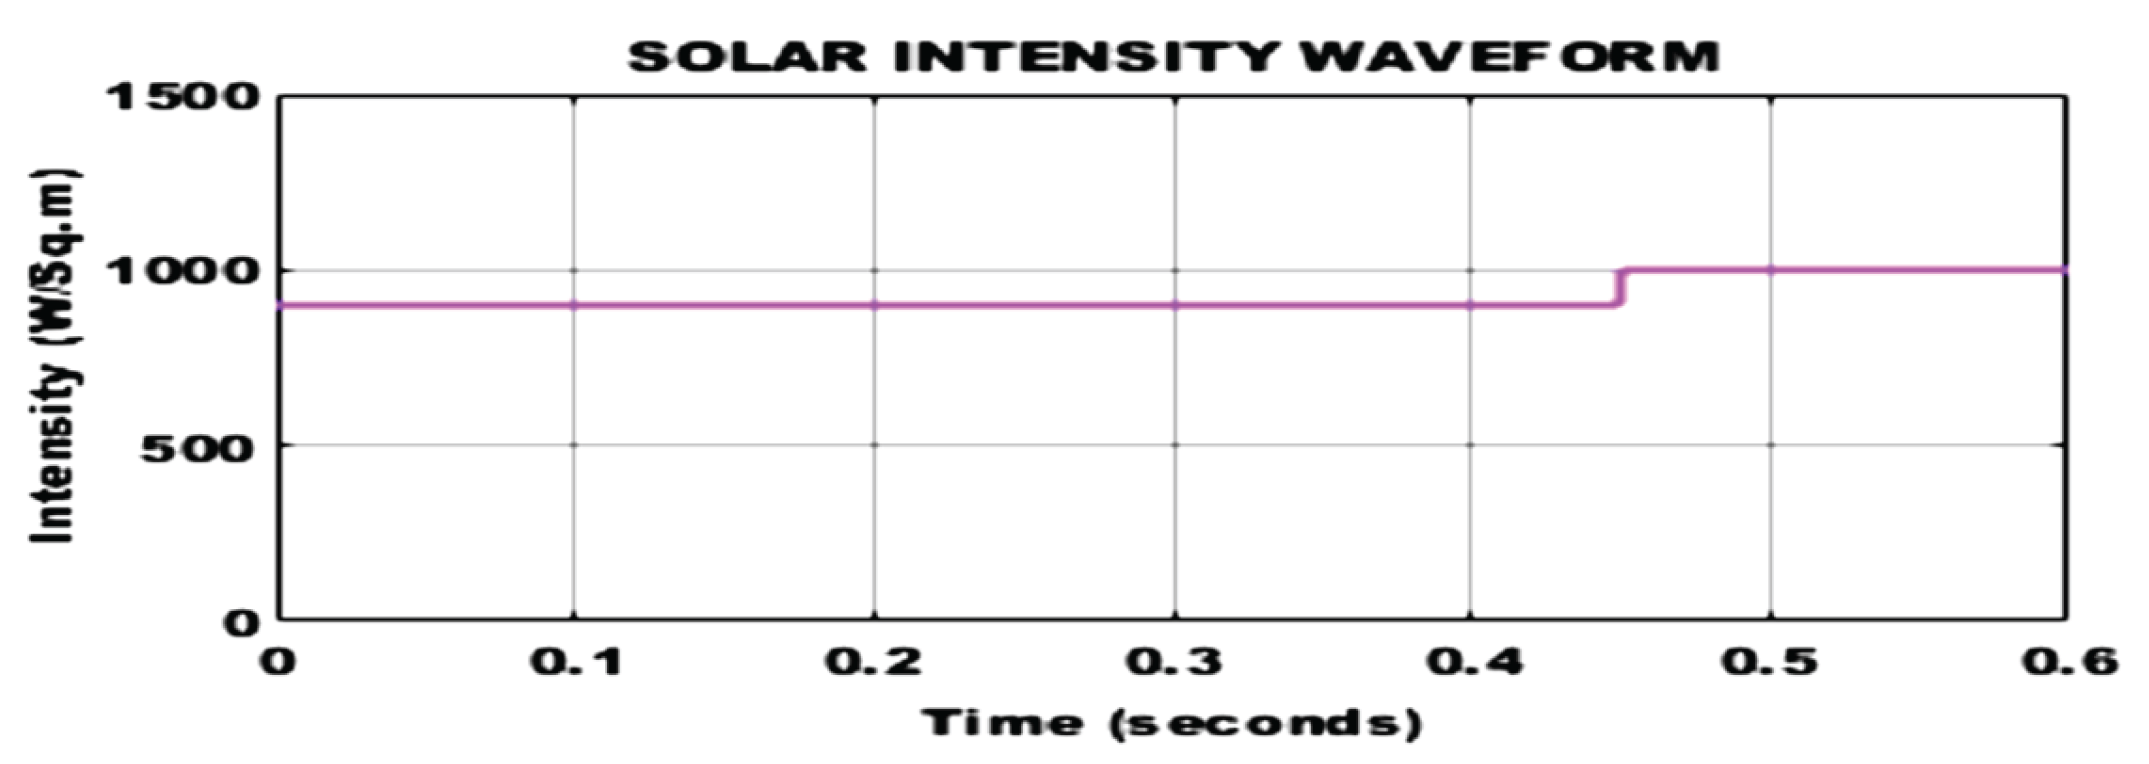
Figure 21.
Simulation result of boost converter’s source and load current.
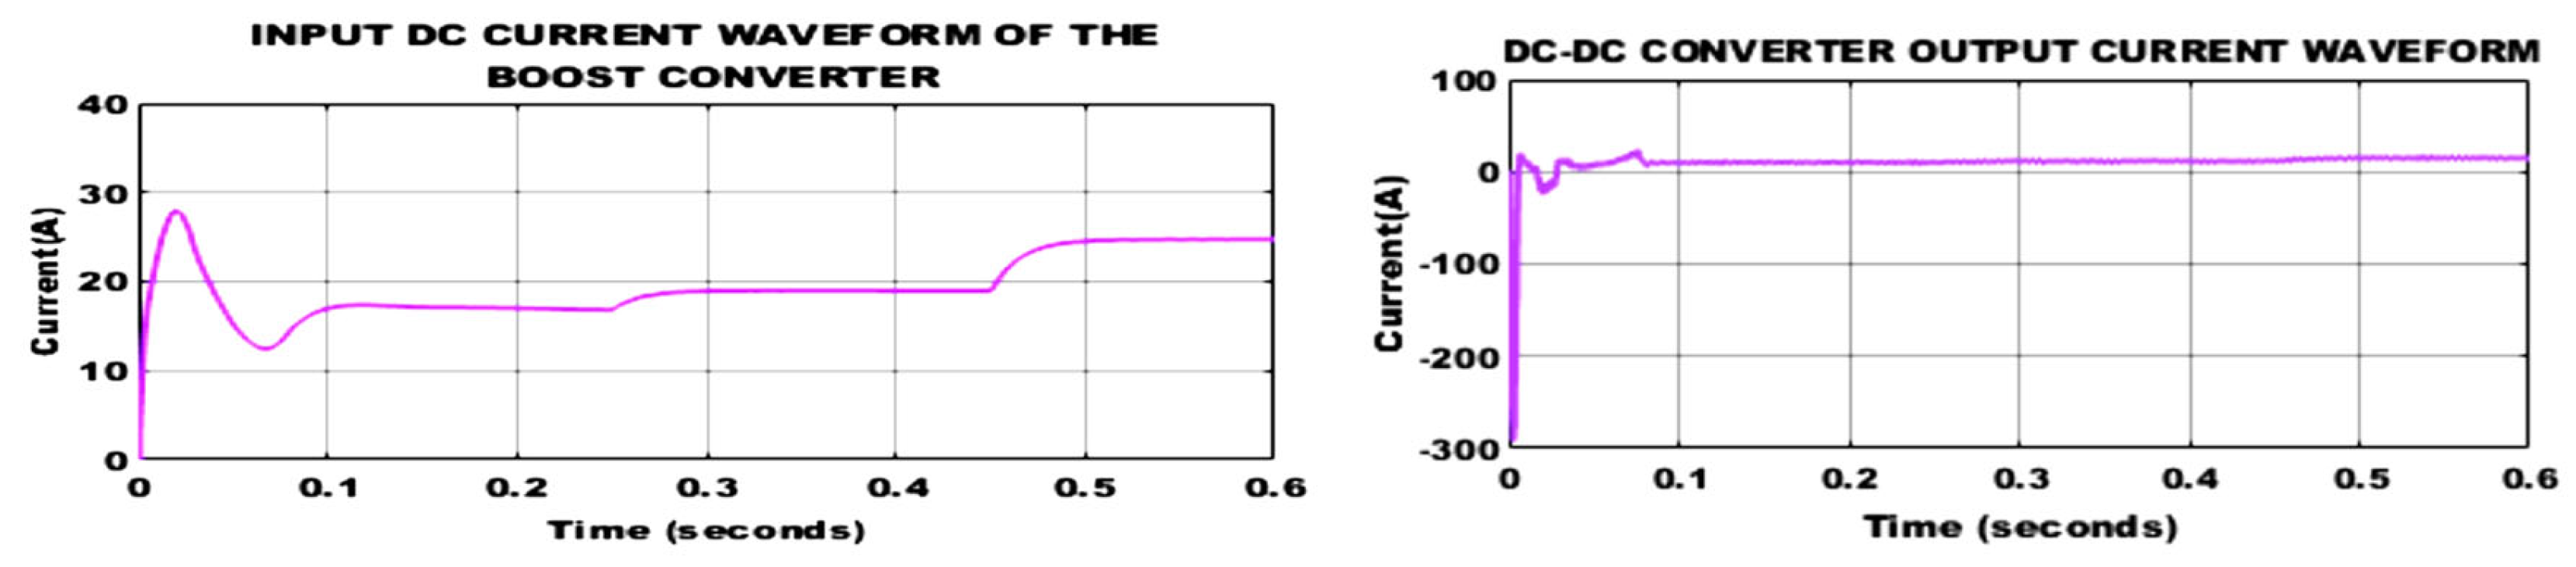
Figure 22.
Simulation result of boost converter’s input and load voltage.
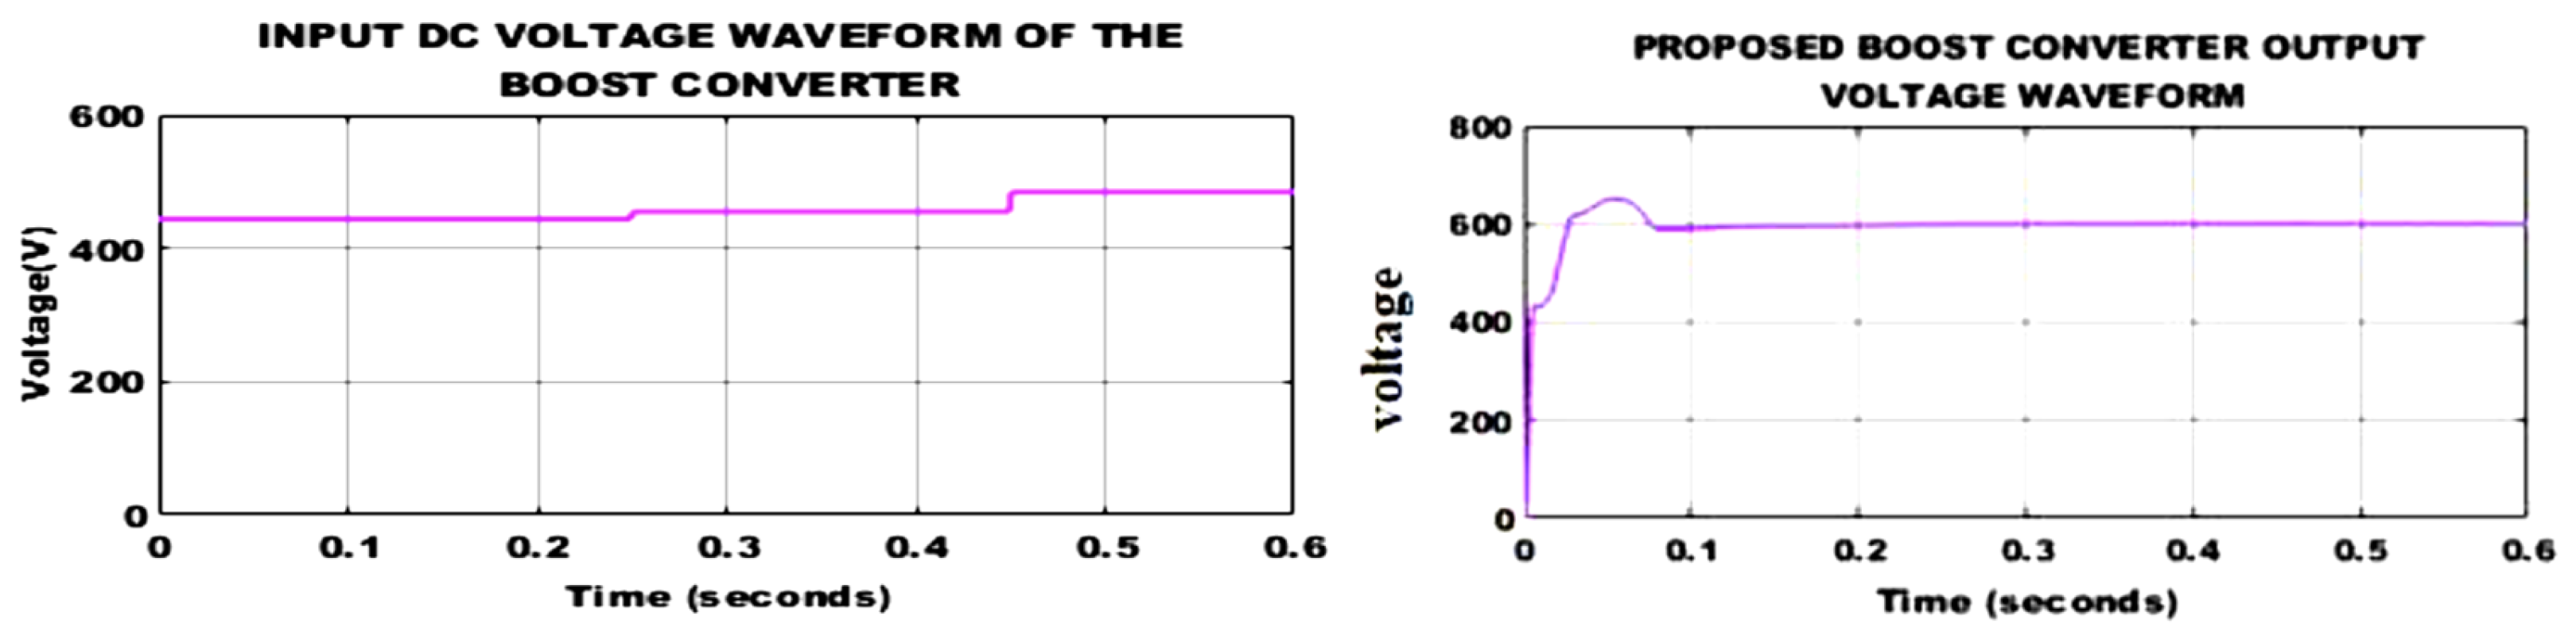
Figure 23.
Output voltage waveforms of the DFIG and PWM rectifier.
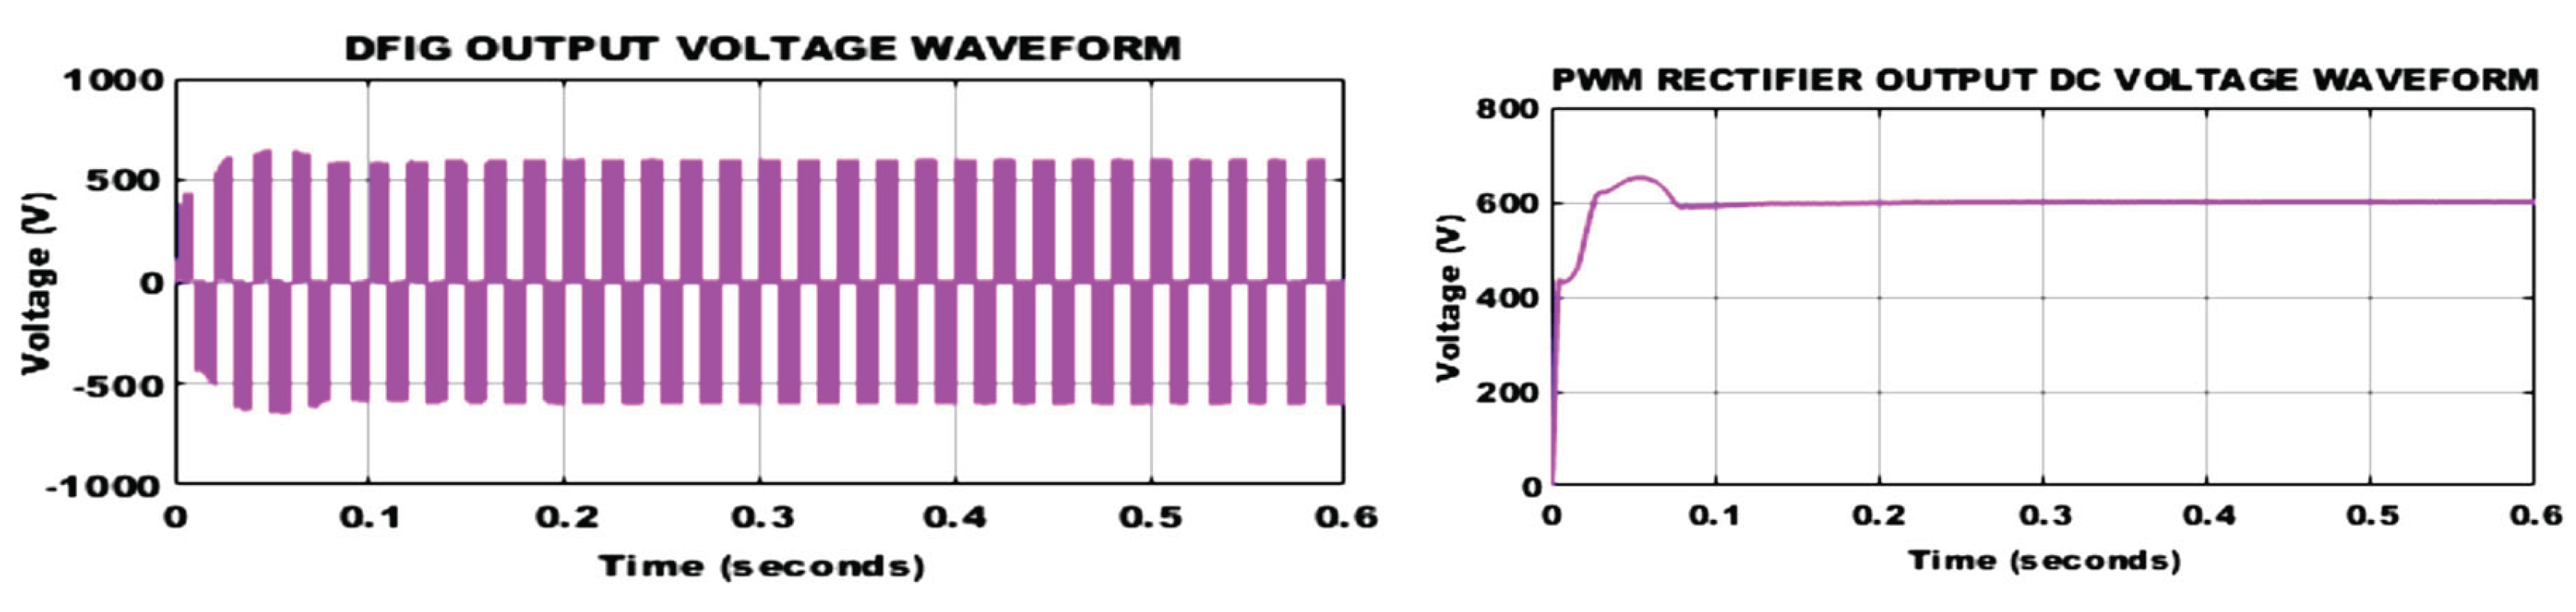
Figure 24.
Battery characteristics.
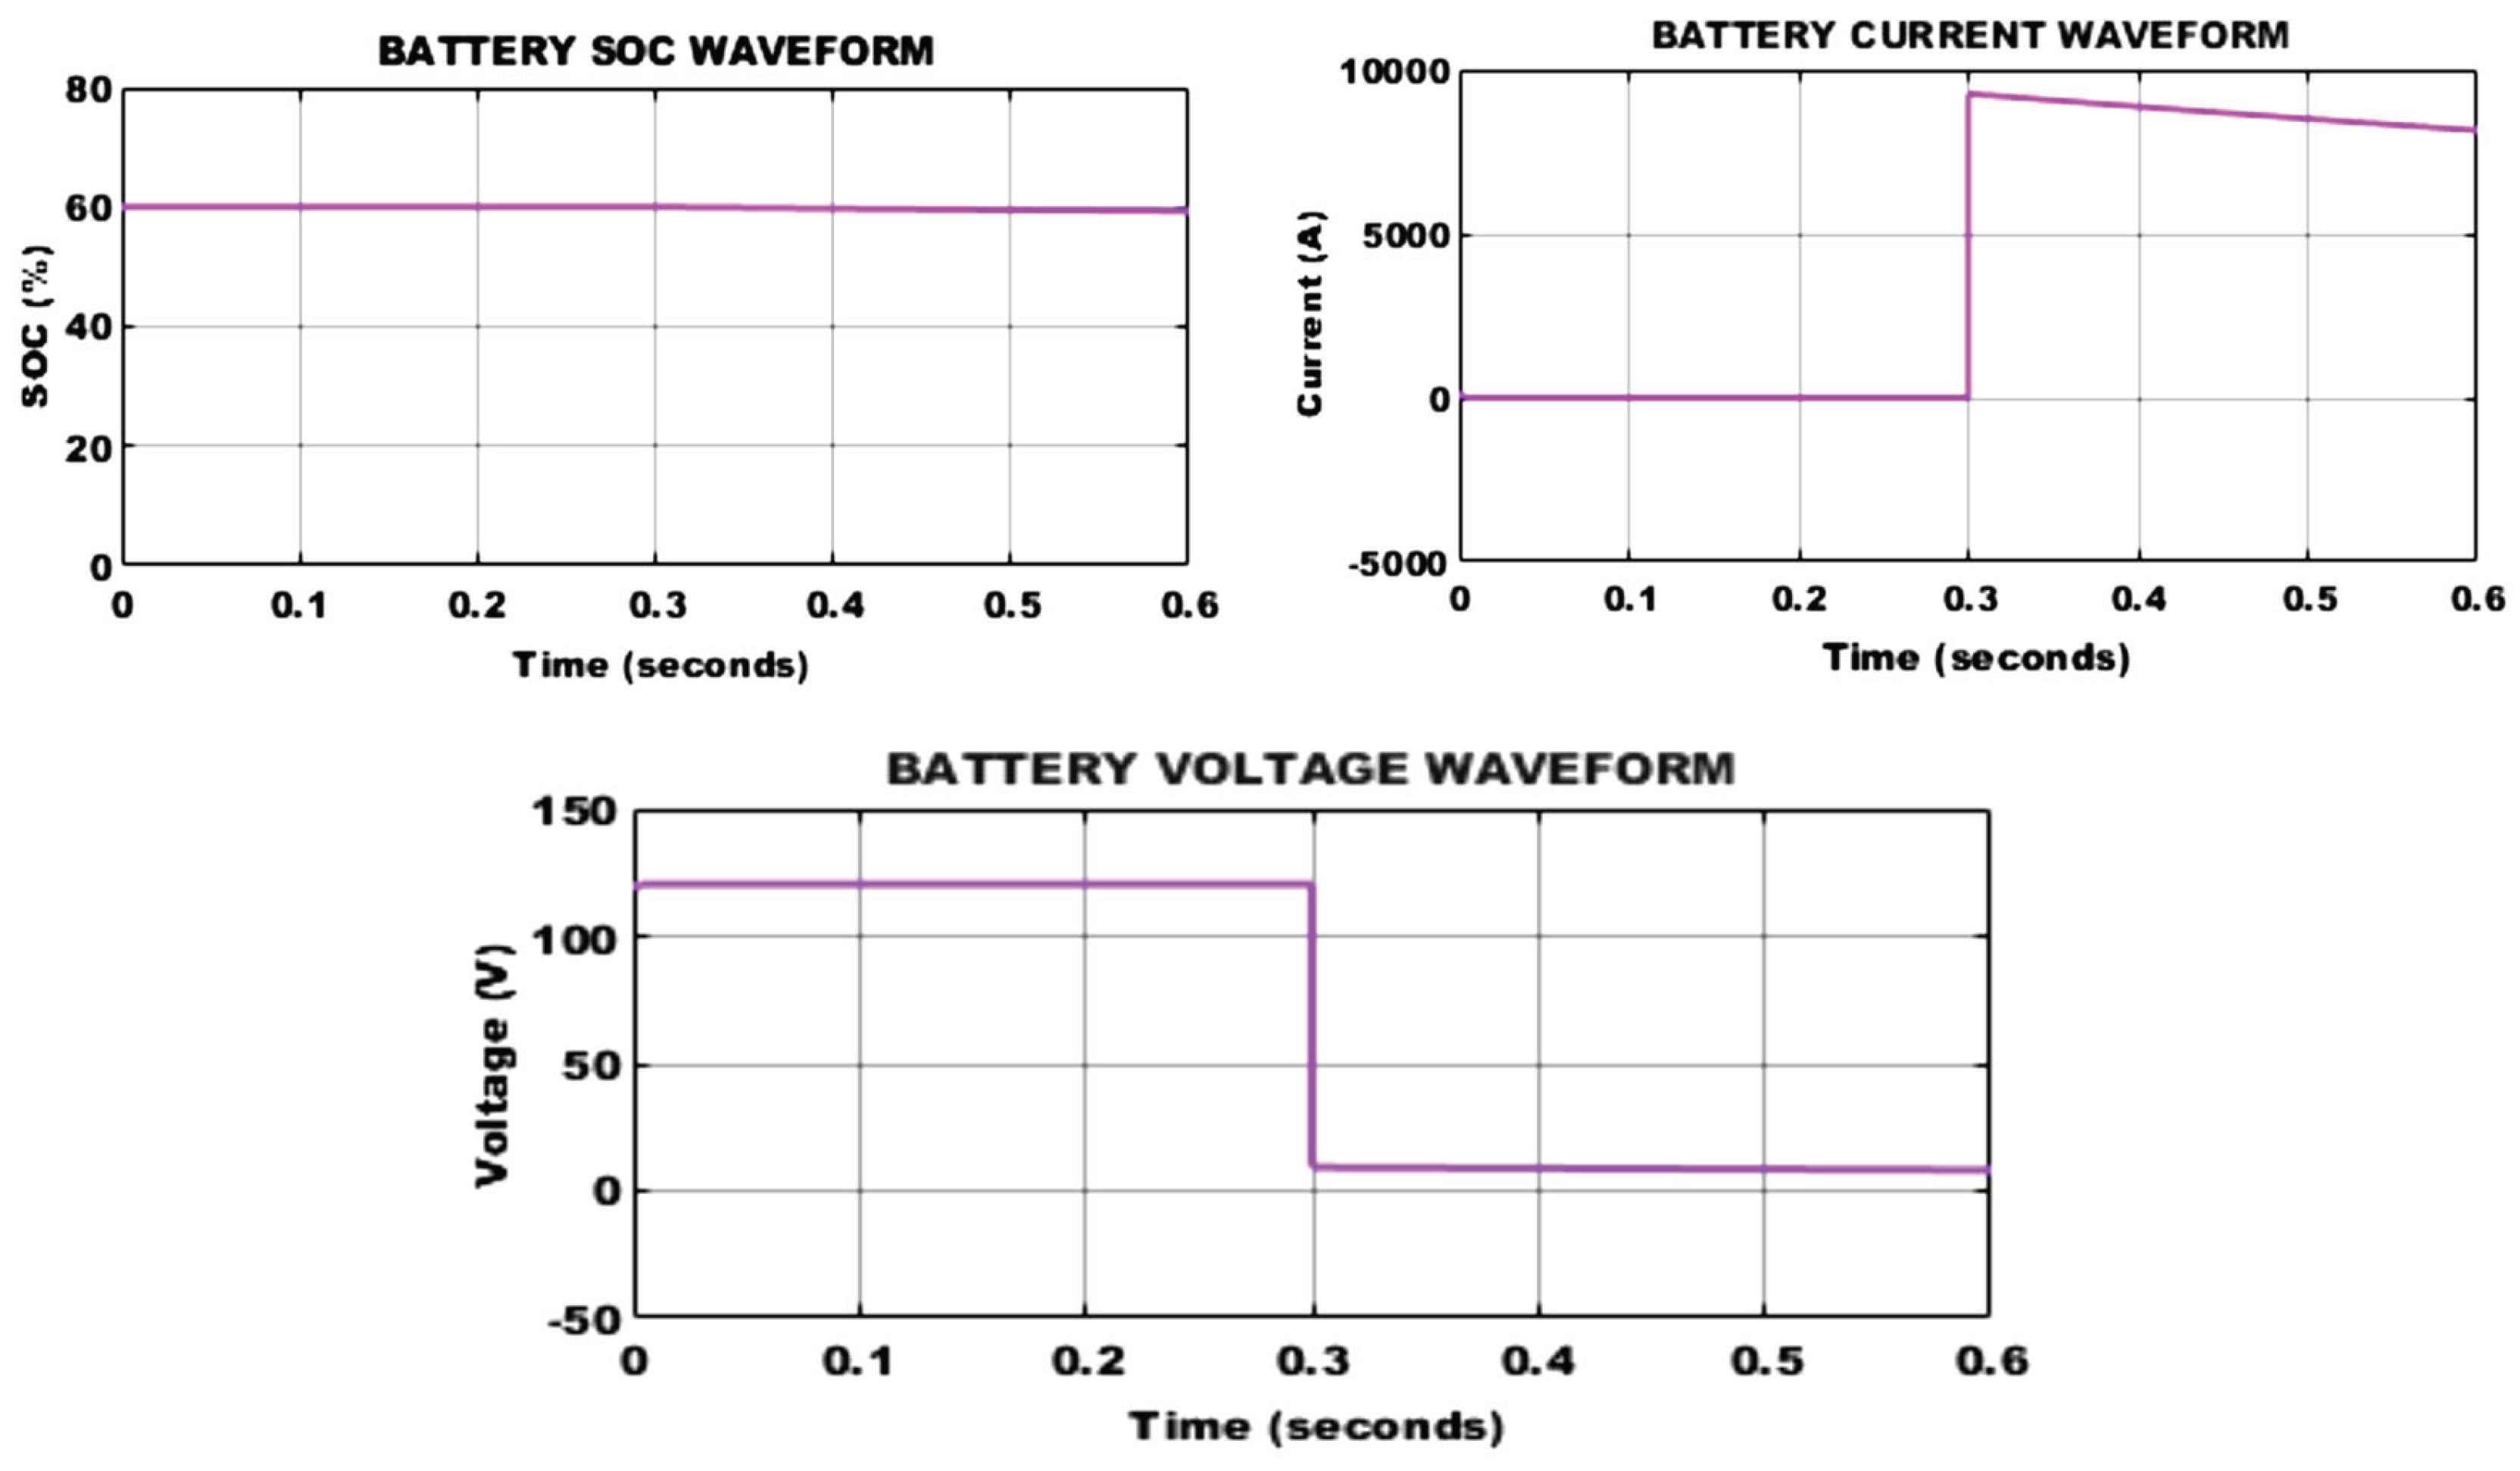
Figure 25.
Simulink of fault detection using an ANN controller.
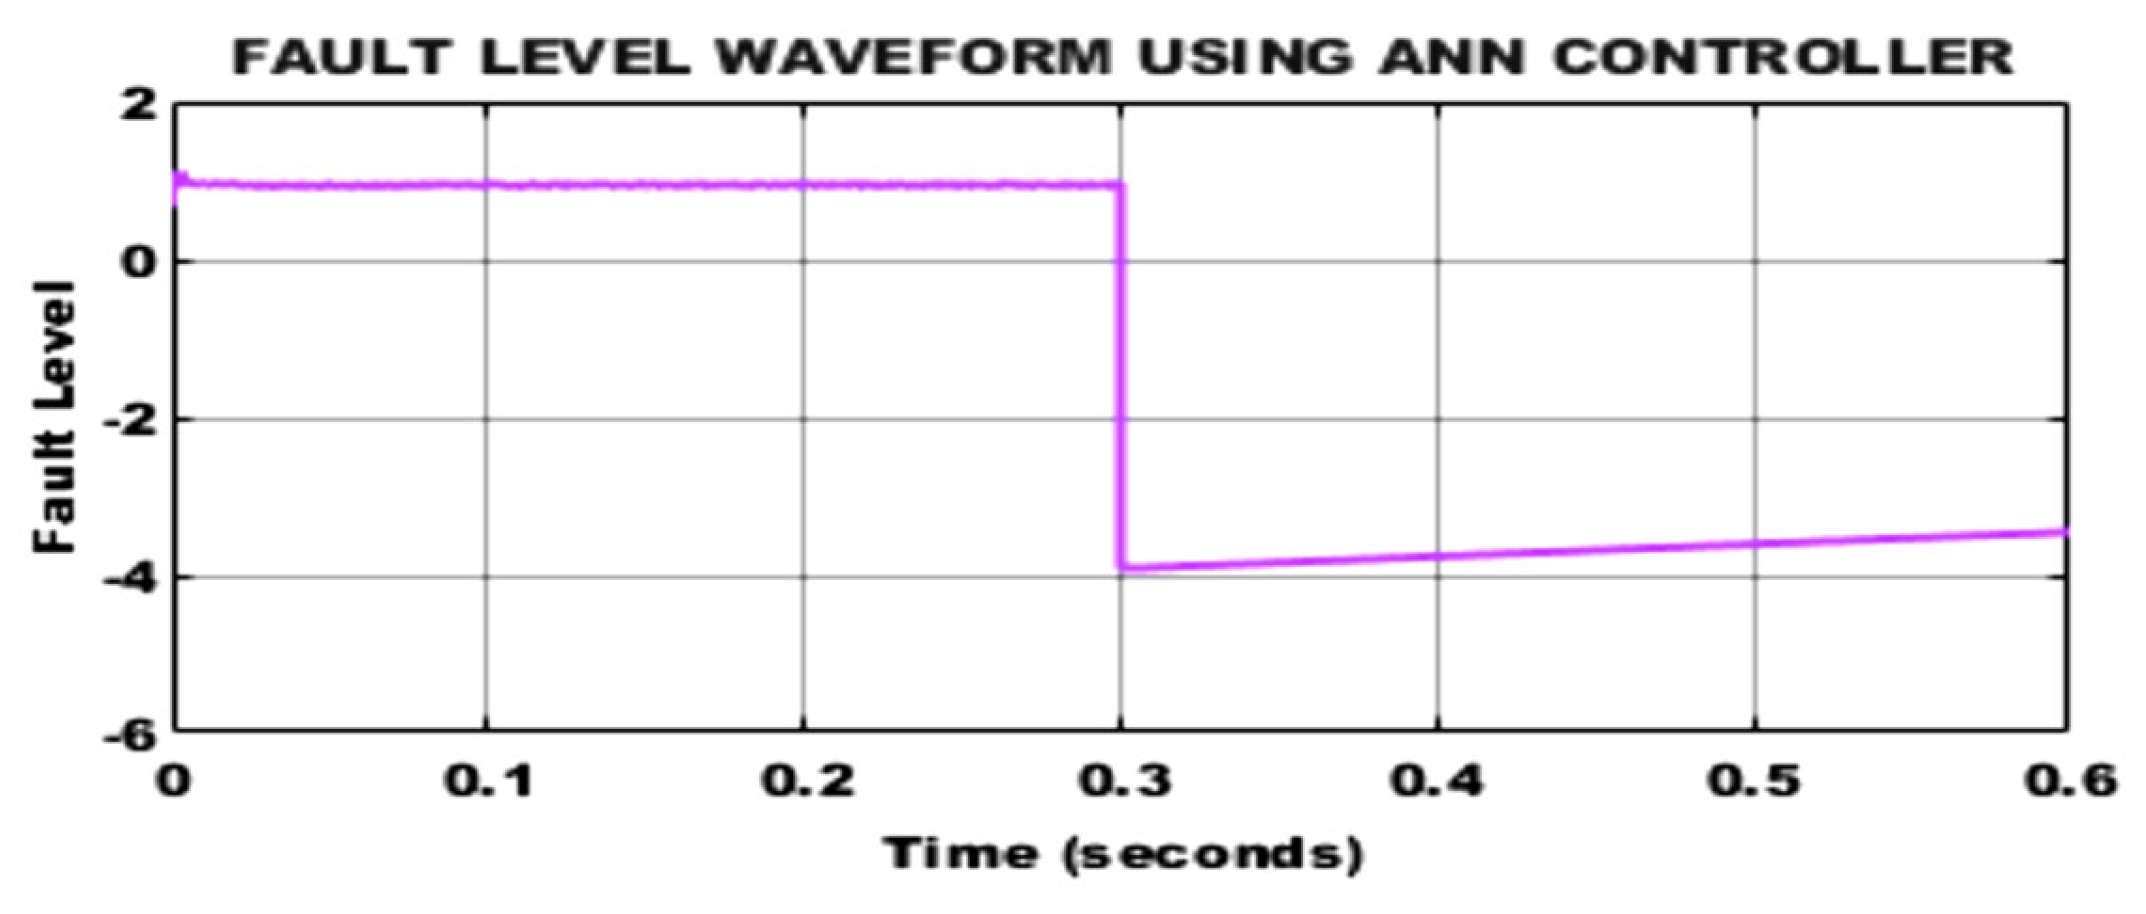
Figure 26.
DC link voltage waveform.
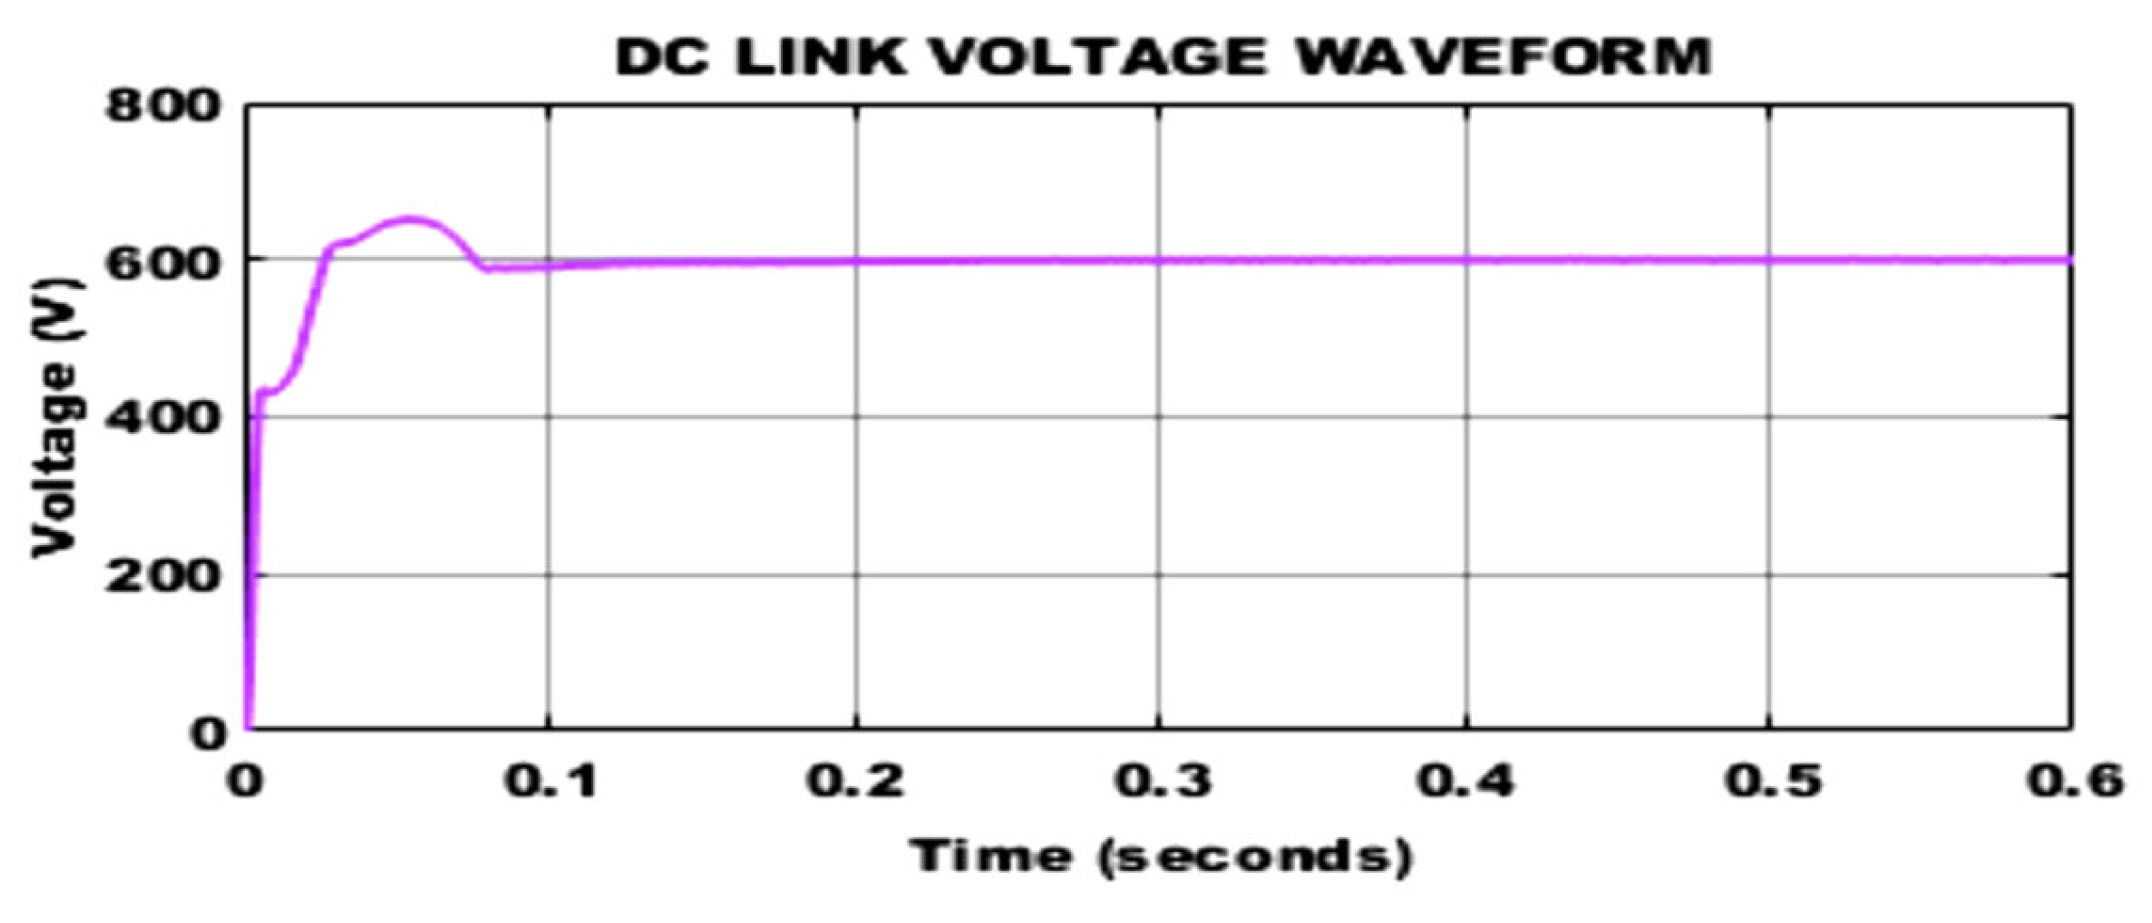
Figure 27.
Power Losses distribution.
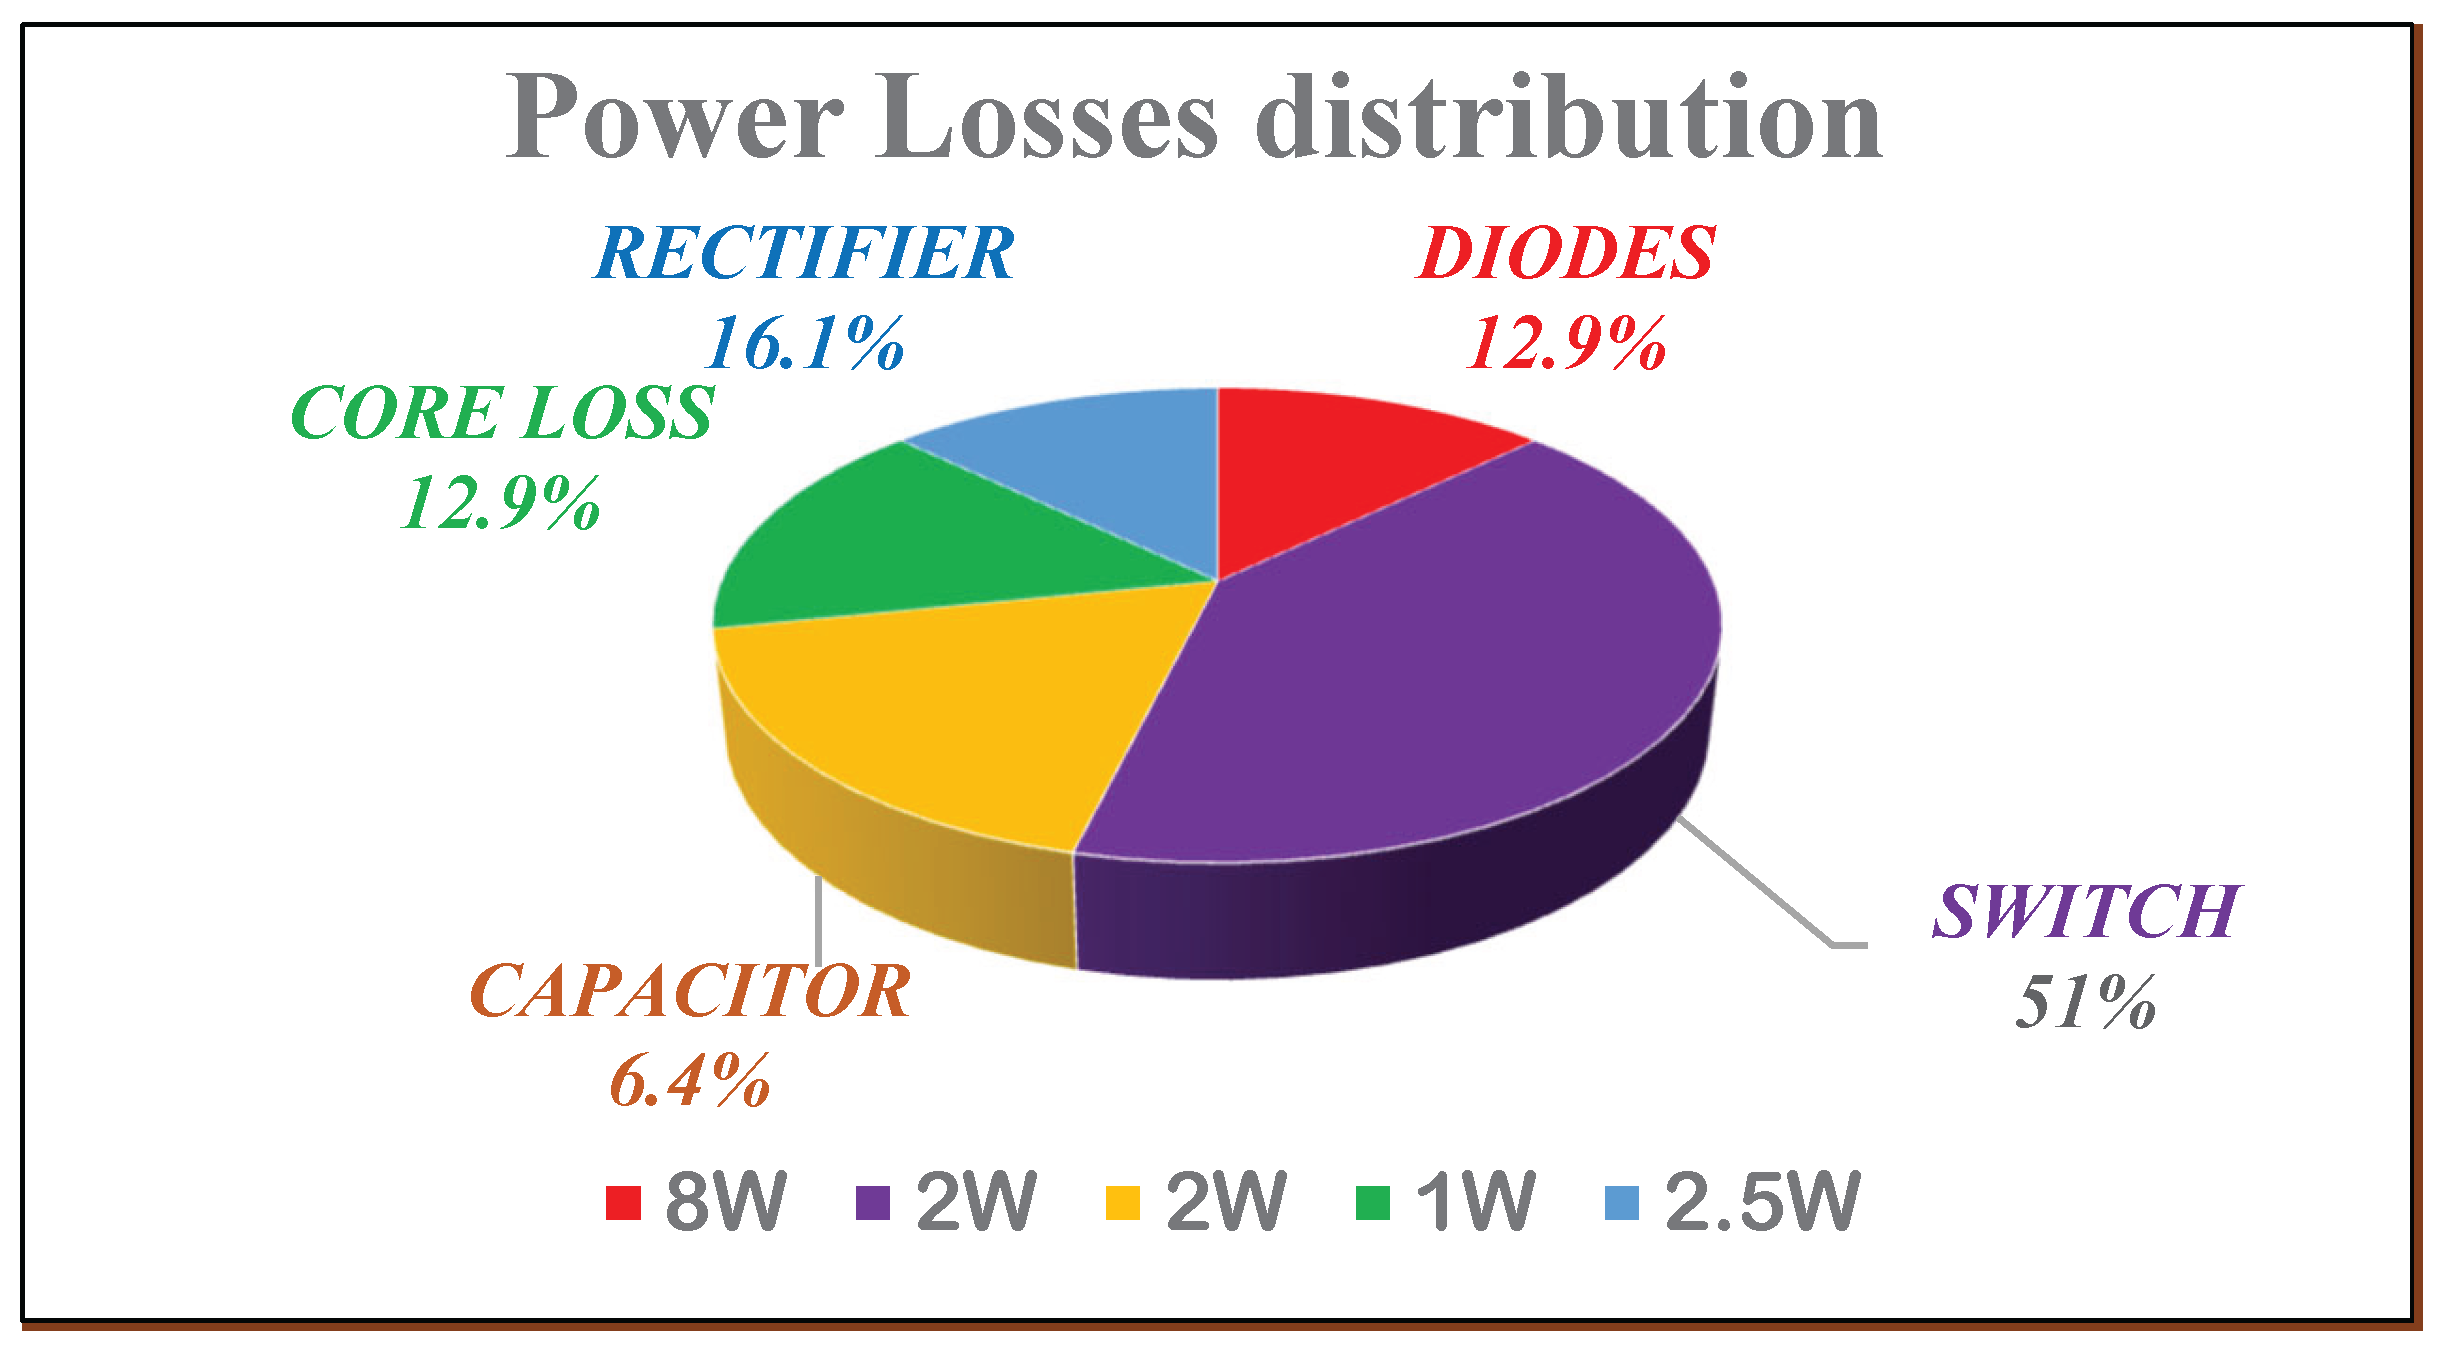
Figure 28.
Experimental setup.
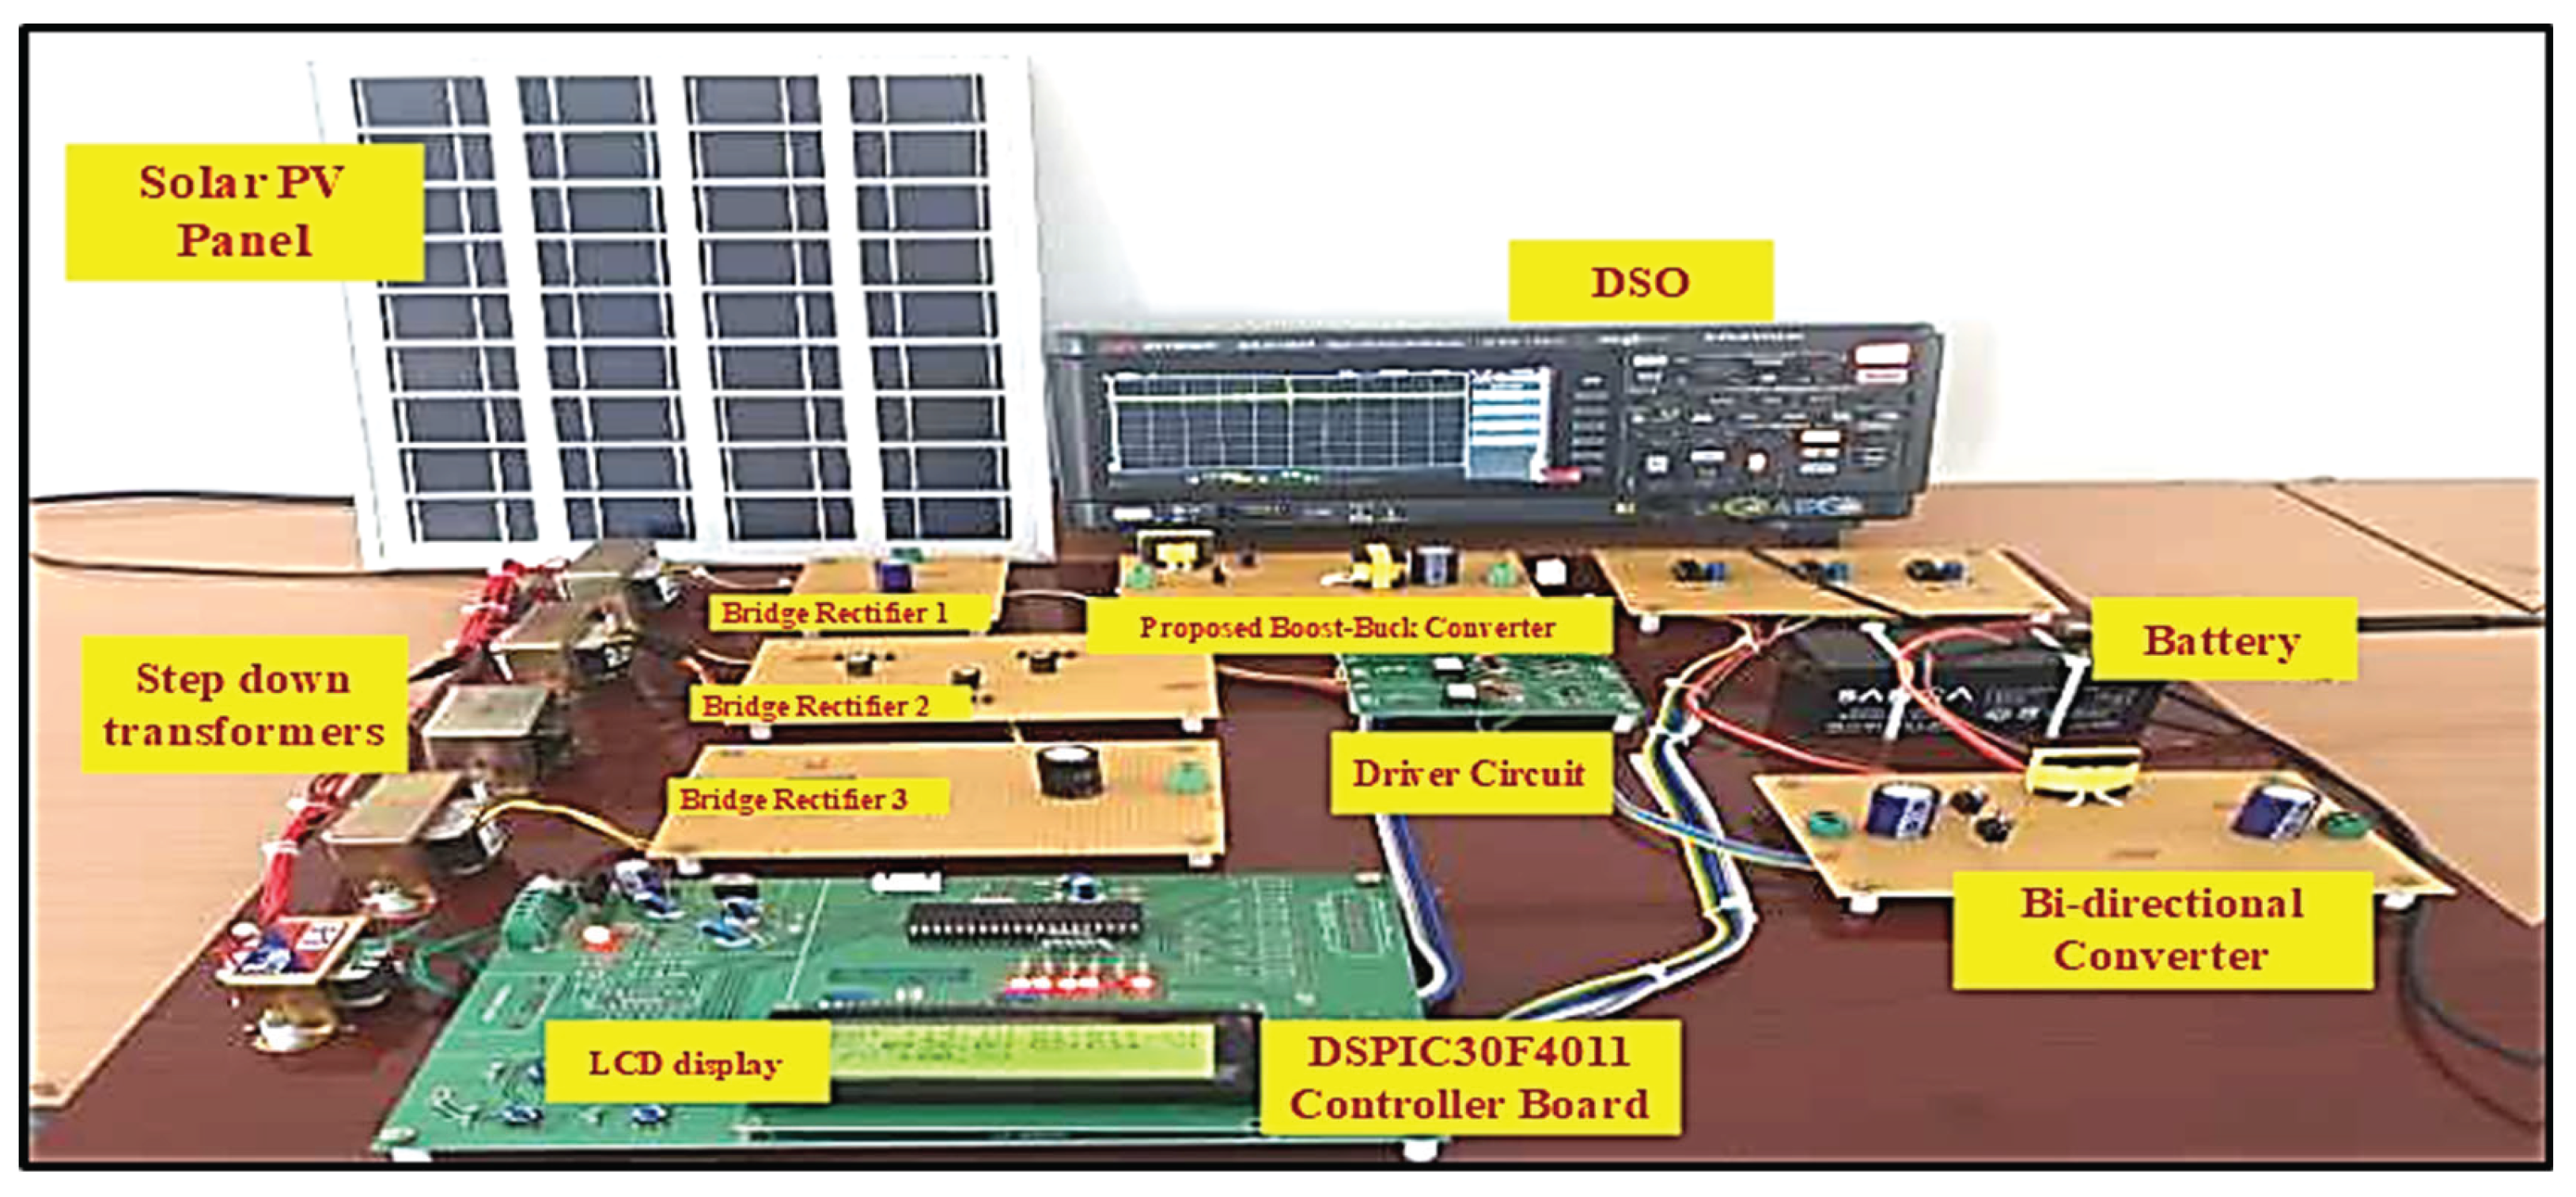
Figure 29.
Hardware Prototype.
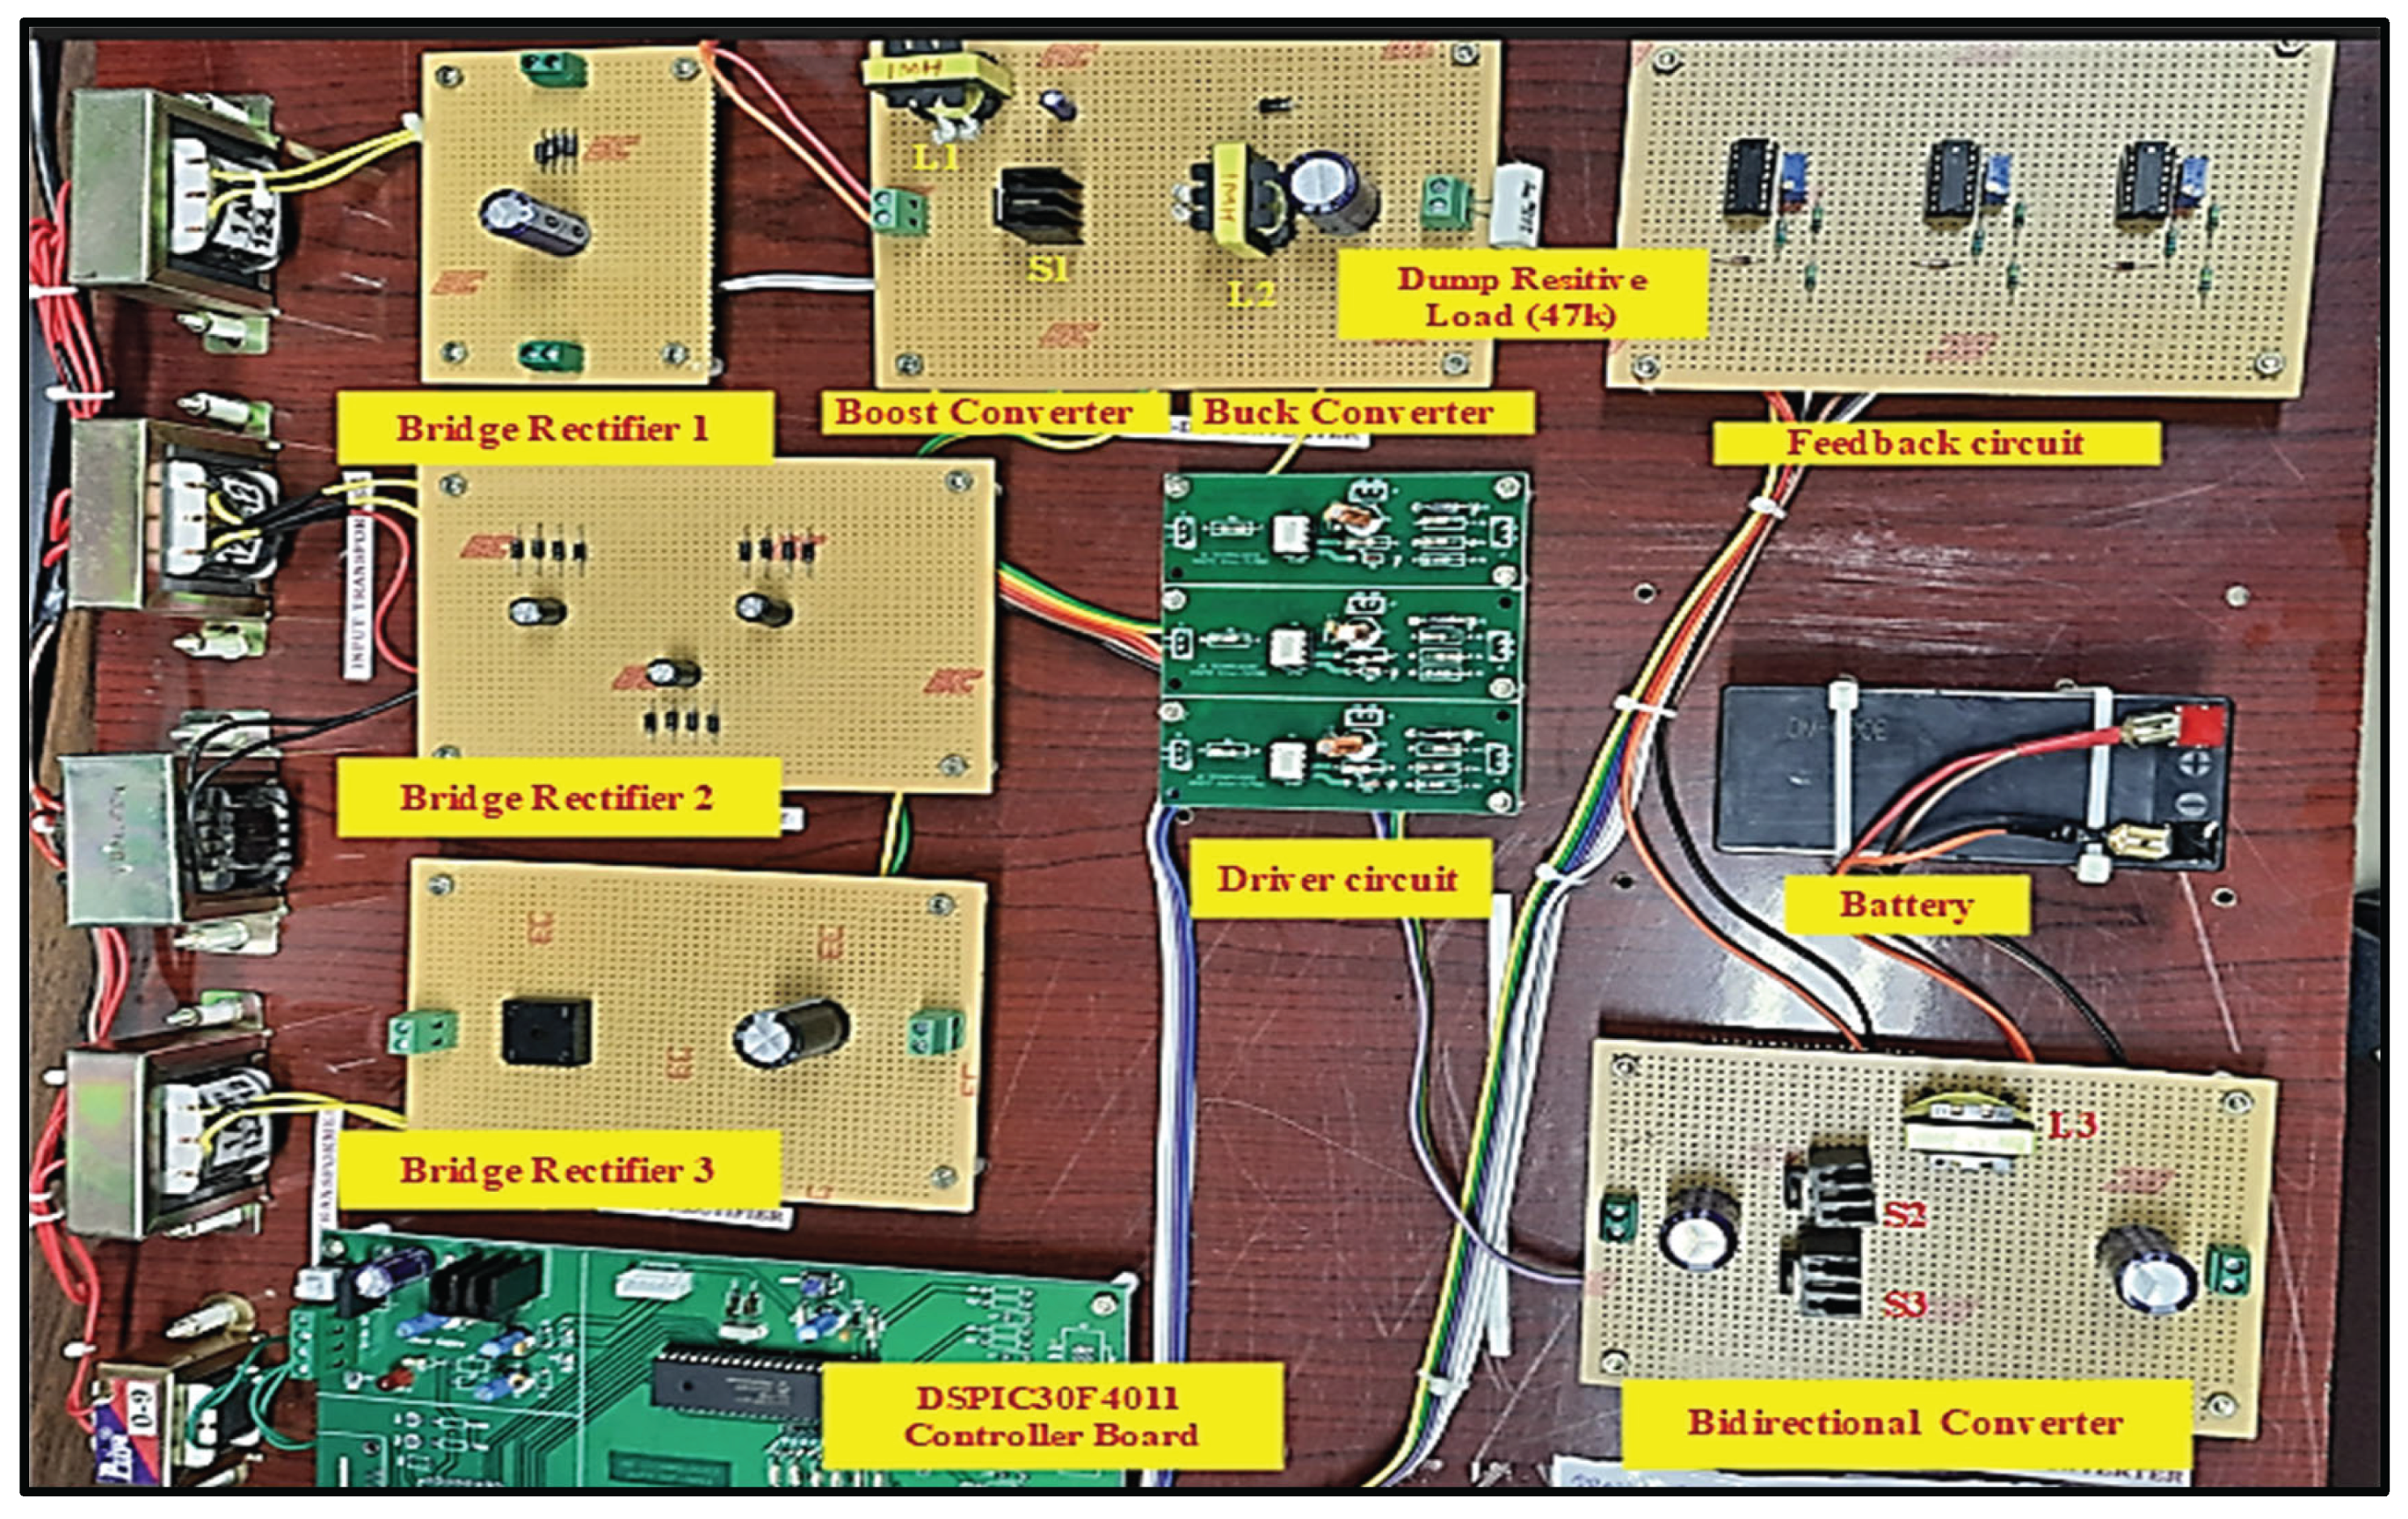
Figure 30.
Boost converter output voltage and DC bus load voltage waveform.
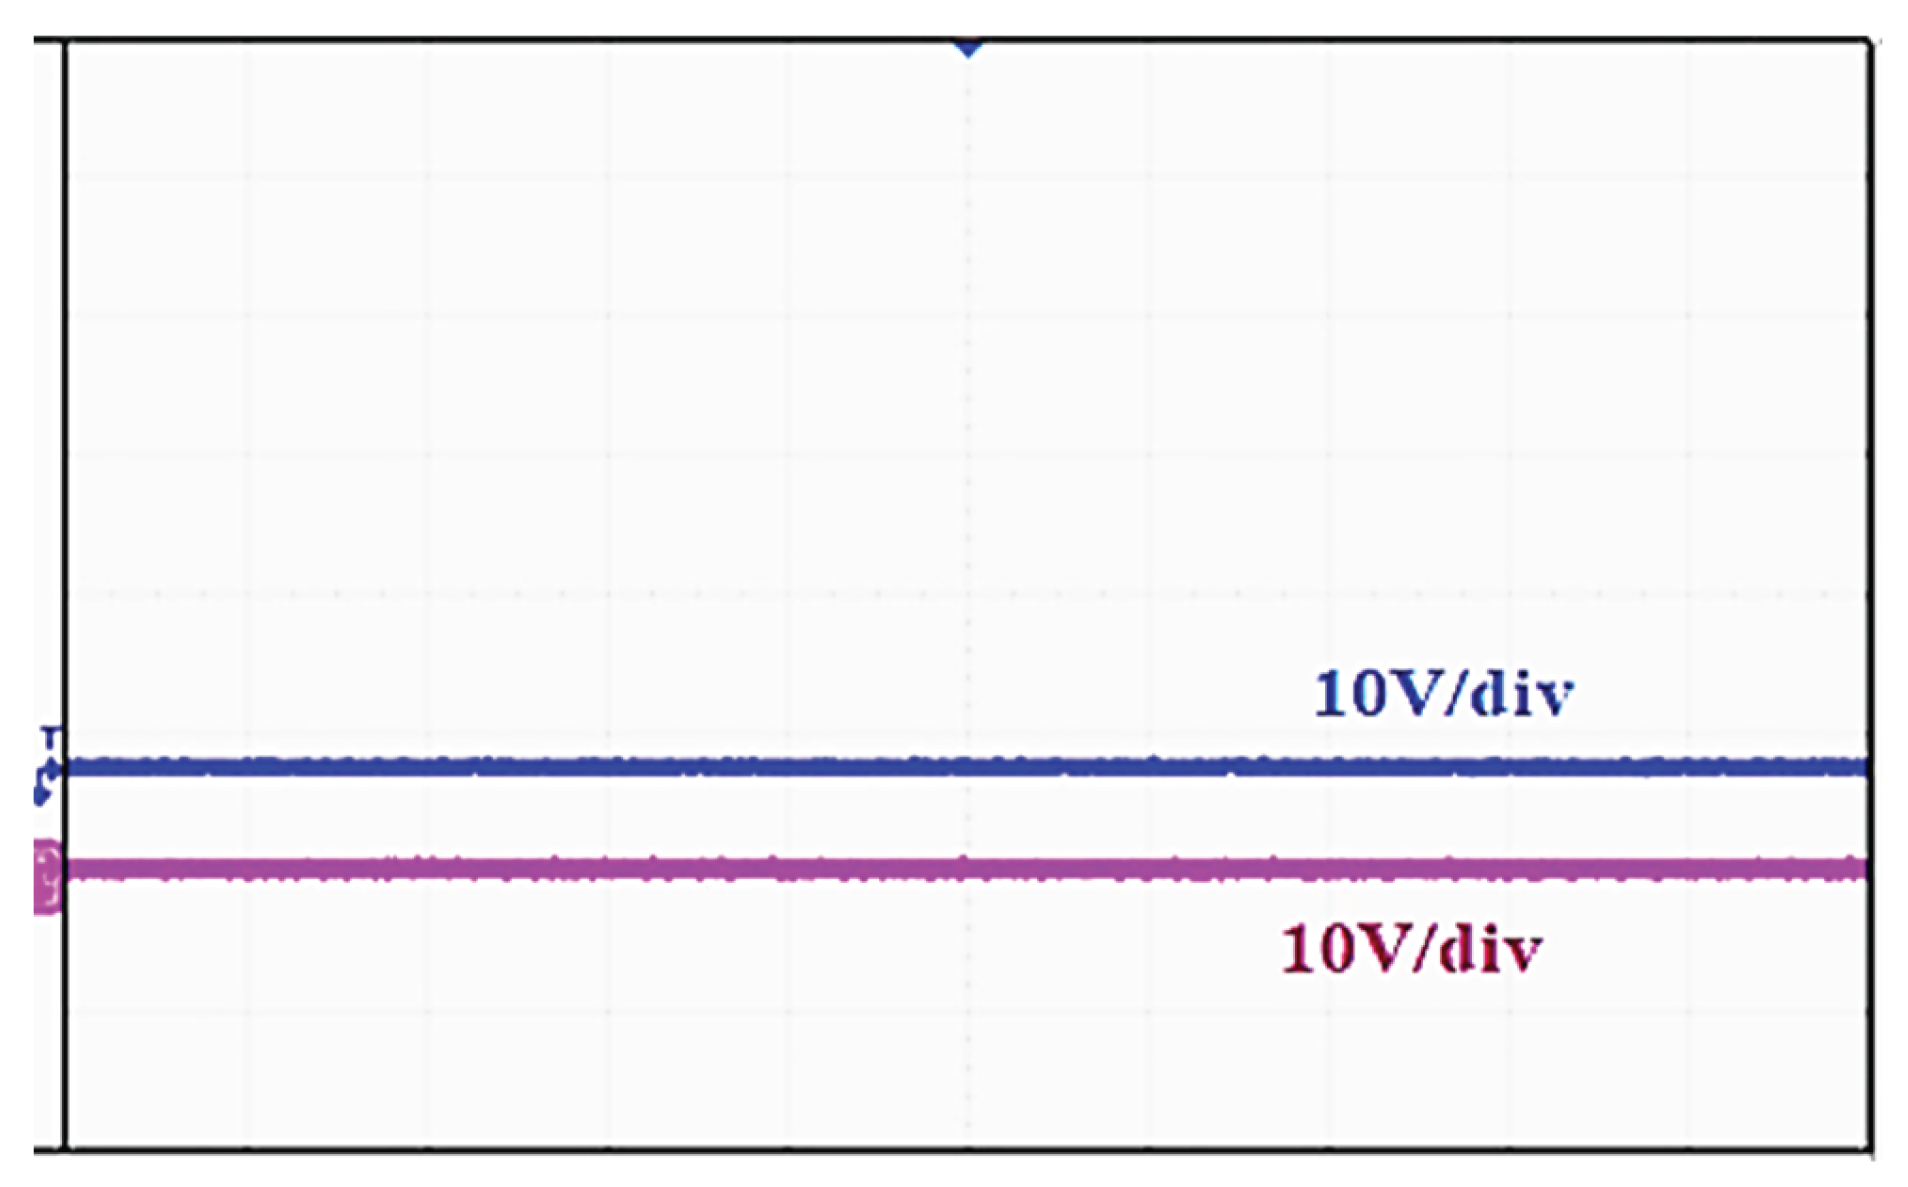
Figure 31.
Experimental waveform of DC bus voltage.
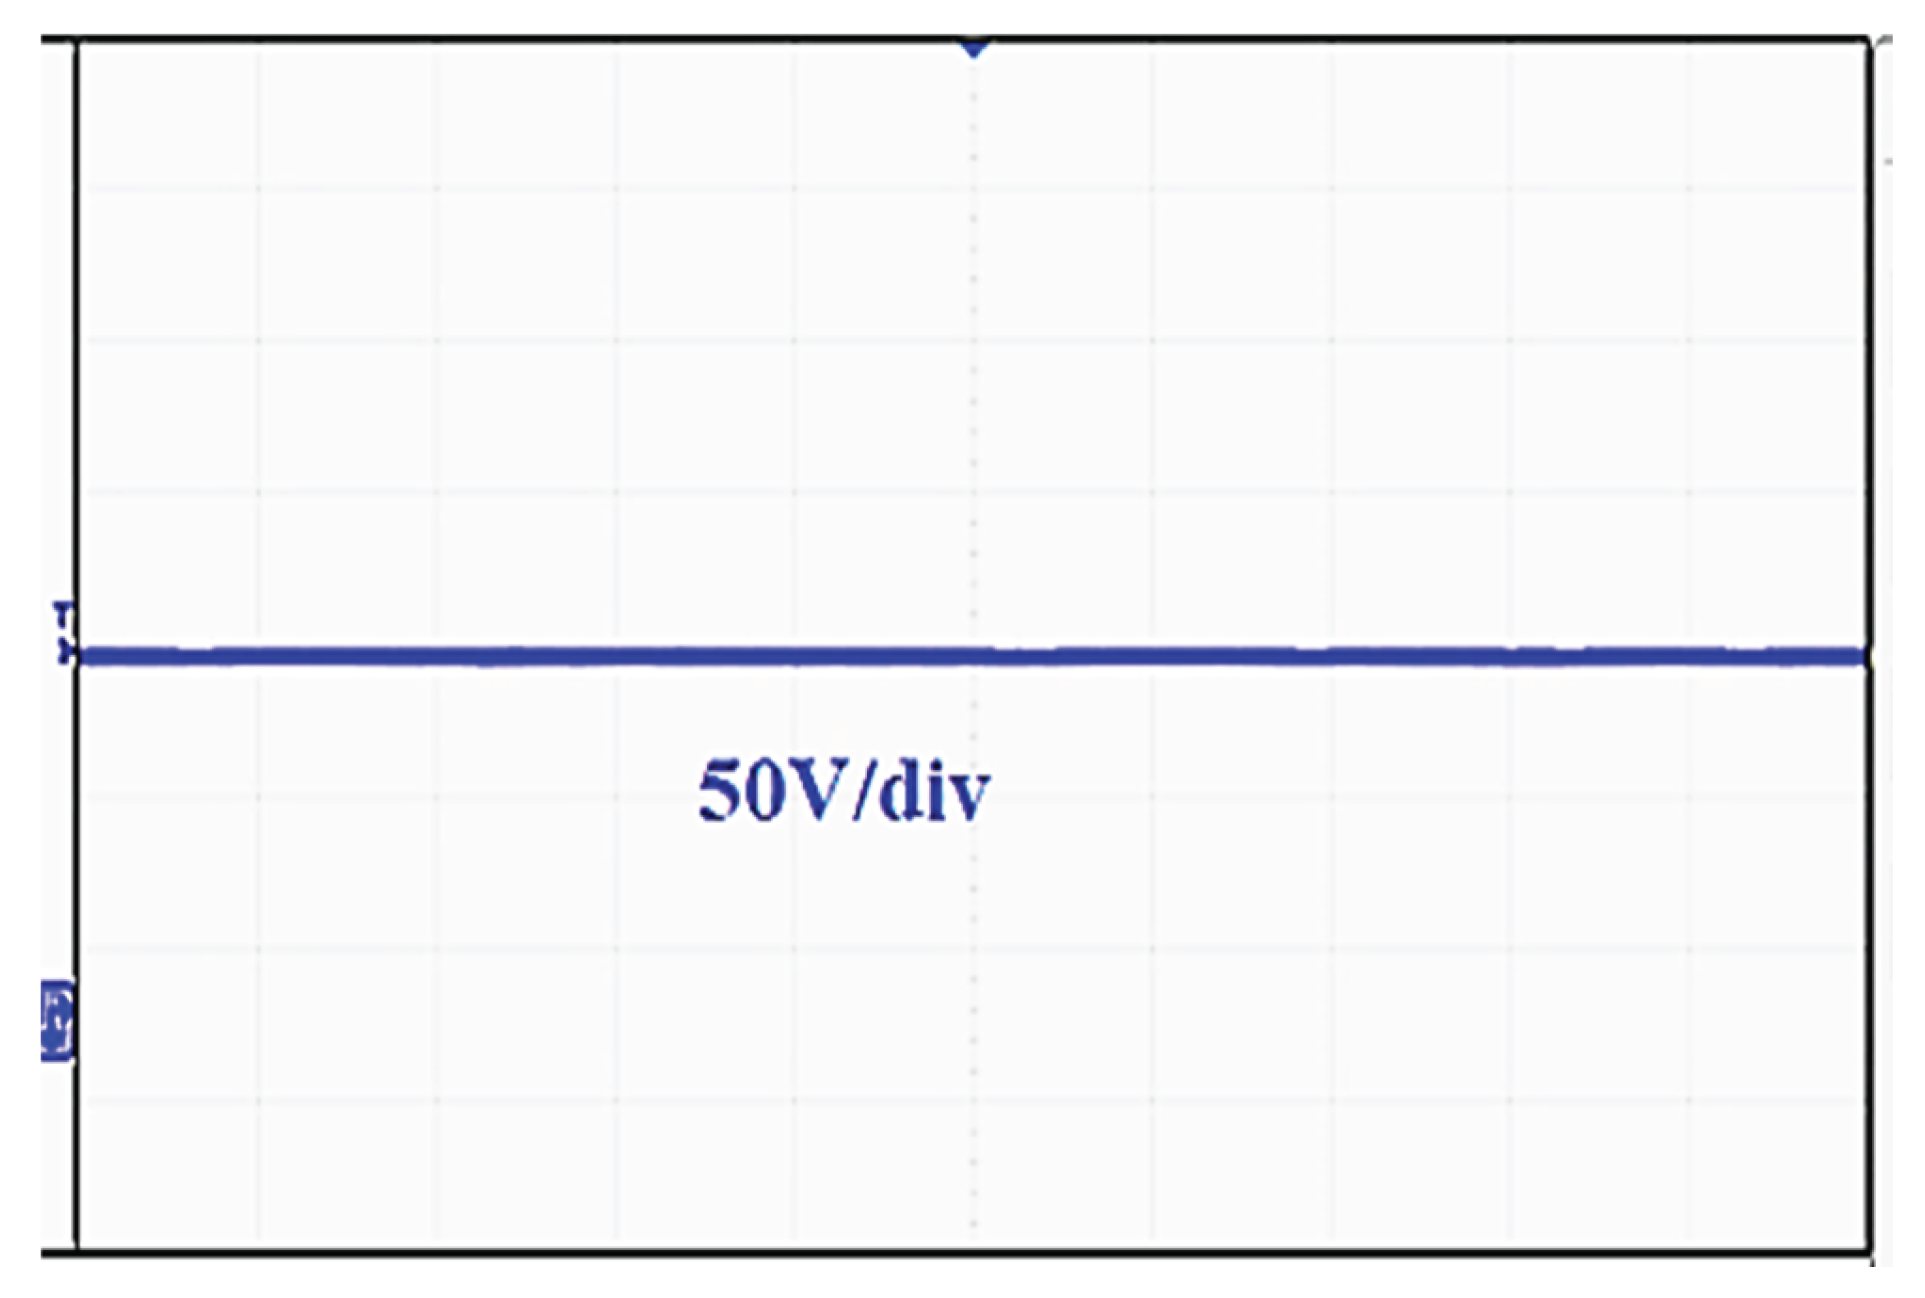
Figure 32.
Waveform of switching pulse generationS1and Inductor (L1)current.
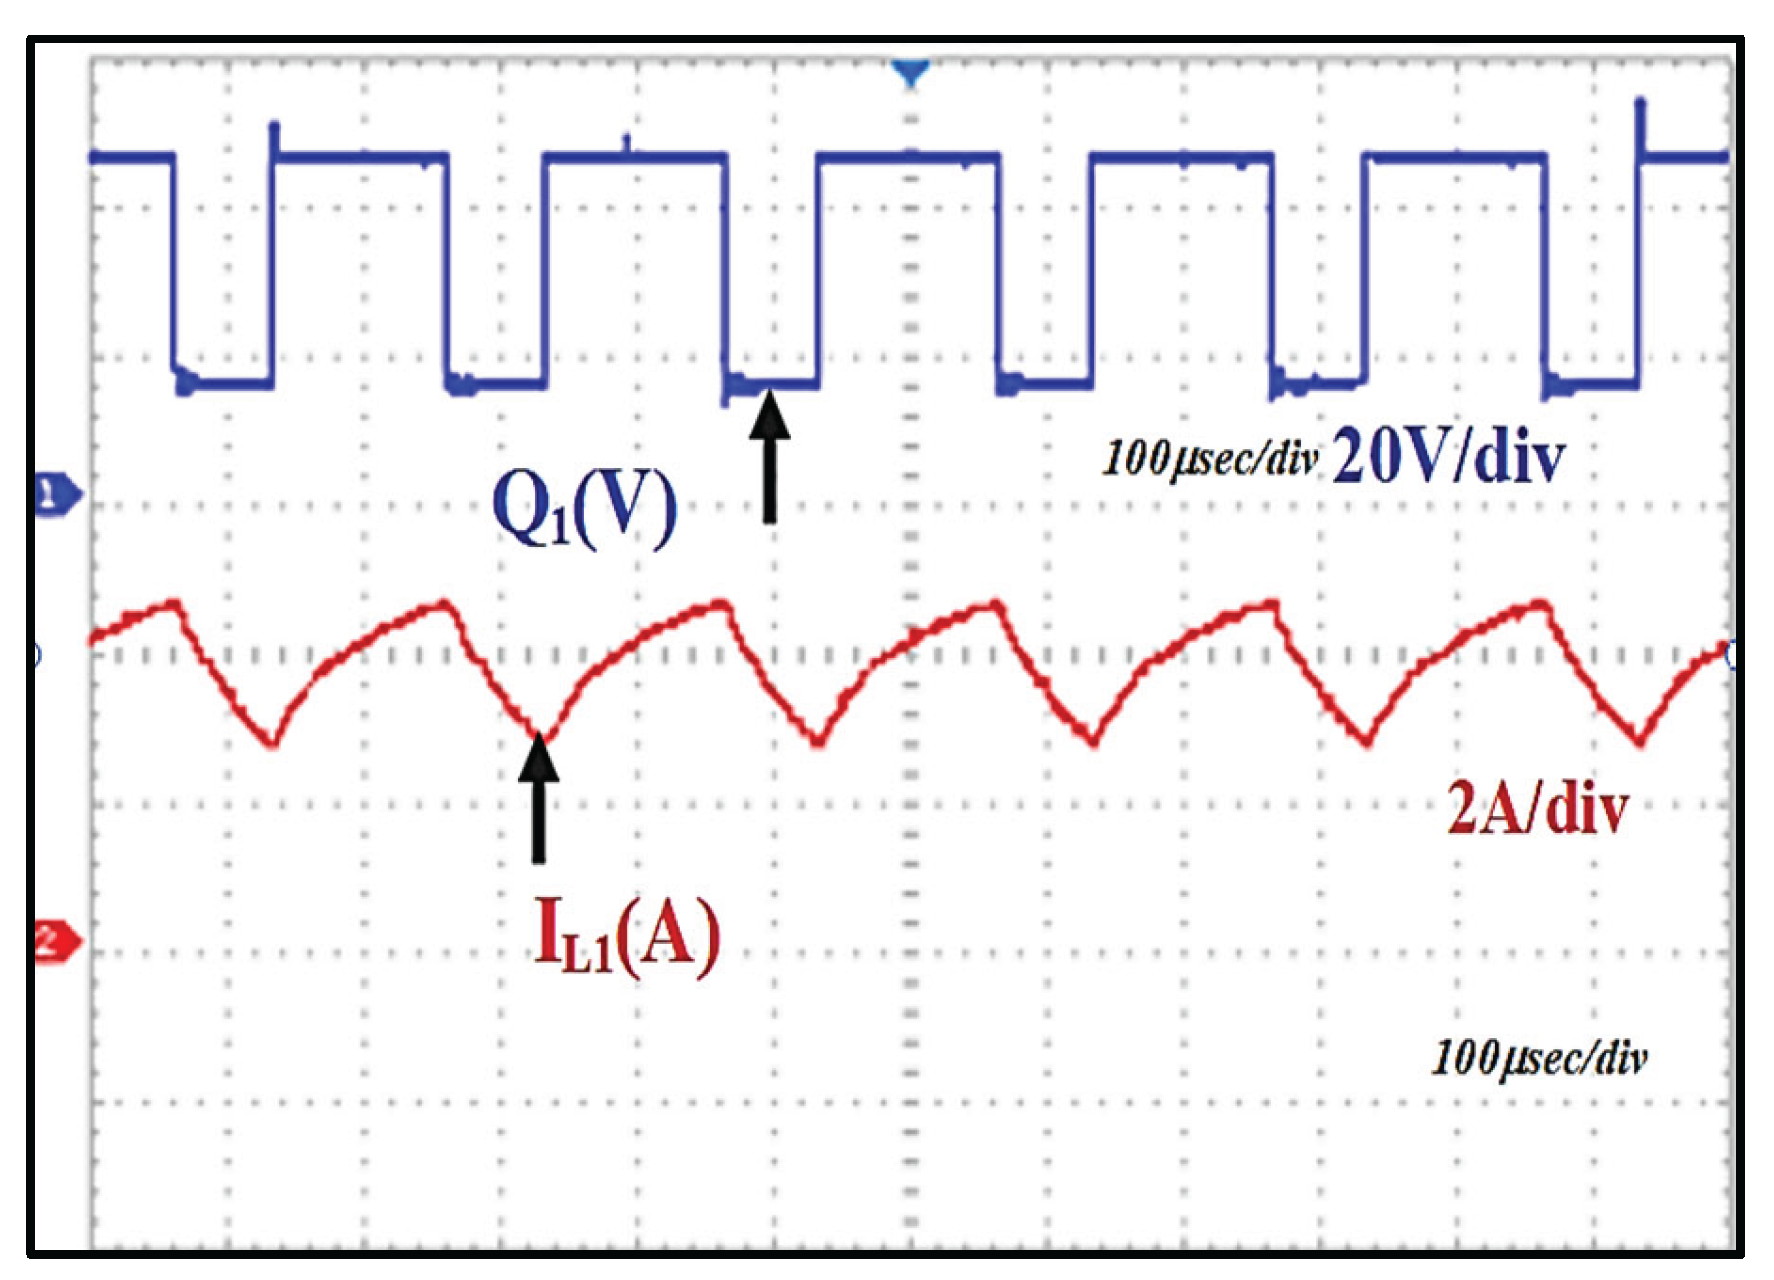
Figure 33.
Waveform of generated solar PV voltage, switchingpulse and current waveform.
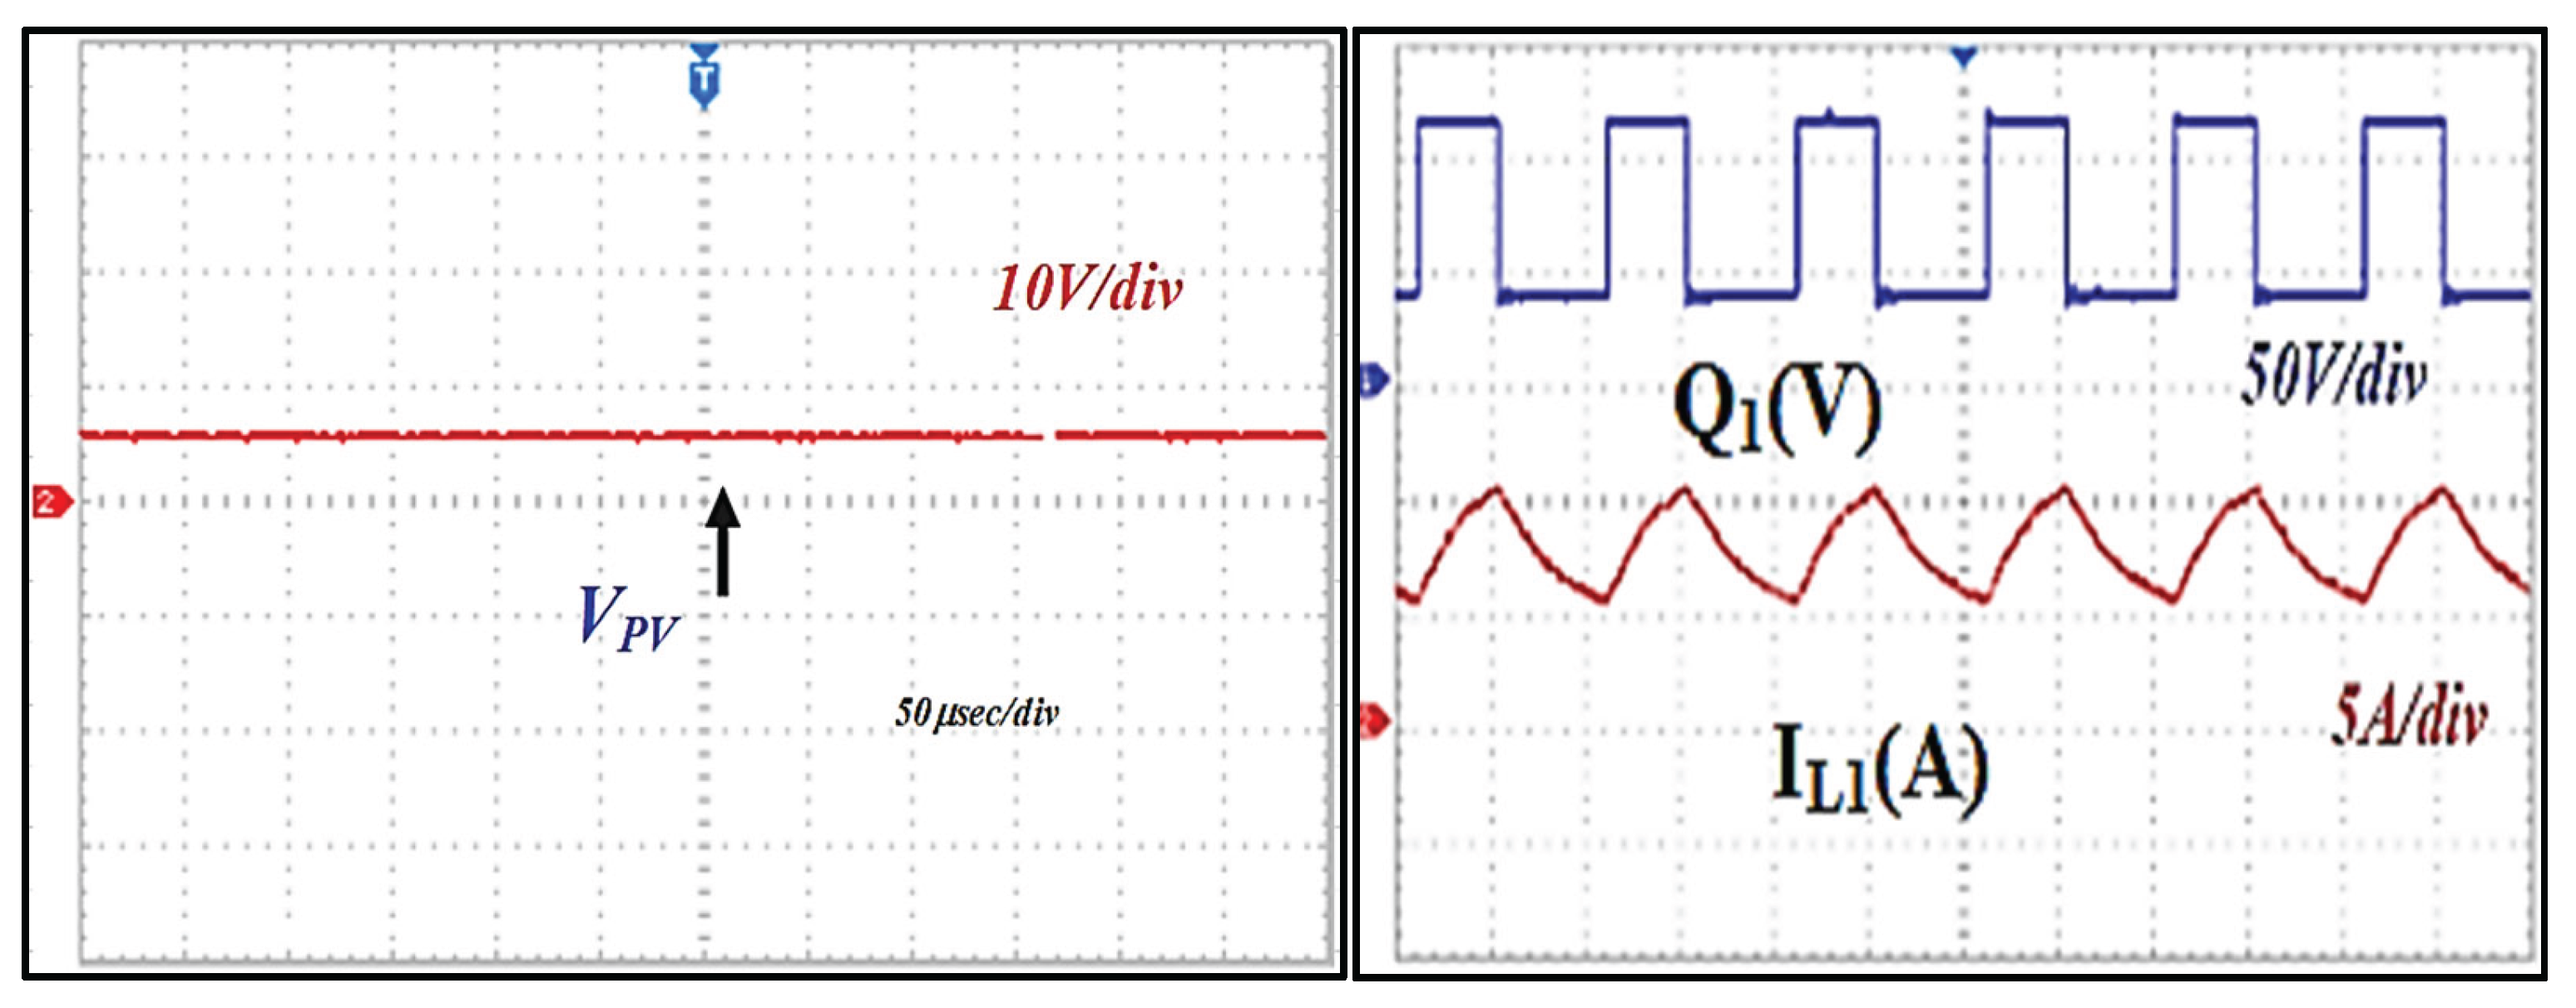
Figure 34.
Waveform of DC bus voltage.
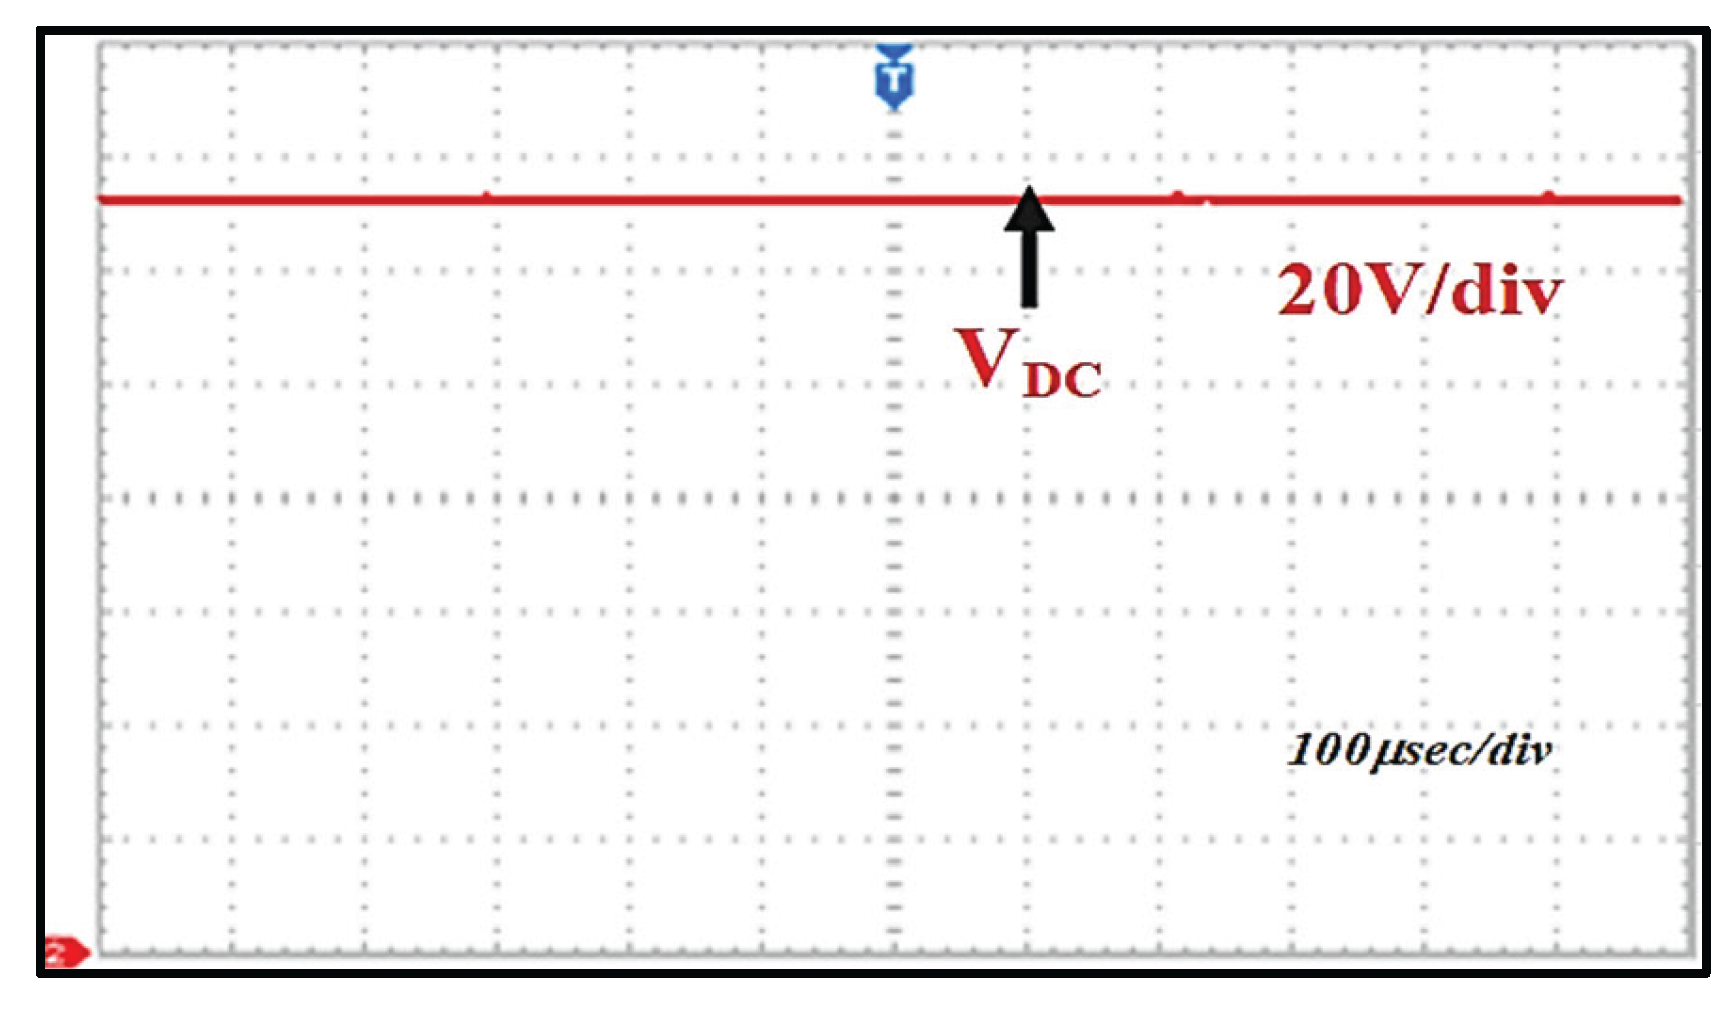
Figure 35.
Waveform of switching pulse generation of S2, S3, battery voltage, and DC bus voltage.
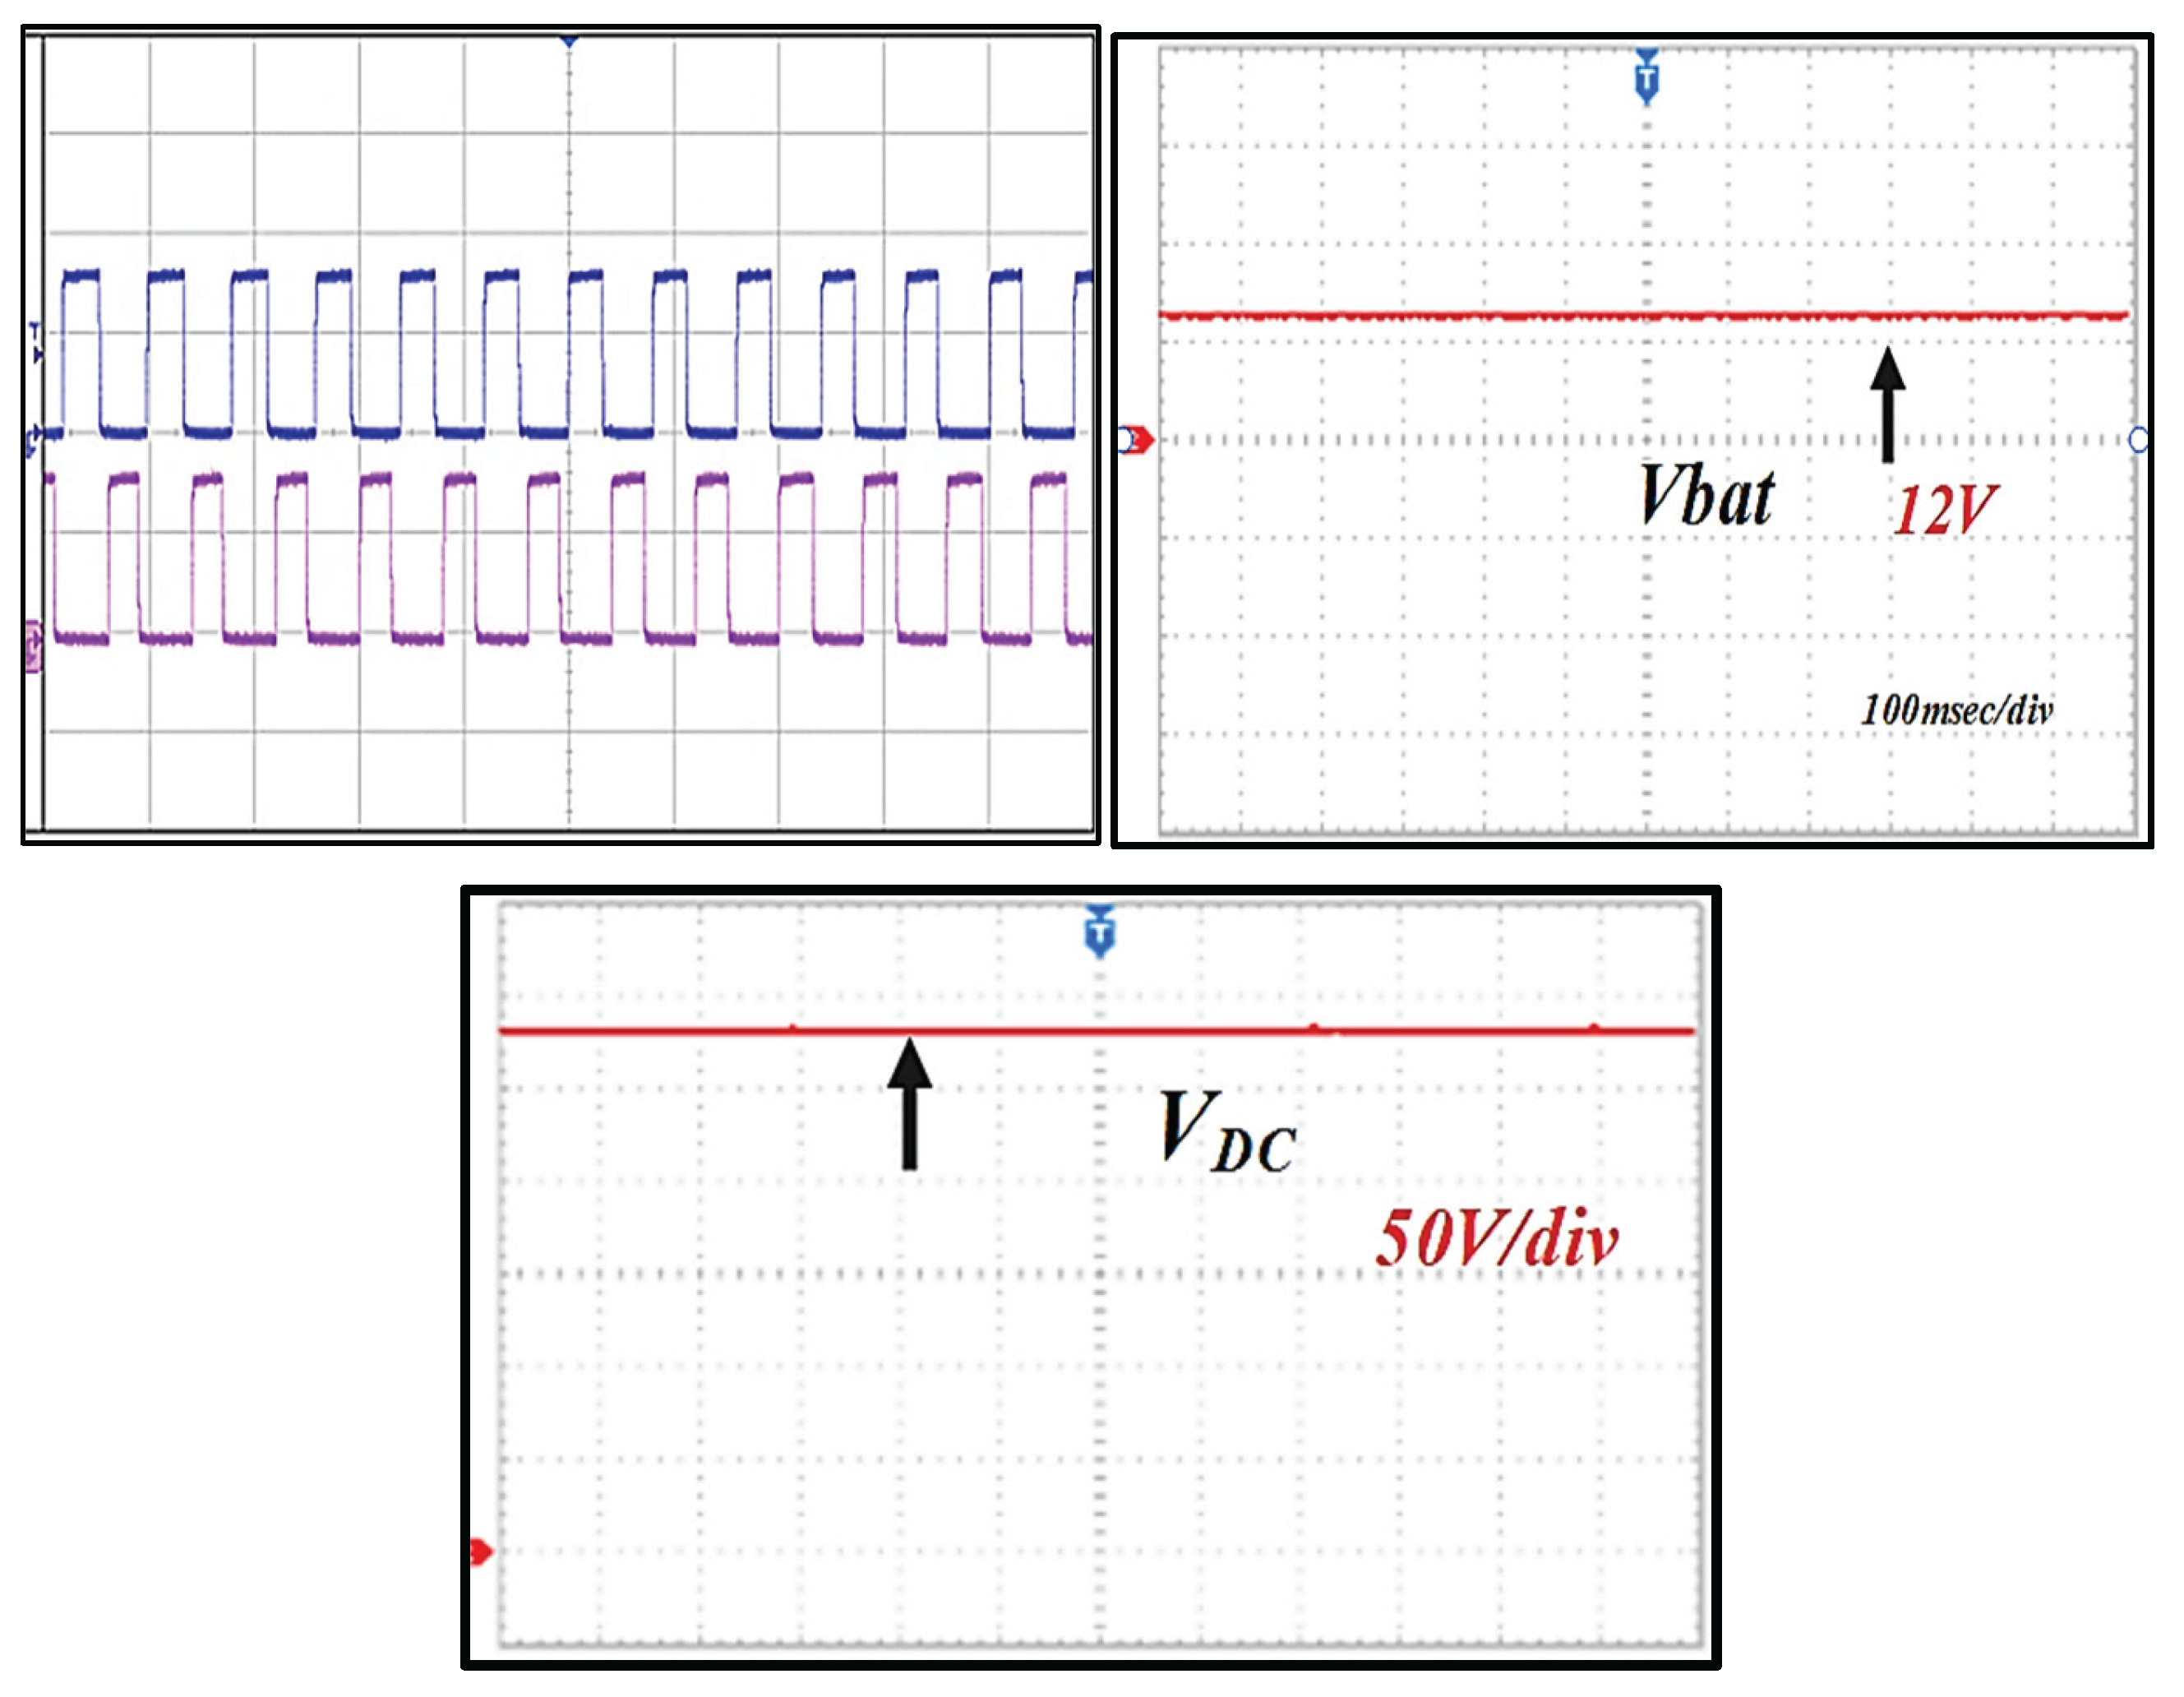
Figure 36.
Dynamic response conditions of the system.
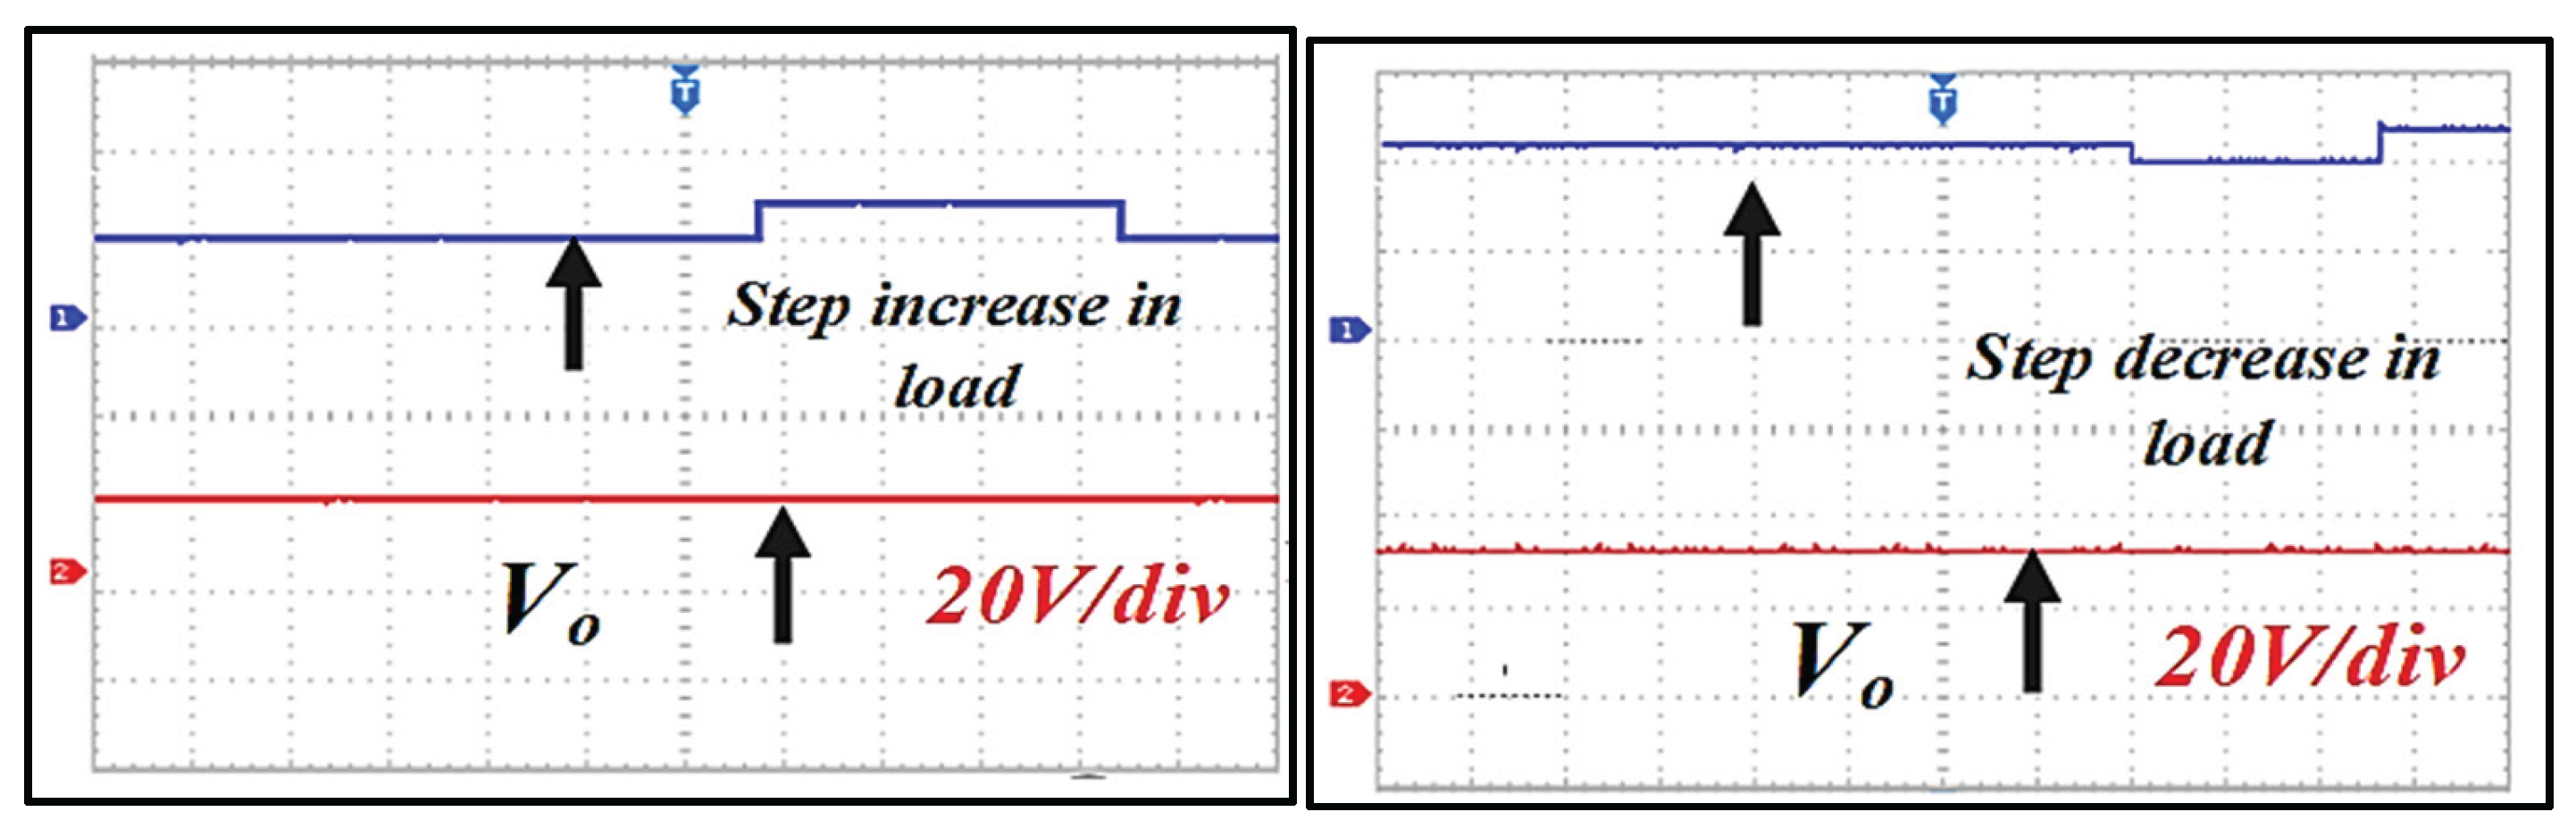
Figure 37.
Performance curve of the proposed system.
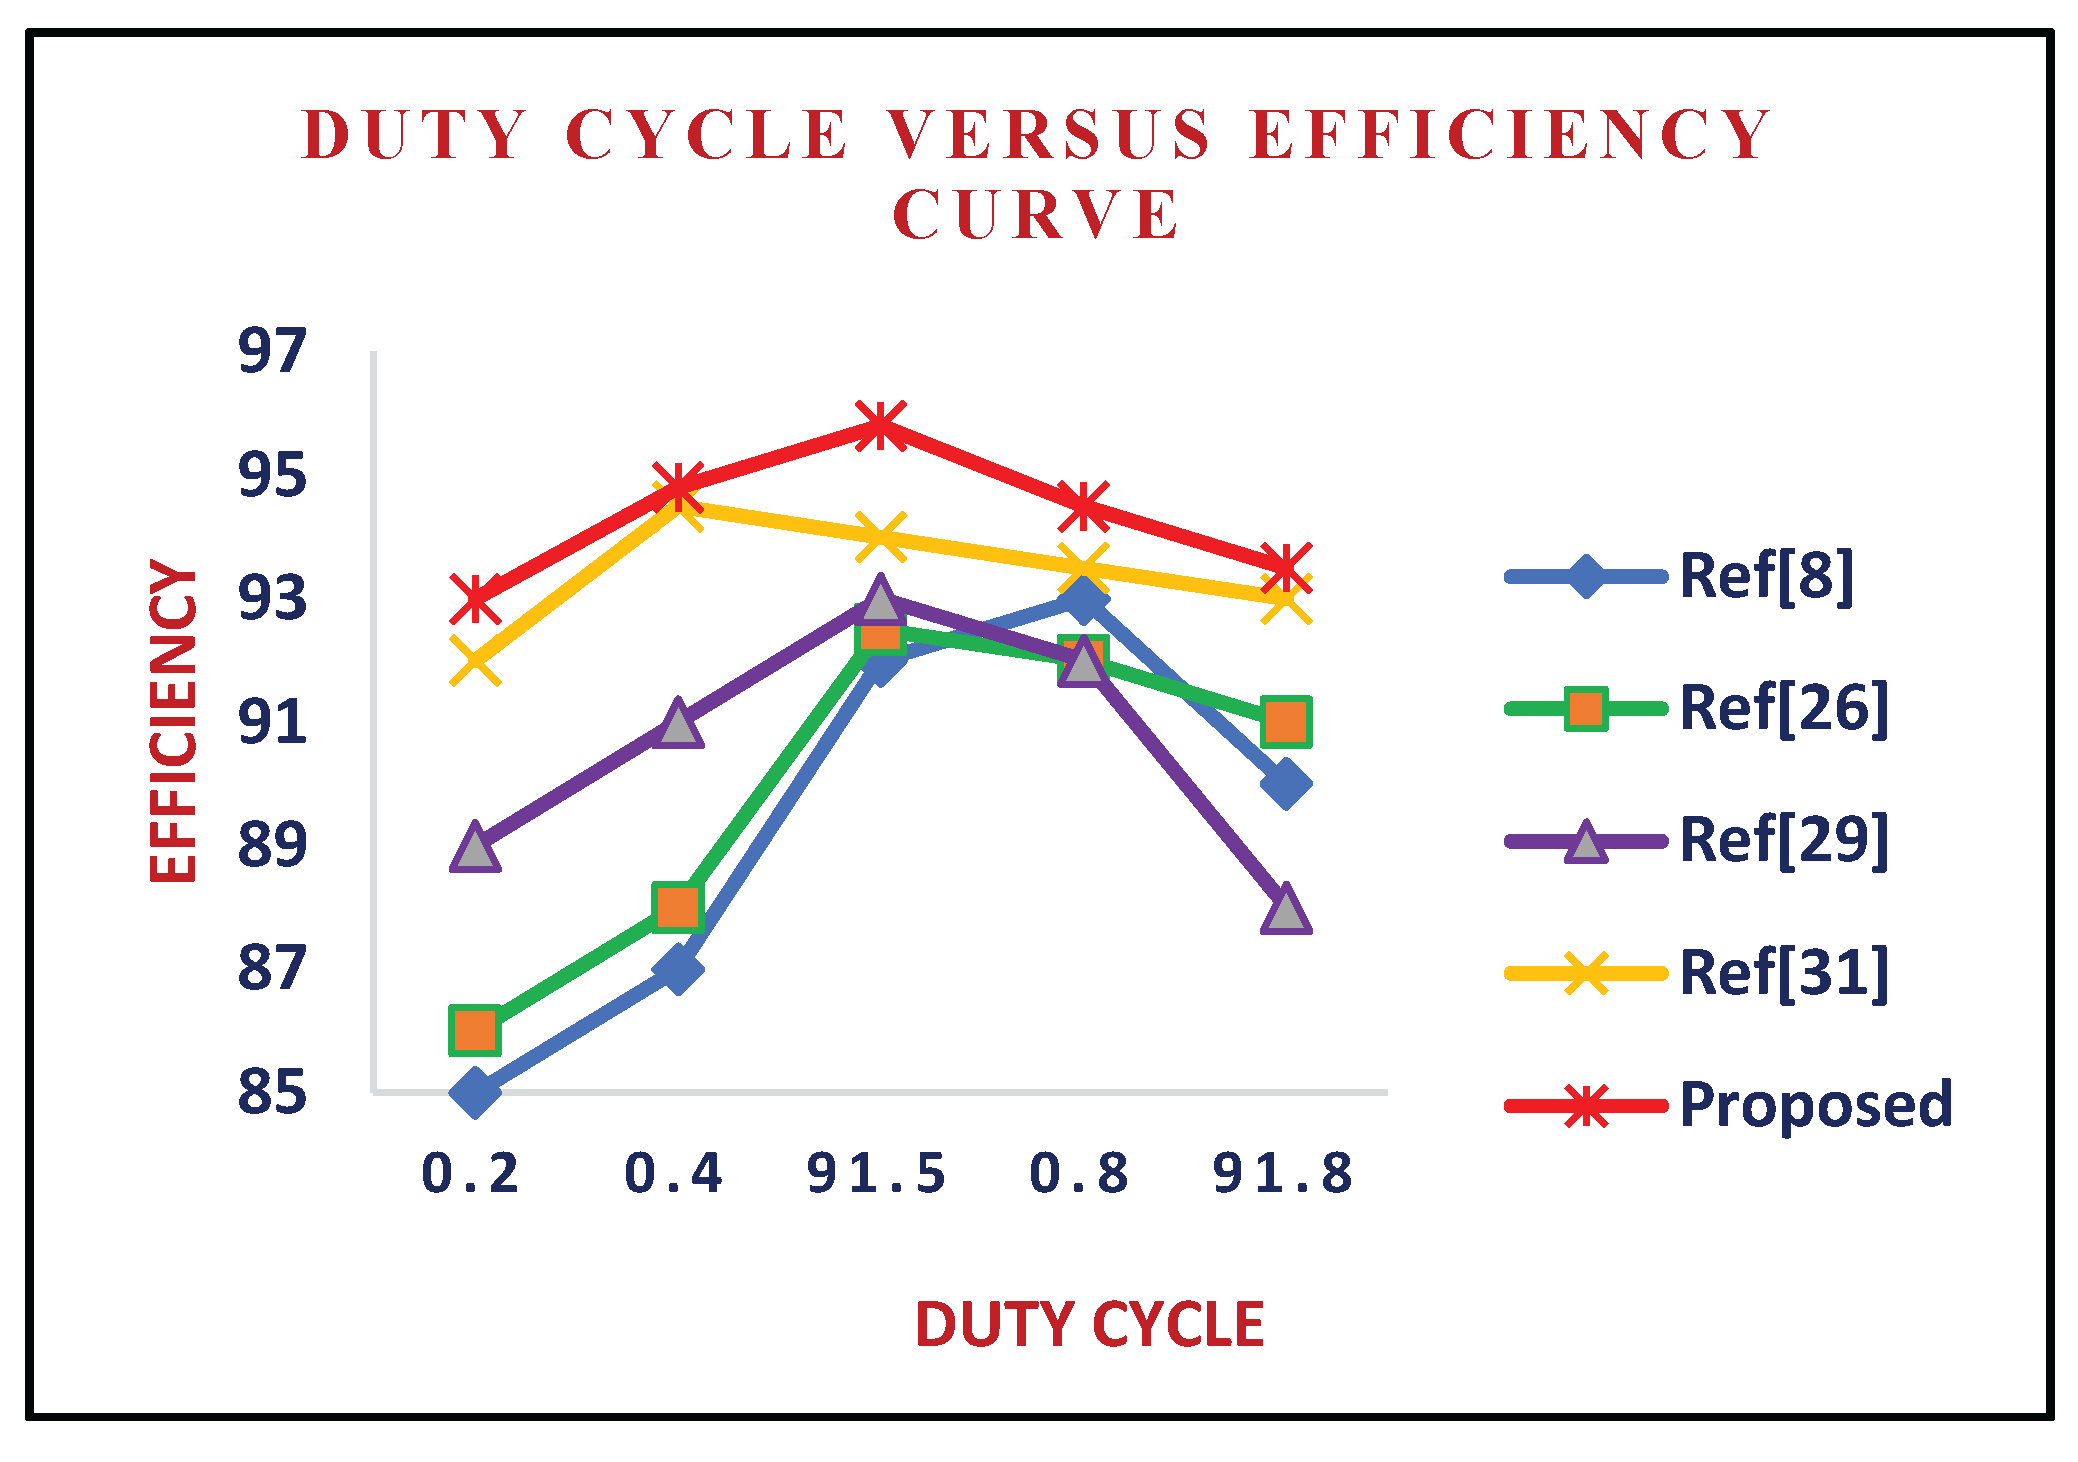

Table 1.
Switching look-up table under all modes.
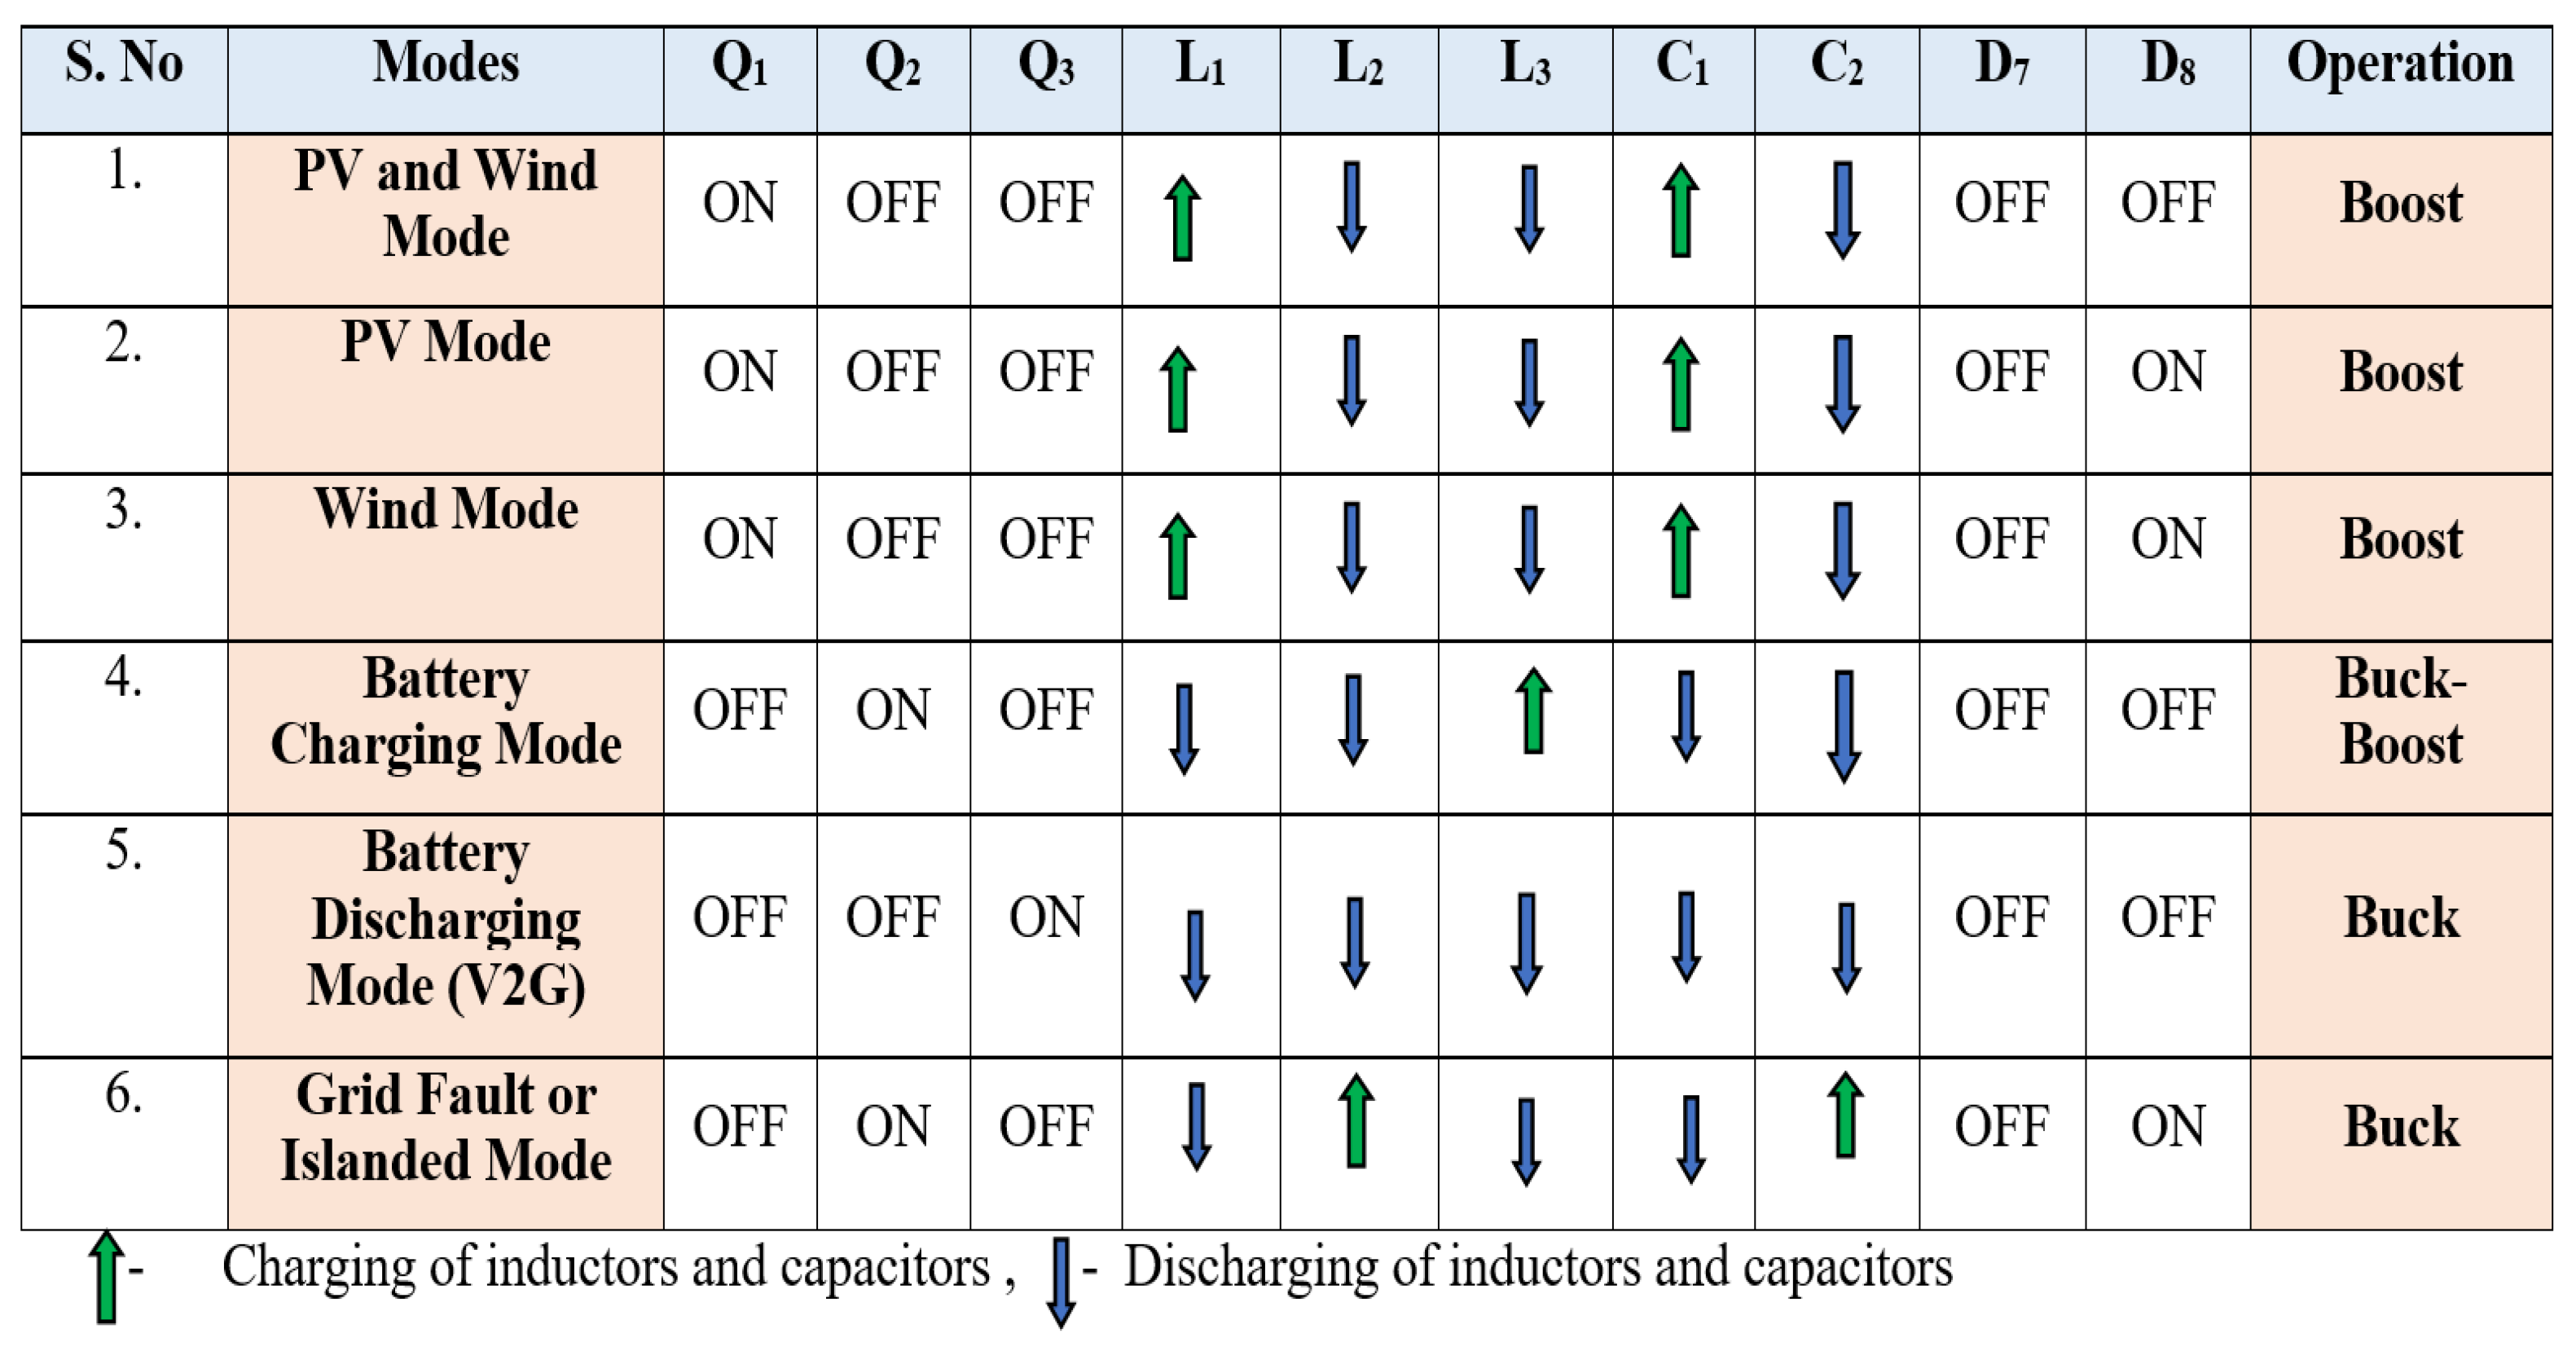
Table 2.
Comparative analysis of the ripple factor specifications.
| Ripple factors |
Lower Value (Below 10%) |
Higher Value (Above 40%) | Values (10%-30%) |
|---|---|---|---|
| Inductor current ripple | A large inductor results in higher cost and size. | Higher losses and more EMI | Enough ripple for control and uses a small value of inductor |
| Capacitor voltage ripple | A large capacitor results in increased cost and size. | Higher stresses and control remain unstable. | Lower ripples requirea smaller value of capacitors. |
Table 3.
Voltage and Current stress analysis under all modes.
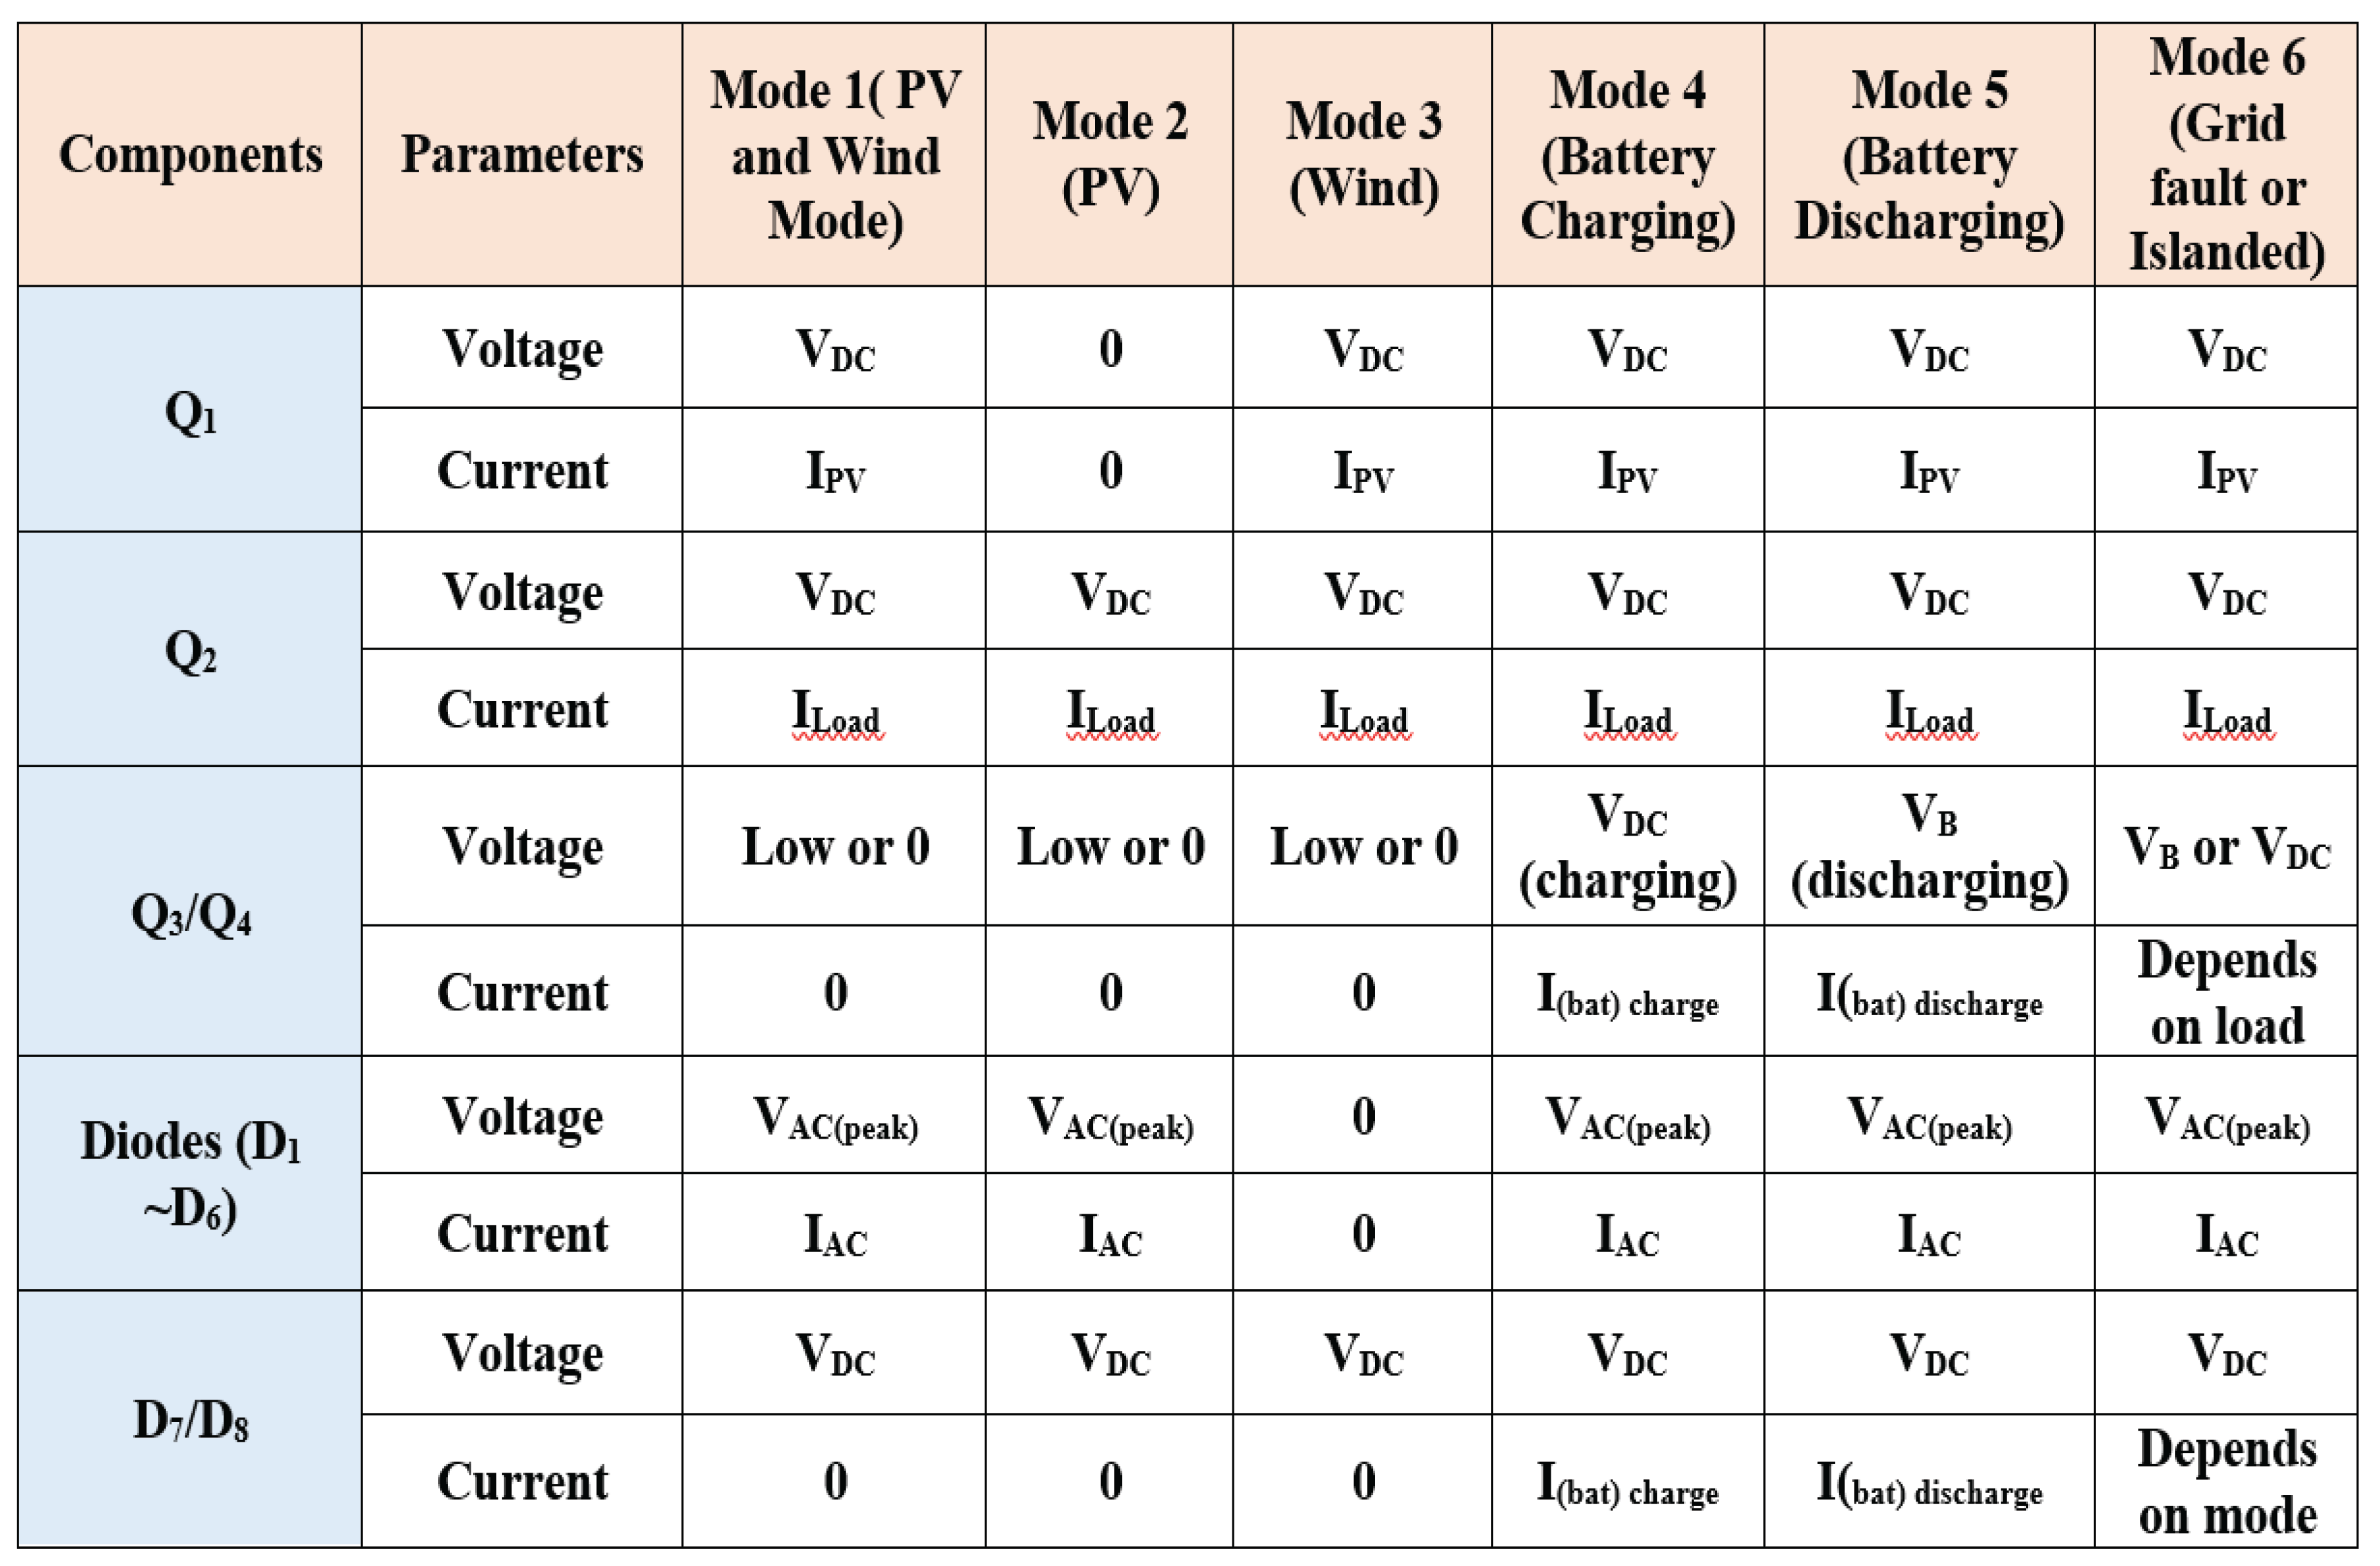
Table 4.
Solar PV system parameters measured at standard test conditions of irradiance-1000W/m2,AM 1.5, and Cell temperature at 25oC.
Table 4.
Solar PV system parameters measured at standard test conditions of irradiance-1000W/m2,AM 1.5, and Cell temperature at 25oC.
| Parameters | Specifications |
|---|---|
| Solar cells type | Monocrystalline |
| Rated Voltage (Vmpp) | 39.8V |
| Rated Current (Impp) | 5.40 A |
| Maximum Peak Power (Pmax) | 220W |
| Short Circuit Current (Isc) | 8.3A |
| Open Circuit Voltage (Voc) | 38V |
| Maximum System Voltage | 600V |
Table 5.
Specifications of Battery Energy Storage Systems (BESS).
| Parameters | Specifications |
|---|---|
| Battery type | Lead-Acid |
| Nominal Voltage (V) | 12 V |
| Nominal Capacity (Ah) | 20 A |
| Internal Resistance (mΩ) | 3.4Ω |
| Cut-off voltage | 9V |
| Full-charge voltage (Voc) | 13.6V |
Table 6.
Simulation parameter specifications.
| Parameters | Specifications |
|---|---|
| Converter Output voltage | 500V~600V |
| Wind Rectifier Output | 150V DC |
| DC Bus link voltage | 600V |
| Inductors L1, L2 and L3 | 5mH and 100mH |
| Capacitors C1, C2 and C | 4.7µF and 1000µF |
| Switching Frequency | 50kHz |
| Output Power | 300W |
| Power Switch | MOSFET IRF840, 500V, 8A |
| Load resistance | 47kΩ, 1kΩ |
Table 7.
Quantitative analysis of the proposed ANN controller.
| Controller | Efficiency (η%) | Voltage Error(%) | Settling time (ms) | Fault detection time(ms) |
|---|---|---|---|---|
| PI-based controller [32] | 93.2% | 2.5 | 45 | 40 |
| PSO-controller [39] | 94.5% | 1.9 | 38 | 35 |
| Proposed ANN-based controller | 95.4% | 0.9 | 16 | 5-15 |
Table 8.
Performance comparison with the state-of-the-art of the converters.
| Ref | L | C | Q | Voltage Gain | fs | Power | Efficiency (η%) |
|---|---|---|---|---|---|---|---|
| [8] | 2 | 3 | 3 | 50kHz | 100W | 92% | |
| [23] | 1 | 3 | 3 | 20kHz | 35W | 92.5% | |
| [26] | 2 | 5 | 2 | 100kHz | 200W | 91% | |
| [29] | 2 | 2 | 3 | 100kHz | 50W | 91.5% | |
| [31] | 4 | 4 | 4 | 50Hz | 250W | 93.5% | |
| Proposed Converter | 2 | 3 | 3 | ( | 50kHz | 1kW | 95.4% |
Table 9.
Hardware components and their specifications.
| Sl. No | Components | Specifications |
|---|---|---|
| 1 | Capacitors( C1, C2,and Co) | 1000 µF/50V, 2200µF/50V, 470µF/25V, 1000µF/63V |
| 2 | Diodes used in bridge rectifier 1 and 2 | FR207 |
| 3 | BR 101Rectron-Bridge Rectifier | 10A, 100V |
| 4 | Battery | 12V, 1.5Ah |
| 5 | Microcontroller | DSPIC IC30F4011 |
| 6 | Inductors (L1, L2,L3) | 2mH, 150µH |
| 7 | Power MOSFET (Q1, Q2, and Q3) | IRF 840 |
| 8 | Dump Load resistor | 1k, 47k |
Table 10.
Performance observations of the proposed configuration.
| Parameters | Simulation observation |
Experimental Observation |
Similarity and Interpretation |
|---|---|---|---|
| Input DC Voltage | Voltage increases from 440 V to 450 V and then to 500 V over the period of time. | Input voltage obtained at 34 V and output at 36.10 V. | Both exhibit increasing voltage; hardware uses a scaled-down model. |
|
Boost Converter Output Voltage |
Voltage stabilizes at 600 V after 0.1 seconds | Output voltage stabilizes at 36.10 V. | Stable voltage achieved in both systems; hardware output scaled down. |
| Battery Voltage | Voltage drops at 0.3 seconds, then stabilizes at 10 V. | Flat and steady voltage waveform observed | Both show stable battery behaviour post-transient. |
|
Bidirectional Converter Pulse |
Switching behaviour observed. | Pulses peak at ~10 V and ~20.75 V at 0.1 sec. | Both show expected pulse switching patterns. |
| Converter Pulse (General) | Periodic waveform behaviour assumed. | Oscillating waveform from -3.91 V to +5.52 V. | The periodic signal shows the converter switching operation. |
Disclaimer/Publisher’s Note: The statements, opinions and data contained in all publications are solely those of the individual author(s) and contributor(s) and not of MDPI and/or the editor(s). MDPI and/or the editor(s) disclaim responsibility for any injury to people or property resulting from any ideas, methods, instructions or products referred to in the content. |
© 2026 by the authors. Licensee MDPI, Basel, Switzerland. This article is an open access article distributed under the terms and conditions of the Creative Commons Attribution (CC BY) license.
Copyright: This open access article is published under a Creative Commons CC BY 4.0 license, which permit the free download, distribution, and reuse, provided that the author and preprint are cited in any reuse.


