
Submitted:
22 January 2026
Posted:
23 January 2026
You are already at the latest version
Abstract
Background/Objectives: Spread through air spaces (STAS) represents an aggressive invasion pattern in lung cancer and is associated with adverse oncologic outcomes. However, STAS is conventionally identified only after surgical resection, highlighting the need for reliable preoperative, noninvasive predictive approaches. Methods: In this retrospective study, patients who underwent surgical resection for lung cancer and had available preoperative ^18F-FDG PET/CT imaging were analyzed. Radiomic features were extracted from both intratumoral and peritumoral regions, the latter intended to reflect tumor microenvironment–related characteristics. Radiomic-only and clinicoradiomic models integrating clinical variables were developed using feature selection and multivariable modeling strategies, and their performance was evaluated using discrimination, calibration, and decision curve analyses. Results: Radiomic features derived from intratumoral metabolism and peritumoral tissue heterogeneity were associated with the presence of STAS. Integration of radiomic features with clinical parameters resulted in improved predictive performance compared with clinical models alone. The combined clinicoradiomic model demonstrated acceptable discrimination, calibration, and clinical utility across a range of threshold probabilities. Conclusions: Preoperative prediction of STAS in lung cancer is feasible using PET/CT-based radiomic analysis incorporating both intratumoral and peritumoral features. This noninvasive approach may provide biologically relevant information beyond anatomy-based assessment and supports further prospective validation of radiomic and clinicoradiomic models for STAS-oriented risk stratification.
Keywords:
lung cancer
; Spread through air spaces (STAS)
; ^18F-FDG PET/CT
; radiomics
; diagnostic accuracy
1. Introduction
Lung cancer remains one of the leading causes of cancer-related mortality worldwide [1]. Despite significant advances in surgical techniques, targeted therapies, and immunotherapies in recent years, patient prognosis largely depends on accurate staging and a deeper understanding of tumor biology [2]. In this context, there is a growing need for novel prognostic markers that can more precisely predict the clinical course of the disease, beyond the conventional TNM staging system [3].
In particular, prognostic factors identifiable in the preoperative period are central to personalized treatment strategies, especially for surgical candidate selection and resection planning. Consequently, the identification of novel markers reflecting invasion patterns and tumor biological behavior has become an important focus of contemporary lung cancer research.
In this context, invasion-related features that reflect the interaction between the tumor and the surrounding lung parenchyma, as well as patterns of tumor spread along air spaces, have emerged as a new paradigm for characterizing tumor biology and refining prognostic assessment. Although tumor invasion through air spaces has long been recognized in lung cancer, it was formally defined as a distinct invasion mechanism by the World Health Organization (WHO) in 2015 under the term “tumor spread through air spaces (STAS).” The presence of STAS has been shown to be associated with worse survival outcomes and has been proposed as an independent prognostic factor in lung adenocarcinomas across all stages, as well as in other histological subtypes of lung cancer [4].
Numerous clinical studies published in recent years have demonstrated that the presence of STAS is associated with poorer prognosis, an increased risk of local recurrence, and unfavorable survival outcomes in lung cancer [5,6,7,8]. STAS has been reported to represent an invasion pattern reflecting the biological aggressiveness of the disease independent of tumor stage and may be considered an independent prognostic factor [5,6]. The presence of STAS has been shown to confer more aggressive tumor behavior, with important implications for clinical decision-making, including the determination of the extent of surgical resection and postoperative treatment planning. STAS positivity has been associated with an increased risk of local recurrence following sublobar resection, even in patients with early-stage disease, prompting consideration of more extensive resection strategies or the need for adjuvant therapy [7,9]. Accordingly, STAS is increasingly regarded not only as a prognostic marker but also as a potential clinical factor that may influence treatment decisions [6,7].
In recent years, radiomic approaches enabling the quantitative analysis of high-dimensional data derived from medical imaging have been increasingly applied to a wide range of oncologic diseases, particularly lung cancer, with the aim of improving diagnostic accuracy, predicting prognosis, and estimating treatment response [10,11,12]. Clinicoradiomic models developed through the integration of clinical variables with radiomic features have demonstrated superior predictive performance compared with imaging or clinical parameters alone, allowing a more comprehensive representation of tumor biological behavior [13,14]. These advances offer substantial potential, particularly for preoperative risk stratification and personalized treatment planning.
Another emerging area of interest in lung cancer research in recent years is the role of the tumor microenvironment in shaping disease behavior. Accumulating evidence suggests that the composition of the tumor microenvironment, including immune cell infiltration and interactions with local and intratumoral microbiota, plays a critical role in tumor progression, treatment outcomes, and response to immunotherapy. The dynamic balance between immunosuppressive and immunostimulatory components within this microenvironment may influence clinical behavior and has been proposed to contribute to histopathological features associated with invasive growth patterns, such as STAS. Accordingly, a deeper understanding of these microenvironmental interactions is considered essential for the development of predictive biomarkers and personalized therapeutic strategies in lung cancer [15].
In this context, artificial intelligence– and deep learning–based approaches have recently been explored for the recognition and quantification of STAS. In a study published in 2024, Feng et al. reported that a deep learning model developed using digital pathology data demonstrated promising performance in the detection of STAS [16].
Although radiomic and artificial intelligence–based methods have shown encouraging results for STAS identification, the role of imaging-derived features reflecting the tumor microenvironment in the preoperative, noninvasive prediction of STAS remains insufficiently characterized. In particular, the contribution of clinicoradiomic models that integrate radiomic features with clinical variables to STAS-related risk stratification has been addressed in only a limited number of studies. Given the prognostic and potential treatment-guiding implications of STAS, there is a clear need for preoperative, noninvasive predictive models incorporating microenvironment-related radiomic features.
Accordingly, the aim of this study was to preoperatively predict the presence of STAS in patients with lung cancer using PET/CT-based radiomic and tumor microenvironment analyses, and to compare the diagnostic performance of radiomic-only and clinicoradiomic models.
2. Materials and Methods
2.1. Study Design and Patient Population
This retrospective study included 1,295 patients who underwent surgical resection for lung cancer between 2018 and 2024. Among these, 65 patients were pathologically diagnosed with spread through air spaces (STAS). Preoperative PET/CT imaging was available in 47 STAS-positive patients, who constituted the STAS-positive group.
Of the remaining 1,230 patients, those with T4 disease (n = 89), pathological N2 involvement (n = 250), small cell lung cancer (n = 95), or unknown STAS status (n = 272) were excluded. Following these exclusions, 524 patients were eligible for control selection.
A 1:1 case–control matching strategy was applied. Control patients were selected to achieve a distribution of T stage and tumor size comparable to that of the STAS-positive group. First, the distribution of T stage and tumor size among STAS-positive patients was determined. Subsequently, STAS-negative patients were randomly selected using an independent computer-based software to match this distribution.
Initially, 104 STAS-negative patients with a comparable T-stage distribution were identified. However, due to the availability of preoperative PET/CT imaging, 52 STAS-negative patients were ultimately included as the control group. The final study cohort consisted of 99 patients (47 STAS-positive and 52 STAS-negative), all of whom had available preoperative PET/CT imaging and comparable T stage and tumor size.
2.2. Clinical Data Collection
Clinical data were retrospectively obtained from electronic medical records. Demographic variables, including age and sex, and clinical characteristics such as smoking status, tumor location, and type of surgical resection were recorded. Pathological staging was determined according to the TNM classification system in use at the time of diagnosis.
For model development, clinicopathological variables considered clinically relevant or previously reported to be associated with prognosis were included in the analysis. Pathological assessment was performed independently of imaging analyses, and investigators involved in radiomic feature extraction and model construction were blinded to pathological outcomes.
2.3. PET/CT Imaging Protocol
All patients underwent preoperative ^18F-fluorodeoxyglucose (^18F-FDG) PET/CT imaging using a Philips Gemini TF 16-slice combined PET/CT scanner (Philips Medical Systems, Cleveland, OH, USA). The same PET/CT system was used for all patients to ensure imaging consistency. Following a minimum of 6 hours of fasting (blood glucose levels <150 mg/dL), 8–15 mCi of ^18F-FDG (approximately 2.5 MBq/kg body weight) was administered intravenously in accordance with the European Association of Nuclear Medicine (EANM) guidelines, version 2.0 [17]. Image acquisition was initiated 60 ± 5 minutes after tracer injection.
Non-contrast-enhanced CT images were first acquired using the following parameters: 140 kV, 100 mAs, and 5-mm slice thickness. Subsequently, PET images were obtained via whole-body scanning from the skull apex to the proximal thighs, with an emission acquisition time of 1.5 minutes per bed position and a total of 9 or 10 bed positions. Attenuation correction was performed using the acquired CT images. The voxel size was 4 × 4 × 4 mm. PET images were reconstructed using the row-action maximum likelihood algorithm (RAMLA).
2.4. ^18. F-FDG PET/CT Texture-Volumetric Analysis
^18F-FDG PET/CT images were analyzed using LIFEx software (LIFEx, Orsay, France) [18]. PET/CT images in DICOM format were transferred to the software for analysis. For each lesion, an initial volume of interest (VOI) was created to ensure accurate tumor delineation while excluding adjacent physiological uptake. Segmentation was performed by an experienced nuclear medicine physician specializing in thoracic PET/CT imaging, who was blinded to pathological findings, including STAS status.
The intratumoral VOI was defined as the metabolically active tumor volume. The region of interest of the target lesion was semi-automatically delineated on hybrid ^18F-FDG PET/CT images using a 41% SUVmax threshold by a nuclear medicine physician with 10 years of experience in PET/CT imaging (Figure 1). SUV normalized to body weight (SUVbw) was used as the SUV type. Conventional SUV parameters, histogram-based features, and shape parameters were extracted. Textural features were subsequently derived using gray-level co-occurrence matrix (GLCM), gray-level run length matrix (GLRLM), neighborhood gray-level difference matrix (NGLDM), and gray-level zone length matrix (GLZLM) analyses. These features are summarized in Table 1.
Areas with SUV values above 2.5 on whole-body images were automatically segmented. An initial VOI was generated for each lesion and manually adjusted when necessary to ensure accurate tumor delineation while excluding adjacent physiological uptake. The obtained VOIs were evaluated individually, and SUVmean and metabolic tumor volume (MTV) values were calculated for regions corresponding to the primary tumor. A 41% SUVmax threshold was applied to the VOIs [17,19]. Total lesion glycolysis (TLG) was calculated by multiplying MTV and SUVmean. CT images were used solely for attenuation correction, and CT-derived features were not included in texture analysis.
Texture matrices were computed using 64 gray levels to resample the region of interest. Absolute resampling was performed using 64 bins with SUV values ranging from a minimum of 0 to a maximum of 50, based on the maximum SUV values observed in the study cohort.
2.5. Tumor Microenvironment–Related Radiomic Analysis
To assess tumor microenvironment–related imaging characteristics, a peritumoral VOI was generated by isotropically expanding the intratumoral VOI by 7 mm in all directions. Non-pulmonary structures and areas of physiological FDG uptake, including the mediastinum, heart, major vessels, and chest wall, were carefully excluded. The peritumoral VOI was restricted to the lung parenchyma to reflect tumor–host interactions within the surrounding tissue.
Additional radiomic features were extracted from the peritumoral region identified during the segmentation process to evaluate imaging characteristics related to the tumor microenvironment. Radiomic features derived from the peritumoral region were used to characterize metabolic heterogeneity and spatial patterns potentially reflecting tumor–host interactions beyond the intratumoral compartment. These tumor microenvironment–related features were analyzed both separately and in combination with intratumoral radiomic features to explore their complementary predictive value.
Both intratumoral and tumor microenvironment–related radiomic features were subsequently incorporated into radiomic-only and clinicoradiomic models for the preoperative prediction of STAS.
2.6. Surgical Evaluation and Procedure
All patients underwent surgical resection with curative intent in accordance with current international guidelines for lung cancer management. The surgical approach and extent of resection were determined based on tumor characteristics, pulmonary reserve, comorbidities, and surgeon preference. Anatomical resections, including lobectomy or segmentectomy, were performed via video-assisted thoracoscopic surgery (VATS) or open thoracotomy, while sublobar resection was reserved for selected patients with limited cardiopulmonary reserve or small peripheral tumors. Wedge resection was performed only when anatomical resection was not feasible, and conversion from VATS to open thoracotomy was undertaken when required for oncological or technical reasons.
Systematic mediastinal lymph node dissection or sampling, including hilar and mediastinal nodal stations, was routinely performed according to institutional practice and international staging recommendations. Resected specimens were immediately sent for pathological examination, with tumor size measured on fresh specimens and resection margins assessed to confirm complete (R0) resection.
Postoperative management followed standardized institutional protocols. Perioperative complications, length of hospital stay, and postoperative outcomes were recorded, and surgical and pathological data were prospectively collected and retrospectively reviewed for analysis.
2.7. Histopathological Evaluation
Histopathological evaluation was performed on surgically resected specimens using routine hematoxylin–eosin (H&E)–stained sections by experienced thoracic pathologists as part of standard clinical practice. Tumor histological subtypes were classified according to the WHO classification of lung tumors. The presence or absence of STAS was assessed based on final pathology reports and recorded as a binary variable (STAS-positive or STAS-negative). STAS was defined as the presence of tumor cells beyond the edge of the main tumor mass, identified as micropapillary structures, solid tumor nests, or single tumor cells within the surrounding alveolar spaces at least one alveolar space away from the primary tumor. Pathological assessment of STAS was performed independently and subsequently confirmed, with pathologists blinded to clinical data, nuclear medicine findings, and radiomic analyses.
2.8. Model Construction
Two predictive models were developed for the preoperative prediction of STAS. The first was a radiomic-only model, which included selected intratumoral and tumor microenvironment–related radiomic features. The second was a clinicoradiomic model that integrated radiomic features with clinically relevant variables derived from routine clinical and pathological assessment.
Before model construction, feature dimensionality was reduced to minimize redundancy and prevent overfitting. Feature selection was performed using a regularization-based method, and highly correlated or unstable features were excluded. The selected features were subsequently entered into multivariable model development.
Model construction was carried out using a supervised classification approach. Radiomic-only and clinicoradiomic models were developed separately to enable direct comparison of their predictive performance and to assess the incremental value of incorporating clinical variables alongside radiomic features.
2.9. Radiomic Feature Extraction and Feature Selection
In preliminary analyses, a total of 85 variables, including clinical parameters and radiomic features, showed statistically significant correlations with the presence of STAS (p < 0.05). Due to the high number of correlated variables and the potential impact of multiple testing and multicollinearity, these features were not directly entered into the predictive models.
To reduce dimensionality and manage multicollinearity, feature selection was performed using the Least Absolute Shrinkage and Selection Operator (LASSO) method. This approach allowed reduction of model complexity while identifying the features with the highest predictive value. The LASSO procedure was conducted using 10-fold cross-validation to determine the optimal lambda parameter.
As a result of this process, two radiomic features with the highest predictive power in combination with clinical variables were selected for final modeling: the minimum standardized uptake value within the tumor (SUVmin_tumor) and the peritumoral NGLDM-derived Coarseness feature reflecting tissue heterogeneity (NGLDM_Coarseness_peritumor).
LASSO analysis was applied solely for dimensionality reduction and feature selection. Final coefficient estimation and model fitting were subsequently performed using conventional logistic regression.
2.10. Model Validation and Performance Evaluation
Model performance was assessed using internal validation procedures. A cross-validation strategy was applied to evaluate model robustness and to reduce the risk of overfitting. Predictive performance was quantified using receiver operating characteristic (ROC) curve analysis, and the area under the curve (AUC) was calculated for each model.
In addition to AUC, sensitivity, specificity, and overall accuracy were calculated at optimal cutoff values. Model calibration was evaluated to assess the agreement between predicted probabilities and observed outcomes. The predictive performances of the radiomic-only and clinicoradiomic models were compared to determine whether the inclusion of clinical variables improved the prediction of STAS.
All performance analyses were conducted with investigators blinded to pathological outcomes throughout model development and validation.
2.11. Statistical Analysis
Continuous variables were presented as mean ± standard deviation or median according to their distribution characteristics. Between-group comparisons were performed using the Student’s t test or the Mann–Whitney U test, as appropriate, while categorical variables were compared using Fisher’s exact test. For the prediction of STAS, a three-step hierarchical logistic regression modeling approach was applied. The clinical model included eosinophil count, neutrophil count, lactate dehydrogenase (LDH), and tumor location (central versus peripheral). The clinical–tumoral model was constructed by adding SUVmin_tumor to the clinical model, and the combined model was obtained by further incorporating NGLDM_Coarseness_peritumor into the clinical–tumoral model.
To ensure comparability of regression coefficients measured on different scales and to improve model stability, all continuous variables were standardized using Z-score transformation prior to analysis. Multicollinearity among model coefficients was assessed using the variance inflation factor (VIF), with values below 5 considered acceptable. The event-per-variable ratio was calculated to be approximately 7.8, which was deemed acceptable for multivariable modeling. Model discrimination was evaluated using receiver operating characteristic (ROC) curve analysis, and area under the curve (AUC) values were compared using the DeLong test. Model generalizability was assessed using repeated 10-fold cross-validation with five repetitions.
Model calibration was evaluated using the Hosmer–Lemeshow goodness-of-fit test and the Brier score. Clinical utility was assessed across a range of threshold probabilities using decision curve analysis. The optimal classification threshold was determined on the training dataset using the Youden index. All statistical analyses were performed using R software (version 4.3.3). Feature selection and dimensionality reduction were conducted using the glmnet package, ROC analyses and AUC comparisons were performed using the pROC package, internal validation procedures were carried out using the caret package, clinical utility was assessed using the dcurves package, model calibration was evaluated using the ResourceSelection package, descriptive clinical and demographic tables were generated using the tableone package, and graphical visualizations were created using ggplot2. These packages represent widely accepted analytical tools in radiomics-based predictive modeling and medical imaging research.
3. Results
3.1. Patient Characteristics and Univariate Analyses
Among the total of 99 patients, STAS positivity was identified in 47.5% (n = 47). The mean age of the entire cohort was 66.4 ± 8.65 years, and 25.3% of patients were female. A history of current or former smoking was present in 61.7% of patients. Centrally located tumors accounted for 24.2% of the cohort. Median laboratory values for the entire cohort were as follows: LDH 177 U/L (160–198.5), CRP 3.65 mg/L (1.72–10.15), neutrophil count 4700/mm³ (3605–6705), eosinophil count 160/mm³ (100–220), and neutrophil-to-lymphocyte ratio (NLR) 2.14 (1.70–3.35).
No significant differences were observed between STAS-positive and STAS-negative groups with respect to age, sex, or smoking history (p > 0.05). The prevalence of STAS was significantly lower in centrally located tumors compared with peripherally located tumors (65.4% vs 87.2%, p = 0.018), indicating peripheral tumor location as a predictive factor for STAS.
In laboratory analyses, LDH levels were significantly higher in the STAS-positive group (median 182 vs 170.5, p = 0.027), whereas inflammatory markers including neutrophil count (p = 0.005), eosinophil count (p = 0.036), and CRP level (p = 0.005) were significantly lower in STAS-positive patients.
When the distribution of key radiomic parameters selected for STAS prediction was examined, SUVmin_tumor values were significantly lower in the STAS-positive group compared with the STAS-negative group (median 1.41 [IQR: 0.96–1.88] vs 2.39 [IQR: 1.74–3.91], p < 0.001). In contrast, NGLDM_Coarseness_peritumor values were significantly higher in the STAS-positive group (median 0.0101 [IQR: 0.0069–0.0161] vs 0.0076 [IQR: 0.0045–0.0109], p = 0.006). Although the absolute values of this parameter were small, the statistically significant difference supports a strong association between peritumoral structural heterogeneity and the presence of STAS.
In univariate logistic regression analysis, central tumor location (OR = 0.276, p = 0.014), eosinophil count (OR = 0.995, p = 0.023), and SUVmin_tumor (OR = 0.55, p < 0.001) were identified as the variables most strongly associated with STAS. NGLDM_Coarseness_peritumor demonstrated a very high odds ratio in univariate analysis, which was attributed to numerical instability related to its distributional properties; this parameter was subsequently stabilized through standardization in multivariable analyses.
3.2. Multivariable Model Performance and Internal Validation
Hierarchical modeling demonstrated a stepwise improvement in predictive performance. The AUC of the clinical model was 0.779 (95% CI: 0.690–0.868), which increased to 0.831 (95% CI: 0.753–0.908) for the clinical–tumoral model and to 0.852 (95% CI: 0.780–0.924) for the combined model. The difference between the clinical model and the combined model was statistically significant (DeLong p = 0.027).
In repeated cross-validation, the combined model achieved a mean AUC of 0.783 (95% CI: 0.748–0.818). At the optimal cutoff value determined by the Youden index on the training dataset (threshold = 0.563), the combined model demonstrated an accuracy of 77.8%, a specificity of 82.7%, and a sensitivity of 72.3%.
3.3. Model Comparisons and Incremental Contribution Analysis
Likelihood ratio testing showed that the addition of SUVmin_tumor to the clinical model resulted in a statistically significant improvement in model fit (p < 0.001). Although the inclusion of NGLDM_Coarseness_peritumor provided a borderline statistical contribution (p = 0.081), decision curve analysis demonstrated that the combined model offered greater net clinical benefit across a broad range of threshold probabilities compared with the clinical model.
3.4. Multivariable Risk Estimates and Calibration
In the Z-score–standardized combined model, variables independently associated with the presence of STAS were LDH (OR = 1.91, 95% CI: 1.08–3.78, p = 0.043), eosinophil count (OR = 0.316, 95% CI: 0.117–0.718, p = 0.013), and SUVmin_tumor (OR = 0.435, 95% CI: 0.204–0.823, p = 0.018). An increase in NGLDM_Coarseness_peritumor showed a trend toward higher STAS risk (OR = 1.68, 95% CI: 0.941–3.292, p = 0.099). Variance inflation factor values ranged between 1.1 and 1.3 for all variables, indicating no significant multicollinearity.
Calibration of the combined model was good, as demonstrated by the Hosmer–Lemeshow test (p = 0.694). The Brier score, reflecting the agreement between predicted and observed probabilities, was calculated as 0.16.
Figure 2.
Receiver Operating Characteristic (ROC) Curves for the Prediction of Spread Through Air Spaces (STAS). This figure displays the ROC curves for the three predictive models: Clinical, Clinical+Tumoral, and Full Clinicoradiomic. The x-axis represents 1-Specificity (False Positive Rate), and the y-axis represents Sensitivity (True Positive Rate). The dashed grey line indicates the performance of a random classifier (AUC = 0.5). The area under the curve (AUC) for each model is provided in the legend. A progressive increase in AUC values is observed from the Clinical Model (AUC = 0.779) to the Clinical+Tumoral Model (AUC = 0.831), culminating in the highest performance with the Full Clinicoradiomic Model (AUC = 0.852), demonstrating the incremental diagnostic value of incorporating radiomic features in STAS prediction.
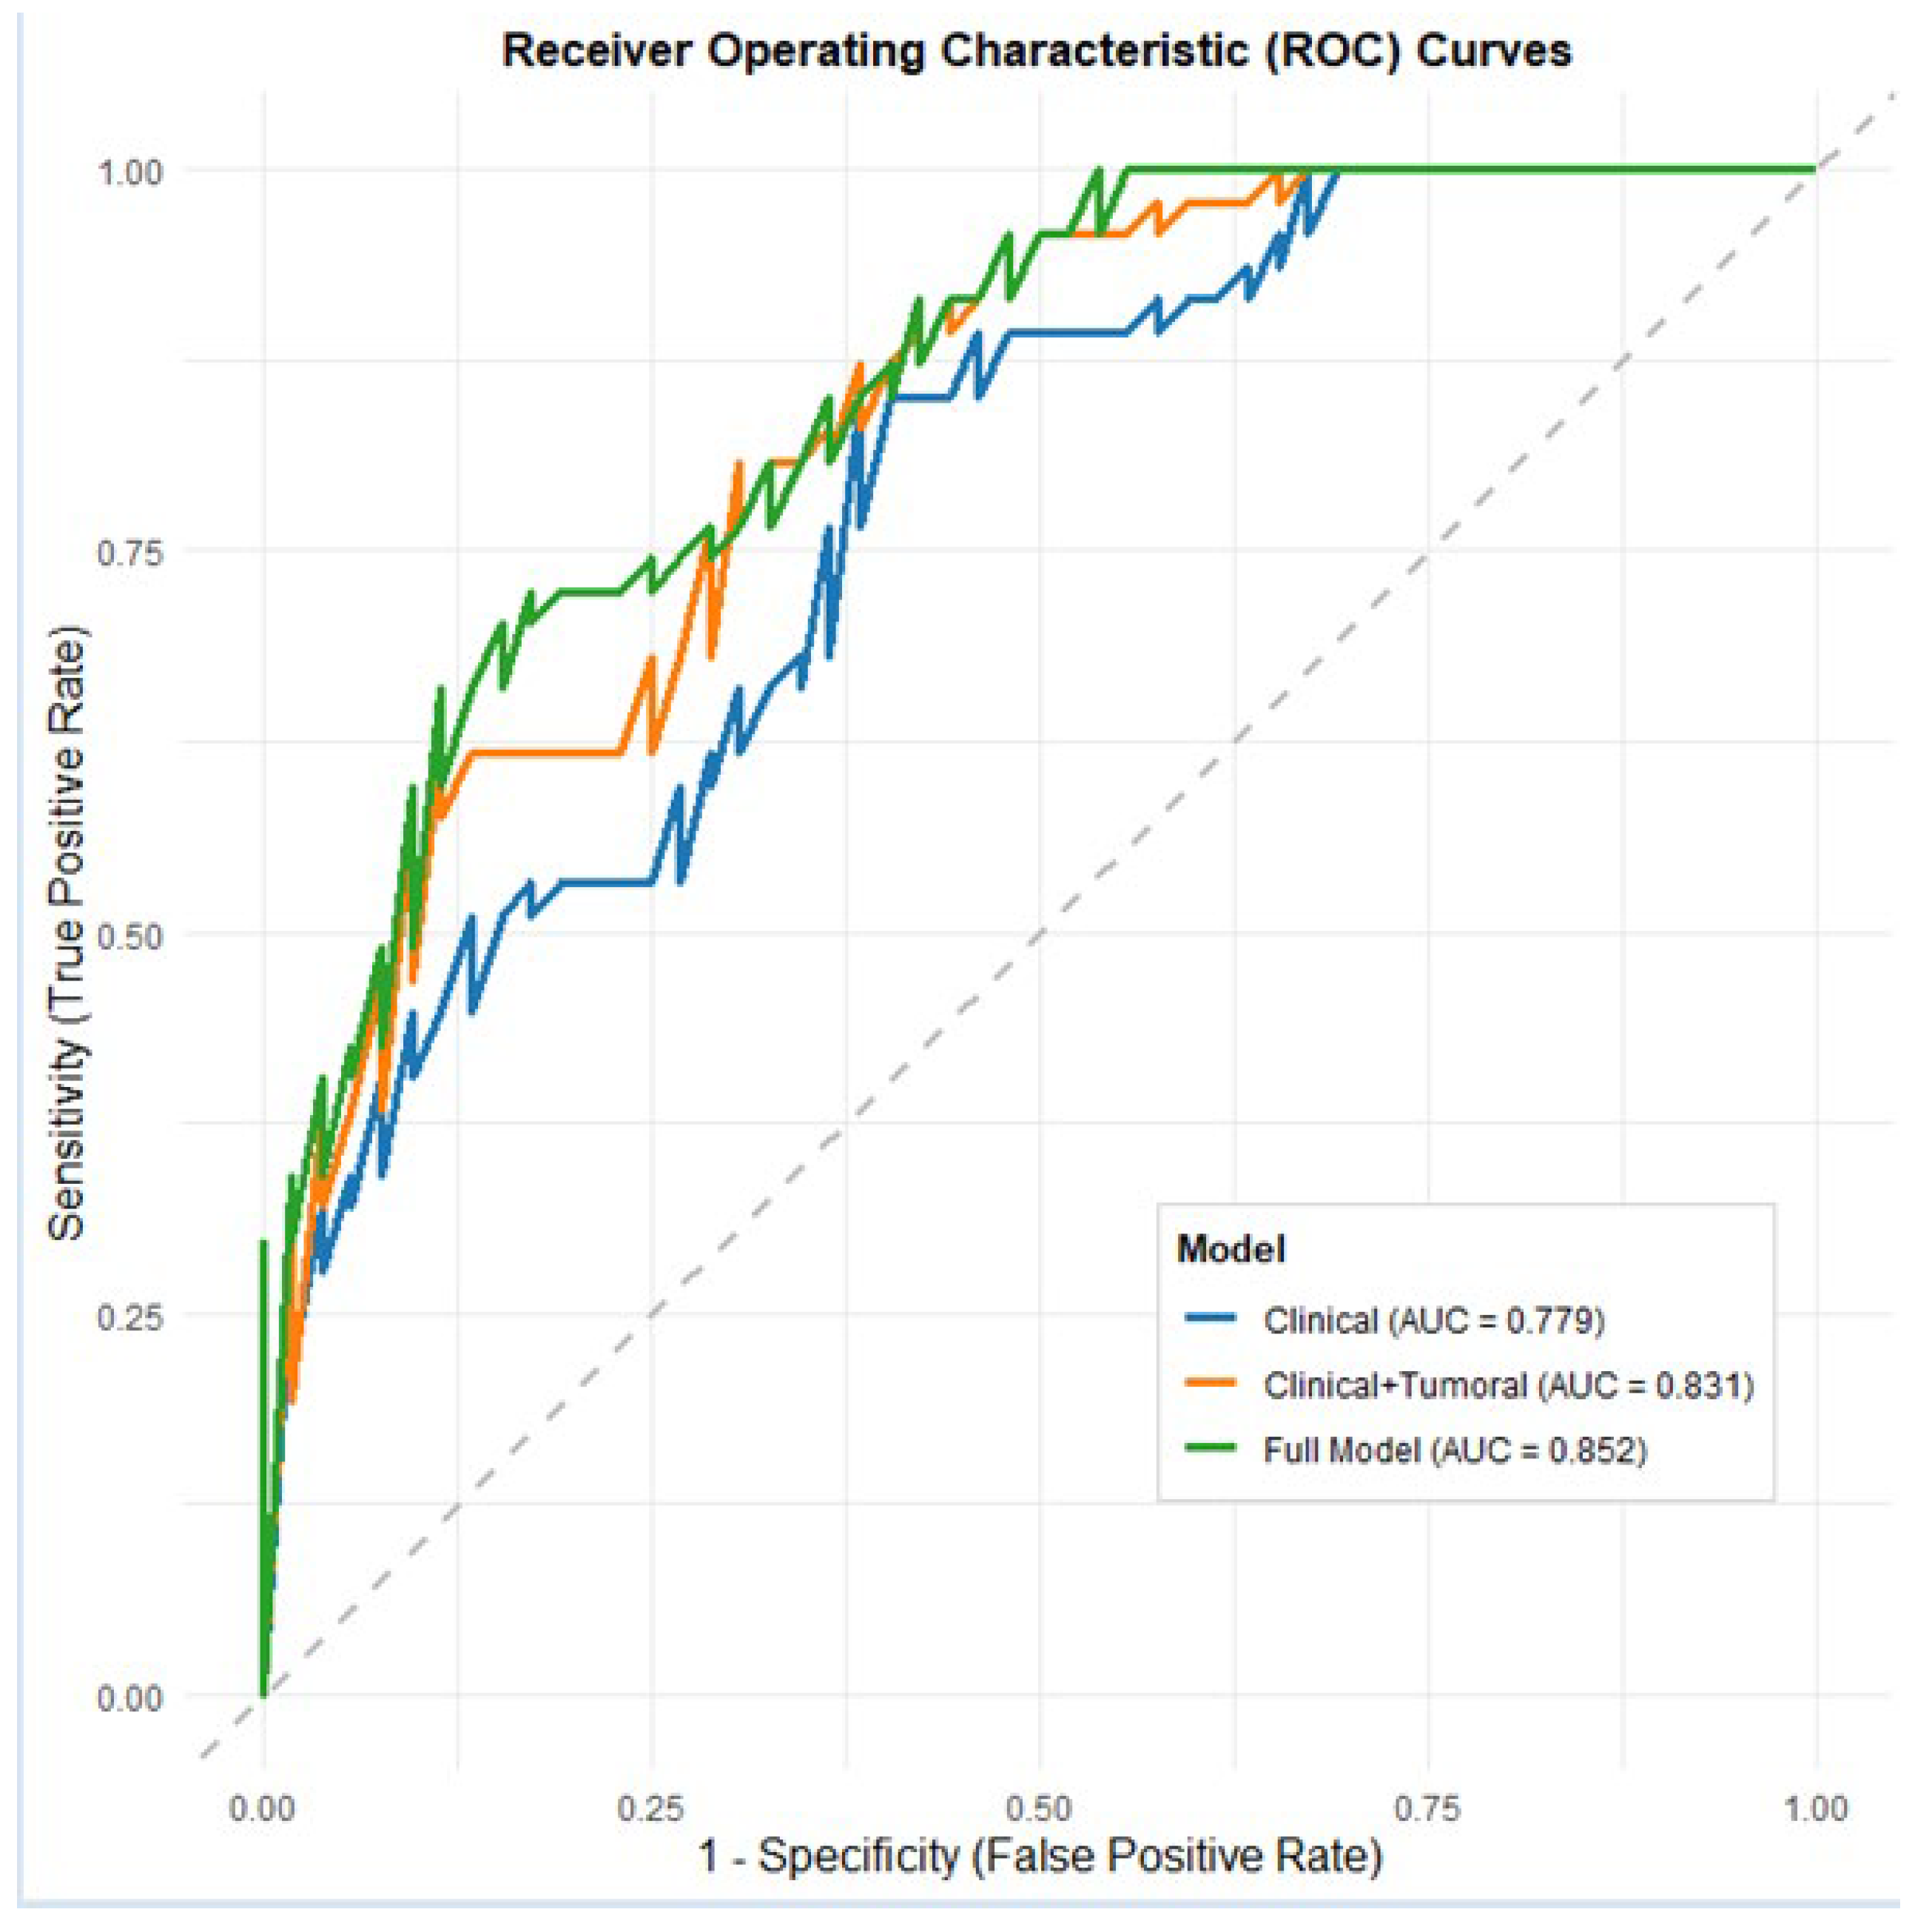
Figure 3.
Decision Curve Analysis for Predicting Spread Through Air Spaces (STAS). The decision curve analysis compares the net benefit of the Full Model (clinicoradiomic) and the Clinical Model against the strategies of treating all patients (red line) or no patients (yellow line). The Full Model demonstrates the highest net benefit across a wide range of threshold probabilities (from approximately 0.1 to 0.8), indicating superior clinical utility in identifying patients with STAS compared to using only clinical parameters or intervening in all/no cases. The higher net benefit suggests that the Full Model contributes positively to clinical decision-making by reducing unnecessary interventions or missed diagnoses.
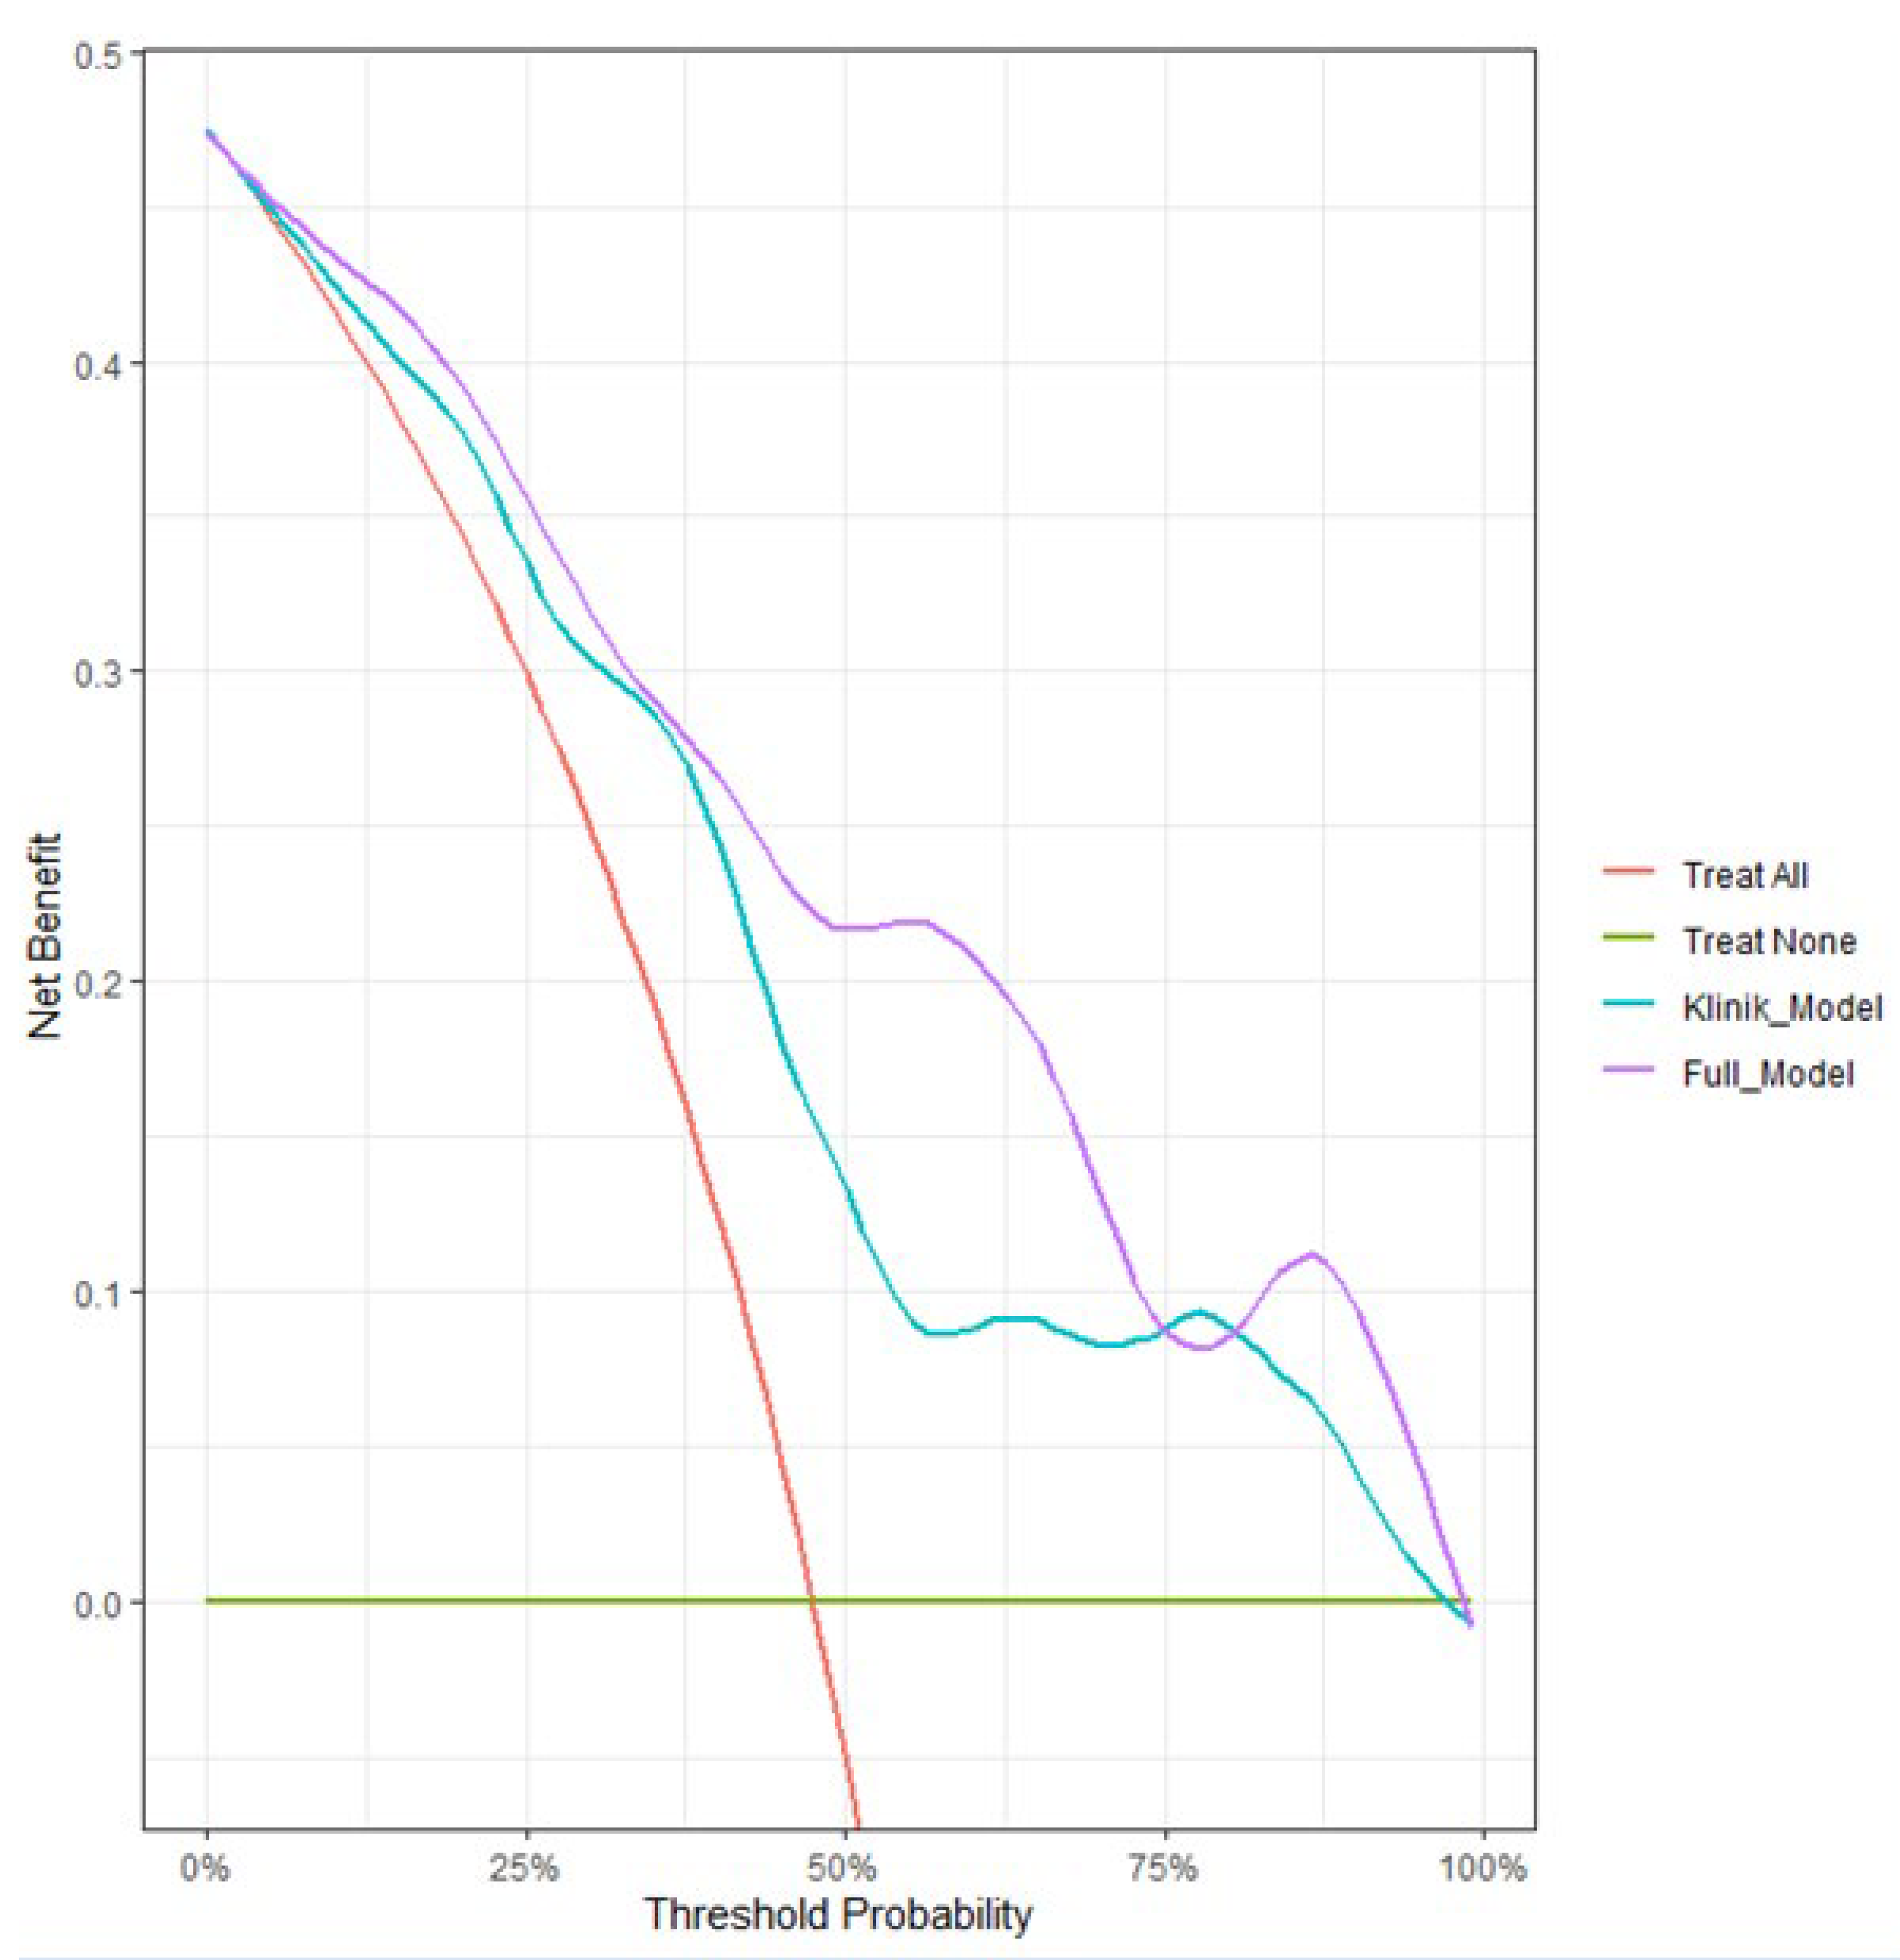
Figure 4.
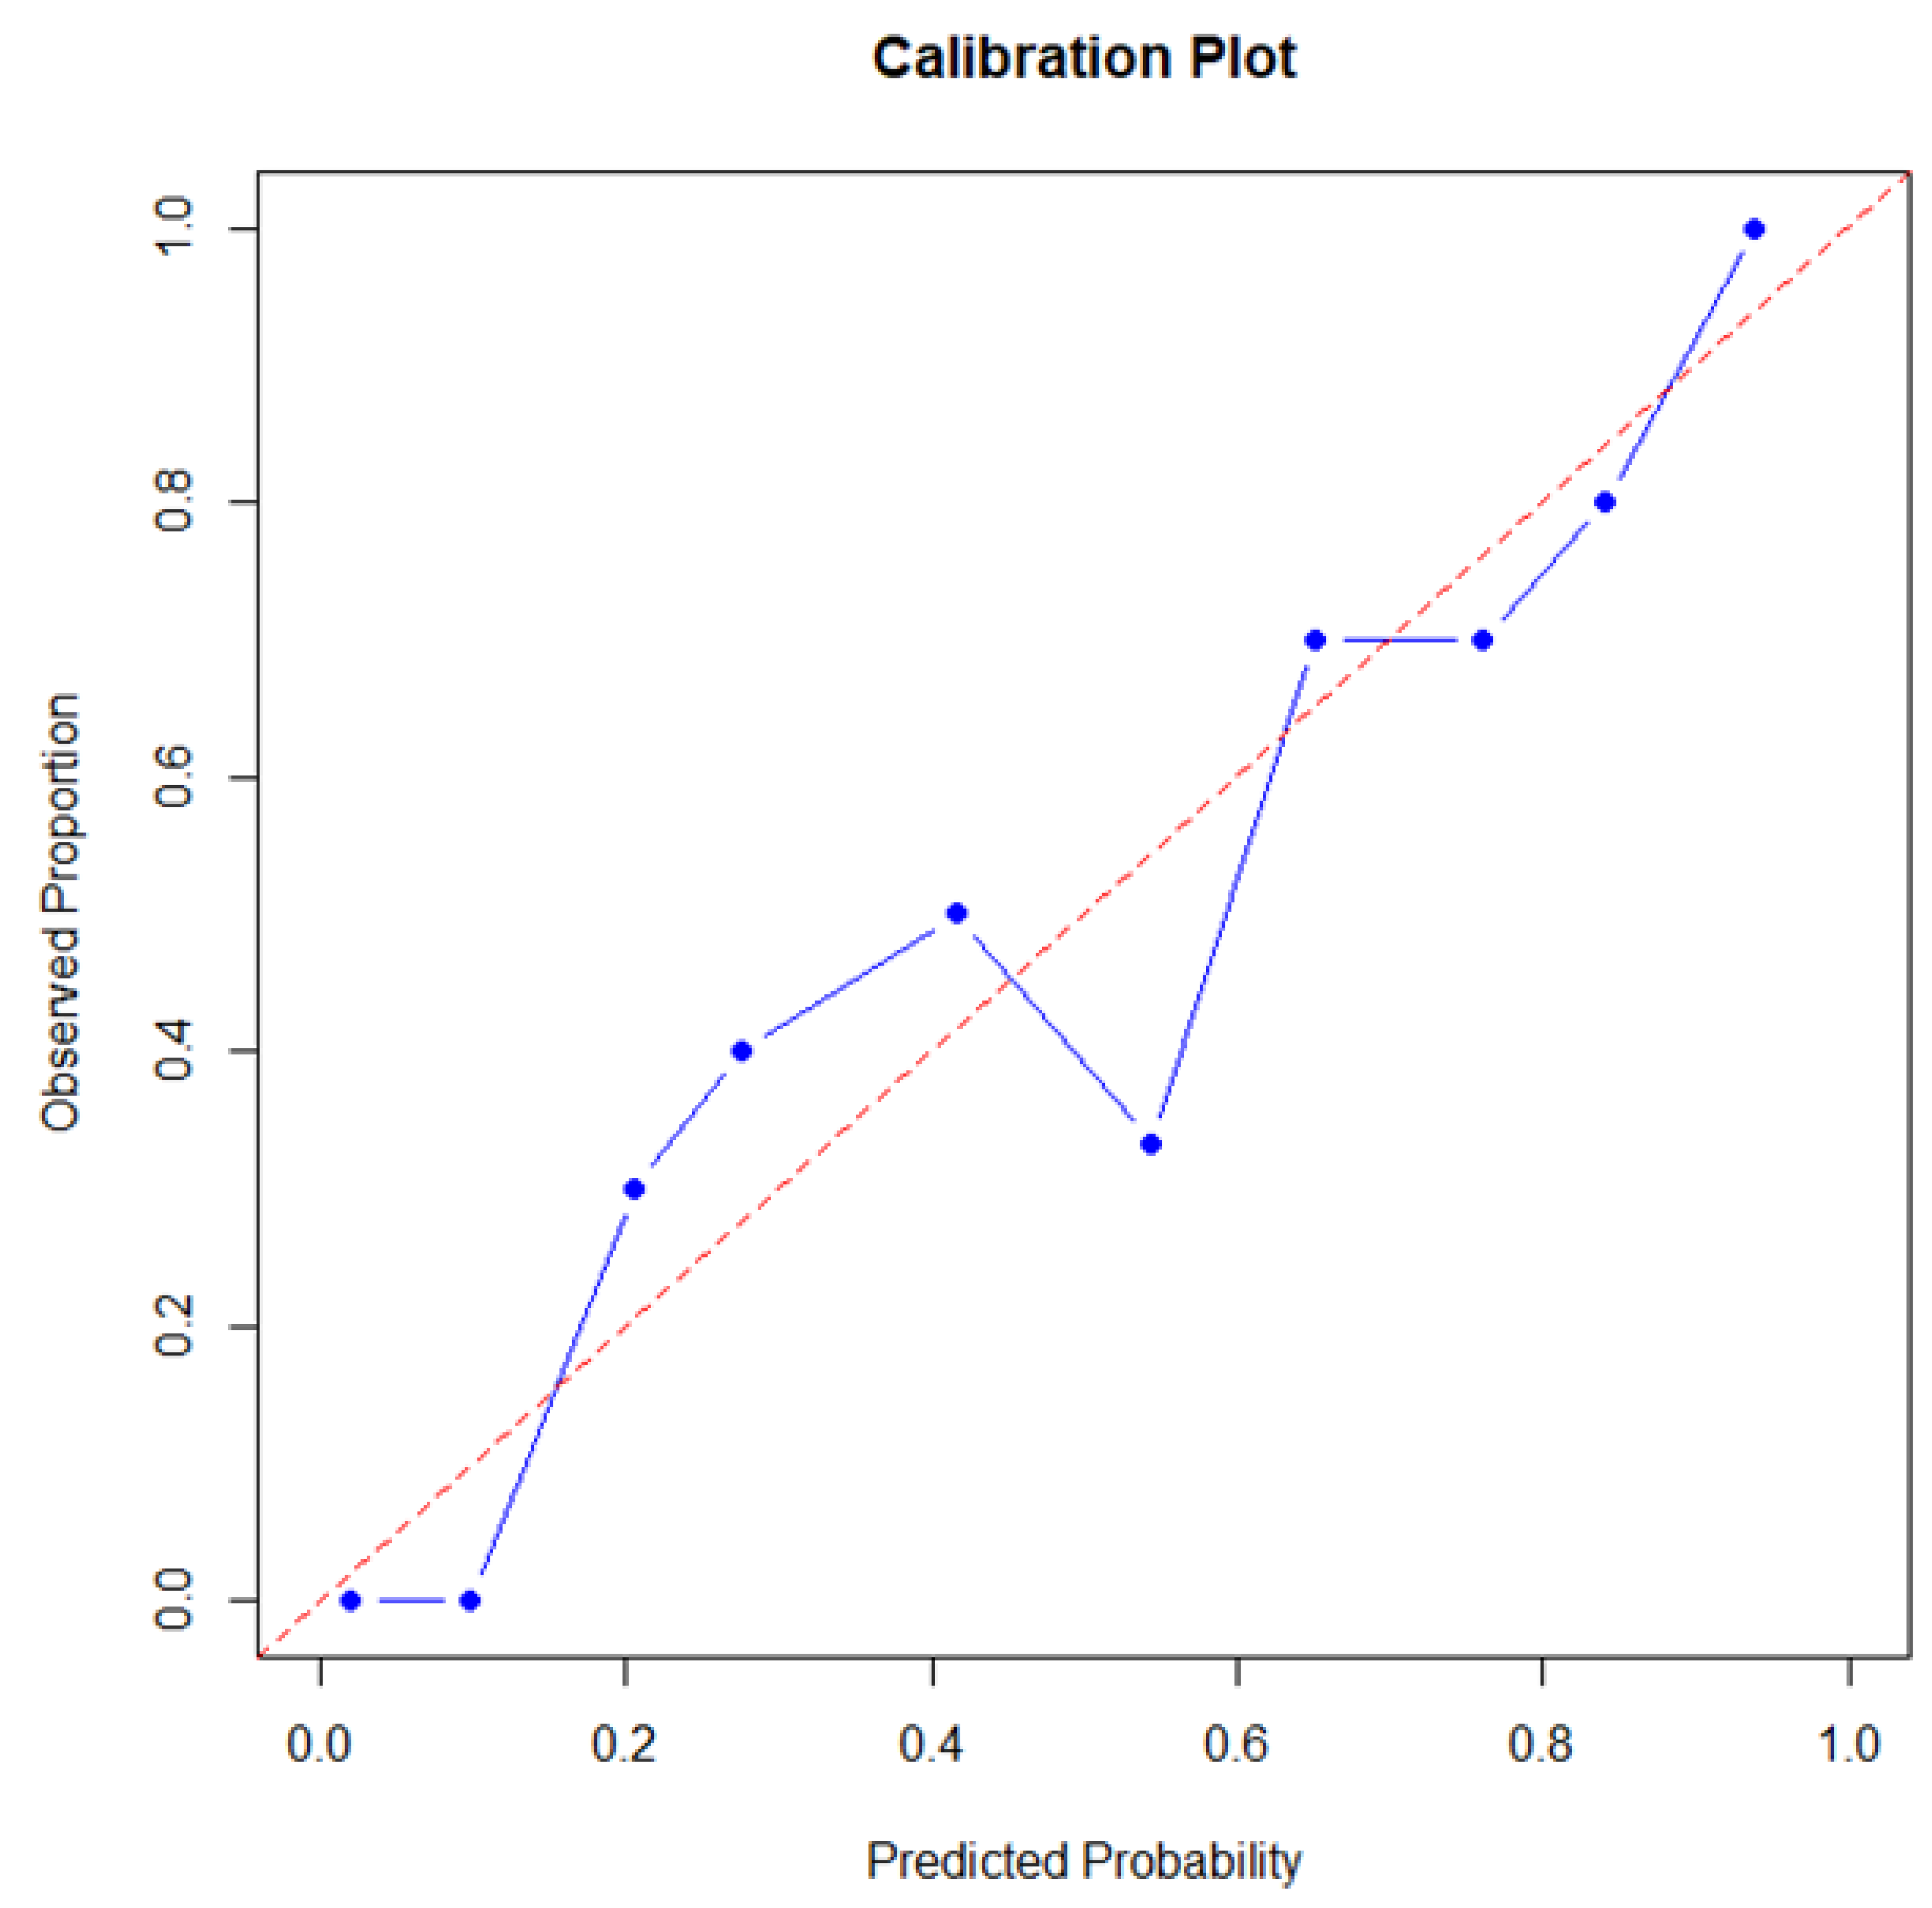
Calibration Plot of the Full Clinicoradiomic Model for Predicting Spread Through Air Spaces (STAS). The calibration plot assesses the agreement between the predicted probabilities of STAS (x-axis) and the observed proportions of STAS (y-axis). The dashed red line represents perfect calibration (where predicted probability exactly matches observed proportion). The blue line, representing the Full Model, closely approximates the ideal calibration line across the entire range of probabilities. This close alignment, further supported by a non-significant Hosmer-Lemeshow test (p = 0.694), indicates that the model's predicted risks are highly consistent with the actual observed STAS rates, affirming its reliability and trustworthiness in clinical predictions.
Figure 4.
Calibration Plot of the Full Clinicoradiomic Model for Predicting Spread Through Air Spaces (STAS). The calibration plot assesses the agreement between the predicted probabilities of STAS (x-axis) and the observed proportions of STAS (y-axis). The dashed red line represents perfect calibration (where predicted probability exactly matches observed proportion). The blue line, representing the Full Model, closely approximates the ideal calibration line across the entire range of probabilities. This close alignment, further supported by a non-significant Hosmer-Lemeshow test (p = 0.694), indicates that the model's predicted risks are highly consistent with the actual observed STAS rates, affirming its reliability and trustworthiness in clinical predictions.
4. Discussion
In this study, ^18F-FDG PET/CT–based radiomic and clinicoradiomic models were developed and internally validated for the preoperative prediction of STAS in patients with non–small cell lung cancer. STAS, which is conventionally assessed through histopathological examination of resected specimens, was systematically analyzed in relation to clinical, laboratory, and radiomic features in a surgically treated cohort. STAS was associated with peripheral tumor location, selected metabolic imaging parameters, and radiomic features reflecting peritumoral tissue heterogeneity. The inclusion of radiomic variables alongside clinical parameters resulted in improved model performance compared with clinical models alone. Differences in net benefit across a range of threshold probabilities were observed between the evaluated models in decision curve analysis. The combined clinicoradiomic model demonstrated acceptable calibration, indicating agreement between predicted probabilities and observed STAS status within the study population.
The prognostic significance of STAS was first systematically described by Kadota and colleagues, who demonstrated its association with worse survival and higher recurrence rates in lung adenocarcinoma [5]. Subsequently, Warth et al. confirmed that STAS constitutes an independent prognostic factor across broader patient populations [6]. Shiono and Yanagawa further highlighted the adverse prognostic impact of STAS in stage I disease, emphasizing its prognostic value beyond conventional staging systems [8]. Similarly, Toyokawa et al. reported inferior oncological outcomes in patients with STAS-positive tumors, reinforcing the clinical importance of this invasion pattern [9]. Collectively, these studies establish STAS as more than a histopathological observation, positioning it as a surrogate marker of aggressive tumor behavior.
From a clinical perspective, STAS challenges the adequacy of anatomy-based staging systems alone. Although TNM classification remains the cornerstone of lung cancer management [2], it does not capture microscopic invasion patterns or tumor–host interactions. Evidence demonstrating significantly worse outcomes in STAS-positive tumors of similar stage and size suggests that a subset of anatomically early-stage tumors may behave biologically aggressively [6,8,9]. Preoperative identification of STAS could therefore facilitate a shift from purely anatomy-driven decision-making toward a more biology-oriented treatment strategy.
Radiomic analysis enables the extraction of quantitative descriptors that characterize spatial heterogeneity within medical images and has increasingly been applied to explore both tumor-intrinsic properties and the surrounding tissue context [10,11,12]. Although STAS represents a distinct histopathological invasion pattern, several CT-based radiomic studies have demonstrated that intratumoral heterogeneity features are associated with STAS and can achieve meaningful predictive performance [20,21]; however, PET/CT-based radiomic approaches specifically targeting STAS remain scarce. In this context, the present study extends prior work by jointly evaluating intratumoral metabolic features and peritumoral radiomic characteristics derived from ^18F-FDG PET/CT, thereby capturing complementary information related to both tumor structure and the adjacent microenvironment. The inclusion of the peritumoral NGLDM-derived coarseness feature highlights the potential of radiomic texture metrics to reflect metabolic and structural heterogeneity in lung parenchyma surrounding the tumor, an area closely linked to the biological processes underlying STAS.
A major contribution of the present study is the integration of peritumoral, microenvironment-related radiomic features derived from ^18F-FDG PET/CT into STAS prediction models. Although STAS is defined histopathologically by tumor cell spread beyond the main tumor edge into surrounding alveolar spaces, metabolic and structural alterations in the adjacent lung parenchyma represent biologically plausible imaging correlates of this invasion pattern [4]. Similar peritumoral radiomic features, including NGLDM coarseness, have previously been associated with microenvironmental heterogeneity and tumor–host interactions in oncologic PET/CT imaging studies [22]. Within this framework, the contribution of the peritumoral NGLDM-derived coarseness feature in our models suggests that imaging-based texture metrics may capture aspects of microenvironmental disruption related to invasive behavior, providing complementary information beyond intratumoral features alone while maintaining a noninvasive approach. Recent spatial transcriptomic analyses have further demonstrated that tumor cells involved in STAS exhibit distinct molecular and microenvironmental profiles at the tumor–airspace interface compared with the main tumor mass, supporting the biological plausibility of peritumoral heterogeneity captured by imaging-based approaches [23]. This finding aligns with previous oncologic imaging literature indicating that peritumoral radiomic features may carry prognostic relevance across different tumor types [24].
Among intratumoral radiomic parameters, SUVmin_tumor emerged as an independent and robust predictor of STAS. Previous PET-based radiomic studies have suggested that parameters reflecting metabolic heterogeneity and spatial distribution may convey more biologically meaningful information than single-voxel intensity metrics such as SUVmax [25,26]. Low-uptake regions within tumors have been associated with hypoxia, necrosis, and irregular invasive growth patterns. Our findings extend this concept to STAS, indicating that intratumoral metabolic heterogeneity captured by SUVmin may reflect underlying invasive potential.
From a surgical perspective, the ability to estimate STAS risk preoperatively carries important clinical implications. Prior studies have demonstrated higher local recurrence rates following sublobar resection in STAS-positive tumors, whereas lobectomy has been associated with improved oncologic outcomes in this subgroup [7,8]. Although the present study does not aim to directly guide surgical decision-making, it provides a noninvasive tool to estimate the biological risk underlying surgical strategies, potentially supporting more individualized operative planning.
More broadly, our findings reflect an ongoing paradigm shift in lung cancer management. Traditional reactive approaches based on postoperative pathology are increasingly being complemented by proactive strategies that aim to anticipate tumor behavior before treatment. In this context, PET/CT radiomics and microenvironment analysis should be viewed not merely as advanced imaging techniques, but as biologically informative windows into tumor aggressiveness. Emerging evidence from digital pathology and deep learning-based STAS detection further supports this integrative, biology-driven framework [16].
Several limitations should be acknowledged. The retrospective, single-center design may limit generalizability. In addition, the absence of separate training and independent validation cohorts represents a methodological limitation, although internal validation procedures were applied to mitigate the risk of overfitting. However, the use of a uniform imaging protocol and a single PET/CT system strengthens the internal consistency of the radiomic analysis. Furthermore, the simultaneous evaluation of intratumoral and peritumoral regions constitutes a methodological strength, as it allows assessment of both tumor-intrinsic characteristics and microenvironment-related imaging features. External validation in multicenter, prospective cohorts will be essential to confirm the robustness and clinical utility of the proposed models.
5. Conclusions
In conclusion, this study demonstrates that STAS, an aggressive and clinically meaningful invasion pattern, can be predicted preoperatively through the integration of ^18F-FDG PET/CT–based radiomic features derived from both intratumoral and peritumoral regions, together with clinical data.
The developed clinicoradiomic model extends beyond anatomy-based assessment and offers a noninvasive approach to capturing tumor biological behavior at an earlier stage. This strategy may support biology-driven risk stratification and surgical planning in lung cancer and provides a strong rationale for future prospective and multicenter investigations focusing on STAS-oriented personalized management.
Author Contributions
Conceptualization was performed by D.S.U., K.C.C., and G.P. Methodology and project administration were led by D.S.U., with formal statistical analysis and radiomic data analysis conducted by A.A. Software implementation and visualization were carried out by A.A. and N.A. Investigation, including clinical data collection, PET/CT image analysis, and data curation, was performed by D.S.U., N.A., O.S.U., B.D., and N.Y. Pathological data collection and interpretation were undertaken by N.Y. Resources and access to the primary dataset were provided by B.A.Ş. Writing of the original draft was carried out by D.S.U., N.A., O.S.U., B.A.Ş., and N.Y., while critical review and editing of the manuscript were performed by D.S.U., O.S.U., Ö.Ö., K.C.C., and G.P. Supervision of the study was provided by K.C.C. and G.P. All authors have read and agreed to the published version of the manuscript.
Funding
This research received no external funding.
Institutional Review Board Statement
The study was conducted in accordance with the Declaration of Helsinki and approved by the Institutional Review Board (Ethics Committee) of Izmir Health Sciences University, Dr. Suat Seren Chest Diseases and Surgery Training and Research Hospital (approval number: 2025/33-26; approval date: 14 May 2025).
Informed Consent Statement
“Written informed consent has been obtained from the patient(s) to publish this paper”.
Data Availability Statement
We encourage all authors of articles published in MDPI journals to share their research data. In this section, please provide details regarding where data supporting reported results can be found, including links to publicly archived datasets analyzed or generated during the study. Where no new data were created, or where data is unavailable due to privacy or ethical restrictions, a statement is still required. Suggested Data Availability Statements are available in section “MDPI Research Data Policies” at https://www.mdpi.com/ethics.
Acknowledgments
During the preparation of this manuscript, the authors occasionally used a large language model–based tool (ChatGPT, OpenAI) for language editing and translation support only. The authors reviewed and edited all generated content and take full responsibility for the accuracy, integrity, and originality of the final manuscript. All authors have read and approved the final version of the manuscript.
Conflicts of Interest
The authors declare no conflicts of interest.
Abbreviations
The following abbreviations are used in this manuscript:
STAS, spread through air spaces; PET/CT, positron emission tomography/computed tomography; ^18F-FDG, fluorine-18 fluorodeoxyglucose; SUV, standardized uptake value; SUVmin, minimum standardized uptake value; MTV, metabolic tumor volume;
TLG, total lesion glycolysis; GLCM, gray-level co-occurrence matrix;
GLRLM, gray-level run-length matrix; NGLDM, neighborhood gray-level difference matrix; GLZLM, gray-level zone-length matrix; ROC, receiver operating characteristic;
AUC, area under the curve; LDH, lactate dehydrogenase;
CRP, C-reactive protein; NLR, neutrophil-to-lymphocyte ratio.
References
- Sung, H.; Ferlay, J.; Siegel, R.L.; Laversanne, M.; Soerjomataram, I.; Jemal, A.; Bray, F. Global cancer statistics 2020: GLOBOCAN estimates of incidence and mortality worldwide for 36 cancers in 185 countries. CA Cancer J. Clin. 2021, 71, 209–249. [CrossRef]
- Goldstraw, P.; Chansky, K.; Crowley, J.; Rami-Porta, R.; Asamura, H.; Eberhardt, W.E.; Nicholson, A.G.; Groome, P.; Mitchell, A.; Bolejack, V. The IASLC lung cancer staging project: Proposals for revision of the TNM stage groupings in the forthcoming (eighth) edition of the TNM classification for lung cancer. J. Thorac. Oncol. 2016, 11, 39–51. [CrossRef]
- Herbst, R.S.; Morgensztern, D.; Boshoff, C. The biology and management of non-small cell lung cancer. Nature 2018, 553, 446– 4. [CrossRef]
- Mino-Kenudson, M. Significance of tumor spread through air spaces (STAS) in lung cancer from the pathologist perspective. Transl. Lung Cancer Res. 2020, 9, 847–859. [CrossRef]
- Kadota, K.; Nitadori, J.I.; Sima, C.S.; et al. Tumor spread through air spaces is an important pattern of invasion and impacts the prognosis of patients with lung adenocarcinoma. J. Thorac. Oncol. 2015, 10, 806–814.
- Warth, A.; Muley, T.; Kossakowski, C.A.; et al. Spread through air spaces (STAS): A novel prognostic factor in lung adenocarcinoma. Am. J. Surg. Pathol. 2015, 39, 793–801.
- Eguchi, T.; Kameda, K.; Lu, S.; et al. Lobectomy is associated with better outcomes than sublobar resection in patients with small-sized lung adenocarcinoma and spread through air spaces. J. Thorac. Oncol. 2017, 12, 321–328.
- Shiono, S.; Yanagawa, N. Spread through air spaces is a prognostic factor in stage I lung adenocarcinoma. Ann. Thorac. Surg. 2018, 106, 354–360.
- Toyokawa, G.; Yamada, Y.; Tagawa, T.; et al. Significance of spread through air spaces in resected lung adenocarcinoma. Eur. J. Cardiothorac. Surg. 2018, 54, 495–501.
- Aerts, H.J.W.L.; Velazquez, E.R.; Leijenaar, R.T.H.; et al. Decoding tumour phenotype by noninvasive imaging using a quantitative radiomics approach. Nat. Commun.2014, 5, 4006. [CrossRef]
- Lambin, P.; Rios-Velazquez, E.; Leijenaar, R.; et al. Radiomics: Extracting more information from medical images using advanced feature analysis. Eur. J. Cancer 2012, 48, 441–446.
- Parmar, C.; Grossmann, P.; Bussink, J.; Lambin, P.; Aerts, H.J.W.L. Machine learning methods for quantitative radiomic biomarkers. Sci. Rep. 2015, 5, 13087.
- Huang, Y.; Liu, Z.; He, L.; et al. Radiomics signature: A potential biomarker for the prediction of disease-free survival in early-stage non–small cell lung cancer. Radiology 2016, 281, 947–957.
- Ran J, Cao R, Cai J, Yu T, Zhao D, Wang Z. Development and Validation of a Nomogram for Preoperative Prediction of Lymph Node Metastasis in Lung Adenocarcinoma Based on Radiomics Signature and Deep Learning Signature. Front Oncol. 2021 Apr 22;11:585942. PMID: 33968715; PMCID: PMC8101496. [CrossRef]
- De Lucia A, Mazzotti L, Gaimari A, Zurlo M, Maltoni R, et al. Non-small cell lung cancer and the tumor microenvironment: making headway from targeted therapies to advanced immunotherapy. Front Immunol. 2025 Feb 10;16:1515748. PMID: 39995659; PMCID: PMC11847692. [CrossRef]
- Feng Y, Ding H, Huang X, Zhang Y, Lu M, Zhang T, Wang H, Chen Y, Mao Q, Xia W, Chen B, Zhang Y, Chen C, Gu T, Xu L, Dong G, Jiang F. Deep learning-based detection and semi-quantitative model for spread through air spaces (STAS) in lung adenocarcinoma. NPJ Precis Oncol. 2024 Aug 5;8(1):173. PMID: 39103596; PMCID: PMC11300827. [CrossRef]
- Boellaard, R.; Delgado-Bolton, R.; Oyen, W.J.G.; et al. FDG PET/CT: EANM procedure guidelines for tumour imaging: Version 2.0. Eur. J. Nucl. Med. Mol. Imaging 2015, 42, 328–354.
- Nioche, C.; Orlhac, F.; Boughdad, S.; et al. LIFEx: A freeware for radiomic feature calculation in multimodality imaging to accelerate advances in tumor heterogeneity characterization. Cancer Res. 2018, 78, 4786–4789.
- Meignan, M.; Sasanelli, M.; Casasnovas, R.O.; et al. Metabolic tumour volumes measured at staging in lymphoma: Methodological evaluation on phantom experiments and patients. Eur. J. Nucl. Med. Mol. Imaging 2014, 41, 1113–1122.
- Liao G, Huang L, Wu S, Zhang P, Xie D, Yao L, Zhang Z, Yao S, Shanshan L, Wang S, Wang G, Wing-Chi Chan L, Zhou H. Preoperative CT-based peritumoral and tumoral radiomic features prediction for tumor spread through air spaces in clinical stage I lung adenocarcinoma. Lung Cancer. 2022 Jan;163:87-95. Epub 2021 Dec 6. PMID: 34942493. [CrossRef]
- Jiang C, Luo Y, Yuan J, You S, Chen Z, Wu M, et al. CT-based radiomics and machine learning to predict spread through air space in lung adenocarcinoma. Eur Radiol. 2020;30(7):4050–4057.
- Lee JW, Woo S, Kim YT, Lee K-H, Lee SM, Kim Y, et al. Peritumoral adipose tissue radiomic features derived from ^18F-FDG PET/CT: associations with tumor microenvironment characteristics and molecular subtypes in breast cancer. J Pers Med. 2024;14(9):952.
- Wang W, Zhou W, Fan J, Jiang T, Yang G, Song C, Xu S, Luo H, Liu H. Spatial deciphering of the transcriptomic heterogeneity of tumor spread through air spaces in lung cancer. Front Pharmacol. 2025 Jul 25;16:1567527. PMID: 40786043; PMCID: PMC12331751. [CrossRef]
- Zuo YQ, Gao D, Cui JJ, Yin YL, Gao ZH, Feng PY, Geng ZJ, Yang X. Peritumoral and intratumoral radiomics for predicting visceral pleural invasion in lung adenocarcinoma based on preoperative computed tomography (CT). Clin Radiol. 2025 Jan;80:106729. Epub 2024 Oct 19. PMID: 39540685. [CrossRef]
- Piñeiro-Fiel M, Moscoso A, Pubul V, Ruibal Á, Silva-Rodríguez J, Aguiar P. A Systematic Review of PET Textural Analysis and Radiomics in Cancer. Diagnostics (Basel). 2021 Feb 23;11(2):380. PMID: 33672285; PMCID: PMC7926413. [CrossRef]
- Orlhac, F.; et al. Tumor texture analysis in ^18F-FDG PET: Relationships between texture parameters, histopathology, and survival. J. Nucl. Med. 2014, 55, 414–422.
Figure 1.
A. PET/CT fusion image, B. Segmentation (with pink color) of the lung lesion in the 18F-FDG PET/CT with LIFEx software.
Figure 1.
A. PET/CT fusion image, B. Segmentation (with pink color) of the lung lesion in the 18F-FDG PET/CT with LIFEx software.
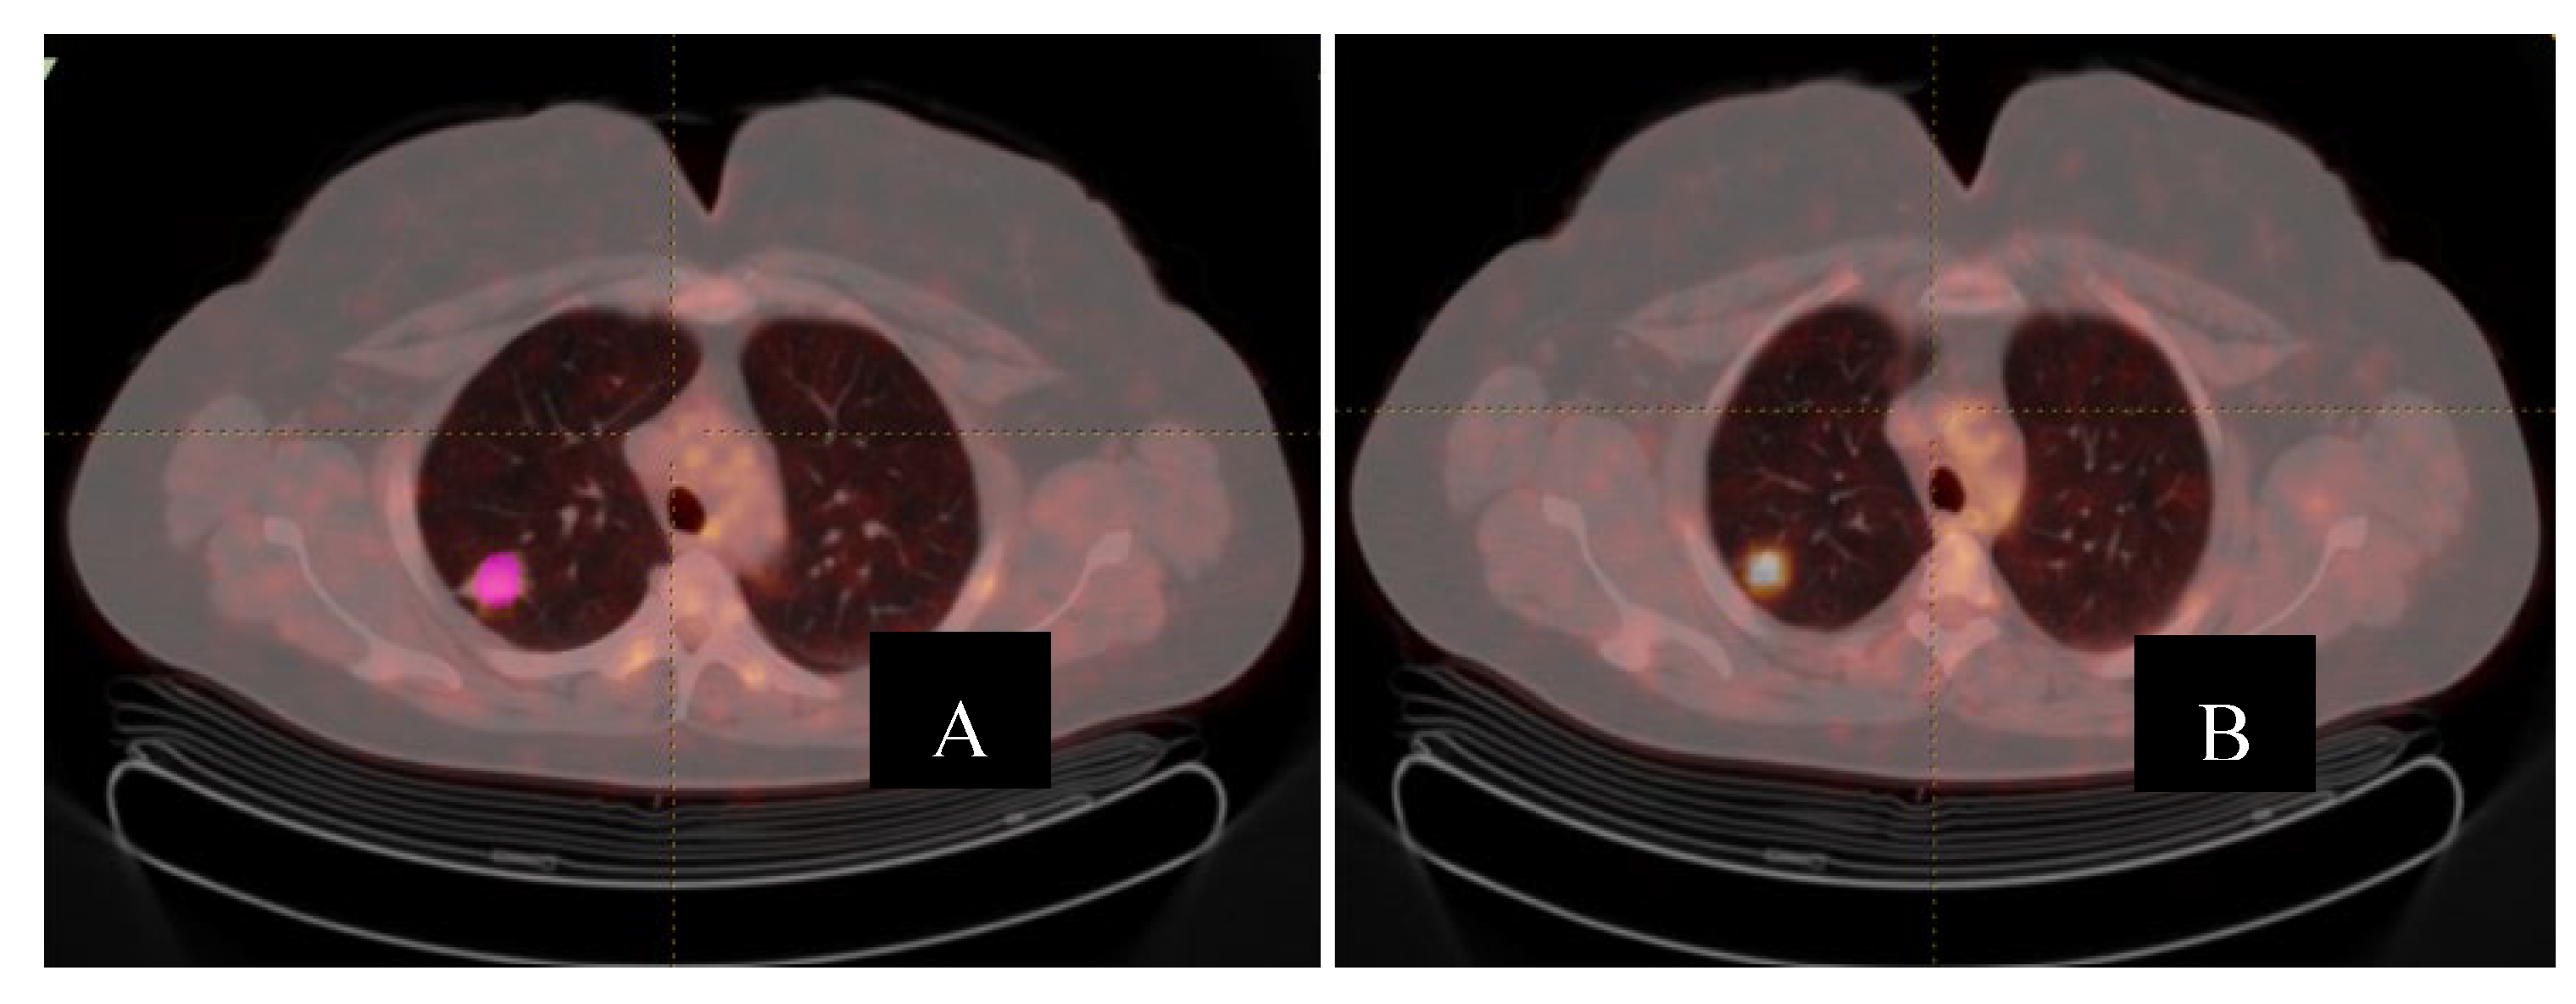

Table 1.
This is a table. Tables should be placed in the main text near to the first time they are cited.
Table 1.
This is a table. Tables should be placed in the main text near to the first time they are cited.
| Index | Matrix | Parameter |
| Conventional indices | SUVmin, SUVmean, SUVmax, SUVpeak, SUVStd | |
| Volumetric indices Radiomic Texture features |
MTV, TLG | |
| GLCM | Homogeneity, Energy, Contrast, Correlation, Entropy, Dissimilarity | |
| NGLDM | Coarseness, Contrast, Busyness | |
| GLRLM | SRE, LRE, LGRE, HGRE, SRLGE, SRHGE, LRLGE, LRHGE, GLNU, RLNU, RP | |
| GLZLM | SZE, LZE, LGZE, HGZE, SZLGE, SZHGE, LZLGE, LZHGE, GLNU, ZLNU, ZP | |
| Shape features | Sphericity, Surface, Compacity |
1 SUV, standard uptake value; TLG, total lesion glycolysis; MTV, metabolic tumor volume,; GLCM, gray-level co-occurrence matrix; NGLDM, neighborhood gray-level diference matrix; GLRLM, gray-level run-length matrix; GLZLM, gray-level zone-length matrix; SRE, short-run emphasis; LRE, long-run emphasis; LGRE, low gray-level run emphasis; HGRE, high gray-level run emphasis, SRLGE, short-run low gray-level emphasis; SRGHE, short-run high gray-level emphasis; LRLGE, long-run row gray-level emphasis; LRHGE, long-run high gray-level emphasis; GLNU, gray-level non-uniformity; RLNU, run-length non-uniformity; RP, run percentage; SZE, short-zone emphasis; LZE, long-zone emphasis; LGZE, low gray-level zone emphasis; HGZE, high gray-level zone emphasis; SZLGE, short-zone low gray-level emphasis; SZHGE, short-zone high gray-level emphasis; LZLGE, long-zone low gray-level emphasis; LZHGE, long-zone high gray-level emphasis; ZLNU, zone-length non-uniformity; ZP, zone percentage.
Disclaimer/Publisher’s Note: The statements, opinions and data contained in all publications are solely those of the individual author(s) and contributor(s) and not of MDPI and/or the editor(s). MDPI and/or the editor(s) disclaim responsibility for any injury to people or property resulting from any ideas, methods, instructions or products referred to in the content. |
© 2026 by the authors. Licensee MDPI, Basel, Switzerland. This article is an open access article distributed under the terms and conditions of the Creative Commons Attribution (CC BY) license (http://creativecommons.org/licenses/by/4.0/).
Copyright: This open access article is published under a Creative Commons CC BY 4.0 license, which permit the free download, distribution, and reuse, provided that the author and preprint are cited in any reuse.


