
Submitted:
30 October 2025
Posted:
31 October 2025
You are already at the latest version
Abstract
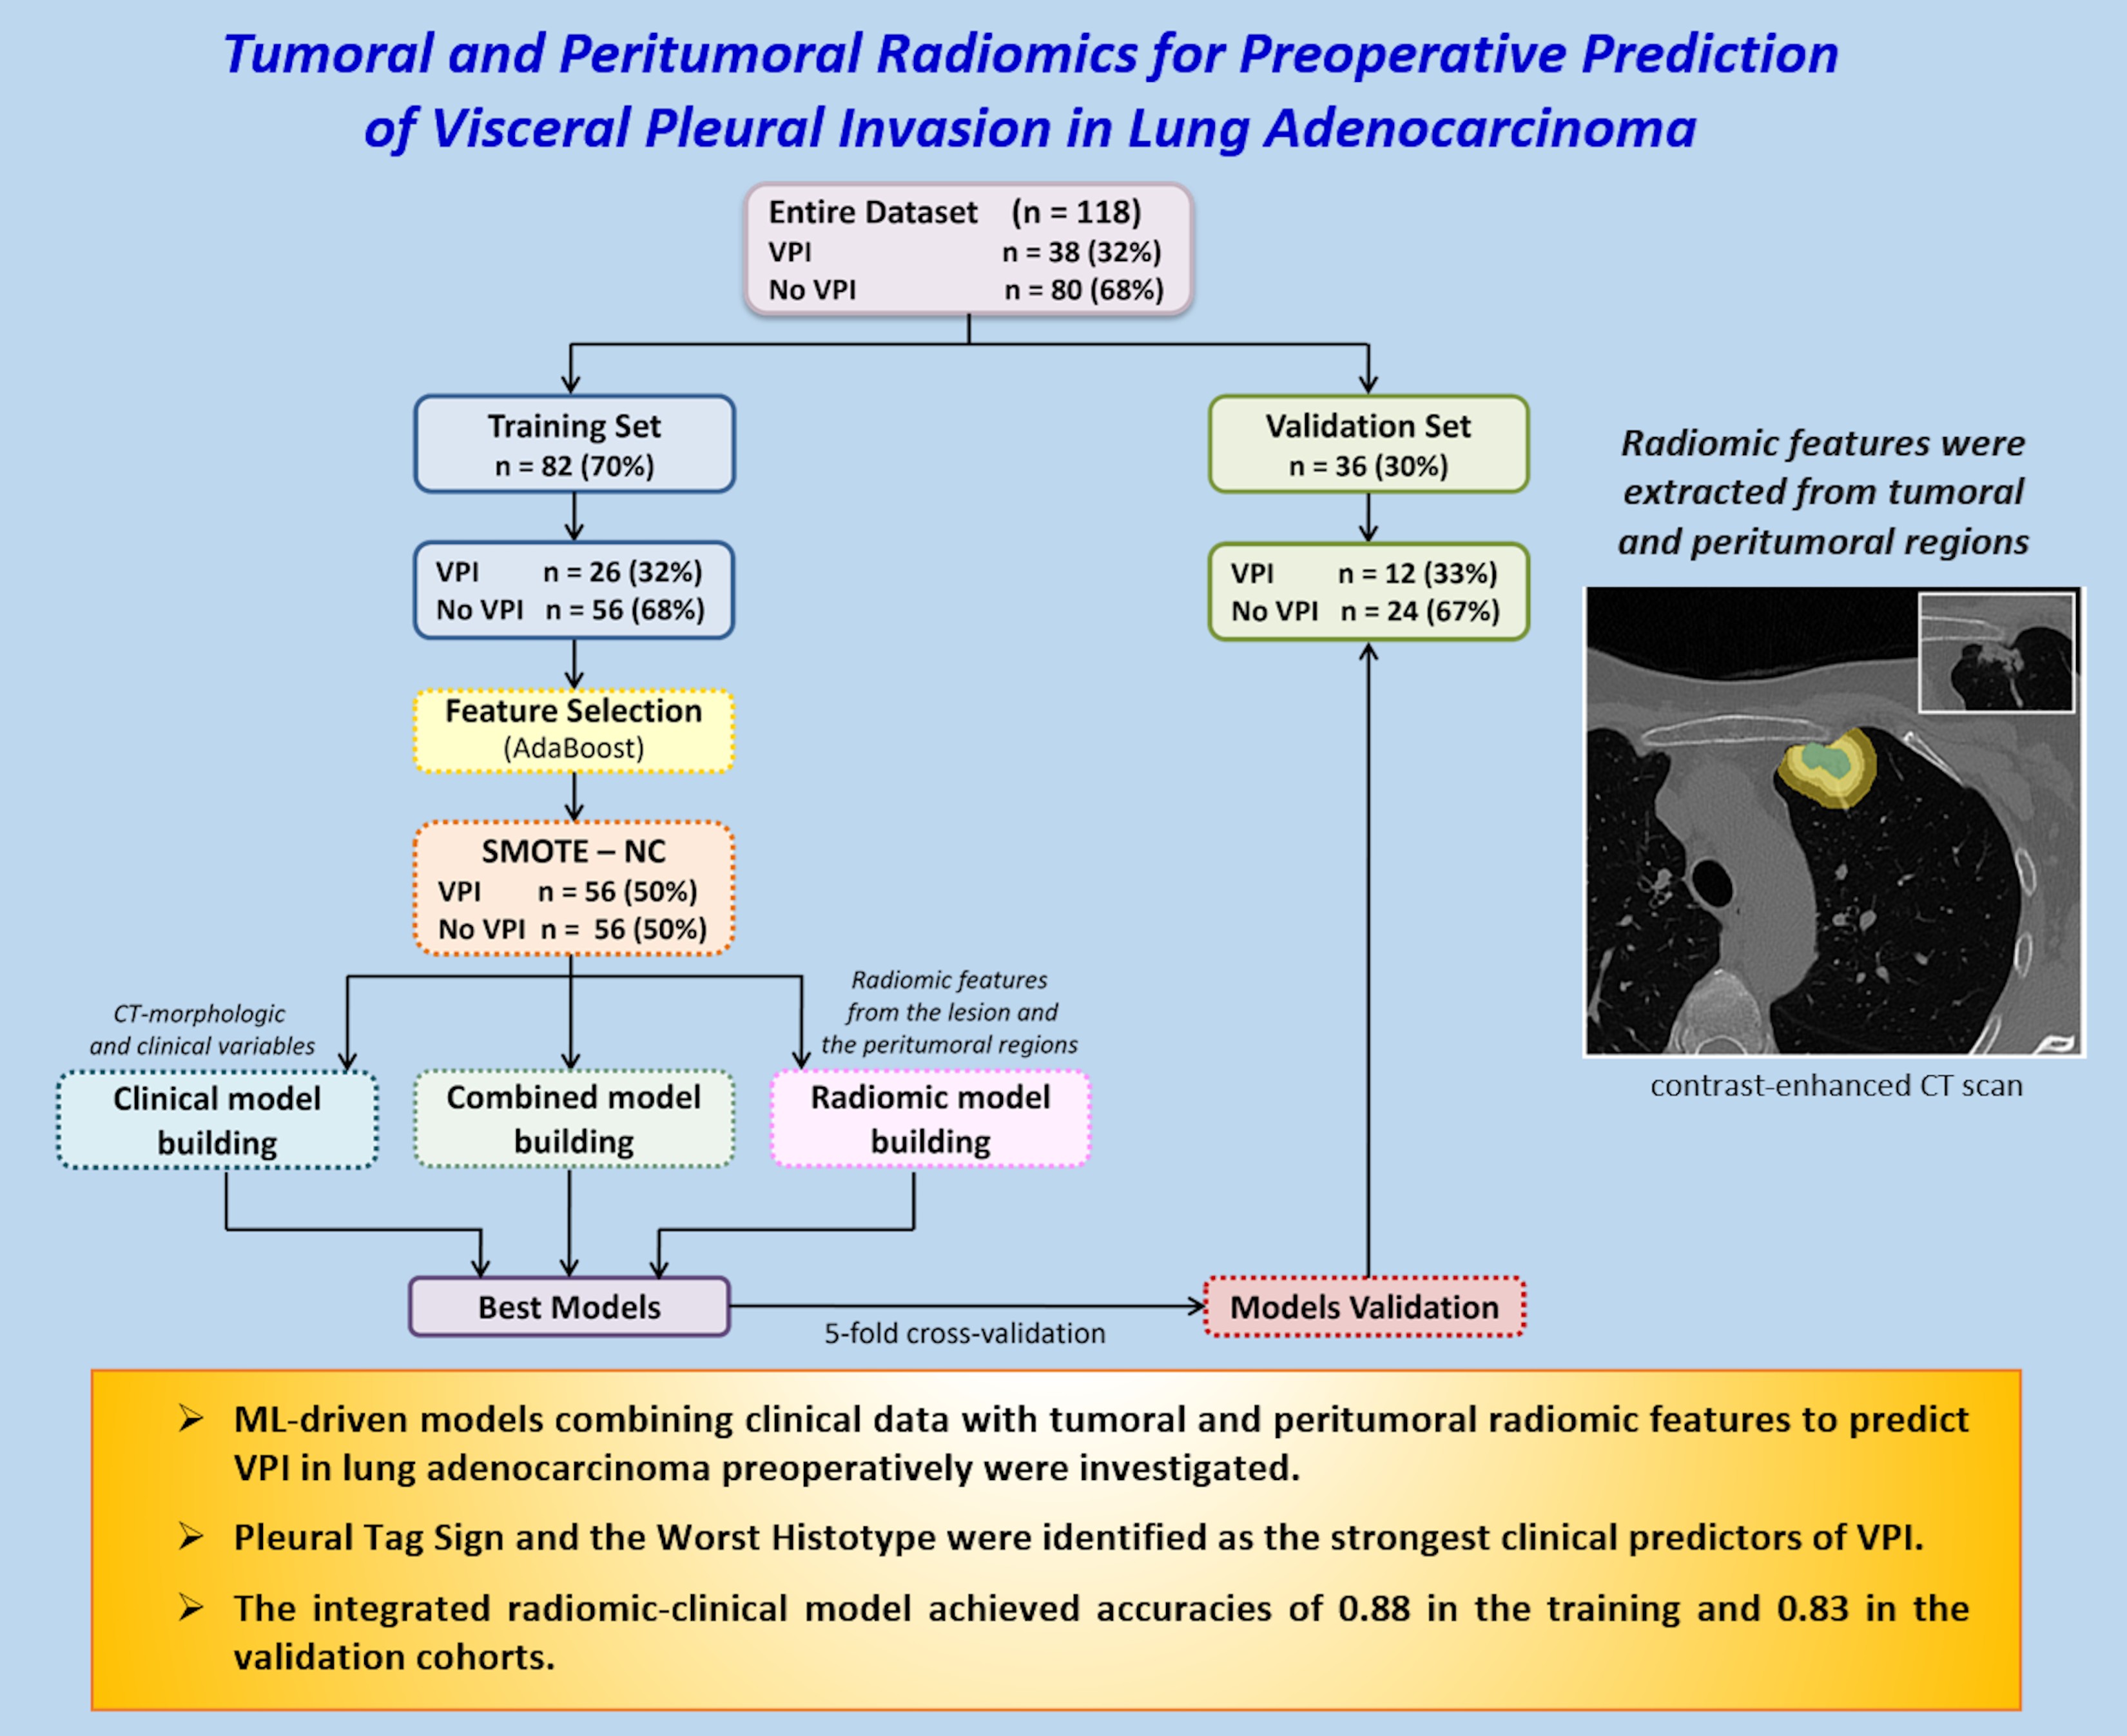
Background: The presence of visceral pleural invasion (VPI) is associated with increased risk of recurrence and reduced overall survival following surgical resection. We aimed to develop machine learning (ML)-based classification models that integrate clinical varia-bles and both tumoral and peritumoral radiomic features to predict VPI in patients with lung adenocarcinoma before surgery. Methods: We retrospectively enrolled 118 patients, including 80 (68%) without VPI and 38 (32%) with histologically confirmed VPI. All pa-tients underwent preoperative contrast-enhanced CT scans. Tumor volumes were manu-ally segmented, and isotropic expansions of 3, 5, and 10 mm were automatically generat-ed to define peritumoral regions. The dataset was randomly split into training (70%) and validation (30%) cohorts. Radiomic features and clinical data were used to train multiple ML algorithms. Results: Pleural Tag Sign and the Worst Histotype were identified as the strongest clinical predictors of VPI. The combined model, integrating radiomics from the lesion and clinical variables, achieved the highest training accuracy of 0.88 (95% CI: 0.80–0.92) and validation accuracy of 0.83 (95% CI: 0.68–0.92). Conclusion: VPI is associated with detectable alterations in both tumoral and peritumoral microenvironment on con-trast-enhanced CT. Incorporating radiomic features with clinical data enabled improved model performance compared to clinical-only models, yielding very good accuracies. This approach may support surgical planning and patient risk stratification. Further prospec-tive studies are needed to validate these findings and assess their clinical impact.
Keywords:
lung adenocarcinoma
; visceral pleural invasion
; computed tomography
; radiomics
; prediction
1. Introduction
Lung cancer remains one of the most prevalent and lethal malignancies worldwide, contributing to cancer-related morbidity and mortality, with non-small cell lung cancer (NSCLC) accounting for 80–85% of cases. Within NSCLC, lung adenocarcinoma (LA) is the predominant histological subtype, particularly among non-smokers and individuals with peripheral lung lesions [1,2]. Visceral pleural invasion (VPI), defined as tumor extension beyond the elastic layer of the visceral pleura, is an important prognostic factor, particularly in early-stage lung adenocarcinoma. Its presence is associated with a higher risk of recurrence and reduced overall survival after surgical resection, and it leads to upstaging from T1a–c to T2a, thereby advancing the overall stage from Ia to Ib according to the 8th edition of the American Joint Committee on Cancer (AJCC) TNM staging system [3]. Thus, the identification of VPI status before surgery plays a pivotal role in thoracic surgical decision-making, influencing the extent of resection, preferring a lobectomy instead of sublobectomy [4], and the consideration of systemic treatment escalation.
Several studies have already investigated the role of computed tomography (CT) to predict the presence of VPI [5,6,7,8,9]. For instance, tumors presenting as ground-glass nodules or lacking pleural contact are associated with a low likelihood of VPI [7,10]. In contrast, CT findings such as direct tumor–pleural contact, pleural indentation, and pleural tags are recognized as high-risk indicators of VPI [5,6,11]. However, despite these associations, the predictive accuracy of VPI based solely on morphological CT signs remains limited.
Recent advances in radiomics have enabled the extraction of high-dimensional quantitative features from medical images, offering a more nuanced characterization of tumour phenotype and microenvironment. Recent studies [7,8,9,12,13,14] have shown that incorporating radiomic features – particularly those derived from both intratumoral and peritumoral regions – can improve the accuracy of predictive models for assessing pathological invasiveness in lung cancer. Nonetheless, most existing radiomics-based models for VPI prediction have primarily focused on intratumoral features or on combined intratumoral and peritumoral regions, while less attention has been devoted to the peritumoral region alone. This area, however, may contain valuable diagnostic information, allowing the detection of early alterations at the tumor–pleura interface that are not otherwise appreciable on conventional CT imaging.
In the present study, we aim to develop and validate machine learning (ML)-based classification models that integrate clinical variables with tumoral and peritumoral radiomic features to predict VPI in patients with lung adenocarcinoma preoperatively.
2. Materials and Methods
2.1. Patient Population
This single-center retrospective study included patients with clinical node-negative early-stage NSCLC treated at Regina Elena National Cancer Institute, who underwent radical resection between January 2021 and December 2023 with available preoperative CT scans. The study was approved by the institutional ethics committee (RS1832/23), and informed consent was waived due to the retrospective nature of the study.
The preoperative workup consisted of brain, chest, and upper abdominal computed tomography (CT) scans, along with F18-fluorodeoxyglucose positron emission tomography (FDG-PET), to rule out the presence of multiple pulmonary nodules, as well as hepatic, adrenal, or cerebral metastases, and to assess hilar and mediastinal lymph node involvement. When indicated, nodal disease was further evaluated by endoscopic or endobronchial ultrasound-guided fine-needle aspiration, performed according to current guidelines. Following surgical resection, all formalin-fixed paraffin-embedded (FFPE) specimens were examined by dedicated pathologists for confirmation of the diagnosis and evaluation of tumor cellularity. The predominant invasive histologic subtype of lung adenocarcinoma was categorized as acinar, cribriform, papillary, micropapillary, solid, clear-cell, lepidic, mixed, mucinous, pleomorphic, or undifferentiated. The evaluation of VPI was performed on hematoxylin–eosin (H&E) stained slides and, when necessary, with elastic fiber staining (e.g., elastic Van Gieson) to identify tumor extension beyond the elastic layer of the visceral pleura. VPI was classified according to the current IASLC/WHO recommendations: PL0, tumor within the lung parenchyma or pleura but not beyond the elastic layer; PL1, invasion beyond the elastic layer; PL2, invasion to the pleural surface; and PL3, invasion of the parietal pleura, chest wall, or other adjacent structures. For this study, PL1 and PL2 were considered positive for visceral pleural invasion (VPI+), whereas PL0 was considered negative (VPI−). Cases with PL3 involvement were excluded. We included patients with clinical stage I–III NSCLC who had undergone complete preoperative staging according to current guidelines, received radical surgical treatment following IASLC recommendations, and had available preoperative contrast-enhanced CT scans. Patients were excluded if they had clinical stage IV disease, clinical N2 involvement, or had received preoperative chemotherapy or radiotherapy.
2.2. Imaging Protocol
CT acquisition was performed using multidetector-row CT scanners from three different manufacturers (Incisive CT, Philips Medical Systems, Best, The Netherlands; iCT SP, Philips Medical Systems, Best, The Netherlands; Optima CT660, GE Medical Systems, Waukesha, WI, USA). All examinations were conducted with patients in the supine position during full inspiration, covering the entire thoracic region. The CT acquisition parameters were as follows: tube voltage, 120 kV; tube current, 120–250 mA; reconstruction slice thickness, 0.75 mm or 1.25 mm; matrix size, 512 × 512; and field of view, 500 mm.
All images were subsequently reviewed using lung window settings (window width: 1500 HU; window level: −650 HU). Pulmonary nodules were categorized as solid nodules (including part-solid nodules with a solid component exceeding 80%), sub-solid nodules (ground-glass nodules that contain one or more solid components less than 80%), or ground-glass nodules (circumscribed areas of increased lung attenuation with preservation of bronchial and vascular margins without solid parts in the context). Furthermore, nodules were classified based on their relationship to the pleura into two categories: (a) pleural-attached nodules, defined as those directly abutting the pleural surface or connected to it via at least one linear pleural tag; and (b) non-pleural-attached nodules, with no contact with the pleura on any CT slice. Additionally, nodules were assessed for the presence or absence of spiculation.
The mean interval between the diagnostic CT study and surgery was 30.6 ± 19.9 days.
2.3. Delineation of Volumes of Interest
For each patient, four distinct volumes of interest (VOIs) were analyzed: the lung lesion and its peritumoral regions obtained by expanding the lesion margins by 3 mm, 5 mm, and 10 mm. The lesion was manually segmented slice by slice by an expert radiologist using semi-automatic tools in the 3D Slicer software [15].
To generate the peritumoral regions, the entire lung volume was first automatically segmented using the Lung CT Segmenter extension in 3D Slicer software. Peritumoral VOIs were then generated using a custom MATLAB script (Release R2021b, MathWorks Inc., Natick, MA, USA). First, an isotropic kernel was applied to each manually segmented lesion to create isotropic expansions of 3 mm, 5 mm, and 10 mm around the tumor. Then, to ensure that the expanded volumes remained confined to the lung parenchyma, each expansion was intersected with the previously segmented lung mask. Finally, the lesion volume was subtracted from each expanded VOI to isolate only the peritumoral tissue.
An example of a segmented lesion and the corresponding peritumoral regions is shown in Figure 1.
2.4. Feature Extraction
Radiomic features were extracted from each VOI (i.e., the entire lesion and its peritumoral regions at 3 mm, 5 mm, and 10 mm) using the open-source LIFEx software (version 7.7.0) [16], in compliance with the Image Biomarker Standardization Initiative (IBSI) guidelines [17].
Prior to feature extraction, each volume was resampled to an isotropic voxel size of 1 mm and discretized using a fixed bin width of 25. A total of 119 radiomic features were extracted for each structure, spanning the following categories: morphological, first-order statistics (intensity-based and intensity histogram), Grey-Level Co-occurrence Matrix (GLCM), Grey-Level Run Length Matrix (GLRLM), Neighborhood Grey Tone Difference Matrix (NGTDM), and Grey-Level Size Zone Matrix (GLSZM) [17]. A comprehensive list of the extracted features is available in the Supplementary Table S1.
To reduce scanner-related variability across the four acquisition systems, radiomic features were harmonized using the ComBat algorithm [18], implemented through the neuroCombat package (version 1.0.14) in RStudio software (version 2024.12.0; Posit Software, PBC, Boston, MA).
2.5. ML Modelling
We developed various predictive models: a clinical model based on clinical variables and CT-based morphological features, i.e., manually assessed morphological features reported by radiologists in the CT reports (such as the Pleural Tag Sign or tumor size); four radiomic models, each using features extracted from a specific VOI, i.e., the entire lesion, and its peritumoral regions expanded by 3 mm, 5 mm, and 10 mm; and four combined models, each merging the most relevant clinical features with radiomic features from one of the respective VOIs, to evaluate the added value of integrating radiomic and clinical data.
Prior to modelling, all numerical features underwent a standardized preprocessing pipeline including outlier removal, Z-score normalization, and replacement of missing values with the median. Features highly correlated with lesion volume (Spearman’s Rho ≥ 0.8) were normalized to lesion volume to mitigate size-dependent biases.
To identify the most informative variables, an ML-based feature selection process was conducted using the Adaptive Boosting (AdaBoost) classification algorithm. Features were ranked according to their importance scores, and to limit overfitting due to the small sample size, only the top 10 features were retained. Among these, the optimal subset of three predictors was selected to build the final classification models.
The dataset was randomly split into a training cohort (70%) and a validation cohort (30%), ensuring balanced class distribution through stratified splitting.
To address class imbalance, synthetic minority class samples were generated using the Synthetic Minority Over-sampling Technique (SMOTE) [19], implemented via the RSBID package in RStudio software (version 2024.12.0). The study analysis pipeline is shown in Figure 2.
A comparative evaluation of several classification algorithms was performed, including Decision Trees, Discriminant Analysis, Logistic Regression, Naive Bayes, Support Vector Machines, K-Nearest Neighbours, and Ensemble Classifiers. Hyperparameter tuning and a stratified five-fold cross-validation were applied to optimize model performance and reduce overfitting. Model performance was assessed in terms of accuracy, sensitivity, specificity, and area under the receiver operating characteristic curve (AUC). AUC values were estimated with 95% confidence intervals by bootstrapping (1000 replicates). Pairwise comparisons of predictive accuracy were performed using the mid-p McNemar test. All analyses and model development were carried out using the Statistics and Machine Learning Toolbox in MATLAB (Release R2021b).
2.6. Model Performance Evaluation According to the Tumor Size
To assess the discriminative performance of the predictive models across different tumor dimensions, patients were stratified into three subgroups based on the tumor's major axis: (1) ≤ 3 cm, (2) > 3 cm and ≤ 5 cm, and (3) > 5 cm. Model predictions were compared against the reference VPI status to generate confusion matrices and calculate performance metrics – namely, accuracy, sensitivity, and specificity – within each subgroup, for each of the proposed models.
2.7. Statistics
To assess the individual association of each feature with the clinical outcome, univariate statistical tests were applied. Continuous variables – including both radiomic features and continuous clinical variables – were analyzed using the Mann–Whitney U test, while categorical variables were assessed using the Chi-square test.
To minimize feature redundancy, pairwise associations among the selected variables were evaluated using the Spearman correlation coefficient for continuous variables, the Chi-square test for categorical variables, and the Kruskal–Wallis test for comparisons involving mixed data types. In cases of strong correlation between two features (Spearman’s Rho > 0.80), the variable showing the strongest univariate association with the clinical outcome was retained.
A p-value less than 0.05 was considered statistically significant. All statistical analyses were performed in MATLAB (Release R2021b).
3. Results
The study cohort consisted of 118 patients, including 80 (68%) without VPI and 38 (32%) with histologically confirmed VPI. The dataset was randomly split into a training cohort (n = 82) and a validation cohort (n = 36) using a stratified procedure to preserve class proportions. Table 1 reports the clinical characteristics of the overall population and each subset. No statistically significant differences were observed between the training and validation sets for any of the variables considered.
3.1. Performance of ML Models
A comprehensive summary of the models, the selected features, and their performance metrics is provided in the Supplementary Table S2. Among all the models developed, the highest predictive performance was observed in three cases: the radiomic model based on features from the lesion, the radiomic model based on the 10 mm-peritumoral region, and the combined model integrating radiomic features from the lesion volume with clinical variables.
For the radiomic model based on the lesion, the top three predictors were Integrated Intensity, Grey-Level Non-Uniformity from the GLSZM, and Root Mean Square (RMS) Intensity. For the 10 mm-peritumoral model, the most relevant features were Flatness, Intensity Skewness, and Run Variance from the GLRLM. The clinical model identified the Pleural Tag Sign and the Worst Histotype as the strongest predictors of VPI. In the combined model based on the clinical features and the radiomic predictors extracted from the lesion volume, RMS Intensity, Worst Histotype, and Pleural Tag Sign emerged as the most important variables.
Descriptive statistics for these predictors, stratified by VPI status, are reported in Table 2.
Notably, although not retained in the final models, the lesion major axis length showed a significant univariate association with VPI (p < 0.001), while density exhibited a trend toward significance (p = 0.055), consistent with their recognized role in pleural invasiveness. Figure 3 shows the distribution of the top three predictors from the combined model.
Table 3 summarizes the performance of the best-performing prediction models in the training and validation sets.
The clinical model achieved an accuracy of 0.81 (95% CI: 0.73–0.87) in the training set and 0.81 (95% CI: 0.65–0.90) in the validation set. The radiomic model based on the lesion reached an accuracy of 0.80 (95% CI: 0.79–0.82) in training and 0.81 (95% CI: 0.75–0.83) in validation cohorts. The 10 mm-peritumoral radiomic model achieved an accuracy of 0.83 (95% CI: 0.75–0.89) in training and 0.81 (95% CI: 0.65–0.90) in validation. The combined model – integrating the radiomic features from the lesion with clinical data – yielded the highest AUC, with an accuracy of 0.88 (95% CI: 0.80–0.92) and 0.83 (95% CI: 0.68–0.92) in the training and validation sets, respectively.
Pairwise McNemar’s tests revealed comparable performance among the proposed models in both the training and validation sets, with the only significant difference observed in the training set between the clinical and combined models (p = 0.008; Supplementary Table S3).
A graphical overview comparing the performance of the four best-performing models is provided in Figure 4.
3.2. Model Performance by Tumor Size
In the training set, 57 out of 82 patients (70%) had a tumor size ≤ 3 cm, 19 patients (23%) had tumors between 3 and 5 cm, and six patients (7%) had tumors > 5 cm. In the validation set, 24 out of 36 patients (67%) had tumors ≤ 3 cm, nine patients (25%) between 3 and 5 cm, and three patients (8%) > 5 cm. The classification performance of the proposed models within each tumor size subgroup is summarized in Supplementary Figures S1–S5.
In the training set, the accuracy of the models ranged from 68% to 82% for tumors ≤ 3 cm and from 53% to 89% for tumors between 3 and 5 cm, depending on the model. For tumors > 5 cm, all models achieved 100% accuracy. Similarly, in the validation set, the accuracy of the models ranged from 75% to 83% for tumors ≤ 3 cm and from 67% to 89% for those between 3 and 5 cm; again, all models achieved 100% accuracy for tumors > 5 cm. Remarkably, in the validation set, the sensitivity of most models decreased in the subgroup with tumors ≤ 3 cm compared to the 3–5 cm group, except for the radiomic model derived from the 3 mm peritumoral region and the combined model based on the lesion.
Two representative NSCLCS cases with tumor major axis < 3 cm are illustrated in Figure 5. In the first case (a-b), the presence of pleural tag suggested a radiological suspicion of pleural invasion, but it was not confirmed by histological examination. In the second case (c-d), no radiological suspicion of pleural invasion was raised due to the absence of pleural tag, but histological examination revealed pleural invasion. All models failed to correctly predict the presence of pleural invasion, except for the 3 mm-peritumoral radiomic model.
4. Discussion
In the present study, we developed ML-based classification models that integrated clinical variables with radiomic features extracted from intratumoral lesion volume and peritumoral rims of different sizes to predict VPI in patients with lung adenocarcinoma preoperatively. Several studies have already demonstrated promising results with predictive models combining clinical variables with radiomic features [7,8,9,11,20]. Accordingly, we observed a statistically significant improvement of the combined model over the clinical model in the training set, corroborated by pairwise testing.
Beyond radiomics, previous studies have highlighted the predictive value of clinico-radiological signs for VPI prediction. For instance, Zha et al. [11] and Huang et al. [20] showed that incorporating variables such as pleural tag or pleural indentation markedly improves model performance. The pleural tag – defined as pleural traction with connecting strands – has consistently emerged as an independent predictor [11,20,21], emphasizing the relevance of tumor–pleura interactions even in conventional imaging. In our clinical model, Pleural Tag Sign and Worst Histotype were identified as significant predictors of VPI. Pleural Tag Signs were more frequently observed in patients with VPI, reflecting pleural retraction or tethering caused by tumor–pleura interaction. Furthermore, patients with VPI exhibited a lower prevalence of the acinar pattern and a higher prevalence of the solid pattern as the worst histotype, in line with the recognized association between solid morphology and more aggressive biological behavior.
Our results also support previous observations that larger tumors are associated with higher VPI risk [5,6,7,8,12,13,20]. In our cohort, the major axis length was significantly greater in VPI-positive patients; however, it was not retained in the final models, likely because pleural tag sign and histotype captured more specific, non-overlapping information among the most relevant predictors. Density also showed a trend toward significance in predicting VPI, consistent with prior reports [7,12,13,20], but was excluded due to its high correlation with histotype, which had a stronger association with VPI and effectively incorporated its predictive contribution.
Compared with purely clinical studies [6,21], which relied solely on semantic signs, radiomics-based models demonstrated an advantage in terms of accuracy. Our findings, in conjunction with evidence from the literature, underscore the added value of radiomics, which can capture imaging-derived markers of heterogeneity beyond conventional predictors. In our study, VPI-positive lesions exhibited higher intratumoral Integrated Intensity, reflecting greater tumor size and density, as well as higher Grey-Level Non-Uniformity, indicating increased heterogeneity likely related to variations in cellularity, necrosis, or stromal composition. RMS Intensity was lower in VPI cases, suggesting a predominance of low-intensity voxels or fewer high-intensity voxels and a more irregular internal architecture. When considering the 10 mm-peritumoral rim, VPI-positive patients showed lower Flatness, consistent with more irregular peritumoral geometry; lower positive Skewness, reflecting fewer localized areas of low intensity with an increased proportion of intermediate-to-high intensity voxels, indicating a more homogeneous distribution of intensity values, possibly due to stromal remodeling; and lower Run Variance, suggesting reduced textural variability and a less complex peritumoral microenvironment.
We want to emphasize that, instead of combining intratumoral and peritumoral features, we analyzed peritumoral regions after excluding the tumor itself, thereby isolating the specific contribution of the surrounding tissue and providing a more rigorous assessment of the value of peritumoral tissue. In this context, peritumoral features may be interpreted as quantitative surrogates of tumor and pleural microenvironment alterations, preceding the histological confirmation of VPI.
The relevance of peritumoral environment analysis has been highlighted for different purposes in NSCLC. For example, Chang et al. [22] and Vaidya et al. [23] investigated peritumoral radiomics to evaluate chemotherapy response, remarking that the peritumoral microenvironment may provide complementary prognostic information beyond intratumoral descriptors. Very recent studies have examined its role in VPI prediction. Among them, Zuo et al. [13] and Wang et al. [12] demonstrated that the inclusion of features extracted from the peritumoral margin provides complementary information, resulting in an increase in AUC compared to intratumoral models alone. Our results confirm the added predictive value of peritumoral tissue, with the 10 mm-peritumoral model achieving overall performance comparable to, and even higher in accuracy and sensitivity than, those reported by Zuo et al. [13] and Wang et al. [12].
Moreover, considering the critical role of lesion size in VPI, we assessed the discriminative performance of the predictive models across different tumor dimensions. Most models showed a reduction in sensitivity in the subgroup with tumors ≤ 3 cm, compared to the 3–5 cm group. This finding is consistent with the observations of Ahn et al. [5], who reported that VPI in small nodules occurs almost exclusively in those with a predominant solid component. Similarly, Sun et al. [21] identified the so-called jellyfish sign as a highly predictive CT feature in solid tumors ≤3 cm, confirming that in small nodules, morphological patterns such as the pleural tag – as conventional signs – are subtler or absent, and prediction becomes more challenging. In this scenario, our peritumoral models, particularly those derived from a 3 mm-peritumoral region, appeared to partially mitigate this limitation, maintaining a good sensitivity in nodules ≤3 cm compared to intratumoral models alone. This may have important clinical implications, as patients with small NSCLC are precisely those for whom the appropriateness of sublobar resections remains debated. The presence of an adverse prognostic factor such as VPI could therefore justify opting for lobectomy. Recent evidence suggests that VPI is an independent negative prognostic factor, even in tumors measuring ≤ 2–3 cm, affecting both recurrence and overall survival [24,25]. In this context, it is reasonable to expect that the future of personalized surgical decision-making in early-stage NSCLC will increasingly rely on an integrated approach combining clinical variables, radiomic features, and genomic information, consistent with recent studies highlighting the prognostic and predictive impact of molecular alterations in this setting.
Our study presents some limitations, primarily related to its monocentric and retrospective nature, as well as its limited sample size, which may limit generalizability and underscore the need for larger, multi-center validation studies. Tumor segmentation, although carefully performed and reviewed, remains subject to inter-observer variability. We mitigated this issue with an automated pipeline to create peritumoral region delineation; however, further automation of the lesion delineation process would be desirable.
5. Conclusions
In summary, our findings support the hypothesis that VPI is associated with detectable alterations in both tumoral and peritumoral microenvironment on contrast-enhanced CT. Incorporating radiomic features with clinical data enabled improved model performance compared to clinical-only models, yielding very good accuracies in both the training and validation cohorts. These results may support surgical planning and patient risk stratification, even though further prospective studies are needed to validate these findings in external patient cohorts and assess their clinical impact.
Supplementary Materials
The following supporting information can be downloaded at the website of this paper posted on Preprints.org, Figure S1: Bar plots illustrating the performance of the clinical model for predicting visceral pleural invasion across the three subgroups according to the lesion size; Figure S2: Bar plots illustrating the performance of the radiomic and combined models derived from the intratumoral volume for predicting visceral pleural invasion across the three subgroups based on the lesion size; Figure S3: Bar plots illustrating the performance of the radiomic and combined models derived from the 3 mm-peritumoral volume for predicting visceral pleural invasion across the three subgroups based on the lesion size; Figure S4: Bar plots illustrating the performance of the radiomic and combined models derived from the 5 mm-peritumoral volume for predicting visceral pleural invasion across the three subgroups based on the lesion size; Figure S5: Bar plots illustrating the performance of the radiomic and combined models derived from the 10 mm-peritumoral volume for predicting visceral pleural invasion across the three subgroups based on the lesion size; Table S1: List of radiomic features included in the study; Table S2: Performance metrics of all the proposed models; Table S3: Comparison of model performances in the training and validation sets.
Author Contributions
Conceptualization, F.T.G.; methodology, F.L. and S.M.; formal analysis, F.L.; investigation, S.L., F.L., R.T., P.V. and S.M.; resources, A.V. and E.M.; data curation, F.T.G., S.L., F.L., S.R., D.V., R.T., E.M. and P.V.; writing—original draft preparation, S.L., F.L., S.R., D.V. and S.M.; writing—review and editing, F.T.G., S.L. and A.V.; supervision, S.M.; project administration, A.V.; funding acquisition, A.V. F.T.G. and S.L. equally contributed to this work. All authors have read and agreed to the published version of the manuscript.
Funding
This work was supported by POS RADIOAMICA project funded by the Italian Minister of Health (H53C22000650006).
Institutional Review Board Statement
The study was conducted in accordance with the Declaration of Helsinki and approved by the Institutional Ethics Committee of Regina Elena National Cancer Institute on 21 February 2023 (RS1832/23).
Informed Consent Statement
Informed patient consent was waived due to the retrospective nature of the study.
Data Availability Statement
All relevant data supporting the findings of this study are included in the article and its Supplementary Materials. Additional details are available from the corresponding author upon request.
Conflicts of Interest
The authors declare no conflicts of interest.
Abbreviations
The following abbreviations are used in this manuscript:
| VPI | Visceral Pleural Invasion |
| NSCLC | Non-Small Cell lung cancer |
| ML | Machine Learning |
| CT | Computed Tomography |
| LA | Lung Adenocarcinoma |
| AJCC | American Joint Committee on Cancer |
| FDG-PET | F18-FluoroDeoxyGlucose Positron Emission Tomography |
| FFPE | Formalin-Fixed Paraffin-Embedded |
| H&E | Hematoxylin–Eosin |
| IASLC | International Association for the Study of Lung Cancer |
| WHO | World Health Organization |
| VOIs | Volumes of Interest |
| IBSI | Image Biomarker Standardization Initiative |
| GLCM | Grey-Level Co-occurrence Matrix |
| GLRLM | Grey-Level Run Length Matrix |
| NGTDM | Neighborhood Grey Tone Difference Matrix |
| GLSZM | Grey-Level Size Zone Matrix |
| AdaBoost | Adaptive Boosting |
| SMOTE-NC | Synthetic Minority Over-sampling Technique for Nominal and Continuous variables |
| AUC | Area Under the Curve |
| RMS | Root Mean Square |
| CI | Confidence Interval |
| PPV | Positive Predictive Value |
| NPV | Negative Predictive Value |
References
- Ahn, S.Y.; Park, C.M.; Jeon, Y.K.; Kim, H.; Lee, J.H.; Hwang, E.J.; Goo, J.M. Predictive CT Features of Visceral Pleural Invasion by T1-Sized Peripheral Pulmonary Adenocarcinomas Manifesting as Subsolid Nodules. American Journal of Roentgenology 2017, 209, 561–566. [Google Scholar] [CrossRef]
- Cai, X.; Wang, P.; Zhou, H.; Guo, H.; Yang, X.; Dai, Z.; Ma, H. CT-Based Radiomics Nomogram for Predicting Visceral Pleural Invasion in Peripheral T1-Sized Solid Lung Adenocarcinoma.
- Chang, R.; Qi, S.; Zuo, Y.; Yue, Y.; Zhang, X.; Guan, Y.; Qian, W. Predicting Chemotherapy Response in Non-Small-Cell Lung Cancer via Computed Tomography Radiomic Features: Peritumoral, Intratumoral, or Combined? Front. Oncol. 2022, 12, 915835. [Google Scholar] [CrossRef] [PubMed]
- Chawla, N.V.; Bowyer, K.W.; Hall, L.O.; Kegelmeyer, W.P. SMOTE: Synthetic Minority Over-Sampling Technique. jair 2002, 16, 321–357. [Google Scholar] [CrossRef]
- Chiang, X.-H.; Chen, C.-J.; Wei, C.-F.; Zheng, Y.-A.; Lin, C.-C.; Lin, M.-W.; Chiang, C.-J.; Lee, W.-C.; Chen, J.-S.; Chen, P.-C. Sublobar Resection Versus Lobectomy for Small (≤3 Cm) NSCLC with Visceral Pleural Invasion: A Propensity-Score-Matched Survival Analysis from a Nationwide Cohort. Cancers 2025, 17, 1990. [Google Scholar] [CrossRef] [PubMed]
- Dai, Z.-Y.; Shen, C.; Wang, X.; Wang, F.-Q.; Wang, Y. Could Less Be Enough: Sublobar Resection vs Lobectomy for Clinical Stage IA Non-Small Cell Lung Cancer Patients with Visceral Pleural Invasion or Spread through Air Spaces. International Journal of Surgery 2025, 111, 2675–2685. [Google Scholar] [CrossRef]
- Denisenko, T.V.; Budkevich, I.N.; Zhivotovsky, B. Cell Death-Based Treatment of Lung Adenocarcinoma. Cell Death Dis 2018, 9, 117. [Google Scholar] [CrossRef]
- Detterbeck, F.C.; Boffa, D.J.; Kim, A.W.; Tanoue, L.T. The Eighth Edition Lung Cancer Stage Classification. Chest 2017, 151, 193–203. [Google Scholar] [CrossRef]
- Fedorov, A.; Beichel, R.; Kalpathy-Cramer, J.; Finet, J.; Fillion-Robin, J.-C.; Pujol, S.; Bauer, C.; Jennings, D.; Fennessy, F.; Sonka, M.; et al. 3D Slicer as an Image Computing Platform for the Quantitative Imaging Network. Magnetic Resonance Imaging 2012, 30, 1323–1341. [Google Scholar] [CrossRef]
- Fortin, J.-P.; Parker, D.; Tunç, B.; Watanabe, T.; Elliott, M.A.; Ruparel, K.; Roalf, D.R.; Satterthwaite, T.D.; Gur, R.C.; Gur, R.E.; et al. Harmonization of Multi-Site Diffusion Tensor Imaging Data. NeuroImage 2017, 161, 149–170. [Google Scholar] [CrossRef]
- Huang, S.; Xu, F.; Zhu, W.; Xie, D.; Lou, K.; Huang, D.; Hu, H. Multi-Dimensional Radiomics Analysis to Predict Visceral Pleural Invasion in Lung Adenocarcinoma of ≤3 Cm Maximum Diameter. Clinical Radiology 2023, 78, e847–e855. [Google Scholar] [CrossRef]
- Iizuka, S.; Kawase, A.; Oiwa, H.; Ema, T.; Shiiya, N.; Funai, K. A Risk Scoring System for Predicting Visceral Pleural Invasion in Non-Small Lung Cancer Patients. Gen Thorac Cardiovasc Surg 2019, 67, 876–879. [Google Scholar] [CrossRef] [PubMed]
- Nioche, C.; Orlhac, F.; Boughdad, S.; Reuzé, S.; Goya-Outi, J.; Robert, C.; Pellot-Barakat, C.; Soussan, M.; Frouin, F.; Buvat, I. LIFEx: A Freeware for Radiomic Feature Calculation in Multimodality Imaging to Accelerate Advances in the Characterization of Tumor Heterogeneity. Cancer Research 2018, 78, 4786–4789. [Google Scholar] [CrossRef] [PubMed]
- Qi, M.; Bian, D.; Zhang, J.; Zhu, X.; Zhou, C.; Zhang, L. The Modification of T Description According to Visceral Pleural Invasion and Tumor Size from 3.1 Cm to 4.0 Cm in Non-Small Cell Lung Cancer: A Retrospective Analysis Based on the SEER Database. Lung Cancer 2021, 158, 47–54. [Google Scholar] [CrossRef] [PubMed]
- Siegel, R.L.; Miller, K.D.; Fuchs, H.E.; Jemal, A. Cancer Statistics, 2022. CA A Cancer J Clinicians 2022, 72, 7–33. [Google Scholar] [CrossRef]
- Sun, Q.; Li, P.; Zhang, J.; Yip, R.; Zhu, Y.; Yankelevitz, D.F.; Henschke, C.I. CT Predictors of Visceral Pleural Invasion in Patients with Non–Small Cell Lung Cancers 30 Mm or Smaller. Radiology 2024, 310. [Google Scholar] [CrossRef]
- Tian, D.; Pei, Y.; Zheng, Q.; Zhang, J.; Li, S.; Wang, X.; Lin, D.; Yang, Y. Effect of Visceral Pleural Invasion on the Prognosis of Patients with Lymph Node Negative Non-small Cell Lung Cancer. Thoracic Cancer 2017, 8, 97–105. [Google Scholar] [CrossRef]
- Vaidya, P.; Bera, K.; Gupta, A.; Wang, X.; Corredor, G.; Fu, P.; Beig, N.; Prasanna, P.; Patil, P.D.; Velu, P.D.; et al. CT Derived Radiomic Score for Predicting the Added Benefit of Adjuvant Chemotherapy Following Surgery in Stage I, II Resectable Non-Small Cell Lung Cancer: A Retrospective Multicohort Study for Outcome Prediction. The Lancet Digital Health 2020, 2, e116–e128. [Google Scholar] [CrossRef]
- Wang, F.; Pan, X.; Zhang, T.; Zhong, Y.; Wang, C.; Li, H.; Wang, J.; Guo, L.; Yuan, M. Predicting Visceral Pleural Invasion in Lung Adenocarcinoma Presenting as Part-solid Density Utilizing a Nomogram Model Combined with Radiomics and Clinical Features. Thoracic Cancer 2024, 15, 23–34. [Google Scholar] [CrossRef]
- Wang, Y.; Lyu, D.; Hu, S.; Ma, Y.; Duan, S.; Geng, Y.; Zhou, T.; Tu, W.; Xiao, Y.; Fan, L.; et al. Nomogram Using Intratumoral and Peritumoral Radiomics for the Preoperative Prediction of Visceral Pleural Invasion in Clinical Stage IA Lung Adenocarcinoma. J Cardiothorac Surg 2024, 19. [Google Scholar] [CrossRef]
- Wei, S.-H.; Zhang, J.-M.; Shi, B.; Gao, F.; Zhang, Z.-X.; Qian, L.-T. The Value of CT Radiomics Features to Predict Visceral Pleural Invasion in ≤3 Cm Peripheral Type Early Non-Small Cell Lung Cancer. XST 2022, 30, 1115–1126. [Google Scholar] [CrossRef]
- Yu, Y.; Huang, R.; Wang, P.; Wang, S.; Ling, X.; Zhang, P.; Yu, J.; Wang, J.; Xiao, J.; Wang, Z. Sublobectomy versus Lobectomy for Long-Term Survival Outcomes of Early-Stage Non-Small Cell Lung Cancer with a Tumor Size ≤2 Cm Accompanied by Visceral Pleural Invasion: A SEER Population-Based Study. J Thorac Dis 2020, 12, 592–604. [Google Scholar] [CrossRef] [PubMed]
- Zha, X.; Liu, Y.; Ping, X.; Bao, J.; Wu, Q.; Hu, S.; Hu, C. A Nomogram Combined Radiomics and Clinical Features as Imaging Biomarkers for Prediction of Visceral Pleural Invasion in Lung Adenocarcinoma. Front. Oncol. 2022, 12. [Google Scholar] [CrossRef] [PubMed]
- Zhao, Y.; Ye, Z.; Yan, Q.; Sun, H.; Zhao, F. Integrating Radiomics Features and CT Semantic Characteristics for Predicting Visceral Pleural Invasion in Clinical Stage Ia Peripheral Lung Adenocarcinoma 2024.
- Zuo, Y.-Q.; Gao, D.; Cui, J.-J.; Yin, Y.-L.; Gao, Z.-H.; Feng, P.-Y.; Geng, Z.-J.; Yang, X. Peritumoral and Intratumoral Radiomics for Predicting Visceral Pleural Invasion in Lung Adenocarcinoma Based on Preoperative Computed Tomography (CT). Clinical Radiology 2025, 80, 106729. [Google Scholar] [CrossRef]
- Zwanenburg, A.; Leger, S.; Vallières, M.; Löck, S. Image Biomarker Standardisation Initiative. Radiology 2020, 295, 328–338. [Google Scholar] [CrossRef] [PubMed]
Figure 1.
Example of lesion segmentation and the corresponding peritumoral regions generated by isotropic expansions of 3 mm, 5 mm, and 10 mm, constrained within the lung parenchyma mask, shown in the axial (a), sagittal (b), and coronal (c) views. The lesion is shown in the box at the top right of panel (a).
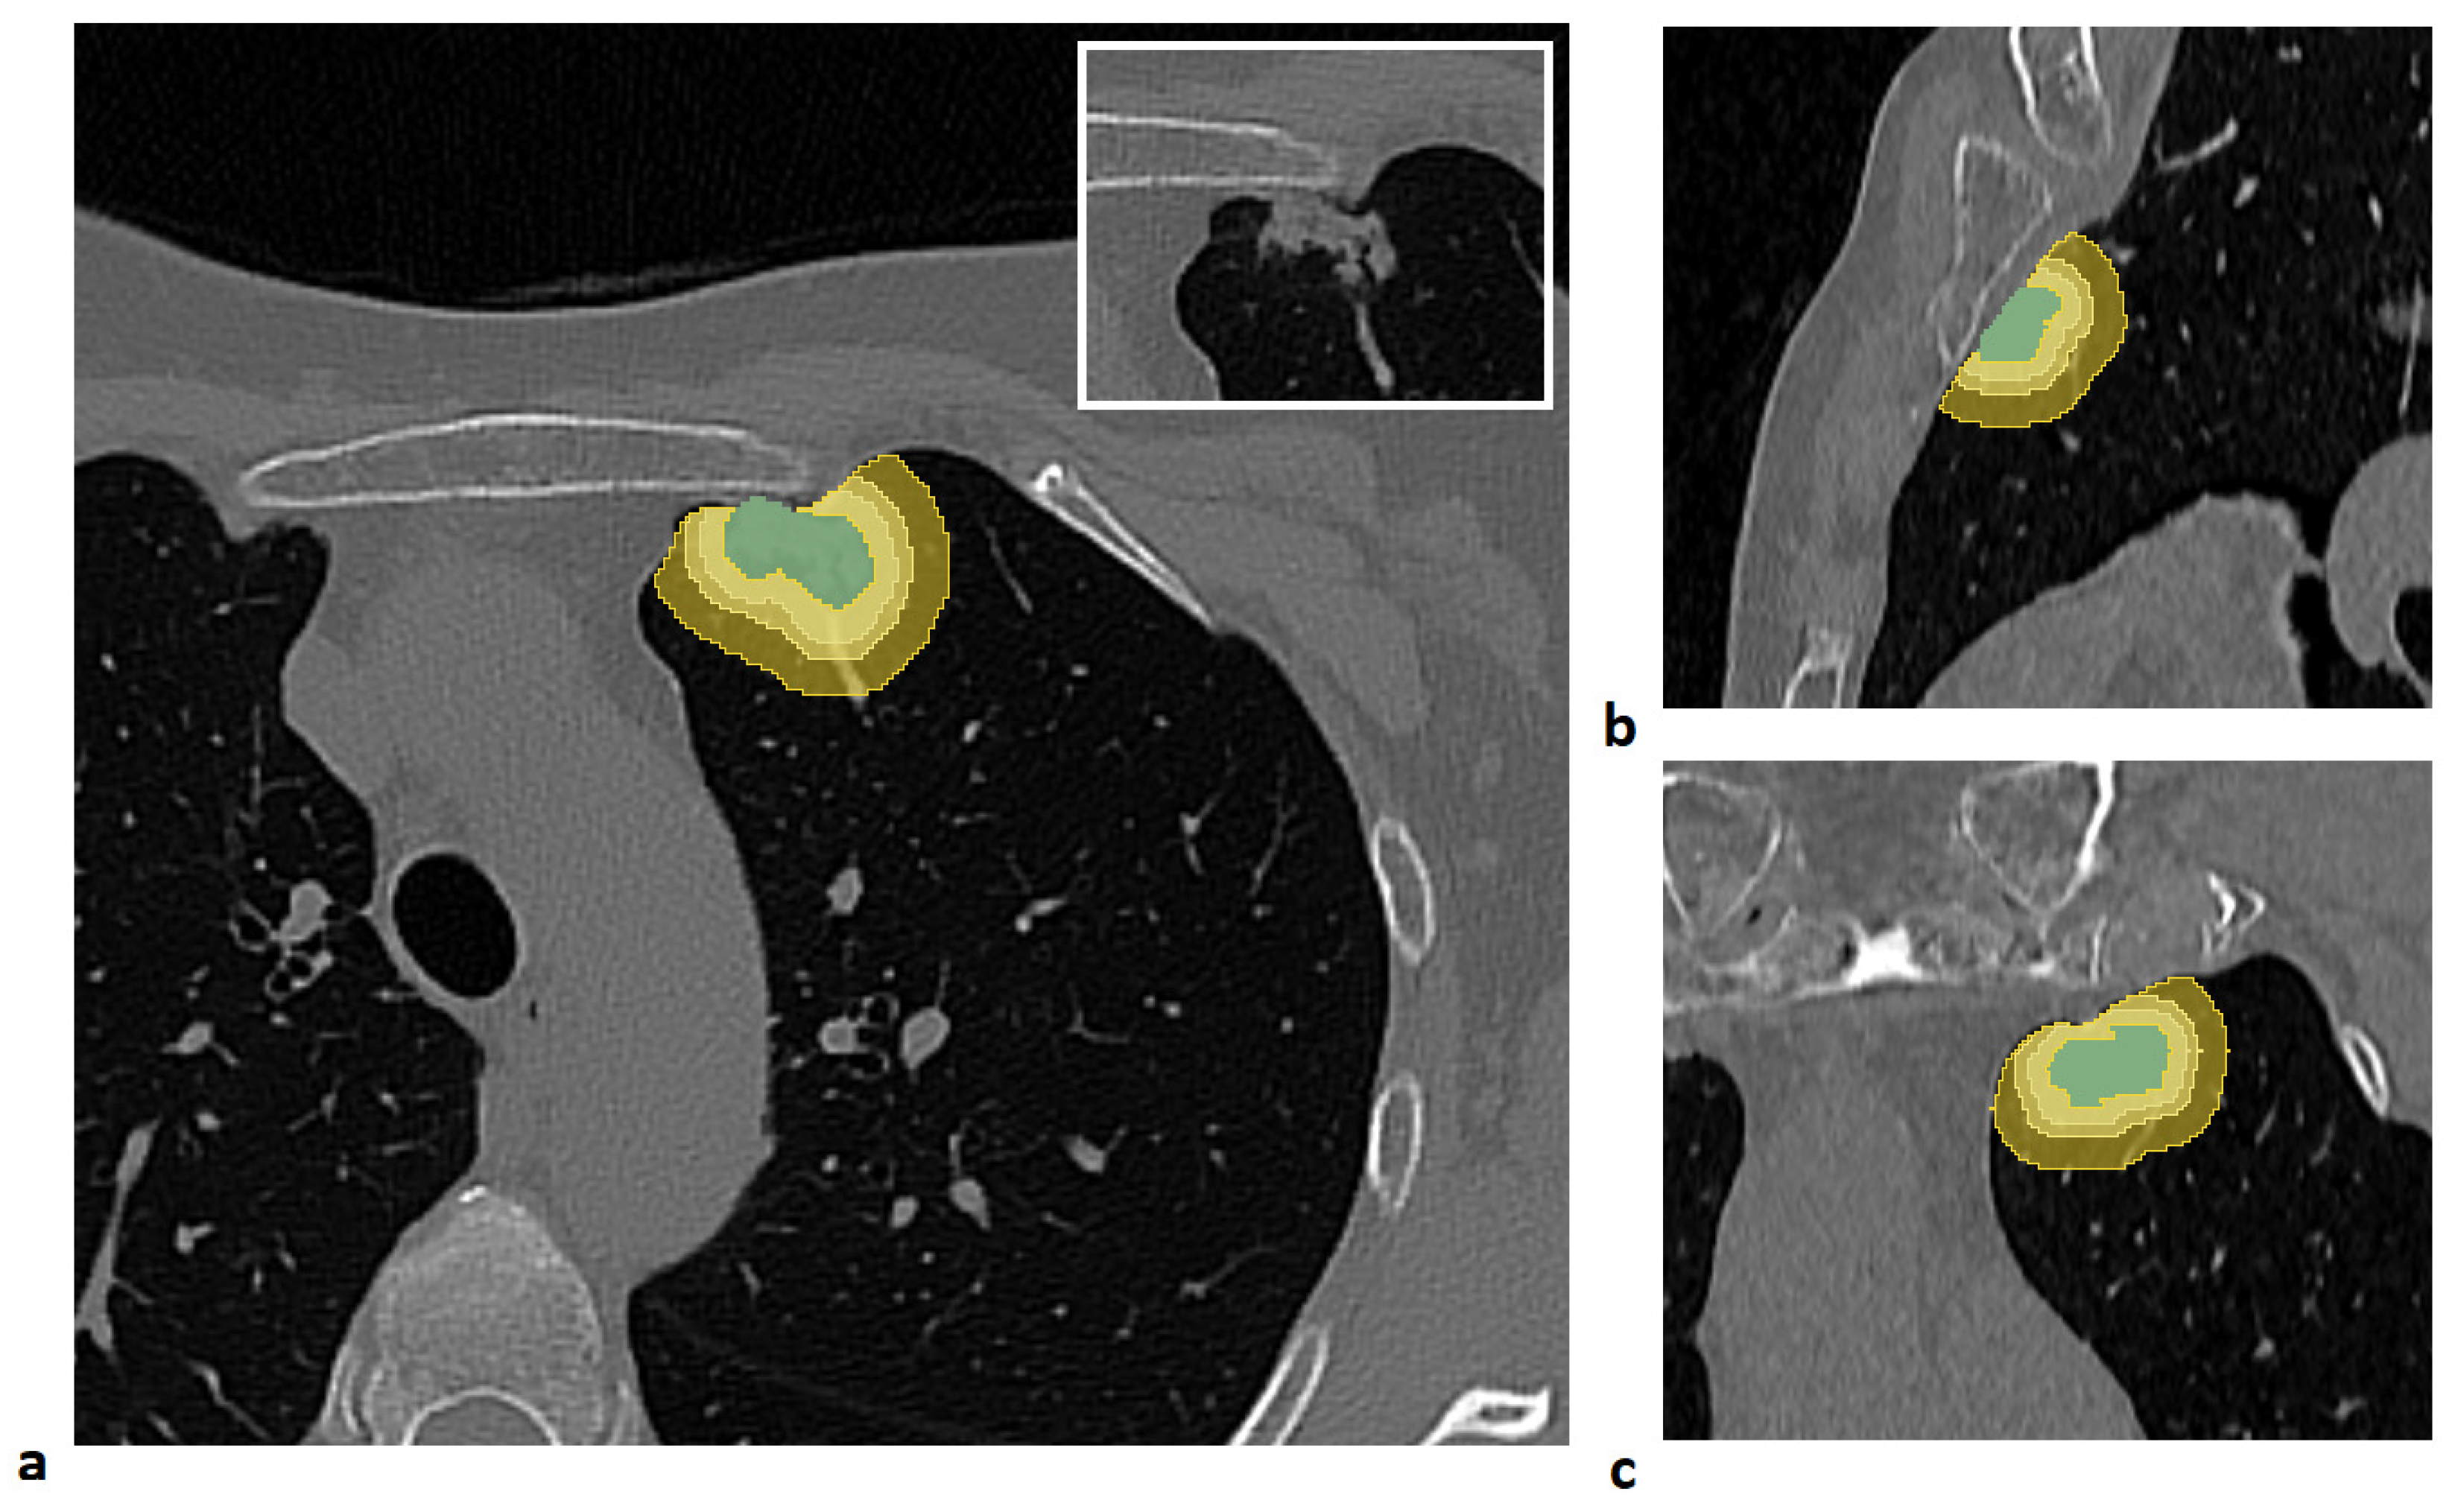
Figure 2.
Overview of the analysis pipeline to obtain the final models. Abbreviations: VPI, Visceral Pleural Invasion; AdaBoost, Adaptive Boosting; SMOTE–NC, Synthetic Minority Over-sampling Technique for Nominal and Continuous variables.
Figure 2.
Overview of the analysis pipeline to obtain the final models. Abbreviations: VPI, Visceral Pleural Invasion; AdaBoost, Adaptive Boosting; SMOTE–NC, Synthetic Minority Over-sampling Technique for Nominal and Continuous variables.
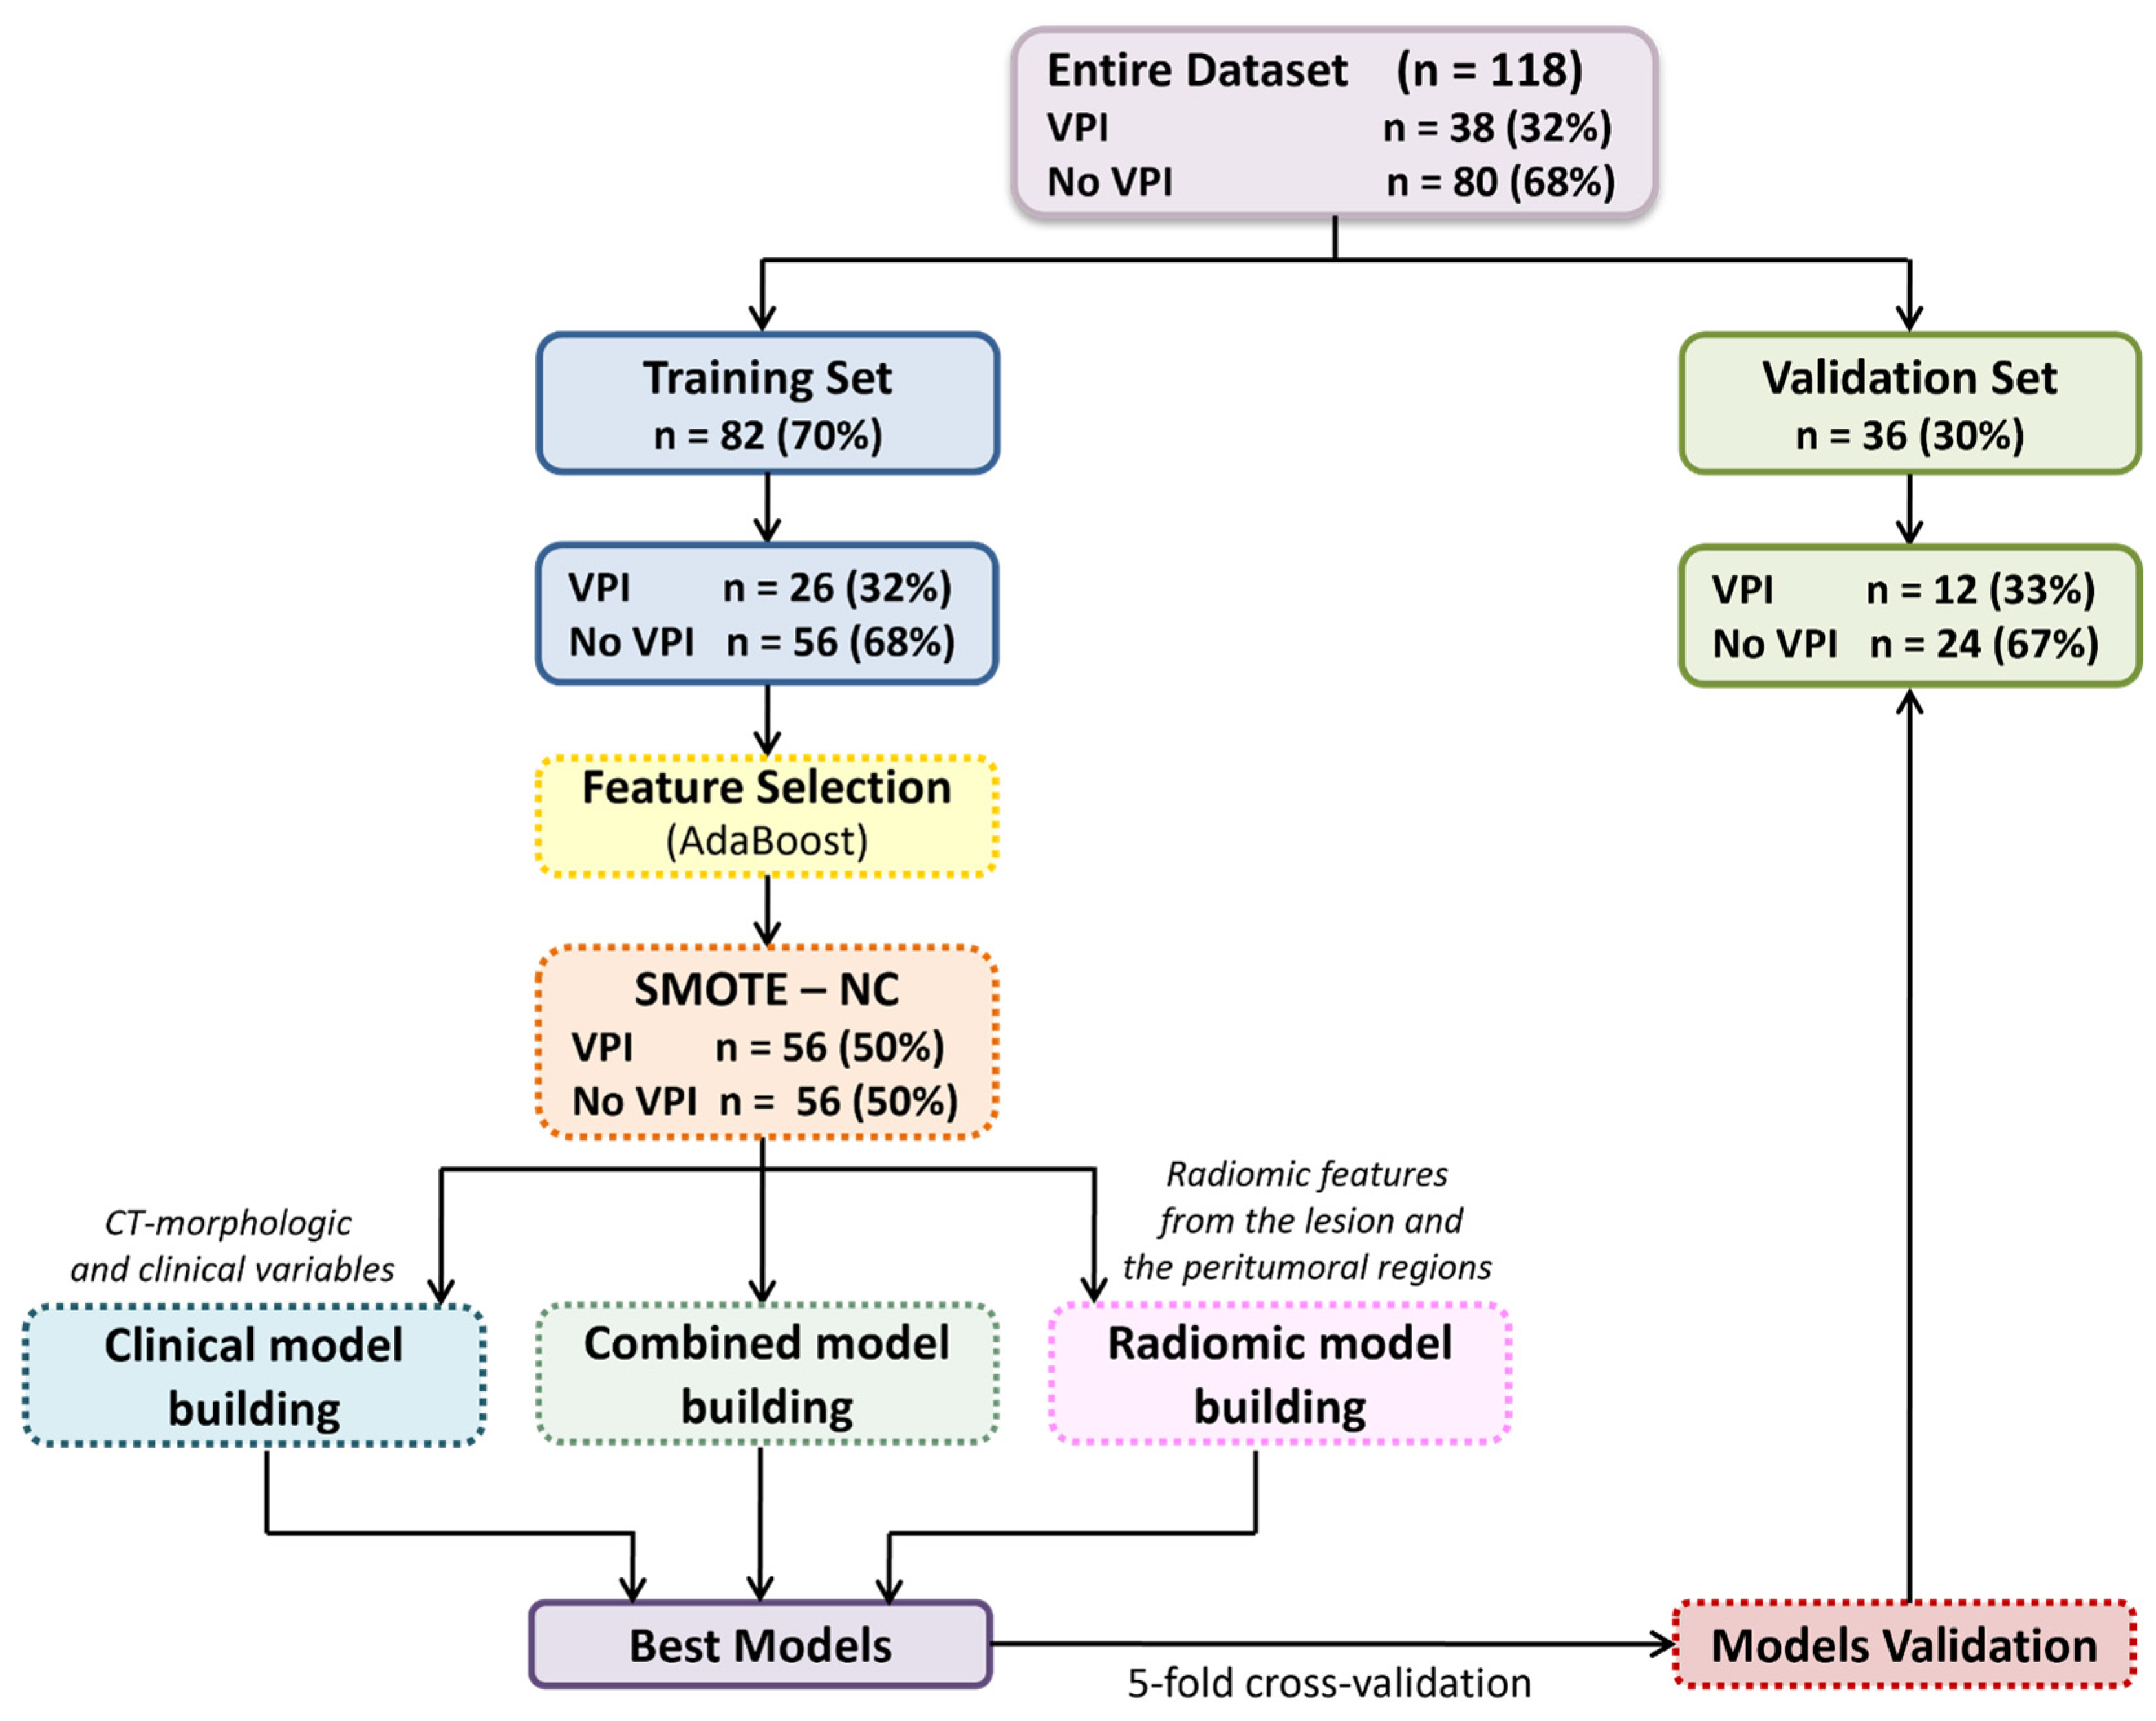
Figure 3.
Boxplot and bar plots of the three predictors in the best-performing model for visceral pleural invasion (VPI), combining intratumoral radiomic features with clinical data: Root Mean Square (RMS) Intensity derived from the radiomic analysis of the lesion (a); presence of a pleural tag (b); and worst histotype (c). .
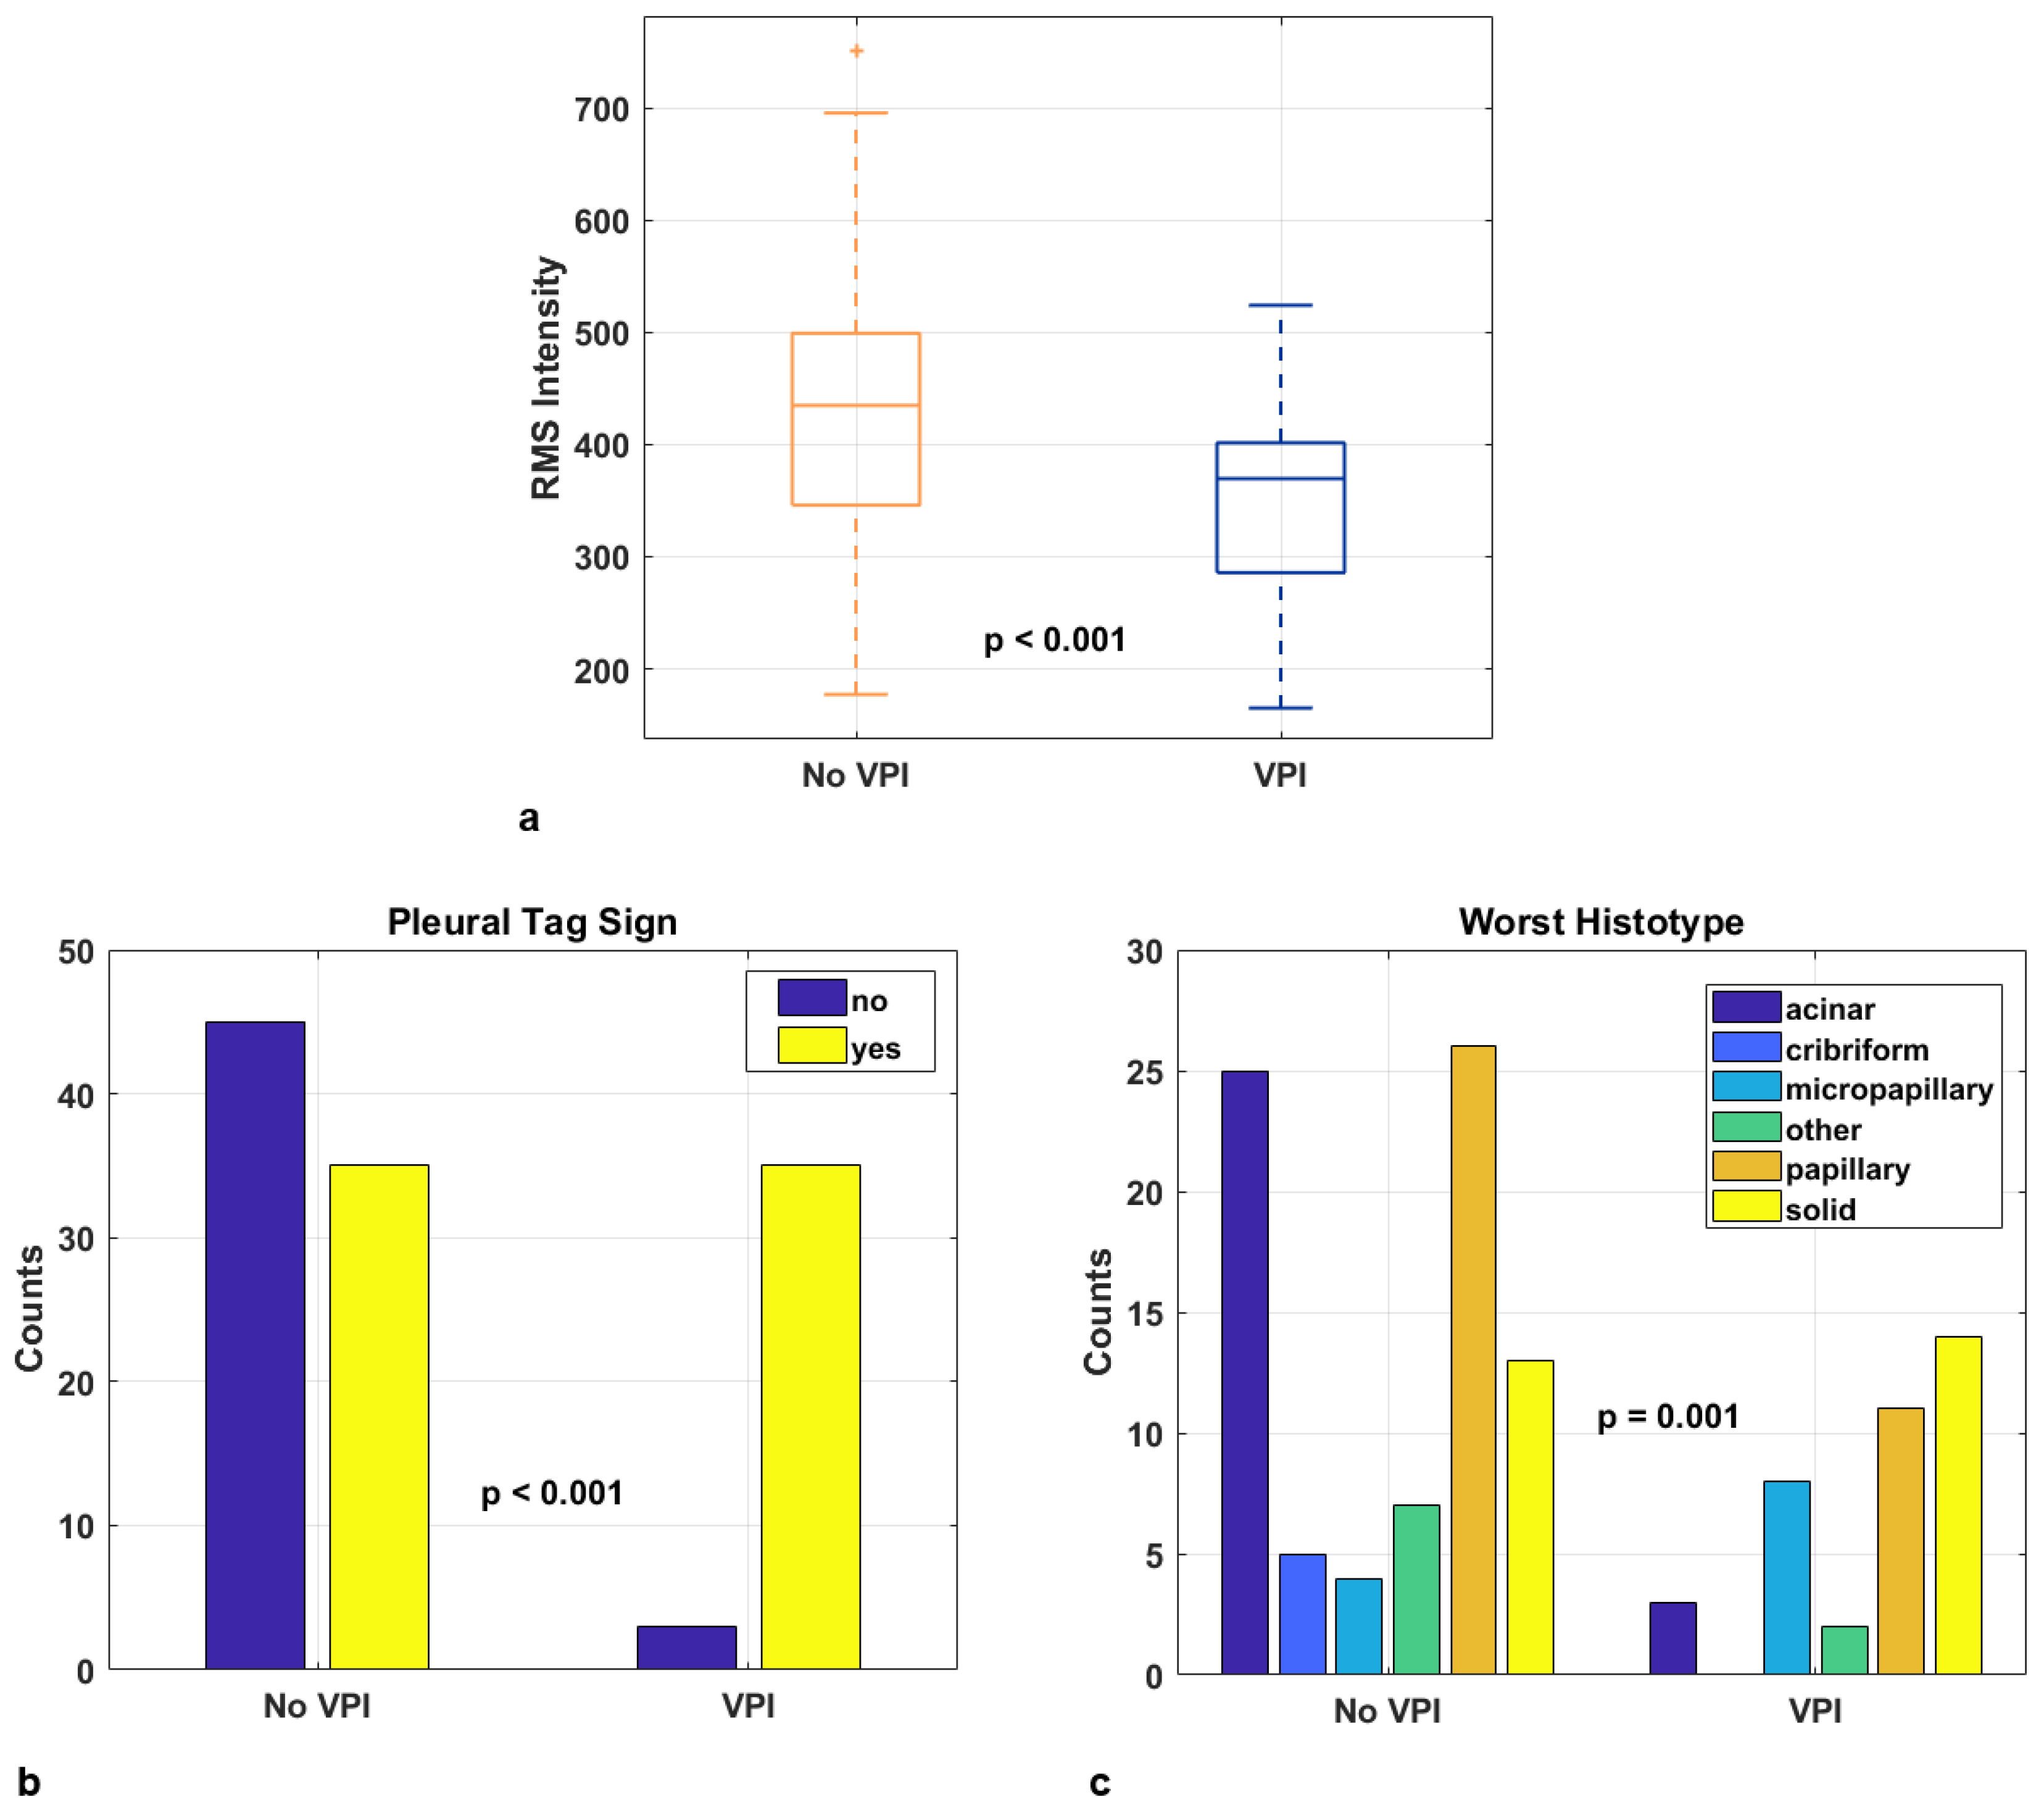
Figure 4.
Bar plots comparing the performance metrics of the four best-performing predictive models for visceral pleural invasion in the training and validation sets.
Figure 4.
Bar plots comparing the performance metrics of the four best-performing predictive models for visceral pleural invasion in the training and validation sets.
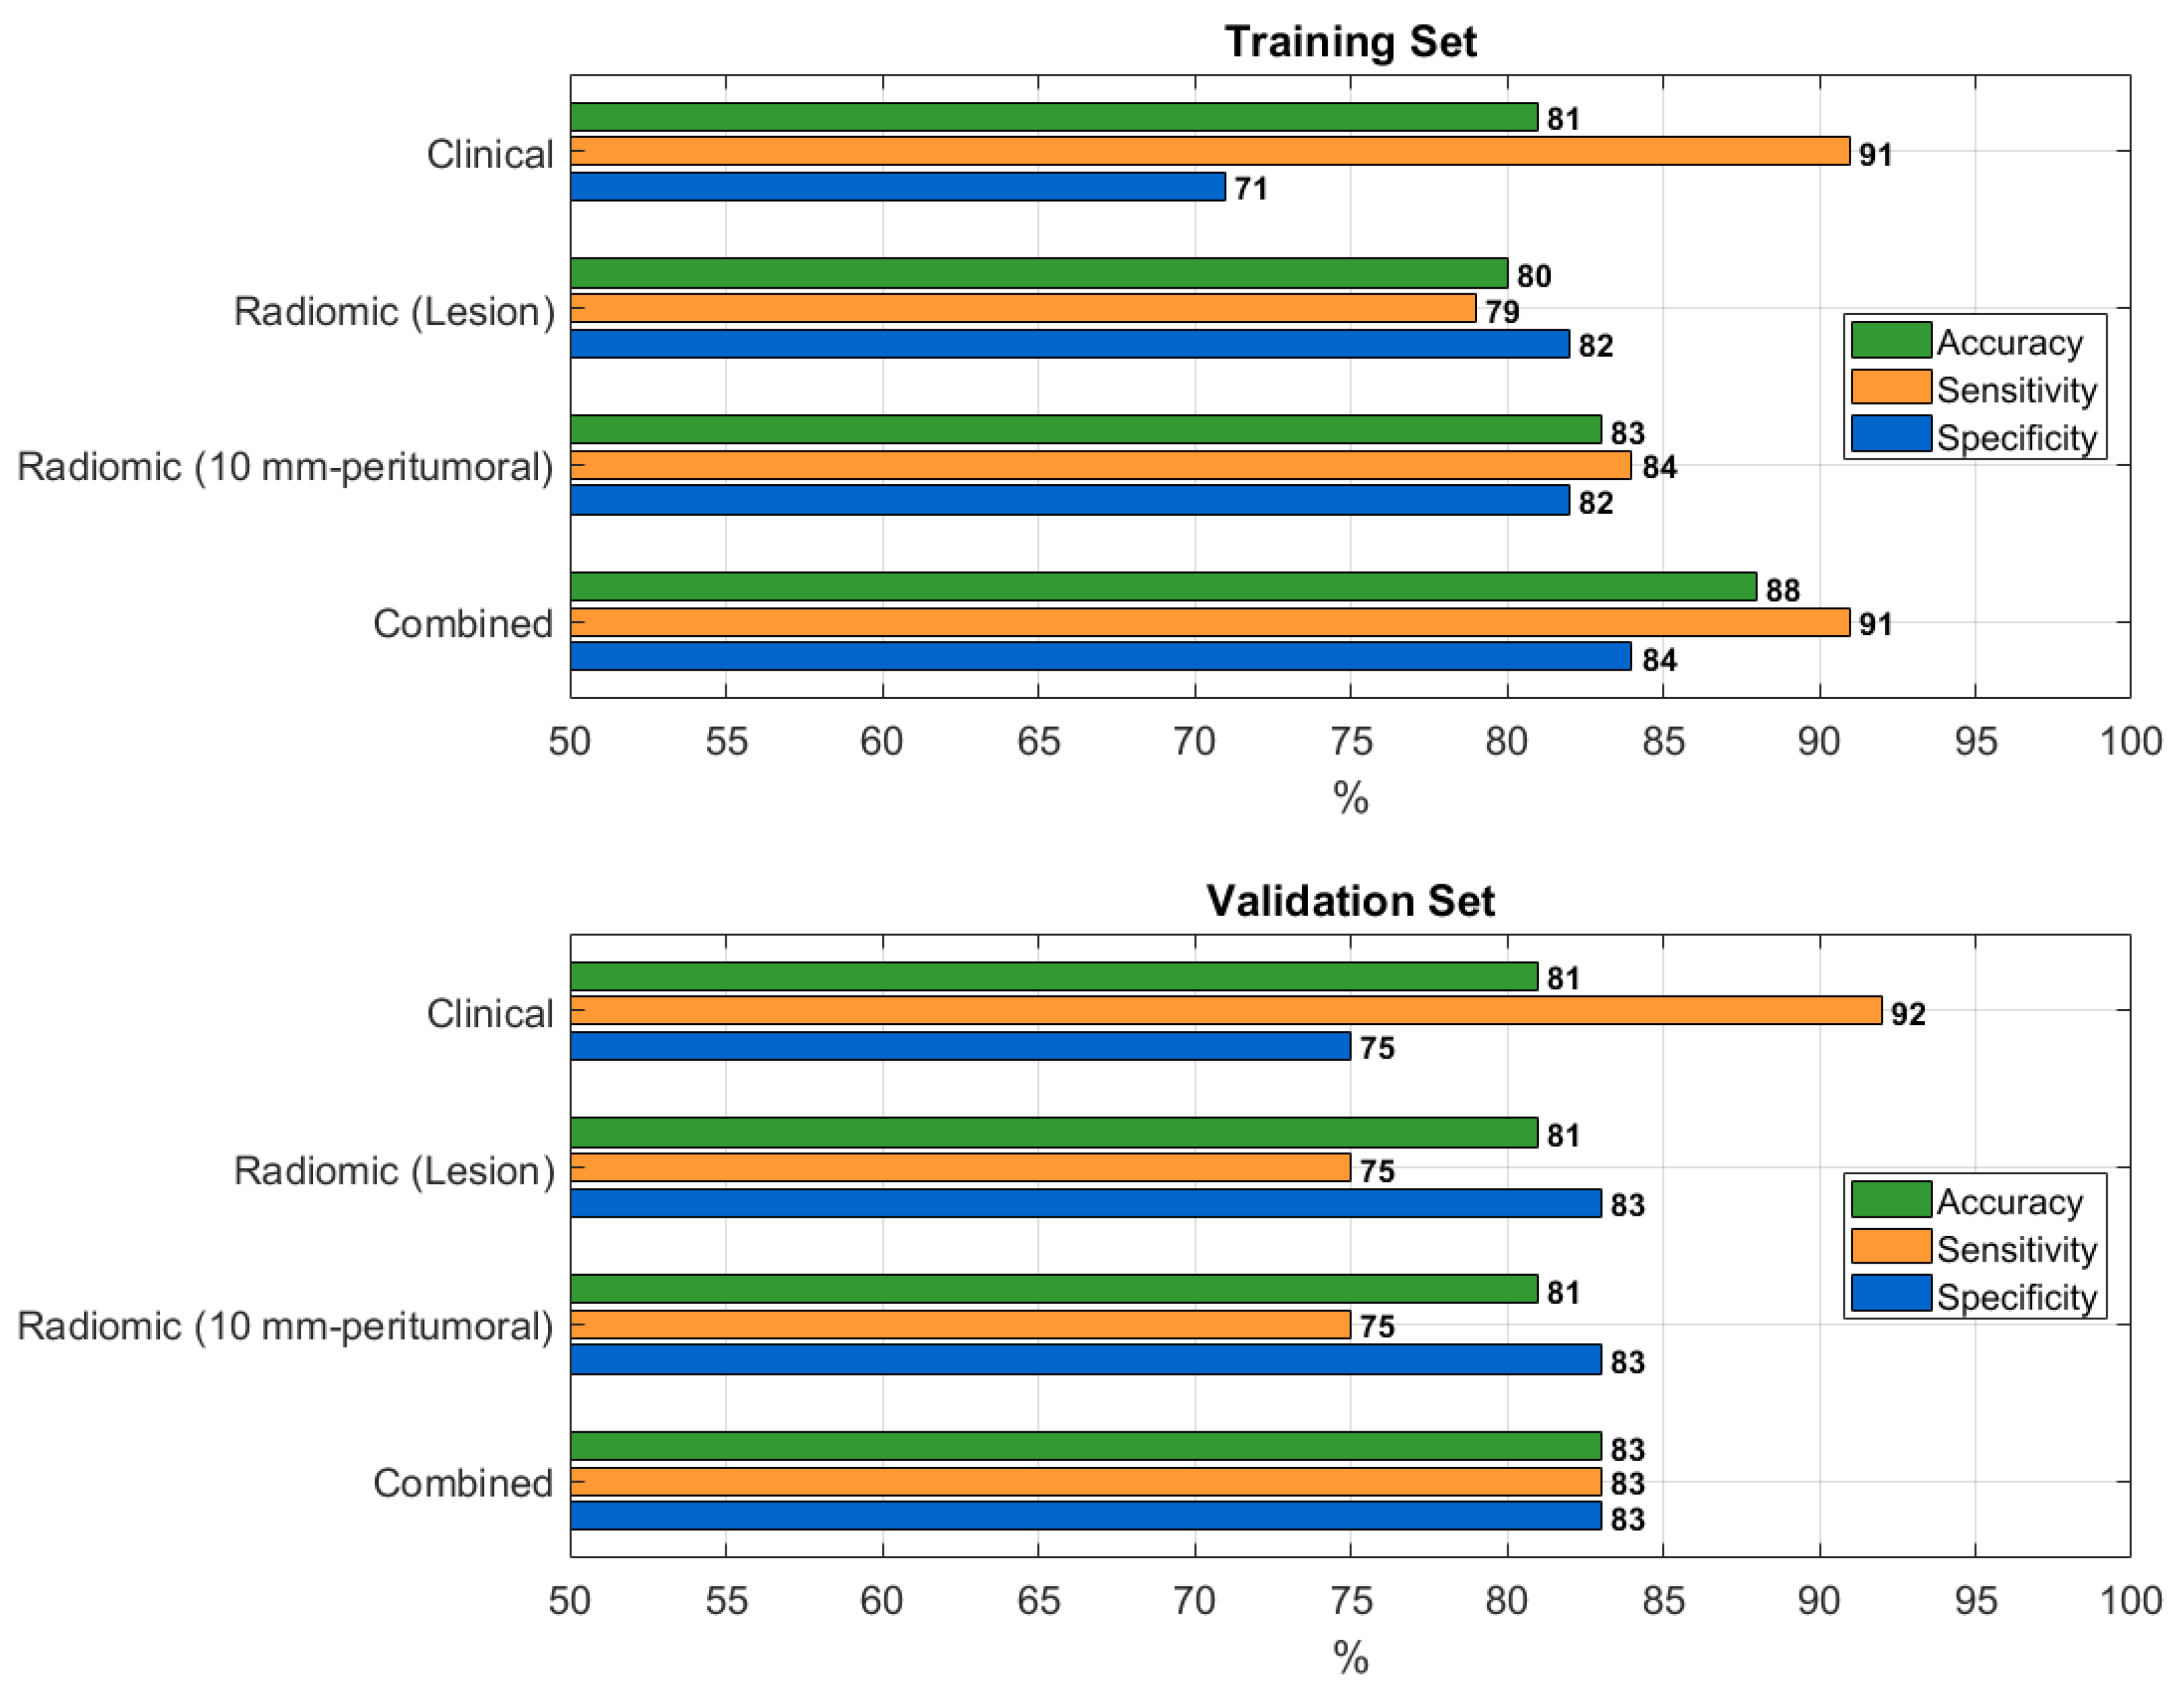
Figure 5.
(a–b) Axial chest CT scan in lung window of a 54-year-old man showing a solid irregular nodule in the anteromedial basal segment of the left lower lobe, with evidence of a pleural tag sign, measuring 14.4 mm in major axis. The corresponding segmented lesion is shown in (b). Despite radiological suspicion, histological examination revealed no pleural invasion. (c-d) Axial chest CT scan in lung window of a 65-year-old man showing a solid irregular nodule in the apical segment of the left lower lobe, without evidence of pleural tag sign, measuring 22.3 mm in major axis. The corresponding segmented lesion is shown in (d). Histological examination revealed pleural invasion, despite no radiological evidence being suspected.
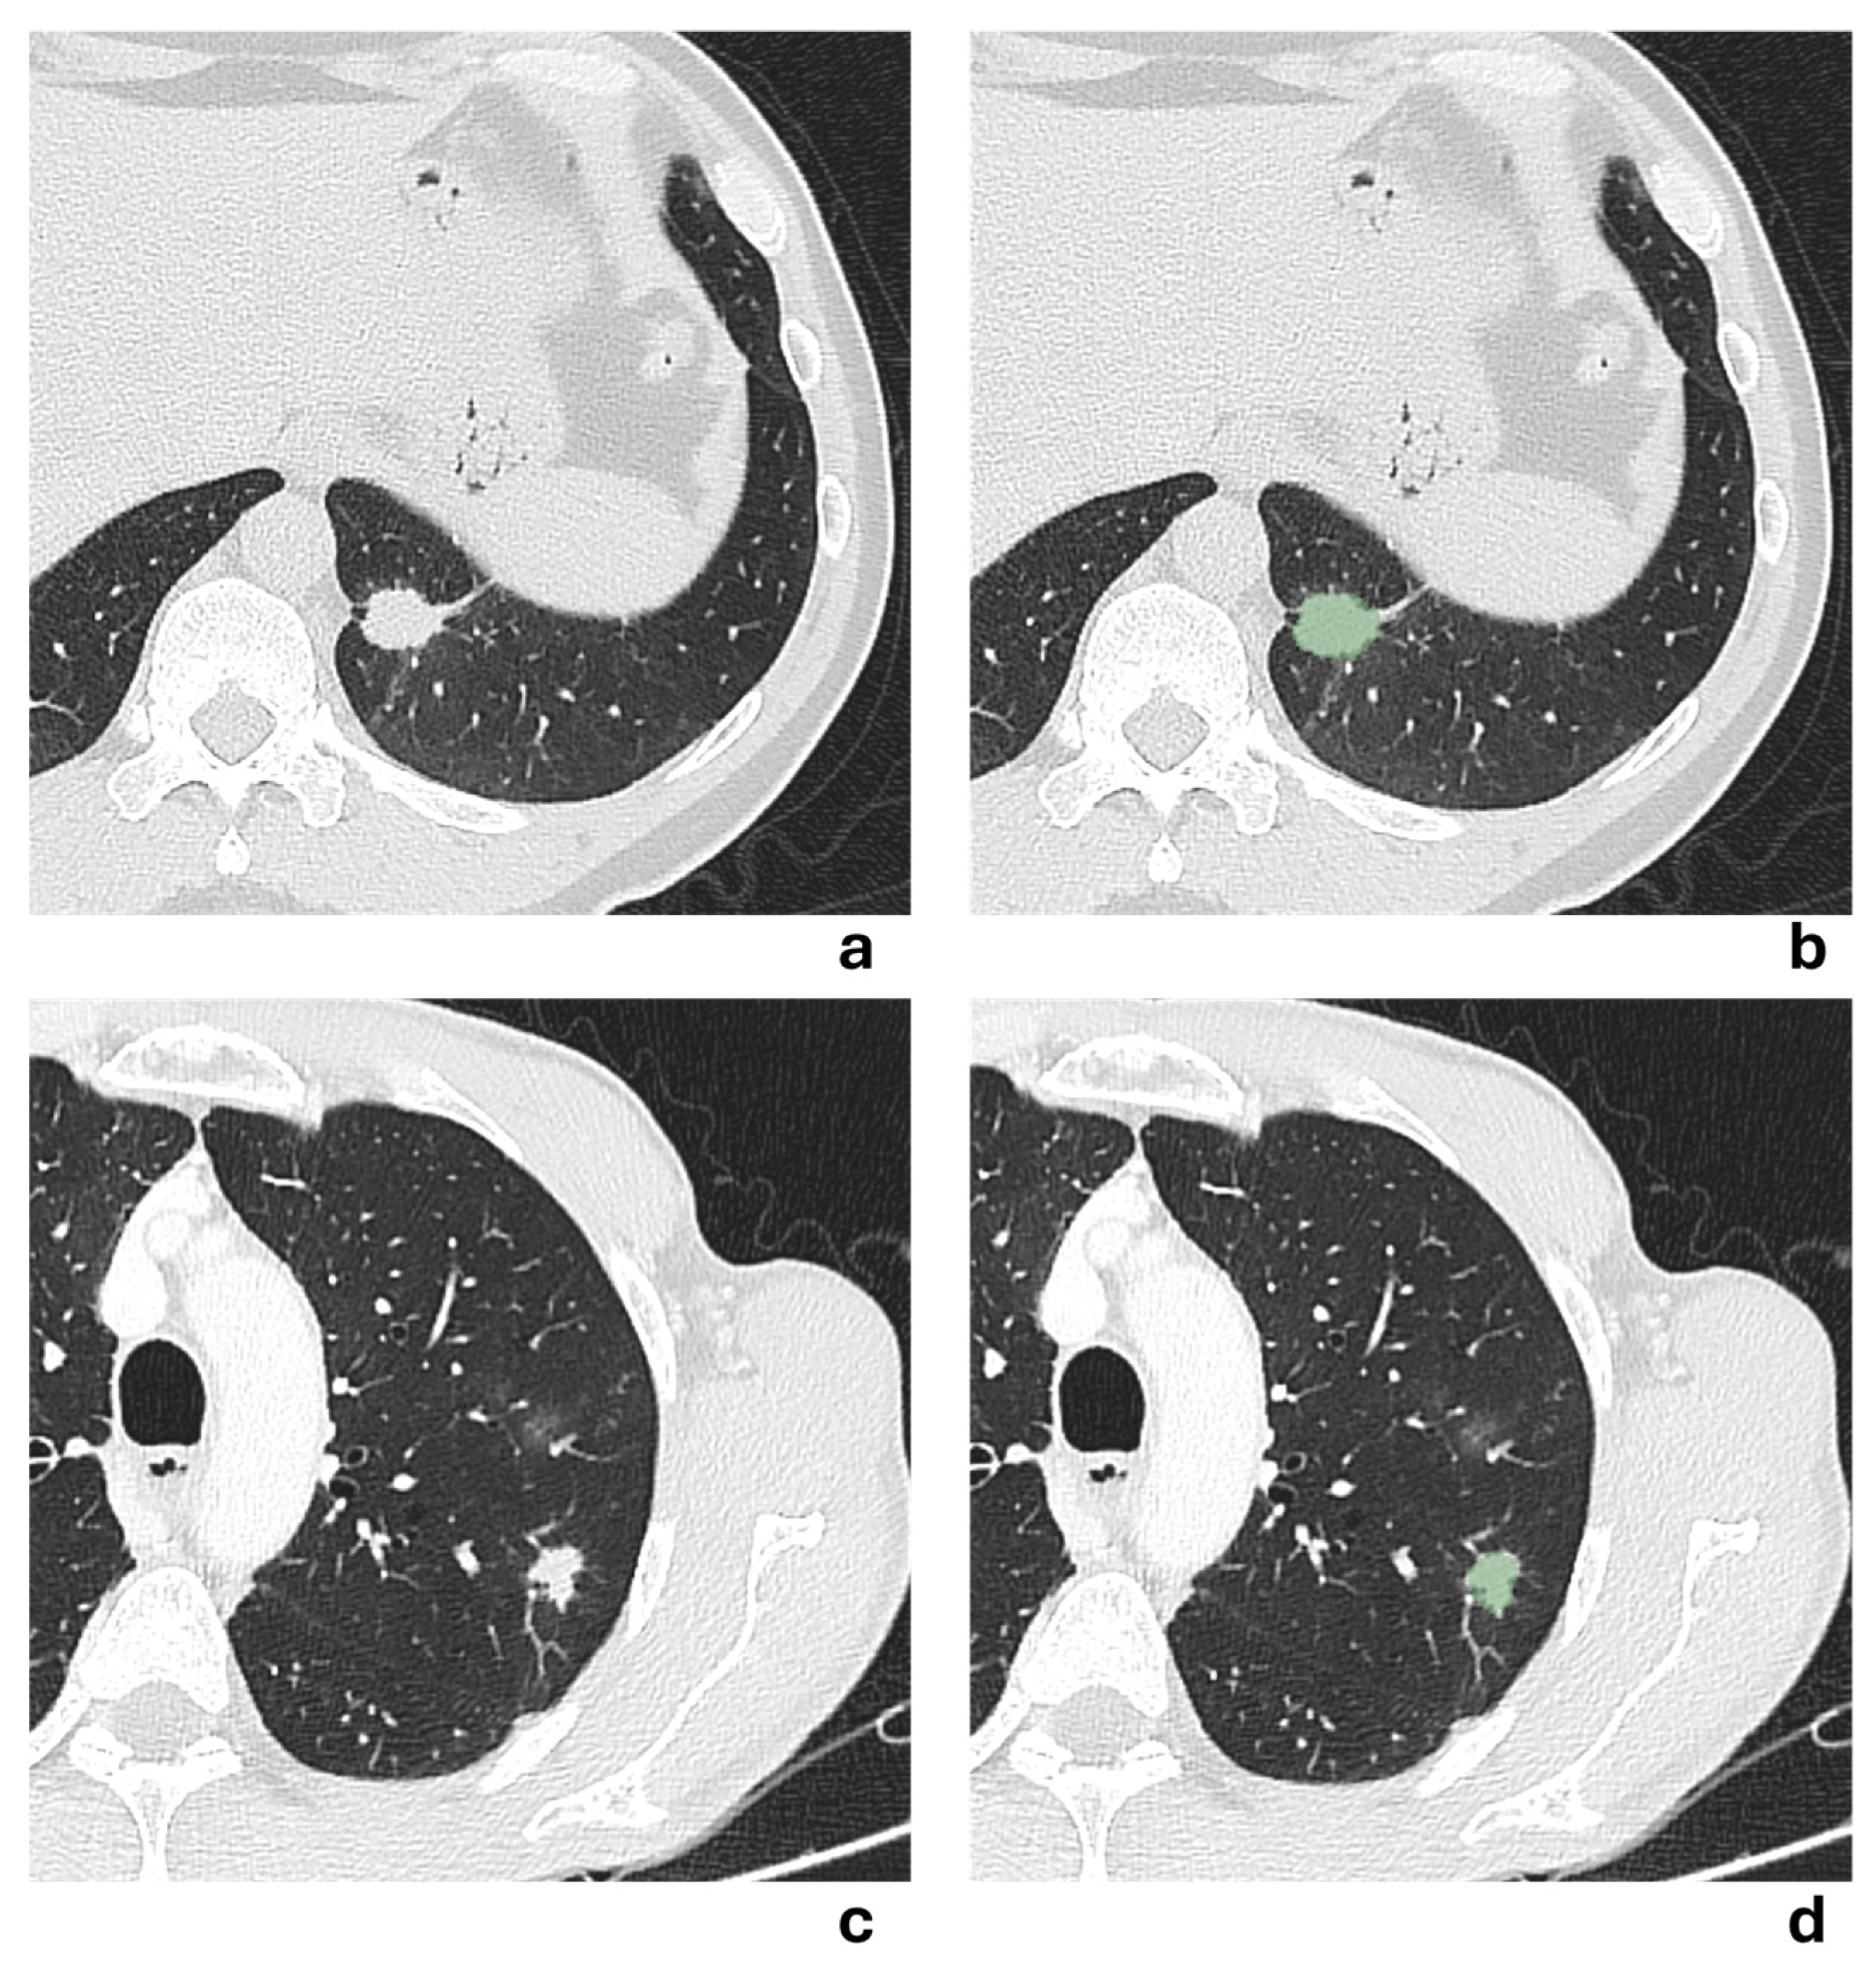

Table 1.
Patient and tumor characteristics in the overall dataset, training set, and validation set.
Table 1.
Patient and tumor characteristics in the overall dataset, training set, and validation set.
| Parameter | Overall N = 118 |
Training Set N = 82 |
Validation Set N = 36 |
P-value |
|---|---|---|---|---|
|
Gender F M |
62 (53%) 56 (47%) |
42 (51%) 40 (49%) |
20 (56%) 16 (44%) |
0.664 |
|
Smoking Status active smoker non-smoker |
43 (36%) 75 (64%) |
29 (35%) 53 (65%) |
14 (39%) 22 (61%) |
0.714 |
| Age at Surgery (years) | 69 [67, 70] | 68.5 [66, 70] | 69.5 [66, 72.5] | 0.290 |
| Major Axis Length (mm) | 23.7 [19.9, 25.5] | 23.7 [19.4, 25.7] | 23.9 [17.7, 29.9] | 0.928 |
|
Location central pheripheral |
35 (30%) 83 (70%) |
22 (27%) 60 (73%) |
13 (36%) 23 (64%) |
0.309 |
|
cTNM 1 2 3 |
82 (69%) 26 (22%) 10 (8.5%) |
57 (70%) 18 (22%) 7 (8.5%) |
25 (69%) 8 (22%) 3 (8.3%) |
0.999 |
|
Grading 2 3 |
55 (47%) 63 (53%) |
36 (44%) 46 (56%) |
19 (53%) 17 (47%) |
0.373 |
|
Worst Histotype acinar cribriform micropapillary papillary solid other |
28 (24%) 5 (4.2%) 12 (10%) 37 (31%) 27 (23%) 9 (7.6%) |
22 (27%) 4 (4.9%) 10 (12%) 25 (30%) 15 (18%) 6 (7.3%) |
6 (17%) 1 (2.8%) 2 (5.6%) 12 (33%) 12 (33%) 3 (8.3%) |
|
|
Spiculation no yes |
34 (29%) 84 (71%) |
24 (29%) 58 (71%) |
10 (28%) 26 (72%) |
0.869 |
|
Pleural Tag Sign no yes |
48 (41%) 70 (59%) |
32 (39%) 50 (61%) |
16 (44%) 20 (56%) |
0.581 |
|
Density solid sub-solid ground-glass |
91 (78%) 9 (7.8%) 16 (14%) |
62 (77%) 7 (8.6%) 12 (15%) |
29 (83%) 2 (5.7%) 4 (11%) |
|
|
Surgery left lower lobe left upper lobe right lower lobe right middle lobe right upper lobe |
20 (17%) 24 (20%) 34 (29%) 5 (4.2%) 35 (30%) |
16 (20%) 15 (18%) 26 (32%) 3 (3.7%) 22 (27%) |
4 (11%) 9 (25%) 8 (22%) 2 (5.6%) 13 (36%) |
0.507 |
|
Visceral Pleural Invasion no yes |
80 (68%) 38 (32%) |
56 (68%) 26 (32%) |
24 (67%) 12 (33%) |
0.862 |
Numerical variables are reported as medians and 95% confidence intervals; categorical variables as counts. No p-value is reported for categorical variables with insufficient class counts. The Worst Histotype subtypes with low frequencies (clear-cell, lepidic, mixed, mucinous, pleomorphic, undifferentiated) are grouped under the category other. For the cTNM variable, stages 3 and 4 are merged into category 3. For the variable Grading, grades 1 and 2 are combined into category 2.
Table 2.
Summary statistics of the best predictors included in the final models.
| No VPI | VPI | ||
|---|---|---|---|
| Radiomic Predictor | Median [95% CI] | Median [95% CI] | P-value |
| Lesion | |||
| Integrated Intensity | 2.0 [1.5, 2.8] x 106 | 9.0 [4.8, 20.8] x 106 | < 0.001 |
| RMS Intensity | 435 [401, 461] | 370 [332, 393] | < 0.001 |
| Grey Level Non-Uniformity (GLSZM) |
28 [25, 42] | 79 [56, 229] | < 0.001 |
| 10 mm-peritumoral region | |||
| Flatness | 0.78 [0.75, 0.81] | 0.68 [0.63, 0.72] | < 0.001 |
| Intensity Skewness | 3.10 [2.85, 3.28] | 2.40 [2.10, 2.54] | < 0.001 |
| Run Variance (GLRLM) | 0.12 [0.11, 0.13] | 0.09 [0.08, 0.10] | < 0.001 |
| No VPI | VPI | ||
| Clinical Predictor | Counts | Counts | P-value |
|
Worst Histotype acinar cribriform micropapillary papillary solid other |
25 5 4 26 13 7 |
308 11 14 2 |
|
|
Pleural Tag Sign no yes |
45 35 |
3 35 |
< 0.001 |
The p-value for Worst Histotype is omitted due to insufficient class frequencies. The Worst Histotype subtypes with low frequencies (clear-cell, lepidic, mixed, mucinous, pleomorphic, undifferentiated) are grouped under the category other. Abbreviations: VPI, Visceral Pleural Invasion; CI, confidence interval; RMS, Root Mean Square; GLSZM, Grey-Level Size Zone Matrix; GLRLM, Grey-Level Run Length Matrix.
Table 3.
Performance of the best–performing prediction models in the training and validation sets.
| Model | AUC | Accuracy | Sensitivity | Specificity | PPV | NPV |
|---|---|---|---|---|---|---|
|
Clinical 1) Worst Histotype 2) Pleural Tag Sign |
0.81 [0.74, 0.88] |
0.81 [0.73, 0.87] |
0.91 [0.81, 0.96] |
0.71 [0.59, 0.82] |
0.76 [0.65, 0.85] |
0.89 [0.77, 0.95] |
|
0.83 [0.68, 0.92] |
0.81 [0.65, 0.90] |
0.92 [0.65, 0.99] |
0.75 [0.55, 0.88] |
0.65 [0.41, 0.83] |
0.95 [0.75, 0.99] |
|
|
Radiomic Lesion 1) Integrated Intensity 2) RMS Intensity 3) Grey Level Non-Uniformity (GLSZM) |
0.80 [0.72, 0.87] |
0.80 [0.72, 0.87] |
0.79 [0.66, 0.88] |
0.82 [0.70, 0.90] |
0.82 [0.69, 0.90] |
0.79 [0.67, 0.88] |
|
0.79 [0.61, 0.91] |
0.81 [0.65, 0.90] |
0.75 [0.47, 0.91] |
0.83 [0.64, 0.93] |
0.69 [0.42, 0.87] |
0.87 [0.68, 0.96] |
|
|
Radiomic 10mm 1) Flatness 2) Intensity Skewness 3) Run Variance (GLRLM) |
0.83 [0.75, 0.89] |
0.83 [0.75, 0.89] |
0.84 [0.72, 0.91] |
0.82 [0.70, 0.90] |
0.83 [0.71, 0.90] |
0.84 [0.72, 0.91] |
|
0.79 [0.60, 0.91] |
0.81 [0.65, 0.90] |
0.75 [0.47, 0.91] |
0.83 [0.64, 0.93] |
0.69 [0.42, 0.87] |
0.87 [0.68, 0.96] |
|
|
Combined: Clinical + Radiomic Lesion 1) RMS Intensity 2) Worst Histotype 3) Pleural Tag Sign |
0.88 [0.80, 0.93] |
0.88 [0.80, 0.92] |
0.91 [0.81, 0.96] |
0.84 [0.72, 0.91] |
0.85 [0.74, 0.92] |
0.90 [0.79, 0.96] |
|
0.83 [0.67, 0.94] |
0.83 [0.68, 0.92] |
0.83 [0.55, 0.95] |
0.83 [0.64, 0.93] |
0.71 [0.45, 0.88] |
0.91 [0.72, 0.98] |
Abbreviations: RMS, Root Mean Square; GLSZM, Grey-Level Size Zone Matrix; GLRLM, Grey-Level Run Length Matrix; AUC, area under the receiver operating characteristic curve; PPV, positive predictive value; NPV, negative predictive value. Bold values refer to the validation set. Performance metrics are reported with their corresponding 95% confidence intervals.
Disclaimer/Publisher’s Note: The statements, opinions and data contained in all publications are solely those of the individual author(s) and contributor(s) and not of MDPI and/or the editor(s). MDPI and/or the editor(s) disclaim responsibility for any injury to people or property resulting from any ideas, methods, instructions or products referred to in the content. |
© 2025 by the authors. Licensee MDPI, Basel, Switzerland. This article is an open access article distributed under the terms and conditions of the Creative Commons Attribution (CC BY) license (http://creativecommons.org/licenses/by/4.0/).
Copyright: This open access article is published under a Creative Commons CC BY 4.0 license, which permit the free download, distribution, and reuse, provided that the author and preprint are cited in any reuse.


