
Submitted:
11 February 2025
Posted:
11 February 2025
You are already at the latest version
Abstract
Objectives: Preoperative identification of occult pleural metastasis (OPM) in lung cancer remains a crucial clinical challenge. This study aimed to develop and validate a predictive model integrating clinical information with chest CT radiomic features to preoperatively identify patients at risk of OPM.
Methods: This study included 50 patients diagnosed with OPM during surgery as the positive training cohort and an equal number of non-metastatic patients as the negative control cohort. Using least absolute shrinkage and selection operator (LASSO) logistic regression, we identified key radiomic features and calculated radiomic scores. A predictive nomogram was developed by combining clinical characteristics and radiomic scores, which was subsequently validated using data from an additional 545 patients across three medical centers.
Results: Univariate and multivariate logistic regression analyses identified carcinoembryonic antigen (CEA), neutrophil-to-lymphocyte ratio (NLR), clinical T stage, and tumor-pleural relationship as significant clinical predictors. The clinical model alone achieved an area under the curve (AUC) of 0.761. The optimal integrated model, combining radiomic scores from the volume of interest (VOI) with CEA and NLR, demonstrated improved predictive performance, with AUCs of 0.890 in the training cohort and 0.855 in the validation cohort.
Conclusion: Radiomic features derived from CT scans show significant promise in identifying OPM in lung cancer. The nomogram developed in this study, which integrates CEA, NLR, and radiomic tumor area scores, enhances the precision of preoperative OPM prediction and provides a valuable tool for clinical decision-making.
Keywords:
occult pleural metastasis
; nomogram
; CT-based radioomic
; lung cancer
1. Introduction
Lung cancer is a major contributor to cancer-related morbidity and mortality worldwide, with an alarming 2.5 million new cases and 1.8 million deaths recorded in 2022, accounting for 18.7% of all cancer-related fatalities [1]. Metastasis is the leading cause of mortality in lung cancer patients, with pleural metastasis (PM) being a common pattern of metastasis due to its nearby anatomical location, which typically presents on computed tomography (CT) scans as malignant effusions, pleural nodules, or irregular pleural thickening. Pleural metastasis in lung cancer is classified as M1a in the 8th edition of the IASLC TNM staging system, with a median survival time of merely 11.5 months and a 10% 5-year overall survival rate [2].
Lung cancer with PM exhibits considerable heterogeneity and may elude detection due to the absence of typical clinical symptoms and imaging signs. Cases that are unexpectedly discovered during surgery and confirmed by pathological biopsy are referred to as occult pleural metastasis (OPM). The incidence of OPM remains uncertain, as indicated by varying rates from 0.9% to 5.26% in large-scale retrospective studies [3,4,5,6]. Notably, patients with occult PM tend to have a more favorable prognosis compared to those with clinically evident PM [7]. Hence, the timely identification of such patients prior to surgery is crucial to avoid needless surgical interventions and to determine the most appropriate treatment strategy.
The advent of radiomics represents a significant advancement in extracting intricate imaging data from CT scans, unveiling its potential in distinguishing benign from malignant lung cancer, assessing the efficacy of lung cancer treatments, and forecasting outcomes [8,9,10]. Studies have indicated that CT texture analysis of lung tumors is valuable for predicting occult lymph node metastasis in lung cancer [11]. Our objective is to assess the predictive value of CT radiomic features of lung cancer and the adjacent pleural area in identifying OPM.
2. Materials and Methods
2.1. Patients
This retrospective study was endorsed by the ethical committee of Peking University People's Hospital and was granted a waiver for informed consent. By reviewing the medical records of our center from January 2015 to June 2022, we selected 50 lung cancer patients with OPM who met the inclusion and exclusion criteria. By matching age, gender, and body mass index (BMI), we randomly selected 50 patients from the negative patient pool during the same period to form our training cohort. Subsequently, 545 patients from our center and two additional external centers were carefully screened from July 2022 to June 2024 to constitute our validation cohort.
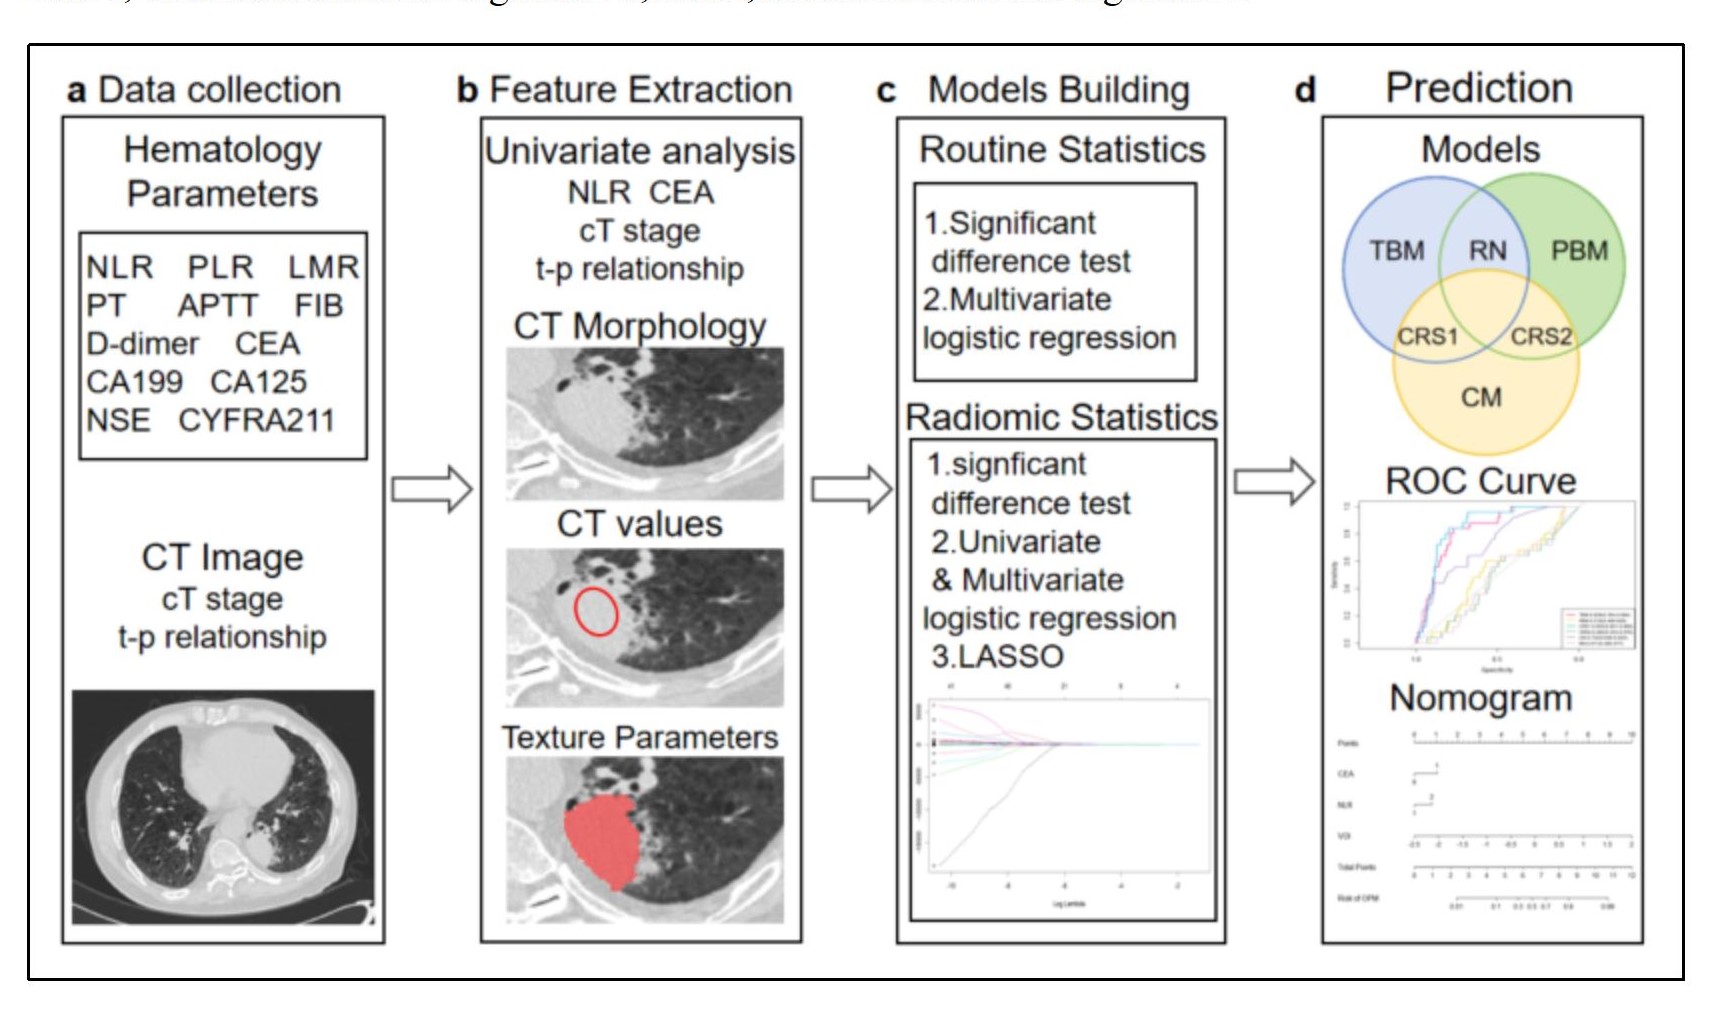
The inclusion criteria were defined as follows: 1) a definitive lung cancer diagnosis via pathology; 2) chest CT scan and thoracoscopy conducted at the same medical facility; 3) the solid component of the primary lung lesion on CT measuring at least 1cm in size, devoid of typical PM signs (such as multiple pleural nodules, pleural/pericardial effusion); 4) no distant metastases or stage IV indications on CT. The exclusion criteria included: 1) a history of previous ipsilateral thoracic surgery; 2) recent pleurisy or malignant lesions; 3) a gap of more than two weeks between CT scans and thoracoscopy; and 4) CT image artifacts that could disrupt the assessment of pleural lesions.The overall framework of this study is shown in Figure 1.
2.2. CT Image Acquisition
Participants underwent scanning with a Siemens SOMATOM Force CT scanner at our facility and Philips 64-row CT at other sites. All patients were instructed to hold their breath while lying in the supine position to minimize potential motion artifacts induced by respiratory movements. A spiral scanning technique was employed, with the following parameters: a tube voltage of 120kVp, automatic tube current modulation, and a field of view covering the entire lung region.
For image reconstruction, an iterative reconstruction method was utilized. The display range of Hounsfield Unit (HU) was set to [-1024, 3071], which was divided into 164 discrete bins using a fixed bin width of 25 HU. This binning strategy was implemented to reduce image noise and enhance image quality.The reconstruction parameters included a slice thickness of 3mm and a reconstruction interval of 1.5mm, enabling overlapping reconstruction to improve spatial continuity. A high-resolution convolution kernel (e.g., Bv40 in Siemens systems) optimized for detailed soft tissue visualization was applied during the reconstruction process.
2.3. PM status Determination
All patients underwent thoracoscopy, wherein suspected pleural lesions were biopsied and pathologically assessed to confirm the presence of pleural metastasis.
2.4. Data Collection and Analysis
We documented the demographic information, laboratory test results, and tumor marker levels for all enrolled patients. These data included variables such as gender, age, BMI, smoking history, neutrophil-to-lymphocyte ratio (NLR), platelet-to-lymphocyte ratio (PLR), lymphocyte-to-monocyte ratio (LMR), prothrombin time (PT), activated partial thromboplastin time (APTT), fibrinogen (FIB), D-dimer levels, and a panel of tumor markers, including carcinoembryonic antigen (CEA), carbohydrate antigen 125 (CA125), carbohydrate antigen 19-9 (CA19-9), human CYFRA21-1 antigen (CYFRA21-1), and neuron-specific enolase (NSE). Preoperative CT scans were utilized to assess the patients' clinical T stage (cT stage) and to evaluate the relationship between the tumor and pleura. Based on previous studies [12], we classified the tumor-pleura relationship into five distinct types, ranging from tumors confined to the lung parenchyma to those directly contacting with the parietal pleura (as illustrated in Figure 2).
Preoperative chest CT scans in DICOM format were collected, and high-density lesion contours were manually delineated at the lesion edges using ITK-SNAP software (version 4.0.2). Two thoracic surgeons independently annotated the images, and a senior surgeon resolved any major discrepancies. The term “volume of interest” (VOI) refers to the entire primary lesion observed on CT scans. The axial slice exhibiting the largest tumor diameter was defined as the middle layer, and the pleural point nearest to the tumor in this layer was selected as the focal point for the pleural region of interest (ROI). A 2cm length of the pleura was annotated in each slice, centered on the ROI focal point. The annotation was extended to adjacent slices above and below until a 2×2cm2 area was completed (Supplementary Figure 1). All annotations were performed using a window level of -500HU and a window width of 1600HU.
In accordance with PyRadiomics standards [13], we extracted 133 radiomic features from both the VOI and ROI. These features were categorized into seven groups: first-order features, shape features, gray-level co-occurrence matrix (GLCM), gray-level size zone matrix (GLSZM), gray-level run-length matrix (GLRLM), neighboring gray tone difference matrix (NGTDM), and gray-level dependence matrix (GLDM). Univariate analysis, multivariate analysis, and least absolute shrinkage and selection operator (LASSO) regression were employed to select radiomic features from the VOI and ROI data. The resulting radiomic scores for the tumor area and pleural area were used as predictive factors in this study.
2.5. Nomogram Construction and Validation
Clinical significant variables (p<0.05) identified through univariate analysis were further evaluated using multivariate logistic regression analysis. Nomogram prediction models were constructed based on clinical features and/or radiomics scores, including clinical models, radiomics models, and combined models.
The predictive performance of each nomogram model was assessed using the area under the curve (AUC), specificity, sensitivity, and accuracy. The DeLong test was employed to compare the significance of the differences in the AUC values among models. The Hosmer-Lemeshow (H-L) test was applied to evaluate the calibration of the nomogram models by comparing the predicted probabilities with the observed outcomes. Additionally, decision curve analysis (DCA) and clinical impact curve (CIC) were performed to quantify the net benefits at varying threshold probabilities and to assess the clinical utility of the radiomic nomogram.
2.6. Statistical Analyses
Radiomic feature extraction was performed using ITK-SNAP software (version 4.0.2), and all other statistical analyses were conducted using R software (version 4.3.3). A two-sided p-value less than 0.05 was considered statistically significant.
3. Results
3.1. Clinical Characteristics
The training cohort of our study was matched in a 1:1 ratio, comprising 50 patients with OPM and 50 patients without OPM, all of whom met the established inclusion and exclusion criteria. In the validation cohort, 545 patients from three medical centers were included, with 25 positive OPM and 520 negative OPM, resulting in an occult pleural metastasis rate of 4.59%. Within the training cohort, there were no notable statistical variances in clinical attributes such as age, gender, smoking history, PLR, LMR, PT, APTT, FIB, D-dimer levels, CA199, CA125, CYFA21-1, NSE and pathological subtypes between the two groups (p > 0.05), as detailed in Table 1. However, four clinical variables—NLR, CEA, cT stage, and tumor-pleural relationship—demonstrated statistical significance in univariate logistic regression (with p-values of 0.017, 0.003, 0.025, and 0.006, respectively) and multivariate logistic regression.
3.2. Radiomic Signature Discovery
After univariate logistic regression analysis, multivariate logistic regression analysis, and LASSO regression analysis, five radiomic features from the VOI were selected to calculate the tumor area radiomic score. These features included shape_Maximum2DDiameterSlice, firstorder_Skewness, glcm_Idn, glcm_InverseVariance, and glrlm_HighGrayLevelRunEmphasis. Similarly, eight features from the ROI were chosen to determine the pleural radiomic score, encompassing shape_SurfaceArea, firstorder_Kurtosis, firstorder_Maximum, glcm_Correlation, glszm_ZoneEntropy, glszm_GrayLevelNonUniformityNormalized, glszm_GrayLevelVariance, and ngtdm_Strength. The correlation coefficients for each feature are presented in Table 2, and the LASSO screening plot for VOI and ROI are presented in Supplementary Figure 2.
3.3. Development and Validation of Nomogram
The pure clinical model (CM), constructed using four statistically distinct clinical features—NLR, CEA, cT stage, and tumor-pleural relationship—achieved an AUC value of 0.761 in the training cohort and 0.732 in the validation cohort. Furthermore, we developed three distinct radiomic models: the Radiomic nomogram model (RN), incorporating both VOI score and ROI score; the Tumor-based model (TBM), utilizing only VOI score, and the Pleura-based model (PBM), employing only ROI score; along with two combined radiomic signature models (CRS1 and CRS2), integrating CEA and NLR with either VOI score or ROI score. Their AUC values in the training group were 0.996 for RN, 0.873 for TBM, 0.994 for PBM, 0.890 for CRS1, and 0.998 for CRS2, respectively (as shown in Figure 3a and Figure 3b). In the validation group, the AUCs were 0.471 for the RN model, 0.829 for the TBM model, 0.518 for the PBM model, 0.855 for the CRS1 model, and 0.465 for the CRS2 model. The accuracy, sensitivity, and specificity values are detailed in Table 3. The nomogram calibration curves demonstrated a strong concordance between predictions and observations in the validation cohort (Figure 3c). The combined radiomic signature models (CRS1) and pure cilinical models (CM) are displayed in Figure 4.
The DeLong-test in Figure 3d and Figure 3e revealed the difference in AUCs among various models in the training and validation cohorts, respectively. Combined with Table 3, it becomes evident that the AUCs performance of PBM, CRS2, and RN within the modeling cohort is equally outstanding, markedly surpassing that of the other three. Contrarily, in the validation cohort, PBM, CRS2, and RN all exhibited poor AUCs. In contrast to the TBM model, while CRS1’s AUC wasn’t statistically excellent in both cohorts, CRS1 performed better in accuracy and sensitivity.
3.4. Clinical Usage
Decision curve analysis was employed to assess the comparative benefits of the nomogram, full thoracoscopy, and non-thoracoscopic surgical options (Figure 5a). It’s observed that when a patient's threshold probability is less than 70%, utilizing the clinical imaging combination model (CRS1) provides a greater net advantage over the TBM prediction model and the full thoracoscopy or non-thoracoscopy exploration protocol for treatment decision-making. The clinical impact curve shows that when the threshold is greater than 0.4, the occurrence risk of the CRS1 model is highly matched with the actual occurrence risk, and the clinical prediction efficiency is high (Figure 5b).
4. Discussion
To our knowledge, this study represents a pioneering effort in developing predictive models for OPM by integrating clinical and radiomics data. The combined model CRS1, which incorporates CEA, NLR, and VOI, demonstrated robust predictive accuracy and calibration in preoperatively identifying the presence or absence of OPM. The model not only provides a reliable toool for preoperative risk stratification but also offers a quantitative probability value that can guide clinical decision-making, thereby reducing the likelihood of inappropriate surgery interventions and facilitating personalized treatment strategies.
The anatomical proximity of the pleura to lung tissue facilitates the direct infiltration of lung cancer cells into the adjacent pleural area. However, during the early stages of pleural metastasis, the absence of pleural thickening or effusion often complicates detection via conventional CT imaging. Clinical observations indicate that even small tumors without lymph node metastasis may harbor occult pleural metastasis, highlighting the critical need for improved diagnostic accuracy to ensure precise staging and treatment planning. The nomogram developed in this study addresses this challenge by enabling preoperative identification of OPM, thereby preventing unnecessary surgeries and providing clinicians with actionable data for tailored therapeutic approaches.
Previous studies have underscored the significance of hematological indicators such as NLR, PLR, LMR, PT, APTT, FIB, and D-dimer in predicting occult peritoneal metastasis of gastric cancer [14]. In the context of lung cancer, Li et al. identified age under 50 years, elevated CEA levels, advanced N stage, adenocarcinoma histology, and pleural invasion as independent risk factors for OPM, achieving an AUC of 0.756 when integrating these clinical factors [15]. Our findings align with these observations, particulary regarding the predictive value of elevated CEA levels. However, other tumor markers, such as CA125 and CYFRA21-1, did not significantly contribute to OPM prediction in our cohort. Additionally, the clinical N stage, which may be influenced by age-related factors or prior infections, was excluded from our predictive model due to its discordance with pathological staging. Pathological subtypes also showed no significant statistical differences between the positive and negative groups in the modeling cohort. Furthermore, since our model is intended for preoperative prediction of OPM and pathological information is not routinely available preoperatively in clinical practice, pathological subtypes were not included as predictive factors in our model.
Zhang et al.[12] previously categorized the tumor-pleura relationship into four types to predict predict occult lymphatic metastasis in clinical stage IA lung adenocarcinoma. In our study, we further refined this classification by distinguishing between tumor in contact with the visceral pleura and those in contact with the parietal pleura. Univariate analysis revealed that tumors located closer to the lung center had a lower probability of pleural metastasis, consistent with conventional understanding. Conversely, tumors adjacent to the parieal pleura exhibited a higher likelihood of metastasis compared to those near the interlobar pleura, likely due to the larger contact area and the denser lymphatic network beneath the parietal pleura. These findings underscore the importance of tumor location in predicting metastasis potential and provide a more nuanced framework for risk stratification.
The pure clinical model in this study, which incorporated NLR, CEA, cT stage, and tumor location, achieved an AUC of 0.761, consistent with previous studies. Notably, the features included in this model are easily obtainable during routine preoperative examinations, making it a practical tool for initial OPM screening. For patients identified as high-risk by the CM, further assessment using the CRS1 model—which intergrates radiomic scores—can provied a more refined risk estimate and guide clinical decision-making.
Among the six models constructed, the PBM, CRS2, and RN models, which relied on pleural radiomics scores, exhibited significant discrepancies in AUC between the training and validation cohorts. While these models performed exceptionally well in the training cohort (AUC values approaching 1), their performance declined in the validation cohort (AUC values around 0.5). This discrepancy may reflect overfitting or challenges in the accurately delineating the thin pleural region, highlighting the need for futher optimization of pleural radiomics features. In contrast, the CRS1 model demonstrated stable performance across both cohorts, with AUC values consistently higher than those of the CM and TBM models. This stability underscores the clinical utility of CRS1 as a reliable predictive tool for OPM.
The radiomics features included in the VOI score, such as "shape_Maximum2DDiameterSlice," "GLCM-Idn," "GLCM-InverseVariance," and "glrlm_HighGrayLevelRunEmphasis," provied valuable insights into tumor characteristics. For instance, "shape_Maximum2DDiameterSlice" reflects tumor size and is closely associated with clinical T stage. A larger maximum diameter is associated with a more advanced tumor stage and a higher likelihood of metastasis. The features "GLCM-Idn" and "GLCM-InverseVariance" measure tumor homogeneity, which may correlate with malignancy and metastatic potential. Similarly, "glrlm_HighGrayLevelRunEmphasis" captures high-intensity regions within the tumor, potential indicative of aggressive tumor behavior. Therefore, these features collectively contribute to the predictive power of the VOI radiomics score.
This study has several limitations. First, its retrospective design may introduce inherent biases and confounding factors. Second, the low detection rate of OPM (4%) in our study resulted in an imbalance between positive and negative cases, which may affected model performance. Future studies should validate these findings in larger, multicenter cohorts to ensure generalizability. Additionally, the challenges associated with delineating the pleural region highlight the need for improved imaging techniques and automated segmentation methods to enhance the accuracy of pleural radiomics features.
5. Conclusion
In conclusion, our study demonstrates the potential of integarting clinical and radiomics data to predict OPM in lung cancer patients. The CRS1 model, in particular, offers a robust and practical tool for preoperative risk assessment, with the potential to improve clinical outcomes by guiding personalized treatment strategies. Future research should focus on refining radiomics features, validating models in diverse populations, and exploring the integration of additional biomarkers to further enhance predictive accuracy.
Supplementary Materials
The following supporting information can be downloaded at the website of this paper posted on Preprints.org. Supplementary Figure 1. An example image is shown using ITK-SNAP software to outline VOI (red) and ROI (yellow). Supplementary Figure 2. LASSO logistic regression on features from the primary tumor (A, B) and pleura (C, D). The LASSO regression can reduce the feature dimension by shrinking the coefficients of some features to zero and further select key features.
Author Contributions
Conceptualization: Feng Yang and Guanchao Jiang.; Data curation: Xiaoyi Zhao and Heng Zhao; Formal analysis: Xiaoyi Zhao, Heng Zhao, Kongxu Dai and Xiangyu Zeng; Funding acquisition: Feng Yang; Methodology and Project administration: Feng Yang and Yun Li; Resources and Supervision: Yun Li, Feng Yang, and Guanchao Jiang; Visualization: Xiaoyi Zhao and Heng Zhao; Original draft, Review & editing: Xiaoyi Zhao, Heng Zhao, Kongxu Dai and Xiangyu Zeng; All authors have read and approved the final manuscript.
Funding
This study has received funding by the Research and Development Foundation of Peking University People's Hospital (ID:RDL 2022-06).
Availability of data and materials
The datasets used and analyzed during the current study are available from the corresponding author on reasonable request.
Ethics approval and consent to participate
This retrospective study was approved by the Ethical Committee of Peking University People’s Hospital. The requirement for informed consent was waived.
Competing Interests
The authors declare that they have no competing interests.
References
- Bray F, Laversanne M, Sung H, Ferlay J, Siegel RL, Soerjomataram I, Jemal A. Global cancer statistics 2022: GLOBOCAN estimates of incidence and mortality worldwide for 36 cancers in 185 countries. CA Cancer J Clin. 2024 May-Jun;74(3):229-263. Epub 2024 Apr 4. [CrossRef] [PubMed]
- Rami-Porta R, Crowley J, et al. The IASLC Lung Cancer Staging Project: Proposals for the Revisions of the T Descriptors in the Forthcoming Eighth Edition of the TNM Classification for Lung Cancer [J]. J Thorac Oncol, 2015,10(7):990-1003.
- Yun JK, Kim MA, Choi CM, Choi SH, Kim YH, Kim DK, Park SI, Kim HR. Surgical Outcomes after Pulmonary Resection for Non-Small Cell Lung Cancer with Localized Pleural Seeding First Detected during Surgery. Thorac Cardiovasc Surg. 2018 Mar;66(2):142-149. Epub 2015 Dec 15. [CrossRef] [PubMed]
- Ren YJ, She YL, Dai CY, Jiang GN, Fei K, Chen C. Primary tumour resection showed survival benefits for non-small-cell lung cancers with unexpected malignant pleural dissemination. Interact Cardiovasc Thorac Surg. 2016 Mar;22(3):321-6. Epub 2015 Dec 24. [CrossRef] [PubMed] [PubMed Central]
- Li S, Zhang S, Huang M, Ma Y, Yang Y. Management of occult malignant pleural disease firstly detected at thoracotomy for non-small cell lung cancer patients. J Thorac Dis. 2017 Oct;9(10):3851-3858. [CrossRef] [PubMed] [PubMed Central]
- Mordant P, Arame A, Foucault C, Dujon A, Le Pimpec Barthes F, Riquet M. Surgery for metastatic pleural extension of non-small-cell lung cancer. Eur J Cardiothorac Surg. 2011 Dec;40(6):1444-9. Epub 2011 Apr 23. [CrossRef] [PubMed]
- Kumar A, Xu B, Srinivasan D, Potter AL, Raman V, Lanuti M, Yang CJ, Auchincloss HG. Long-Term Survival of American Joint Committee on Cancer 8th Edition Staging Descriptors for Clinical M1a Non-Small Cell Lung Cancer. Chest. 2024 Mar;165(3):725-737. Epub 2023 Aug 5. [CrossRef] [PubMed]
- Choi W, Oh JH, Riyahi S, et al. Radiomics analysis of pulmonary nodules in low-dose CT for early detection of lung cancer. Med Phys, 2018, 45(4): 1537-1549.
- Trebeschi S, Drago SG, Birkbak NJ, et al. Predicting response to cancer immunotherapy using noninvasive radiomic biomarkers. Ann Oncol, 2019, 30(6): 998-1004.
- Huang Y, Liu Z, He L, et al. Radiomics Signature: A potential biomarker for the prediction of disease-free survival in early-stage (Ⅰ or Ⅱ) non-small cell lung cancer. Radiology, 2016, 281(3): 947-957.
- Yang X, Pan X, Liu H, Gao D, He J, Liang W, Guan Y. A new approach to predict lymph node metastasis in solid lung adenocarcinoma: a radiomics nomogram. J Thorac Dis. 2018 Apr;10(Suppl 7):S807-S819. [CrossRef] [PubMed] [PubMed Central]
- Zhang C, Wang L, Cai X, Li M, Sun D, Wang P. Tumour-pleura relationship on CT is a risk factor for occult lymph node metastasis in peripheral clinical stage IA solid adenocarcinoma. Eur Radiol. 2023 May;33(5):3083-3091. Epub 2023 Feb 18. [CrossRef] [PubMed]
- ttp:/pyradiomics.readthedocs.io.Accessed 1Nov 2024.
- Yang C, Yang Y, Huang X, Li H, Cheng H, Tong S, Zheng Y. A Nomogram Based on Clinicopathologic Features and Preoperative Hematology Parameters to Predict Occult Peritoneal Metastasis of Gastric Cancer: A Single-Center Retrospective Study. Dis Markers. 2020 Dec 9;2020:1418978. [CrossRef] [PubMed] [PubMed Central]
- Li S, Zhang S, Huang M, Ma Y, Yang Y. Management of occult malignant pleural disease firstly detected at thoracotomy for non-small cell lung cancer patients. J Thorac Dis. 2017 Oct;9(10):3851-3858. [CrossRef] [PubMed] [PubMed Central]
Figure 1.
Experimental design flowchart. LASSO,least absolute shrinkage and selection operator; TBM,tumor-based model; PBM, pleura-based model; RN,radiomic nomogram; CM, clinical model; CRS1, combined radiomic signature 1;CRS2,combined radiomic signature 2.
Figure 1.
Experimental design flowchart. LASSO,least absolute shrinkage and selection operator; TBM,tumor-based model; PBM, pleura-based model; RN,radiomic nomogram; CM, clinical model; CRS1, combined radiomic signature 1;CRS2,combined radiomic signature 2.
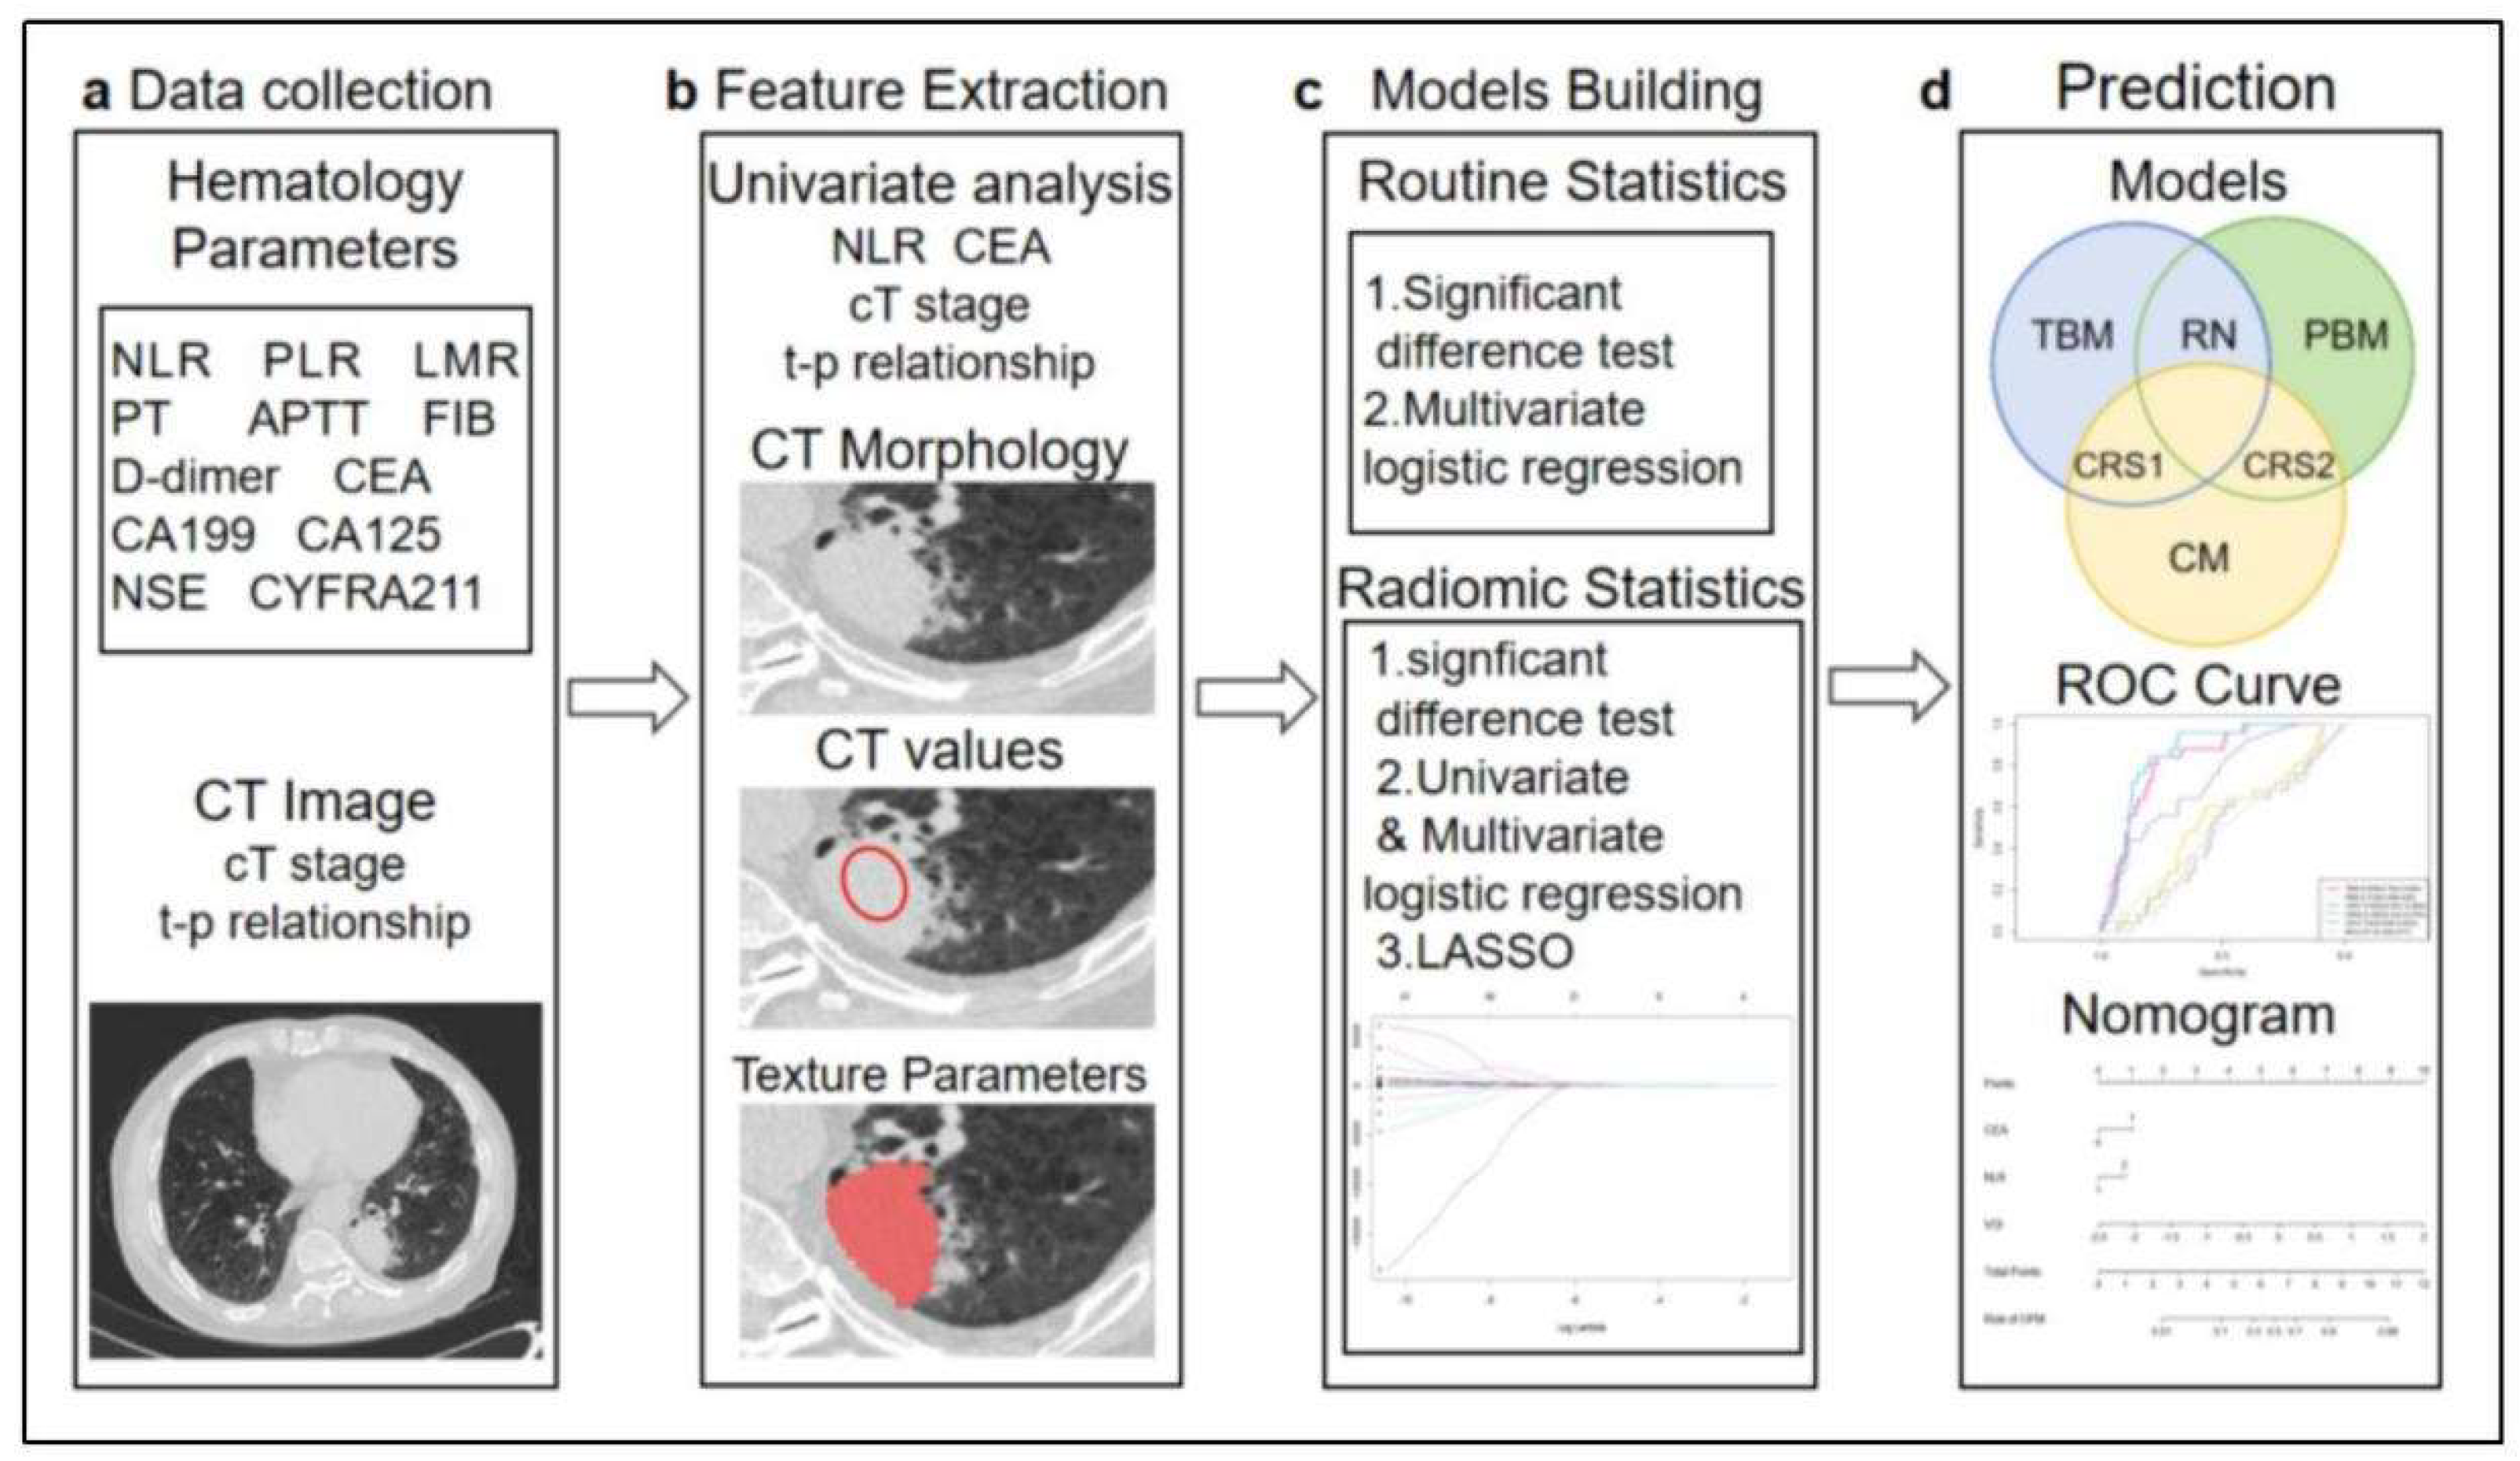
Figure 2.
Schematic and example of type 1-5 tumour-pleura relationships. Type 1,the tumor was located inner the lung unrelated to the pleura. Type 2,the tumour was not in contact with the pleura, and one or more linear or striated pleural tags were visible. Type 3, the tumour was not in contact with the pleura, and one or more linear or striated pleural tags with soft tissue component at the pleural end were visible. Type 4, the tumour was in contact with the interlobar pleura. Type 5,the tumour was in contact with the parietal pleura.
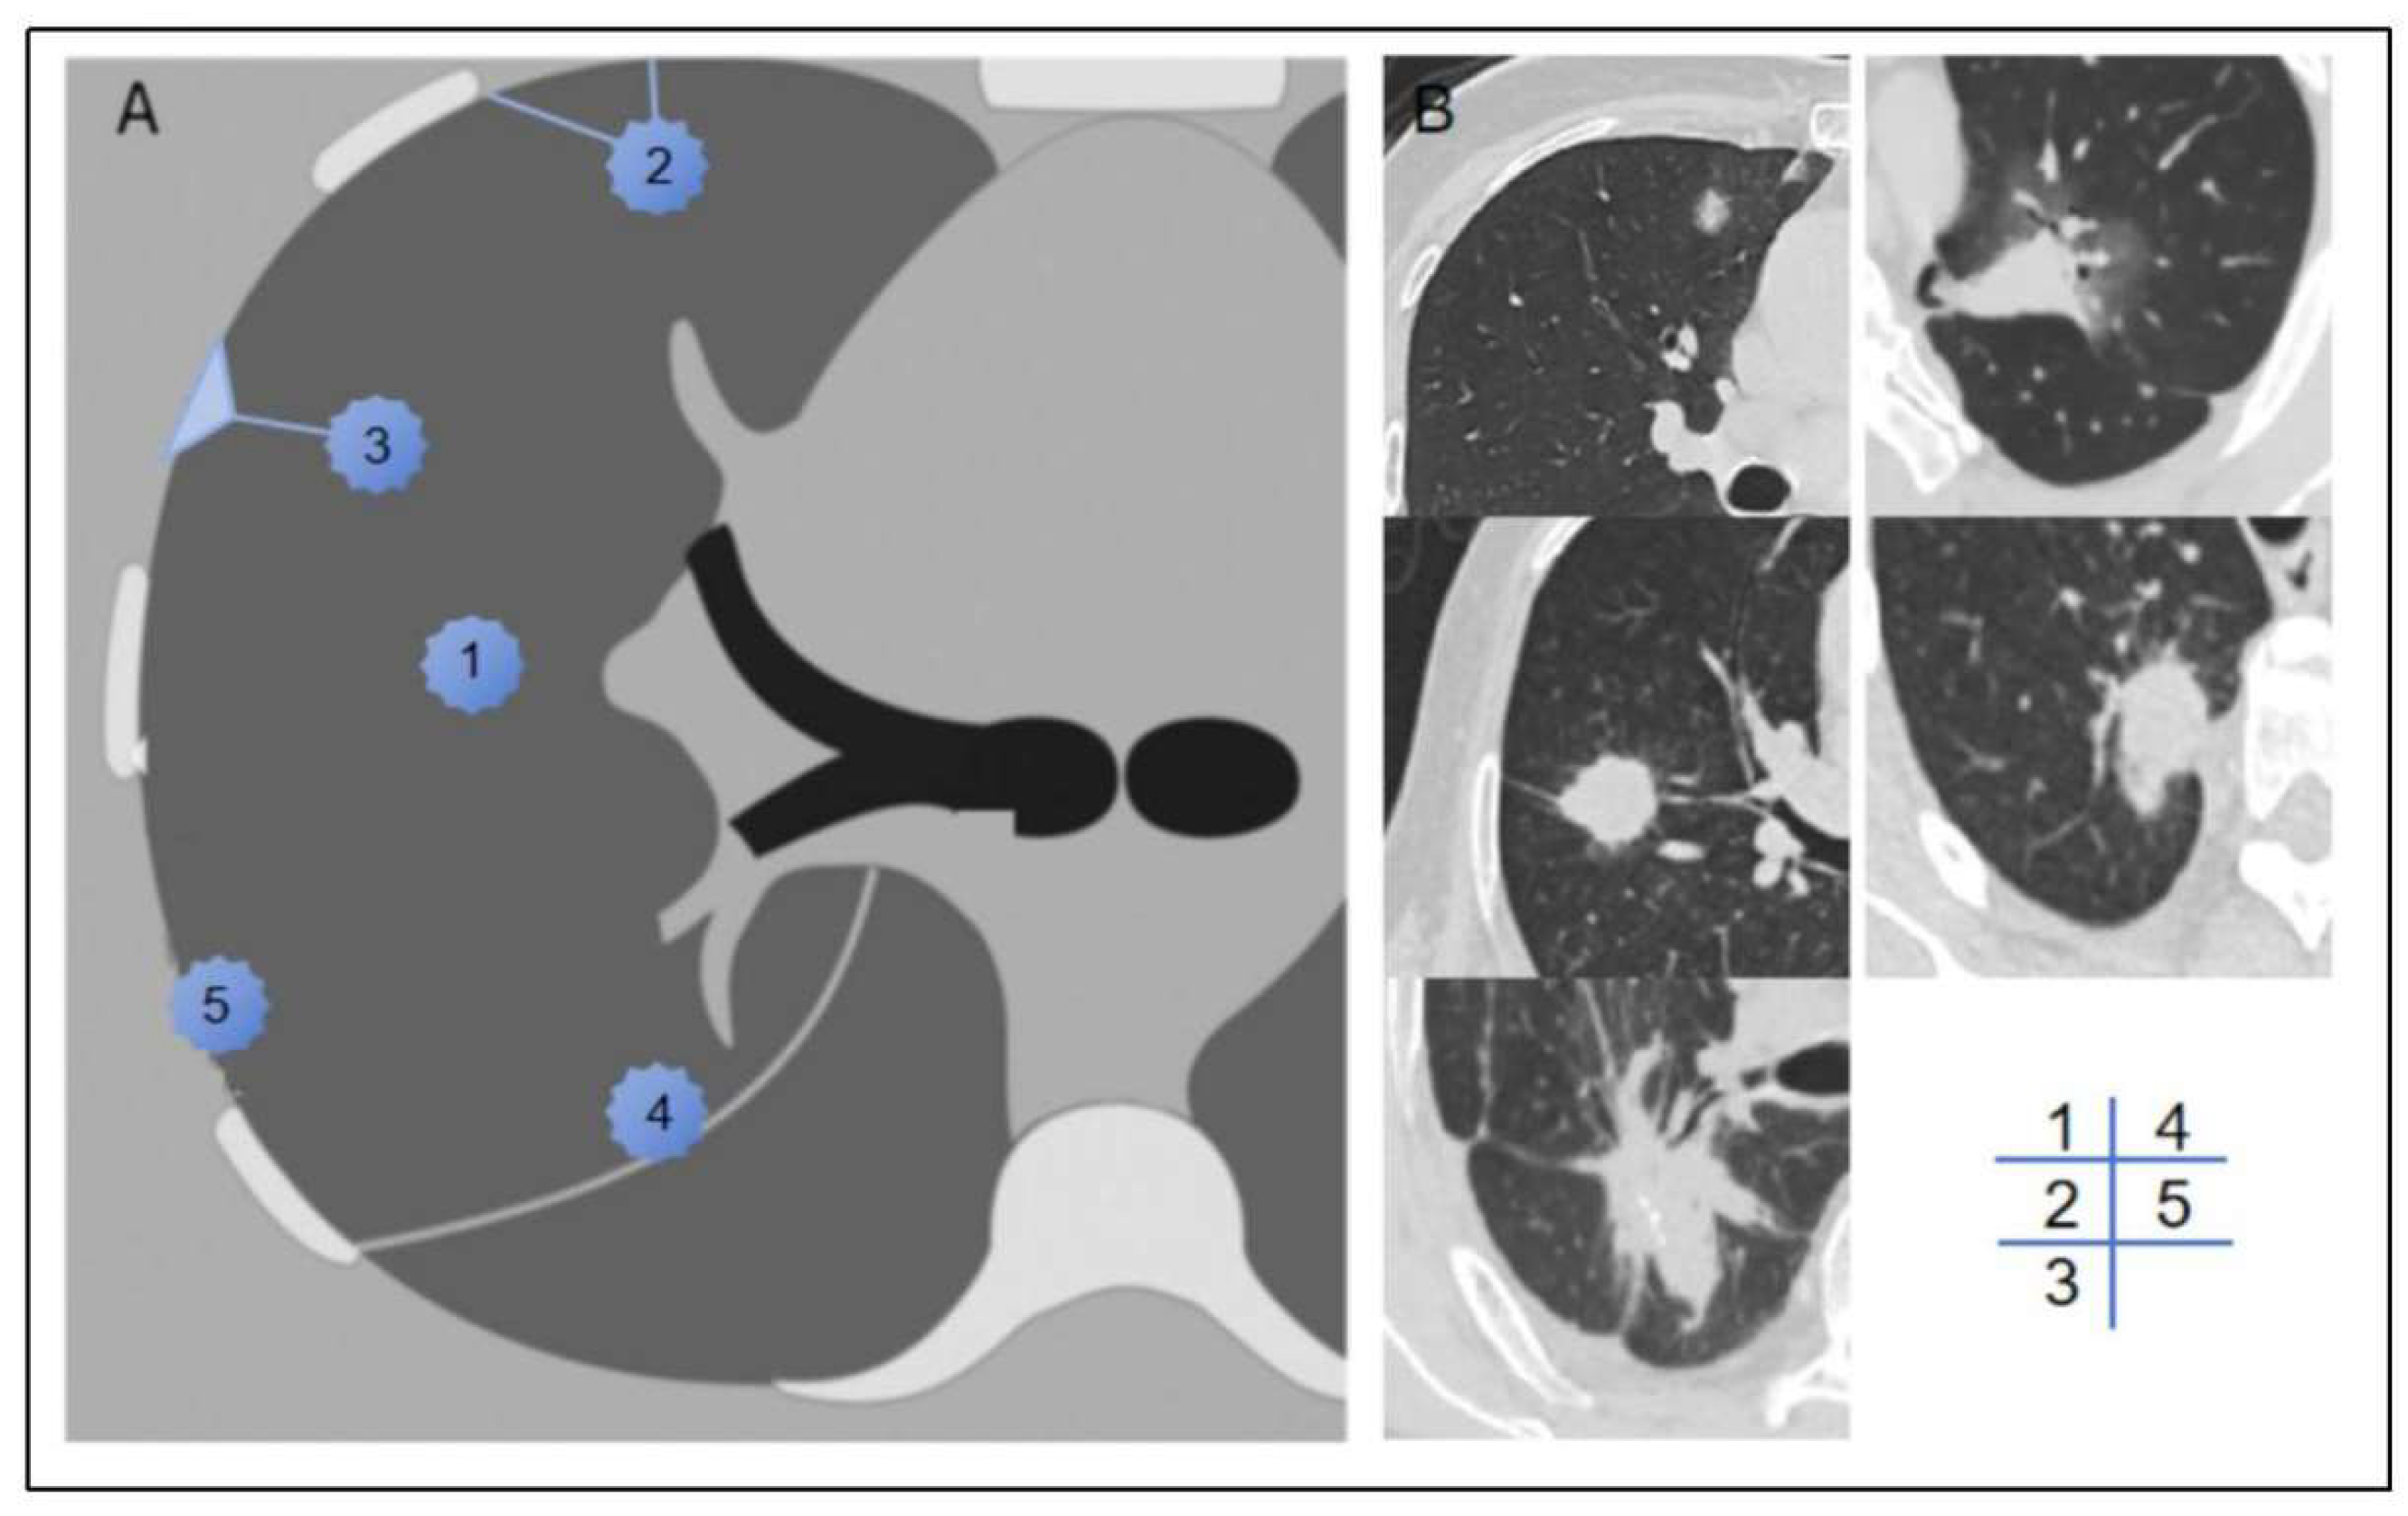
Figure 3.
Receiver operating characteristic curves of 6 predictive models in 3a training and 3b validation cohort. 3c Calibration curves for radiomic nomogram in validation cohort.Delong-test results between each two models in 3d training and 3e validation cohort. Yellow boxes represent p values < 0.05.
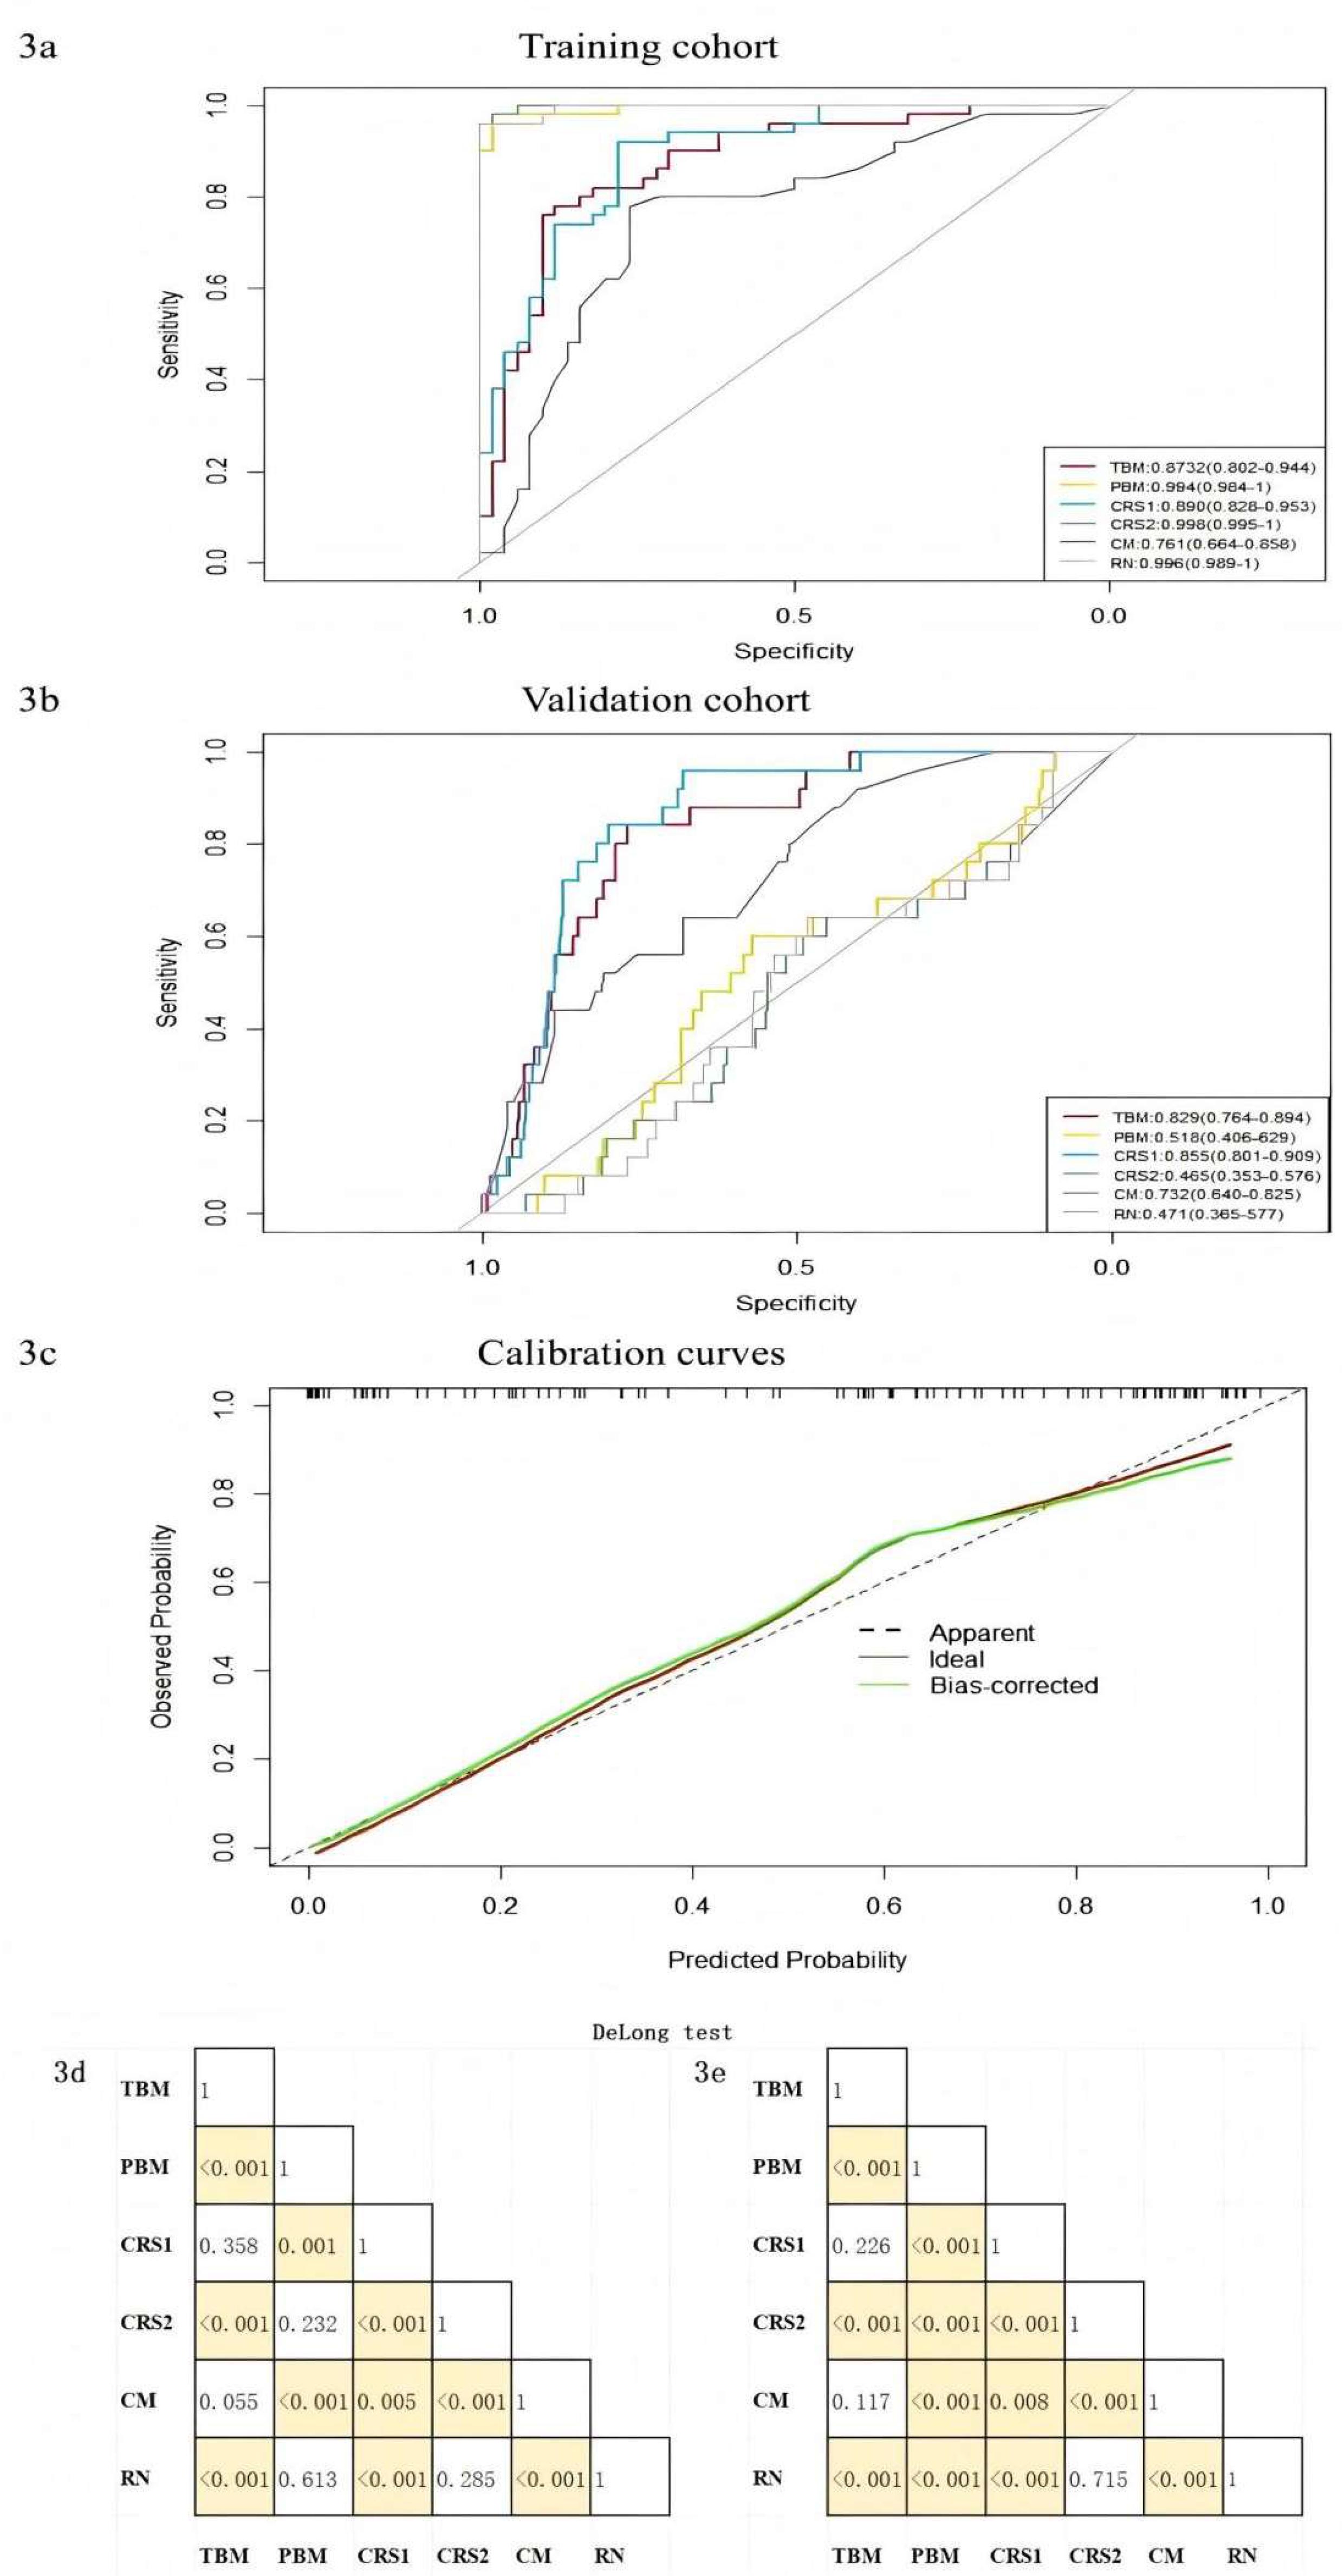
Figure 4.
Visualization of the CRS1 nomogram (4a) and CM nomogram(4b).CRS1,combined radiomic signature 1; CM, clinical model.
Figure 4.
Visualization of the CRS1 nomogram (4a) and CM nomogram(4b).CRS1,combined radiomic signature 1; CM, clinical model.
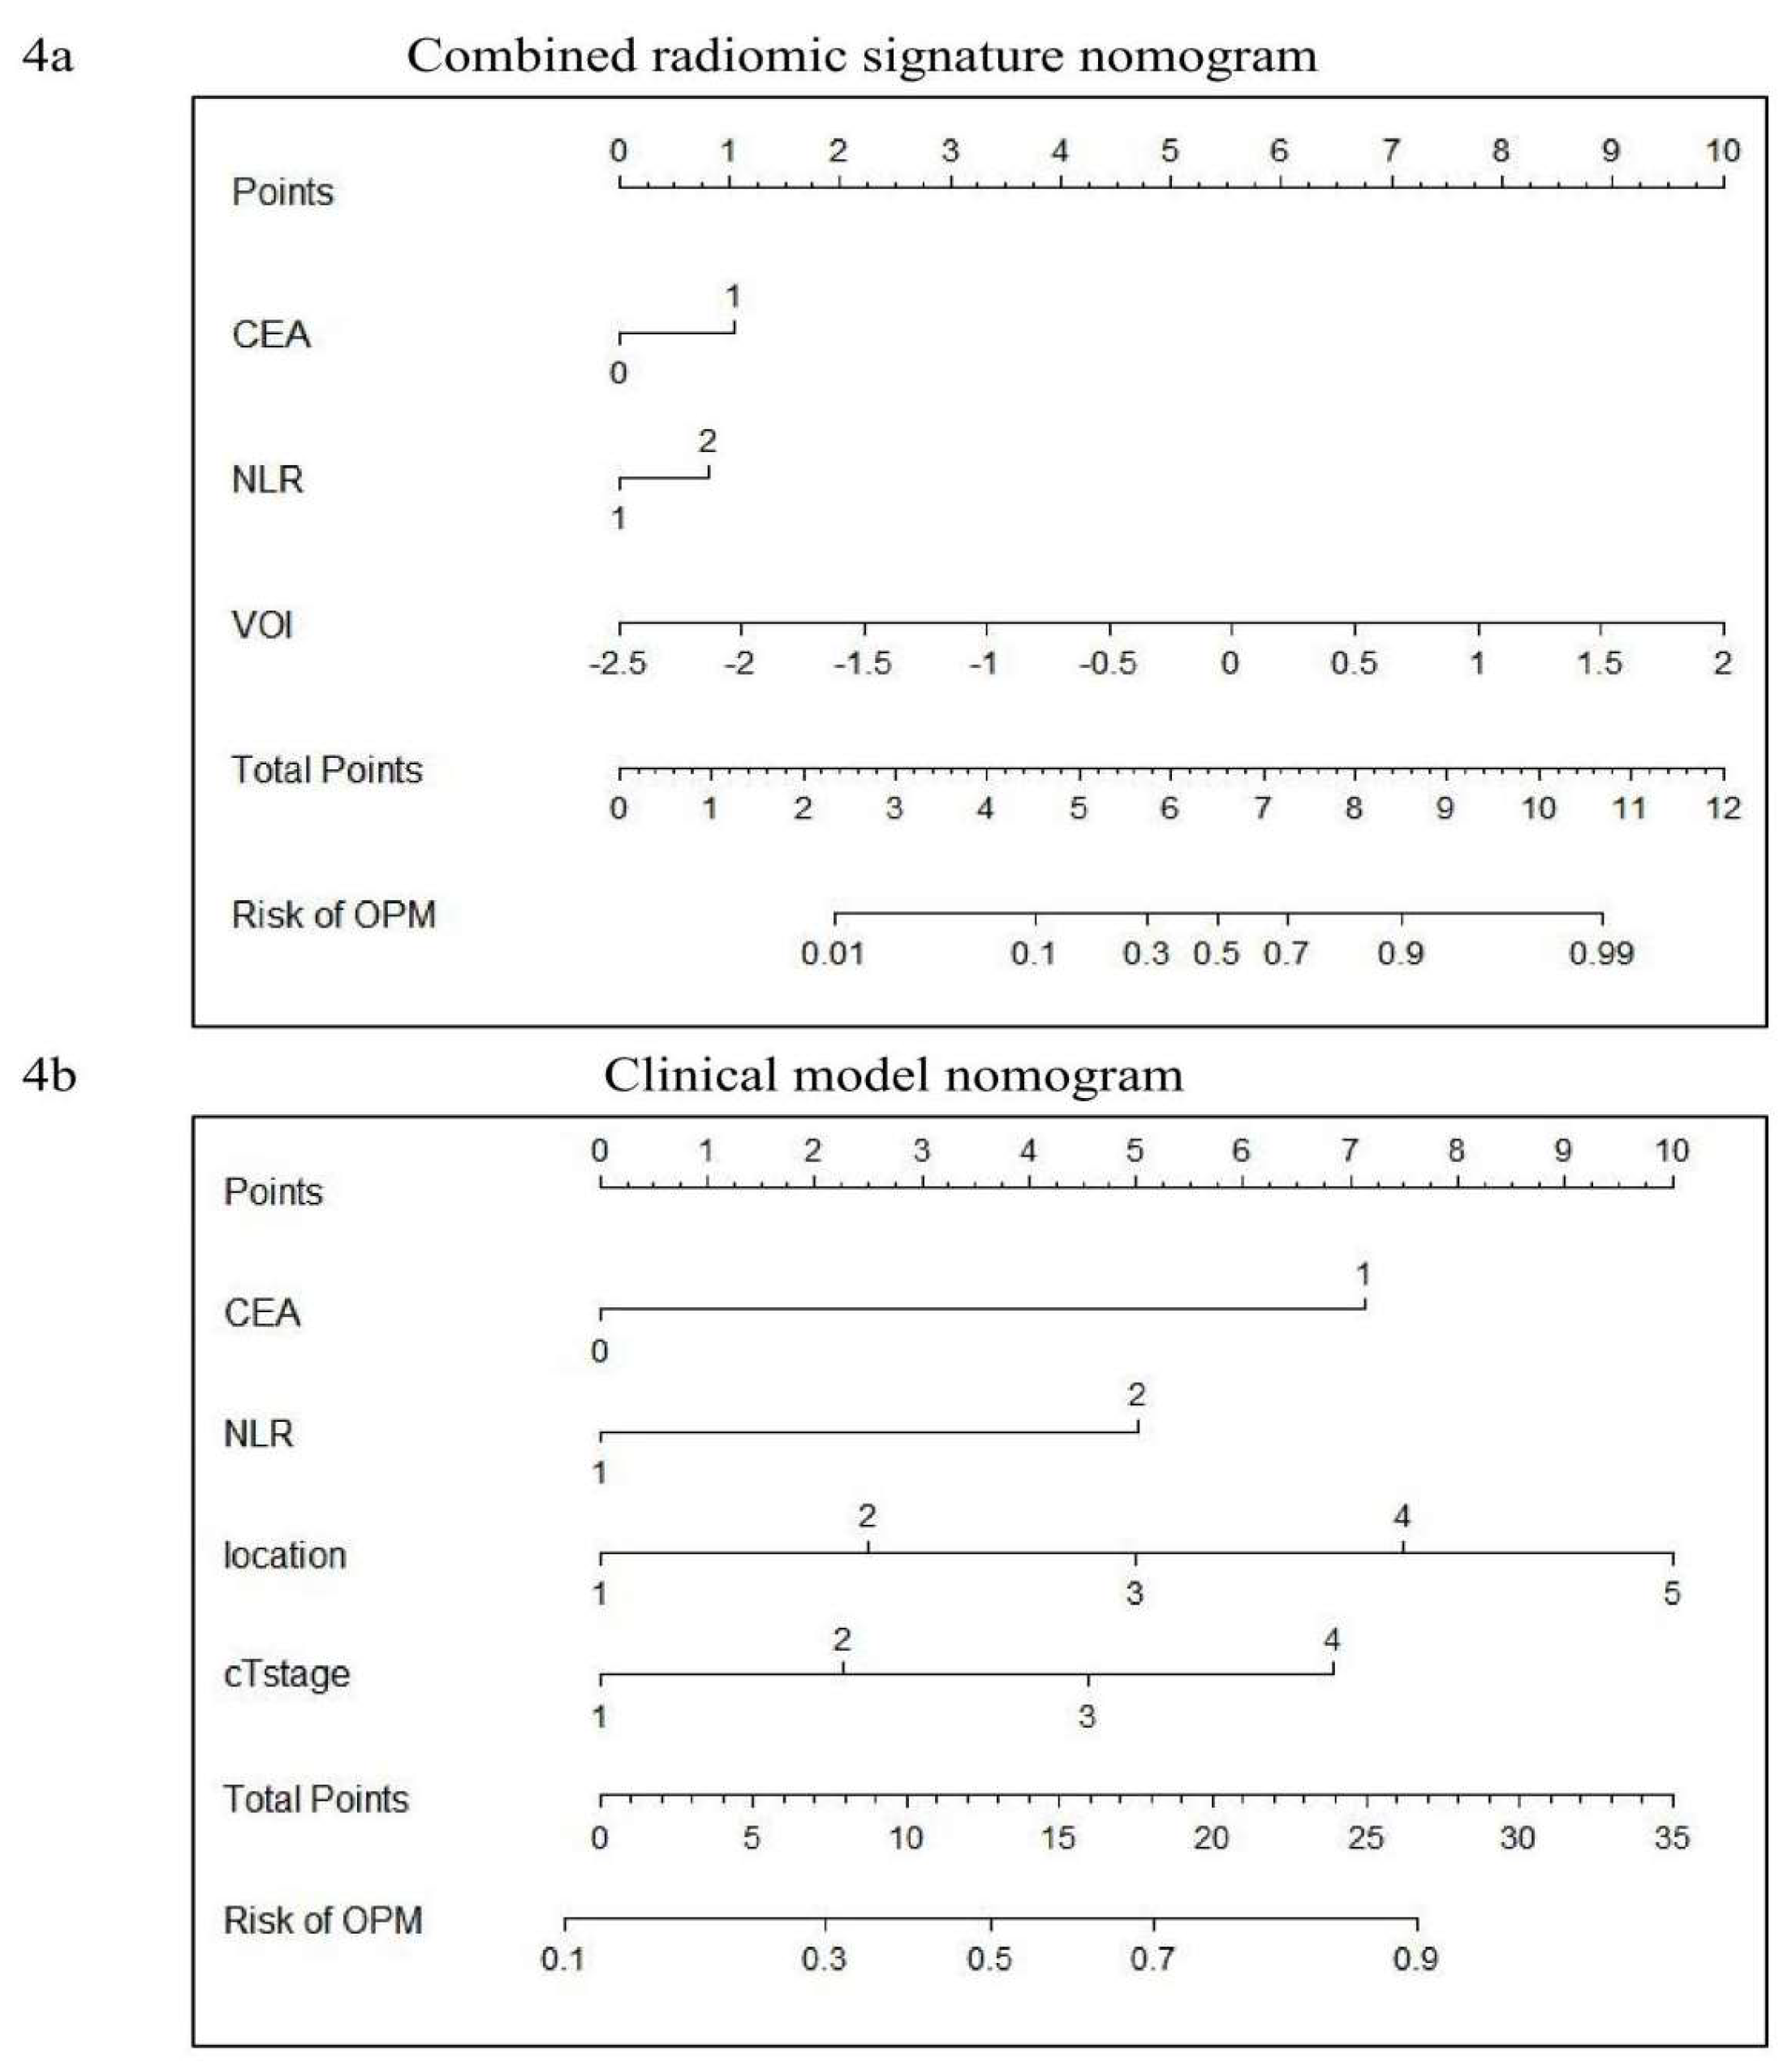
Figure 5.
a Decision curve analysis of the CRS1 model and CM model. b Clinical impact curve of the CRS1 model.
Figure 5.
a Decision curve analysis of the CRS1 model and CM model. b Clinical impact curve of the CRS1 model.
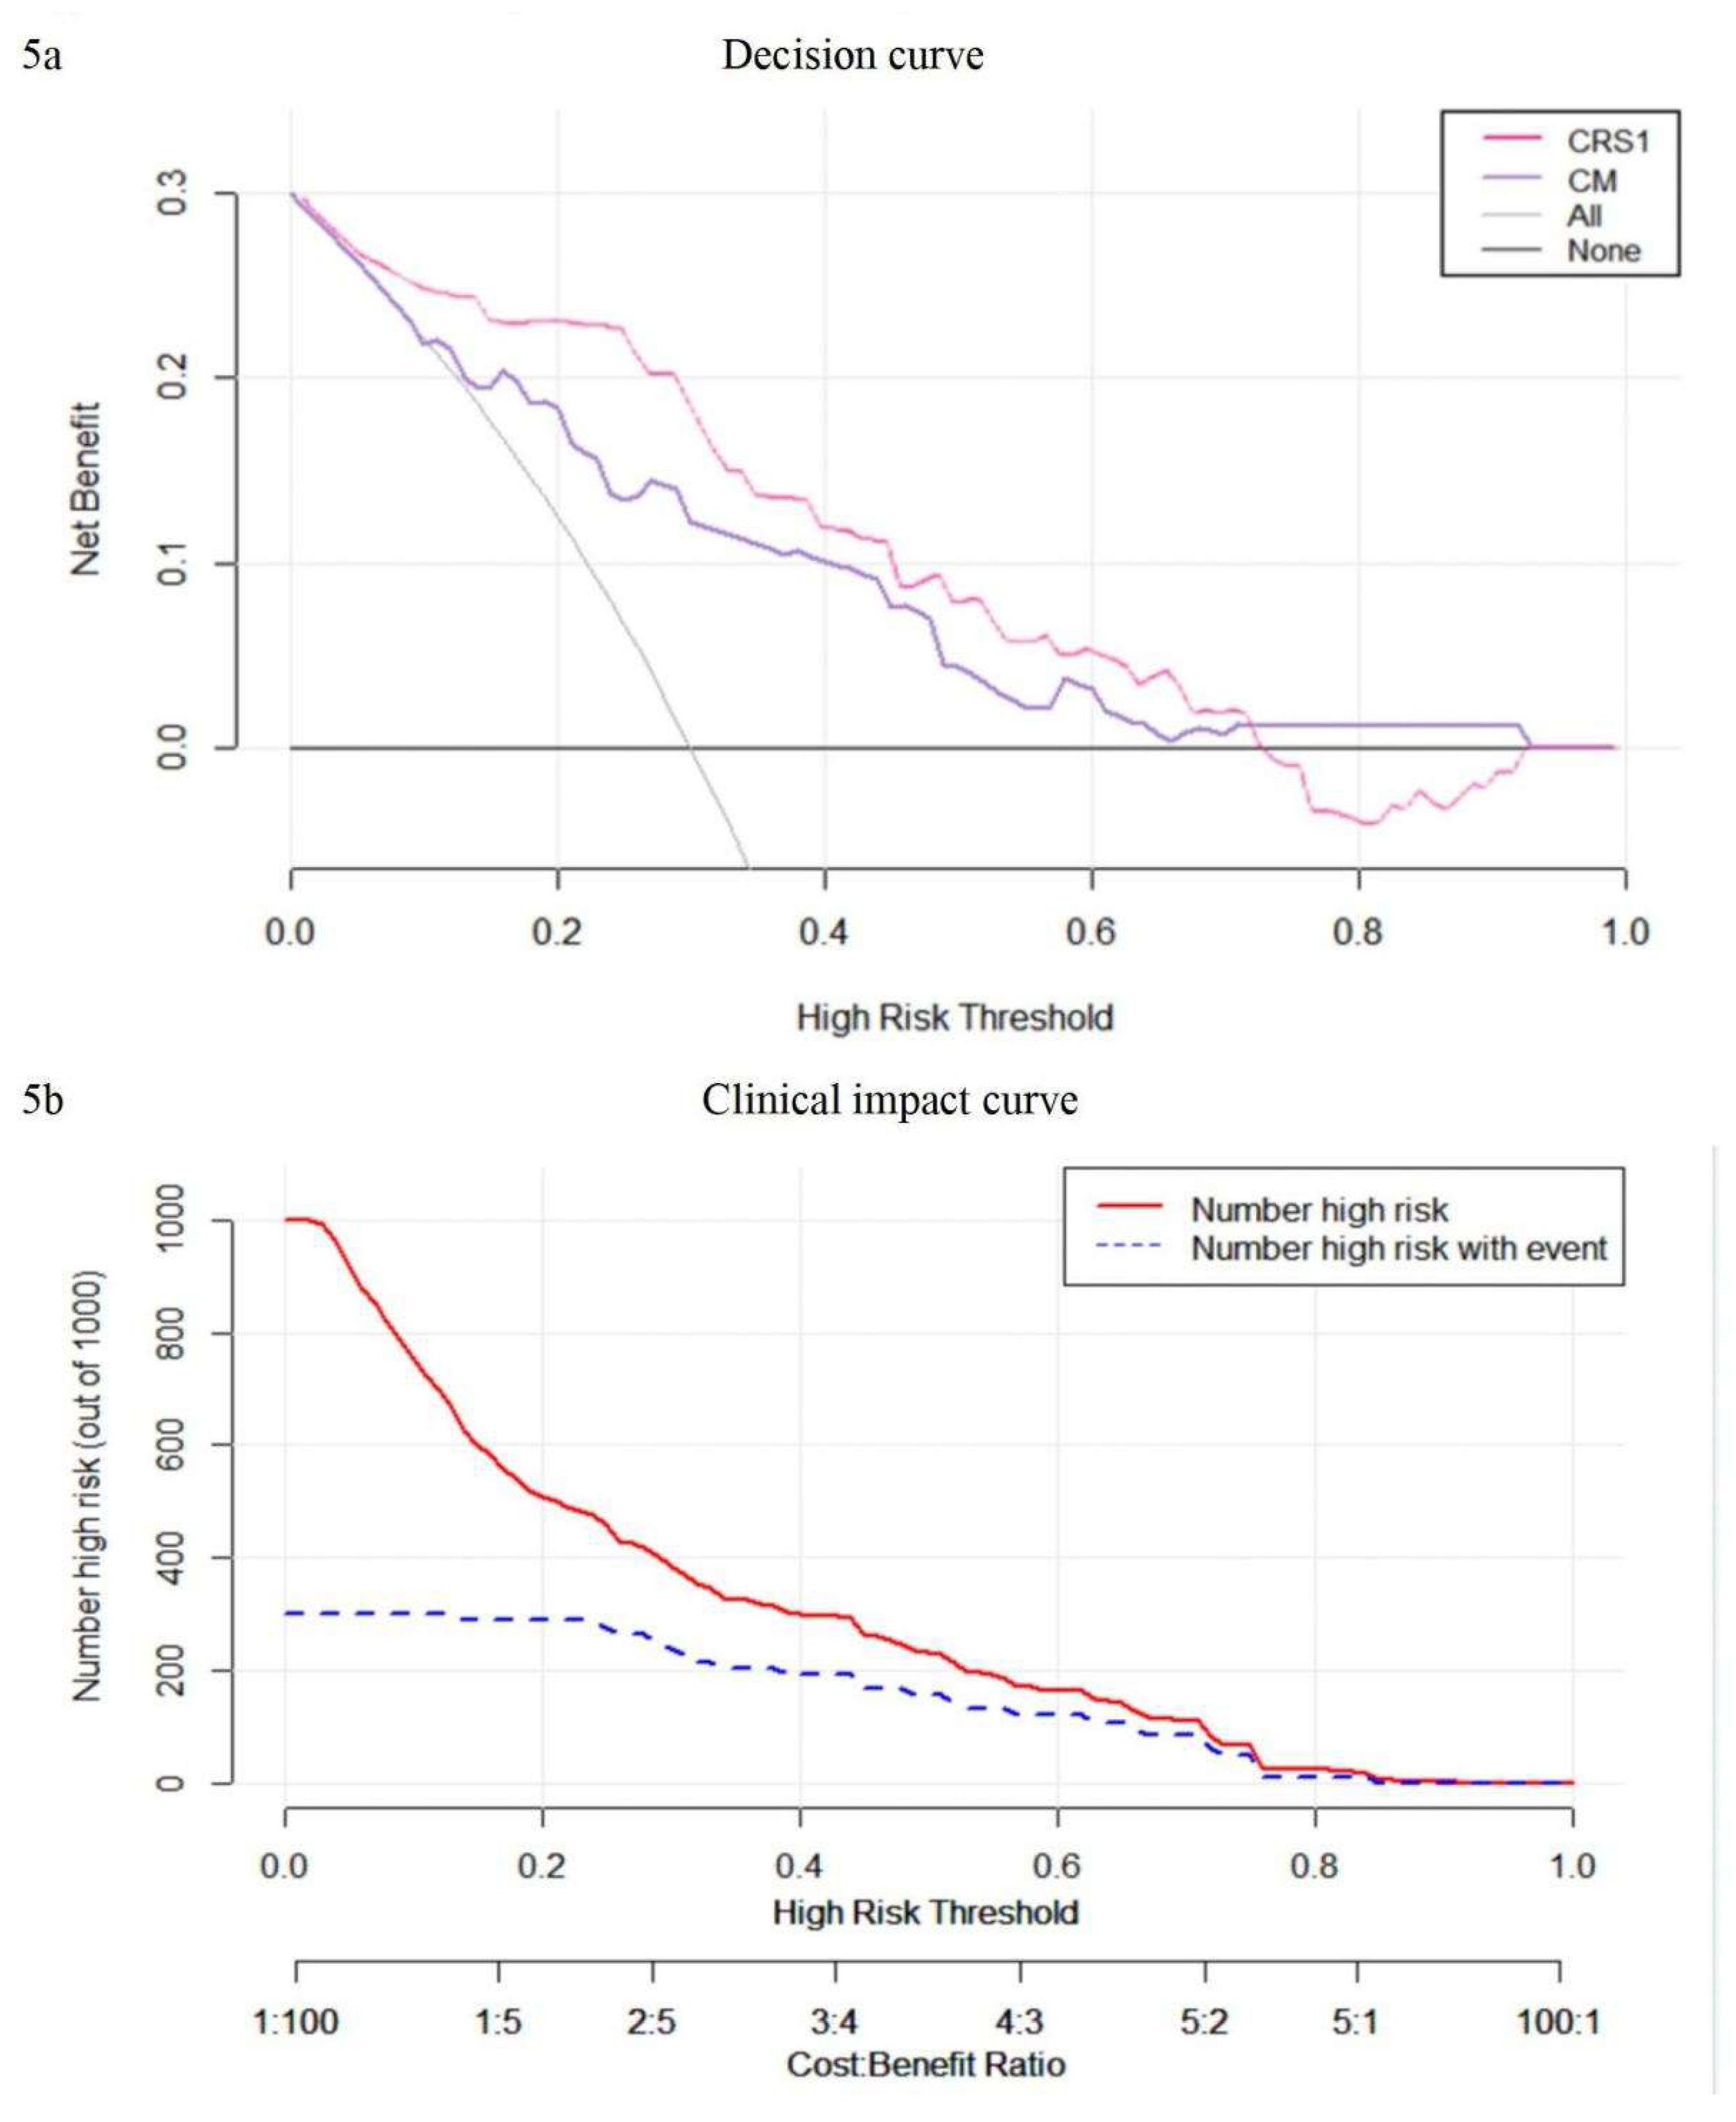

Table 1.
Univariate logistic regression and Multiple logstic regression of the clinical characteristics of training cohort.
Table 1.
Univariate logistic regression and Multiple logstic regression of the clinical characteristics of training cohort.
| Feature | OPM+ | OPM- | P value | Feature | OPM+ | OPM- | P value | ||
| Age | 0.556 | Sex | 0.316 | ||||||
| <60 | 28 | 25 | male | 20 | 25 | ||||
| ≥60 | 22 | 25 | female | 30 | 25 | ||||
| Smoking history | 0.133 | BMI | 24.30±3.00 | 24.77±3.69 | 0.489 | ||||
| Yes | 38 | 31 | |||||||
| No | 12 | 19 | |||||||
| NLR | 0.017* | LMR | 0.446 | ||||||
| <2 | 17 | 29 | <5 | 42 | 39 | ||||
| ≥2 | 33 | 21 | ≥5 | 8 | 11 | ||||
| PLR | 0.139 | PT | 0.566 | ||||||
| <165 | 37 | 43 | <12s | 44 | 42 | ||||
| ≥165 | 13 | 7 | ≥12s | 6 | 8 | ||||
| APTT | 0.251 | FIB | 0.421 | ||||||
| <28s | 35 | 40 | <3g/L | 26 | 30 | ||||
| ≥28s | 15 | 10 | ≥3g/L | 24 | 20 | ||||
| CA199 | 0.123 | D-dimer | 0.374 | ||||||
| normal | 42 | 47 | <0.5mg/L | 16 | 12 | ||||
| rise | 8 | 3 | ≥0.5mg/L | 34 | 38 | ||||
| CEA | 0.003* | NSE | 0.207 | ||||||
| normal | 23 | 38 | normal | 43 | 38 | ||||
| rise | 27 | 12 | rise | 7 | 12 | ||||
| CA125 | 0.078 | Histological subtype | 0.775 | ||||||
| normal | 41 | 47 | Adenocarinoma | 47 | 46 | ||||
| rise | 9 | 3 | Squamous cell carcinoma | 2 | 3 | ||||
| CYFRA21-1 | 0.509 | Adenosquamous carcinoma | 1 | 1 | |||||
| normal | 37 | 34 | |||||||
| rise | 13 | 16 | |||||||
| Tumour–pleura relationship | 0.006* | cT stage | 0.025* | ||||||
| type1 | 3 | 5 | 1 | 17 | 33 | ||||
| type2 | 5 | 14 | 2 | 16 | 15 | ||||
| type3 | 7 | 14 | 3 | 3 | 2 | ||||
| type4 | 19 | 6 | 4 | 14 | 0 | ||||
| Type5 | 16 | 11 | |||||||
| Estimate | Std.Error | Z value | Pr(|Z|) | ||||||
| (Intercept) | -3.5573 | 1.0261 | -3.467 | <0.001 | |||||
| cT stage | 0.3598 | 0.3369 | 2.001 | 0.042 | |||||
| Tumor-pleura relationship | 0.3947 | 0.1830 | 2.156 | 0.031 | |||||
| CEA | 1.1273 | 0.4616 | 2.442 | 0.015 | |||||
| NLR | 0.7919 | 0.4582 | 1.970 | 0.047 | |||||
OPM+, with occult pleural metastasis; OPM-, without occult pleural metastasis; LMR: lymphocyte-to-monocyte ratio; NLR: neutrophil-to-lymphocyte ratio; PLR: platelet-to-lymphocyte ration; CEA: carcinoembryonic antigen; PT: prothrombin time; APTT: activated partial thromboplastin time; FIB: fibrinogen; CEA: carcinoma embryonic antigen; CA199: carbohydrate antigen 19-9; CA125: carbohydrate antigen 125; CYFRA21-1:human CYFRA21-1 antigen;NSE:neuron specific enolase.
Table 2.
Correlation coefficients of radiomic features.
| Variable of VOI | coef |
| (Intercept) | -16.93664 |
| shape_Maximum2DDiameterSlice | 0.000979729 |
| firstorder_Skewness | -0.2107765 |
| glcm_Idn | 16.18972 |
| glcm_InverseVariance | 2.98917 |
| glrlm_HighGrayLevelRunEmphasis | 0.000280008 |
| Variable of ROI | coef |
| (Intercept) | -23.359305349 |
| shape_SurfaceArea | 0.001080420 |
| firstorder_Kurtosis | 1.197099060 |
| firstorder_Maximum | 0.003960438 |
| glcm_Correlation | 10.638743549 |
| glszm_GrayLevelNonUniformityNormalized | -1.595754622 |
| glszm_GrayLevelVariance | 0.049673685 |
| glszm_ZoneEntropy | 0.480000350 |
| ngtdm_Strength | 0.782355538 |
Table 3.
Performance of different predictive models.
| Models | Training cohort | Validation cohort | ||||||
| AUC(95%Cl) | ACC | SPE | SEN | AUC(95%Cl) | ACC | SPE | SEN | |
| RN(VOI+ROI) | 0.996(0.989-1) | 0.988 | 0.998 | 0.978 | 0.471(0.365-0.577) | 0.633 | 0.483 | 0.640 |
| CRS1(CEA+NLR+VOI) | 0.890(0.828-0.953) | 0.850 | 0.780 | 0.920 | 0.855(0.801-0.909) | 0.947 | 0.679 | 0.960 |
| CRS2(CEA+NLR+ROI) | 0.998(0.995-1) | 0.980 | 0.980 | 0.980 | 0.465(0.353-0.576) | 0.637 | 0.452 | 0.640 |
| TBM(VOI) | 0.873(0.802-0.944) | 0.830 | 0.900 | 0.760 | 0.829(0.764-0.894) | 0.837 | 0.767 | 0.840 |
| PBM(ROI) | 0.994(0.984-1) | 0.980 | 0.980 | 0.980 | 0.518(0.406-0.629) | 0.596 | 0.517 | 0.600 |
| CM(CEA+NLR+cTstage+T-P relationship) | 0.761(0.644-0.858) | 0.770 | 0.760 | 0.780 | 0.732(0.640-0.825) | 0.533 | 0.806 | 0.520 |
AUC, Area under the cruve; Cl, confidence interval; ACC, accuracy; SPE, specificity; SEN, sensitivity.
Disclaimer/Publisher’s Note: The statements, opinions and data contained in all publications are solely those of the individual author(s) and contributor(s) and not of MDPI and/or the editor(s). MDPI and/or the editor(s) disclaim responsibility for any injury to people or property resulting from any ideas, methods, instructions or products referred to in the content. |
© 2025 by the authors. Licensee MDPI, Basel, Switzerland. This article is an open access article distributed under the terms and conditions of the Creative Commons Attribution (CC BY) license (http://creativecommons.org/licenses/by/4.0/).
Copyright: This open access article is published under a Creative Commons CC BY 4.0 license, which permit the free download, distribution, and reuse, provided that the author and preprint are cited in any reuse.


