
Submitted:
22 January 2026
Posted:
23 January 2026
You are already at the latest version
Abstract
Alzheimer’s disease (AD) is an aging-associated neurodegenerative disorder in which dysregulated neuroinflammation drives disease progression. Although long noncoding RNAs (lncRNAs) are increasingly implicated in AD, their mechanistic roles remain poorly defined. Here, we identified a novel lncRNA termed LIMASI (LncRNA Inflammation and Mucous associated, Antisense to ICAM1), that is linked with AD-associated neuroinflammation. LIMASI expression is significantly elevated in postmortem AD brain tissues and in the 3xTg-AD mouse model by qPCR and RNA fluorescence in situ hybridization, and its upregulation correlated with increased β-amyloid plaque burden, tau hyperphosphorylation, and heightened neuroinflammatory activation. Cell-type–specific analyses demonstrated inflammation-inducible LIMASI expression in astrocytes and microglia. In an in vitro model of AD-associated neuroinflammation, viral-mimetic poly(I:C) challenge of amyloid precursor protein (APP)–overexpressing neuroblastoma cells elicited coordinated induction of LIMASI and key inflammatory mediators. Mechanistically, computational RNA–RNA interaction modeling predicted multiple energetically favorable binding sites for AD-associated inflammatory microRNAs (miR-1915-3p, miR-122-5p, miR-155-5p, and miR-150-5p), supporting a competing endogenous RNA (ceRNA) model in which LIMASI sequesters miRNAs to modulate neuroinflammatory gene networks. Together, these data identify LIMASI as a putative ceRNA strongly linked to AD-related neuroinflammation and suggest that LIMASI represents a promising therapeutic target for modulating neuroinflammatory signaling and slowing AD-associated neurodegeneration.
Keywords:
Alzheimer’s disease (AD)
; long noncoding RNAs (lncRNAs)
; neuroinflammation
; competing endogenous RNA (ceRNA)
; microRNAs (miRNAs)
1. Introduction
Alzheimer’s disease (AD) is the most common neurodegenerative disease among the aging population [1]. Although the neuropathological features and genetic determinants for familial cases of AD (FAD) are relatively well characterized, the molecular basis for sporadic late-onset Alzheimer’s disease (LOAD), the most prevalent form, remains poorly understood. Clinically, AD is marked by progressive decline in cognitive function, collectively termed as AD-related dementia (ADRD) that severely impairs the ability to perform day-to-day activities [2]. With more than 25 million people affected worldwide by dementia, where most suffer from ADRD, a deeper understanding of AD pathophysiology is essential to reduce disease risk and delay or suppress the clinical onset of AD [3].
AD exhibits a strong genetic basis with heritability estimates approaching 80% [4]. However, known genetic variants in the four established AD genes namely amyloid precursor protein (APP), presenilin (PS) 1, PS2, ApoE, and the newly identified nine genetic risk loci for LOAD, account for less than half of familial AD cases [5], indicating the existence of additional, yet-unidentified genetic contributors. Multiple seminal studies implicate neuroinflammation as a critical driver of AD pathogenesis. For example, dysregulated inflammatory responses accelerate cognitive decline in both experimental animal models [6] and AD patients [7]. In addition, genome-wide association studies (GWAS) and meta-analyses have identified multiple inflammation-associated genes and polymorphisms that increase AD risk [8,9]. These findings strongly suggest that immune dysregulation and chronic neuroinflammation play a central role in AD and warrant further mechanistic investigation.
Long noncoding RNAs (lncRNAs) have emerged as a new class of immunomodulators and are involved in multiple aspects of AD pathology, including β-amyloid (Aβ) plaques formation, neurofibrillary tangle (NFTs) development, synaptic dysfunction, and neuronal loss [10,11,12]. LncRNAs modulate nervous system functions through diverse mechanisms, including epigenetic regulation [13] and posttranscriptional regulation [14]. For example, the lncRNA β-amyloid precursor protein cleaving enzyme 1-antisense (BACE1-AS) stabilizes BACE1 mRNA thereby enhancing APP cleavage and Aβ production [15]. In addition, the ultraconserved enhancer lncRNA Evf2 regulates adult hippocampal neurogenesis [16], MALAT1 lncRNA modulates synaptogenesis in mouse hippocampal neurons [17], and many lncRNAs have been reported to function as competing endogenous RNAs (ceRNAs), acting as microRNA (miRNA) sponges [18,19] via miRNA response elements (MREs) to modulate AD-related molecular pathways [12,14,15].
Our recent transcriptomic (RNA-seq) analysis identified a novel lncRNA LIMASI (LncRNA Inflammation and Mucous associated, Antisense to ICAM1) in asthmatic airway epithelial cells [20]. Given that ICAM-1 is well-established mediator of inflammation and infection [20,21,22], we hypothesized that LIMASI lncRNA may contribute to AD-associated neuroinflammatory responses. To test this, we examined the LIMASI expression in archived AD patient brain samples and in a transgenic mouse model of AD; and further validated our findings in a stable APP-overexpressing cell culture model challenged with viral mimics. Mechanistically, LIMASI acted as a ceRNA that interacted with several microRNAs (miRNAs) to fine-tune neuroinflammatory gene networks relevant to Alzheimer’s disease. Collectively, these studies provide new insight into a lncRNA that potentially functions as a ceRNA dysregulated during AD-related neuroinflammation.
2. Materials and Methods
2.1. Brain Tissue Samples of AD and Control Subjects
The AD and normal control (NC) brain tissues (hippocampus) were obtained from the “Harvard Brain Tissue Resource Center” which is supported in part by PHS grant number R24MH068855. Additional brain tissues (motor cortex) were obtained from the NICHD Brain and Tissue Bank for Developmental Disorders at the University of Maryland, Baltimore, MD. The frozen brain tissue samples (see Table 1 for demographics) were processed for the protein and RNA isolation, as described previously [23]. The formalin-fixed paraffin-embedded sections were processed for the histochemical, immunostaining, and RNA-FISH analyses as described in the following sections.
2.2. Animal Model of AD Pathology
All animal regulations were strictly enforced as per the National Institute of Health’s “Guide for the Care and Use of Animals", and the protocols approved by the Institutional Animal Care and Use Committee (IACUC) at Florida International University. Brain tissues from 10 months old male and female 3xTg-AD (MMRC stock #34830) mice were analyzed as described before [24,25]. 3xTg-AD mice are homozygous for all three mutant alleles (homozygous for the Psen1 mutation and homozygous for the co-injected APPSwe and tauP301L transgenes (Tg(APPSwe,tauP301L)1Lfa). Brain tissues from C57BL/6j wild-type (WT) mice (Jackson Labs) from both males and females served as controls. One half of brain tissue fixed in formalin was used for sectioning and the snap-frozen half was used for protein and RNA analyses as described recently [20].
2.3. Cell Culture and Treatments
To generate the human neuroblastoma cell line stably expressing APP, the SH-SY5Y cells (cat# CRL-2266, ATCC, Manassas, VA) were transfected with pLHCX plasmid vector (Clontech, Palo Alto, CA, USA) containing APP751 Swedish mutation (K595N/M596L). The SH-SY5Y-APPSwe cells were cultured in a 1:1 mixture of DMEM: Nutrient Mixture F12 with 1mM L-Glutamine media (Cytiva HyClone) supplemented with 10% fetal bovine serum (FBS), and Pen-Strep and the stable cell line was selected with 50 µg/ml Hygromycin B (Invitrogen Inc., Carlsbad, CA). Human primary astrocytes (cat# 1800, ScienCell, Carlsbad, CA) was cultured as per the manufacturer's instructions. Cells were challenged with polyinosine-polycytidilic acid (poly(I:C)), to mimic viral infection. To model the acute neuroinflammatory responses, cells were treated with 0, 5, 10, 25, 50, and 100 µg/ml poly(I:C) (Invivogen Inc., San Diego, CA) for 2, 24, and 48 h.
2.4. Immunostaining and Imaging
For immunohistochemical staining, the brain tissue sections (10 µ) or treated cells were fixed in PFA and washed in 0.05% v Brij-35 in PBS (pH 7.4), and immunostained for antigen expression as described previously [22,23]. Briefly, sections/cells were blocked and permeabilized for an hour at RT and stained with antibodies to anti-beta Amyloid1-16 (6E10) (cat #SIG-39320, Covance), GFAP (cat# Sc-33673), and IBA-1 (cat# sc-32725) from Santa Cruz Biotech. The immunolabelled cells were detected using secondary antibodies conjugated fluorescent dyes (Jackson ImmunoResearch Lab Inc., West Grove, PA) and mounted with 4',6-diamidino-2-phenylindole (DAPI) containing Fluormount-GTM (SouthernBiotech, Birmingham, AL) for staining nuclei. Immunofluorescent images were captured by BZX700 Microscopy system (Keyence Corp., Japan) and analyzed using NIH Image J software.
2.5. RNA Fluorescent In-Situ Hybridization
RNA FISH was performed using the RNAscope® Fluorescent Multiplexed reagent kit (Advanced Cell Diagnostics, Newark, CA) as per the manufacturer’s protocol using the custom-made probe sets for LIMASI lncRNA and as described previously [20]. Briefly, cryostat brain sections/cells were hybridized with probes for 2 h at 40°C using a HyBEZ® oven (Advanced Cell Diagnostics, Newark, CA), and the signal was amplified by serial incubation in amplification buffers and HRP-tagged probe (Thermo Fisher Inc.,), at 40°C using a HyBEZ® oven. Probes were detected using Tyramide signal amplification (TSA) reaction using TSA-Plus Cy5 for LIMASI transcripts. Sections were also immunostained with GFAP or IBA-1 as described above. Dual-labelled images were analyzed and LIMASI expression was quantified by H-score analysis as reported earlier [20,22].
2.6. Protein Isolation and Western Blot Analysis
The tissue/cell lysates were prepared using RIPA lysis buffer (cat #89990, ThermoFisher Scientific) with 400nM microcystine-LR, 0.5 mM sodium vanadate, and 5% protease inhibitor cocktail. Protein concentration was determined by BCA assay (Pierce; Rockford, IL) and 30 µg protein was analyzed by western blotting as described previously [24]. Antibodies used for detecting Tau (HT7) (cat# MN1000), and pTau Thr231 (cat# MN1040) were from Invitrogen, and for pTau S396 (cat# 2934-1) and for total Tau-5 (cat# MAB361) and were from Epitomics and Millipore Sigma, respectively, and for APP (cat# 751-770) from Calbiochem. Immunolabeled protein bands were detected using ECL kit and visualized by chemiluminescence (Perkin Elmer, Waltham, MA) using the BioRad Chemidoc Imaging system (Hercules, CA). The signals were quantified by using Image J software and β-actin (cat# A5441) from Sigma was used to normalize the protein levels in each sample.
2.7. Cytokine Proteome Array
The brain tissue inflammatory and tissue remodeling factors were analyzed using the Proteome Profiler Human XL (hXL) Cytokine Array Kit (cat-# ARY022B; R&D Systems, MN) according to the manufacturer’s instructions. Equal protein amounts of AD and NC brain tissue lysates were incubated with array membranes separately, and the immunolabelled protein blots were detected using ECL kit (Perkin Elmer, Waltham, MA). The densitometric analysis of each protein spot was determined using the Image J software after background subtraction, and relative expression to the NC tissue was quantified.
2.8. Real-Time Quantitative PCR for mRNAs, lncRNAs and miRNAs
Total RNA was isolated from the brain tissues and treated cells were using RNeasy kit (Qiagen, MD) as per the manufacturer’s instructions. The FAM-based primer/probe sets for LIMASI were obtained from Applied Biosystems (ThermoFisher Inc.) and the SYBR green-based primer sets for ICAM-1, IL-6, IL-1β, and TNF mRNA were obtained from BioRad (Hercules, CA). RNA expression levels were quantified by qRT-PCR using the iTaq SYBR-green Master Mix (BioRad) in the CFX96 Real-Time PCR System (BioRad). Relative RNA quantities were calculated by normalizing data to u6 for LIMASI and GAPDH for all mRNAs as described previously [20].
2.9. Modeling of Potential miRNA Interaction Site Prediction
The IntaRNA 2.0 webserver [26] was used to predict potential RNA-RNA binding sites between the LIMASI and miRNAs miR-150-5p, miR-155-5p, miR-122-5p, and miR-1915-3p.
2.10. Statistical Analysis
Data is expressed as means ± SEM and was analyzed using GraphPad Prism Software (GraphPad Software, Inc., San Diego, CA). Grouped results were analyzed using one-way analysis of variance. When significant main effects were detected (p<0.05), Student’s t-test was used to determine differences between two groups.
3. Results
3.1. Classical Alzheimer’s Disease Neuropathology Is Associated with Robust Neuroinflammatory Activation
3.1. Elevated Expression of Neuroinflammatory Factors in AD Brain Tissues
We first verified hallmark AD pathology in archived postmortem brain tissues from AD patients (Braak stage IV or higher) and compared these findings with normal control (NC) subjects. In contrast to the NC brain sections, immunostaining for β-amyloid (Aβ) in AD brain tissues revealed markedly elevated Aβ expression with prominent plaque aggregation (Supplementary Figure S1A). Consistently, Aβ40 monomer levels were more than two-fold higher in AD brain homogenates, as quantified by a specific ELISA (Supplementary Figure S1B). Analysis of tau pathology demonstrated increased hyperphosphorylation at serine residues S396/S404 (Supplementary Figure S1C), and S396 (Supplementary Figure S1E), and threonine T231 (Supplementary Figure S1D) along with a significant increase in total tau protein levels in AD subjects (Supplementary Figure S1F).
Next, multiplex protein array analysis of brain tissue lysates from AD and NC subjects revealed robust neuroinflammatory activation in AD subjects (Supplementary Figure S2). Compared with NC tissues, innate immune-associated cytokines and chemokines- including, CD14, Lipocalin-2, IL-19, IL-1β, IL-6, IL-10, IL-15, IL-34, MCP-1, CXCL-10, and TNF-α were elevated by approximately three-fold in AD brains (Figure 1A). Additionally, brain tissue remodeling and vascular inflammatory markers, including BDNF, CHI3L-1, uPAR, MMP9, CRP, ICAM-1 and VCAM1 were significantly increased in AD subjects (Figure 1B). Gene expression analysis further showed significantly higher mRNA levels of ICAM-1 (1.5-fold, Figure 1C), and TNF (three-fold, Figure 1F) in AD tissues compared to NC controls, with trends toward increased IL-6 and IL-1β mRNA expression (approximately two-fold, P=0.07, Figure 1D and 1E). Thus, these findings confirm the presence of classical AD neuropathology in our archived brain samples and demonstrate a strong association with elevated neuroinflammatory gene and protein expression.
3.2. Elevated lncRNA LIMASI Expression in AD Patients and an AD Transgenic Mouse Model
Modulation of innate immune responses and neuroinflammation has been shown to reduce or delay the onset of AD [27]. Increasing evidence indicates that long-noncoding RNAs (lncRNAs) play important roles in regulating innate inflammatory pathways. We previously identified an immunomodulatory lncRNA associated with ICAM-1 termed LIMASI, which regulates the expression of multiple innate inflammatory mediators [20,22,28]. Analysis of postmortem human brain tissues revealed that, compared to NC tissues, LIMASI expression was more than 5-fold higher in AD tissues (Figure 2A). To validate these findings and determine cell-specific expression of LIMASI, we performed RNA-FISH analysis (Figure 2B). Quantitative analysis demonstrated approximately 5-fold higher LIMASI transcript levels in AD brain sections compared with NC controls (Figure 2C). Co-immunostaining of RNA-FISH sections showed LIMASI was expressed in both for GFAP+ astrocytes (Supplementary Figure S3A) and IBA1+ microglia (Supplementary Figure S3B).
To extend these findings to an experimental model, we performed a bioinformatic analysis to identify a murine analog of human LIMASI and identified a homologous sequence on mouse chromosome 9 (GenBank: CM001002.2) with substantial sequence identity. Using RNA-FISH probes targeting human LIMASI, we analyzed brain sections from 3xTg-AD mouse model, which develops neurofibrillary tangles, tauopathy, and other AD-like pathologies [29]. Age-matched (10 months), male and female C57/BL6 wild-type (WT) and 3xTg-AD mice were examined. Compared with WT brain sections, 3xTg-AD mice exhibited markedly elevated LIMASI expression (Figure 2D). Consistently, qPCR analysis revealed a 1.5-fold increase in LIMASI transcripts (Figure 2E), a 5-fold increase in Icam1 (Figure 2F), and a striking 30-fold increase in Il-6 mRNA expression (Figure 2G) in 3xTg-AD mice relative to WT controls. These data collectively demonstrate that LIMASI expression is elevated in both human AD brains and a transgenic mouse model of AD and is associated with a primed neuroinflammatory network, supporting a potential link between LIMASI upregulation and AD-associated neuroinflammation.
3.3. Cell Culture Models of AD-Associated Neuroinflammation Show Increased lncRNA LIMASI Expression
To establish a cell culture model of AD-associated neuroinflammation, we used APPSwe-overexpressing human neuroblastoma cell line (SH-SY5Y-APPSwe) and challenged the cells with the viral mimetic, poly(I:C), to simulate viral infections known to exacerbate AD neuropathology [30]. SH-SY5Y-APPSwe cells were treated with increasing concentrations of poly(I:C) (0, 5, 25, 50, and 100 µg/ml) for 2 h, based on our prior observations that lncRNAs regulate early inflammatory gene expression [20,22]. No significant toxicity was observed under any treatment conditions, as assessed by viable cell count analysis (data not shown). Quantitative PCR analysis revealed a dose-dependent induction in LIMASI transcript levels (Figure 3A), accompanied by increased expression of neuroinflammatory mediators including ICAM1, IL-6, IL-1β, and TNF mRNA levels (Figure 3B-E).
To examine temporal dynamics, SH-SY5Y-APPSwe cells were treated with at 50 µg/ml of poly(I:C) and incubated for 2, 24, and 48 h and compared the changes in gene expression with non-treated (NT) controls. LIMASI and inflammatory gene expression peaked at 2 h post-treatment. Expression levels returned toward baseline by 24 h, whereas LIMASI and TNF were again elevated at 48 h (Figure 3F-J). RNA-FISH analysis further validated poly(I:C)-induced LIMASI upregulation, demonstrating increased LIMASI levels following 10µg/ml poly(I:C) treatment compared to NT controls (Figure 3K,L).
In a separate experiment, SH-SY5Y-APPSwe cells treated with 50 µg/ml poly(I:C) for 48 h exhibited a more than 50% increase in APP protein levels (Supplementary Figures S4A and S4B). To extend these findings to a non-neuronal cell type, human primary astrocytes (HPA) were treated with 10µg/ml poly(I:C) for 24 h, resulting in increased expression of the inflammatory markers ICAM1, IL-6, and IL-1β, along with concomitant induction in of LIMASI transcripts (Supplementary Figures S5A-D). Elevated LIMASI expression levels were further confirmed by RNA-FISH in GFAP-positive astrocytes (Supplementary Figures S5E and S5F). Thus, these cell culture models recapitulate key features of AD-associated neuroinflammation and demonstrate strong correlation between neuroinflammatory activation and increased LIMASI expression.
3.4. LIMASI as a Competing Endogenous RNA with Multiple microRNA Interaction Sites
Analysis of the lncRNA-miRNA interactome provides important insights into gene regulatory mechanisms operating under pathological conditions. LncRNAs function as ceRNAs that could act as miRNA sponges/decoys, compete with miRNAs for the shared mRNA targets, or serve as precursors for miRNA biogenesis [31,32,33,34]. In a separate earlier study, we performed small RNA-sequencing to identify miRNAs associated with LIMASI during viral infection. Notably siRNA-mediated knock down of LIMASI resulted in reversal of several differentially expressed miRNAs [22], suggesting a functional regulatory relationship.
Among the LIMASI-associated miRNAs, miR-1915-3p, miR-122-5p, miR-155-5p, and miR-150-5p have previously been identified in serum and brain tissues of AD patients. To predict potential interaction sites between LIMASI and these miRNAs, we used the IntaRNA web server. Computational modeling predicted that nucleotides 6-20 of miR-1915-3p’s interact with the exon 1 region of LIMASI spanning nucleotides 64-78 (Figure 4A). Both miR-122-5p and miR-155-5p were predicted to bind LIMASI exon 2. Specifically, miR-122-5p was predicted to bind with LIMASI nucleotides 171-204 (Figure 4B), whereas miR-155-5p’s nucleotides 13-21 were predicted to bind LIMASI nucleotides 324-332 (Figure 4C). In addition, miR-150-5p nucleotides 1-16 were predicted to pair with LIMASI nucleotides 797-806 within exon 3 (Figure 4D). All predicted LIMASI–miRNA interactions exhibited energetically favorable minimum free energies (ranging from approximately −9.24 to −14.8 kcal/mol) supporting the feasibility of stable RNA–RNA interactions. Collectively, these findings suggest that LIMASI harbors multiple miRNA binding sites and may function as a competing endogenous RNA by sequestering inflammation-associated miRNAs relevant to AD–associated neuroinflammation.
4. Discussion
In this study, we demonstrate a strong association between the lncRNA LIMASI and AD-associated neuroinflammation in human postmortem brain tissues, a transgenic mouse model of AD, and complementary in vitro models. Elevated LIMASI expression consistently correlated with increased levels of key inflammatory mediators, including ICAM-1, IL-6, IL-1β and TNF, which are known drivers of neuroinflammation and brain tissue remodeling. Using a viral mimic, poly (I:C), we further showed that APPSwe-overexpressing SH-SY5Y neuroblastoma cells exhibited robust induction of these inflammatory factors in parallel with LIMASI upregulation, supporting a functional link between LIMASI expression and inflammatory signaling. Computational analyses indicate that LIMASI contains multiple energetically favorable binding sites for AD–associated inflammatory miRNAs including, miR-1915-3p, miR-122-5p, miR-155-5p, and miR-150-5p, supporting its role as a competing endogenous RNA that sequesters these miRNAs and modulates neuroinflammatory gene regulation. Collectively, these findings identify LIMASI as a potential mediator of AD-associated neuroinflammation and pathology.
Neuroinflammation is increasingly recognized as a central and early contributor to AD pathogenesis, facilitating and exacerbating both Aβ and NFT pathologies, and potentially bridging early Aβ deposition with later tau aggregation. Recent high-resolution PET imaging studies have identified neuroinflammation as one of the earliest detectable biomarkers of AD [35]. In agreement with these observations, our analysis confirmed classical AD neuropathology in the archived brain tissues alongside markedly elevated innate immune cytokines and tissue remodeling factors. Notably, we identified increased expression of CHI3L-1, uPAR, MMP9, CRP, ICAM-1, and VCAM1 – molecules implicated in immune cell recruitment, extracellular matrix remodeling, and vascular inflammation—highlighting their potential value as diagnostic or prognostic biomarkers. ICAM-1, a cell surface glycoprotein expressed by neurons, glia, and endothelial cells, plays a critical role in immune cell adhesion and trafficking, its dysregulation can profoundly alter brain immune homeostasis. Previous studies have shown strong ICAM-1 expression in AD brain regions enriched with amyloid plaques and activated microglia [36,37], supporting its relevance in AD-related neuroinflammation.
Pro-inflammatory cytokines are pivotal contributors to AD pathology. TNF-α, primarily secreted by macrophages and microglia, regulates microglial activation and synaptic dysfunctions and is elevated in serum of AD patients [38,39]. IL-6, a multifunctional cytokine essential for neuronal tissue homeostasis, promotes chronic neuroinflammation when overproduced and correlates with cognitive decline and AD disease severity [40,41,42,43]. IL-1β further amplifies the inflammatory cascade by regulating APP synthesis, Aβ plaque deposition, mild cognitive impairment and AD pathophysiology [44,45,46,47]. Further, IL-1β regulates the expression of downstream cytokines such as IL-6 and TNF-α [48]. In our study, AD brain tissues exhibited increased levels of TNF-α, CXCL-10, MCP-1, CXCL1, IL-34, IL-15, IL-10, IL-6, IL-1β, IL-19, Lipocalin-2, and CD14, underscoring the extensive inflammatory milieu associated with AD pathology and reinforcing the need to understand upstream regulatory mechanisms governing these responses.
Growing evidence highlights lncRNAs as key regulators of neuroinflammation and neurodegeneration, and the temporal regulation of lncRNAs and miRNAs is a major contributor in the adaptation of cells and host immune system [49,50]. Several lncRNAs including BACE1-AS, MALAT1, BDNF-AS, and MAGI2-AS3 have been implicated in APP processing, synaptic regulation, neuronal apoptosis, and amyloid secretion [12,17,51,52,53]. LncRNAs are often dysregulated in pathological states and restoration of their expression has shown therapeutic benefits in multiple disease models [54,55]. Our immunohistological and molecular analyses demonstrate that LIMASI is expressed in both microglia and astrocytes and is strongly associated with AD-related neuroinflammation. Most notably, the induction of LIMASI by poly(I:C) further suggests that this lncRNA may participate in viral infection-augmented neuroinflammation, potentially involving TLR3/7-dependent pathways in APPSwe-overexpressing cells [56,57]. Importantly, experiments using human primary astrocytes confirmed that LIMASI is directly inducible during astrocytic inflammatory responses, highlighting astrocytes as a key cellular course of LIMASI-induced inflammatory responses in AD. Further studies are needed to investigate the molecular pathways by which LIMASI regulates neuroinflammation including developing a suitable co-culture model of human induced-pluripotent stem cell (hiPSC)-derived cells to study the contribution of glial cells and other neurons.
Mechanistically, our bioinformatic and expression analyses support a competing endogenous RNA (ceRNA) model in which LIMASI regulates neuroinflammation through interactions with multiple disease-relevant miRNAs. As discussed earlier, lncRNAs often act as ceRNAs and influence gene regulation by sequestering proteins and coding and non-coding RNAs [58]. Several LIMASI-associated miRNAs including miR-1915-3p, miR-122-5p, miR-155-5p, and miR-150-5p have previously reported as being dysregulated in neurodegenerative diseases, including AD [59,60,61,62,63]. Among these, miR-155-5p and miR-150-5p play distinct yet complementary roles in AD, linking neuroinflammatory regulation, disease pathology, and clinical relevance. miR-155-5p functions as a context-dependent pro-inflammatory mediator with both detrimental and protective effects: its early upregulation in AD mouse models promotes microglial and astrocytic activation and inflammatory cytokine production (e.g., IL-6 and IFN-β) prior to overt amyloid plaque formation [64], while mechanistically enhancing amyloid pathology through pathways such as the miR-155-5p/SKP2/IKKβ axis [65]. Conversely, microglia-specific deletion of miR-155-5p induces a pre-neurodegenerative microglial phenotype that enhances amyloid plaque compaction and reduces neuritic damage yet paradoxically increases neuronal hyperexcitability and seizure susceptibility due to altered synaptic pruning [66,67]. These findings place miR-155-5p at the intersection of innate immune signaling, amyloid processing, synaptic regulation, and viral-response pathways relevant to late-onset AD [68]. In contrast, miR-150-5p has emerged as a robust and clinically validated blood-based biomarker for AD with elevated levels correlating strongly with cognitive decline, reduced CSF Aβ42, increased CSF total tau, and brain atrophy within default mode and executive control networks [69]. Mechanistically, miR-150-5p targets components of the Wnt signaling pathway, including PDCD4, which is downregulated in AD patients [69]. Together, these miRNAs exemplify how small noncoding RNAs contribute to AD pathogenesis, biomarker development, and ceRNA-based regulatory networks implicated in disease progression [69,70]. The current study suggests that LIMASI may sequester these miRNAs, thereby relieving repression of ICAM-1 and other neuroinflammatory targets and amplifying neuroinflammatory signaling in AD.
Overall, this proof-of-concept study strongly suggests that LIMASI mediates amyloid-associated neuroinflammation following viral mimic challenges. Despite these insights, several limitations should be acknowledged while drawing conclusions. First, the postmortem human brain samples analyzed represent late-stage disease, limiting insight into early pathogenic events. Second, the relatively small sample size warrants validation in larger, independent cohorts. Finally, although animal and cell culture models provide valuable mechanistic insight, they incompletely recapitulate the complexity of human AD, and better experimental models are needed that recapitulate the complex AD disease spectrum [71].
In conclusion, this proof-of-concept study identifies LIMASI as a novel ceRNA associated with AD-related neuroinflammation and supports a ceRNA-based mechanism linking LIMASI, miRNAs, and ICAM-1 signaling. These findings provide new avenues for understanding AD pathogenesis and highlight LIMASI as a potential biomarker and therapeutic target for modulating neuroinflammation and slowing disease progression.
Supplementary Materials
The following supporting information can be downloaded at: Preprints.org. Supplementary Figure S1: Increased accumulation of β-amyloid plaques and hyperphosphorylation of tau in the brain tissues of AD patients (Braak-stage IV or higher) compared to non-diseased brain tissues (NC). Supplementary Figure S2: Micrographs showing the hXL array blot expressions of non-diseased controls (NC) and AD patients brain tissue homogenates. Supplementary Figure S3: Representative micrographs of brain cortex regions of NC and AD brain tissues stained for LIMASI transcripts and co-immunostained for GFAP (green) to mark astrocytes and IBA1 to mark microglia. Supplementary Figure S4: Immunoblot analysis showing full-length APP protein expression at 48 h post-challenge of poly (I:C). Supplementary Figure S5: Human primary astrocytes (HPA) were treated with 10µg/ml of poly (I:C) and RNA expression was compared to non-treated (NT) cells at 24 h post-challenge.
Author Contributions
Conceptualization, H.S.C.; methodology, D.D..; software, T.V.; validation, D.D., J.A., and N.O.; formal analysis, D.D.s and H.S.C.; investigation, D.D., J.A., and N.O.; resources, H.S.C. and M.K.L; data curation, D.D, and G.M.B.; writing—original draft preparation, D.D. and H.S.C.; writing—review and editing, D.D., J.A., N.O., T.V., G.M.B., and M.K.L; visualization, D.D., T.V. and H.S.C.; supervision, H.S.C.; project administration, D.D. and H.S.C.; funding acquisition, M.K.L. and H.S.C.. All authors have read and agreed to the published version of the manuscript.
Funding
This research was funded by NIH, grant numbers R21AI152937 and 3R21AI152937-02S1.
Institutional Review Board Statement
The animal study was approved by Institutional Animal Care and Use Committee of Florida International University (FIU). The deidentified archived human brain tissues were from ‘Harvard Brain Tissue Resource Center’ at McLean Hospital, Belmont, MA, and the ‘NICHD Brain and Tissue Bank for Developmental Disorders’ at the University of Maryland, Baltimore, MD, which are now part of the ‘NIH NeuroBioBank’. The study was conducted in accordance with the local legislation and FIU's institutional guidelines and regulations.
Informed Consent Statement
Not applicable.
Data Availability Statement
No new data was created.
Acknowledgments
Authors would like to thank the technical support by Ariane Chung and by Dr. Mohan KM Karuppan for his help with mouse study and brain tissue sectioning.
Conflicts of Interest
The authors declare no conflicts of interest. The funders had no role in the design of the study; in the collection, analyses, or interpretation of data; in the writing of the manuscript; or in the decision to publish the results.
Abbreviations
The following abbreviations are used in this manuscript:
| AD | Alzheimer’s disease |
| ADRD | Alzheimer’s disease -related dementia |
| ApoE | Apolipoprotein E |
| APP | Amyloid Precursor Protein |
| APPSwe | APP with Swedish mutation (K595N/M596L) |
| Aβ | Amyloid-beta |
| BACE1 | Beta-site Amyloid Precursor Protein Cleaving Enzyme |
| BACE1-AS | BACE1-Antisense RNA |
| BDNF-AS | Brain-Derived Neurotrophic Factor Antisense RNA |
| ceRNA | competing endogenous RNA |
| CHI3L-1 | Chitinase-3-like protein 1 |
| CRP | C-reactive protein |
| CSF | Cerebrospinal fluid |
| CXCL-10 | C-X-C motif chemokine ligand 10 |
| DAPI | 4',6-diamidino-2-phenylindole |
| FAD | familial cases of Alzheimer’s disease |
| FBS | Fetal Bovine Serum |
| FISH | Fluorescence In Situ Hybridization |
| GFAP | Glial Fibrillary Acidic Protein |
| IBA1 | Ionized calcium-binding adaptor molecule 1 |
| ICAM1 | intercellular adhesion molecule-1 |
| IKKβ | Inhibitor of nuclear factor kappa B kinase subunit beta |
| IL-1β | Interleukin-1β |
| IL-6 | Interleukin-6 |
| LIMASI | LncRNA Inflammation and Mucous associated, Antisense to ICAM1 |
| lncRNAs | long noncoding RNAs lncRNAs |
| LOAD | Late-onset- Alzheimer’s disease |
| MAGI2-AS3 | Membrane Associated Guanylate Kinase, WW And PDZ Domain Containing 2-Antisense RNA 3 |
| MALAT1 | Metastasis Associated Lung Adenocarcinoma Transcript 1 |
| MCP-1 | Monocyte Chemoattractant Protein-1 |
| miRNAs | microRNAs |
| MMP9 | Matrix metalloproteinase-9 |
| NFTs | Neurofibrillary tangles |
| PBS | Phosphate-Buffered Saline |
| PDCD4 | Programmed cell death protein 4 |
| PS1 | presenilin 1 |
| PS1 | presenilin 2 |
| qPCR | Quantitative Polymerase Chain Reaction |
| RIPA | Radioimmunoprecipitation Assay buffer |
| RNA | Ribonucleic Acid |
| SKP2 | S-phase kinase-associated protein 2 |
| TLR3/7 | Toll-like receptors3/7 |
| TNFα | Tumor necrosis factor α |
| uPAR | Urokinase-type Plasminogen Activator Receptor |
| VCAM1 | Vascular cell adhesion protein 1 |
References
- Reitz, C.; Brayne, C.; Mayeux, R. Epidemiology of Alzheimer disease. Nat Rev Neurol 2011, 7, 137–152. [Google Scholar] [CrossRef]
- Weller, J.; Budson, A. Current understanding of Alzheimer's disease diagnosis and treatment. F1000Res 2018, 7. [Google Scholar] [CrossRef] [PubMed]
- Qiu, C.; Kivipelto, M.; von Strauss, E. Epidemiology of Alzheimer's disease: occurrence, determinants, and strategies toward intervention. Dialogues Clin Neurosci 2009, 11, 111–128. [Google Scholar] [CrossRef] [PubMed]
- Gatz, M.; Reynolds, C.A.; Fratiglioni, L.; Johansson, B.; Mortimer, J.A.; Berg, S.; Fiske, A.; Pedersen, N.L. Role of genes and environments for explaining Alzheimer disease. Arch Gen Psychiatry 2006, 63, 168–174. [Google Scholar] [CrossRef]
- Kamboh, M.I.; Demirci, F.Y.; Wang, X.; Minster, R.L.; Carrasquillo, M.M.; Pankratz, V.S.; Younkin, S.G.; Saykin, A.J.; Alzheimer's Disease Neuroimaging, I.; Jun, G.; et al. Genome-wide association study of Alzheimer's disease. Transl Psychiatry 2012, 2, e117. [Google Scholar] [CrossRef]
- Cunningham, C.; Campion, S.; Lunnon, K.; Murray, C.L.; Woods, J.F.; Deacon, R.M.; Rawlins, J.N.; Perry, V.H. Systemic inflammation induces acute behavioral and cognitive changes and accelerates neurodegenerative disease. Biol Psychiatry 2009, 65, 304–312. [Google Scholar] [CrossRef]
- Gisondi, P.; Sala, F.; Alessandrini, F.; Avesani, V.; Zoccatelli, G.; Beltramello, A.; Moretto, G.; Gambina, G.; Girolomoni, G. Mild cognitive impairment in patients with moderate to severe chronic plaque psoriasis. Dermatology 2014, 228, 78–85. [Google Scholar] [CrossRef]
- Hamilton, G.; Evans, K.L.; Macintyre, D.J.; Deary, I.J.; Dominiczak, A.; Smith, B.H.; Morris, A.D.; Porteous, D.J.; Thomson, P.A. Alzheimer's disease risk factor complement receptor 1 is associated with depression. Neurosci Lett 2012, 510, 6–9. [Google Scholar] [CrossRef]
- Payao, S.L.; Goncalves, G.M.; de Labio, R.W.; Horiguchi, L.; Mizumoto, I.; Rasmussen, L.T.; de Souza Pinhel, M.A.; Silva Souza, D.R.; Bechara, M.D.; Chen, E.; et al. Association of interleukin 1beta polymorphisms and haplotypes with Alzheimer's disease. J Neuroimmunol 2012, 247, 59–62. [Google Scholar] [CrossRef] [PubMed]
- Chouliaras, L.; Rutten, B.P.; Kenis, G.; Peerbooms, O.; Visser, P.J.; Verhey, F.; van Os, J.; Steinbusch, H.W.; van den Hove, D.L. Epigenetic regulation in the pathophysiology of Alzheimer's disease. Prog Neurobiol 2010, 90, 498–510. [Google Scholar] [CrossRef]
- De Smaele, E.; Ferretti, E.; Gulino, A. MicroRNAs as biomarkers for CNS cancer and other disorders. Brain Res 2010, 1338, 100–111. [Google Scholar] [CrossRef]
- Faghihi, M.A.; Modarresi, F.; Khalil, A.M.; Wood, D.E.; Sahagan, B.G.; Morgan, T.E.; Finch, C.E.; St Laurent, G., 3rd; Kenny, P.J.; Wahlestedt, C. Expression of a noncoding RNA is elevated in Alzheimer's disease and drives rapid feed-forward regulation of beta-secretase. Nat Med 2008, 14, 723–730. [Google Scholar] [CrossRef]
- Mercer, T.R.; Mattick, J.S. Structure and function of long noncoding RNAs in epigenetic regulation. Nat Struct Mol Biol 2013, 20, 300–307. [Google Scholar] [CrossRef]
- Mercer, T.R.; Dinger, M.E.; Mattick, J.S. Long non-coding RNAs: insights into functions. Nat Rev Genet 2009, 10, 155–159. [Google Scholar] [CrossRef] [PubMed]
- Esteller, M. Non-coding RNAs in human disease. Nat Rev Genet 2011, 12, 861–874. [Google Scholar] [CrossRef] [PubMed]
- Bond, A.M.; Vangompel, M.J.; Sametsky, E.A.; Clark, M.F.; Savage, J.C.; Disterhoft, J.F.; Kohtz, J.D. Balanced gene regulation by an embryonic brain ncRNA is critical for adult hippocampal GABA circuitry. Nat Neurosci 2009, 12, 1020–1027. [Google Scholar] [CrossRef] [PubMed]
- Bernard, D.; Prasanth, K.V.; Tripathi, V.; Colasse, S.; Nakamura, T.; Xuan, Z.; Zhang, M.Q.; Sedel, F.; Jourdren, L.; Coulpier, F.; et al. A long nuclear-retained non-coding RNA regulates synaptogenesis by modulating gene expression. EMBO J 2010, 29, 3082–3093. [Google Scholar] [CrossRef]
- Kallen, A.N.; Zhou, X.B.; Xu, J.; Qiao, C.; Ma, J.; Yan, L.; Lu, L.; Liu, C.; Yi, J.S.; Zhang, H.; et al. The imprinted H19 lncRNA antagonizes let-7 microRNAs. Mol Cell 2013, 52, 101–112. [Google Scholar] [CrossRef] [PubMed]
- Wang, Y.; Xu, Z.; Jiang, J.; Xu, C.; Kang, J.; Xiao, L.; Wu, M.; Xiong, J.; Guo, X.; Liu, H. Endogenous miRNA sponge lincRNA-RoR regulates Oct4, Nanog, and Sox2 in human embryonic stem cell self-renewal. Dev Cell 2013, 25, 69–80. [Google Scholar] [CrossRef]
- Devadoss, D.; Daly, G.; Manevski, M.; Houserova, D.; Hussain, S.S.; Baumlin, N.; Salathe, M.; Borchert, G.M.; Langley, R.J.; Chand, H.S. A long noncoding RNA antisense to ICAM-1 is involved in allergic asthma associated hyperreactive response of airway epithelial cells. Mucosal Immunol 2021, 14, 630–639. [Google Scholar] [CrossRef]
- Bowman, G.L.; Dayon, L.; Kirkland, R.; Wojcik, J.; Peyratout, G.; Severin, I.C.; Henry, H.; Oikonomidi, A.; Migliavacca, E.; Bacher, M.; et al. Blood-brain barrier breakdown, neuroinflammation, and cognitive decline in older adults. Alzheimers Dement 2018, 14, 1640–1650. [Google Scholar] [CrossRef]
- Devadoss, D.; Acharya, A.; Manevski, M.; Houserova, D.; Cioffi, M.D.; Pandey, K.; Nair, M.; Chapagain, P.; Mirsaeidi, M.; Borchert, G.M.; et al. Immunomodulatory LncRNA on antisense strand of ICAM-1 augments SARS-CoV-2 infection-associated airway mucoinflammatory phenotype. iScience 2022, 25, 104685. [Google Scholar] [CrossRef]
- Wang, H.; Devadoss, D.; Nair, M.; Chand, H.S.; Lakshmana, M.K. Novel Alzheimer risk factor IQ motif containing protein K is abundantly expressed in the brain and is markedly increased in patients with Alzheimer's disease. Front Cell Neurosci 2022, 16, 954071. [Google Scholar] [CrossRef]
- Devadoss, D.; Akkaoui, J.; Nair, M.; Lakshmana, M.K. LRRC25 expression during physiological aging and in mouse models of Alzheimer's disease and iPSC-derived neurons. Front Mol Neurosci 2024, 17, 1365752. [Google Scholar] [CrossRef] [PubMed]
- Akkaoui, J.; Devadoss, D.; Wang, H.; Movila, A.; Lakshmana, M.K. Robust Increase in IQCK Protein Expression in Mouse Models of Alzheimer's Disease and iPSC-Derived Neurons. J Cell Mol Med 2025, 29, e70686. [Google Scholar] [CrossRef] [PubMed]
- Mann, M.; Wright, P.R.; Backofen, R. IntaRNA 2.0: enhanced and customizable prediction of RNA-RNA interactions. Nucleic Acids Res 2017, 45, W435–W439. [Google Scholar] [CrossRef]
- Guillot-Sestier, M.V.; Doty, K.R.; Town, T. Innate Immunity Fights Alzheimer's Disease. Trends Neurosci 2015, 38, 674–681. [Google Scholar] [CrossRef]
- Manevski, M.; Devadoss, D.; Long, C.; Singh, S.P.; Nasser, M.W.; Borchert, G.M.; Nair, M.N.; Rahman, I.; Sopori, M.; Chand, H.S. Increased Expression of LASI lncRNA Regulates the Cigarette Smoke and COPD Associated Airway Inflammation and Mucous Cell Hyperplasia. Front Immunol 2022, 13, 803362. [Google Scholar] [CrossRef]
- Dennison, J.L.; Ricciardi, N.R.; Lohse, I.; Volmar, C.H.; Wahlestedt, C. Sexual Dimorphism in the 3xTg-AD Mouse Model and Its Impact on Pre-Clinical Research. J Alzheimers Dis 2021, 80, 41–52. [Google Scholar] [CrossRef]
- Liu, R.Y.; Yin, K.F.; He, S.Y.; Su, W.M.; Duan, Q.Q.; Wen, X.J.; Chen, T.; Shen, C.; Li, J.R.; Cao, B.; et al. Viral infections and the risk of neurodegenerative diseases: a comprehensive meta-analysis and systematic review. Transl Psychiatry 2025, 15, 388. [Google Scholar] [CrossRef] [PubMed]
- Legnini, I.; Morlando, M.; Mangiavacchi, A.; Fatica, A.; Bozzoni, I. A feedforward regulatory loop between HuR and the long noncoding RNA linc-MD1 controls early phases of myogenesis. Mol Cell 2014, 53, 506–514. [Google Scholar] [CrossRef]
- Faghihi, M.A.; Zhang, M.; Huang, J.; Modarresi, F.; Van der Brug, M.P.; Nalls, M.A.; Cookson, M.R.; St-Laurent, G., 3rd; Wahlestedt, C. Evidence for natural antisense transcript-mediated inhibition of microRNA function. Genome Biol 2010, 11, R56. [Google Scholar] [CrossRef]
- Yoon, J.H.; Abdelmohsen, K.; Srikantan, S.; Yang, X.; Martindale, J.L.; De, S.; Huarte, M.; Zhan, M.; Becker, K.G.; Gorospe, M. LincRNA-p21 suppresses target mRNA translation. Mol Cell 2012, 47, 648–655. [Google Scholar] [CrossRef]
- Keniry, A.; Oxley, D.; Monnier, P.; Kyba, M.; Dandolo, L.; Smits, G.; Reik, W. The H19 lincRNA is a developmental reservoir of miR-675 that suppresses growth and Igf1r. Nat Cell Biol 2012, 14, 659–665. [Google Scholar] [CrossRef] [PubMed]
- Lagarde, J.; Sarazin, M.; Bottlaender, M. In vivo PET imaging of neuroinflammation in Alzheimer's disease. J Neural Transm (Vienna) 2018, 125, 847–867. [Google Scholar] [CrossRef]
- Akiyama, H.; Barger, S.; Barnum, S.; Bradt, B.; Bauer, J.; Cole, G.M.; Cooper, N.R.; Eikelenboom, P.; Emmerling, M.; Fiebich, B.L.; et al. Inflammation and Alzheimer's disease. Neurobiol Aging 2000, 21, 383–421. [Google Scholar] [CrossRef] [PubMed]
- Akiyama, H.; Kawamata, T.; Yamada, T.; Tooyama, I.; Ishii, T.; McGeer, P.L. Expression of intercellular adhesion molecule (ICAM)-1 by a subset of astrocytes in Alzheimer disease and some other degenerative neurological disorders. Acta Neuropathol 1993, 85, 628–634. [Google Scholar] [CrossRef] [PubMed]
- Ren, S.; Breuillaud, L.; Yao, W.; Yin, T.; Norris, K.A.; Zehntner, S.P.; D'Adamio, L. TNF-alpha-mediated reduction in inhibitory neurotransmission precedes sporadic Alzheimer's disease pathology in young Trem2(R47H) rats. J Biol Chem 2021, 296, 100089. [Google Scholar] [CrossRef]
- Chang, R.; Yee, K.L.; Sumbria, R.K. Tumor necrosis factor alpha Inhibition for Alzheimer's Disease. J Cent Nerv Syst Dis 2017, 9, 1179573517709278. [Google Scholar] [CrossRef]
- Rothaug, M.; Becker-Pauly, C.; Rose-John, S. The role of interleukin-6 signaling in nervous tissue. Biochim Biophys Acta 2016, 1863, 1218–1227. [Google Scholar] [CrossRef]
- Singh-Manoux, A.; Dugravot, A.; Brunner, E.; Kumari, M.; Shipley, M.; Elbaz, A.; Kivimaki, M. Interleukin-6 and C-reactive protein as predictors of cognitive decline in late midlife. Neurology 2014, 83, 486–493. [Google Scholar] [CrossRef]
- Blum-Degen, D.; Muller, T.; Kuhn, W.; Gerlach, M.; Przuntek, H.; Riederer, P. Interleukin-1 beta and interleukin-6 are elevated in the cerebrospinal fluid of Alzheimer's and de novo Parkinson's disease patients. Neurosci Lett 1995, 202, 17–20. [Google Scholar] [CrossRef]
- Dursun, E.; Gezen-Ak, D.; Hanagasi, H.; Bilgic, B.; Lohmann, E.; Ertan, S.; Atasoy, I.L.; Alaylioglu, M.; Araz, O.S.; Onal, B.; et al. The interleukin 1 alpha, interleukin 1 beta, interleukin 6 and alpha-2-macroglobulin serum levels in patients with early or late onset Alzheimer's disease, mild cognitive impairment or Parkinson's disease. J Neuroimmunol 2015, 283, 50–57. [Google Scholar] [CrossRef]
- Liao, Y.F.; Wang, B.J.; Cheng, H.T.; Kuo, L.H.; Wolfe, M.S. Tumor necrosis factor-alpha, interleukin-1beta, and interferon-gamma stimulate gamma-secretase-mediated cleavage of amyloid precursor protein through a JNK-dependent MAPK pathway. J Biol Chem 2004, 279, 49523–49532. [Google Scholar] [CrossRef]
- Buxbaum, J.D.; Oishi, M.; Chen, H.I.; Pinkas-Kramarski, R.; Jaffe, E.A.; Gandy, S.E.; Greengard, P. Cholinergic agonists and interleukin 1 regulate processing and secretion of the Alzheimer beta/A4 amyloid protein precursor. Proc Natl Acad Sci U S A 1992, 89, 10075–10078. [Google Scholar] [CrossRef]
- Chong, Y. Effect of a carboxy-terminal fragment of the Alzheimer's amyloid precursor protein on expression of proinflammatory cytokines in rat glial cells. Life Sci 1997, 61, 2323–2333. [Google Scholar] [CrossRef]
- Forlenza, O.V.; Diniz, B.S.; Talib, L.L.; Mendonca, V.A.; Ojopi, E.B.; Gattaz, W.F.; Teixeira, A.L. Increased serum IL-1beta level in Alzheimer's disease and mild cognitive impairment. Dement Geriatr Cogn Disord 2009, 28, 507–512. [Google Scholar] [CrossRef]
- Basu, A.; Krady, J.K.; Levison, S.W. Interleukin-1: a master regulator of neuroinflammation. J Neurosci Res 2004, 78, 151–156. [Google Scholar] [CrossRef] [PubMed]
- Devadoss, D.; Long, C.; Langley, R.J.; Manevski, M.; Nair, M.; Campos, M.A.; Borchert, G.; Rahman, I.; Chand, H.S. Long Noncoding Transcriptome in Chronic Obstructive Pulmonary Disease. Am J Respir Cell Mol Biol 2019, 61, 678–688. [Google Scholar] [CrossRef] [PubMed]
- Li, D.; Zhang, J.; Li, X.; Chen, Y.; Yu, F.; Liu, Q. Insights into lncRNAs in Alzheimer's disease mechanisms. RNA Biol 2021, 18, 1037–1047. [Google Scholar] [CrossRef] [PubMed]
- Mandrekar-Colucci, S.; Landreth, G.E. Microglia and inflammation in Alzheimer's disease. CNS Neurol Disord Drug Targets 2010, 9, 156–167. [Google Scholar] [CrossRef]
- Ren, H.; Qiu, W.; Zhu, B.; Li, Q.; Peng, C.; Chen, X. The long non-coding RNA BDNF-AS induces neuronal cell apoptosis by targeting miR-125b-5p in Alzheimer's disease models. Adv Clin Exp Med 2024, 33, 233–245. [Google Scholar] [CrossRef] [PubMed]
- Zhang, J.; Wang, R. Deregulated lncRNA MAGI2-AS3 in Alzheimer's disease attenuates amyloid-beta induced neurotoxicity and neuroinflammation by sponging miR-374b-5p. Exp Gerontol 2021, 144, 111180. [Google Scholar] [CrossRef] [PubMed]
- Li, L.; Wang, L.; Li, H.; Han, X.; Chen, S.; Yang, B.; Hu, Z.; Zhu, H.; Cai, C.; Chen, J.; et al. Characterization of LncRNA expression profile and identification of novel LncRNA biomarkers to diagnose coronary artery disease. Atherosclerosis 2018, 275, 359–367. [Google Scholar] [CrossRef]
- Ni, X.; Liao, Y.; Li, L.; Zhang, X.; Wu, Z. Therapeutic role of long non-coding RNA TCONS_00019174 in depressive disorders is dependent on Wnt/beta-catenin signaling pathway. J Integr Neurosci 2018, 17, 125–132. [Google Scholar] [CrossRef]
- Butler, A.A.; Johnston, D.R.; Kaur, S.; Lubin, F.D. Long noncoding RNA NEAT1 mediates neuronal histone methylation and age-related memory impairment. Sci Signal 2019, 12. [Google Scholar] [CrossRef] [PubMed]
- Wan, P.; Su, W.; Zhuo, Y. The Role of Long Noncoding RNAs in Neurodegenerative Diseases. Mol Neurobiol 2017, 54, 2012–2021. [Google Scholar] [CrossRef]
- Chen, L.L.; Carmichael, G.G. Altered nuclear retention of mRNAs containing inverted repeats in human embryonic stem cells: functional role of a nuclear noncoding RNA. Mol Cell 2009, 35, 467–478. [Google Scholar] [CrossRef]
- Subasinghe, K.; Hall, C.; Rowe, M.; Zhou, Z.; Barber, R.; Phillips, N. Neuronal Enriched Extracellular Vesicle miR-122-5p as a Potential Biomarker for Alzheimer's Disease. Cells 2025, 14. [Google Scholar] [CrossRef]
- Novobilsky, R.; Kusnierova, P.; Stepan, D.; Bartova, P.; Stejskal, D.; Bar, M. Identification and evaluation of potential microRNA markers for diagnostics in neurodegenerative diseases and correlation with other biochemical markers. PLoS One 2025, 20, e0333801. [Google Scholar] [CrossRef]
- Chen, Y.; Wei, Q.; Chen, X.; Li, C.; Cao, B.; Ou, R.; Hadano, S.; Shang, H.F. Aberration of miRNAs Expression in Leukocytes from Sporadic Amyotrophic Lateral Sclerosis. Front Mol Neurosci 2016, 9, 69. [Google Scholar] [CrossRef]
- Ruf, W.P.; Freischmidt, A.; Grozdanov, V.; Roth, V.; Brockmann, S.J.; Mollenhauer, B.; Martin, D.; Haslinger, B.; Fundel-Clemens, K.; Otto, M.; et al. Protein Binding Partners of Dysregulated miRNAs in Parkinson's Disease Serum. Cells 2021, 10. [Google Scholar] [CrossRef]
- Yu, N.; Tian, W.; Liu, C.; Zhang, P.; Zhao, Y.; Nan, C.; Jin, Q.; Li, X.; Liu, Y. miR-122-5p Promotes Peripheral and Central Nervous System Inflammation in a Mouse Model of Intracerebral Hemorrhage via Disruption of the MLLT1/PI3K/AKT Signaling. Neurochem Res 2023, 48, 3665–3682. [Google Scholar] [CrossRef]
- Guedes, J.R.; Custodia, C.M.; Silva, R.J.; de Almeida, L.P.; Pedroso de Lima, M.C.; Cardoso, A.L. Early miR-155 upregulation contributes to neuroinflammation in Alzheimer's disease triple transgenic mouse model. Hum Mol Genet 2014, 23, 6286–6301. [Google Scholar] [CrossRef]
- Wang, W.; Gu, X.H.; Li, M.; Cheng, Z.J.; Tian, S.; Liao, Y.; Liu, X. MicroRNA-155-5p Targets SKP2, Activates IKKbeta, Increases Abeta Aggregation, and Aggravates a Mouse Alzheimer Disease Model. J Neuropathol Exp Neurol 2022, 81, 16–26. [Google Scholar] [CrossRef] [PubMed]
- Yin, Z.; Herron, S.; Silveira, S.; Kleemann, K.; Gauthier, C.; Mallah, D.; Cheng, Y.; Margeta, M.A.; Pitts, K.M.; Barry, J.L.; et al. Identification of a protective microglial state mediated by miR-155 and interferon-gamma signaling in a mouse model of Alzheimer's disease. Nat Neurosci 2023, 26, 1196–1207. [Google Scholar] [CrossRef]
- Aloi, M.S.; Prater, K.E.; Sanchez, R.E.A.; Beck, A.; Pathan, J.L.; Davidson, S.; Wilson, A.; Keene, C.D.; de la Iglesia, H.; Jayadev, S.; et al. Microglia specific deletion of miR-155 in Alzheimer's disease mouse models reduces amyloid-beta pathology but causes hyperexcitability and seizures. J Neuroinflammation 2023, 20, 60. [Google Scholar] [CrossRef] [PubMed]
- Readhead, B.; Haure-Mirande, J.V.; Mastroeni, D.; Audrain, M.; Fanutza, T.; Kim, S.H.; Blitzer, R.D.; Gandy, S.; Dudley, J.T.; Ehrlich, M.E. miR155 regulation of behavior, neuropathology, and cortical transcriptomics in Alzheimer's disease. Acta Neuropathol 2020, 140, 295–315. [Google Scholar] [CrossRef] [PubMed]
- Chia, S.Y.; Vipin, A.; Ng, K.P.; Tu, H.; Bommakanti, A.; Wang, B.Z.; Tan, Y.J.; Zailan, F.Z.; Ng, A.S.L.; Ling, S.C.; et al. Upregulated Blood miR-150-5p in Alzheimer's Disease Dementia Is Associated with Cognition, Cerebrospinal Fluid Amyloid-beta, and Cerebral Atrophy. J Alzheimers Dis 2022, 88, 1567–1584. [Google Scholar] [CrossRef]
- Ianni, M.; Corraliza-Gomez, M.; Costa-Coelho, T.; Ferreira-Manso, M.; Inteiro-Oliveira, S.; Aleman-Serrano, N.; Sebastiao, A.M.; Garcia, G.; Diogenes, M.J.; Brites, D. Spatiotemporal Dysregulation of Neuron-Glia Related Genes and Pro-/Anti-Inflammatory miRNAs in the 5xFAD Mouse Model of Alzheimer's Disease. Int J Mol Sci 2024, 25. [Google Scholar] [CrossRef]
- Bales, K.R. The value and limitations of transgenic mouse models used in drug discovery for Alzheimer's disease: an update. Expert Opin Drug Discov 2012, 7, 281–297. [Google Scholar] [CrossRef] [PubMed]
Figure 1.
Robust neuroinflammatory activation in AD brain tissues (Braak-stage IV or higher). Heat-map showing the multiplex protein array of select innate immune-associated cytokines and chemokines (A.), and tissue remodeling factors (B.) in NC and AD brain tissue homogenates (n=3). Total RNA isolated from NC and AD brain tissues were analyzed by qPCR for relative expression of inflammatory markers (C.) ICAM1 (D.) IL-6, (E.) IL-1β, (F.) TNF mRNA (n=4). *p<0.05, **p<0.01, ***p<0.001 as analyzed by Student’s t-test.
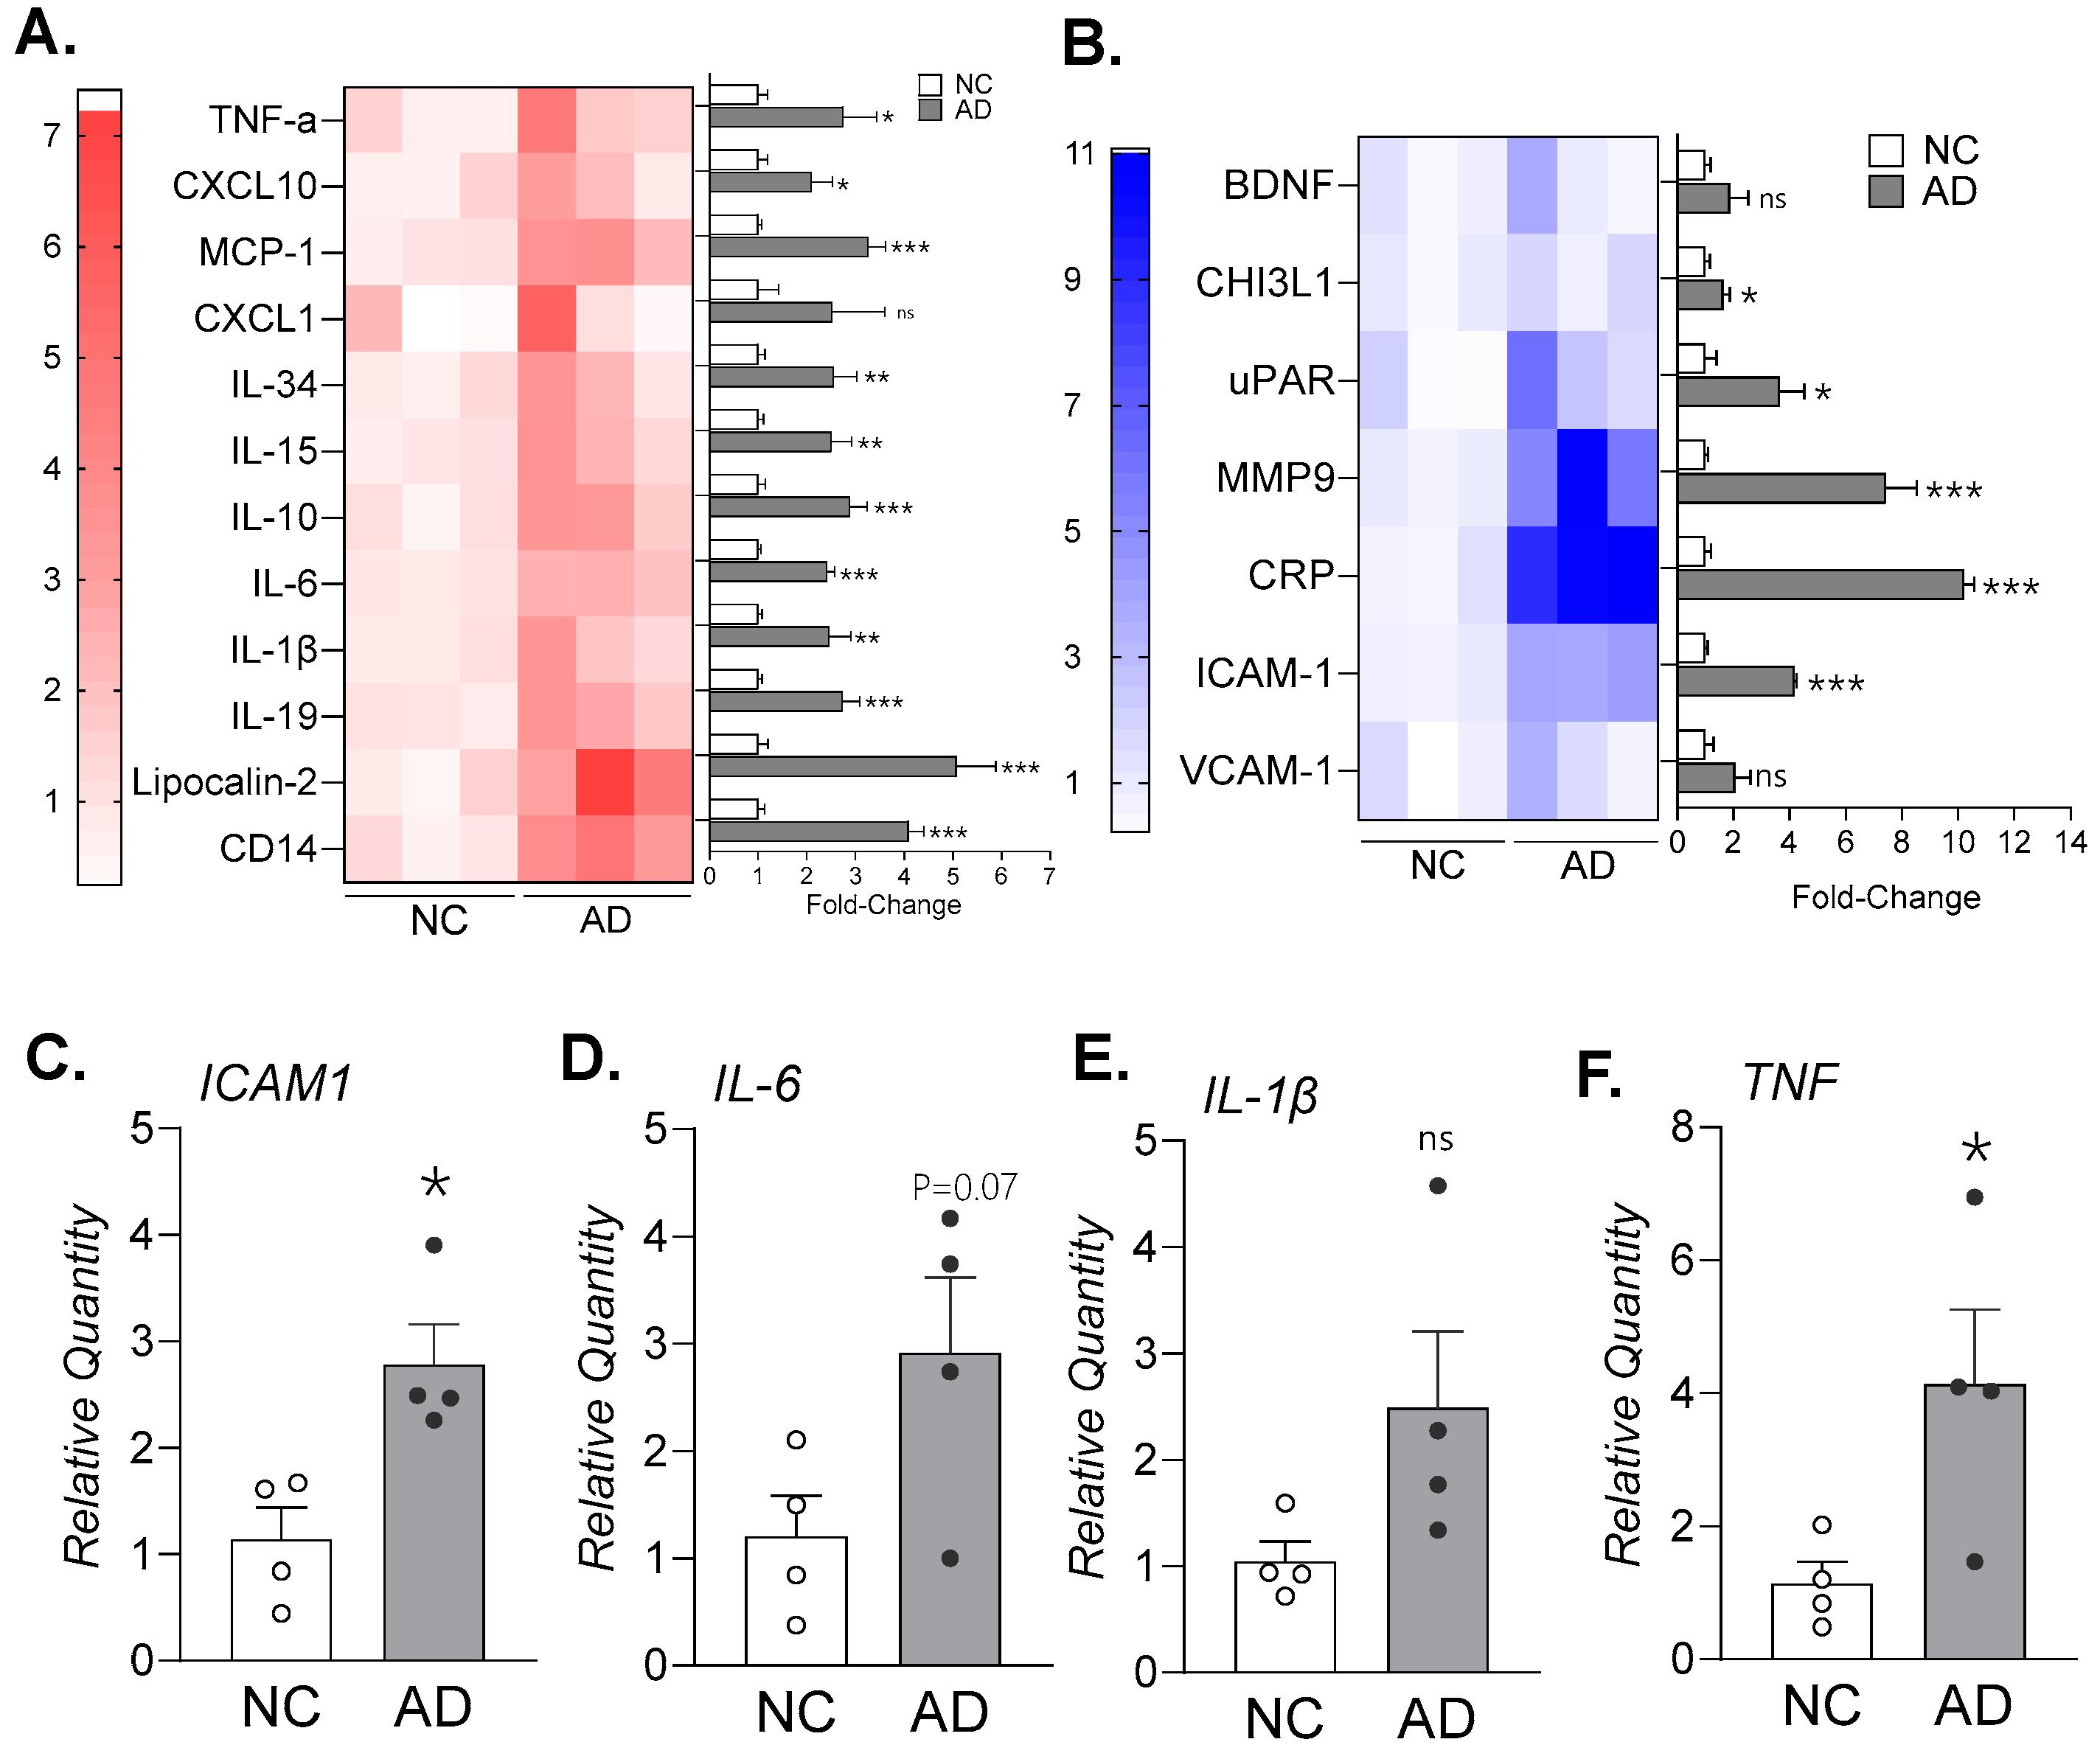
Figure 2.
Elevated LncRNA LIMASI expression in brain tissues of AD patients (Braak-stage IV or higher) and 3xTg-AD mice brain. Total RNA isolated from NC and AD brain tissues were analyzed by qPCR for relative expression of (A.) LIMASI transcript (n=4). (B.) Representative micrographs of brain cortex regions of NC and AD brain tissues stained for LIMASI transcripts (in red; scale -10µ) along with DAPI-stained nuclei (blue) by RNA-FISH analysis. Inner panels show magnified images of inset regions; arrows indicate LIMASI transcripts. (C.) The LIMASI transcript levels were quantified as histo-score (H-score). (n=3). **p<0.01, ***p<0.001 as analyzed by Student’s t-test. (D.) Representative micrographs of mouse brain tissues from wild-type (WT) C57BL/6 and 3xTg-AD mice for LIMASI (red) by RNA-FISH. Lower panels display magnified inset images of hippocampus brain regions immunostained for GFAP (green) to mark astrocytes; scale 250µ (upper panels), and 5µ (lower panels). Total RNA isolated from WT and 3xTg mice brain tissues were analyzed by qPCR for relative expression of (E.) LIMASI transcripts, (F.) Icam1, and (G.) Il-6 mRNA (n=3; **p<0.01, ***p<0.001 as analyzed by Student’s t-test).
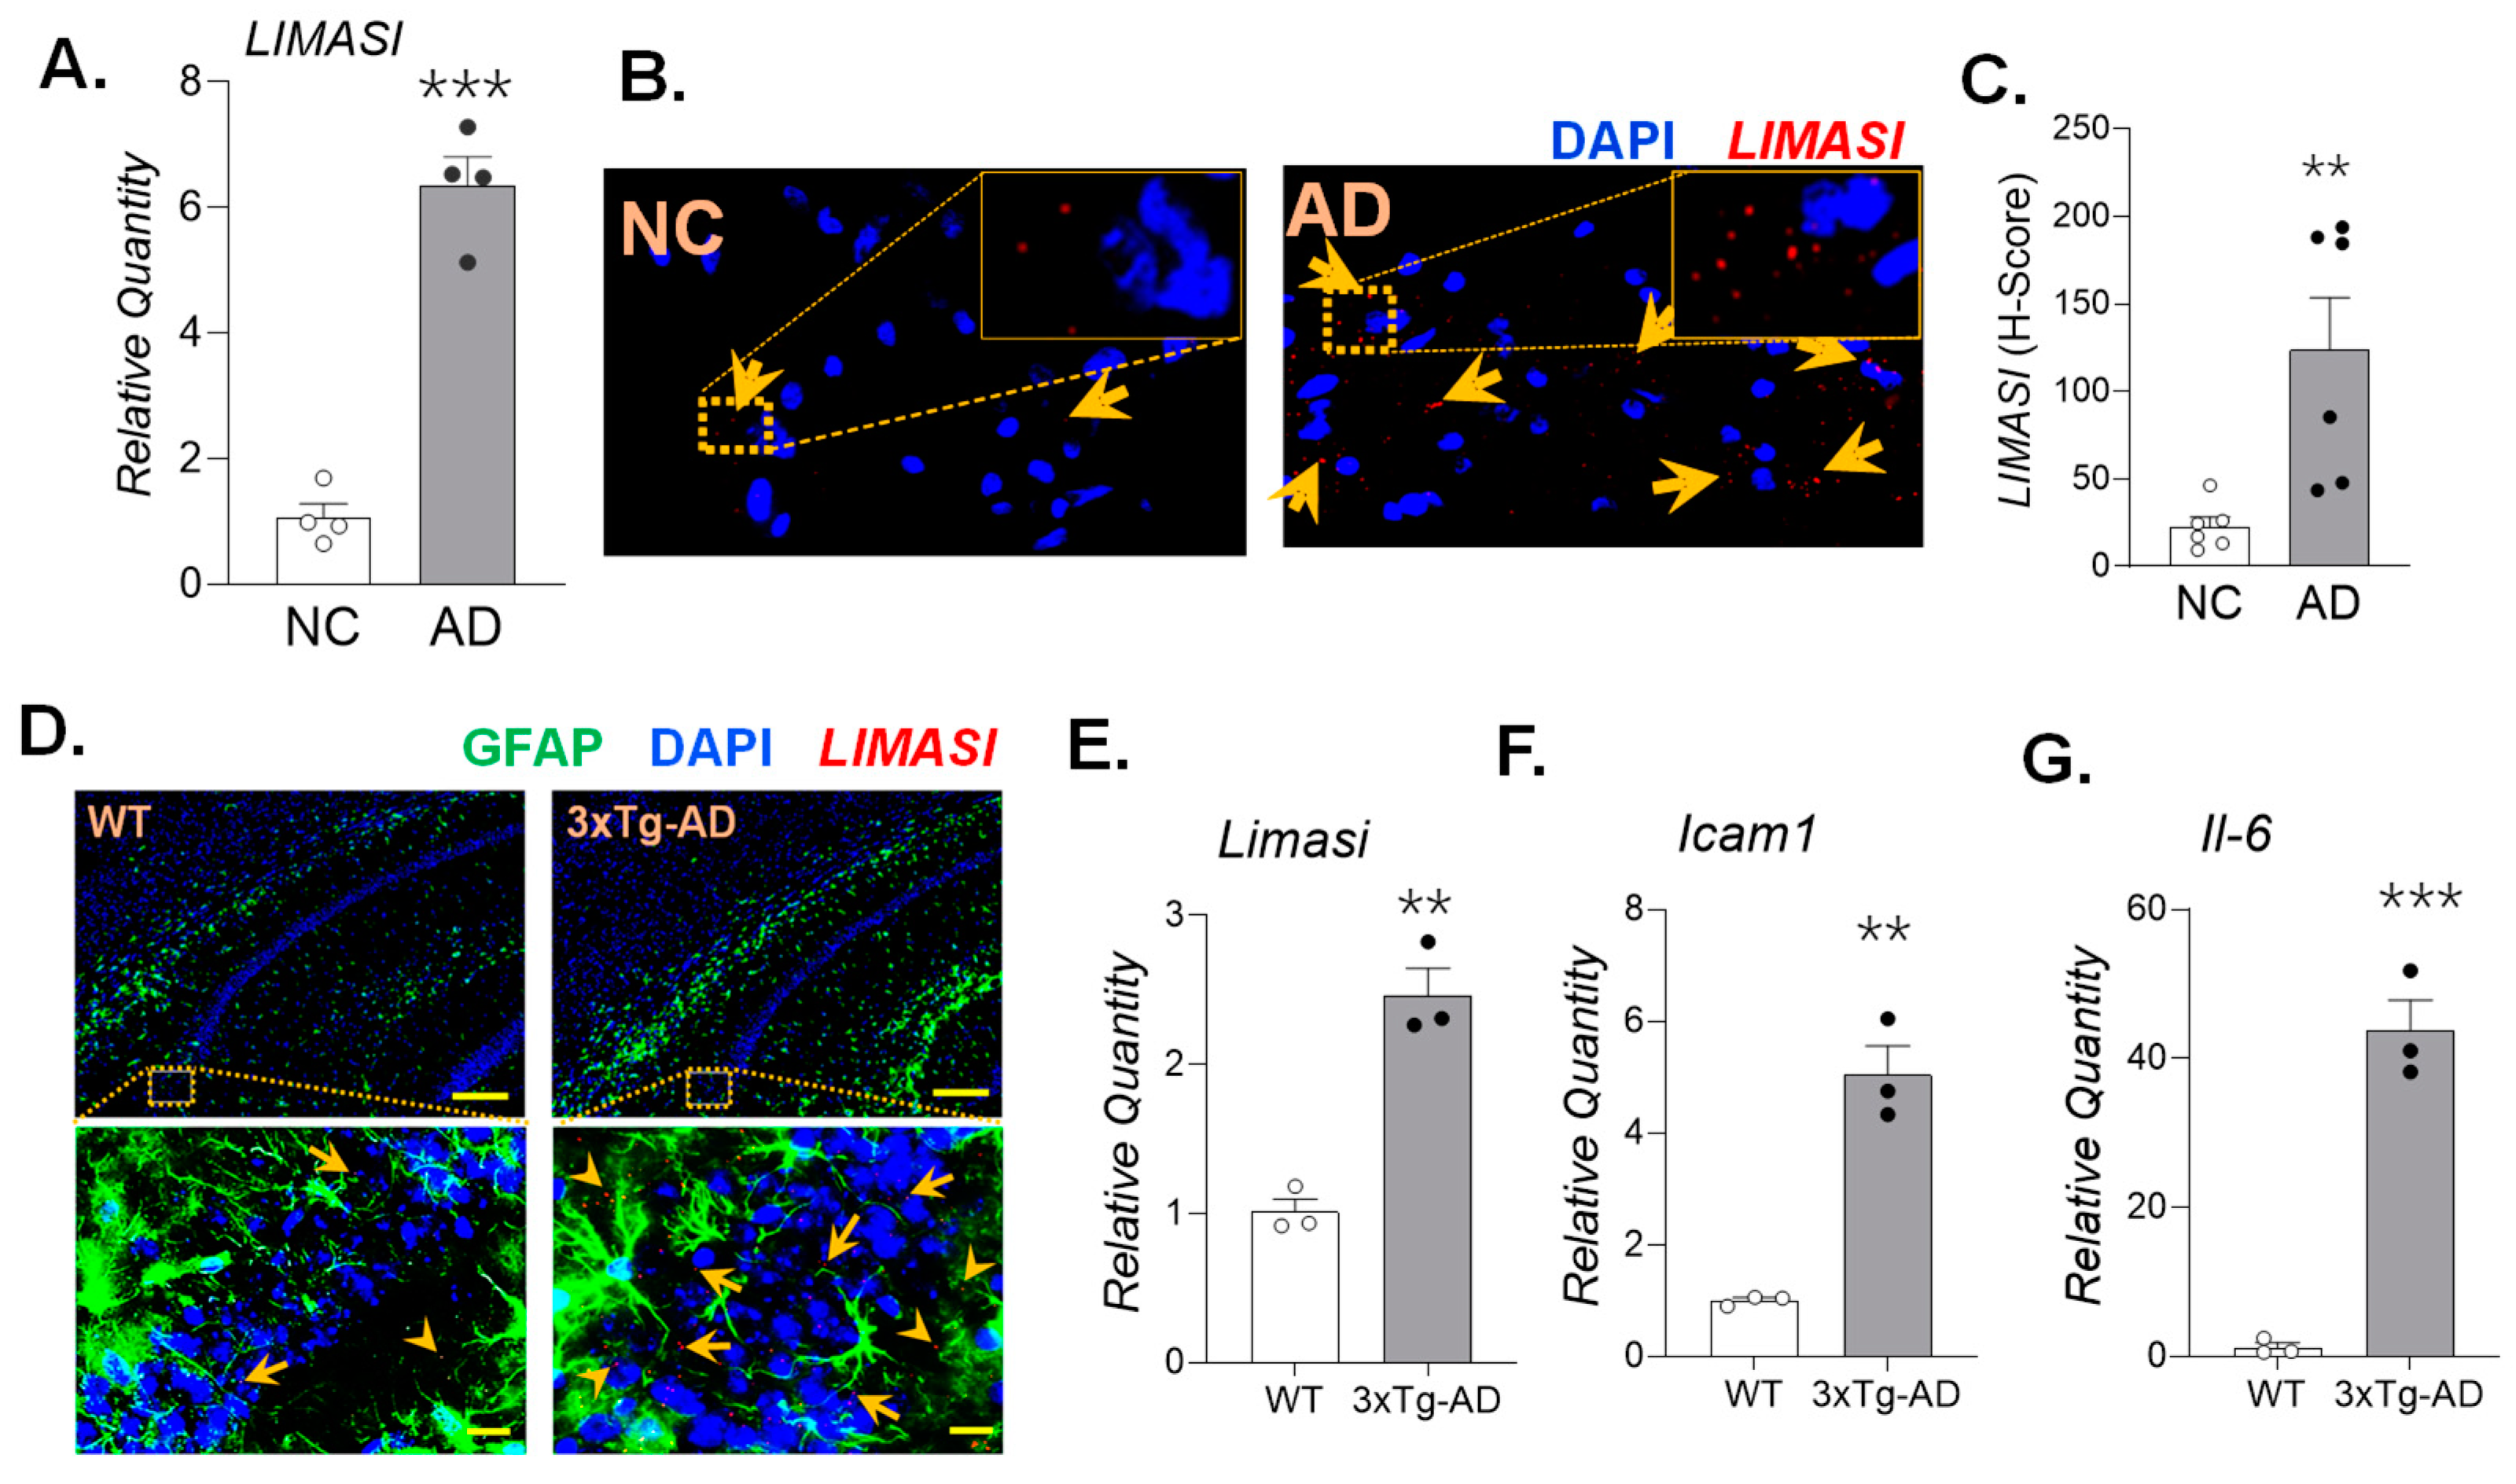
Figure 3.
Cell culture model of neuroinflammation using viral mimetic poly (I:C) challenge recapitulates the increased LIMASI lncRNA expression. The SH-SY5Y-APPSwe cells were treated with different doses (0, 5, 10, 25, 50 and 100 µg/ml) and incubation times (2, 24, and 48 h) of poly(I:C). Total RNA isolated from poly(I:C) treated cells were analyzed by qPCR for relative expression of LIMASI (A & F), ICAM1 (B & G), IL-6 (C & H), IL-1β (D & I) and TNF (E & J). (n=3) *p<0.05, **p<0.01, ***p<0.001 as analyzed by one-way ANOVA. (K.) Micrographs of SH-SY5Y-APPSwe cells showing LIMASI transcripts (red) as stained by RNA-FISH, scale – 10µm (L.) LIMASI transcripts expression per cell as quantified by H-score analysis. (n=4). *p<0.05, **p<0.01, ***p<0.001 as analyzed by Student’s t-test.
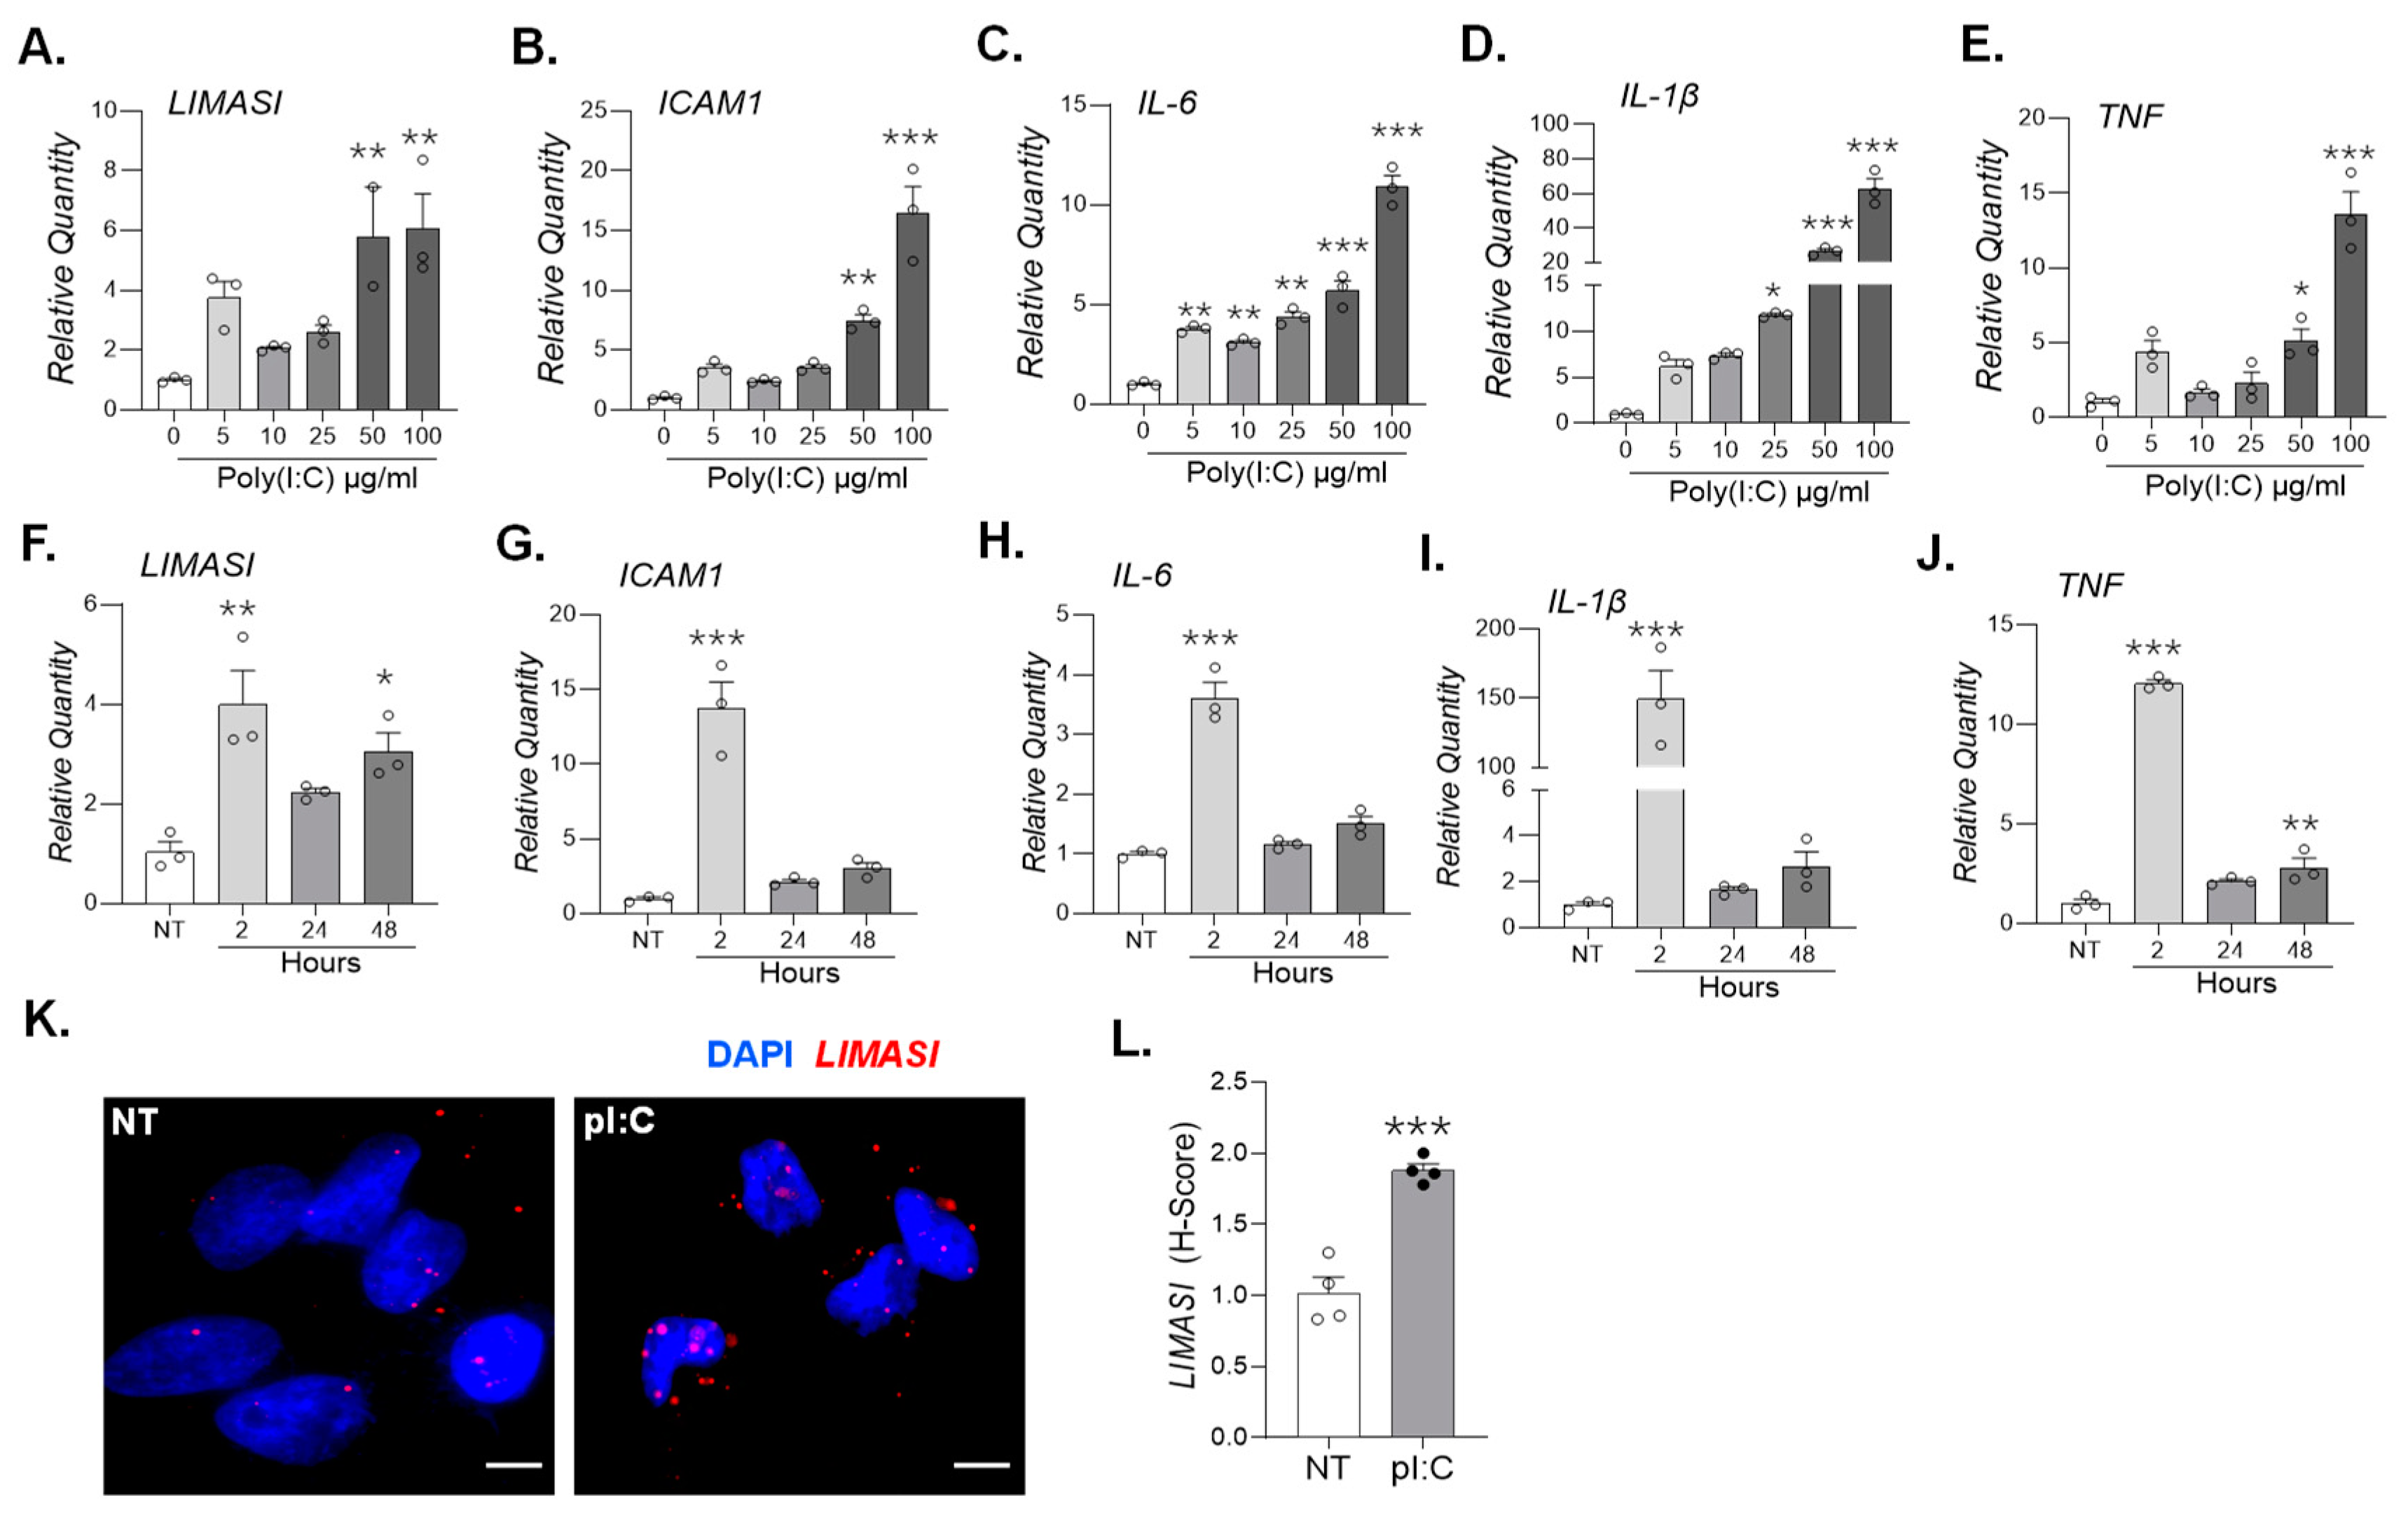
Figure 4.
In silico modeling analysis of potential miRNA interaction sites within the lncRNA LIMASI using the IntaRNA web server. (A.) Predicted base-pairing interaction between miR-1915-3p (nucleotides 6–20) and the exon 1 region of LIMASI (nucleotides 64–78). (B.) Predicted interaction of miR-122-5p with LIMASI exon 2, spanning nucleotides 171–204. (C.) Predicted binding of miR-155-5p (nucleotides 13–21) to the exon 2 region of LIMASI (nucleotides 324–332). (D.) Predicted interaction between miR-150-5p (nucleotides 1–16) and LIMASI exon 3 (nucleotides 797–806).
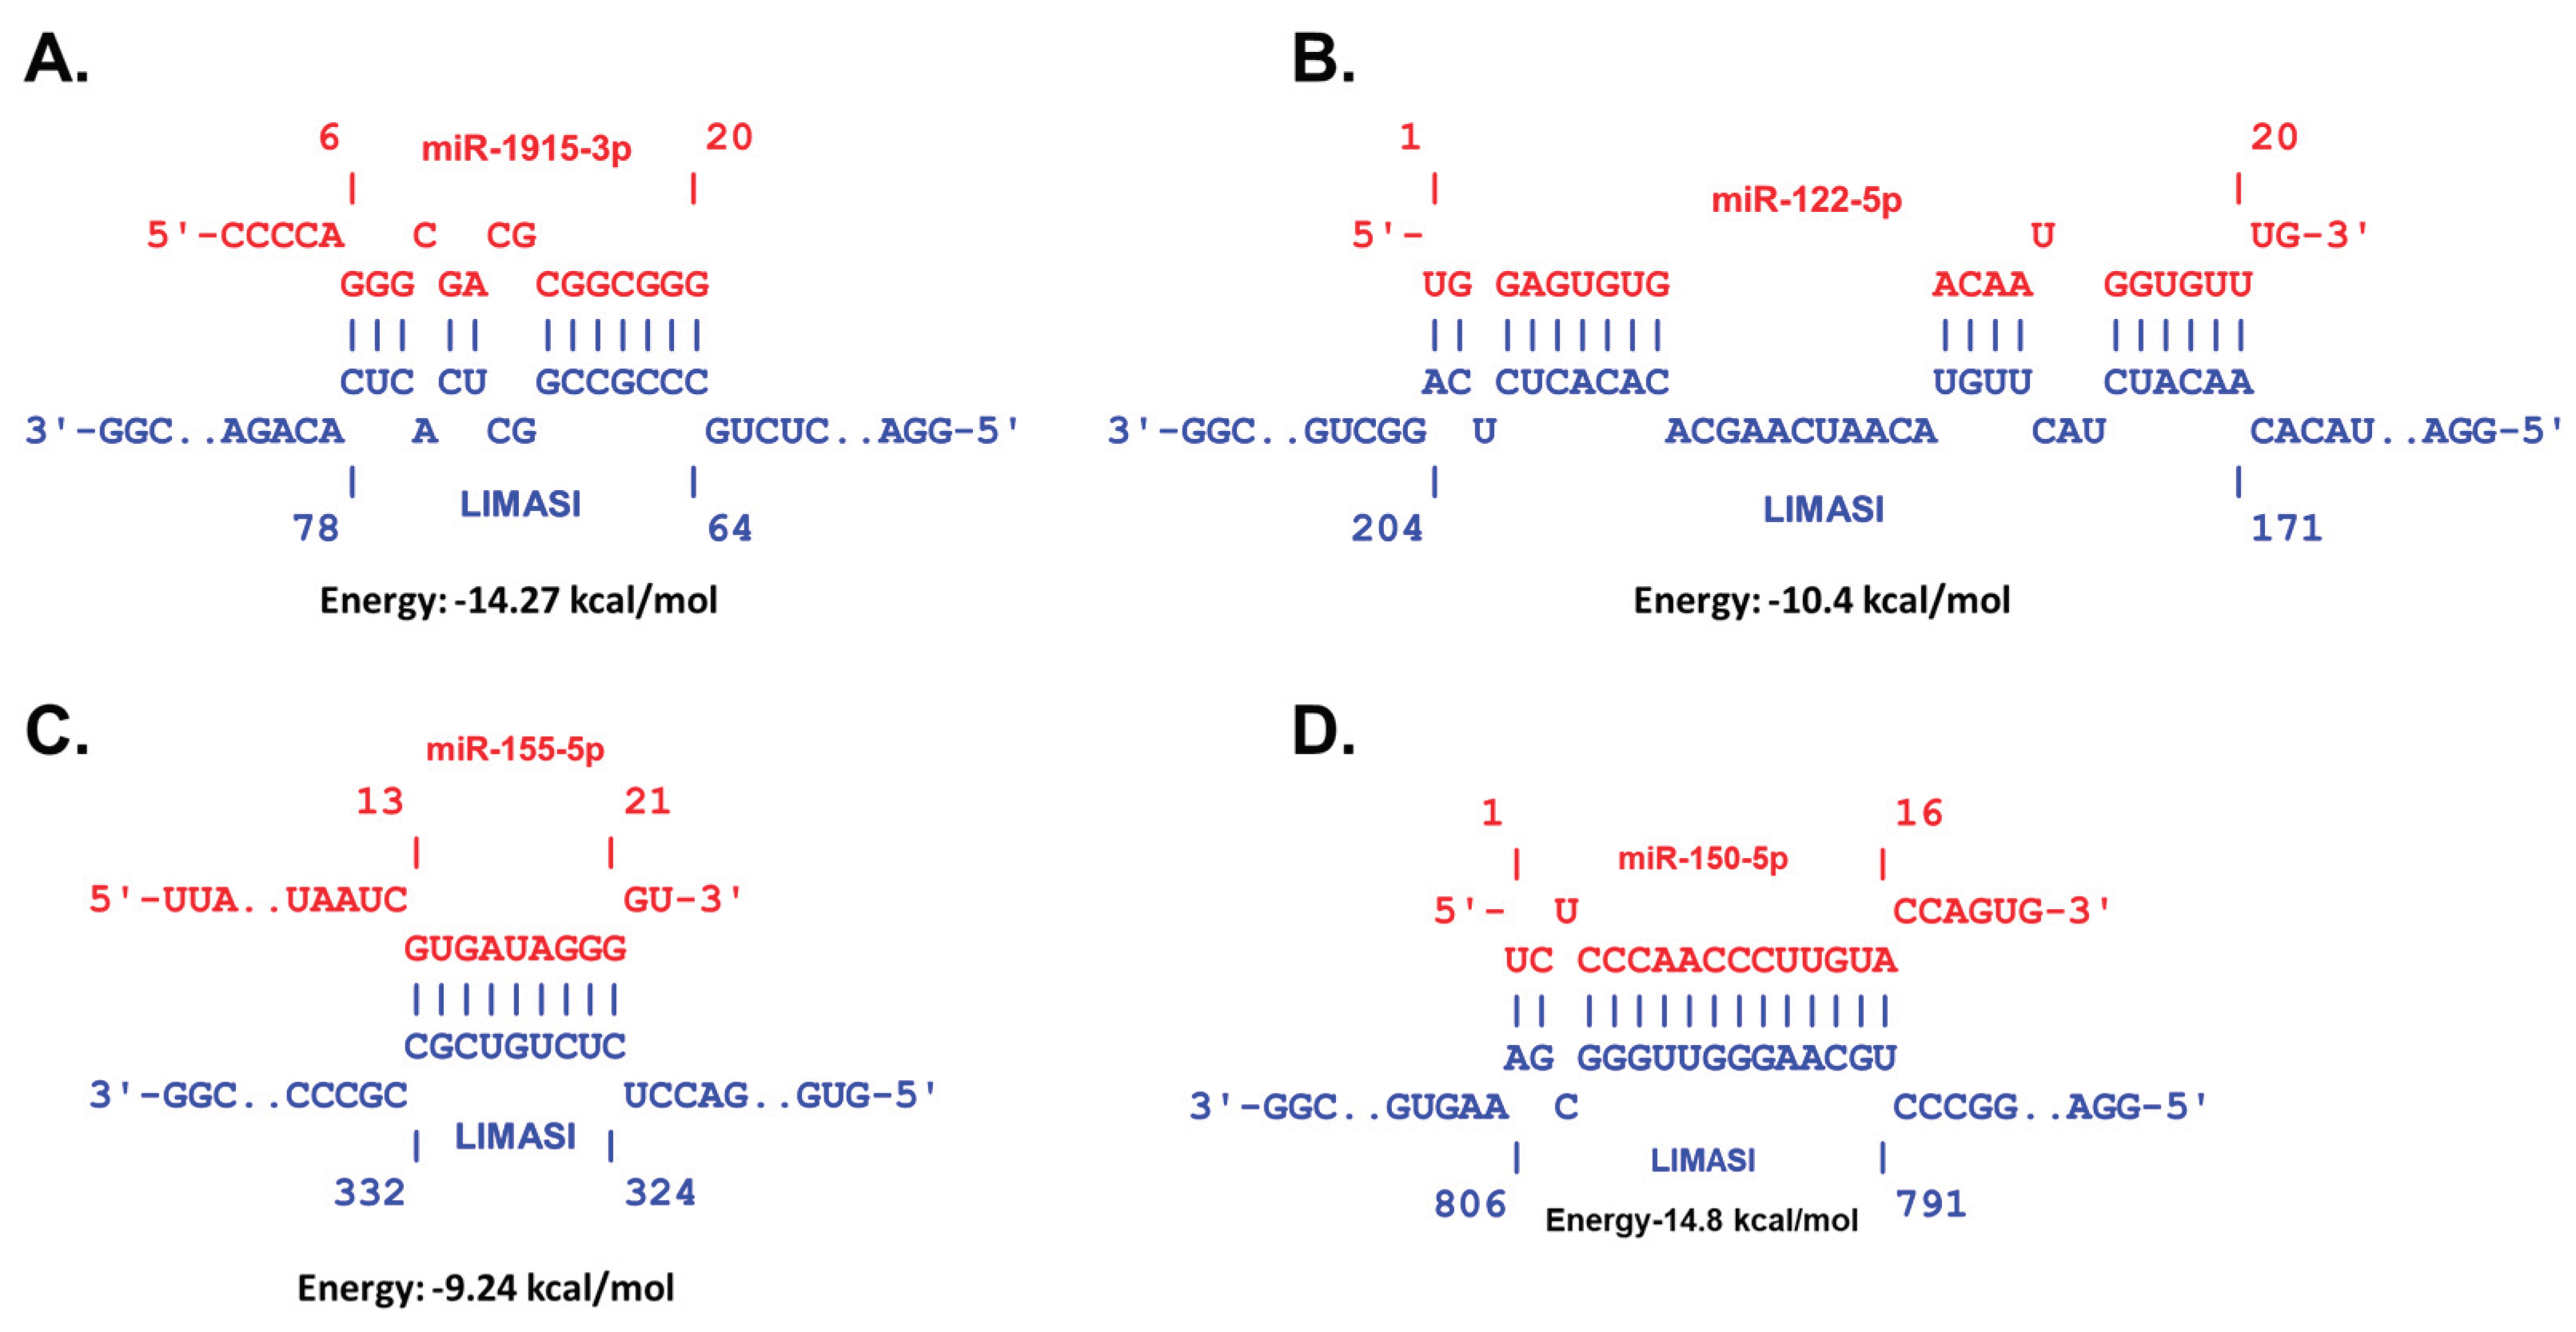

Table 1.
Demographics of the non-diseased controls (NC) and AD brain tissue donors.
| Donors | Samples | Gender (M/F) | Age (Y) | Avg. Age (Y) | PMI (h) | Avg. PMI (h) |
|---|---|---|---|---|---|---|
| Non-diseased Controls | C-1 | F | 88 | 75.1±3.6 | 17.06 | 19.20±1.82 |
| C-2 | M | 76 | 14.6 | |||
| C-3 | M | 77 | 17.06 | |||
| C-4 | M | 83 | 14.7 | |||
| NC-5 | F | 77 | 28.00 | |||
| NC-6 | M | 61 | 21.00 | |||
| NC-7 | M | 64 | 22.00 | |||
| NC-11 | NA | NA | NA | |||
| NC-12 | NA | NA | NA | |||
| AD patients | A-5 | M | 95 | 81.7±3.5 | 15.00 | 16.38±2.50 |
| A-6 | M | 82 | 17.45 | |||
| A-7 | M | 72 | 16.08 | |||
| A-8 | M | 84 | 6.66 | |||
| AD-11 | M | 90 | 24.00 | |||
| AD-12 | F | 84 | 22.08 | |||
| AD-1 | F | 83 | 6.92 | |||
| AD-2 | M | 86 | 10.92 | |||
| AD-3 | F | 59 | 28.33 |
The gender distribution of male/female (M/F), age in years (Y), and the postmortem interval (PMI) for tissue collection in hours (h); NA-not available.
Disclaimer/Publisher’s Note: The statements, opinions and data contained in all publications are solely those of the individual author(s) and contributor(s) and not of MDPI and/or the editor(s). MDPI and/or the editor(s) disclaim responsibility for any injury to people or property resulting from any ideas, methods, instructions or products referred to in the content. |
© 2026 by the authors. Licensee MDPI, Basel, Switzerland. This article is an open access article distributed under the terms and conditions of the Creative Commons Attribution (CC BY) license (http://creativecommons.org/licenses/by/4.0/).
Copyright: This open access article is published under a Creative Commons CC BY 4.0 license, which permit the free download, distribution, and reuse, provided that the author and preprint are cited in any reuse.


