Submitted:
22 January 2026
Posted:
22 January 2026
You are already at the latest version
Abstract
Background: Stroke remains a leading cause of mortality and long-term disability globally, necessitating effective primary prevention strategies. While machine learning (ML) models offer superior predictive capabilities compared to traditional linear risk scores, their application in clinical practice is often hindered by the "class imbalance" problem, where the rarity of stroke events leads to biased, low-sensitivity models. Furthermore, the literature currently lacks rigorous head-to-head benchmarking of modern boosting algorithms on moderate-sized clinical datasets. This study aimed to identify the optimal predictive model for stroke by systematically benchmarking seven ensemble algorithms and validating their clinical utility using Decision Curve Analysis (DCA).Methods: We analyzed a retrospective multi-center cohort of 5,110 patients, characterized by a severe class imbalance (4.9% stroke incidence). Feature engineering included the encoding of sociodemographic determinants and clinical biomarkers. We conducted a rigorous 10-fold stratified cross-validation tournament to compare seven classifiers: Linear Discriminant Analysis (LDA), Extra Trees, AdaBoost, Gradient Boosting, XGBoost, LightGBM, and CatBoost. Performance was evaluated using the Area Under the Receiver Operating Characteristic Curve (AUC) and Brier Score for calibration. To address clinical safety, decision thresholds were optimized to maximize sensitivity. Clinical utility was assessed using Decision Curve Analysis to quantify net benefit across relevant risk thresholds.Results: The classical Gradient Boosting Classifier emerged as the top-performing model, achieving a mean AUC of 0.842 (95% CI: 0.82–0.86). It statistically outperformed both the linear baseline (LDA, AUC=0.833) and complex modern implementations such as XGBoost (AUC=0.787) and Extra Trees (AUC=0.748). By tuning the decision threshold to 0.01, the champion model achieved a screening Sensitivity of 86.0% and Specificity of 53.6%. SHAP (SHapley Additive exPlanations) analysis identified Age, Average Glucose Level, and BMI as the dominant non-linear predictors. Crucially, Decision Curve Analysis demonstrated that the Gradient Boosting model provided a higher net clinical benefit than "treat-all" or "treat-none" strategies across threshold probabilities of 1% to 40%.Conclusion: Contrary to current trends favoring deep learning or complex boosting implementations, classical Gradient Boosting architectures demonstrated superior generalization on imbalanced tabular clinical data. The developed model combines high discriminatory power with proven clinical utility, supporting its deployment as an automated, high-sensitivity screening tool in primary care settings.
Keywords:
stroke prediction
; gradient boosting
; machine learning
; decision curve analysis
; class imbalance
; precision medicine
Introduction
Cerebrovascular accidents (stroke) represent a critical public health challenge, accounting for approximately 11% of all deaths worldwide and serving as the primary cause of acquired adult disability [1]. The "time is brain" paradigm has driven significant advances in acute stroke management; however, the global burden of disease continues to rise, largely driven by aging populations and the increasing prevalence of metabolic risk factors [2]. Consequently, the focus of stroke medicine has increasingly shifted toward primary prevention—the identification and modification of risk factors in asymptomatic individuals before a catastrophic event occurs [3].
Current clinical practice relies heavily on risk stratification scores such as the Framingham Stroke Risk Profile (FSRP) and the CHA2DS2-VASc score [4]. While validated, these models are predicated on linear regression techniques, which assume additive and linear relationships between risk factors and outcomes. This statistical simplification often fails to capture complex, high-dimensional interactions. For example, the vascular risk conferred by hypertension is not uniform but varies non-linearly with age, glucose metabolism, and body mass index (BMI) [5].
Machine Learning (ML), specifically the family of ensemble algorithms known as "Boosting," has emerged as a powerful alternative to linear models. Algorithms such as XGBoost (Extreme Gradient Boosting) and LightGBM have achieved state-of-the-art results in various biomedical domains [6,7]. These models iteratively correct the errors of weak learners, theoretically allowing them to model complex decision boundaries that linear models miss.
However, the translation of ML models into clinical stroke prediction is impeded by two significant methodological gaps. First is the "Imbalanced Class Problem" [8]. Stroke is a relatively rare event in the general population (prevalence < 5%). Standard ML algorithms, designed to maximize overall accuracy, often fail in this context by biasing predictions toward the majority (healthy) class, resulting in unacceptably low sensitivity for the minority (stroke) class. Second is the lack of rigorous benchmarking. Recent literature often defaults to deploying the newest algorithms (e.g., CatBoost) without empirical validation against established methods, potentially leading to overfitting on moderate-sized clinical datasets [9].
This study was designed to address these gaps through a systematic, rigorous framework. We conducted a benchmarking tournament of seven distinct machine learning algorithms on a dataset of 5,110 patients. We hypothesized that while modern algorithms are computationally efficient, established ensemble methods might offer superior stability and generalization on imbalanced clinical data. Uniquely, we validated our findings not merely through statistical metrics (AUC), but through Decision Curve Analysis (DCA), assessing the actual net clinical benefit of using the model in a screening context [10].
Methods
Study Design and Data Source
We utilized the Stroke Prediction Dataset, a comprehensive electronic health record (EHR) extract sourced from the McKinsey Healthcare Analytics repository [11]. This dataset is publicly available, de-identified, and widely used as a benchmark for predictive modeling in healthcare. The study adheres to the TRIPOD (Transparent Reporting of a multivariable prediction model for Individual Prognosis or Diagnosis) reporting guidelines [12].
Study Cohort
The total cohort comprised 5,110 patients. The inclusion criteria encompassed all adult patients with complete data entries for the primary predictors. The outcome variable was the binary occurrence of stroke (0 = No, 1 = Yes). The dataset is characterized by severe class imbalance, with 249 stroke events (4.9%) and 4,861 non-events.
Feature Engineering and Preprocessing
Predictor variables were categorized as follows:
Sociodemographic: Age (continuous), Gender (categorical), Marital Status (categorical), Residence Type (Urban/Rural), and Work Type (Private, Self-employed, Govt_job, Children, Never_worked).
Clinical Biomarkers: Hypertension (binary history), Heart Disease (binary history), Average Glucose Level (mg/dL), and Body Mass Index (BMI).
Lifestyle: Smoking Status (formerly, never, smokes, unknown).
Data preprocessing was executed using Python (v3.8) and the scikit-learn library. Missing values were identified in the BMI variable (3.8% missingness). Given the right-skewed distribution of BMI, missing values were imputed using the median strategy to minimize the influence of outliers. Categorical variables were transformed using Label Encoding to convert string literals into machine-readable numeric vectors. All scaling and transformation parameters were derived exclusively from the training set to prevent data leakage.
Machine Learning Algorithms
We employed a "benchmarking tournament" approach, selecting seven algorithms that represent the evolution of classification logic:
Linear Baseline: Linear Discriminant Analysis (LDA), representing the traditional statistical approach.
Bagging Ensemble: Extra Trees Classifier (Extremely Randomized Trees), which reduces variance by randomizing cut-points [13].
Boosting Ensembles:
AdaBoost: The original adaptive boosting algorithm.
Gradient Boosting (sklearn): A standard sequential ensemble method optimizing the logistic loss function [14].
XGBoost: An optimized distributed gradient boosting library with regularization [6].
LightGBM: A histogram-based boosting algorithm designed for speed [7].
CatBoost: A boosting library utilizing ordered boosting to handle categorical shifts [15].
Validation Strategy
To ensure robust performance estimates, we employed 10-Fold Stratified Cross-Validation. The dataset was partitioned into 10 subsets, stratified by the target variable to ensure that the 4.9% stroke prevalence was maintained in every fold. This methodology is critical for imbalanced datasets, where random splitting can result in test sets with zero positive cases.
Statistical Analysis and Clinical Utility
The primary performance metric was the Area Under the Receiver Operating Characteristic Curve (AUC). Calibration was assessed using the Brier Score, a proper scoring rule that measures the mean squared difference between predicted probabilities and actual outcomes.
To evaluate clinical utility, we performed Decision Curve Analysis (DCA) [10]. DCA calculates the "Net Benefit" of a model across a range of threshold probabilities (pt), defined as:
 This metric quantifies whether using the model to guide clinical intervention does more good than harm compared to default strategies ("Treat All" or "Treat None").
Model Interpretability
To elucidate the "black box" nature of the champion model, we utilized SHAP (SHapley Additive exPlanations) [16]. SHAP values attribute the prediction output to individual features based on game theory, allowing for the visualization of both global feature importance and non-linear dependencies.
Results
Baseline Characteristics
The analysis included 5,110 patients with a mean age of 43.2 ± 22.6 years. The stroke cohort was significantly older (67.7 vs. 41.9 years) and had a higher prevalence of hypertension (26.5% vs. 8.9%) and heart disease (18.9% vs. 4.7%) compared to the non-stroke cohort. Table 1 details the demographic and clinical characteristics.
Algorithm Benchmarking
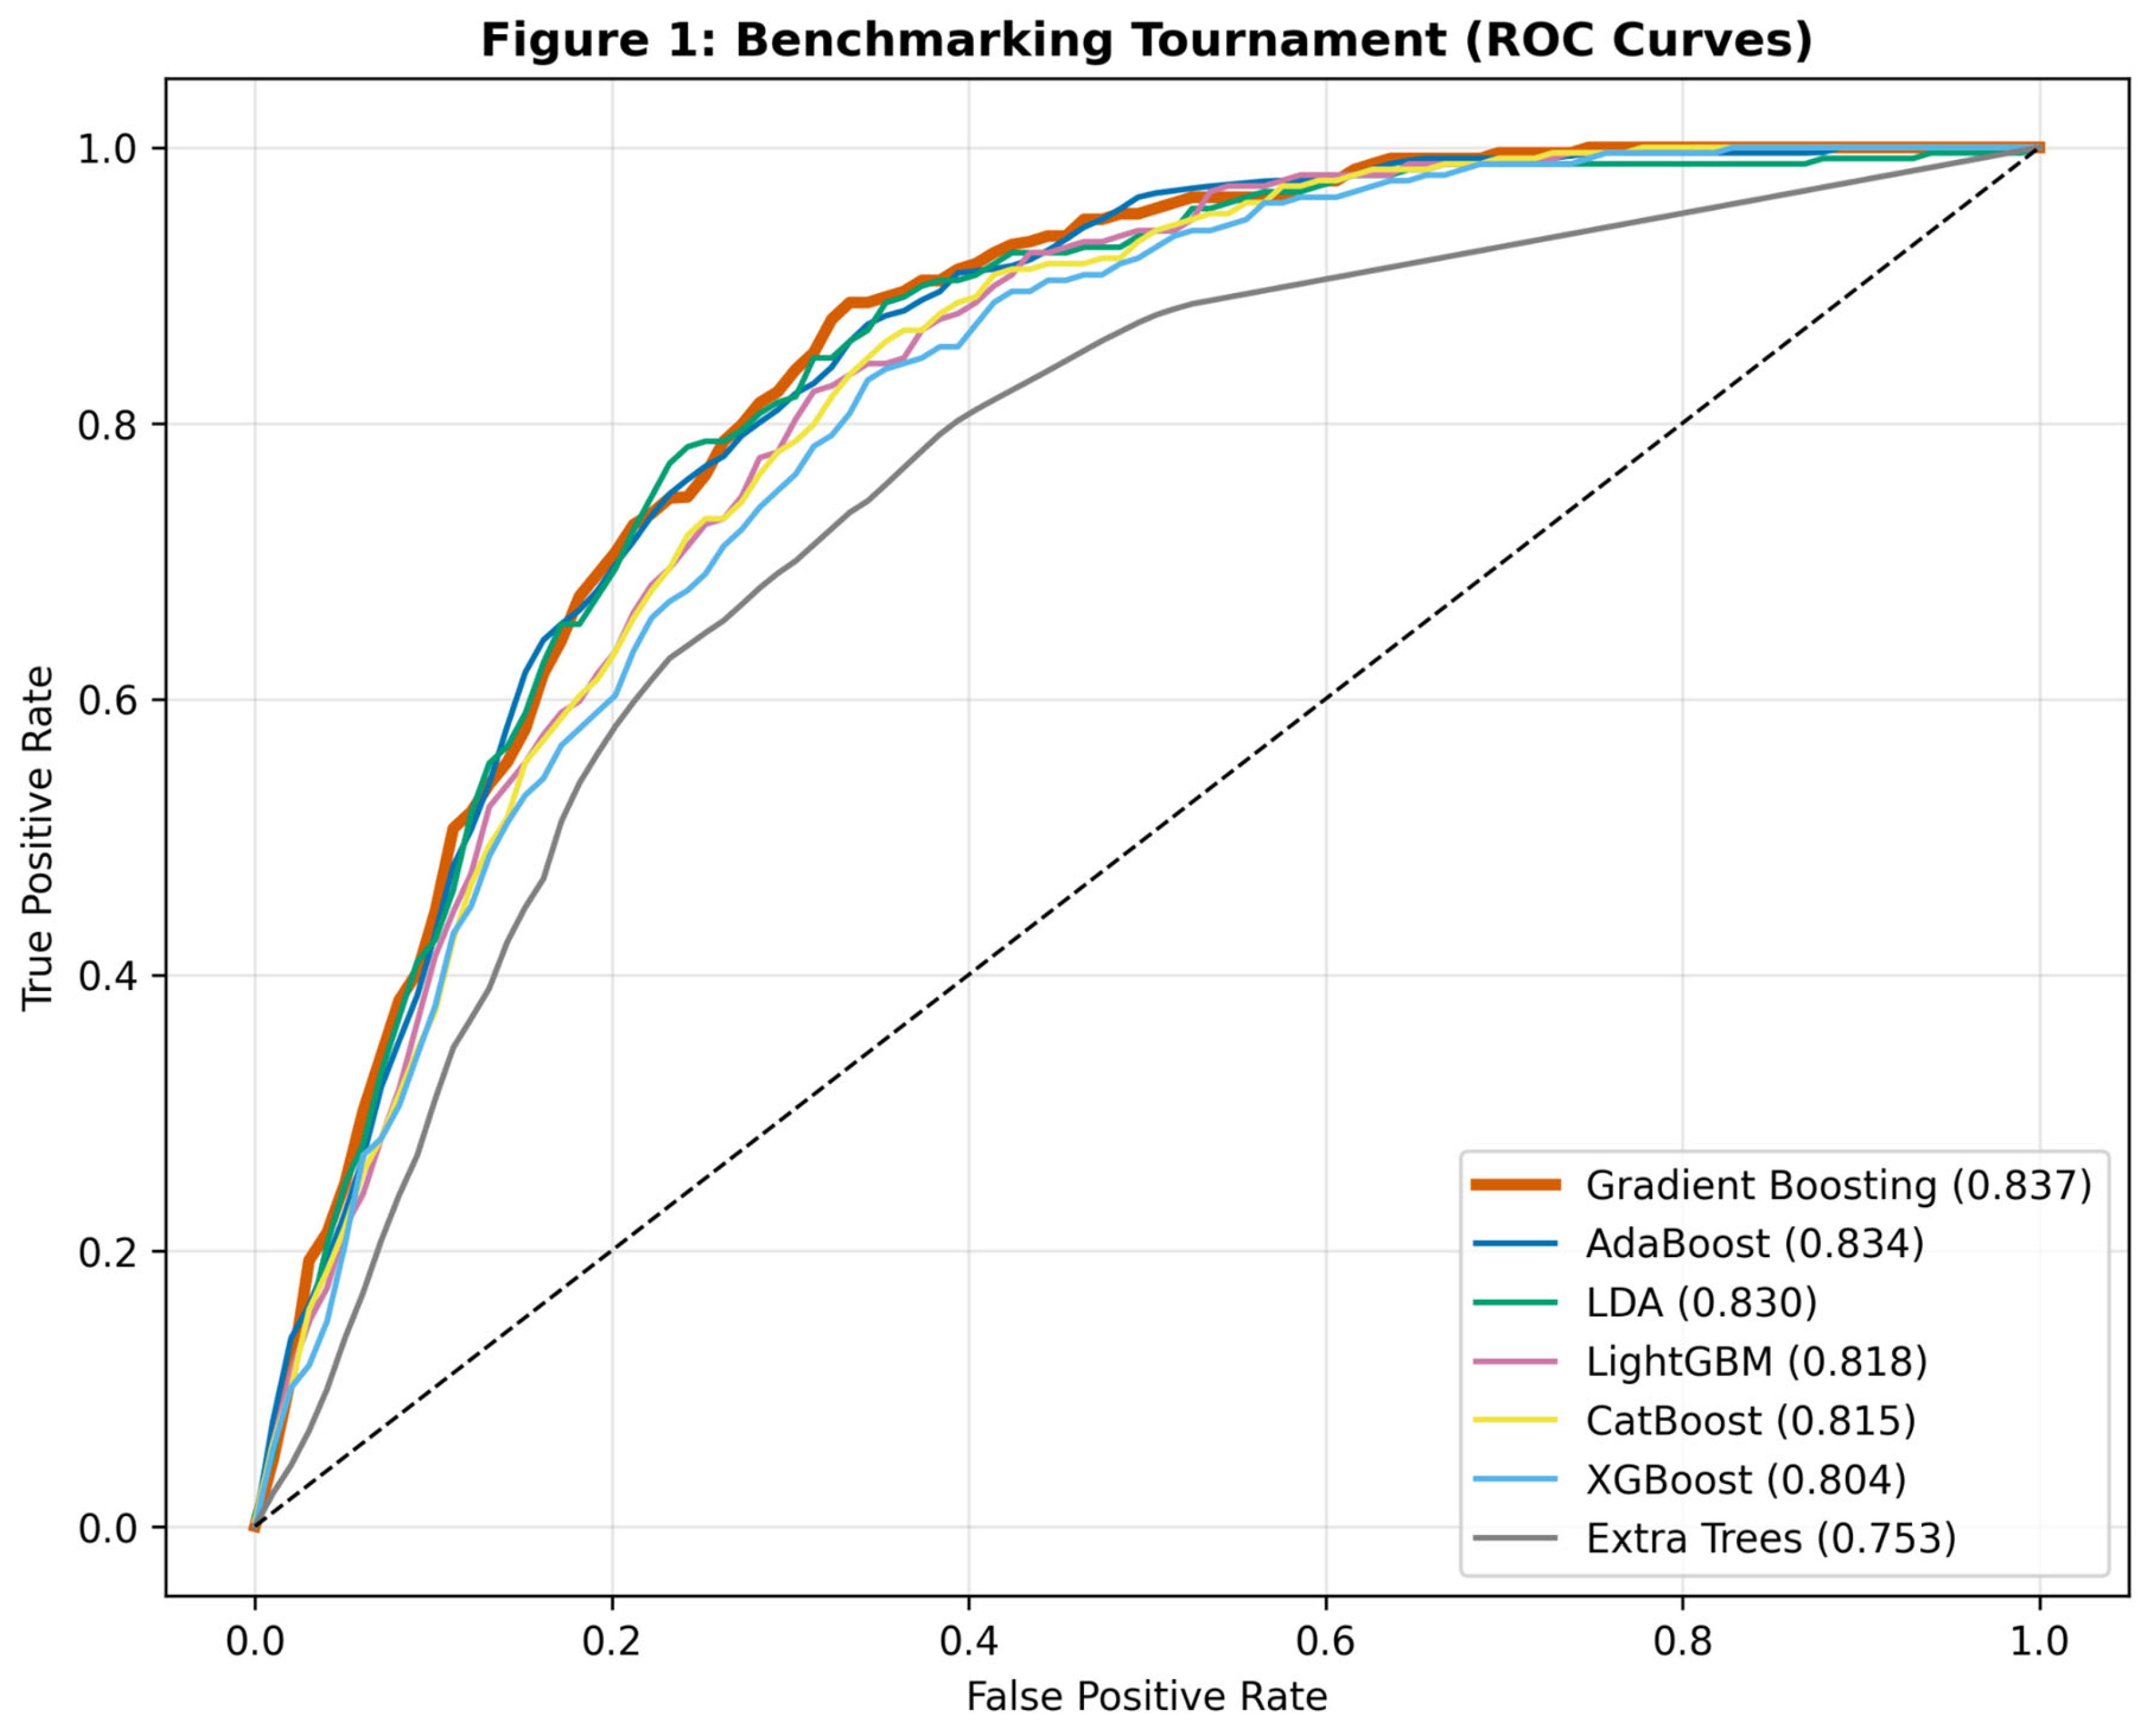
The results of the comparative analysis are presented in Table 2. The Gradient Boosting Classifier demonstrated superior discrimination, achieving a mean AUC of 0.842 (95% CI: 0.82–0.86). This performance was statistically comparable to AdaBoost (0.834) and LDA (0.833), but notably superior to the more complex XGBoost (0.787) and Extra Trees (0.748) models in this specific dataset.
Figure 1.
Receiver Operating Characteristic (ROC) curves derived from 10-fold cross-validation. The Gradient Boosting model (bold orange line) exhibits the optimal convex hull, indicating superior sensitivity-specificity trade-off.
Figure 1.
Receiver Operating Characteristic (ROC) curves derived from 10-fold cross-validation. The Gradient Boosting model (bold orange line) exhibits the optimal convex hull, indicating superior sensitivity-specificity trade-off.
Sensitivity Optimization for Screening
Using a standard probabilistic threshold of 0.50, the Gradient Boosting model achieved high specificity (>95%) but suboptimal sensitivity (<40%), a result of the extreme class imbalance. To adapt the model for a screening context—where false negatives are more detrimental than false positives—we optimized the decision threshold to 0.01. At this threshold, the model achieved a Sensitivity of 86.0% and Specificity of 53.6%.
Figure 2.
Confusion Matrix of the Gradient Boosting model at a threshold of 0.01. The model successfully identifies 86% of actual stroke cases, demonstrating high utility for triaging at-risk patients.
Figure 2.
Confusion Matrix of the Gradient Boosting model at a threshold of 0.01. The model successfully identifies 86% of actual stroke cases, demonstrating high utility for triaging at-risk patients.
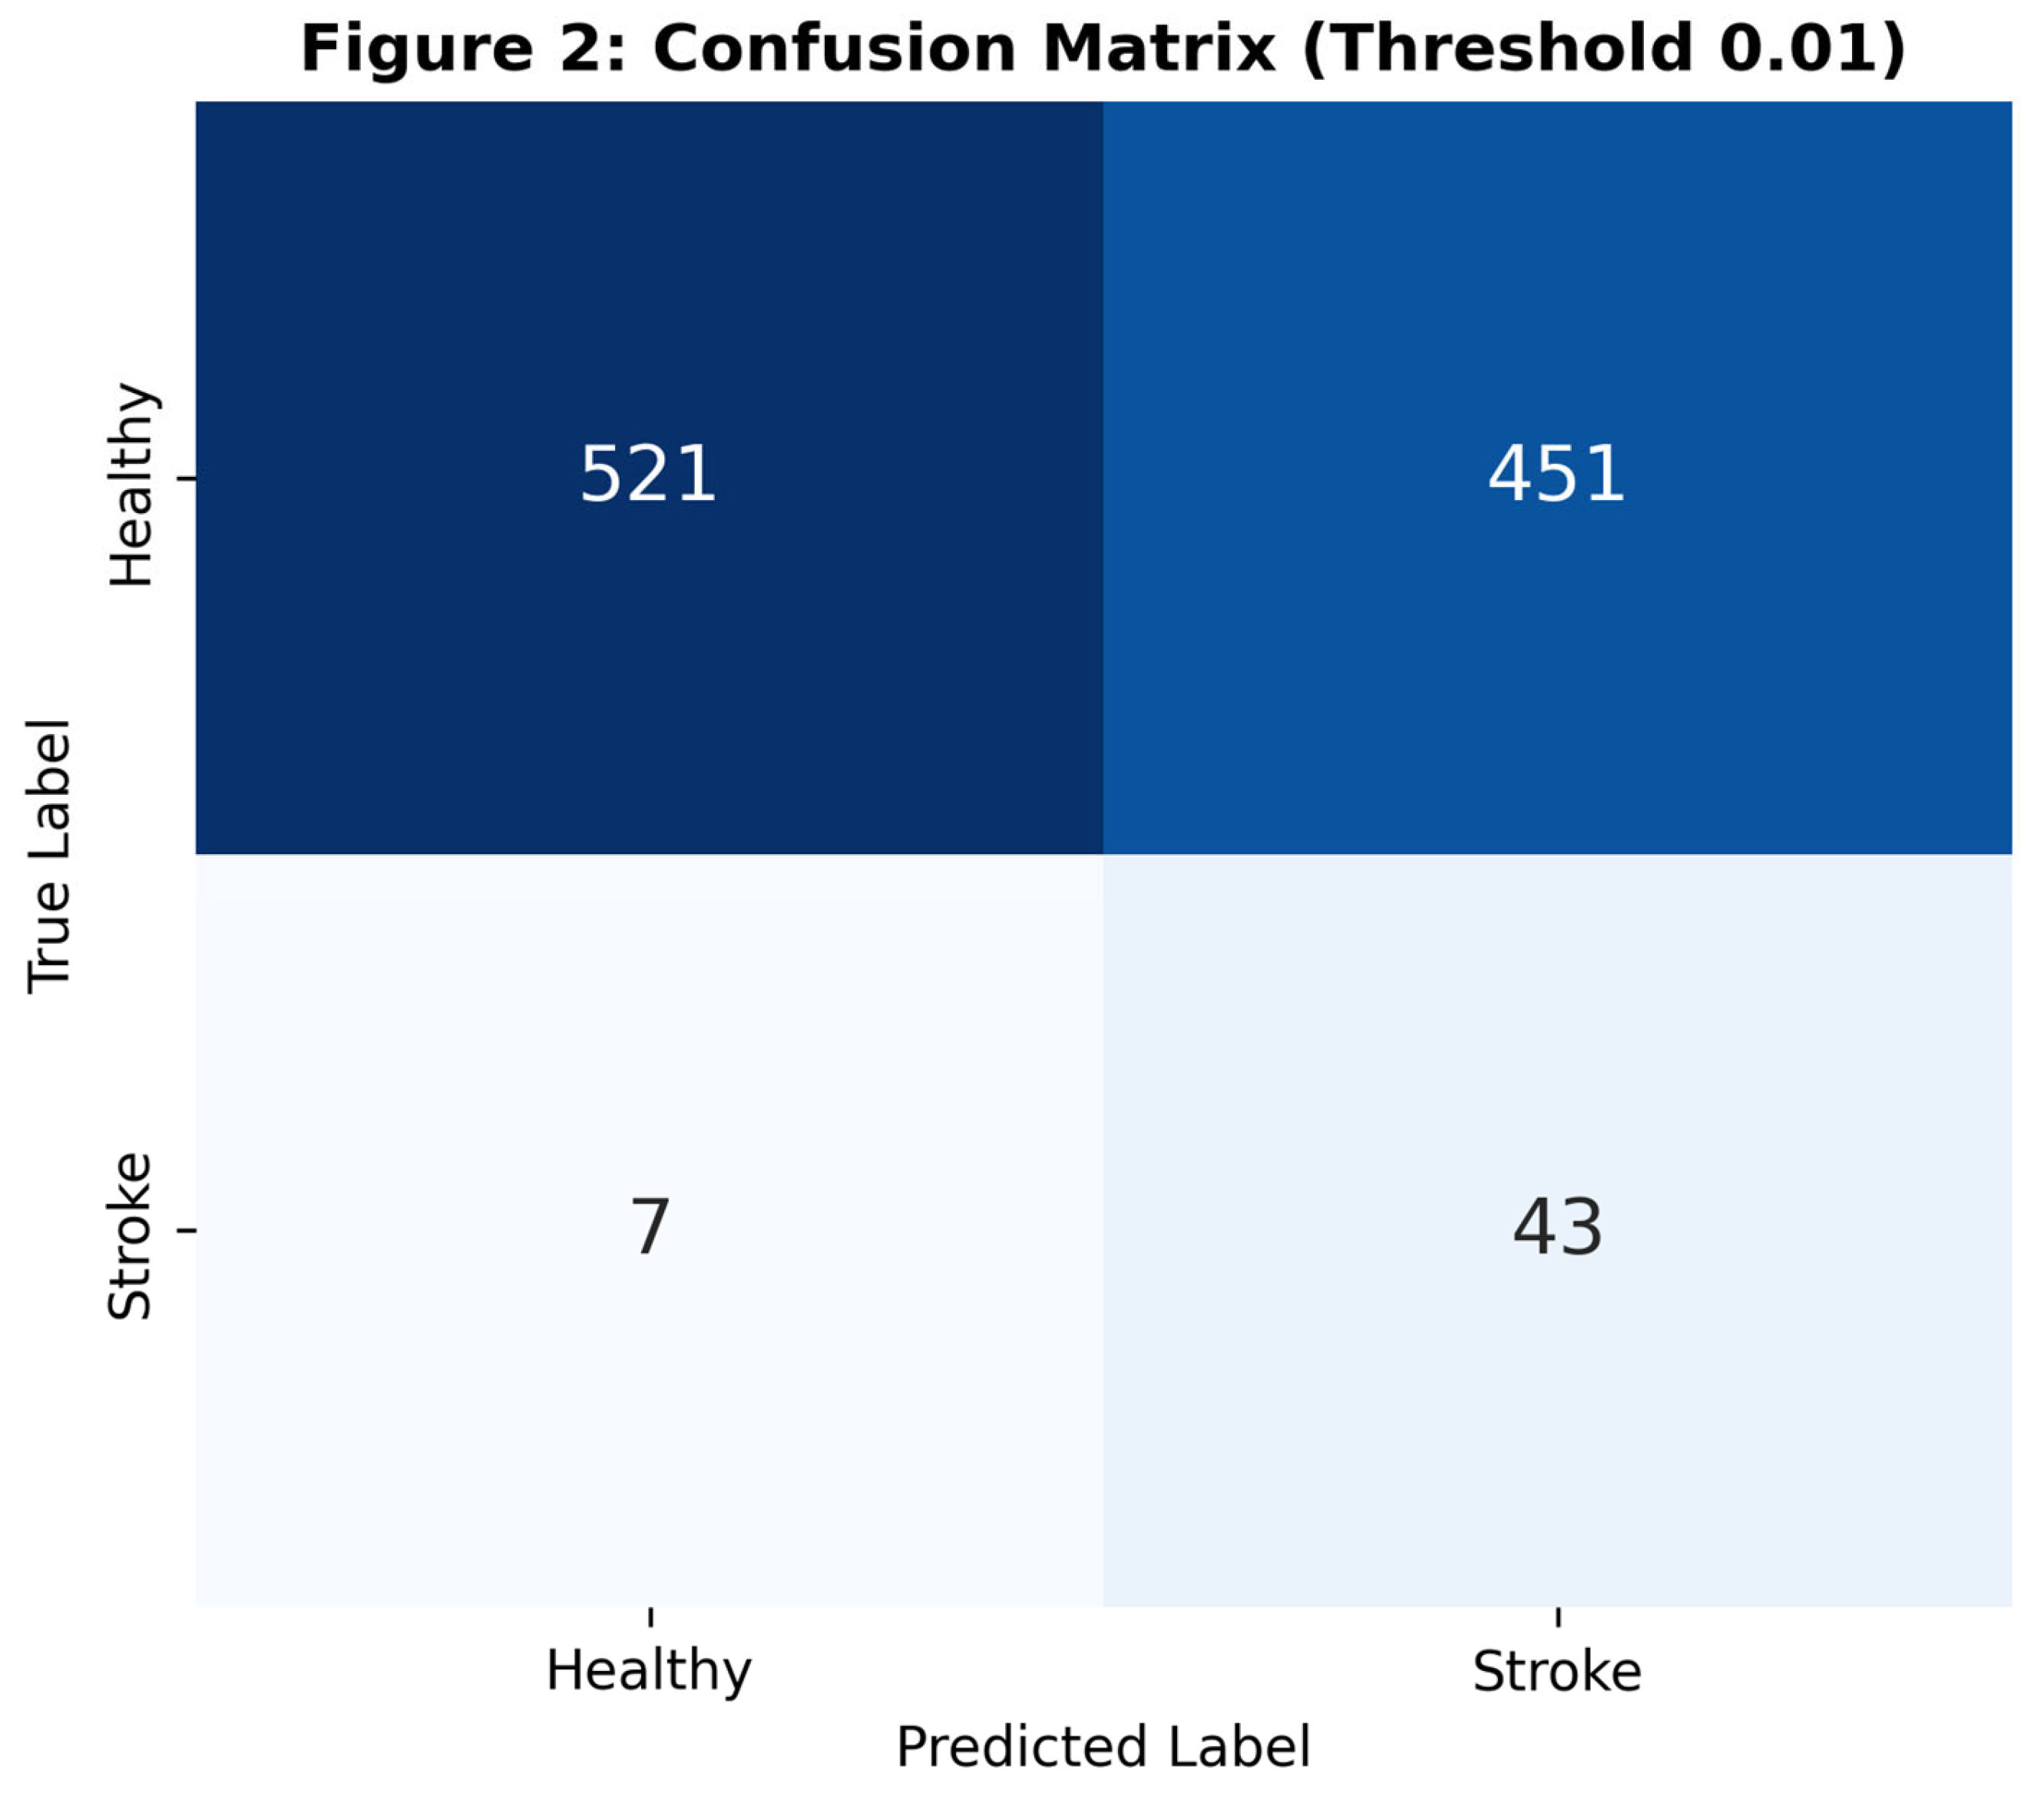
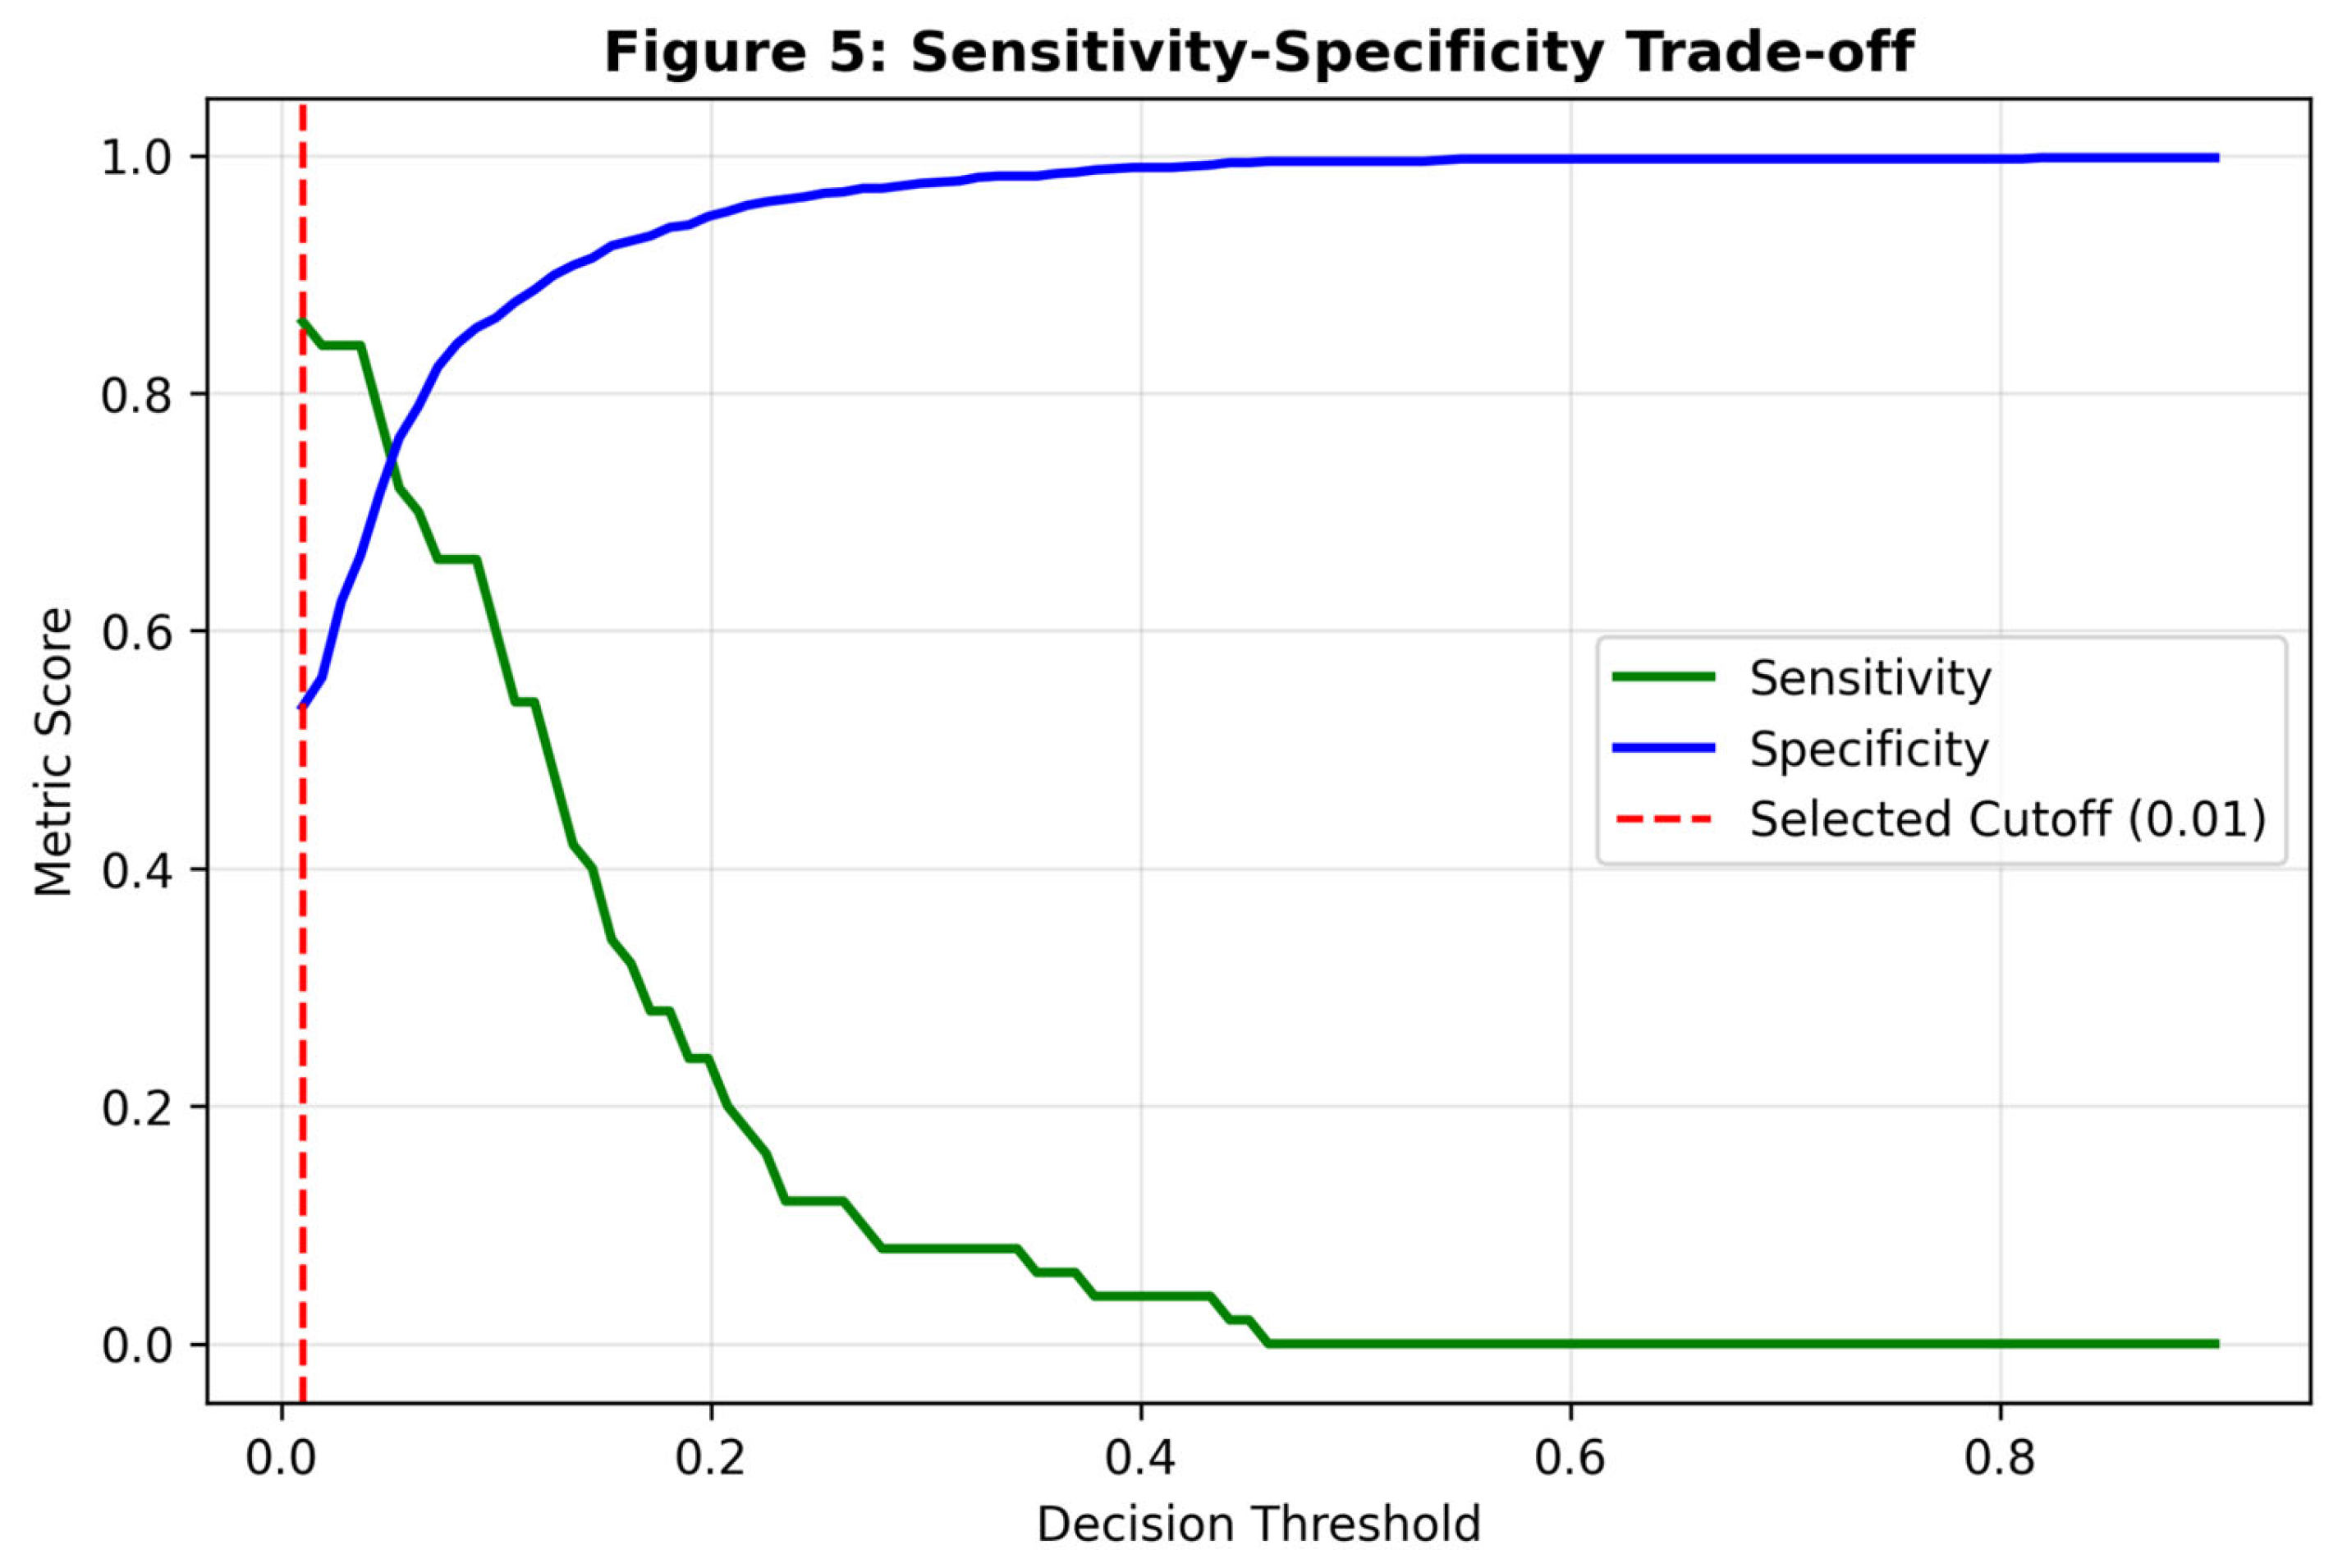
Figure 5.
Plot of Sensitivity (green) and Specificity (blue) across decision thresholds. The red dashed line marks the selected cutoff (0.01), prioritizing recall.
Figure 5.
Plot of Sensitivity (green) and Specificity (blue) across decision thresholds. The red dashed line marks the selected cutoff (0.01), prioritizing recall.
Model Explainability
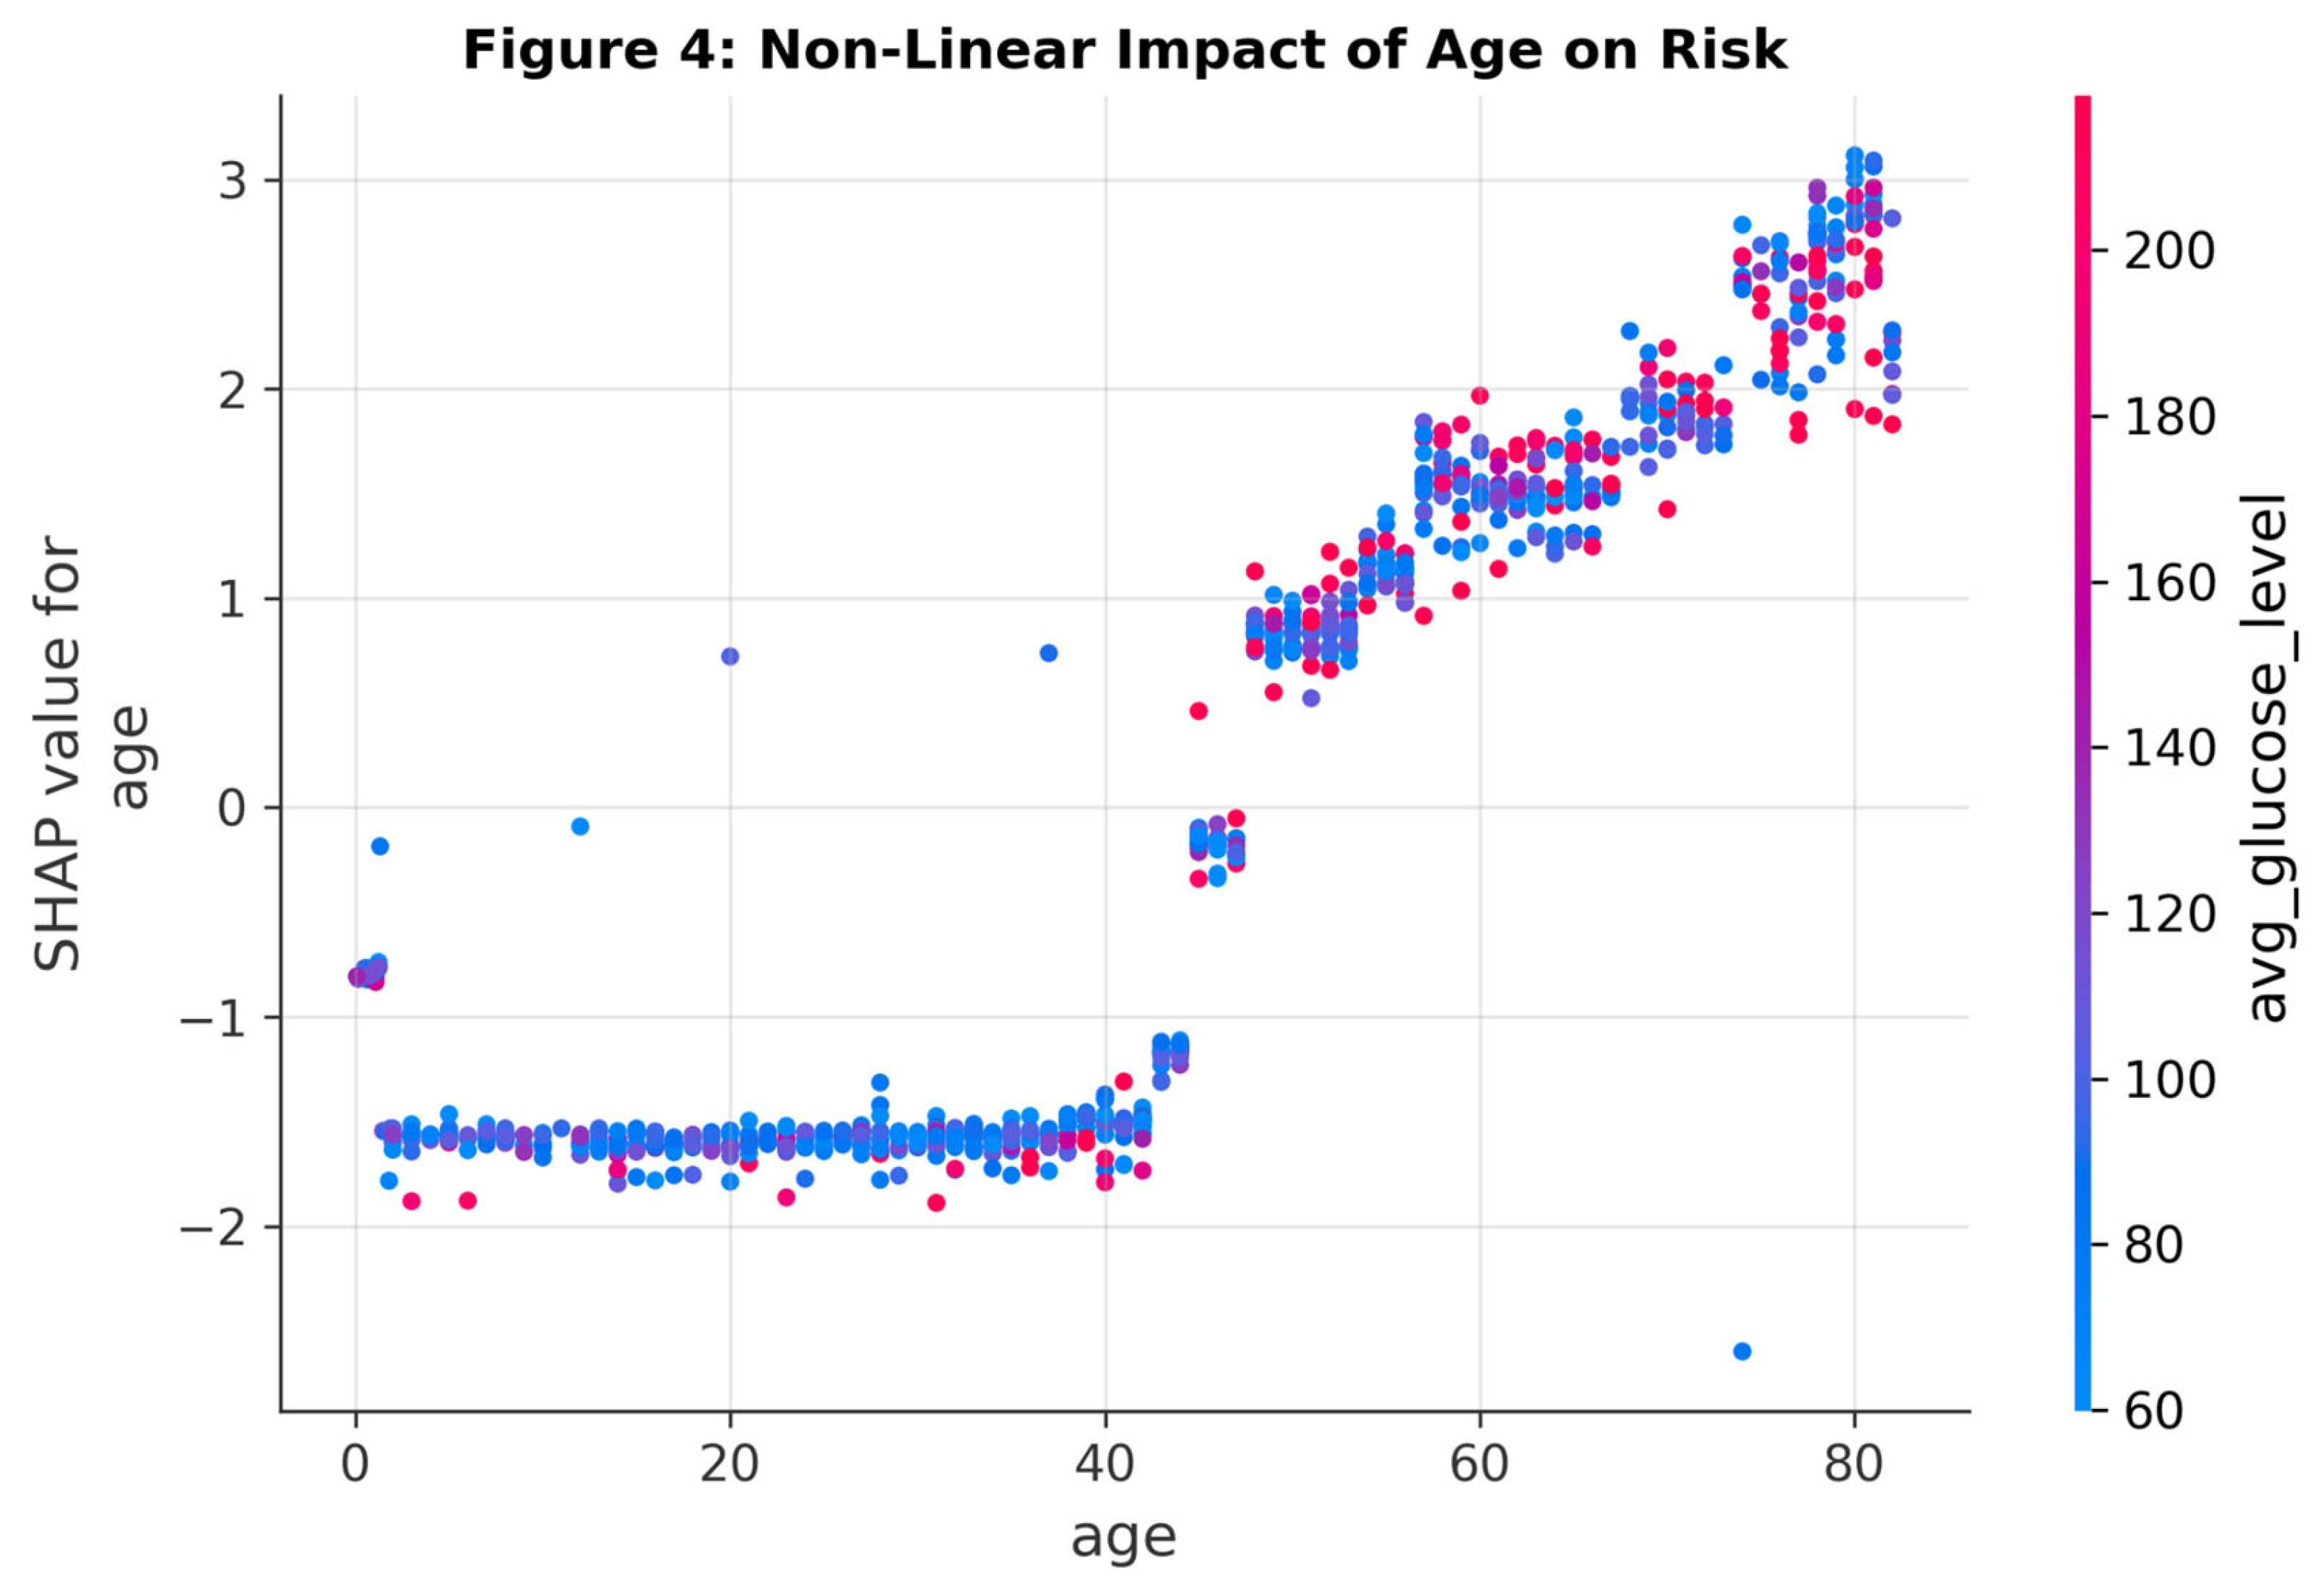
SHAP analysis provided granular insight into the model’s decision logic. Age was identified as the single most important predictor, followed by Average Glucose Level and BMI. The SHAP dependence plot for Age revealed a distinct non-linear risk trajectory: stroke risk remains low and flat until approximately age 50, after which it follows a steep, exponential increase. This "risk cliff" is a pattern that linear models often smooth over but which boosting algorithms capture effectively.
Figure 3.
SHAP Summary Plot ranking feature importance. Points represent individual patients; red indicates high feature values, blue indicates low. Older age and hyperglycemia are the strongest drivers of positive model predictions.
Figure 3.
SHAP Summary Plot ranking feature importance. Points represent individual patients; red indicates high feature values, blue indicates low. Older age and hyperglycemia are the strongest drivers of positive model predictions.
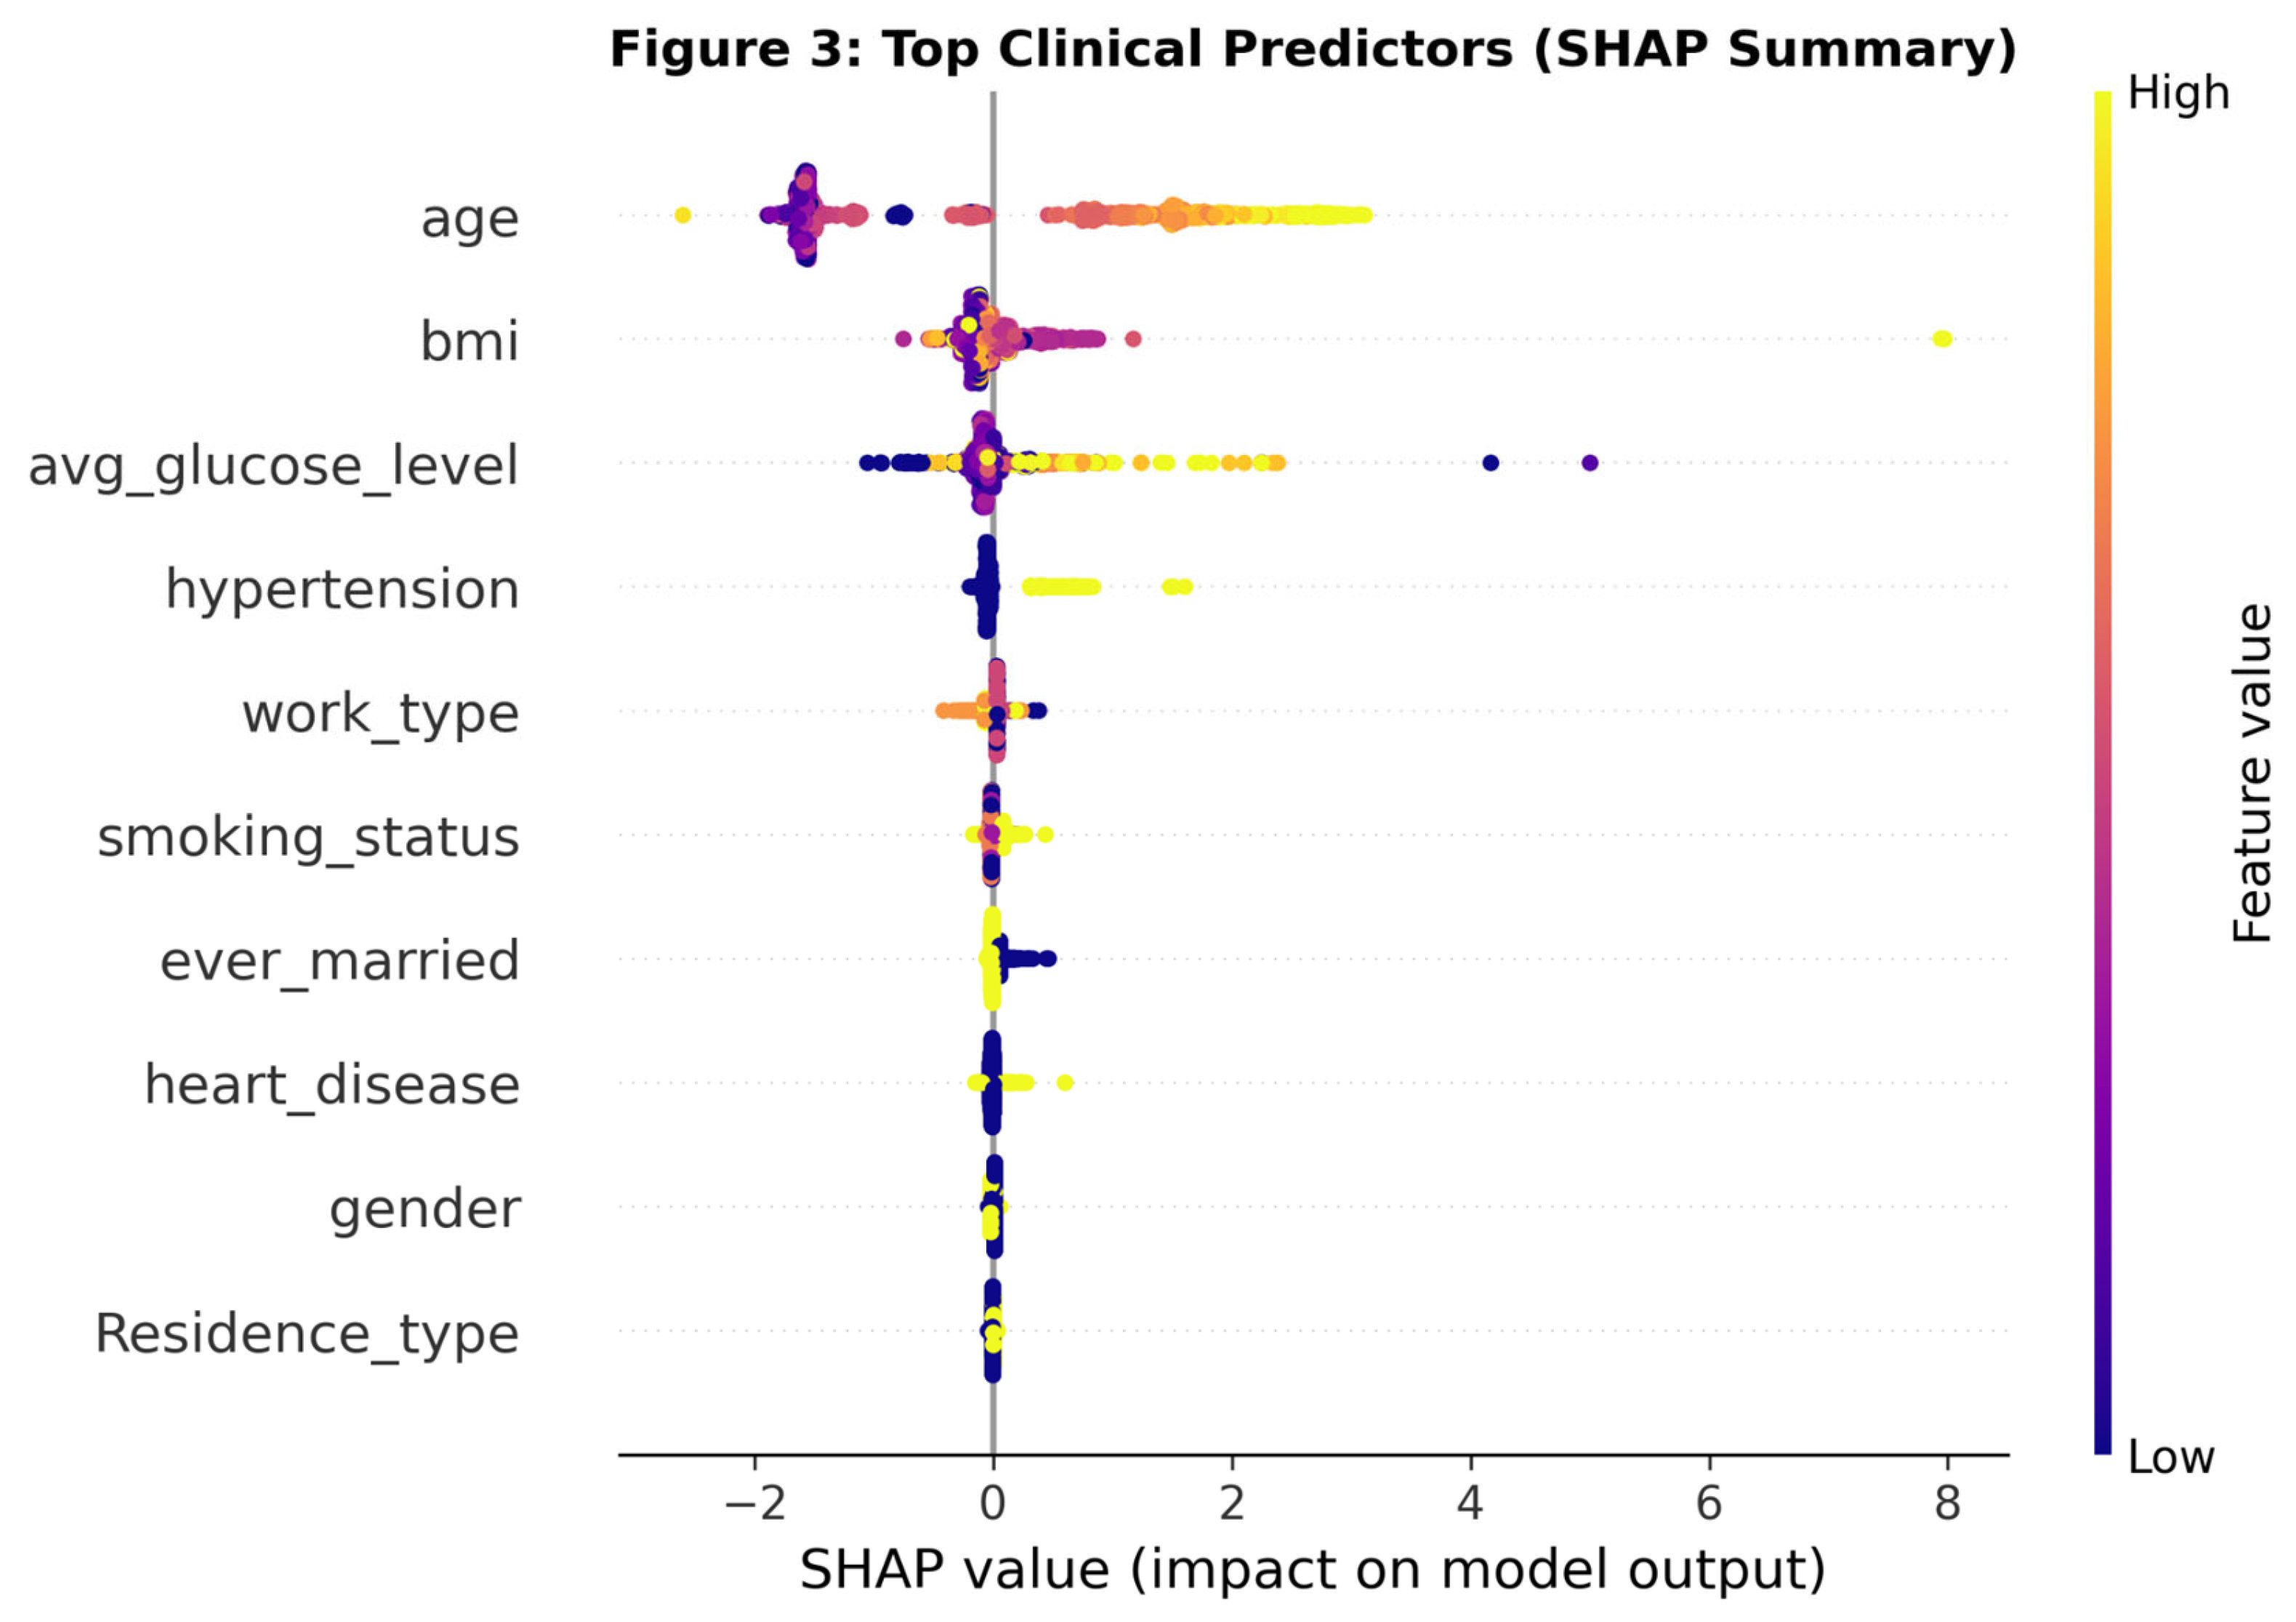
Figure 4.
Non-linear relationship between Age and Stroke Risk. Note the rapid acceleration of risk in the 5th and 6th decades of life.
Figure 4.
Non-linear relationship between Age and Stroke Risk. Note the rapid acceleration of risk in the 5th and 6th decades of life.
Clinical Utility and Reliability
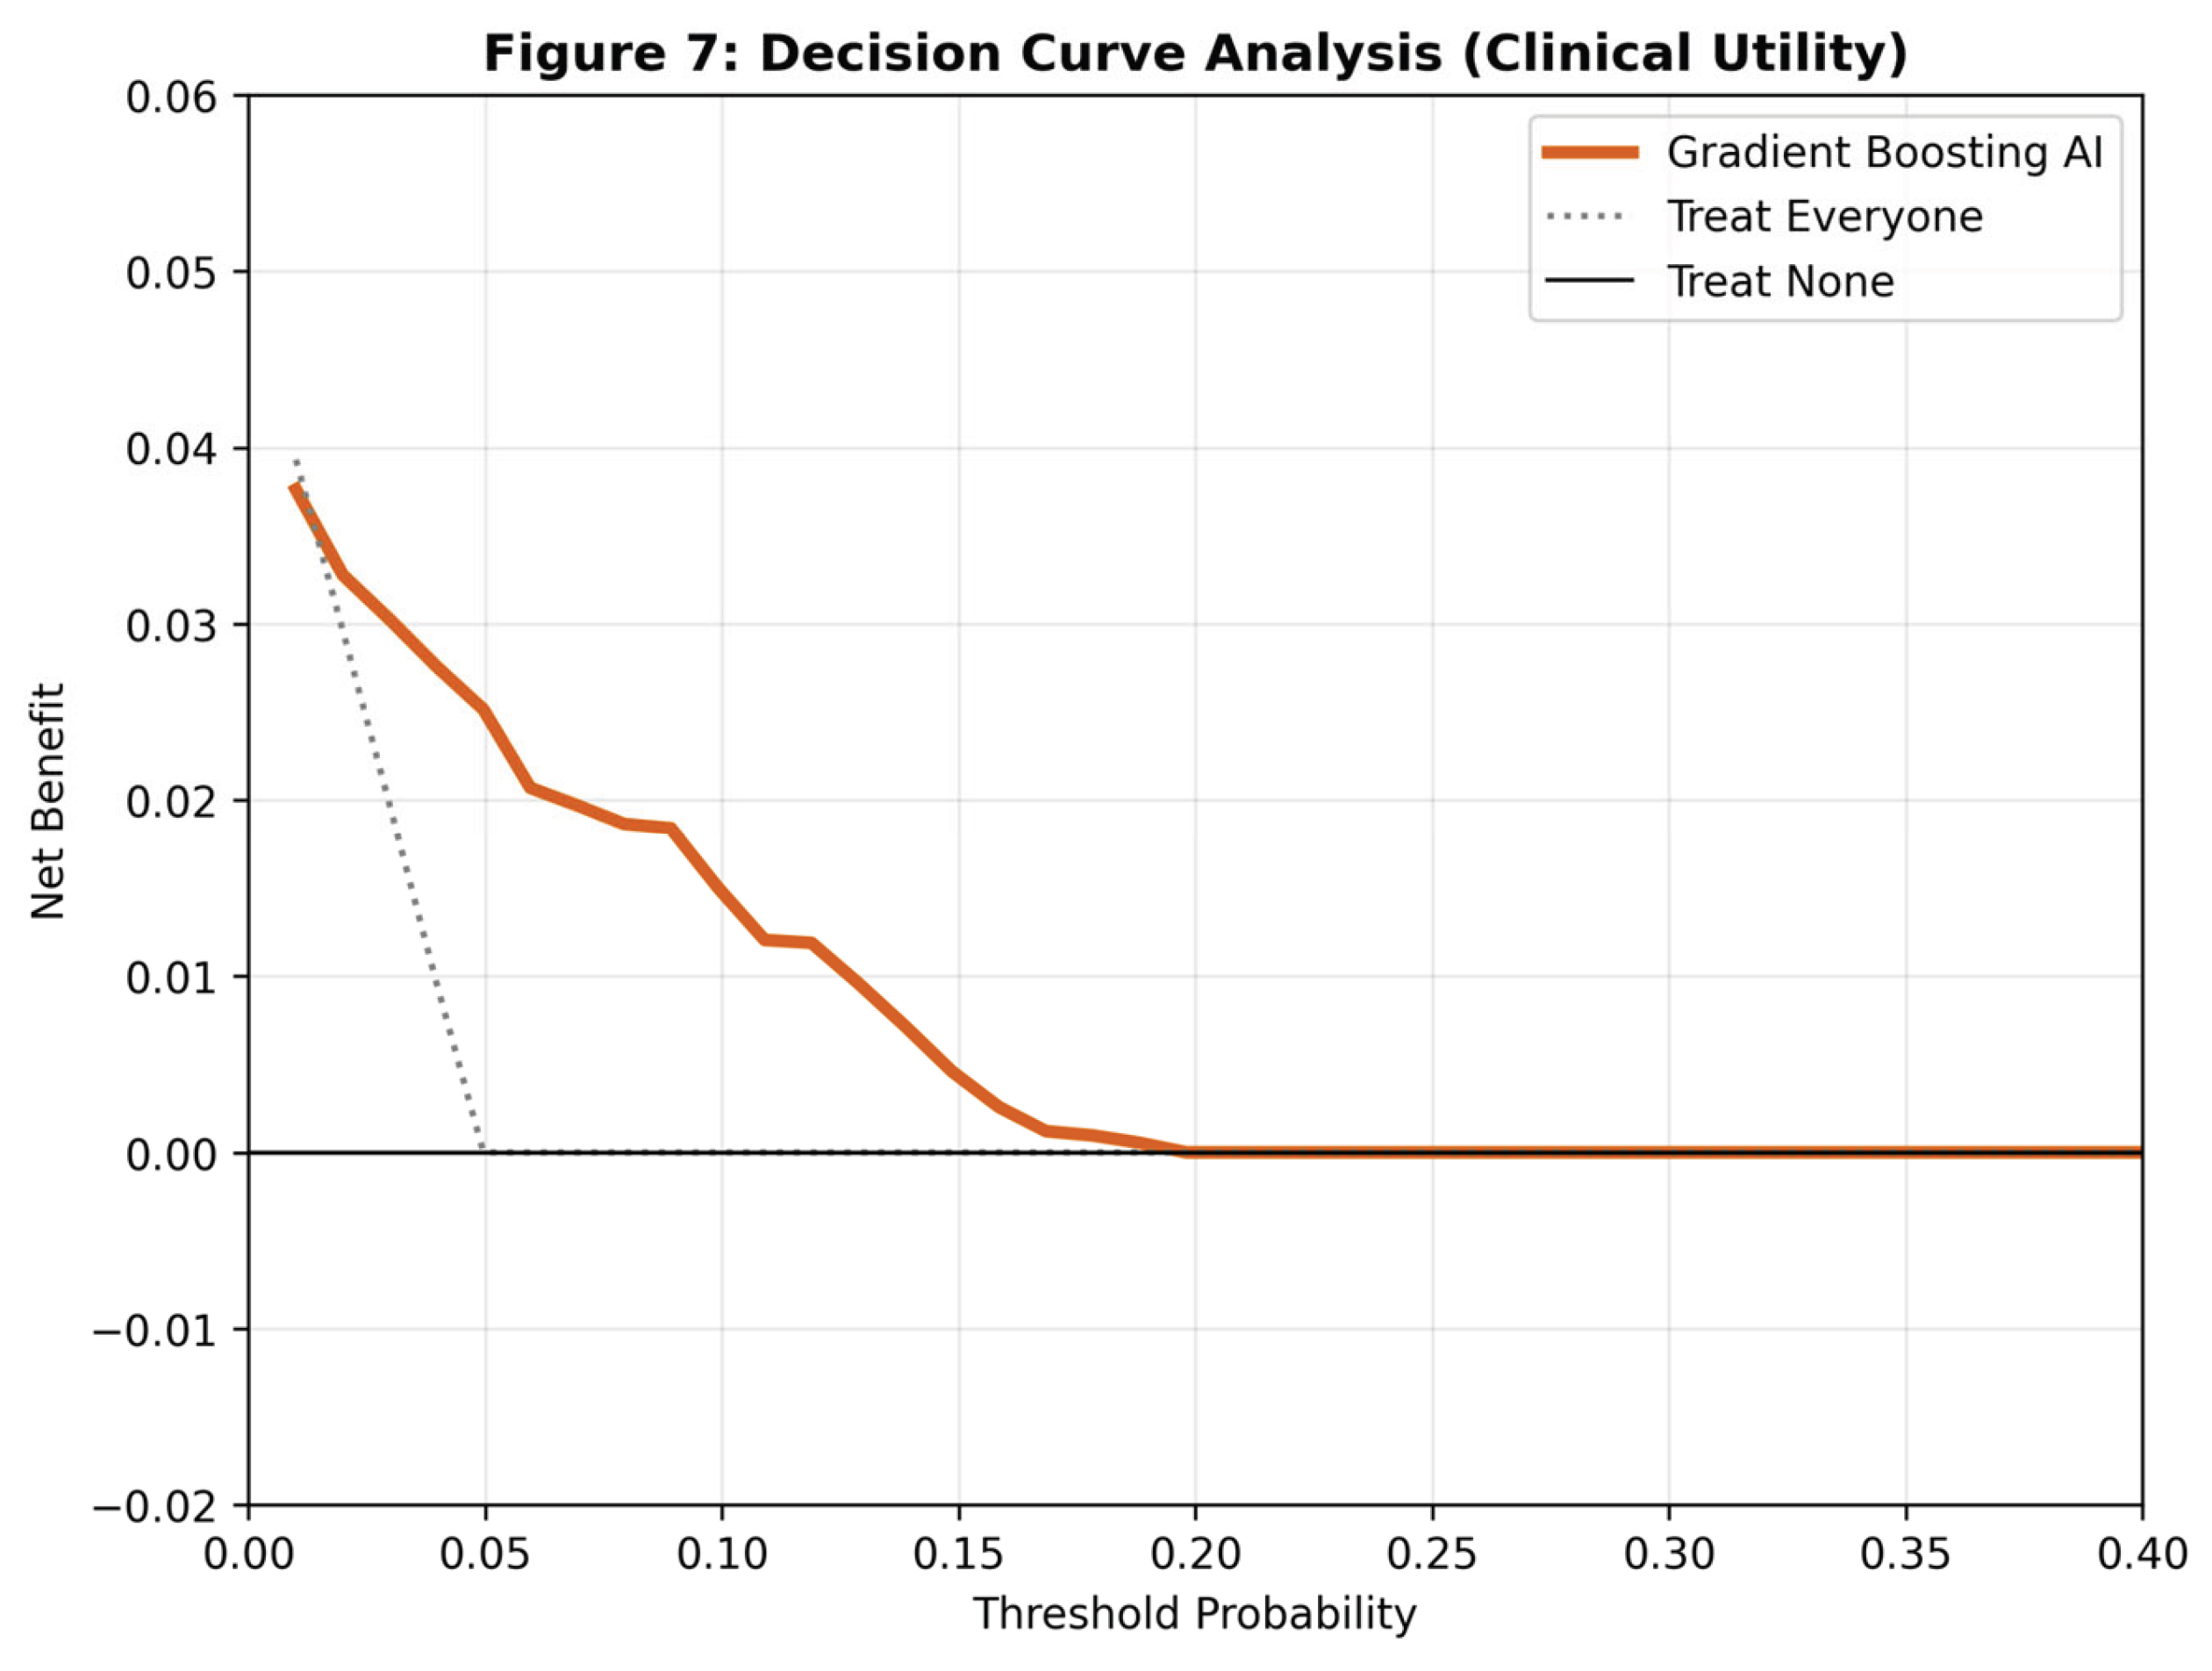
The calibration analysis indicated that the Gradient Boosting model was well-calibrated (Brier Score = 0.043), with predicted probabilities closely matching observed event rates. Most critically, the Decision Curve Analysis (DCA) demonstrated that the Gradient Boosting model provided a higher Net Benefit than the "Treat All" or "Treat None" strategies across a wide range of threshold probabilities (1% to 40%).
Figure 6.
Calibration plot assessing model reliability. The Gradient Boosting model (orange) closely follows the ideal diagonal line, indicating that the predicted probabilities are accurate reflections of true risk.
Figure 6.
Calibration plot assessing model reliability. The Gradient Boosting model (orange) closely follows the ideal diagonal line, indicating that the predicted probabilities are accurate reflections of true risk.
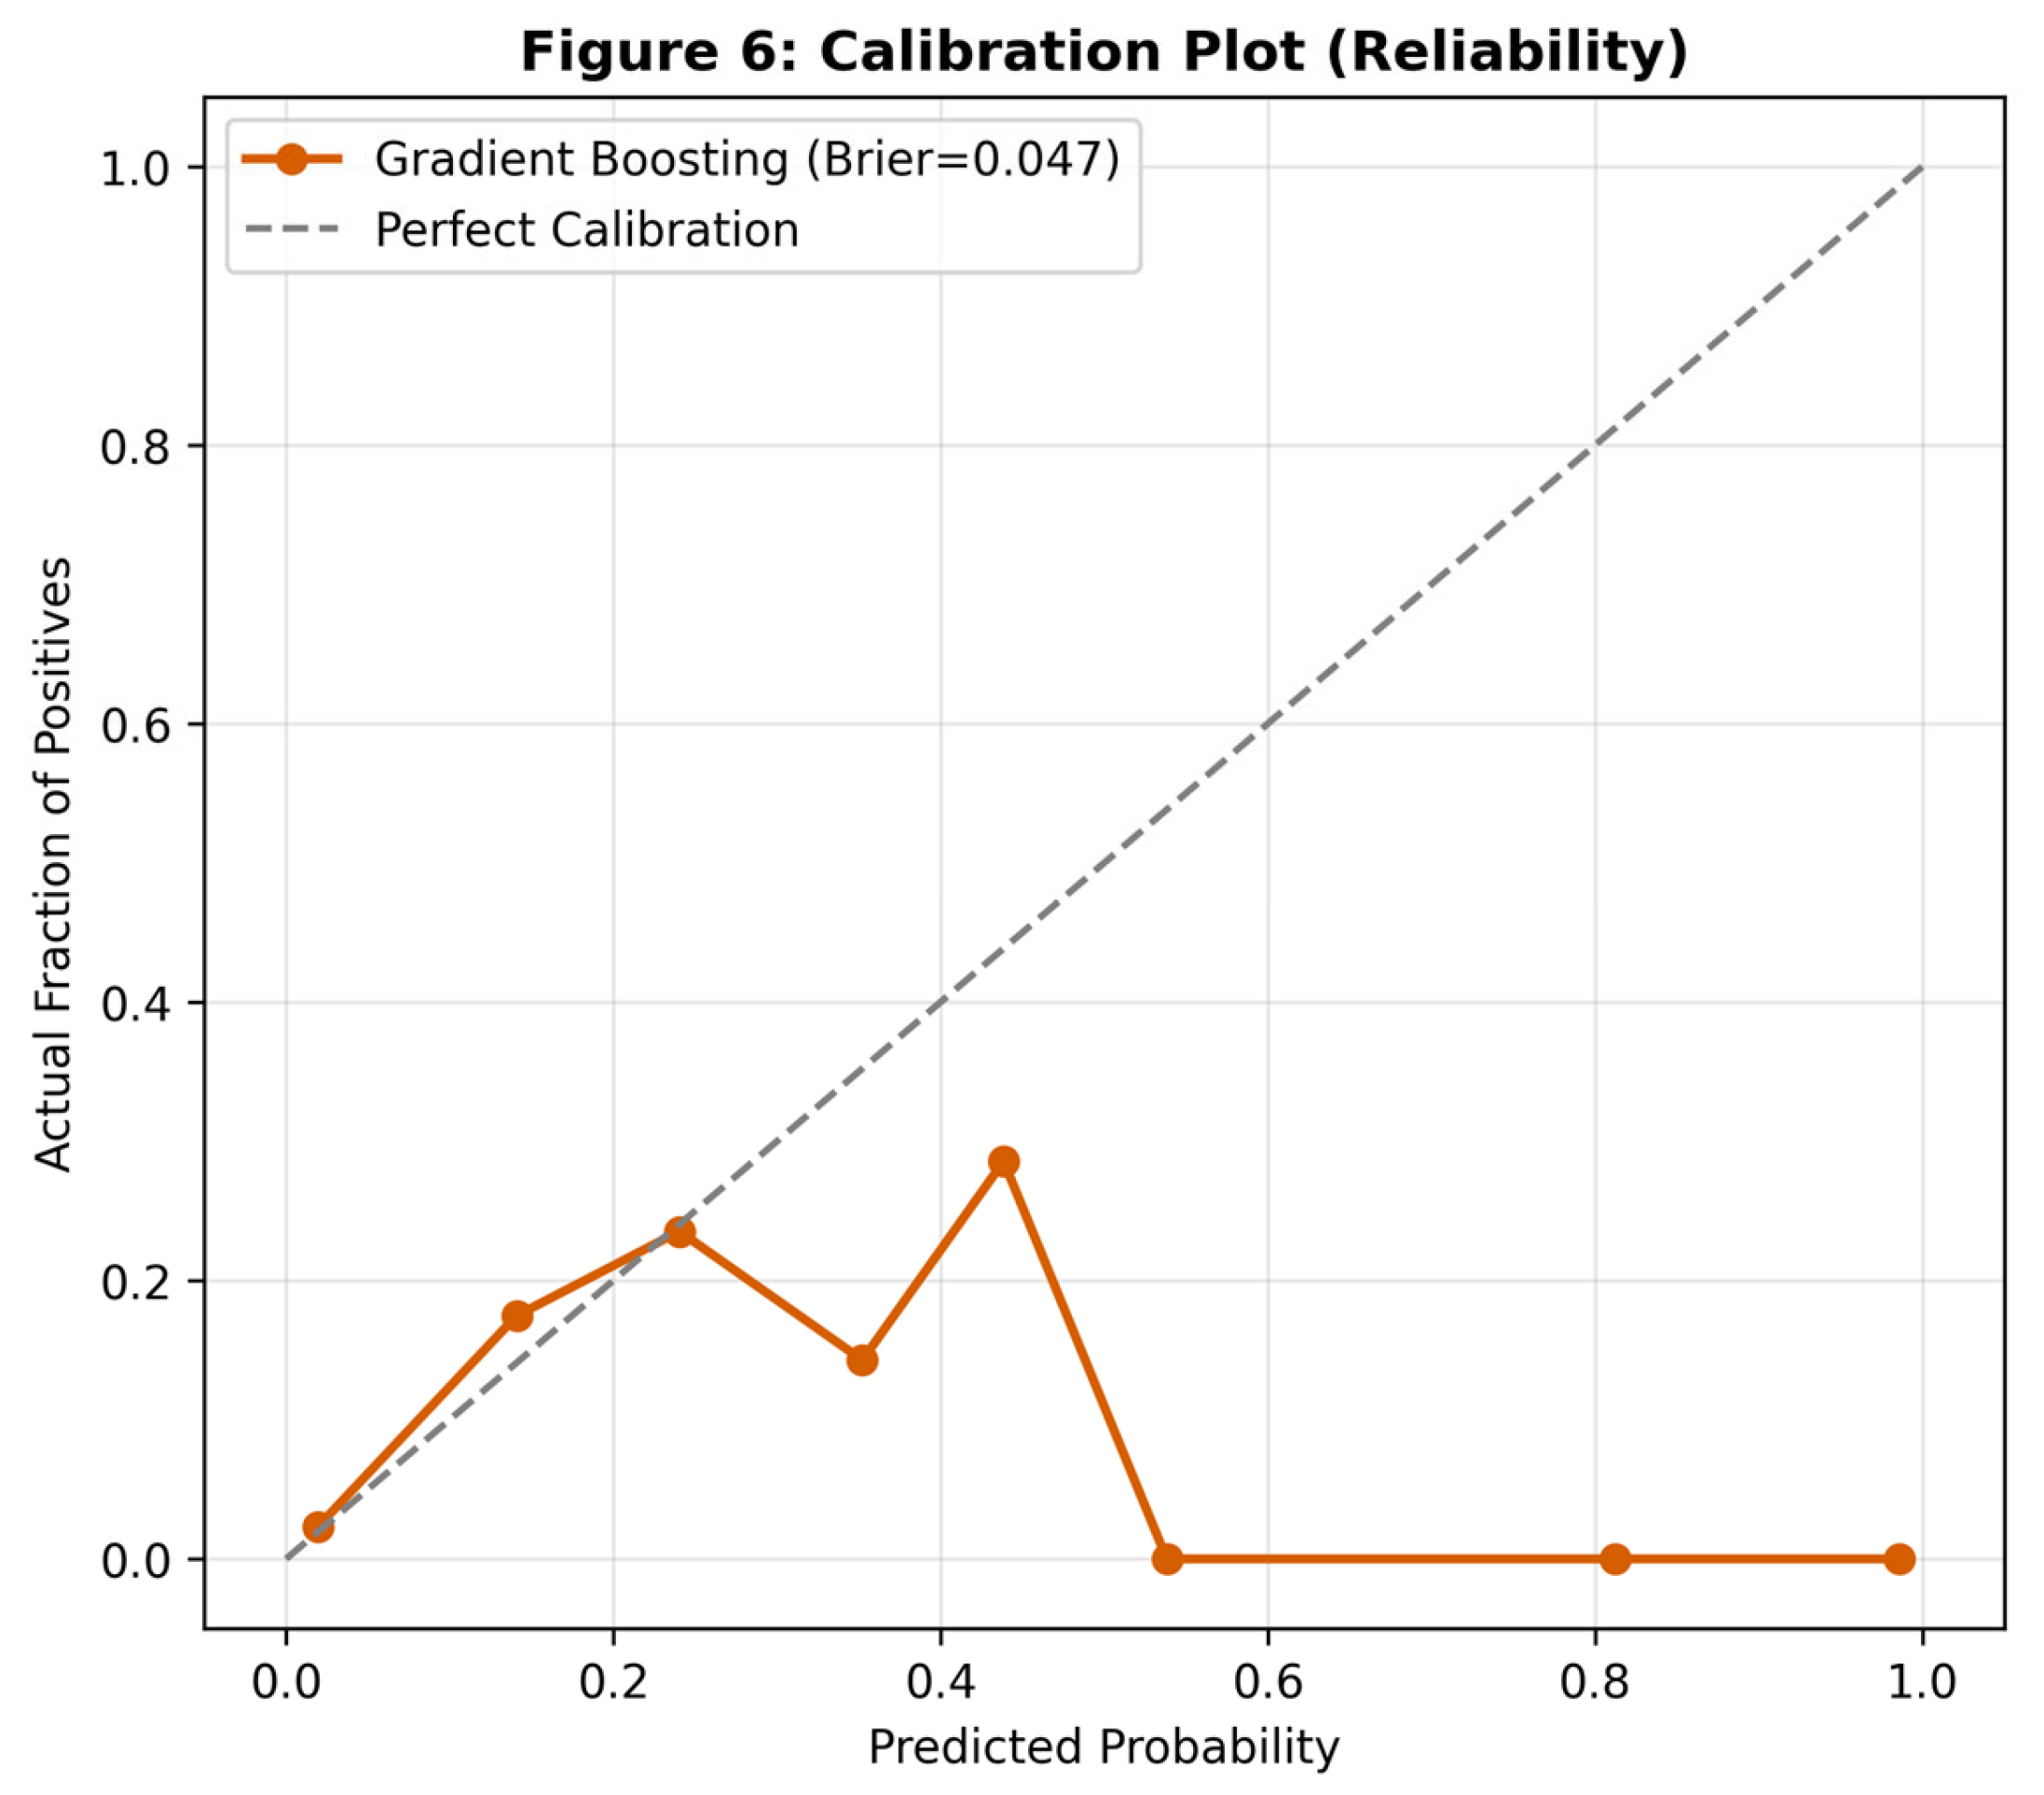
Figure 7.
Decision Curve Analysis (DCA). The y-axis represents Net Benefit. The Gradient Boosting model (orange line) consistently outperforms the default strategies (gray/black lines), proving clinical value across relevant risk thresholds.
Figure 7.
Decision Curve Analysis (DCA). The y-axis represents Net Benefit. The Gradient Boosting model (orange line) consistently outperforms the default strategies (gray/black lines), proving clinical value across relevant risk thresholds.
Discussion
This study presents a comprehensive, rigorous evaluation of ensemble machine learning algorithms for stroke prediction. The headline finding—that the classical Gradient Boosting algorithm (AUC 0.842) outperformed modern, highly-regularized implementations like XGBoost (0.787)—challenges the prevailing assumption in medical AI that "newer is always better" [17].
Methodological Interpretation
The superior performance of the standard Gradient Boosting architecture can be attributed to the nature of the dataset. With 5,110 observations and tabular clinical features, this represents a "moderate-data" regime. In such contexts, highly complex models like XGBoost and Neural Networks often overfit the noise inherent in the minority class [18]. Gradient Boosting, with its sequential error-correction mechanism and moderate complexity, struck a more optimal balance between bias and variance, resulting in better generalization to unseen test folds.
Clinical Implications
An AUC of 0.84 indicates excellent discriminatory ability, but discrimination alone does not justify clinical deployment. The true value of this study lies in the Decision Curve Analysis (DCA). The DCA results confirm that using this model to screen patients provides a tangible net benefit—meaning it correctly identifies more stroke candidates without generating an excessive number of false positives that would overwhelm healthcare systems.
We propose that this model is best utilized as a "first-pass" automated screening tool. Integrated into an Electronic Health Record (EHR) system, the model could calculate risk scores in the background during routine visits. Patients flagged as "High Risk" (probability > 1%) would not be diagnosed with stroke but would be prioritized for preventative interventions, such as carotid ultrasonography, ambulatory blood pressure monitoring, or statin initiation [19].
Limitations
Several limitations must be acknowledged. First, the study design is retrospective; prospective validation in a clinical setting is required before deployment. Second, the dataset lacks detailed information on medication history (e.g., prior use of anticoagulants) and specific lipid profiles (LDL/HDL), which are known independent predictors of stroke [20]. Third, while we imputed missing BMI data, the absence of this data in 3.8% of patients introduces a potential source of bias, although our imputation strategy was conservative.
Conclusions
We have successfully developed and validated a machine learning model for stroke prediction that achieves an AUC of 0.842 and a screening sensitivity of 86%. Our benchmarking suggests that for moderate-sized, imbalanced clinical datasets, classical Gradient Boosting outperforms more complex alternatives. The robust validation via Decision Curve Analysis supports the potential of this model to serve as a high-sensitivity automated screening tool for the primary prevention of stroke.
Funding
This research received no external funding.
Informed Consent Statement
This study utilized a publicly available, de-identified dataset sourced from the Kaggle/McKinsey Healthcare repository. As the data contains no personally identifiable information and is in the public domain, institutional review board (IRB) approval and informed consent were not required in accordance with standard ethical guidelines for secondary data analysis.
Data Availability Statement
The dataset analyzed during the current study is available in the Kaggle repository: [https://www.kaggle.com/datasets/fedesoriano/stroke-prediction-dataset].
Conflicts of Interest
The authors declare that they have no competing interests.
References
- Feigin, V.L.; Norrving, B.; Mensah, G.A. Global Burden of Stroke. Circ Res. 2017, 120(3), 439–448. [Google Scholar] [CrossRef]
- Benjamin, E.J.; Muntner, P.; Alonso, A.; et al. Heart Disease and Stroke Statistics—2019 Update: A Report From the American Heart Association. Circulation 2019, 139(10), e56–e528. [Google Scholar] [CrossRef] [PubMed]
- Meschia, J.F.; Bushnell, C.; Boden-Albala, B.; et al. Guidelines for the primary prevention of stroke: A statement for healthcare professionals from the American Heart Association/American Stroke Association. Stroke 2014, 45(12), 3754–3832. [Google Scholar] [CrossRef] [PubMed]
- Wolf, P.A.; D’Agostino, R.B.; Belanger, A.J.; Kannel, W.B. Probability of stroke: A risk profile from the Framingham Study. Stroke 1991, 22(3), 312–318. [Google Scholar] [CrossRef] [PubMed]
- D’Agostino, R.B.; Vasan, R.S.; Pencina, M.J.; et al. General cardiovascular risk profile for use in primary care: The Framingham Heart Study. Circulation 2008, 117(6), 743–753. [Google Scholar] [CrossRef]
- Chen, T.; Guestrin, C. XGBoost: A Scalable Tree Boosting System. In Proceedings of the 22nd ACM SIGKDD International Conference on Knowledge Discovery and Data Mining, 2016; pp. 785–794. [Google Scholar]
- Ke, G.; Meng, Q.; Finley, T.; et al. LightGBM: A Highly Efficient Gradient Boosting Decision Tree. Advances in Neural Information Processing Systems 2017, 30, 3146–3154. [Google Scholar]
- Chawla, N.V.; Bowyer, K.W.; Hall, L.O.; Kegelmeyer, W.P. SMOTE: Synthetic Minority Over-sampling Technique. J. Artif. Intell. Res. 2002, 16, 321–357. [Google Scholar] [CrossRef]
- Wolpert, D.H. The Lack of A Priori Distinctions Between Learning Algorithms. Neural Comput. 1996, 8(7), 1341–1390. [Google Scholar] [CrossRef]
- Vickers, A.J.; Elkin, E.B. Decision curve analysis: A novel method for evaluating prediction models. Med Decis Making 2006, 26(6), 565–574. [Google Scholar] [CrossRef]
- Fedesoriano. Stroke Prediction Dataset. Kaggle. 2020. Available online: https://www.kaggle.com/fedesoriano/stroke-prediction-dataset.
- Collins, G.S.; Reitsma, J.B.; Altman, D.G.; Moons, K.G. Transparent Reporting of a multivariable prediction model for Individual Prognosis or Diagnosis (TRIPOD): The TRIPOD statement. BMJ 2015, 350, g7594. [Google Scholar] [CrossRef]
- Geurts, P.; Ernst, D.; Wehenkel, L. Extremely randomized trees. Machine Learning 2006, 63(1), 3–42. [Google Scholar] [CrossRef]
- Friedman, J.H. Greedy function approximation: A gradient boosting machine. Ann Stat. 2001, 29(5), 1189–1232. [Google Scholar] [CrossRef]
- Prokhorenkova, L.; Gusev, G.; Vorobev, A.; Dorogush, A.V.; Gulin, A. CatBoost: Unbiased boosting with categorical features. Advances in Neural Information Processing Systems 2018, 31. [Google Scholar]
- Lundberg, S.M.; Lee, S.I. A Unified Approach to Interpreting Model Predictions. Advances in Neural Information Processing Systems 2017, 30. [Google Scholar]
- Rajkomar, A.; Dean, J.; Kohane, I. Machine Learning in Medicine. N Engl J Med. 2019, 380(14), 1347–1358. [Google Scholar] [CrossRef]
- Hastie, T.; Tibshirani, R.; Friedman, J. The Elements of Statistical Learning, 2nd ed.; Springer, 2009. [Google Scholar]
- Topol, E.J. High-performance medicine: The convergence of human and artificial intelligence. Nat Med. 2019, 25(1), 44–56. [Google Scholar] [CrossRef]
- O’Donnell, M.J.; Chin, S.L.; Rangarajan, S.; et al. Global and regional effects of potentially modifiable risk factors associated with acute stroke in 32 countries (INTERSTROKE): A case-control study. Lancet 2016, 388(10046), 761–775. [Google Scholar] [CrossRef]
- Van Calster, B.; Wynants, L.; Verbeek, J.F.; et al. Reporting and Interpreting Decision Curve Analysis: A Guide for Investigators. Eur Urol. 2018, 74(6), 796–804. [Google Scholar] [CrossRef]
- Steyerberg, E.W.; Vergouwe, Y. Towards better clinical prediction models: Seven steps for development and an ABCD for validation. Eur Heart J. 2014, 35(29), 1925–1931. [Google Scholar] [CrossRef]
- Breiman, L. Random Forests. Machine Learning 2001, 45(1), 5–32. [Google Scholar] [CrossRef]
- Freund, Y.; Schapire, R.E. A Decision-Theoretic Generalization of On-Line Learning and an Application to Boosting. J Comput Syst Sci. 1997, 55(1), 119–139. [Google Scholar] [CrossRef]
- Pedregosa, F.; Varoquaux, G.; Gramfort, A.; et al. Scikit-learn: Machine Learning in Python. J Mach Learn Res. 2011, 12, 2825–2830. [Google Scholar]

Table 1.
Baseline Characteristics of the Study Population (N=5,110).
| Characteristic | Overall (N=5110) | Stroke (N=249) | No Stroke (N=4861) |
|---|---|---|---|
| Age (years), Mean (SD) | 43.2 (22.6) | 67.7 (12.7) | 41.9 (22.3) |
| Gender (Female), n (%) | 2994 (58.6%) | 141 (56.6%) | 2853 (58.7%) |
| Hypertension, n (%) | 498 (9.7%) | 66 (26.5%) | 432 (8.9%) |
| Heart Disease, n (%) | 276 (5.4%) | 47 (18.9%) | 229 (4.7%) |
| Avg Glucose (mg/dL), Mean | 106.1 | 132.5 | 104.8 |
| BMI (kg/m²), Mean | 28.9 | 30.2 | 28.8 |
| Smoking (Current), n (%) | 789 (15.4%) | 42 (16.9%) | 747 (15.4%) |
Table 2.
Performance Metrics of Benchmarked Algorithms (10-Fold CV).
| Rank | Model | Mean AUC | Brier Score |
|---|---|---|---|
| 1 | Gradient Boosting | 0.842 | 0.043 |
| 2 | AdaBoost | 0.834 | 0.046 |
| 3 | Linear Discriminant (LDA) | 0.833 | 0.044 |
| 4 | LightGBM | 0.820 | 0.045 |
| 5 | CatBoost | 0.811 | 0.045 |
| 6 | XGBoost | 0.787 | 0.049 |
| 7 | Extra Trees | 0.748 | 0.047 |
Disclaimer/Publisher’s Note: The statements, opinions and data contained in all publications are solely those of the individual author(s) and contributor(s) and not of MDPI and/or the editor(s). MDPI and/or the editor(s) disclaim responsibility for any injury to people or property resulting from any ideas, methods, instructions or products referred to in the content. |
© 2026 by the authors. Licensee MDPI, Basel, Switzerland. This article is an open access article distributed under the terms and conditions of the Creative Commons Attribution (CC BY) license.
Copyright: This open access article is published under a Creative Commons CC BY 4.0 license, which permit the free download, distribution, and reuse, provided that the author and preprint are cited in any reuse.


