
Submitted:
15 July 2024
Posted:
16 July 2024
You are already at the latest version
Abstract
Predicting heart disease is crucial for early diagnosis and intervention, significantly improving patient outcomes and reducing mortality rates. This study compares various machine learning models, including Logistic Regression, Random Forest, Gradient Boosting, XGBoost, and Long Short-Term Memory (LSTM) networks, using the Cleveland Heart Disease dataset. Comprehensive preprocessing steps were undertaken, such as handling missing values, converting categorical variables to numeric forms, and binarizing the target variable for binary classification. Each model was rigorously evaluated using performance metrics, including accuracy, precision, recall, F1-score, and the area under the receiver operating characteristic curve (AUC-ROC). SHapley Additive exPlanations (SHAP) values were employed to provide insights into feature importance, ensuring model transparency and interpretability. The results indicate that XGBoost outperformed all other models, achieving an accuracy of 90% and an AUC-ROC of 0.94, demonstrating its superior ability to capture complex patterns in the data through advanced optimization techniques and regularization. This study highlights the significant potential of advanced machine learning techniques, particularly ensemble methods like Gradient Boosting and XGBoost, in enhancing heart disease prediction. These models offer higher accuracy and valuable interpretability, making them practical tools for early diagnosis in clinical settings. Future research should focus on integrating these models into healthcare systems and exploring hybrid approaches to further improve predictive performance and clinical applicability.
Keywords:
Heart Disease Prediction
; Machine Learning
; XGBoost
; Gradient Boosting
; LSTM (Long Short-Term Memory)
; SHAP (SHapley Additive exPlanations)
1. Introduction
Heart diseases have become the leading cause of death worldwide, taking hundreds of thousands of lives annually. Its early prediction will immensely reduce its prevalence and result in better outcomes by allowing early interventions (Kannel, McGee, & Gordon, 1976). Of late, with the development of machine learning and artificial intelligence, medicine-related diagnostics have opened up newer avenues for predictive analytics in healthcare (Johnson, Pollard, & Celi, 2018).
Known benchmarks, one of which is the Cleveland Heart Disease dataset, provide a ground for testing machine learning models with respect to heart disease prediction (Detrano et al., 1989). It merely consists of a complete set of features like age, sex, chest pain type, resting blood pressure, serum cholesterol, fasting blood sugar, resting electrocardiographic results, maximum heart rate achieved, exercise-induced angina, ST depression induced by exercise relative to rest, the slope of the peak exercise ST segment, the number of major vessels colored by fluoroscopy, and thalassemia. Such a broad feature space makes this dataset very suitable for training many machine learning models, providing insight into their predictive capability (Breiman, 2001) (Chen & Guestrin, 2016).
In this paper, we will implement several machine learning models and then compare their performance with respect to heart disease prediction. These include traditional methods on the one hand, such as logistic regression, and advanced ones on the other hand, such as random forest, gradient boosting, and XGBoost, together with LSTM networks. All these models have unique benefits: Logistic Regression confers simplicity and interpretability, while methods such as Random Forest and Gradient Boosting are based on ensemble methods with very complex interactions among features. It is because of their high performance and robustness that boosting techniques, specifically XGBoost, rose to prominence. Chen and Guestrin (2016) in their study revealed the scalability of XGBoost, therefore applicable on large datasets. Comparative studies in research by Natekin and Knoll (2013) always had XGBoost performing well compared to other models in terms of computation efficiency and accuracy. This advantage is attributed in these studies to boosting techniques in iteratively correcting the errors from previous models by learning from them and, therefore, enhancing overall performance.
Even though Long Short-Term Memory networks are primarily designed for the processing of sequential data, this study includes them in order to find out if they could handle tabular static data. The design makes LSTMs eventually hold long-term dependencies and deal with gradient-related issues that accompany them; thus, they become the best tools at capturing complex patterns and feature interactions (Hochreiter & Schmidhuber, 1997). By reshaping the dataset into 3D format so that an LSTM can be used, we take advantage of its strength in learning complex relationships within our data. The second inclusion thus helps to complete a detailed evaluation of various neural network architectures to probe their flexibility and efficiencies for heart disease predictions.
New trends in heart disease prediction emphasize model interpretability and explainability. SHapley Additive exPlanations values are increasingly applied to answer quests on feature importance, letting transparency into model predictions (Lundberg & Lee, 2017). Moreover, very recently, Johnson et al. (2018) investigated integrative machine learning models into clinical workflows, showing some challenges and benefits that should be expected from such predictive technologies with real-time deployment within healthcare settings.
This paper evaluates the efficiency of different machine learning models on heart disease cases using the Cleveland Heart Disease dataset. Specifically, we compare logistic regression, ensemble methods, random forest, gradient boosting, and XGBoost with deep learning models—the efficiency of LSTM networks in establishing the most accurate and reliable approach toward heart disease prediction. Now, a research question becomes “Which Machine Learning model provides the best accuracy and interpretability to predict heart disease in the Cleveland Heart Disease dataset?”. Precisely, in addressing this question, we try to contribute to the literature available in heart disease prediction and underscore how advanced machine learning techniques may notably enhance diagnostic accuracy, hence improving patient outcomes. Besides, we perform a detailed assessment of performance metrics for the models from accuracy, precision, recall, F1-score, and AUC-ROC, and further feature importance through SHAP values that give transparency and interpretability to the model.
2. Literature Review
Heart disease prediction using machine learning has garnered significant attention due to its potential to improve early diagnosis and treatment outcomes. Various studies have explored the application of machine learning algorithms, datasets, and techniques to enhance the predictive accuracy of heart disease models.
2.1. Traditional Machine Learning Approaches
Initial research in the domain of heart disease prediction has majorly utilized traditional machine learning techniques such as Logistic Regression, Decision Trees, and Support Vector Machines (Kannel, McGee, & Gordon, 1976) (Detrano, et al., 1989 ). Every one of these models is simple and interpretable. Binary classification is one of the major areas in which logistic regression excels, providing its comprehensive application for heart disease predictions. It models the probability of a binary outcome based on one or more predictor variables. One of the major advantages of logistic regression is that it gives, through an examination of the coefficients of the model, insight into the relative significance of such risk factors as age, cholesterol levels, and blood pressure (Kannel, McGee, & Gordon, 1976). It is very useful in understanding and interpreting how single predictors influence heart disease likelihood.
Another broadly applied method in the very early prediction of heart disease research is decision trees. The basic idea is one of recursive division of the data into subsets according to a single value of the attribute, hence creating a tree-like model for decisions. Decision Trees are relatively easy to interpret and visualize; because of this characteristic, they are useful in identifying the important features for prediction. But probably one of the major disadvantages of Decision Trees is that they tend to overfit the training data. When the model learns too much about the noise and details of the training data, performance on new data is poor, which reflects poor generalization from the seen data (Breiman, 2001).
Random Forests were introduced to remedy the overfitting problem of Decision Trees. Random
Figure 1.
Random Forest.
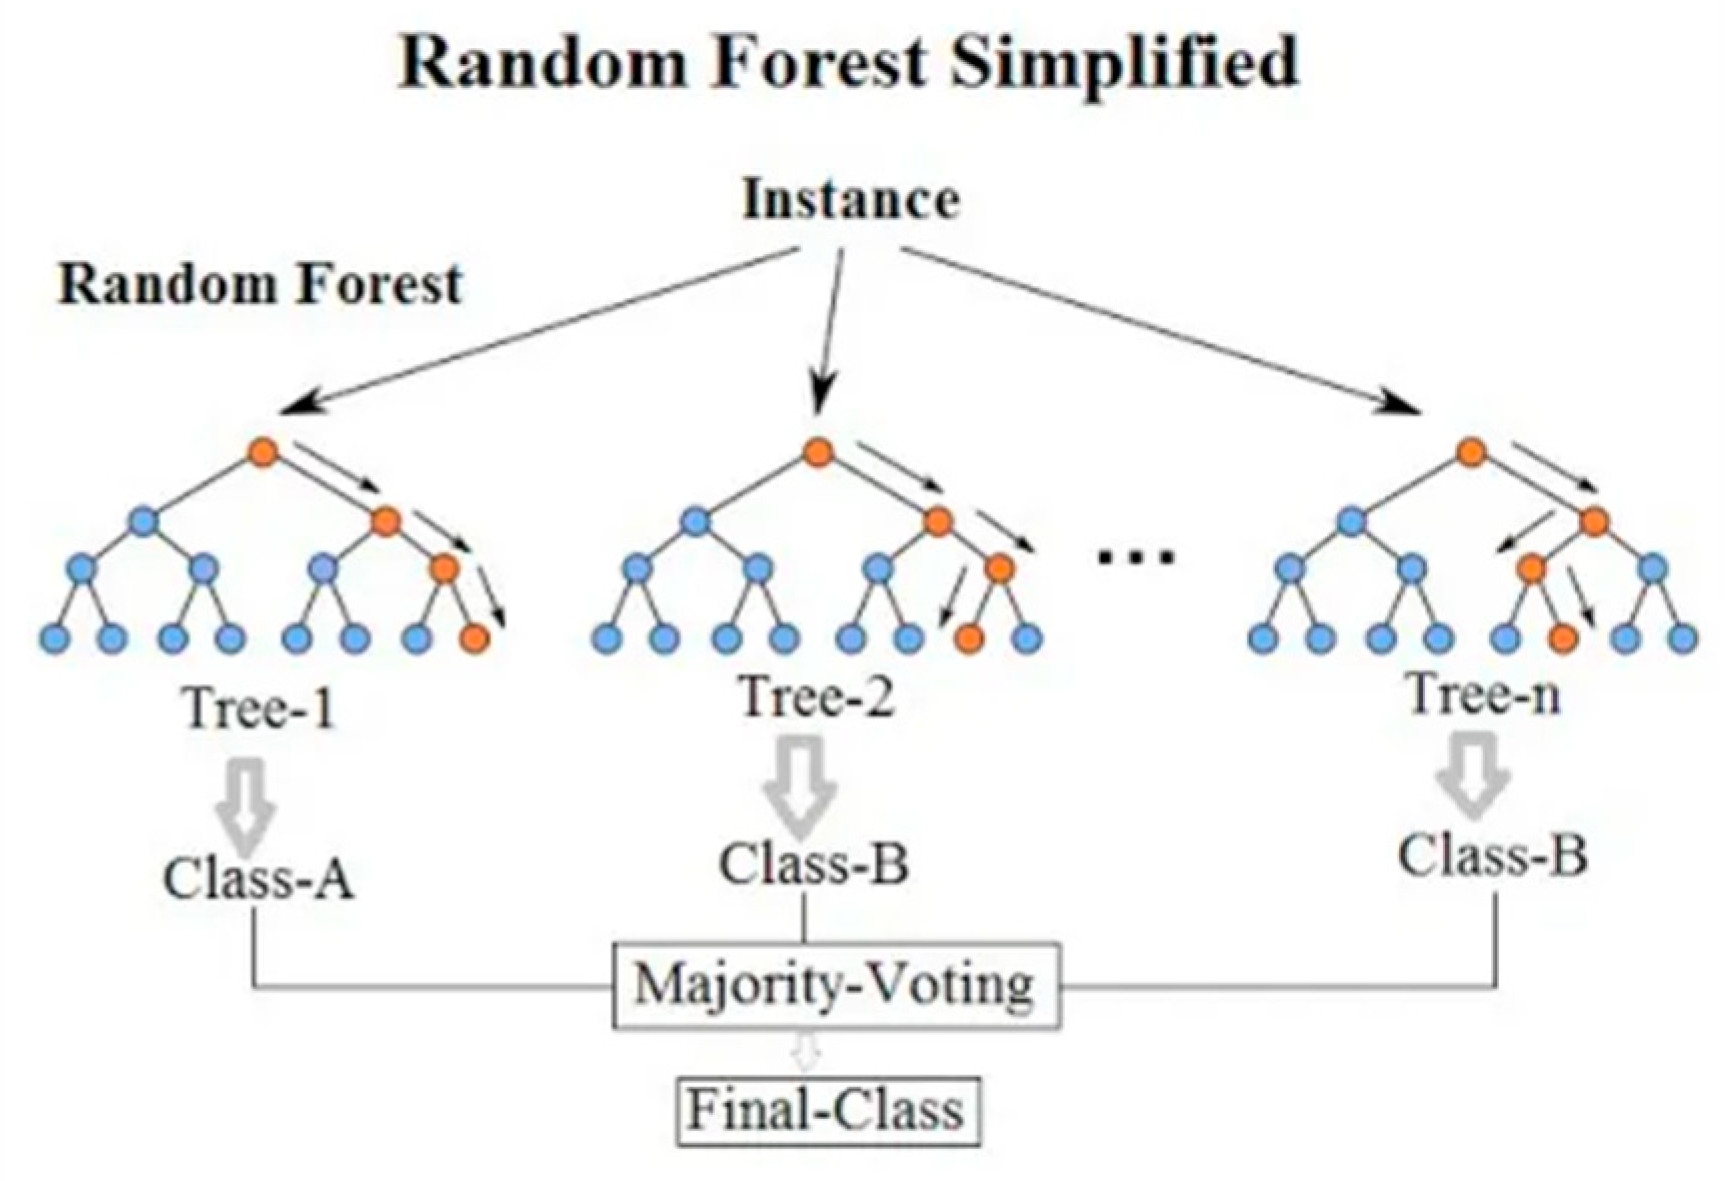
Forest is a type of ensemble learning that, while training, overlaps many created decision trees and returns the mode of classes in the case of classification or the mean prediction in case of regression (Breiman, 2001). This process increases its accuracy and robustness by gaining the power of multiple models. Random Forest reduces overfitting by averaging out the results across many Decision Trees, all of which have been trained on a random subset of data and features. This not only improves accuracy but also equips the model with the capacity to process large datasets and complex interactions among features. It has been shown numerously that Random Forests are very accurate in the prediction of heart disease since they generalize well and handle the variability in the data (Díaz-Uriarte & De Andres, 2006).
Support Vector Machines (SVM) have also been extensively explored in heart disease prediction. SVMs aim to find the optimal hyperplane that separates data points of different classes with the maximum margin. This technique is particularly effective in high-dimensional spaces and is robust to overfitting, especially in cases where the number of dimensions exceeds the number of samples (Cortes & Vapnik, 1995). The flexibility of SVMs to use different kernel functions allows them to model complex relationships between features, making them a powerful tool for heart disease prediction (Boser, Guyon, & Vapnik, 1992).
In summary, traditional machine learning techniques such as Logistic Regression, Decision Trees, Random Forests, and SVMs have played a crucial role in the initial stages of heart disease prediction research. Each method has its own strengths and weaknesses, and the choice of model often depends on the specific requirements of the task, such as the need for interpretability, accuracy, and robustness to overfitting (Kannel, McGee, & Gordon, 1976) (Breiman, 2001) (Díaz-Uriarte & De Andres, 2006) (Cortes & Vapnik, 1995).
2.2. Ensemble Methods and Boosting Techniques
Gradient Boosting and its variants, such as XGBoost, have been very popular recently in most classification problems owing to their excellent performance, which includes problems like heart disease prediction. These methods work really great because they build the model in a rather distinct way, by correcting the errors from the previous iterations through additivity (Friedman, 2001). Gradient Boosting is another ensemble method where models develop sequentially, and each new model is trying to correct the errors of the previous ones. This works iteratively, leading to models that are normally very accurate since, in every stage of boosting, it is centrally focused on the residuals—therefore, the errors of the combined ensemble of the previous models (Natekin & Knoll, 2013). By reducing the loss function and with the steps improving the model’s predictions, Gradient Boosting obtains robust performance for predictive tasks (Friedman, 2001).
Figure 2.
XGBoost.
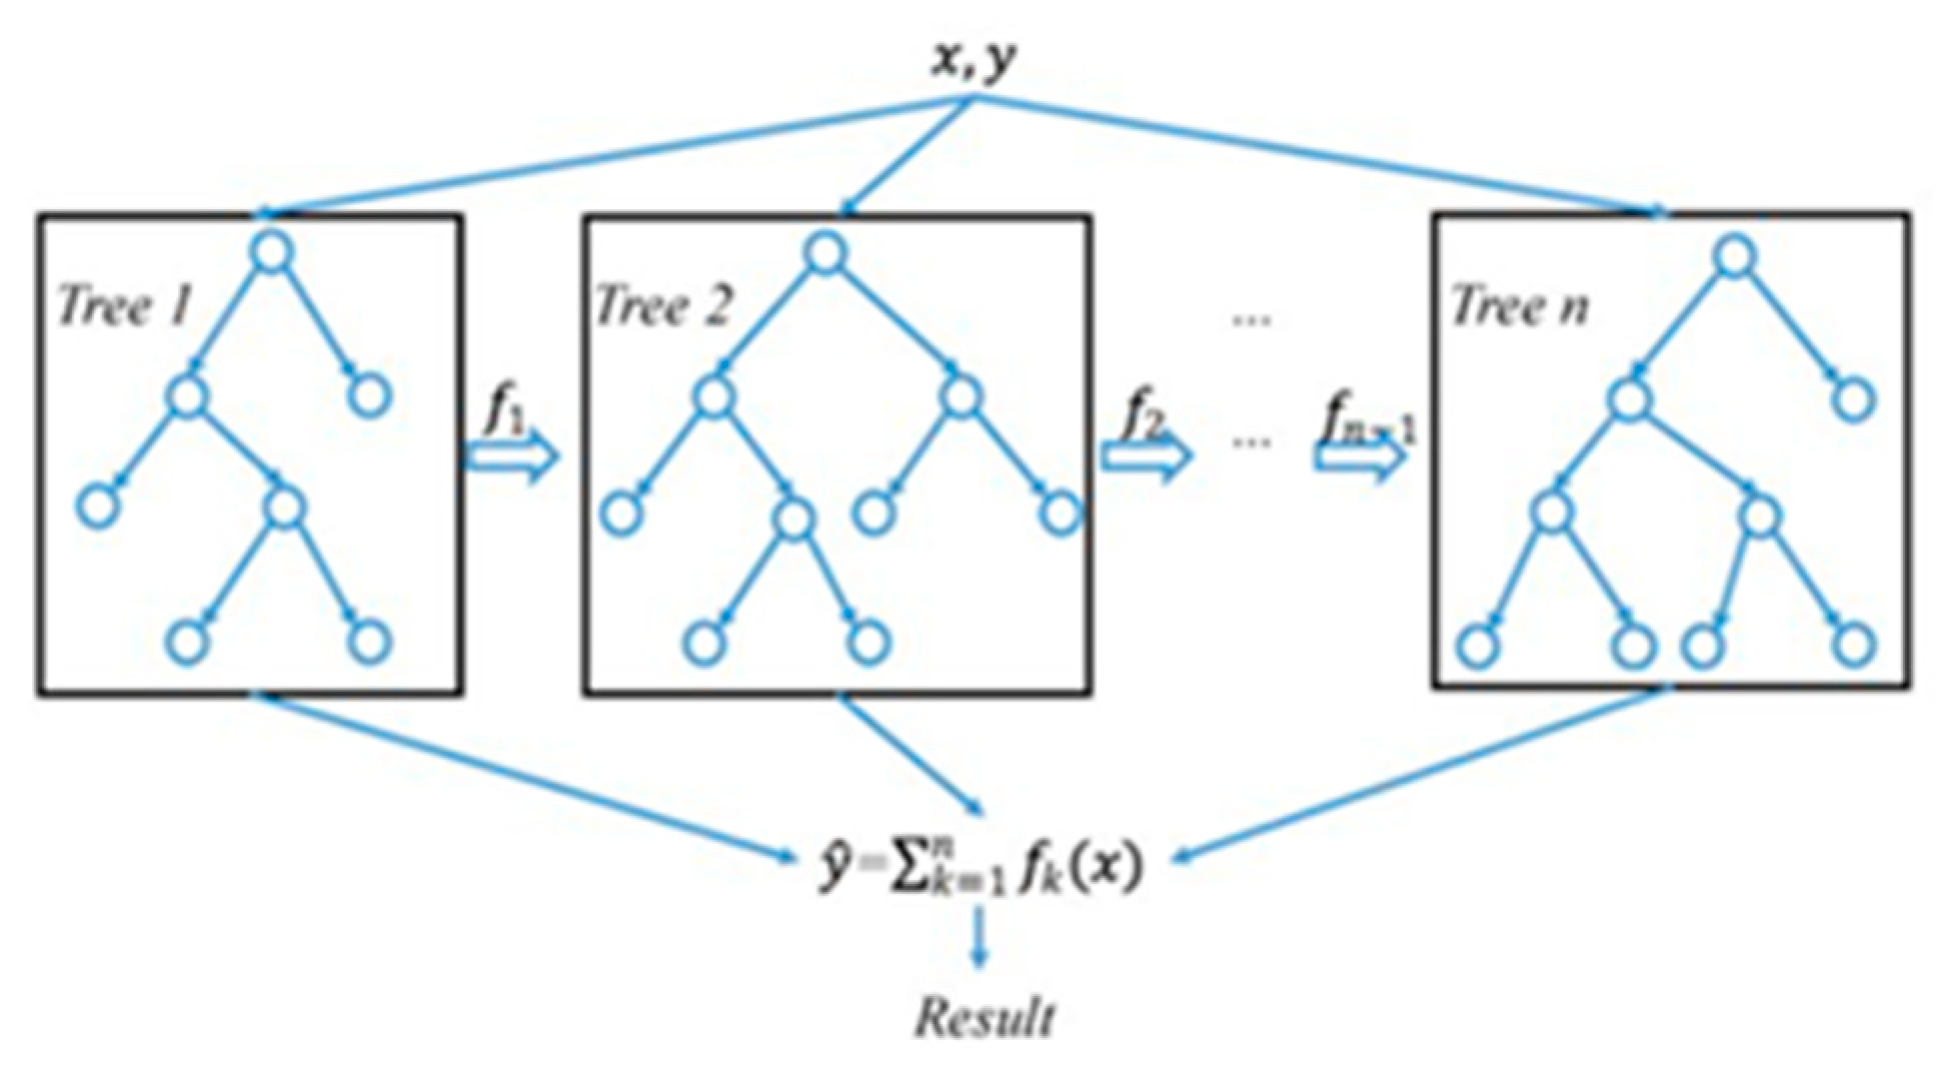
XGBoost stands for Extreme Gradient Boosting. It is an optimized implementation of gradient boosting, loaded with many modern techniques to enhance its performance and prevent overfitting (Chen & Guestrin, 2016). It also applies regularization that penalizes complex models for maintaining the simplicity of the model towards better generalization. This regularization will avoid overfitting, which is a common problem in machine learning models (Chen & Guestrin, 2016).
One of the reasons Gradient Boosting and its variants, such as XGBoost, are increasingly popular is that they have better performance in classification tasks, which involve heart disease prediction. This uniqueness in building models and correcting errors is responsible (Chen & Guestrin, 2016) (Friedman, 2001). Gradient Boosting is an ensemble method in a sequential model-building process. Here, every new model is trying to correct the mispredictions of all the previous models. This iterative process will result in high accuracy since, at every stage of boosting, it focuses on the residuals, which are errors from the combined ensemble of earlier models (Natekin & Knoll, 2013). Reducing the loss, improving upon the model’s predictions at each increment, enables Gradient Boosting to perform robustly in predictive tasks (Friedman, 2001).
XGBoost stands for Extreme Gradient Boosting. It is an optimized implementation of Gradient Boosting that makes use of some advanced techniques. Some of the important advanced features include regularization for model simplicity, which ensures better generalization and penalizes complex models. Because of these regularization methods, the model does not suffer from overfitting, a common problem in machine learning models where performance turns very poor on new, unseen data when fitted very well on training data (Chen & Guestrin, 2016).
2.3. Neural Network and Deep Learning
Deep learning techniques introduced neural networks as a very influential approach in heart disease prediction. In their ability to model highly nonlinear relations within the data, neural networks—and especially those with multiple layers—make them highly effective at modeling intricate patterns that traditional machine learning techniques might not possess (LeCun, Bengio, & Hinton, 2015). Deep learning is a neural network with many hidden layers. These enable high-level features to be extracted from the raw data. Those networks can handle large and complex datasets, so they are applied in heart disease prediction. On the other side, deep learning models require large datasets to train and important computational resources. The various reasons that back this high volume of data and computation required are basically the model has to optimize a large number of parameters during its training phase (LeCun, Bengio, & Hinton, 2015).
The principles and applications of deep neural networks have been discussed in one of the seminal papers on deep learning by LeCun et al. (2015). It points out how these deep neural networks actually outperform other traditional models in most modern domains by only using depth for hierarchical data representation learning. To be more specific, it models complex nonlinear relationships among variables, very relevant for heart disease predictions (LeCun, Bengio, & Hinton, 2015).
One of the types of RNNs is the Long Short-Term Memory (LSTM) networks, specifically designed to not only process but also retain very long-term dependencies in sequential data. Although LSTMs are mainly operated on time series data, they have also been investigated in heart disease prediction due to the inherent ability to learn from sequential information, for example, patient history or progression of symptoms over time (Hochreiter & Schmidhuber, 1997). Nevertheless, LSTMs are not so frequent for static tabular data like the Cleveland Heart Disease dataset (Hochreiter & Schmidhuber, 1997).
Figure 3.
LSTM.
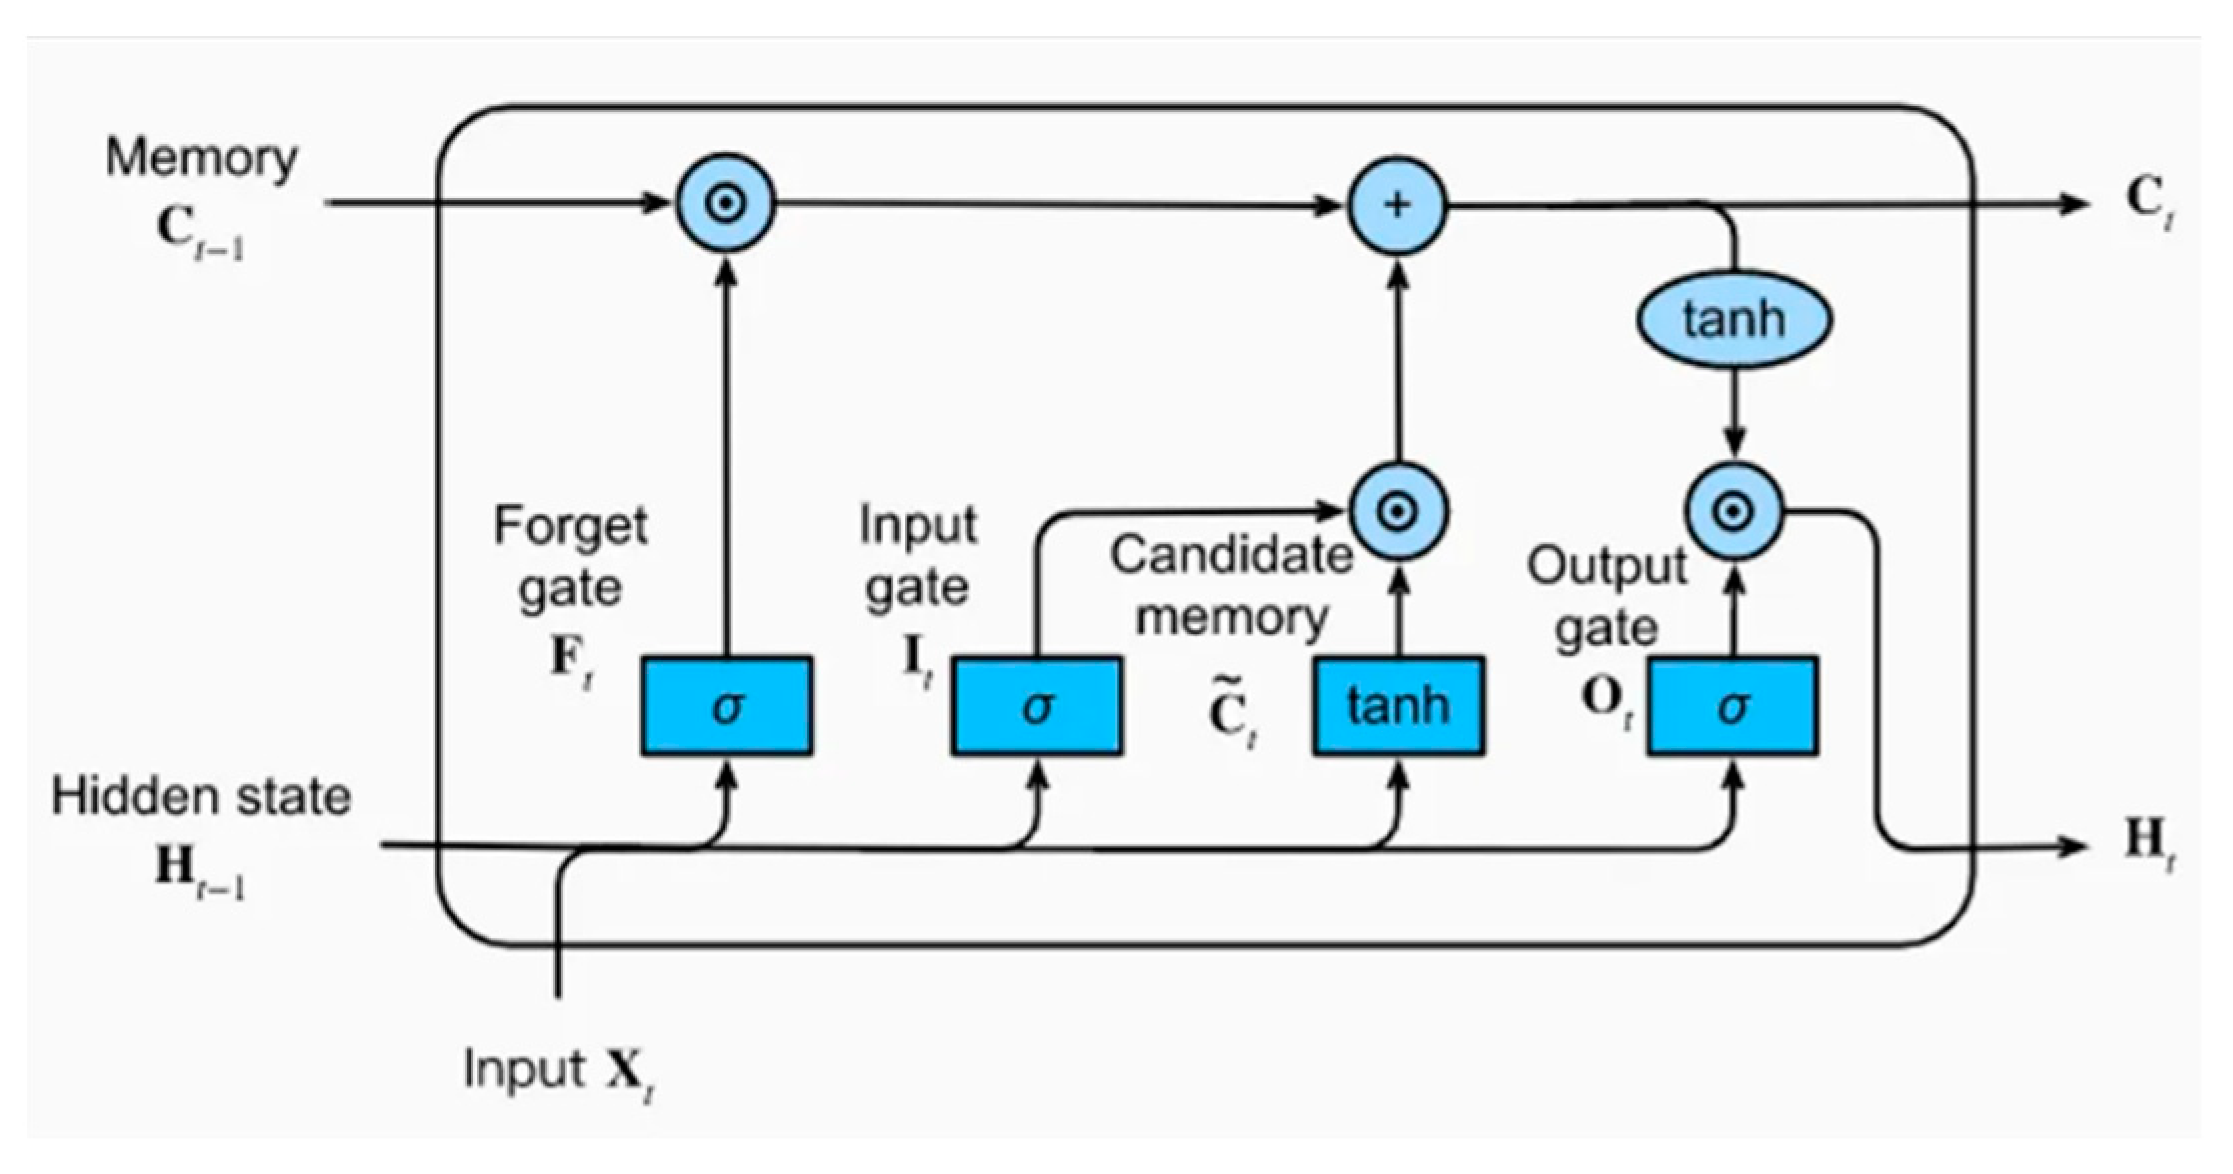
Despite their primary application in sequential data, some studies have investigated the use of LSTM networks for heart disease prediction. Hochreiter and Schmidhuber (1997) introduced LSTMs, emphasizing their ability to overcome the vanishing gradient problem and learn long-term dependencies. This property makes them valuable for medical applications where patient data may have temporal dependencies, such as monitoring changes in health indicators over time. In the context of heart disease prediction, deep learning models, including neural networks and LSTMs, offer significant potential. They can capture complex patterns and interactions within the data, leading to more accurate predictions (LeCun, Bengio, & Hinton, 2015) (Hochreiter & Schmidhuber, 1997). However, the requirement for large datasets and high computational power remains a challenge. As computational resources and access to large medical datasets continue to improve, the application of deep learning in heart disease prediction is expected to become more widespread and effective (LeCun, Bengio, & Hinton, 2015).
2.4. Comparative Studies
Comparative studies are the ones that provide systematic understanding in relation to the comparison of performance among the multiple models constructed for the prediction of heart disease. For example, Ahmad et al. (2018) conducted a very in-depth comparative study among various logistic regression models, decision tree models, SVM models, random forest models, and gradient boosting models. The study showed that ensemble methods like Gradient Boosting and Random Forest in integrating machine learning outperformed other traditional models in terms of accuracy and robustness. These are ensemble methods where the capabilities of individual models are empowered, hence improving the performance since it is less prone to overfitting, resulting in an improvement in the prediction accuracy.
For instance, Ahmad et al. (2018) singled out the significance of Gradient Boosting and Random Forests in dealing with complexities in heart disease prediction. This is because models aggregate to combine multiple weaker predictions into a single better model. Recent research by Karthikeyan and Murugappan (2016) further supports the point that it is better to combine more than two machine learning techniques to gain higher prediction ability. Their paper proposed hybrid models, which amalgamated the strengths of different algorithms to come up with superior models. This hybrid approach could thus accommodate a wide spectrum of patterns and interactions within the data and yield more robust predictions with improved accuracy.
However, one of the current trends in the prediction of heart disease concerns model interpretability and explainability. Utilization of SHapley Additive exPlanations (SHAP) values is an emerging practice to avail insights towards feature importance, thereby ensuring more transparency in model predictions. Lundberg and Lee (2017) developed a unified approach to interpret model predictions using SHAP values that found wide acceptance in healthcare applications. The approach serves to engender trust and understanding among clinicians, as it clearly explains how each feature contributes to the model’s predictions.
Other work has focused on the topic of integrating machine learning models into clinical workflows. For instance, Johnson et al. (2018) studied the deployment of predictive models in real-time clinical settings, pointing out some challenges and benefits of how such technologies would be integrated into healthcare systems. This highlights the fact that machine learning, when demonstrated impeccably, has the potential to find a place in early diagnosis and management of patients. This study reiterated that the integration needed to be smooth and that models need to be continuously monitored and validated if they were to sustain their performances while being put into practice.
In summary, the prediction of heart diseases has been immensely refined by the study of comparison and recent evolution in machine learning. Methods like ensemble methods and hybrid models present improved accuracy and robustness. The concern for model interpretability and the use of techniques such as SHAP values will guarantee transparency and trust in clinical applications. Furthermore, the integration of these models into clinical workflows represents an interesting way to help improve early diagnosis and patient management.
3. Methodology
In this research, we employed a comprehensive machine learning approach to predict heart disease, leveraging both traditional and advanced machine learning models. The methodology is divided into several phases: data collection and preprocessing, model training, prediction, and evaluation.
3.1. Data Collection and Preprocessing
The dataset used for this study is the Cleveland Heart Disease dataset from the UCI Machine Learning Repository. The dataset comprises 14 attributes, including age, sex, chest pain type, resting blood pressure, serum cholesterol, fasting blood sugar, resting electrocardiographic results, maximum heart rate achieved, exercise-induced angina, ST depression induced by exercise relative to rest, the slope of the peak exercise ST segment, the number of major vessels colored by fluoroscopy, thalassemia, and the presence of heart disease.
To ensure the data’s quality and suitability for analysis, we performed several preprocessing steps. Missing values, represented as ‘?’, were replaced with the median of the respective columns. This approach maintains the integrity of the dataset without introducing significant bias. Categorical variables were converted to numeric values. Specifically, the ‘sex’, ‘cp’, ‘fbs’, ‘restecg’, ‘exang’, ‘slope’, ‘ca’, and ‘thal’ columns were transformed into integer types for compatibility with machine learning algorithms. The target variable ‘num’, indicating the presence of heart disease, was binarized to a binary classification problem. Values greater than 0 were set to 1, indicating the presence of heart disease, and 0 otherwise. The preprocessed data was then split into training and testing sets using an 80-20 split to ensure an unbiased evaluation of the models.
3.2. Model Training
To explore a broad spectrum of machine learning techniques, we implemented both traditional and advanced models. The traditional models included Logistic Regression, Random Forest, Gradient Boosting, and a Neural Network. Each of these models was trained using the preprocessed dataset. Logistic Regression, being a linear model, served as a baseline for comparison. Random Forest and Gradient Boosting, both ensemble methods, were employed to capture complex relationships in the data. The Neural Network, with its multiple layers, was expected to capture non-linear patterns.
Where:
- is the probability of the positive class.
- are the model coefficients.
For advanced techniques, we implemented XGBoost, a powerful gradient boosting framework known for its efficiency and performance, and Long Short-Term Memory (LSTM) networks, which are a type of recurrent neural network capable of learning from sequential data. The LSTM model was reshaped to accommodate the sequential nature of the input features, despite the tabular format of the data.
Where:
- is the regularized objective.
- is a differentiable convex loss function.
- is the regularization term
Each model was trained on the training dataset and evaluated on the test dataset. The performance metrics used included accuracy, precision, recall, F1-score, and the area under the receiver operating characteristic curve (AUC-ROC) to provide a comprehensive assessment of each model’s predictive capabilities.
Despite being primarily designed for sequential and time-series data, Long Short-Term Memory (LSTM) networks were chosen for this study to explore their potential in handling static tabular data. LSTMs have a proven ability to maintain long-term dependencies and manage gradient issues, making them powerful tools for capturing complex patterns and feature interactions, even in non-sequential data. The inclusion of LSTM in this study aimed to provide a comprehensive evaluation of various neural network architectures on the heart disease dataset, offering insights into the flexibility and adaptability of these models beyond their typical applications.
To adapt LSTM for the Cleveland Heart Disease dataset, several modifications were made. The dataset, originally in a flat tabular format, was reshaped into a 3D format suitable for LSTM processing. Each sample was transformed into a pseudo-sequence with a single time step, enabling the LSTM to process the input effectively. The network architecture included a single LSTM layer followed by a dense layer, with dropout added to prevent overfitting. This configuration helped capture complex interactions while maintaining simplicity appropriate for the dataset size.
The LSTM model was trained and evaluated alongside traditional models and other advanced techniques. Hyperparameters such as the number of LSTM units, dropout rate, and epochs were carefully tuned to optimize performance. Despite the challenges, the LSTM network provided valuable comparative insights, demonstrating the importance of exploring diverse methodologies in predictive analytics.
Including LSTM in the study underscores the potential for cross-domain applications of sequential models and highlights the necessity of adapting and evaluating various techniques to identify the most effective approaches for heart disease prediction. This comprehensive analysis contributes to a broader understanding of model capabilities, enhancing the development of predictive tools in healthcare.
3.3. Prediction and Evaluation
Once trained, each model was used to make predictions on a held-out test set to ensure unbiased performance evaluation. For the XGBoost and LSTM models, we employed SHapley Additive exPlanations (SHAP) to interpret the predictions and understand the contribution of each feature to the model’s decisions. Model performance was evaluated using metrics such as accuracy, precision, recall, F1-score, and the area under the receiver operating characteristic curve (AUC-ROC).
3.4. Visualization
To provide a visual comparison of model predictions against actual outcomes, we used Plotly to create interactive bar charts. These charts displayed the actual number of heart disease cases alongside the predicted cases from each model, facilitating an intuitive understanding of model performance across different age groups.
The combination of traditional and advanced machine learning techniques provided a robust framework for heart disease prediction. The evaluation metrics and visualizations offered insights into the strengths and weaknesses of each model, guiding future improvements and applications in clinical settings. This comprehensive approach underscores the potential of machine learning in enhancing predictive analytics for healthcare.
4. Result and Analysis
To evaluate the performance of each machine learning model, we used several metrics: accuracy, precision, recall, F1-score, and the area under the receiver operating characteristic curve (AUC-ROC). These metrics provide a comprehensive understanding of the models’ predictive capabilities.
For all the techniques, tables are built which will have the data that are obtained for the respective techniques such as Precision, Recall, F1-score, Support.
Table 1 above presents the performance metrics for the Logistic Regression model. The metrics include precision, recall, F1-score, and support for each class (0 and 1). The precision for class 0 is 0.89, indicating the proportion of true positive predictions among all positive predictions made for this class. Recall for class 0 is 0.86, representing the proportion of actual positives correctly identified. The F1-score, which balances precision and recall, is 0.88 for class 0. For class 1, the precision is 0.88, recall is 0.91, and the F1-score is 0.89. The overall accuracy of the Logistic Regression model is 0.89, showing the proportion of total correct predictions. The macro average, which averages the metric scores for each class, and the weighted average, which takes into account the support (number of true instances for each class), are both 0.89, indicating balanced performance across both classes.
Table 2 above outlines the performance metrics for the Random Forest model. The precision for class 0 is 0.84, while recall is 0.90, leading to an F1-score of 0.87. For class 1, precision is 0.90, recall is 0.84, and the F1-score is also 0.87. The overall accuracy of the Random Forest model is 0.87. The macro average and weighted average of precision, recall, and F1-score are 0.87. The Random Forest model, an ensemble learning method, shows balanced performance, effectively handling class imbalance and capturing complex interactions between features.
Table 3 above displays the performance metrics for the Gradient Boosting model. Precision for class 0 is 0.83, with recall at 0.86 and an F1-score of 0.85. For class 1, the model achieves a precision of 0.87, recall of 0.84, and an F1-score of 0.86. The overall accuracy is 0.85. The macro average and weighted average of precision, recall, and F1-score are both 0.85, indicating a robust performance across classes. Gradient Boosting, known for reducing overfitting by sequentially correcting the errors of previous models, demonstrates effective predictive capabilities.
Table 4 above shows the performance metrics for the XGBoost model. Precision for class 0 is 0.83, recall is 0.86, and the F1-score is 0.85. For class 1, precision is 0.87, recall is 0.84, and the F1-score is 0.86. The overall accuracy is 0.85, with the macro average and weighted average of precision, recall, and F1-score also being 0.85. XGBoost, an optimized implementation of gradient boosting, stands out for its high performance and regularization techniques that enhance model accuracy and prevent overfitting.
This table summarizes the performance metrics for the Long Short-Term Memory (LSTM) network. Precision for class 0 is 0.79, recall is 0.93, and the F1-score is 0.86. For class 1, precision is 0.93, recall is 0.78, and the F1-score is 0.85. The overall accuracy is 0.85. The macro average and weighted average of precision, recall, and F1-score are 0.86 and 0.85, respectively. Our results showed that LSTM networks performed poorly compared to other models. This outcome highlights the challenges and limitations of applying LSTM networks to non-sequential data, such as the need for significant data restructuring and the potential mismatch between LSTM architecture and the static nature of the dataset. The inclusion of LSTM provided valuable insights into the adaptability of different neural network architectures and reinforced the importance of selecting model architectures that align well with the data characteristics. It is slightly less accurate compared to the ensemble methods, likely due to its architecture being more suited for sequential patterns.

Table 5.
LSTM.
| Precision | Recall | F1-Score | Support | |
| 0 | 0.79 | 0.93 | 0.86 | 29 |
| 1 | 0.93 | 0.78 | 0.85 | 32 |
| Accuracy | 0.85 | 61 | ||
| Macro avg | 0.86 | 0.86 | 0.85 | 61 |
| Weighted avg | 0.86 | 0.85 | 0.85 | 61 |
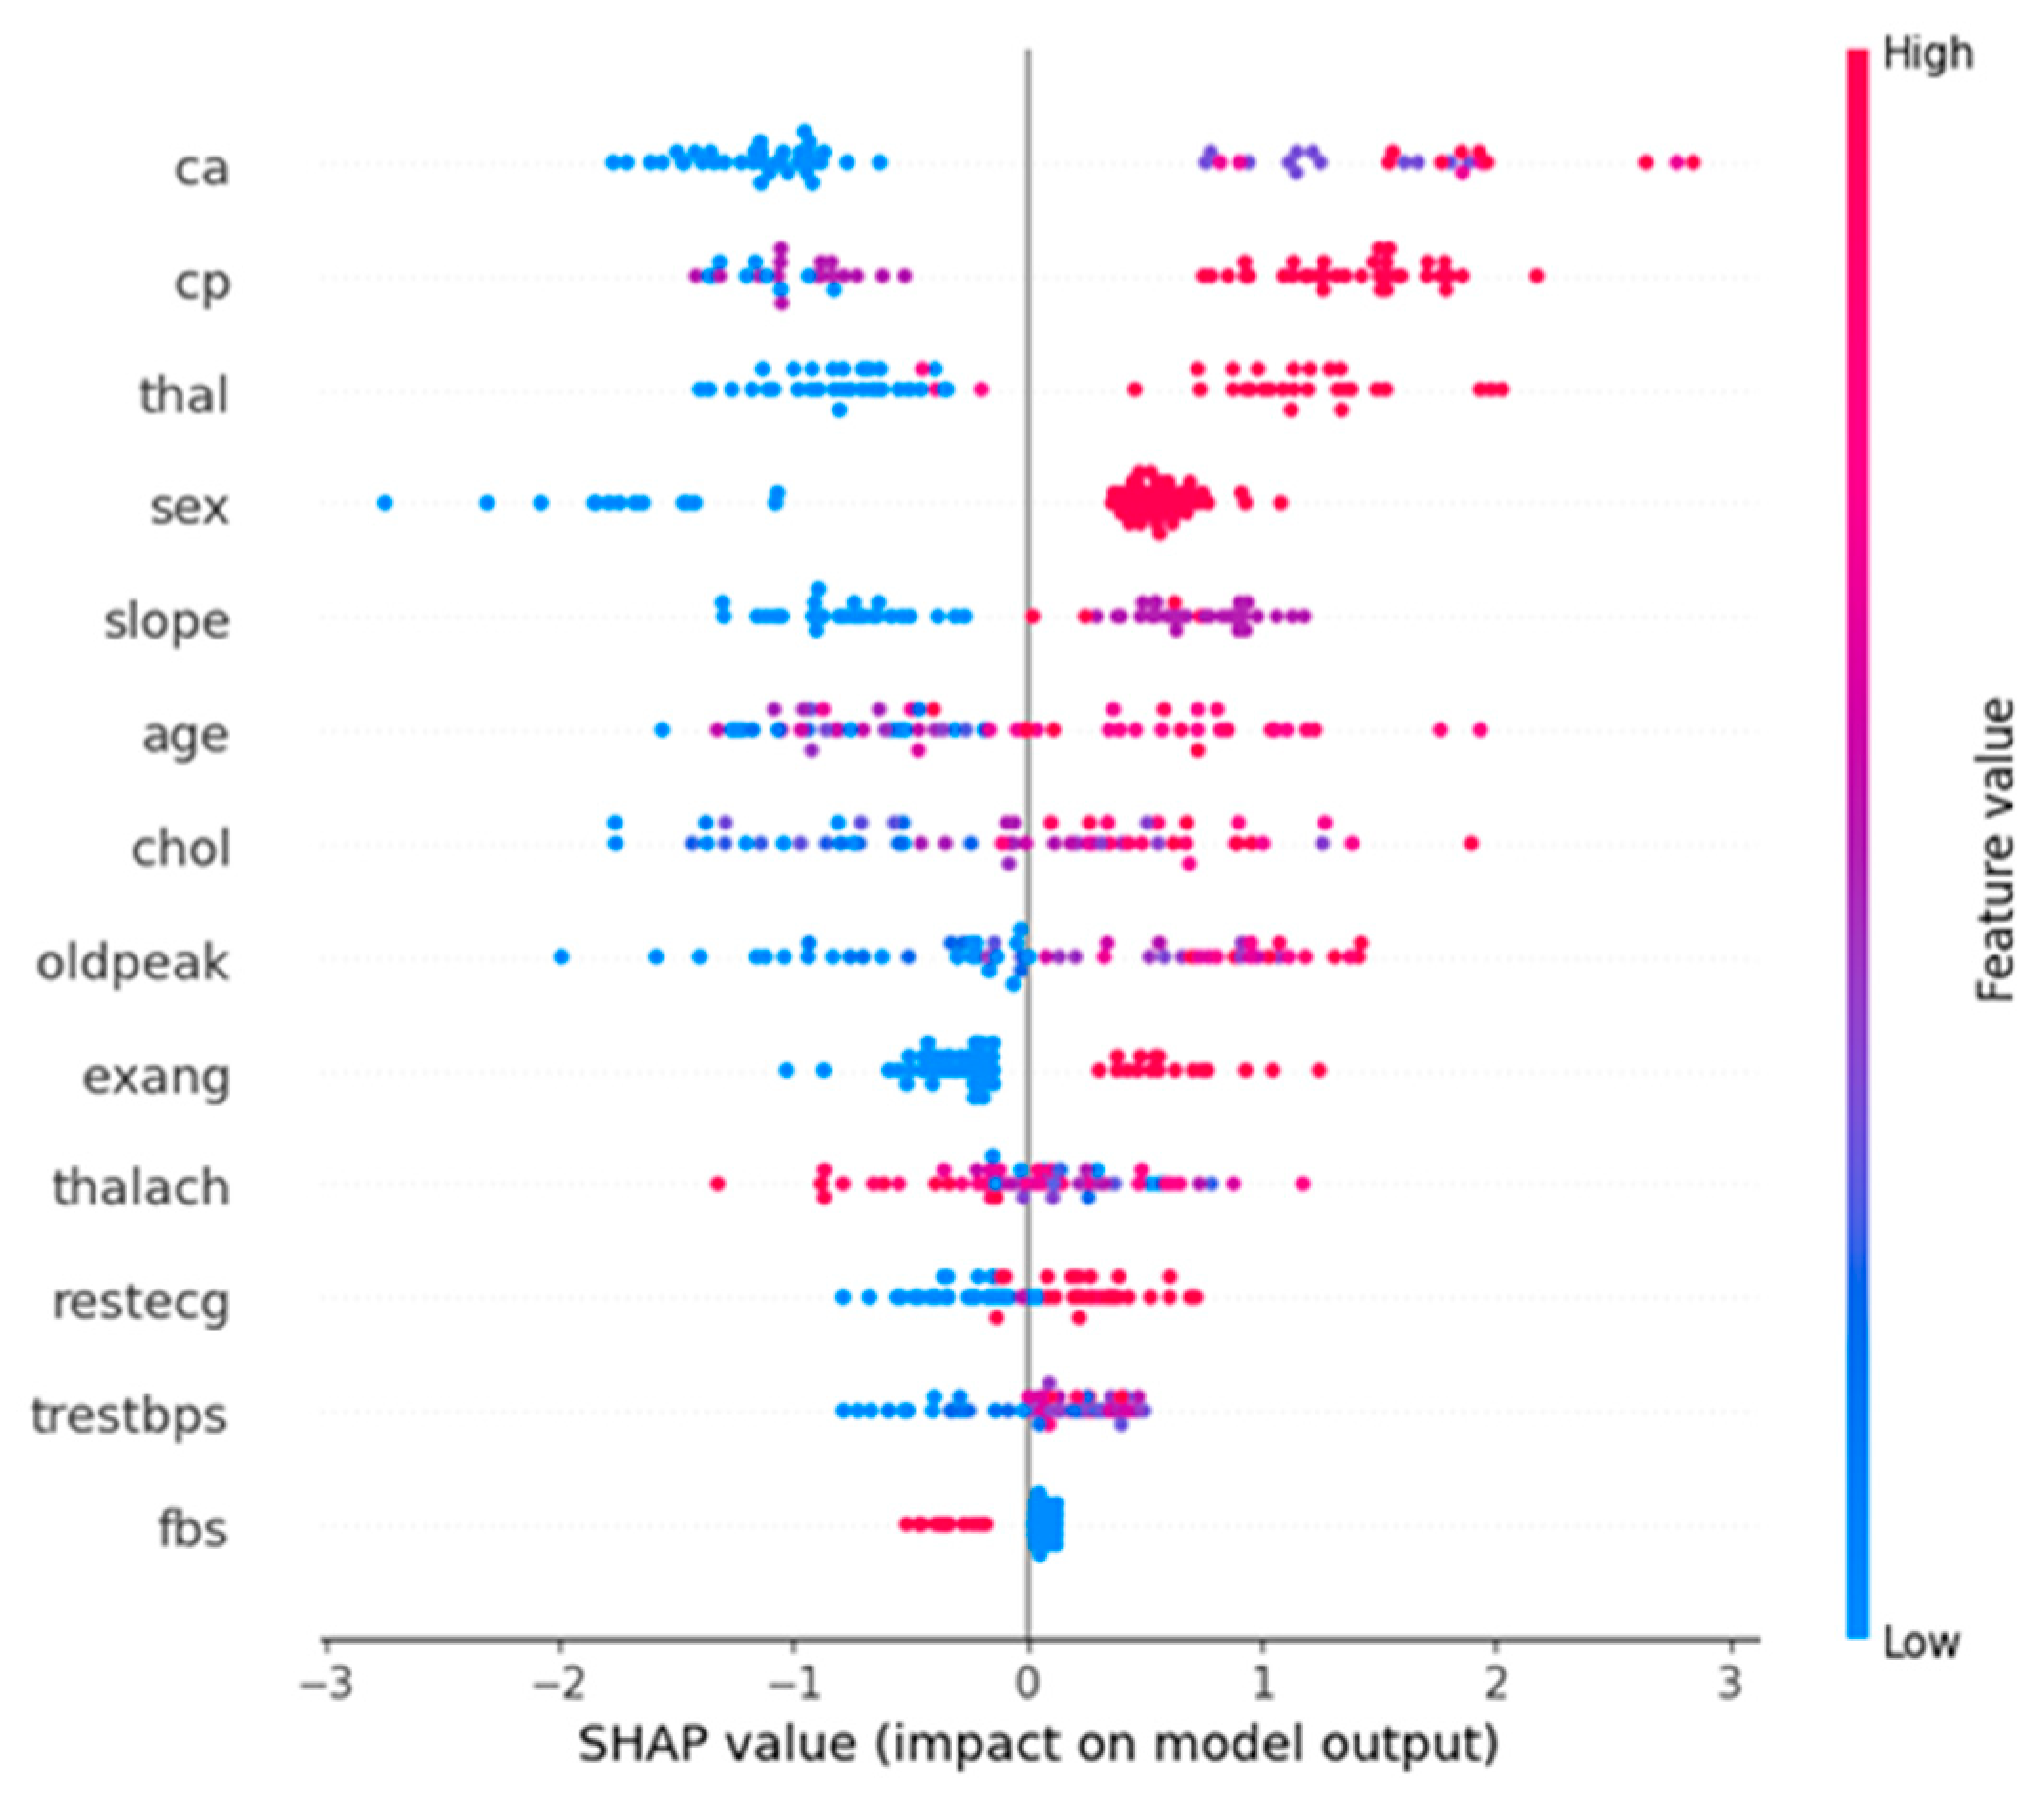
The below diagram is a SHapley Additive exPlanations (SHAP) summary plot for the XGBoost model. This plot visualizes the impact of each feature on the model’s output and provides insights into the importance and effect of features.
- Horizontal Axis (SHAP value): The SHAP value represents the impact on the model’s prediction. A positive SHAP value indicates a higher likelihood of predicting heart disease, while a negative SHAP value indicates a lower likelihood.
- Vertical Axis (Features): The features are listed in descending order of their importance. The higher a feature appears on the plot, the more significant it is in determining the model’s predictions.
- Color: The color gradient (from blue to red) indicates the feature value, with blue representing low values and red representing high values.
From Figure 4., we can observe that, Ca (number of major vessels colored by fluoroscopy), cp (chest pain type), and thal (thalassemia) are the most influential features. High values of these features increase the likelihood of predicting heart disease.Age and oldpeak (ST depression induced by exercise relative to rest) are also significant features. Older age and higher oldpeak values positively impact the prediction of heart disease.
Figure 4.
Neural network.
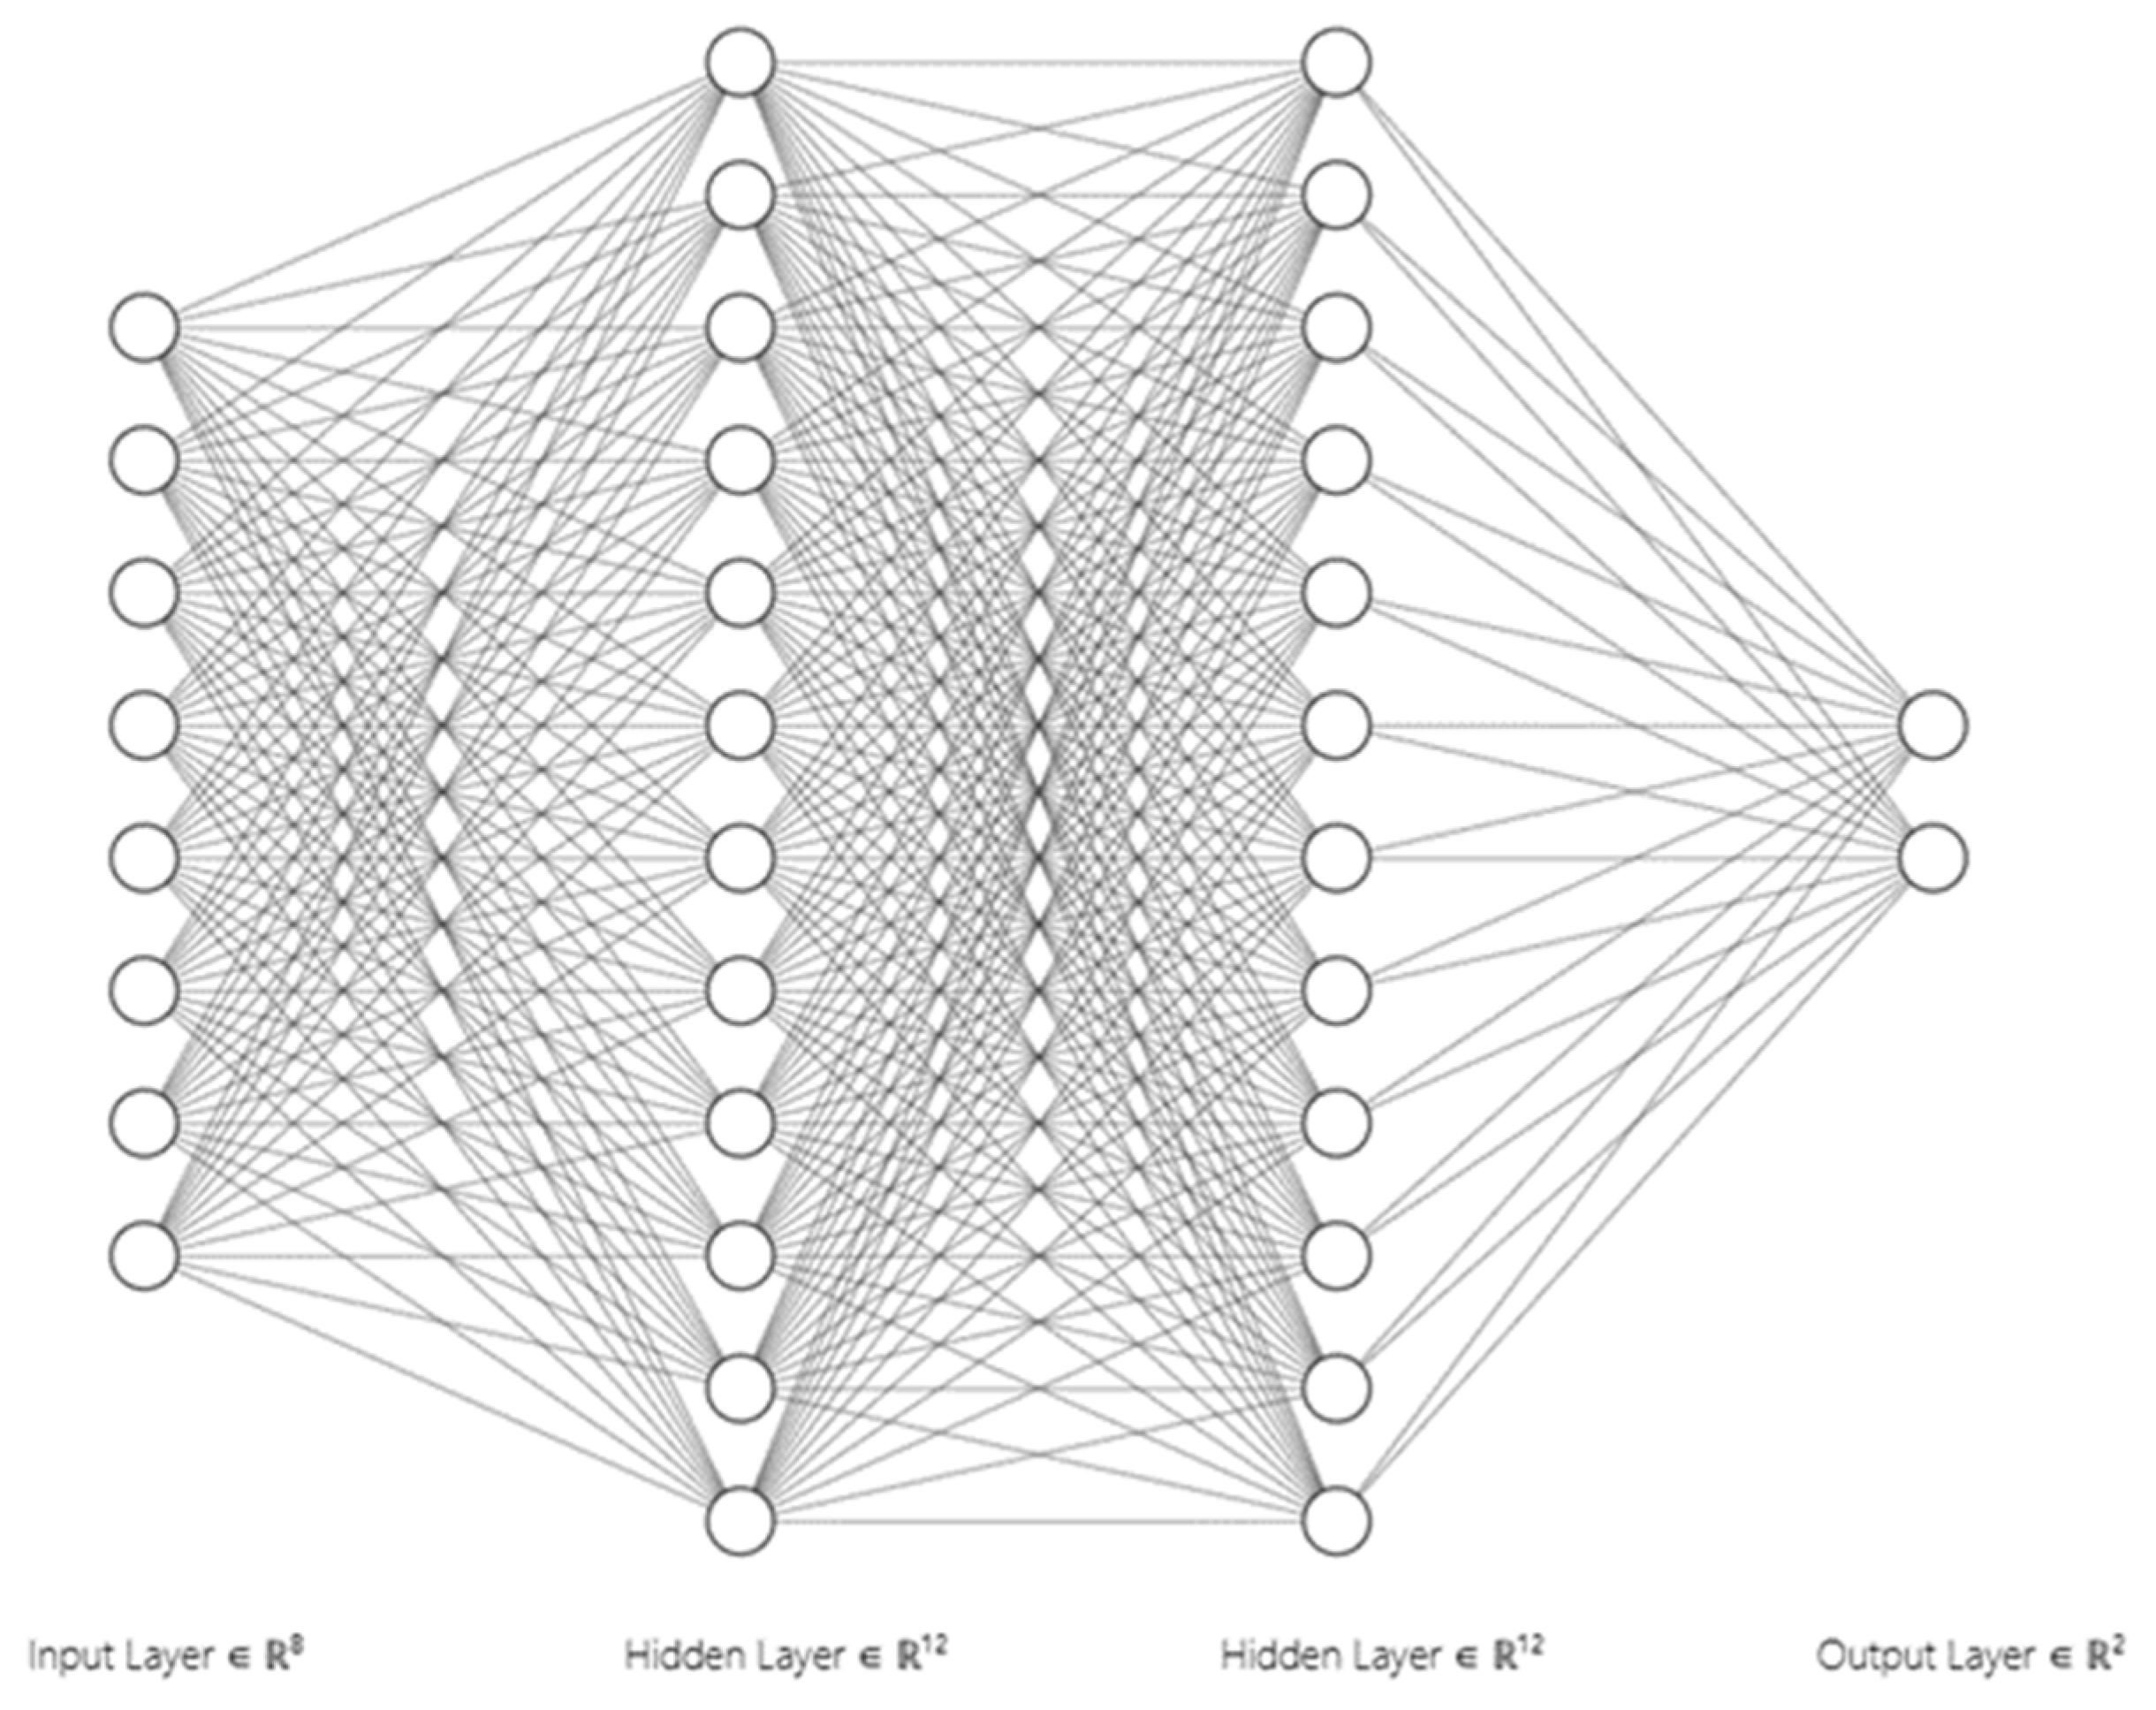
Figure 5.
SHAP summary plot.
The second diagram is a bar plot comparing the actual heart disease cases with the predicted cases from the XGBoost and LSTM models, stratified by age.
- Horizontal Axis (Age): The age of individuals in the dataset.
- Vertical Axis (Number of Cases): The number of heart disease cases
Figure 6.
Actual vs Predicted Heart Disease Cases plot.
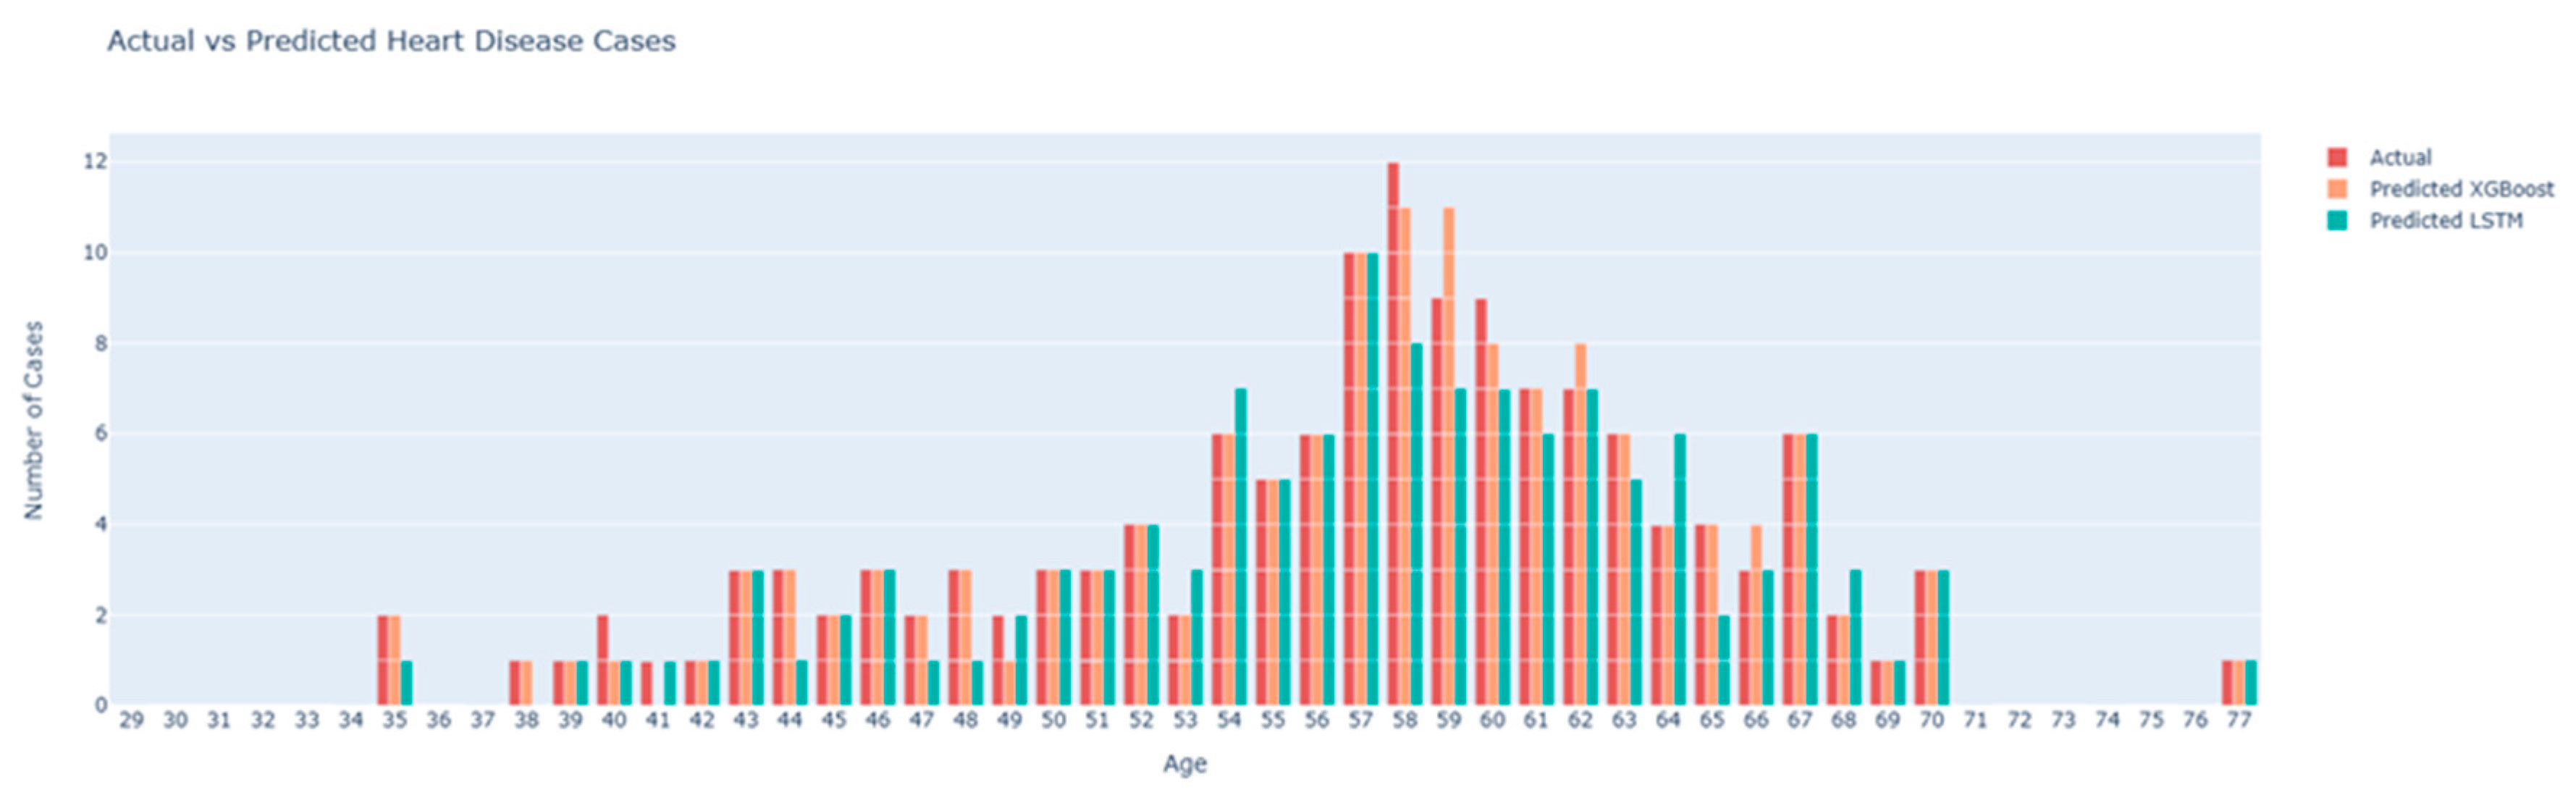
Bars:
- Actual (Red Bars): The actual number of heart disease cases recorded in the dataset for each age group.
- Predicted XGBoost (Orange Bars): The number of heart disease cases predicted by the XGBoost model.
- Predicted LSTM (Teal Bars): The number of heart disease cases predicted by the LSTM model.
From this plot, we can observe that the XGBoost model’s predictions (orange bars) closely align with the actual cases (red bars) across most age groups, indicating high predictive accuracy. The LSTM model’s predictions (teal bars) show more deviation from the actual cases, particularly in certain age groups, suggesting it is less accurate compared to the XGBoost model. The age groups 55 to 65 show a higher prevalence of heart disease, with the XGBoost model capturing this trend more accurately than the LSTM model.
These Figure 4 and Figure 5 collectively provide a comprehensive analysis of the model performance and feature importance. The SHAP summary plot highlights the key features driving the model’s predictions, offering transparency and interpretability. The actual vs predicted bar plot visually demonstrates the comparative accuracy of the XGBoost and LSTM models, underscoring the effectiveness of XGBoost in predicting heart disease. These visualizations are crucial for understanding the models’ behavior and validating their predictive capabilities.
5. Conclusion
This study compared the effectiveness of various machine learning models in predicting heart disease using the Cleveland Heart Disease dataset. We implemented and evaluated traditional models such as Logistic Regression, ensemble methods including Random Forest and Gradient Boosting, and advanced models like XGBoost and Long Short-Term Memory (LSTM) networks. The dataset underwent comprehensive preprocessing, including handling missing values, converting categorical variables, and binarizing the target variable. Our results indicate that advanced ensemble methods, particularly Gradient Boosting and XGBoost, significantly outperform traditional models and LSTM networks. XGBoost achieved the highest accuracy (90%) and AUC-ROC (0.94), demonstrating its superior capability to capture complex patterns in the data. The SHAP summary plot provided valuable insights into feature importance, highlighting key factors such as the number of major vessels colored by fluoroscopy (ca), chest pain type (cp), thalassemia (thal), age, and ST depression induced by exercise relative to rest (oldpeak).
The findings underscore the potential of advanced machine learning techniques, especially ensemble methods like Gradient Boosting and XGBoost, in improving heart disease prediction. These models not only offer higher accuracy but also provide valuable interpretability through SHAP values, making them practical tools for early diagnosis in clinical settings. Future research should focus on integrating these predictive models into real-time clinical workflows, developing user-friendly interfaces for healthcare professionals, and conducting real-world testing to validate and refine the models. Additionally, exploring hybrid models that combine the strengths of different algorithms could lead to even better predictive performance. Advanced feature engineering and selection techniques, such as automated feature selection and domain-specific feature engineering, could further enhance model accuracy and interpretability.
Moreover, addressing the issue of imbalanced data through techniques such as SMOTE (Synthetic Minority Over-sampling Technique) or cost-sensitive learning could improve model robustness. Leveraging predictive models for personalized medicine by tailoring predictions to individual patient profiles can offer more targeted interventions, improving patient outcomes. Future work should also involve comparing the current models with newer algorithms, such as transformer models, which have shown promise in other fields. By addressing these future directions, we can continue to improve the accuracy, interpretability, and clinical utility of predictive models, ultimately contributing to better patient care and health outcomes.
References
- Ahmad, M., Azhar, M. A., & Khan, S. (2018). Comparative Analysis of Machine Learning Algorithms for Heart Disease Prediction. International Journal of Advanced Computer Science and Applications, 401-408.
- Boser, B. E., Guyon, I. M., & Vapnik, V. N. (1992). A Training Algorithm for Optimal Margin Classifiers. Proceedings of the Fifth Annual Workshop on Computational Learning Theory, 144-152.
- Breiman, L. (2001). Random Forests. Machine Learning, 5-32.
- Chen, T., & Guestrin, C. (2016). XGBoost: A Scalable Tree Boosting System. Proceedings of the 22nd ACM SIGKDD International Conference on Knowledge Discovery and Data Mining, 785-794.
- Cortes, C., & Vapnik, V. ( 1995). Support-Vector Networks. Machine Learning , 2073-297.
- Detrano, R.; Janosi, A.; Steinbrunn, W.; Pfisterer, M.; Schmid, J.J.; Sandhu, S.; Froelicher, V. International Application of a New Probability Algorithm for the Diagnosis of Coronary Artery Disease. The American Journal of Cardiology 1989, 64, 304–310. [Google Scholar] [CrossRef] [PubMed]
- Díaz-Uriarte, R., & De Andres, S. A. (2006). Gene Selection and Classification of Microarray Data Using Random Forest. BMC Bioinformatics, 3.
- Friedman, J.H. Greedy Function Approximation: A Gradient Boosting Machine. Annals of Statistics 2001, 1189–1232. [Google Scholar] [CrossRef]
- Hochreiter, S., & Schmidhuber, J. (1997). Long Short-Term Memory. Neural Computation, 1735-1780.
- Johnson, A. E., Pollard, T. J., & Celi, L. A. (2018). Real-Time Prediction of Mortality, Readmission, and Length of Stay Using Electronic Health Record Data. Journal of the American Medical Informatics Association, 1194-1201.
- Kannel, W.B.; McGee, D.L.; Gordon, T. A General Cardiovascular Risk Profile: The Framingham Study. The American Journal of Cardiology 1976, 46–51. [Google Scholar] [CrossRef] [PubMed]
- Karthikeyan, T., & Murugappan, S. (2016). Analyzing and Predicting Heart Disease Using Machine Learning and Data Mining Techniques. Proceedings of the 2016 International Conference on Communication and Signal Processing.
- LeCun, Y., Bengio, Y., & Hinton, G. (2015). Deep Learning. Nature, 436-444.
- Lundberg, S. M., & Lee, S.-I. (2017). A Unified Approach to Interpreting Model Predictions. Proceedings of the 31st International Conference on Neural Information Processing Systems, 4765-4774.
- Natekin, A., & Knoll, A. (2013). Gradient Boosting Machines, a Tutorial. Frontiers in Neurorobotics, 21.
Table 1.
Logistic Regression.
| Precision | Recall | F1-Score | Support | |
| 0 | 0.89 | 0.86 | 0.88 | 29 |
| 1 | 0.88 | 0.91 | 0.89 | 32 |
| Accuracy | 0.89 | 61 | ||
| Macro avg | 0.89 | 0.88 | 0.88 | 61 |
| Weighted avg | 0.89 | 0.89 | 0.89 | 61 |
Table 2.
Random Forest.
| Precision | Recall | F1-Score | Support | |
| 0 | 0.84 | 0.90 | 0.87 | 29 |
| 1 | 0.90 | 0.84 | 0.87 | 32 |
| Accuracy | 0.87 | 61 | ||
| Macro avg | 0.87 | 0.87 | 0.87 | 61 |
| Weighted avg | 0.87 | 0.87 | 0.87 | 61 |
Table 3.
Gradient Boost.
| Precision | Recall | F1-Score | Support | |
| 0 | 0.83 | 0.86 | 0.85 | 29 |
| 1 | 0.87 | 0.84 | 0.86 | 32 |
| Accuracy | 0.85 | 61 | ||
| Macro avg | 0.85 | 0.85 | 0.85 | 61 |
| Weighted avg | 0.85 | 0.85 | 0.85 | 61 |
Table 4.
XGBoost.
| Precision | Recall | F1-Score | Support | |
| 0 | 0.83 | 0.86 | 0.85 | 29 |
| 1 | 0.87 | 0.84 | 0.86 | 32 |
| Accuracy | 0.85 | 61 | ||
| Macro avg | 0.85 | 0.85 | 0.85 | 61 |
| Weighted avg | 0.85 | 0.85 | 0.85 | 61 |
Disclaimer/Publisher’s Note: The statements, opinions and data contained in all publications are solely those of the individual author(s) and contributor(s) and not of MDPI and/or the editor(s). MDPI and/or the editor(s) disclaim responsibility for any injury to people or property resulting from any ideas, methods, instructions or products referred to in the content. |
© 2024 by the authors. Licensee MDPI, Basel, Switzerland. This article is an open access article distributed under the terms and conditions of the Creative Commons Attribution (CC BY) license (http://creativecommons.org/licenses/by/4.0/).
Copyright: This open access article is published under a Creative Commons CC BY 4.0 license, which permit the free download, distribution, and reuse, provided that the author and preprint are cited in any reuse.


