
Submitted:
18 July 2025
Posted:
22 July 2025
You are already at the latest version
Abstract
Cardiovascular disease (CVD) is one of the leading causes of mortality worldwide, which raises the fundamental need to apply efficient predictive tools to support clinical deci-sion-making. This study compares the predictive performance of Bagging, Random Forest, Extra Trees, Gradient Boosting, and AdaBoost ensemble learning algorithms applied to a clinical dataset of CVD patients. The methodology included data preprocessing and cross-validation to regulate generalization. Performance was evaluated using multiple metrics: accuracy, F1 score, precision, recall, Cohen's Kappa, and area under the curve (AUC). Among the models evaluated, Bagging demonstrated the best overall performance (accuracy: 93.36 %± 0.22; F1 Score: 0.936; AUC: 0.9686), reaching also the lowest average rank (1.0) in Friedman's test and placing, together with Extra Trees (90.76 %± 0.18; AUC: 0.9689), in the superior statistical group (group A) according to Nemenyi's post-hoc test. Both models evidenced high agreement with the real labels (Kappa: 0.87 and 0.83, respec-tively), which reinforces their reliability in real clinical settings. The results validate the superiority of aggregation-based ensemble methods in terms of accuracy, stability, and concordance, highlighting Bagging and Extra Trees as preferred candidates for cardio-vascular diagnostic support systems, where reliability and generalization are essential.
Keywords:
ensemble models
; machine learning
; prediction
; cardiovascular diseases
; myocardial infarction
1. Introduction
Cardiovascular disease (CVD) is the leading cause of death worldwide. According to the World Health Organization (WHO), approximately 17.9 million people died from CVD in 2019, representing 32% of all global deaths [3]. Of these deaths, 85% were attributed to acute cardiovascular events, primarily acute myocardial infarction (AMI) and cerebrovascular accidents (CVAs) [2]. More than 66% of the global burden of CVD is concentrated in low- and middle-income countries (LMICs) [4], where structural limitations in health systems, including deficiencies in hospital infrastructure, specialized human resources and access to emergency services, represent critical barriers to timely, effective and continuous care, thus increasing the associated morbidity and mortality [5]. This structural scenario is exacerbated by an unfavorable epidemiological transition characterized by sustained increases in modifiable cardiovascular risk factors, such as obesity, type 2 diabetes mellitus, hypertension, and a sedentary lifestyle [6]. The confluence of these clinical and social determinants intensifies the disease burden, exacerbating CVD-attributable morbidity and mortality. This upward trend reflects a growing challenge for health systems and has profound long-term clinical and epidemiological implications [8]. The most recent global estimates project that, without effective primary prevention interventions and strengthened primary care, CVD-attributable deaths could exceed 23.6 million per year by 2030 [3,9].
The management of CVD is not only a clinical challenge, but also a growing economic burden for health systems globally [10]. The most recent estimates project that the total cost associated with CVD-linked treatment, rehabilitation, and lost productivity could reach US$1.1 trillion by 2035, a substantial increase from the US$555 billion reported in 2015 [11]. This exponential increase in economic impact is attributed to both population aging and the expansion of poorly controlled cardiovascular risk factors, underscoring the urgent need for cost-effective prevention strategies and predictive models for early intervention [12].
Prevention and early diagnosis of CVD are essential to reduce its impact on overall morbidity and mortality [13]. Most CVDs can be prevented by interventions aimed at modifying risk factors [14,15]. At the same time, early detection allows optimal clinical management, facilitating the timely implementation of therapeutic and pharmacological strategies that improve the prognosis and quality of life of patients [16].
In the context of early cardiovascular risk assessment, biomarkers play a key role by facilitating early detection of subclinical cardiac dysfunction and enabling accurate risk stratification for adverse cardiovascular events [17]. Among the most widely used are cardiac troponins (cTnI and cTnT), recognized as the most sensitive and specific markers for the detection of myocardial necrosis [18], making them essential tools for the timely diagnosis of acute myocardial infarction (AMI) [19,20]. On the other hand, B-type natriuretic peptide (BNP) and its N-terminal inactive fragment (NT-proBNP) are key biomarkers in the functional assessment of the left ventricle and the classification of heart failure, both with reduced and preserved ejection fraction [21]. Additionally, high-sensitivity C-reactive protein (hs-CRP) has been widely validated as a marker of systemic inflammation, with relevant clinical implications in the pathophysiology of atherosclerosis and its association with an increased risk of major cardiovascular events, including myocardial infarction and stroke [22].
In addition to serum biomarkers, the lipid profile is an essential component in the comprehensive assessment of cardiovascular risk [23]. This profile includes the quantification of lipoproteins such as low-density cholesterol (LDL-C), high-density cholesterol (HDL-C), total cholesterol, and triglycerides, whose altered levels have been robustly associated with the progression of atherosclerosis and the development of coronary heart disease [24]. Early detection and appropriate management of these dyslipidemias allow the implementation of primary and secondary prevention strategies aimed at reducing the burden of atherothrombotic cardiovascular events [25]. In a complementary manner, noninvasive cardiovascular imaging techniques represent fundamental diagnostic tools for the structural and functional detection of heart disease in early stages [26]. The electrocardiogram (ECG) allows the identification of electrical alterations of the heart, facilitating the diagnosis of arrhythmias and myocardial ischemia [27]. Echocardiography evaluates myocardial structure and function, being key in the diagnosis of heart failure and valvular heart disease [28]. Coronary angiotomography (CTA) offers a non-invasive assessment of atherosclerosis, while cardiac magnetic resonance (CMR) provides detailed information on myocardial viability, inflammation, and fibrosis [29]. Complementarily, functional and stress tests, such as stress testing, stress echocardiography, and myocardial perfusion by SPECT and PET, allow accurate assessment of coronary ischemia and perfusion [30,31].
However, despite their high diagnostic accuracy, many of these techniques are expensive and require specialized infrastructure, which limits their implementation in low-resource countries [2,12]. Given this problem, predictive models based on machine learning have emerged as a promising alternative for the early diagnosis of cardiovascular disease [1,32]. These models have demonstrated a superior capacity for risk stratification and prediction of cardiovascular events, allowing more efficient identification of high-risk patients and optimizing clinical decision making [33].
Research on machine learning algorithms applied to cardiovascular problems has gained significant relevance in recent years [34,35]. However, the use of a machine learning model in clinical prediction, such as in the early diagnosis of acute myocardial infarction, presents significant technical limitations that compromise its applicability in a real-world setting [36,37]. Problems such as overfitting, convergence to local optima, sensitivity to noise, and instability to slight variations in the data affect its generalizability and robustness [38,39]. These shortcomings are compounded when working with complex, multivariate, and often unbalanced clinical data, such as those found in cardiology [40]. In response to these limitations, ensemble methods have emerged as a superior methodological strategy by integrating multiple models to reduce bias, variance, and improve the stability of the predictive system [36,37]. Algorithms such as bagging, boosting, and stacking allow leveraging the strengths of diverse classifiers, generating more accurate, interpretable, and clinically useful predictions [41]. Despite their proven effectiveness, the application of ensemble architectures in predicting myocardial infarction remains scarce in the literature [42], revealing a knowledge gap with direct implications for the design of intelligent medical decision support systems. The present investigation responds to this gap, proposing a comprehensive approach that combines methodological rigor and clinical applicability to contribute to the development of decision support tools in cardiovascular medicine.
In this context, the present study aims at the development and comparative evaluation of machine learning assembly architectures oriented to the prediction of acute myocardial infarction. This approach seeks not only to maximize diagnostic accuracy but also to improve the robustness and generalizability of the models in real clinical settings, where patient heterogeneity, the presence of unbalanced data, and variability in the clinical presentation of the disease constitute significant challenges for traditional models.
2. Literature Review
A comprehensive review of the most relevant literature on myocardial infarction prediction was performed, with a focus on the application of machine learning algorithms. In this context, Liu et al. [43] developed supervised machine learning models for myocardial infarction prediction, using recursive feature elimination as a selection algorithm and a hierarchical modeling approach; random forest, gradient boosting decision tree (GBDT), logistic regression, and support vector machine were evaluated, and GBDT was determined to be the optimal model. In the same line of research Wang et al. [44] developed three machine learning (ML) models to predict the occurrence of tachyarrhythmias after acute myocardial infarction (AMI). After variable selection, the artificial neural network (ANN) showed the highest accuracy, outperforming the model based on the GRACE score variables. Sharma and Sunkaria[45] proposed a technique based on the stationary wavelet transform to analyze multiderivative electrocardiogram (ECG) signals, extracting discriminative features; support vector machine (SVM) and k-nearest neighbor (KNN) were used to classify patients with MI and controls, using the PTB-DB database. In the class-oriented approach, SVM achieved an accuracy of 98.84% (AUC = 0.9994) and KNN 98.69% (AUC = 0.9945).
Additionally, Oliveira et al. [46] analyzed data from patients with a principal diagnosis of AMI in a Portuguese hospital (2013-2015) to predict mortality using machine learning. Three experiments were performed, varying the number and type of variables included. In Experiment 1, stochastic gradient descent achieved an accuracy of 80%, a recall of 77% and an AUC of 79%. In Experiment 2, the inclusion of new variables improved SVM performance (AUC = 81%). In Experiment 3, the combination of feature selection and the SMOTE technique optimized the model, achieving an AUC of 88% and a recall of 80 %. These results highlight the impact of variable selection and data balancing in the prediction of AMI mortality.
On the other hand, Li et al. [47] developed an early warning model for heart failure (HF) in AMI patients using machine learning techniques. Cohort 1 (2018-2019) included patients with and without HF, and seven algorithms were evaluated using features selected from routine testing. Cohort 2 (2020-2021) was used for external model validation. Among the models evaluated, XGBoost showed the best performance, identifying troponin I, triglycerides, urine red blood cell count, γ-glutamyl transpeptidase, glucose, urine density, prothrombin time, prealbumin, and urea as key features. The HF-Lab9 model, based on XGBoost, achieved an AUC of 0.966 and demonstrated a high clinical benefit according to decision analysis (DCA), highlighting its potential in early prediction of post-AMI HF.
In a systematic review study, Cho et al. [48] reported that of 7348 articles identified, 112 were reviewed at full text, resulting in a final set of 24 studies with data from 374,365 patients. Machine learning (ML) models evaluated included neural networks (n = 12), random forests (n = 11), decision trees (n = 8), support vector machines (n = 8), and Bayesian approaches (n = 7). In comparison, traditional case modeling methods (CSM) used logistic regression (n = 19), CSM-derived risk scores (n = 12), and Cox regression (n = 2). Of the 19 studies that analyzed mortality, 13 reported higher C rates with ML. In total, 29 comparisons were made between ML and CSM, with absolute differences less than 0.05 in 90% of cases.
Using a similar approach, Barker et al. [49] performed a systematic search of 10 databases, identifying 4356 studies, of which 11 met the inclusion criteria. The ML models included between 4 and 72 variables and had an AUC between 0.71 and 0.96. In five of six comparative studies, ML outperformed regression. However, no study met reporting standards, and five were at high risk of bias.
Despite recent advances in the application of individual machine learning models for cardiovascular event prediction, these approaches have critical limitations, including risk of bias, low interpretability, limited generalizability [50], and propensity to converge to local optima [51]. These shortcomings reduce their effectiveness in real clinical settings, where data heterogeneity and the need for reliable decisions demand robust, stable, and explainable models [52]. These challenges are intensified in contexts characterized by large volume datasets, high dimensionality, and clinically heterogeneous populations, where the structural complexity and intrinsic variability of the data increase the risk of overfitting and hinder the stability and generalizability of models[33] . In this context, and as a response to the limitations of individual models, the development and comparative evaluation of ensemble architectures in machine learning is proposed. These techniques allow for mitigating overfitting, improving learning stability, and strengthening generalization capability by combining multiple base estimators that capture different patterns in complex and heterogeneous clinical data [38].
In this context, the present study aims to address the existing gap in the early prediction of acute myocardial infarction by developing, benchmarking, and validating machine learning models based on ensemble techniques. This methodological approach aims to improve the stability, interpretability, and generalizability of predictive models, fundamental attributes for their future implementation in real clinical settings.
By combining multiple base algorithms through robust aggregation methods such as bagging, boosting, AdaBoost, and ExtraTrees, we aim to reduce the limitations of individual models, especially regarding performance variability, overfitting, and sensitivity to noise. This research thus contributes to developing more accurate, reliable, and clinically relevant predictive tools that can aid medical decision-making in the timely identification of patients at risk of acute coronary events.
3. Methodology
For the development of the model, the methodology used in the design of machine learning machines was applied, as described below:
3.1. Data Source
A dataset extracted from the Kaggle repository (https://www.kaggle.com/datasets/ankushpanday2/heart-attack-risk-dataset-of-china, accessed February 10, 2024), comprising 239,266 records and 28 variables, was utilized in this research. This dataset represents a solid basis for modeling the risk of acute myocardial infarction in Chinese population by integrating fundamental clinical variables such as age, sex, smoking, blood pressure, cholesterol levels, and cardiovascular history along with relevant contextual determinants, including regional disparities in access to health services, urban and rural habits, and environmental exposure to air pollutants.
3.2. Data Pre-Processing
An initial exploratory analysis of the database was conducted using descriptive statistical functions to identify missing values, inconsistencies in data types, and anomalies in the distribution of variables. To ensure structural consistency, the data were integrated by merging and concatenation techniques, standardizing variable names and formats.
The management of missing values was addressed through combined elimination and imputation strategies, applying the mean, median, or mode depending on the type of variable (continuous or categorical). For the treatment of outliers, Z-score analysis was used to preserve only clinically plausible patterns in the context of acute myocardial infarction. Likewise, duplicate observations were eliminated by drop_duplicates() to avoid redundancies and biases in model training.
Categorical variables were transformed by one-hot encoding, using OneHotEncoder and pd.get_dummies(), ensuring their adequate representation for machine learning algorithms. Subsequently, variable scaling and transformation techniques were applied to improve the homogeneity of the distributions and the numerical stability of the model: standardization with StandardScaler.
These preprocessing stages were fundamental to optimizing the performance of the predictive models in the classification of clinical risk and the identification of complications associated with acute myocardial infarction.
3.3. Selection of Learning Algorithm
The selection of ensemble models for the prediction of complications of acute myocardial infarction is based on their ability to improve model accuracy and robustness by combining multiple base estimators. This strategy is advantageous in clinical scenarios where data present high variability and nonlinear relationships between patient characteristics and clinical outcomes.
3.3.1. AdaBoost Classifier
The Adaptive Boosting (AdaBoost) algorithm is a boosting-based ensemble method that combines multiple weak classifiers to build a robust and accurate model [53]. The operation of AdaBoost is based on iteratively assigning weights to the observations in the training set [54]. At each iteration, the weighting of those instances misclassified by the previous classifier is increased, forcing the next classifier to focus on the errors made [55]. The contribution of each classifier to the final ensemble is determined by a weighting coefficient inversely proportional to its error rate, ensuring a greater influence of the more accurate classifiers on the final decision [53].
In the present study, the implementation of AdaBoostClassifier (from the sklearn.ensemble library) improved the detection of relevant clinical patterns by more effectively differentiating between patients at low and high risk for cardiovascular adverse events. This algorithm proved to be particularly effective in identifying nonlinear relationships and synergies between biomedical variables (biomarkers, clinical history, vital signs), even in the presence of noisy or partially collinear data.
In addition, the adaptive nature of AdaBoost offers greater resistance to overfitting compared to more complex models, mainly when used with simple base classifiers, such as decision stumps. This property is particularly relevant in clinical settings, where generalization of the model to new patients is critical to the practical utility of the medical decision support system.
Where are base estimators (commonly weak regressors such as decision trees), and represents their weighting coefficients.
3.3.2. Gradient Boosting Classifier
The Gradient Boosting Classifier algorithm is a supervised learning method based on boosting, which builds an additive model by progressively minimizing a loss function using downward gradients in the functional space [56]. Its architecture is based on the sequential combination of weak base classifiers, where each new estimator is adjusted to correct the residual errors of the previous models, thus iteratively improving the accuracy of the model [57].
In the context of acute myocardial infarction complication prediction, Gradient Boosting Classifier optimizes the identification of complex and nonlinear clinical patterns, facilitating better risk stratification of patients [58]. Its ability to handle large volumes of heterogeneous data and its resistance to overfitting make it a robust tool for clinical decision making based on advanced predictive models [59].
Where is the learning coefficient obtained by minimizing:
Unlike AdaBoost, which adjusts sample weights according to their error, Gradient Boosting builds a sequential model by fitting each new estimator to the residual gradients. This formulation allows flexibility in using various loss functions, such as mean square error for regression or classification.
3.3.3. Random Forest Classifier
The Random Forest Classifier algorithm, an ensemble method based on decision trees that combines multiple classifiers built on random subsets of data and features, was used to improve accuracy, reduce variance, and minimize overfitting [60]. Its implementation, using the sklearn.ensemble library, included hyperparameter adjustment by grid search and stratified cross-validation.
In the context of predicting complications of acute myocardial infarction, Random Forest allowed modeling nonlinear and complex relationships between clinical variables and biomarkers, with high robustness to outliers and good tolerance to high dimensionality. In addition, it provided measures of variable importance that facilitated the clinical interpretation of the model, contributing to its applicability in medical decision support environments.
where are individual regression trees trained with bootstrap sampling.
3.3.4. Extra Trees Classifier
The Extra Trees Classifier (Extremely Randomized Trees) is a variant of the Random Forest algorithm that incorporates a higher degree of randomization during the construction of decision trees [61]. Unlike Random Forest, which selects optimal splitting thresholds according to impurity criteria, Extra Trees assigns these thresholds randomly within the subset of features selected for each node [62]. This strategy increases the diversity among the ensemble trees, which contributes to a further reduction in model variance and improves its stability against noise and overfitting.
In the present study, ExtraTreesClassifier from the sklearn.ensemble library was used as part of the set of models evaluated for the prediction of complications of acute myocardial infarction. Its highly randomized architecture allowed us to capture nonlinear interactions and complex relationships between clinical variables and biomarkers, even in the presence of collinearity or skewed distributions.
This approach was particularly effective in high-dimensional contexts, showing a superior ability to handle large volumes of data without compromising computational performance. Furthermore, like other tree-based models, Extra Trees provides measures of variable significance that facilitate clinical interpretation and the identification of key predictors in cardiovascular risk stratification.
the trees represents the prediction of the tree . This strategy introduces a higher bias compared to RF, but reduces the variance and correlation between trees, improving the generalization capability.
3.3.5. Bagging Classifier
The Bagging Classifier algorithm is an ensemble method that improves the stability and accuracy of base models by reducing variance through training on multiple subsets of data generated by sampling with replacement (bootstrap) [63]. Each base classifier is independently fit on a different sample, and the final ensemble prediction is obtained by majority voting, thus mitigating overfitting and improving model generalization [64].
In the context of predicting complications of acute myocardial infarction, Bagging Classifier optimizes the model's ability to handle clinical data with high variability, allowing better identification of risk factors and greater robustness in the classification of patients according to their clinical evolution:
where each is a base model trained on a random subset of the data. The relationship explains the impact of Bagging on variance reduction:
where the decrease in variance is greater when the models are less correlated. Bagging improves model stability and generalizability, reducing overfitting without significantly increasing bias.
3.3.6. Performance Metrics
Model performance is evaluated through performance metrics derived from the confusion matrix, a fundamental tool for assessing classification models [65]. The confusion matrix summarizes the prediction results by comparing the actual labels with the predictions generated by the model, providing detailed insight into its classification capability [66].
Since no classification system is completely infallible, prediction errors can manifest themselves in two primary forms: false positives and false negatives. To understand these errors, four key metrics are defined within the confusion matrix:
True Positives (TP): cases in which the model correctly predicts an observation belonging to the positive class.
False Negatives (FN): Situations in which the observation belongs to the positive class, but the model misclassifies it as negative.
False Positives (FP): Occur when an observation of the negative class is incorrectly classified as positive.
True Negatives (TN): Cases in which the model correctly predicts an observation as belonging to the negative class.
From these values, fundamental performance metrics can be calculated, such as:
Accuracy: Proportion of correct predictions over total observations, i.e., a high accuracy indicates that the model correctly classifies most cases, both emergencies and non-emergencies. However, in medical problems where false negatives can have critical consequences, accuracy alone is not sufficient to assess model performance, as it can be high even if the model fails to detect emergencies accurately. It is defined as:
Accuracy: measures the accuracy of positive predictions, reducing the impact of false positives, i.e., if the model classifies non-emergency cases as emergency cases, it creates a significant problem for the hospital ED. Real emergency cases will not receive enough medical service. But it is not a problem for some misclassification numbers; Further diagnosis shows that they are not emergencies. Therefore, it should also be considered that false positives are not so high.
Sensitivity (Recall): To evaluate the performance of the model in identifying observations belonging to the positive class, it is essential to analyze its ability to detect critical cases correctly. Suppose a patient has severe heart failure, which constitutes a medical emergency. Upon arrival at the hospital, the model is used to determine whether the patient's condition is an emergency. If the model misclassifies the patient as a non-emergent case, a false negative (FN) is generated, which can seriously compromise the patient's life. Since this type of error has critical consequences, the most relevant parameter for model evaluation is the false negative rate. Consequently, the primary metric used to measure its performance is the Recall, since it reflects the model's ability to identify positive cases and minimize false negatives correctly.
Specificity: Indicates the model's ability to identify observations in the negative class correctly, i.e., patients who do not present a medical emergency. In a diagnosis of severe heart failure, a true negative (TN) occurs when the model correctly classifies a patient with no critical condition. At the same time, a false positive (FP) implies a misclassification as an emergency, generating unnecessary interventions and inefficient use of resources. It is defined as the proportion of true negatives over the total number of negative cases. It is essential to evaluate the model's accuracy in excluding emergencies.
F1-score: Harmonic mean between precision and sensitivity, useful in unbalanced data sets, i.e., F1-score (Eq. (10)) is used to have the effects of the two metrics mentioned above in a formula, and facilitates the comparison of the performance of different models. It is worth noting that in the formula, Recall and Precision have the same effect on the F1 score. However, it is mentioned that the Recall score is more important than Precision, and for final evaluation, Recall should be considered the most critical metric.
Evaluating the performance of classification models is crucial for optimizing their predictive ability, which involves calibrating hyperparameters and refining data preprocessing. In addition to traditional metrics, Cohen's Kappa coefficient is used as a statistical measure to quantify the agreement between two classifiers by adjusting the observed agreement based on the expected match by chance [67].
Unlike standard precision, which measures only the proportion of hits, the Kappa coefficient provides a more rigorous assessment by correcting for random agreement, thus allowing for a more robust interpretation of model reliability [68]. Mathematically,k is defined from the proportion of observed agreement and the proportion of expected agreement by chance . The value of is obtained by dividing the sum of the frequencies of the main diagonal of the confusion matrix by the total observations, while is calculated from the marginal probabilities of each category. Its mathematical formulation is expressed as:
The interpretation ofk follows the scale proposed by Landis and Koch (1977): values of k≤ 0.20 indicate poor agreement, 0.21≤k≤ 0.40 fair, 0.41≤k≤ 0.60 moderate, 0.61≤k≤ 0.80 good, and 0.81≤k≤ 1.00 very good. Values close to 1 reflect high agreement between raters, while values close to 0 suggest that the model does not overcome chance. This metric is beneficial for assessing the consistency of machine learning models and validating classification systems in environments with ambiguous or unbalanced data, providing a robust measure of reliability in classification tasks.
For model comparison, the present study used a robust nonparametric approach for the comparison of multiple supervised classification models, based on Friedman's test and Nemenyi's post-hoc test.
3.3.7. Evaluation of Model Stability
The stability of a classification model is a fundamental criterion for its application in the diagnosis of critical diseases, such as myocardial infarction [69]. To assess its stability and mitigate the risk of overfitting, cross-validation is employed and both the mean performance and standard deviation of the [70] are calculated.
N-fold cross-validation segments the dataset into N subsets, using in each iteration one of them as a test set and the remaining ones for training the model [71]. This process is repeated N times, storing the performance obtained in each cycle. In the evaluation of model stability using N-fold cross-validation, two fundamental metrics are employed: the average performance and the standard deviation of the performance [72]. These metrics allow quantification of model stability and generalizability, minimizing the risk of overfitting. In the context of myocardial infarction diagnosis, this approach ensures that the model can correctly identify patients with acute cardiac events in a consistent manner, reducing the risk of misdiagnosis and improving reliability in its clinical implementation.
3.3.8. ROC Curve
In the healthcare context, the Receiver Operating Characteristic (ROC) curve is a fundamental tool for evaluating the performance of binary classification models in the detection of critical diseases, such as myocardial infarction [73]. The ROC curve illustrates the model's ability to differentiate between two classes: presence or absence of the medical condition of interest [74]. Each point on the ROC curve represents a different threshold for classification. An ideal model will approach the upper left corner of the graph, indicating a high discriminatory ability [75]. In clinical practice, the ROC curve is used to determine the optimal threshold of a diagnostic model, minimizing both false negatives (risk of not detecting a patient with infarction) and false positives (possible unnecessary hospitalizations). A model with a high sensitivity is crucial in medical settings, as an incorrect classification of an infarct patient as healthy (false negative) can have fatal consequences.
Therefore, the ROC curve and AUC will allow us to select the best predictive model based on the balance between sensitivity and specificity, optimizing decision making in clinical settings. The area under the ROC curve (AUC) is defined as:
Where: T is the classifier decision threshold, TPR(T) is the true positive rate as a function of the threshold, FPR(T) is the false positive rate as a function of the threshold, ie:
The area under the curve shows the performance of the binary classifier regardless of the true instance distribution. In other words, it calculates the probability of two classes.
4. Results and Discussion
The ensemble-based machine learning models applied to the clinical dataset provided evidence of differential performance in the classification of the risk of acute myocardial infarction. The implementation of multiple algorithms on a large and heterogeneous population base facilitated the comparative evaluation of their discriminative ability against complex morbidity patterns. In this context, a clear superiority of machine learning ensemble methods was observed, which demonstrated greater consistency in the identification of positive cases, as well as adequate sensitivity to the presence of diverse clinical and contextual variables. These results highlight the value of the ensemble approach in contexts of high epidemiological variability, while establishing a technical framework for model prioritization in diagnostic support tasks in preventive cardiology.
In order to ensure the integrity, consistency and analytical robustness of the dataset, a systematic preprocessing protocol was applied to mitigate the effects of missing values, atypicality, structural redundancy and class imbalance, all of which are critical factors in clinical studies of AMI prediction. In a first stage, imputation strategies differentiated according to the type of variable were implemented. For numerical variables, the median was used as a robust estimator, given its resilience to extreme values and asymmetric distributions. For categorical variables, imputation by mode was applied, preserving the semantic coherence of the categories and maintaining the stability of the marginal distributions. Subsequently, duplicate records were identified and eliminated in order to reduce structural redundancies and minimize the risk of overfitting, ensuring that the machine learning algorithms were not biased by the replication of specific patterns. Coding of categorical variables was performed by one-hot encoding, systematically excluding the first category to avoid collinearity per fecta. The StandardScaler standardization technique was then applied, transforming the numerical variables to present a zero mean and unit standard deviation. This transformation was essential to ensure the correct convergence of models sensitive to the scale of the variables.
Since the positive event class (IAM) was substantially underrepresented compared to the negative class, the problem of class imbalance was explicitly addressed using the Synthetic Minority Oversampling Technique (SMOTE) [76]. This method generates synthetic examples from the interpolation of the nearest neighbors of the minority class, allowing for the realistic expansion of the representation space of infarct patients [77]. The implementation of SMOTE was performed after partitioning the dataset in training and validation, in order to avoid information leakage and preserve the validity of the cross-evaluation process.
Consequently, a comparative evaluation of five ensemble algorithms commonly used in supervised machine learning was performed: AdaBoost, Gradient Boosting, Random Forest, Extra Trees, and Bagging [78]. These models were selected because of their ability to optimize predictive accuracy by combining classifiers, thus reducing both bias and variance, critical aspects in complex clinical contexts such as the prediction of acute myocardial infarction.
The performance of each model was quantified using widely accepted clinical and computational classification metrics. Overall accuracy was used as an initial measure of performance, although its interpretation in isolation can be misleading in contexts with class imbalance [79]. Therefore, additional metrics were incorporated that capture different aspects of predictive performance. The F1-score, calculated as the harmonic mean between precision and sensitivity, allowed assessment of the balance between type I and type II errors. Accuracy (precision) and sensitivity (recall) were reported as complementary metrics to examine the ability of the model to correctly identify true positive cases and minimize false positives, respectively.
To assess the adjusted agreement between model predictions and actual values, Cohen's Kappa coefficient was estimated, which adjusts for the expected agreement by chance [80]. Values above 0.80 were considered indicative of a near-perfect level of agreement, according to criteria established in the epidemiological literature [81]. Additionally, the area under the ROC curve (AUC) was calculated, which measures the discriminative capacity of the model to differentiate between cases and controls over multiple decision thresholds [82].
Table 1 shows the results obtained for each model, accompanied by a critical analysis that addresses their relative performance in terms of accuracy, robustness and generalizability.
As can be seen in Table 1, the performance of the ensemble models varies substantially according to the metric evaluated. The accuracy metric, defined as the proportion of correct predictions over total observations, reached its highest values in the Bagging (0.936) and Extra Trees (0.916) models, in contrast to AdaBoost (0.646), which showed the lowest performance. However, since the accuracy metric can be misleading in settings with unbalanced classes, as is common in clinical cohorts with low prevalence of AMI, its interpretation should be performed with caution [83].
In this context, the F1 Score, understood as the harmonic mean between accuracy (precision) and sensitivity (recall), is a key metric to assess the performance of models in unbalanced classification tasks, such as the detection of acute myocardial infarction (AMI) events [84]. This metric provides a robust measure of the model's ability to balance the correct identification of positive events (sensitivity) with the minimization of false positives (accuracy).
According to the results obtained, the Bagging model not only achieves the highest overall accuracy, but also the highest F1 Score (0.936), which evidences its efficacy in the comprehensive classification of AMI events. Similarly, Extra Trees exhibits an F1 Score of 0.916, indicating a solid and balanced performance in terms of detection and specificity. In contrast, the AdaBoost model, with an F1 Score of 0.646, reflects suboptimal performance, possibly associated with an imbalance between its detection capability (recall) and the reliability of its positive predictions (accuracy) [85]. This behavior suggests a higher incidence of type I (false positives) or type II (false negatives) errors, compromising its clinical utility in scenarios where both early detection and diagnostic accuracy are critical.
Accuracy, which represents the proportion of true positives over all cases predicted as positive, acquires particular clinical relevance in the prediction of cardiovascular events, given that low accuracy translates into a high number of false positives, which could induce unnecessary invasive or costly diagnostic procedures [86]. The Bagging model achieved an accuracy of 0.941, indicating very high reliability in its positive predictions. In contrast, AdaBoost showed a considerably lower accuracy (0.647), which in clinical settings could increase the rate of overintervention.
Sensitivity or recall indicates the proportion of true positives correctly identified by the model. From an epidemiological and clinical perspective, this metric is critical, as low recall may imply a high false-negative rate, which is patients with AMI who are missed, with potentially fatal consequences [87]. Bagging and Extra Trees maintained a sensitivity above 93%, suggesting high effectiveness in capturing individuals at risk. This property makes them ideal candidates for implementation in clinical decision support systems.
Bagging (0.873) and Extra Trees (0.833) showed excellent adjusted concordance, confirming the statistical robustness of their predictions. In contrast, AdaBoost (0.292) and Gradient Boosting (0.417) evidenced low to moderate agreement, suggesting that much of their accuracy could be attributed to chance, which compromises their clinical applicability.
To evaluate the multiscale discriminative ability of the machine learning models, ROC curves were constructed for each of the ensemble algorithms implemented [74]. This graphical representation allows the performance of the classifiers to be analyzed as a function of their true positive rate (TPR) versus false positive rate (FPR) over different thresholds, thus providing a global measure using the AUC, especially useful in scenarios with unbalanced classes, such as acute myocardial infarction (AMI) [88].
Figure 1.
Comparative ROC curves of Bagging models for binary classification.
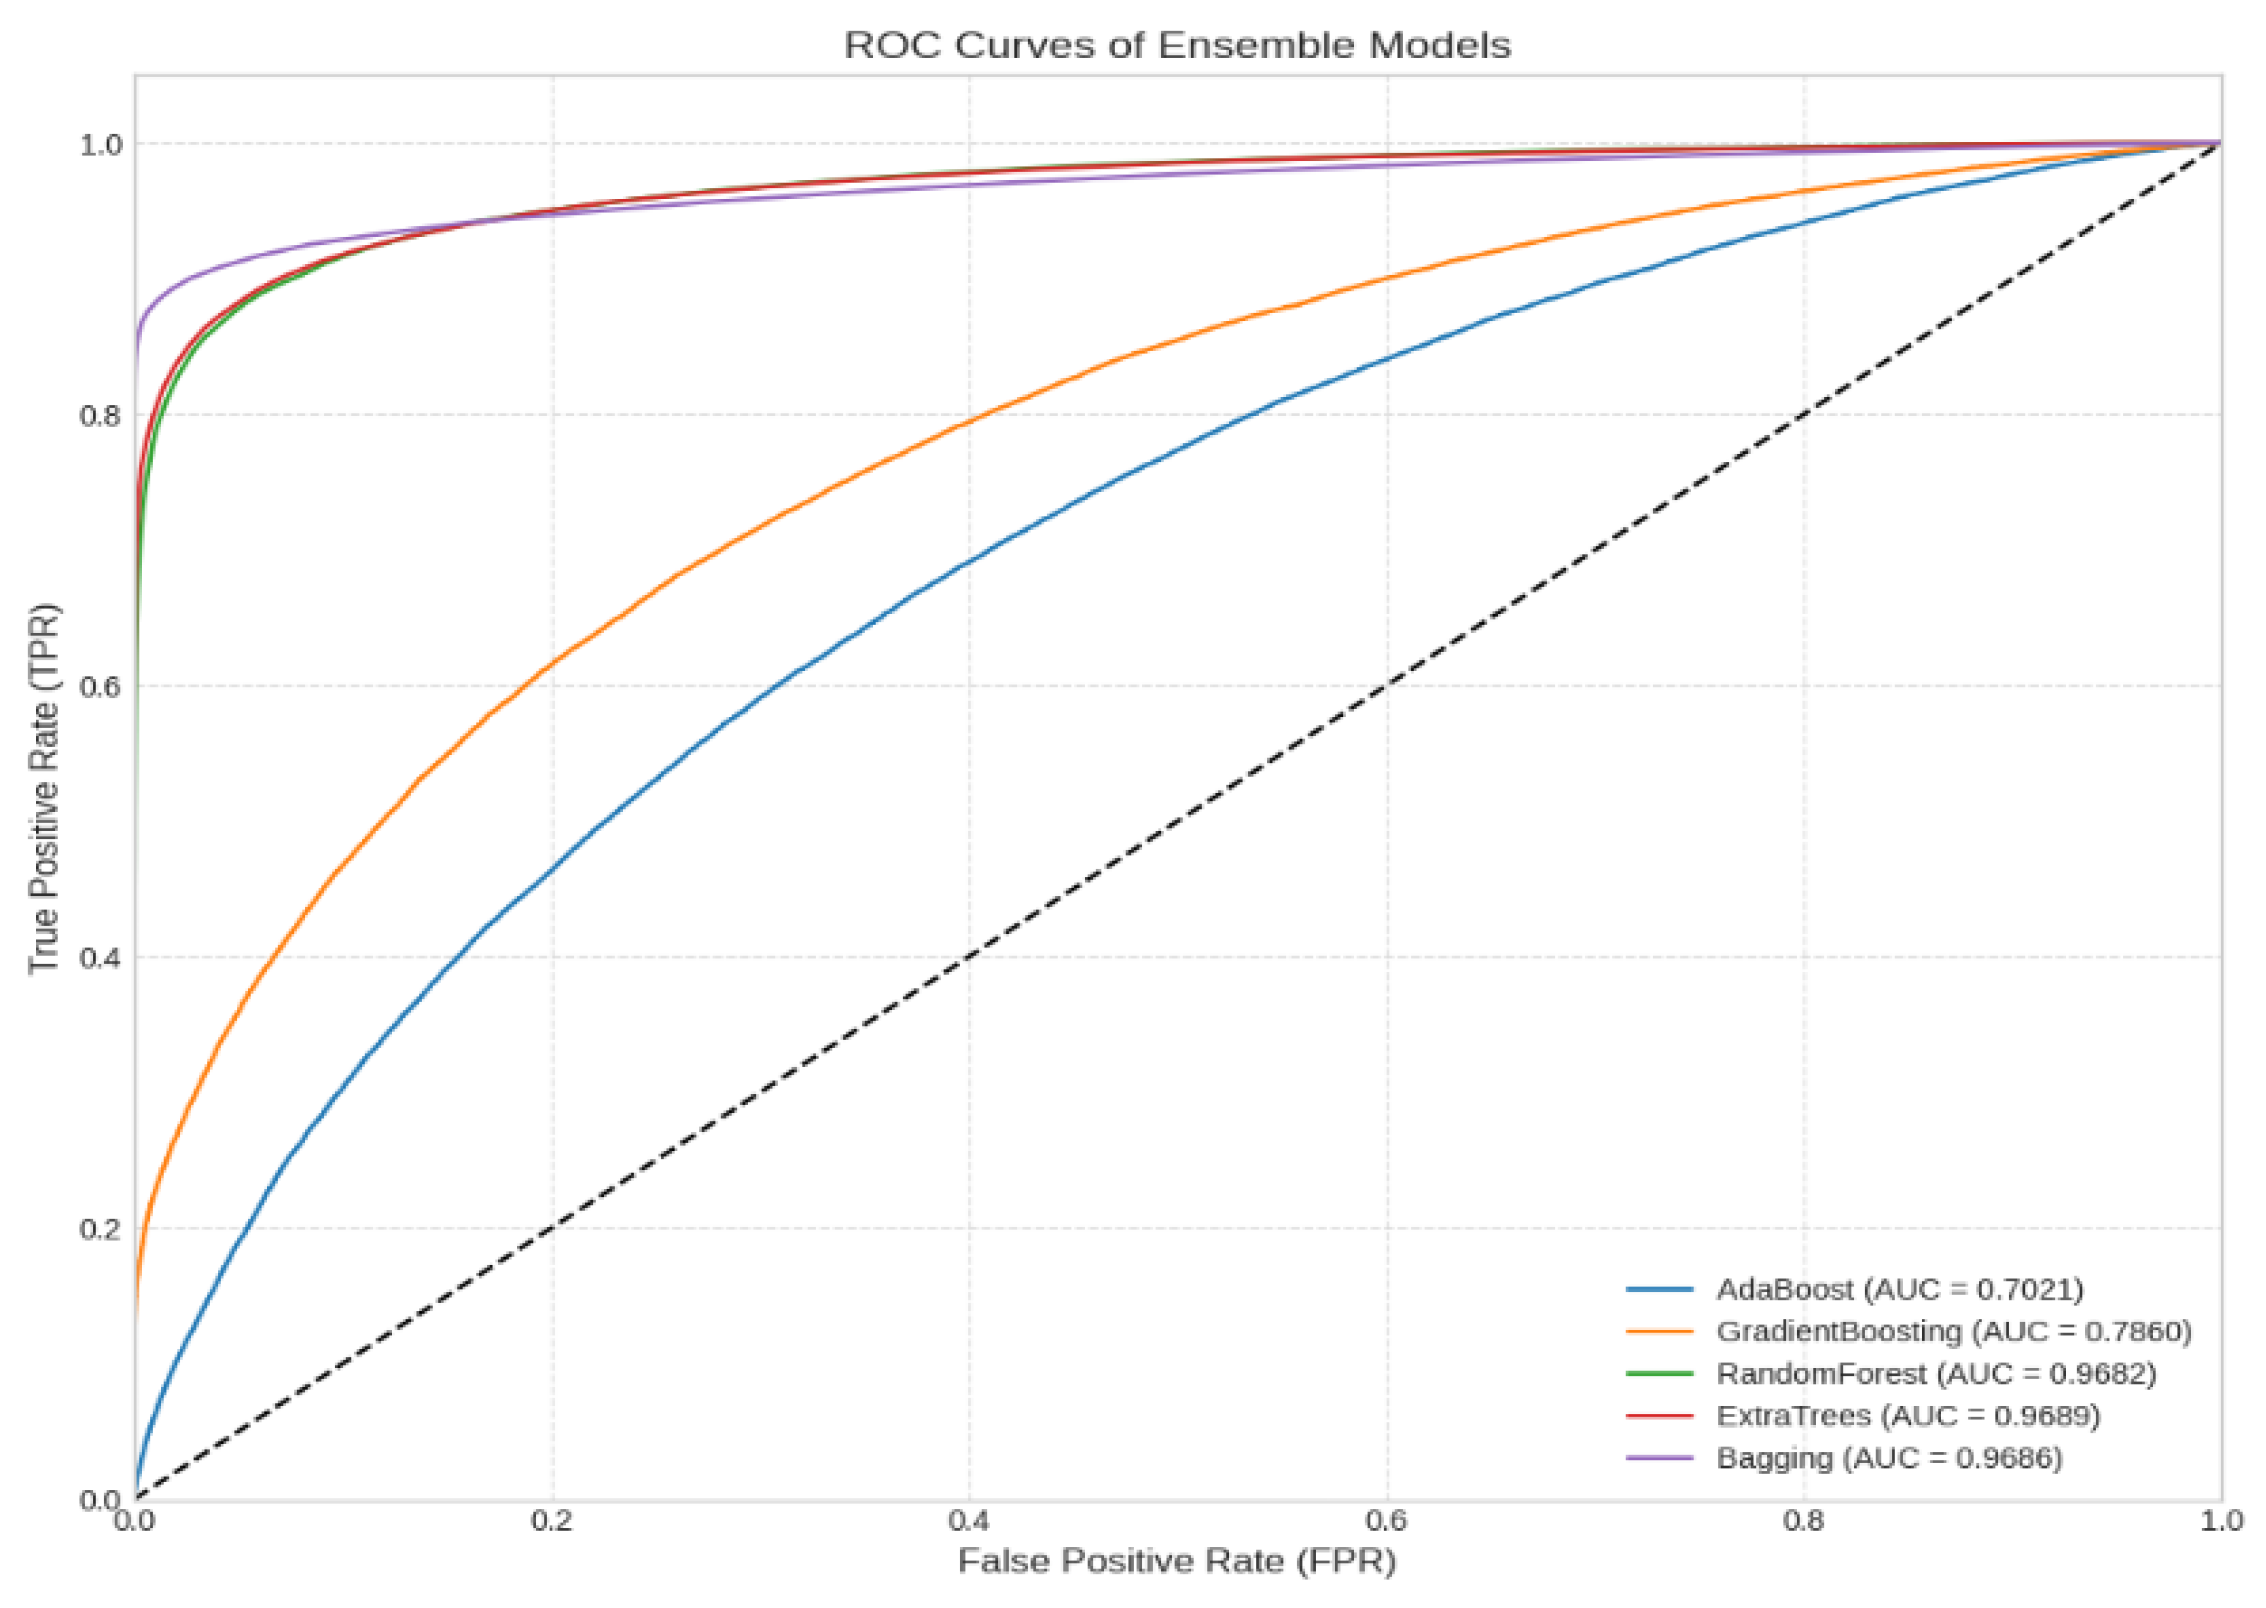
The Bagging (AUC = 0.9686) and Extra Trees (AUC = 0.9689) models demonstrated outstanding discriminative ability, with ROC curves close to the upper left vertex of the graph (TPR≈ 1; FPR≈ 0), indicating a low probability of error in both false positives and negatives. This behavior is characteristic of models with low variance and high stability, particularly valuable in clinical settings where the cost of diagnostic error is asymmetric [58]. Likewise, Random Forest (AUC = 0.9682) presented a similar performance, with marginal differences with respect to the previous ones, confirming its robustness as a reliable classifier in predictive medicine.
In contrast, Gradient Boosting (AUC = 0.7860) showed lower convexity in the curve, suggesting reduced sensitivity at certain decision thresholds, possibly attributable to overfitting or sensitivity to outliers [89]. AdaBoost (AUC = 0.7021), on the other hand, presented the lowest discriminative capacity, with a curve close to the non-discrimination diagonal, which limits its usefulness in clinical practice.
These findings are consistently reflected in the results summarized in Table 2, which details the statistical comparison of the five ensemble learning models evaluated.
Table 2 presents the results of the comparative evaluation of the ensemble learning models applied to the data set of interest. The models were evaluated using three complementary approaches: average precision with its standard deviation (SD), statistical comparison of average ranks using Friedman's test with post-hoc adjustments (Nemenyi's test), and Cohen's Kappa index, which quantifies the agreement with the ground truth correcting for the effect of chance. Cohen's Kappa coefficient, which measures the agreement between model predictions and the actual classification adjusted for expected agreement by chance, provides critical insight into the reliability of the model. This coefficient is especially valuable in the presence of class imbalances, as accuracy may be inflated in these cases [90].
Bagging achieved the highest accuracy (93.36 %± 0.22) and obtained the lowest average rank (1.0), evidencing its consistently superior performance across all validation partitions. This model, together with ExtraTrees (90.76 %± 0.18, rank 2.0) belongs to statistical group A, indicating that their performance differences are not statistically significant at significance level α = 0.05. In terms of reliability, both models present high Kappa indices (0.87 and 0.83 respectively), corroborating that their high performance is not the product of chance, but of genuine agreement with the actual classification.
For its part, Random Forest showed an average accuracy similar to ExtraTrees (90.41 %± 0.18), however, its average rank (3.0) and belonging to statistical group B suggest that, statistically, its performance is lower than that of Bagging and ExtraTrees in some test subsets. Nevertheless, its Cohen's Kappa (0.83) confirms a high degree of true agreement, aligning with its observed accuracy.
In contrast, the evaluated boosting algorithms, Gradient Boosting (70.72 %± 0.30) and AdaBoost (65.15 %± 0.29), present notably lower accuracies and occupy the highest average ranks (4.0 and 5.0, respectively). The post-hoc test groups Gradient Boosting in group B, while AdaBoost clearly lags behind in group C, indicating a statistically significant difference with respect to the higher performing models. This inferiority in accuracy is consistently reflected in the Kappa indices (0.42 for Gradient Boosting and 0.29 for AdaBoost), values that denote a barely moderate or even poor level of agreement with the reference classification, suggesting a high risk of overfitting or underfitting, possibly attributable to the sensitivity of these algorithms to suboptimal parameter settings or to the nature of the data employed.
These findings reinforce the relevance of applying nonparametric multiple comparison statistical tests, in conjunction with robust matching metrics such as Cohen's Kappa[68] , to obtain reliable conclusions about the superiority of machine learning models. In particular, the combination of Bagging and ExtraTrees stands out as the most robust and generalizable option for the addressed problem, while boosting-based methods should be carefully reconsidered or adjusted before implementation in production scenarios.
From a machine learning perspective applied to medicine, model selection should not be based exclusively on global metrics, but also on its behavior under real clinical conditions, its interpretability, and stability in the face of data variability[44,91]. In this regard, Random Forest, Extra Trees and Bagging stand out as preferred choices for clinical decision support systems, combining high AUC, low FPR and high TPR. This balance minimizes both the risk of overintervention (false positives) and diagnostic omission (false negatives), optimizing the screening of AMI patients [92].
Our findings align with those reported by Zheng et al. [93] , who integrated the hybrid SMOTETomek technique with stacking-type assembly models, achieving outstanding metrics (AUC = 0.9863), validating the positive impact of combining data balancing techniques with assembly architectures. However, divergences are observed with the study of Kasim et al. [94], who reported that ML models with feature selection outperformed the TIMI scale (AUC: 0.60-0.93 vs. 0.81), indeed, the best performing model was a linear SVM with specific feature selection (AUC: 0.93; 95%CI: 0.89-0.98), outperforming even the best ensemble model (AUC: 0.91; 95%CI: 0.87-0.96), the robustness of that superiority is difficult to generalize because their evaluation was limited exclusively to discrimination metrics. In particular, the study omitted concordance analyses such as Cohen's Kappa index, which would have made it possible to assess the stability of the predictions in the presence of class imbalances, and also failed to apply the nonparametric Friedman test with the Nemenyi post-hoc adjustment, an indispensable tool to rule out that the differences observed are due to variability between cross-validation partitions. In the absence of these contrasts, the AUC confidence intervals, although narrow, are not sufficient to affirm that SVM statistically significantly outperforms the ensemble models, nor do they guarantee that such performance will be maintained in heterogeneous clinical scenarios. Our research remedies these limitations by systematically integrating concordance metrics and multiclass comparative tests, which provides a more robust evidence framework and ultimately strengthens confidence in the operational superiority of ensembles for myocardial risk stratification.
Finally, our results support the convergence of three lines of quantitative evidence, ROC curves with superior AUCs, statistical significance of the Friedman test with post-hoc Nemenyi adjustment, and Cohen's Kappa values consistently greater than 0.80, legitimizes the robustness of the Bagging and extra Tree models and ratifies their superiority to the other classifiers in predicting cardiovascular events. This statistical robustness, however, does not exempt us from considering the temporal stability of the performance, the computational cost and the possibility of integrating the algorithm into hospital information systems, as well as its transparency to support auditable medical decisions. Therefore, clinical adoption should be based on an explicit balance between accuracy, methodological robustness and operational suitability, ensuring that the predictive gain translates into tangible benefits for cardiology practice.
5. Conclusions
The present study provides conclusive evidence on the relative superiority of specific ensemble models in the classification of complex clinical events, particularly in the context of automated diagnosis of acute myocardial infarction. The findings reflect that the performance of algorithms depends not only on their computational structure, but also on their ability to adapt to the inherent heterogeneity of clinical data. Models based on aggregation and randomization demonstrated remarkable stability, robustness to noise, and ability to capture nonlinear relationships between variables, consolidating themselves as reliable tools for eventual integration into medical decision support systems.
In contrast, relevant limitations were identified in models more sensitive to class imbalance and structural variability of the data, highlighting the importance of contextualized algorithmic selection. These results suggest that the effectiveness of a classification model in medical settings cannot be evaluated solely on the basis of its overall performance, but must consider its behavior under realistic clinical conditions, where interpretability, diagnostic consistency and generalizability are critical factors.
Based on the above, the use of robust and stable models in highly complex clinical settings is recommended, as well as the development of methodological strategies that include external validations, explanatory mechanisms and tests in independent cohorts. Future work should focus on the integration of these models into real clinical workflows, as well as on the analysis of their impact on medical practice, decision making and health outcomes.
Based on quantitative and statistical evidence, it is recommended to prioritize Bagging or ExtraTrees as reference models for similar applications, given their excellent compromise between accuracy, inter-partition stability and high agreement with real labels. The complementary application of agreement indices such as Kappa, together with hypothesis testing on average ranks, provides a solid basis for objective model selection in classification contexts with multiple candidate algorithms.
Funding
This research did not receive any specific grant from funding agencies in the public, commercial, or not-for-profit sectors.
Institutional Review Board Statement
Not applicable.
Informed Consent Statement
Not applicable.
Data Availability Statement
No new data were created or analyzed in this study. Data sharing is not applicable to this article.
Conflicts of Interest
The authors declare that they have no known competing financial interests or personal relationships that could have appeared to influence the work reported in this paper.
NOTE
Artificial intelligence platforms have been used to improve the writing, but not to generate the article document.
References
- Boudali, I.; Chebaane, S.; Zitouni, Y. A Predictive Approach for Myocardial Infarction Risk Assessment Using Machine Learning and Big Clinical Data. Healthcare Analytics 2024, 5, 100319. [CrossRef]
- Kaptoge, S.; Pennells, L.; De Bacquer, D.; Cooney, M.T.; Kavousi, M.; Stevens, G.; Riley, L.M.; Savin, S.; Khan, T.; Altay, S.; et al. World Health Organization Cardiovascular Disease Risk Charts: Revised Models to Estimate Risk in 21 Global Regions. The Lancet Global Health 2019, 7, e1332–e1345. [CrossRef]
- Mc Namara, K.; Alzubaidi, H.; Jackson, J.K. Cardiovascular Disease as a Leading Cause of Death: How Are Pharmacists Getting Involved? IPRP 2019, Volume 8, 1–11. [CrossRef]
- Kelly, B.B.; Narula, J.; Fuster, V. Recognizing Global Burden of Cardiovascular Disease and Related Chronic Diseases. Mount Sinai Journal of Medicine: A Journal of Translational and Personalized Medicine 2012, 79, 632–640. [CrossRef]
- Nansseu, J.R.; Tankeu, A.T.; Kamtchum-Tatuene, J.; Noubiap, J.J. Fixed-Dose Combination Therapy to Reduce the Growing Burden of Cardiovascular Disease in Low- and Middle-Income Countries: Feasibility and Challenges. The Journal of Clinical Hypertension 2018, 20, 168–173. [CrossRef]
- Janez, A.; Muzurovic, E.; Bogdanski, P.; Czupryniak, L.; Fabryova, L.; Fras, Z.; Guja, C.; Haluzik, M.; Kempler, P.; Lalic, N.; et al. Modern Management of Cardiometabolic Continuum: From Overweight/Obesity to Prediabetes/Type 2 Diabetes Mellitus. Recommendations from the Eastern and Southern Europe Diabetes and Obesity Expert Group. Diabetes Ther 2024, 15, 1865–1892. [CrossRef]
- Jagannathan, R.; Patel, S.A.; Ali, M.K.; Narayan, K.M.V. Global Updates on Cardiovascular Disease Mortality Trends and Attribution of Traditional Risk Factors. Curr Diab Rep 2019, 19, 44. [CrossRef]
- Ibrahim, L.; Mesinovic, M.; Yang, K.-W.; Eid, M.A. Explainable Prediction of Acute Myocardial Infarction Using Machine Learning and Shapley Values. IEEE Access 2020, 8, 210410–210417. [CrossRef]
- Writing Committee:; Smith, S.C.; Collins, A.; Ferrari, R.; Holmes, D.R.; Logstrup, S.; McGhie, D.V.; Ralston, J.; Sacco, R.L.; Stam, H.; et al. Our Time: A Call to Save Preventable Death from Cardiovascular Disease (Heart Disease and Stroke). European Heart Journal 2012, 33, 2910–2916. [CrossRef]
- Gheorghe, A.; Griffiths, U.; Murphy, A.; Legido-Quigley, H.; Lamptey, P.; Perel, P. The Economic Burden of Cardiovascular Disease and Hypertension in Low- and Middle-Income Countries: A Systematic Review. BMC Public Health 2018, 18, 975. [CrossRef]
- Parry, M.; Bjørnnes, A.K.; Nickerson, N.; Lie, I. Family Caregivers and Cardiovascular Disease: An Intersectional Approach to Good Health and Wellbeing. In International Perspectives on Family Caregiving; Stanley, S., Ed.; Emerald Publishing Limited, 2025; pp. 135–157 ISBN 978-1-83549-612-1.
- Laslett, L.J.; Alagona, P.; Clark, B.A.; Drozda, J.P.; Saldivar, F.; Wilson, S.R.; Poe, C.; Hart, M. The Worldwide Environment of Cardiovascular Disease: Prevalence, Diagnosis, Therapy, and Policy Issues. Journal of the American College of Cardiology 2012, 60, S1–S49. [CrossRef]
- Capotosto, L.; Massoni, F.; De Sio, S.; Ricci, S.; Vitarelli, A. Early Diagnosis of Cardiovascular Diseases in Workers: Role of Standard and Advanced Echocardiography. BioMed Research International 2018, 2018, 7354691. [CrossRef]
- Forman, D.; Bulwer, B.E. Cardiovascular Disease: Optimal Approaches to Risk Factor Modification of Diet and Lifestyle. Curr Treat Options Cardio Med 2006, 8, 47–57. [CrossRef]
- Hymowitz, N. Behavioral Approaches to Preventing Heart Disease: Risk Factor Modification. International Journal of Mental Health 1980, 9, 27–69. [CrossRef]
- Ullah, M.; Hamayun, S.; Wahab, A.; Khan, S.U.; Rehman, M.U.; Haq, Z.U.; Rehman, K.U.; Ullah, A.; Mehreen, A.; Awan, U.A.; et al. Smart Technologies Used as Smart Tools in the Management of Cardiovascular Disease and Their Future Perspective. Current Problems in Cardiology 2023, 48, 101922. [CrossRef]
- Thupakula, S.; Nimmala, S.S.R.; Ravula, H.; Chekuri, S.; Padiya, R. Emerging Biomarkers for the Detection of Cardiovascular Diseases. Egypt Heart J 2022, 74, 77. [CrossRef]
- Fathil, M.F.M.; Md Arshad, M.K.; Gopinath, S.C.B.; Hashim, U.; Adzhri, R.; Ayub, R.M.; Ruslinda, A.R.; Nuzaihan M.N., M.; Azman, A.H.; Zaki, M.; et al. Diagnostics on Acute Myocardial Infarction: Cardiac Troponin Biomarkers. Biosensors and Bioelectronics 2015, 70, 209–220. [CrossRef]
- Tiwari, R.P.; Jain, A.; Khan, Z.; Kohli, V.; Bharmal, R.N.; Kartikeyan, S.; Bisen, P.S. Cardiac Troponins I and T: Molecular Markers for Early Diagnosis, Prognosis, and Accurate Triaging of Patients with Acute Myocardial Infarction. Mol Diagn Ther 2012, 16, 371–381. [CrossRef]
- Garg, P.; Morris, P.; Fazlanie, A.L.; Vijayan, S.; Dancso, B.; Dastidar, A.G.; Plein, S.; Mueller, C.; Haaf, P. Cardiac Biomarkers of Acute Coronary Syndrome: From History to High-Sensitivity Cardiac Troponin. Intern Emerg Med 2017, 12, 147–155. [CrossRef]
- Li, Y.; Xu, H.; Chen, S.; Wang, J. Advances in Electrochemical Detection of B-Type Natriuretic Peptide as a Heart Failure Biomarker. International Journal of Electrochemical Science 2024, 19, 100748. [CrossRef]
- Onitilo, A.A.; Engel, J.M.; Stankowski, R.V.; Liang, H.; Berg, R.L.; Doi, S.A.R. High-Sensitivity C-Reactive Protein (Hs-CRP) as a Biomarker for Trastuzumab-Induced Cardiotoxicity in HER2-Positive Early-Stage Breast Cancer: A Pilot Study. Breast Cancer Res Treat 2012, 134, 291–298. [CrossRef]
- Upadhyay, R.K. Emerging Risk Biomarkers in Cardiovascular Diseases and Disorders. Journal of Lipids 2015, 2015, 971453. [CrossRef]
- Georgoulis, M.; Chrysohoou, C.; Georgousopoulou, E.; Damigou, E.; Skoumas, I.; Pitsavos, C.; Panagiotakos, D. Long-Term Prognostic Value of LDL-C, HDL-C, Lp(a) and TG Levels on Cardiovascular Disease Incidence, by Body Weight Status, Dietary Habits and Lipid-Lowering Treatment: The ATTICA Epidemiological Cohort Study (2002–2012). Lipids Health Dis 2022, 21, 141. [CrossRef]
- Sonmez, A.; Yilmaz, M.I.; Saglam, M.; Unal, H.U.; Gok, M.; Cetinkaya, H.; Karaman, M.; Haymana, C.; Eyileten, T.; Oguz, Y.; et al. The Role of Plasma Triglyceride/High-Density Lipoprotein Cholesterol Ratio to Predict Cardiovascular Outcomes in Chronic Kidney Disease. Lipids Health Dis 2015, 14, 29. [CrossRef]
- Djaberi, R.; Beishuizen, E.D.; Pereira, A.M.; Rabelink, T.J.; Smit, J.W.; Tamsma, J.T.; Huisman, M.V.; Jukema, J.W. Non-Invasive Cardiac Imaging Techniques and Vascular Tools for the Assessment of Cardiovascular Disease in Type 2 Diabetes Mellitus. Diabetologia 2008, 51, 1581–1593. [CrossRef]
- Ansari, S.; Farzaneh, N.; Duda, M.; Horan, K.; Andersson, H.B.; Goldberger, Z.D.; Nallamothu, B.K.; Najarian, K. A Review of Automated Methods for Detection of Myocardial Ischemia and Infarction Using Electrocardiogram and Electronic Health Records. IEEE Reviews in Biomedical Engineering 2017, 10, 264–298. [CrossRef]
- Klaeboe, L.G.; Edvardsen, T. Echocardiographic Assessment of Left Ventricular Systolic Function. J Echocardiogr 2019, 17, 10–16. [CrossRef]
- Cheng, K.; Lin, A.; Yuvaraj, J.; Nicholls, S.J.; Wong, D.T.L. Cardiac Computed Tomography Radiomics for the Non-Invasive Assessment of Coronary Inflammation. Cells 2021, 10, 879. [CrossRef]
- Mushtaq, S.; Conte, E.; Pontone, G.; Baggiano, A.; Annoni, A.; Formenti, A.; Mancini, M.E.; Guglielmo, M.; Muscogiuri, G.; Tanzilli, A.; et al. State-of-the-Art-Myocardial Perfusion Stress Testing: Static CT Perfusion. Journal of Cardiovascular Computed Tomography 2020, 14, 294–302. [CrossRef]
- Beller, G.A.; Heede, R.C. SPECT Imaging for Detecting Coronary Artery Disease and Determining Prognosis by Noninvasive Assessment of Myocardial Perfusion and Myocardial Viability. J. of Cardiovasc. Trans. Res. 2011, 4, 416–424. [CrossRef]
- Baghdadi, N.A.; Farghaly Abdelaliem, S.M.; Malki, A.; Gad, I.; Ewis, A.; Atlam, E. Advanced Machine Learning Techniques for Cardiovascular Disease Early Detection and Diagnosis. J Big Data 2023, 10, 144. [CrossRef]
- Boudali, I.; Chebaane, S.; Zitouni, Y. A Predictive Approach for Myocardial Infarction Risk Assessment Using Machine Learning and Big Clinical Data. Healthcare Analytics 2024, 5, 100319. [CrossRef]
- Dimopoulos, A.C.; Nikolaidou, M.; Caballero, F.F.; Engchuan, W.; Sanchez-Niubo, A.; Arndt, H.; Ayuso-Mateos, J.L.; Haro, J.M.; Chatterji, S.; Georgousopoulou, E.N.; et al. Machine Learning Methodologies versus Cardiovascular Risk Scores, in Predicting Disease Risk. BMC Med Res Methodol 2018, 18, 179. [CrossRef]
- Saikumar, K.; Rajesh, V. A Machine Intelligence Technique for Predicting Cardiovascular Disease (CVD) Using Radiology Dataset. Int J Syst Assur Eng Manag 2024, 15, 135–151. [CrossRef]
- Hakim, Md.A.; Jahan, N.; Zerin, Z.A.; Farha, A.B. Performance Evaluation and Comparison of Ensemble Based Bagging and Boosting Machine Learning Methods for Automated Early Prediction of Myocardial Infarction. In Proceedings of the 2021 12th International Conference on Computing Communication and Networking Technologies (ICCCNT); July 2021; pp. 1–6.
- Rai, H.M.; Chatterjee, K. Hybrid CNN-LSTM Deep Learning Model and Ensemble Technique for Automatic Detection of Myocardial Infarction Using Big ECG Data. Appl Intell 2022, 52, 5366–5384. [CrossRef]
- Bian, K.; Priyadarshi, R. Machine Learning Optimization Techniques: A Survey, Classification, Challenges, and Future Research Issues. Arch Computat Methods Eng 2024, 31, 4209–4233. [CrossRef]
- Aliferis, C.; Simon, G. Overfitting, Underfitting and General Model Overconfidence and Under-Performance Pitfalls and Best Practices in Machine Learning and AI. In Artificial Intelligence and Machine Learning in Health Care and Medical Sciences: Best Practices and Pitfalls; Simon, G.J., Aliferis, C., Eds.; Springer International Publishing: Cham, 2024; pp. 477–524 ISBN 978-3-031-39355-6.
- Cai, Y.-Q.; Gong, D.-X.; Tang, L.-Y.; Cai, Y.; Li, H.-J.; Jing, T.-C.; Gong, M.; Hu, W.; Zhang, Z.-W.; Zhang, X.; et al. Pitfalls in Developing Machine Learning Models for Predicting Cardiovascular Diseases: Challenge and Solutions. Journal of Medical Internet Research 2024, 26, e47645. [CrossRef]
- Ribeiro, M.H.D.M.; dos Santos Coelho, L. Ensemble Approach Based on Bagging, Boosting and Stacking for Short-Term Prediction in Agribusiness Time Series. Applied Soft Computing 2020, 86, 105837. [CrossRef]
- Krittanawong, C.; Virk, H.U.H.; Bangalore, S.; Wang, Z.; Johnson, K.W.; Pinotti, R.; Zhang, H.; Kaplin, S.; Narasimhan, B.; Kitai, T.; et al. Machine Learning Prediction in Cardiovascular Diseases: A Meta-Analysis. Sci Rep 2020, 10, 16057. [CrossRef]
- Liu, R.; Wang, M.; Zheng, T.; Zhang, R.; Li, N.; Chen, Z.; Yan, H.; Shi, Q. An Artificial Intelligence-Based Risk Prediction Model of Myocardial Infarction. BMC Bioinformatics 2022, 23, 217. [CrossRef]
- Wang, S.; Li, J.; Sun, L.; Cai, J.; Wang, S.; Zeng, L.; Sun, S. Application of Machine Learning to Predict the Occurrence of Arrhythmia after Acute Myocardial Infarction. BMC Med Inform Decis Mak 2021, 21, 301. [CrossRef]
- Sharma, L.D.; Sunkaria, R.K. Inferior Myocardial Infarction Detection Using Stationary Wavelet Transform and Machine Learning Approach. SIViP 2018, 12, 199–206. [CrossRef]
- Oliveira, M.; Seringa, J.; Pinto, F.J.; Henriques, R.; Magalhães, T. Machine Learning Prediction of Mortality in Acute Myocardial Infarction. BMC Med Inform Decis Mak 2023, 23, 70. [CrossRef]
- Li, X.; Shang, C.; Xu, C.; Wang, Y.; Xu, J.; Zhou, Q. Development and Comparison of Machine Learning-Based Models for Predicting Heart Failure after Acute Myocardial Infarction. BMC Med Inform Decis Mak 2023, 23, 165. [CrossRef]
- Cho, S.M.; Austin, P.C.; Ross, H.J.; Abdel-Qadir, H.; Chicco, D.; Tomlinson, G.; Taheri, C.; Foroutan, F.; Lawler, P.R.; Billia, F.; et al. Machine Learning Compared With Conventional Statistical Models for Predicting Myocardial Infarction Readmission and Mortality: A Systematic Review. Canadian Journal of Cardiology 2021, 37, 1207–1214. [CrossRef]
- Barker, J.; Li, X.; Khavandi, S.; Koeckerling, D.; Mavilakandy, A.; Pepper, C.; Bountziouka, V.; Chen, L.; Kotb, A.; Antoun, I.; et al. Machine Learning in Sudden Cardiac Death Risk Prediction: A Systematic Review. EP Europace 2022, 24, 1777–1787. [CrossRef]
- Chellappan, D.; Rajaguru, H. Generalizability of Machine Learning Models for Diabetes Detection a Study with Nordic Islet Transplant and PIMA Datasets. Sci Rep 2025, 15, 4479. [CrossRef]
- Sun, Y.; Pang, S.; Zhao, Z.; Zhang, Y. Interpretable SHAP Model Combining Meta-Learning and Vision Transformer for Lithology Classification Using Limited and Unbalanced Drilling Data in Well Logging. Nat Resour Res 2024, 33, 2545–2565. [CrossRef]
- Rana, N.; Sharma, K.; Sharma, A. Diagnostic Strategies Using AI and ML in Cardiovascular Diseases: Challenges and Future Perspectives. In Deep Learning and Computer Vision: Models and Biomedical Applications: Volume 1; Dulhare, U.N., Houssein, E.H., Eds.; Springer Nature: Singapore, 2025; pp. 135–165 ISBN 978-981-96-1285-7.
- Taherkhani, A.; Cosma, G.; McGinnity, T.M. AdaBoost-CNN: An Adaptive Boosting Algorithm for Convolutional Neural Networks to Classify Multi-Class Imbalanced Datasets Using Transfer Learning. Neurocomputing 2020, 404, 351–366. [CrossRef]
- Cao, Y.; Miao, Q.-G.; Liu, J.-C.; Gao, L. Advance and Prospects of AdaBoost Algorithm. Acta Automatica Sinica 2013, 39, 745–758. [CrossRef]
- Shahraki, A.; Abbasi, M.; Haugen, Ø. Boosting Algorithms for Network Intrusion Detection: A Comparative Evaluation of Real AdaBoost, Gentle AdaBoost and Modest AdaBoost. Engineering Applications of Artificial Intelligence 2020, 94, 103770. [CrossRef]
- Bentéjac, C.; Csörgő, A.; Martínez-Muñoz, G. A Comparative Analysis of Gradient Boosting Algorithms. Artif Intell Rev 2021, 54, 1937–1967. [CrossRef]
- Bahad, P.; Saxena, P. Study of AdaBoost and Gradient Boosting Algorithms for Predictive Analytics. In Proceedings of the International Conference on Intelligent Computing and Smart Communication 2019; Singh Tomar, G., Chaudhari, N.S., Barbosa, J.L.V., Aghwariya, M.K., Eds.; Springer: Singapore, 2020; pp. 235–244.
- Sun, R.; Wang, G.; Zhang, W.; Hsu, L.-T.; Ochieng, W.Y. A Gradient Boosting Decision Tree Based GPS Signal Reception Classification Algorithm. Applied Soft Computing 2020, 86, 105942. [CrossRef]
- Aziz, N.; Akhir, E.A.P.; Aziz, I.A.; Jaafar, J.; Hasan, M.H.; Abas, A.N.C. A Study on Gradient Boosting Algorithms for Development of AI Monitoring and Prediction Systems. In Proceedings of the 2020 International Conference on Computational Intelligence (ICCI); October 2020; pp. 11–16.
- Chowdhury, A.R.; Chatterjee, T.; Banerjee, S. A Random Forest Classifier-Based Approach in the Detection of Abnormalities in the Retina. Med Biol Eng Comput 2019, 57, 193–203. [CrossRef]
- Dhananjay, B.; Venkatesh, N.P.; Bhardwaj, A.; Sivaraman, J. Cardiac Signals Classification Based on Extra Trees Model. In Proceedings of the 2021 8th International Conference on Signal Processing and Integrated Networks (SPIN); August 2021; pp. 402–406.
- Aria, M.; Cuccurullo, C.; Gnasso, A. A Comparison among Interpretative Proposals for Random Forests. Machine Learning with Applications 2021, 6, 100094. [CrossRef]
- Fumera, G.; Roli, F.; Serrau, A. A Theoretical Analysis of Bagging as a Linear Combination of Classifiers. IEEE Transactions on Pattern Analysis and Machine Intelligence 2008, 30, 1293–1299. [CrossRef]
- Plaia, A.; Buscemi, S.; Fürnkranz, J.; Mencía, E.L. Comparing Boosting and Bagging for Decision Trees of Rankings. J Classif 2022, 39, 78–99. [CrossRef]
- Heydarian, M.; Doyle, T.E.; Samavi, R. MLCM: Multi-Label Confusion Matrix. IEEE Access 2022, 10, 19083–19095. [CrossRef]
- Markoulidakis, I.; Markoulidakis, G. Probabilistic Confusion Matrix: A Novel Method for Machine Learning Algorithm Generalized Performance Analysis. Technologies 2024, 12, 113. [CrossRef]
- Kolesnyk, A.S.; Khairova, N.F. Justification for the Use of Cohen’s Kappa Statistic in Experimental Studies of NLP and Text Mining. Cybern Syst Anal 2022, 58, 280–288. [CrossRef]
- Wang, J.; Yang, Y.; Xia, B. A Simplified Cohen’s Kappa for Use in Binary Classification Data Annotation Tasks. IEEE Access 2019, 7, 164386–164397. [CrossRef]
- Mokeddem, S.A. A Fuzzy Classification Model for Myocardial Infarction Risk Assessment. Appl Intell 2018, 48, 1233–1250. [CrossRef]
- Yates, L.A.; Aandahl, Z.; Richards, S.A.; Brook, B.W. Cross Validation for Model Selection: A Review with Examples from Ecology. Ecological Monographs 2023, 93, e1557. [CrossRef]
- Lim, C.; and Yu, B. Estimation Stability With Cross-Validation (ESCV). Journal of Computational and Graphical Statistics 2016, 25, 464–492. [CrossRef]
- Raschka, S. Model Evaluation, Model Selection, and Algorithm Selection in Machine Learning 2020.
- Mohd Faizal, A.S.; Hon, W.Y.; Thevarajah, T.M.; Khor, S.M.; Chang, S.-W. A Biomarker Discovery of Acute Myocardial Infarction Using Feature Selection and Machine Learning. Med Biol Eng Comput 2023, 61, 2527–2541. [CrossRef]
- Obuchowski, N.A.; Bullen, J.A. Receiver Operating Characteristic (ROC) Curves: Review of Methods with Applications in Diagnostic Medicine. Phys. Med. Biol. 2018, 63, 07TR01. [CrossRef]
- Rojas, J.C.; Lyons, P.G.; Chhikara, K.; Chaudhari, V.; Bhavani, S.V.; Nour, M.; Buell, K.G.; Smith, K.D.; Gao, C.A.; Amagai, S.; et al. A Common Longitudinal Intensive Care Unit Data Format (CLIF) for Critical Illness Research. Intensive Care Med 2025, 51, 556–569. [CrossRef]
- Elreedy, D.; Atiya, A.F. A Comprehensive Analysis of Synthetic Minority Oversampling Technique (SMOTE) for Handling Class Imbalance. Information Sciences 2019, 505, 32–64. [CrossRef]
- Özdemir, A.; Polat, K.; Alhudhaif, A. Classification of Imbalanced Hyperspectral Images Using SMOTE-Based Deep Learning Methods. Expert Systems with Applications 2021, 178, 114986. [CrossRef]
- Carreira-Perpiñán, M.Á.; Zharmagambetov, A. Ensembles of Bagged TAO Trees Consistently Improve over Random Forests, AdaBoost and Gradient Boosting. In Proceedings of the Proceedings of the 2020 ACM-IMS on Foundations of Data Science Conference; Association for Computing Machinery: New York, NY, USA, October 18 2020; pp. 35–46.
- Shao, G.; Tang, L.; Liao, J. Overselling Overall Map Accuracy Misinforms about Research Reliability. Landscape Ecol 2019, 34, 2487–2492. [CrossRef]
- Kolesnyk, A.S.; Khairova, N.F. Justification for the Use of Cohen’s Kappa Statistic in Experimental Studies of NLP and Text Mining. Cybern Syst Anal 2022, 58, 280–288. [CrossRef]
- Demirhan, H.; Yilmaz, A.E. Detection of Grey Zones in Inter-Rater Agreement Studies. BMC Med Res Methodol 2023, 23, 3. [CrossRef]
- Brzezinski, D.; Stefanowski, J. Prequential AUC: Properties of the Area under the ROC Curve for Data Streams with Concept Drift. Knowl Inf Syst 2017, 52, 531–562. [CrossRef]
- Newaz, A.; Mohosheu, M.S.; Al Noman, Md.A. Predicting Complications of Myocardial Infarction within Several Hours of Hospitalization Using Data Mining Techniques. Informatics in Medicine Unlocked 2023, 42, 101361. [CrossRef]
- Abbas, S.; Ojo, S.; Krichen, M.; Alamro, M.A.; Mihoub, A.; Vilcekova, L. A Novel Deep Learning Approach for Myocardial Infarction Detection and Multi-Label Classification. IEEE Access 2024, 12, 76003–76021. [CrossRef]
- Alsirhani, A.; Tariq, N.; Humayun, M.; Naif Alwakid, G.; Sanaullah, H. Intrusion Detection in Smart Grids Using Artificial Intelligence-Based Ensemble Modelling. Cluster Comput 2025, 28, 238. [CrossRef]
- Van den Bruel, A.; Cleemput, I.; Aertgeerts, B.; Ramaekers, D.; Buntinx, F. The Evaluation of Diagnostic Tests: Evidence on Technical and Diagnostic Accuracy, Impact on Patient Outcome and Cost-Effectiveness Is Needed. Journal of Clinical Epidemiology 2007, 60, 1116–1122. [CrossRef]
- Miao, J.; Zhu, W. Precision–Recall Curve (PRC) Classification Trees. Evol. Intel. 2022, 15, 1545–1569. [CrossRef]
- Markoulidakis, I.; Markoulidakis, G. Probabilistic Confusion Matrix: A Novel Method for Machine Learning Algorithm Generalized Performance Analysis. Technologies 2024, 12, 113. [CrossRef]
- Li, A.H.; Bradic, J. Boosting in the Presence of Outliers: Adaptive Classification With Nonconvex Loss Functions. Journal of the American Statistical Association 2018, 113, 660–674. [CrossRef]
- Chicco, D.; Warrens, M.J.; Jurman, G. The Matthews Correlation Coefficient (MCC) Is More Informative Than Cohen’s Kappa and Brier Score in Binary Classification Assessment. IEEE Access 2021, 9, 78368–78381. [CrossRef]
- Wallace, M.L.; Mentch, L.; Wheeler, B.J.; Tapia, A.L.; Richards, M.; Zhou, S.; Yi, L.; Redline, S.; Buysse, D.J. Use and Misuse of Random Forest Variable Importance Metrics in Medicine: Demonstrations through Incident Stroke Prediction. BMC Med Res Methodol 2023, 23, 144. [CrossRef]
- Liu, L.; Lewandrowski, K. Establishing Optimal Cutoff Values for High-Sensitivity Cardiac Troponin Algorithms in Risk Stratification of Acute Myocardial Infarction. Critical Reviews in Clinical Laboratory Sciences 2024, 61, 1–22. [CrossRef]
- Zheng, H.; Sherazi, S.W.A.; Lee, J.Y. A Stacking Ensemble Prediction Model for the Occurrences of Major Adverse Cardiovascular Events in Patients With Acute Coronary Syndrome on Imbalanced Data. IEEE Access 2021, 9, 113692–113704. [CrossRef]
- Kasim, S.; Amir Rudin, P.N.F.; Malek, S.; Ibrahim, K.S.; Wan Ahmad, W.A.; Fong, A.Y.Y.; Lin, W.Y.; Aziz, F.; Ibrahim, N. Ensemble Machine Learning for Predicting In-Hospital Mortality in Asian Women with ST-Elevation Myocardial Infarction (STEMI). Sci Rep 2024, 14, 12378. [CrossRef]

Table 1.
Performance of Machine Learning Ensemble Models.
| Model | Accuracy | F1 Score | Precision | Recall | AUC |
|---|---|---|---|---|---|
| Adaboost | 0.646122 | 0.645918 | 0.646548 | 0.646179 | 0.702120 |
| Gradient Boosting | 0.708342 | 0.708330 | 0.708406 | 0.708360 | 0.786005 |
| RandomForest | 0.912938 | 0.912910 | 0.913365 | 0.912903 | 0.968798 |
| ExtraTrees | 0.916395 | 0.916330 | 0.917540 | 0.916337 | 0.968897 |
| Bagging | 0.936273 | 0.936083 | 0.941200 | 0.936156 | 0.968604 |
Table 2.
Comparative performance of ensemble learning models: average accuracy, average rank, statistical group, and Cohen's Kappa index.
Table 2.
Comparative performance of ensemble learning models: average accuracy, average rank, statistical group, and Cohen's Kappa index.
| Model | Accuracy± SD | Average rank | Statistical group | Cohen's Kappa |
|---|---|---|---|---|
| Bagging | 93.36 ± 0.22 | 1.0 | A | 0.87 |
| ExtraTrees | 90.76 ± 0.18 | 2.0 | A | 0.83 |
| RandomForest | 90.41 ± 0.18 | 3.0 | B | 0.83 |
| GradientBoosting | 70.72 ± 0.30 | 4.0 | B | 0.42 |
| AdaBoost | 65.15± 0.29 | 5.0 | C | 0.29 |
Disclaimer/Publisher’s Note: The statements, opinions and data contained in all publications are solely those of the individual author(s) and contributor(s) and not of MDPI and/or the editor(s). MDPI and/or the editor(s) disclaim responsibility for any injury to people or property resulting from any ideas, methods, instructions or products referred to in the content. |
© 2025 by the authors. Licensee MDPI, Basel, Switzerland. This article is an open access article distributed under the terms and conditions of the Creative Commons Attribution (CC BY) license (http://creativecommons.org/licenses/by/4.0/).
Copyright: This open access article is published under a Creative Commons CC BY 4.0 license, which permit the free download, distribution, and reuse, provided that the author and preprint are cited in any reuse.


