
Submitted:
14 May 2024
Posted:
14 May 2024
You are already at the latest version
Abstract
Stroke constitutes a significant public health concern due to its impact on mortality and morbidity. This study investigates the utility of machine learning algorithms in predicting stroke and identifying key risk factors using data from the Suita study, comprising 7,389 participants and 53 variables. Initially, unsupervised K-prototype clustering categorized participants into risk clusters, while five supervised models including Logistic Regression (LR), Random Forest (RF), Support Vector Machine (SVM), eXtreme Gradient Boosting (XGBoost), and Light Gradient Boosted Machine (Light-GBM) were employed to predict stroke outcomes. Stroke incidence disparities among identified risk clusters using the unsupervised K-prototype clustering method are substantial, according to the findings. Supervised learning, particularly RF was a preferable option because of the higher levels of performance metrics. The Shapley Additive Explanations (SHAP) method identified age, systolic blood pressure, hypertension, estimated glomerular filtration rate, metabolic syndrome, and blood glucose level as key predictors of stroke, aligning with findings from the unsupervised clustering approach in high-risk groups. Additionally, previously unidentified risk factors such as elbow joint thickness, fructosamine, hemoglobin, and calcium level demonstrate potential for stroke prediction. In conclusion, machine learning facilitated accurate stroke risk predictions and highlighted potential biomarkers, offering a data-driven framework for risk assessment and biomarker discovery.
Keywords:
Stroke
; supervised machine learning
; unsupervised machine learning
; Logistic Regression
; Random Forest
; Support Vector Machine (SVM)
; eXtreme Gradient Boost (XGBoost)
; Light Gradient Boosted Machine (Light-GBM)
; K-prototype clustering
; Shapley Addictive ExPlanations (SHAP)
1. Introduction
Stroke is a major global health concern, with high rates of disability and mortality worldwide. In 2019, stroke was responsible for 11% of the 55.4 million deaths worldwide [1]. According to the Global Stroke Factsheet published in 2022, the risk of stroke has increased by 50% in the last 17 years [2]. Stroke incidence, mortality, prevalence, and disability-adjusted life years (DALY) have also increased significantly over the past few decades [2]. The economic burden of stroke is also substantial, with global direct and indirect costs totaling US$891 billion in 2017 [3].
Early detection of stroke risk by predictive models can enable early intervention and prevention, reducing the severity of stroke events. Predictive models can improve stroke patient outcomes, including reduced morbidity and mortality, and enable personalized therapy. Furthermore, stroke prediction can inform resource allocation and prioritization of preventive measures in communities where they are most needed. Prediction models can also provide insights into the underlying causes of stroke, leading to the development of new treatments and preventative measures. Thus, research on the prediction of stroke and the identification of high-risk populations is crucial.
Population-based cohort studies have been used to identify stroke risk, which follows a specific population over time, and collect data on various factors such as demographics, medical history, lifestyle habits, and disease outcomes. However, conventional risk scores have limitations due to the complex interactions among diverse factors in real-life situations. Machine learning (ML) algorithms can provide a technical solution to these difficulties by automatically selecting the most important features and variables, reducing the need for manual feature selection. Additionally, ML algorithms can be trained on large datasets and typically achieve greater accuracy than traditional statistical methods, especially for complex interactions between variables, making them more generalizable to new and unexplored data.
While ML techniques have been used in increasing cardiovascular event-related studies in recent years, they remain a relatively unexplored topic in stroke research [4,5,6,7]. Therefore, combining unsupervised and supervised ML techniques to identify high-risk groups is essential for stroke prediction. Additionally, the SHAP approach can be utilized to determine the importance of independent variables with stroke and explore the potential of unidentified risk factors for stroke prediction.
In summary, this study aims to explore the role of machine learning techniques in predicting stroke incidence and uncovering novel risk factors. Through a comprehensive ML-driven analysis, we endeavor to enhance our understanding of stroke risk assessment and contribute to the development of effective preventive strategies.
2. Materials and Methods
2.1. Study Participants
The Suita Study, a prospective population-based cohort study, was conducted in Suita city, located in northern Osaka, Japan. The study design and selection criteria have been previously described [8,9]. Between 1989 and 1999, the study enrolled 7672 men and women aged 30 to 84 years who did not have clinical cardiovascular disease at baseline. The participants were selected from the municipality population registry and followed for an average of 15 years until their first stroke, myocardial infarction (MI), death, or relocation. All participants who agreed to participate in the Suita study provided informed consent.
2.2. Outcomes
The diagnosis of stroke, a binary outcome, was made using computed tomography and magnetic resonance imaging based on the criteria established by the US National Survey of Stroke.
2.3. Risk Factors and Additional Measurements
The baseline measurements were collected prior to the occurrence of stroke events. The participant’s blood pressure (BP) was measured through a standardized protocol for accuracy and precision, utilizing a mercury column sphygmomanometer and a suitable cuff. Participants were instructed to rest for at least 5 minutes before their initial BP measurement to establish a stable baseline. To ensure proper observation and recording, two separate BP readings were taken at intervals greater than one minute and averaged. Hypertension was defined as systolic blood pressure ≥ 140mmHg, diastolic blood pressure ≥ 90 mmHg, or using antihypertensive medications. Body mass index (BMI) was calculated as weight (kg) divided by the square of height (m2). As part of the baseline evaluation, routine blood tests were performed, measuring serum total cholesterol, high-density lipoprotein cholesterol as well as glucose levels. Non-HDL cholesterol was calculated by total cholesterol concentration minus high density lipoprotein cholesterol. Diabetes was defined as fasting plasma glucose ≥ 126 mg/dL, and/or using diabetic medications. Metabolic syndrome was defined as a combination of abdominal obesity, impaired fasting glucose, atherogenic dyslipidemia, and elevated blood pressure. According to the original Japanese criteria for metabolic syndrome were the presence of high waist circumference ≥ 85 cm in men and ≥ 90 cm in women and/or BMI ≥ 25.0 kg/m2, an essential component plus ≥ 2 (definite MetS) of the followings [10,11]: (1) systolic blood pressure ≥ 130 mm Hg and/or diastolic blood pressure ≥ 85 mm Hg or medication use; (2) triglyceride level ≥ 150 mg/dL and/or HDL cholesterol level < 40 mg/dL; and (3) fasting glucose level ≥ 100 mg/dL and/or medication use. Estimated glomerular filtration rate (eGFR) (mL/min/1.73m2) was calculated according to the original Modification of Diet in Renal Disease (MDRD) equation modified by the Japanese coefficient (0.881) as follows:
eGFR = [12].
2.4. Statistical Methods
Data is presented as percentages, means (standard deviations), or medians (IQRs) depending on variable characteristics. Chi-squared test or Fisher exact test is used for categorical variables, whereas t-test, analysis of variance, or Kruskal-Wallis’s test is used for continuous variables.
The flowchart, in Figure 1, represents the development of a Stroke prediction model.
2.5. Data Pre-Processing
Our original dataset consisted of 7672 participants and 169 variables. We utilized a random forest method to impute missing values for continuous variables. For missing categorical variables, we replaced them with the mode before applying one-hot encoding.
In order to facilitate the interpretation of results, it is necessary for all variables to be expressed in the same unit. Therefore, we normalize all these variables using standardization methods (or Z-score normalization) that involves centering the variable mean at 0 and standardizing the variance at 1 [13]. The procedure involves subtracting each observation’s mean and dividing by the standard deviation.
We extracted all variables from the raw dataset to build a data-driven model. We removed multicollinearity by considering the clinical meaning of variables, variance inflation factor (VIF), and correlation coefficients between variables. After that, we have to eliminate the redundant and unneeded variables from the dataset, which included 7389 participants (4012 female and 3377 male) and 53 variables.
2.6. Unsupervised Learning
For the purpose of obtaining the overview of the characteristics of study participants and their risk factors in the association with stroke incidence, we used the clustering method that is a type of unsupervised learning that consists of similar characteristics within a group and different characteristics between groups through the characteristics of individuals. We employed the K-prototypes clustering approach, combining the K-means and K-modes clustering methods because our dataset had continuous and categorical variables [14].
The clusters were not chosen arbitrarily or adjusted to maximize results. Instead, we carefully considered factors such as the clinical relevance of the clusters, the interpretability of the results, and the feasibility of implementing interventions or healthcare strategies tailored to each risk group. This approach allowed us to strike a balance between statistical rigor and practical relevance in identifying distinct risk groups within the study population
2.7. Supervised Learning
In this study, we took several steps to ensure the robustness of our supervised models for predicting stroke incidence. Initially, we addressed the challenge of imbalanced data by down-sampling the group free of stroke while maintaining the original ratio of positive (stroke) to negative (free of stroke) samples. Subsequently, we randomly divided the dataset into training (80%) and testing (20%) sets.
Following this, we trained five supervised models using the training set, employing logistic regression (LR), random forest (RF), support vector machine (SVM), extreme gradient boost (XGBoost), and light gradient boosting machine (LightGBM). We employed a combination of 5-fold cross-validation and a hyperparameter optimization framework. The cross-validation method is a proficient way to safeguard against overfitting by testing the model with various combinations of training and validation data.
Each model has unique strengths that could make it the best model for predicting stroke in our cohort. LR is a simple approach to prediction that provides baseline accuracy scores for comparisons with other non-parametric machine learning models [15]. RF is a bagging technique that generates many decision trees to reduce the high variance of decision trees [15]. SVM classifies data by separating classes with a boundary [16,17], while XGBoost is a powerful tool for classification and regression [17]. LightGBM is a fast, distributed, high-performance gradient-boosting framework that uses a tree-based learning algorithm [18].
For evaluating the efficacy of these models, we calculated using several performance metrics, such as accuracy, area under the receiver operating characteristic curve (AUC), recall, precision, and F1-score, using the test set. The metrics explanation is included in our Appendix Table A1.
2.8. Extraction of Important Variables for Stroke Risk
To determine which predictors contribute the most to the prediction model, we applied the Shapley Additive ExPlanations (SHAP) method [13]. SHAP is a unified framework for predictive interpretation that expresses variables’ importance by comparing situations’ predictions with baseline values when there are specific values for a given feature [13,17].
3. Results
In total, 7389 individuals participated in our Suita study. At baseline, the median (interquartile range) age was 56 (44 - 65) years, 45.7% of participants were male, and 5.9% had suffered a stroke. People with incident stroke were older and more likely to have a higher prevalence of hypertension, diabetes, and metabolic syndrome. As demonstrated in Table 1, the incidence of stroke was higher among men and those with a higher body mass index, blood sugar, triglyceride, and non-high-density lipoprotein cholesterol level but a low estimated glomerular filtration rate (eGFR).
The unsupervised K-prototype technique was used to examine the features of each cluster in Table 2. These clusters created three risk groups: high-risk, medium-risk, and low-risk based on their incidence of stroke as 9.1%, 6.6%, and 3.2%, respectively. Participants at high risk exhibited numerous distinguishing characteristics, including elevated systolic and diastolic blood pressure, increased non-HDL-c levels, higher fructosamine levels, greater BMI, and higher levels of body fat. Additionally, they had a high prevalence of hypertension and metabolic syndrome. However, their estimated glomerular filtration rate was modest. In contrast, the low-risk categories included younger individuals at the lowest risk for cardiovascular disease.
The supervised model applied five classifier methods, including LR, RF, SVM, XGBoost, and LightGBM. Accuracy, AUC, Recall, Precision, and F1-score are used to evaluate the performance of these models. As demonstrated in Table 3, RF algorithm was a preferable option because of the higher levels of all metrics, with an accuracy of 0.70, an AUC of 0.71, recall of 0.70, precision of 0.70, and a F1 score of 0.70.
Figure 2, illustrated additional analysis conducted using SHAP values. RF was utilized to compute the SHAP values, which facilitated the identification of the top most important variables that led to the incidence of Stroke.
As shown in Figure 2, age emerged as the most influential predictor among the most important variables. Other significant variables included systolic blood pressure, hypertension, estimated glomerular filtration rate, metabolic syndrome, and blood glucose. Intriguingly, we also discovered that elbow joint thickness, fructosamine level, hemoglobin and serum calcium levels could predict stroke risk. These results are consistent with those reported for the population at high risk, and the most important variables identified by the SHAP method were comparable.
4. Discussion
Our study suggested that machine learning techniques can be used for stroke prediction in large-scale population studies. Unsupervised K-prototype approaches are appropriate for large datasets that include both categorical and numeric variables, and they aid in elucidating the characteristics of study participants [5,19]. Moreover, supervised method can also be used in our model, notably the RF, which can be utilized to predict the risk of stroke accurately [20]. Machine learning techniques can cover a wider variety of variables and identify more complex relationships than conventional methods [7,21,22].
4.1. Top Most Important Variables and Comparisons with Other Studies
Age, maybe reflecting the duration of risk exposure, was the most significant predictor of non-communicable diseases and stroke. Consistent with prior studies, our investigation also found systolic blood pressure, and hypertension [23,24,25,26,27], and estimated glomerular filtration rate (representing chronic kidney disease) [23,28,29] as the most important predictors of stroke incidence.
Participants with a high prevalence of metabolic syndrome exhibited a high incidence of stroke. The metabolic syndrome defines the relationship between diabetes, hypertension, obesity, and dyslipidemia and an increased risk for cardiovascular disease. It is primarily the consequence of an unhealthy diet and a sedentary lifestyle. These modifiable risk factors are becoming more prevalent with the widespread adoption of so-called Western lifestyles [30]. High glucose levels, or hyperglycemia, can damage blood vessels and increase the risk of stroke. Similar to Carson et al. [31], we discovered a relationship between blood glucose level and stroke incidence.
Fructosamine, which encompasses total glycated serum proteins, has gained attention as an alternative glycemic status indicator. It has been acknowledged that it can provide additional insights beyond HbA1c or function as a reliable metric when HbA1c is unreliable. In addition, fructosamine assesses glycemic exposure over a shorter period of time than HbA1c, which examines exposure over the preceding three-month period. This temporal characteristic is advantageous for the monitoring of rapid metabolic fluctuations and adjustments in diabetes therapy [32]. Fructosamine levels have been identified as a potential risk factor for risk of stroke, a finding consistent with previous studies [33,34].
High hemoglobin concentration is also associated with stroke, according to our SHAP research. It is unclear how hemoglobin and serum calcium concentration affect stroke incidence. Our findings imply that stroke incidence is related to hemoglobin concentration, contrary to earlier research [35,36].
Moreover, a majority of studies [37,38] have found an inverse relationship between serum calcium levels and the incidence of stroke. Intriguingly, serum calcium’s potential function as a clinical prognosticator extends beyond ischemic stroke. Hypocalcemia is consistently associated with more severe illness and a higher mortality rate compared to normal calcium levels [39,40], as shown by research on a variety of medical conditions, particularly among critically ill individuals. These results correspond to our own research findings.
In addition, one of our most recent and intriguing discoveries involves the association between elbow joint thickness and the incidence of stroke.
4.2. Comparing our Important Variables and the Variables Used in Framingham and Suita Scores
The Framingham and Suita scores primarily focused on predicting coronary heart disease incidence, but this study focused on stroke incidence. However, coronary heart disease and stroke shared some common risk factors. Some discrepancies were found when comparing our results to the Framingham and Suita scores. The Framingham risk score comprises 6 coronary risk factors: age, sex, smoking habits, blood pressure, Total cholesterol, and HDL cholesterol [41]. The Suita score, developed for the Japanese population, was more accurate in predicting coronary heart disease than the original Framingham risk scores. The Suita score includes similar factors to the Framingham score but also includes an assessment of the CKD stage [42,43].
Our investigation discovered several important predictors of stroke incidence that were not included in either the Framingham or Suita scores, such as elbow joint thickness, fructosamine level, hemoglobin concentration, and calcium level. Nevertheless, age, hypertension, and blood sugar were also revealed as important predictors in our study and the Framingham and Suita scores. We also confirmed the estimated glomerular filtration rate representative for chronic kidney disease, an important variable included in the Suita score.
Hence, our study identified several significant predictors of stroke risk that are similar to findings from other studies. However, some discrepancies were found when comparing our results to the Framingham and Suita scores. The outcomes of this study can assist healthcare professionals in identifying persons at high risk for stroke and implementing preventive measures.
4.3. Strengths and Limitations
Regarding our study’s strengths, we identified specific characteristics associated with high and low-risk group and had a large sample size. In addition, we analyzed the data using a combination of unsupervised and supervised learning techniques to provide a thorough understanding of the stroke predictors.
But so far, there are constraints to consider. Our study included only participants from a single region, which may limit the applicability of the results to other populations. Moreover, while machine learning approaches can find more complicated associations between variables, they may be more susceptible to overfitting or developing models that do not generalize well to new data.
It would be advantageous to compare the results of our investigation with those of other studies that have employed machine learning techniques to predict the risk of stroke. This comparison would assist in determining whether or not our findings are compatible with other studies in the field. In addition, it would be advantageous to undertake additional research to validate the findings of our study and assess the efficacy of machine learning algorithms in clinical practice.
5. Conclusions
This study found that both unsupervised and supervised learning can effectively develop a stroke prediction model using many predictors from a population-based study. By considering multiple predictors, our research provided a preventive perspective on stroke, facilitating risk assessment, biomarker identification, and identifying novel markers for stroke.
Author Contributions
Study concept and design: T.V., Y.K., M.A.; data analysis and interpretation: T.V., M.I., M.Y.; drafting of the manuscript: T.V.; resources: Y.K.; data curation: Y.K., M.A.; supervision: Y.K., M.A.; reviewing and editing: T.V., R.D., A.MM., T.I., A.M. All authors critically revised and approved the final version of the manuscript.
Funding
This article was supported by Japan Science and Technology Agency (JST) COI-NEXT Grant number JPMJPF2018 to M.A.
Institutional Review Board Statement
The study was conducted per the Declaration of Helsinki guidelines and regulations, with approval from the institutional review board at National Cerebral and Cardiovascular Center (Research project no. R21024-2).
Informed Consent Statement
Informed consent was obtained from all subjects involved in the study.
Data Availability Statement
The dataset examined in this study is not available to the public due to the inclusion of individuals’ personal information.
Conflicts of Interest
The authors declare no conflict of interest.
Abbreviations
The following abbreviations are used in this manuscript:
| SHAP | SHapley Additive exPlanations |
| AUC | Area Under the Curve |
| VIF | Variance inflation factor |
| LR | Logistic Regression |
| SVM | Support Vector Machine |
| RF | Random Forest |
| XGBoost | eXtreme Gradient Boosting |
| Light-GBM | Light Gradient-Boosting Machine |
| BMI | Body mass index |
| SBP | Systolic blood pressure |
| DBP | Diasolic blood pressure |
| HDL-c | High-density lipoprotein cholesterol |
| eGFR | Estimated glomerular filtration rate |
| MetS | Metabolic syndrome |
Appendix A

Table A1.
Interpretation for model performance metrics
| Performance metrics | Definition | Formula | Interpretation |
|---|---|---|---|
| Accuracy | Accuracy is a measure of how many of the total predictions made by the model are correct |
Accuracy tells us the overall correctness of predictions. However, a highly imbalanced dataset can lead to misleadingly high accuracy if the model predicts the majority class most of the time. |
|
| AUC | Area under a receiver operating characteristic (AUC-ROC) measures the ability of a model to distinguish between the positive and negative classes by varying the classification threshold |
The ROC curve plots the True Positive Rate (Recall) against the False Positive Rate at various threshold values, and AUC-ROC calculates the area under this curve. |
|
| Recall | Recall (or Sensitivity) measures the ability of the model to correctly identify positive instances out of all actual positive instances |
Recall quantifies the model’s ability to avoid missing positive cases. It’s crucial in scenarios where false negatives (missing actual positive cases) are costly or problematic. |
|
| Precision | Precision (or Positive Predictive Value) measures the accuracy of positive predictions made by the model |
Precision focuses on the accuracy of positive predictions. |
|
| F1-score | The F1-score is the harmonic mean of precision and recall. It provides a single metric that balances both precision and recall. |
The F1-score combines the strengths of precision and recall into a single metric. |
Abbreviation: AUC, Area Under the Curve; TP, True Positive; TN, True Negative; FP, False Positive; FN, False Negative.
References
- WHO. The top 10 causes of death, 2020. https://www.who.int/news-room/fact-sheets/detail/the-top-10-causes-of-death.
- Feigin, V.L.; Brainin, M.; Norrving, B.; Martins, S.; Sacco, R.L.; Hacke, W.; Fisher, M.; Pandian, J.; Lindsay, P. World Stroke Organization (WSO): Global Stroke Fact Sheet 2022. International Journal of Stroke 2022, 17, 18–29. [Google Scholar] [CrossRef] [PubMed]
- Owolabi, M.O.; Thrift, A.G.; Mahal, A.; Ishida, M.; Martins, S.; Johnson, W.D.; Pandian, J.; Abd-Allah, F.; Yaria, J.; Phan, H.T.; et al. Primary stroke prevention worldwide: translating evidence into action. The Lancet Public Health 2022, 7, e74–e85. [Google Scholar] [CrossRef] [PubMed]
- Ambale-Venkatesh, B.; Yang, X.; Wu, C.O.; Liu, K.; Hundley, W.G.; McClelland, R.; Gomes, A.S.; Folsom, A.R.; Shea, S.; Guallar, E.; Bluemke, D.A.; Lima, J.A. Cardiovascular Event Prediction by Machine Learning. Circulation Research 2017, 121, 1092–1101. [Google Scholar] [CrossRef]
- Kim, J.T.; Kim, N.R.; Choi, S.H.; Oh, S.; Park, M.S.; Lee, S.H.; Kim, B.C.; Choi, J.; Kim, M.S. Neural network-based clustering model of ischemic stroke patients with a maximally distinct distribution of 1-year vascular outcomes. Scientific Reports 2022, 12, 9420. [Google Scholar] [CrossRef] [PubMed]
- Dritsas, E.; Trigka, M. Stroke Risk Prediction with Machine Learning Techniques. Sensors 2022, 22, 4670. [Google Scholar] [CrossRef]
- Tazin, T.; Alam, M.N.; Dola, N.N.; Bari, M.S.; Bourouis, S.; Khan, M.M. Stroke Disease Detection and Prediction Using Robust Learning Approaches. Journal of Healthcare Engineering 2021, 2021, 1–12. [Google Scholar] [CrossRef] [PubMed]
- Kokubo, Y.; Kamide, K.; Okamura, T.; Watanabe, M.; Higashiyama, A.; Kawanishi, K.; Okayama, A.; Kawano, Y. Impact of High-Normal Blood Pressure on the Risk of Cardiovascular Disease in a Japanese Urban Cohort. Hypertension 2008, 52, 652–659. [Google Scholar] [CrossRef]
- Kokubo, Y.; Watanabe, M.; Higashiyama, A.; Nakao, Y.M.; Kobayashi, T.; Watanabe, T.; Okamura, T.; Okayama, A.; Miyamoto, Y. Interaction of Blood Pressure and Body Mass Index With Risk of Incident Atrial Fibrillation in a Japanese Urban Cohort: The Suita Study. American Journal of Hypertension 2015, 28, 1355–1361. [Google Scholar] [CrossRef]
- Nakao, Y.M.; Miyamoto, Y.; Ueshima, K.; Nakao, K.; Nakai, M.; Nishimura, K.; Yasuno, S.; Hosoda, K.; Ogawa, Y.; Itoh, H.; Ogawa, H.; Kangawa, K.; Nakao, K. Effectiveness of nationwide screening and lifestyle intervention for abdominal obesity and cardiometabolic risks in Japan: The metabolic syndrome and comprehensive lifestyle intervention study on nationwide database in Japan (MetS ACTION-J study). PLOS ONE 2018, 13, e0190862. [Google Scholar] [CrossRef] [PubMed]
- Iso, H.; Cui, R.; Takamoto, I.; Kiyama, M.; Saito, I.; Okamura, T.; Miyamoto, Y.; Higashiyama, A.; Kiyohara, Y.; Ninomiya, T.; Yamada, M.; Nakagawa, H.; Sakurai, M.; Shimabukuro, M.; Higa, M.; Shimamoto, K.; Saito, S.; Daimon, M.; Kayama, T.; Noda, M.; Ito, S.; Yokote, K.; Ito, C.; Nakao, K.; Yamauchi, T.; Kadowaki, T. Risk Classification for Metabolic Syndrome and the Incidence of Cardiovascular Disease in Japan With Low Prevalence of Obesity: A Pooled Analysis of 10 Prospective Cohort Studies. Journal of the American Heart Association 2021, 10. [Google Scholar] [CrossRef]
- Imai, E.; Horio, M.; Nitta, K.; Yamagata, K.; Iseki, K.; Hara, S.; Ura, N.; Kiyohara, Y.; Hirakata, H.; Watanabe, T.; Moriyama, T.; Ando, Y.; Inaguma, D.; Narita, I.; Iso, H.; Wakai, K.; Yasuda, Y.; Tsukamoto, Y.; Ito, S.; Makino, H.; Hishida, A.; Matsuo, S. Estimation of glomerular filtration rate by the MDRD study equation modified for Japanese patients with chronic kidney disease. Clinical and Experimental Nephrology 2007, 11, 41–50. [Google Scholar] [CrossRef] [PubMed]
- Martin-Morales, A.; Yamamoto, M.; Inoue, M.; Vu, T.; Dawadi, R.; Araki, M. Predicting Cardiovascular Disease Mortality: Leveraging Machine Learning for Comprehensive Assessment of Health and Nutrition Variables. Nutrients 2023, 15, 3937. [Google Scholar] [CrossRef] [PubMed]
- Huang, Z. Extensions to the k-Means Algorithm for Clustering Large Data Sets with Categorical Values. Data Mining and Knowledge Discovery 1998, 2, 283–304. [Google Scholar] [CrossRef]
- Landwehr, N.; Hall, M.; Frank, E. Logistic Model Trees. Machine Learning 2005, 59, 161–205. [Google Scholar] [CrossRef]
- Hamaguchi, T.; Saito, T.; Suzuki, M.; Ishioka, T.; Tomisawa, Y.; Nakaya, N.; Abo, M. Support Vector Machine-Based Classifier for the Assessment of Finger Movement of Stroke Patients Undergoing Rehabilitation. Journal of Medical and Biological Engineering 2020, 40, 91–100. [Google Scholar] [CrossRef]
- Su, P.Y.; Wei, Y.C.; Luo, H.; Liu, C.H.; Huang, W.Y.; Chen, K.F.; Lin, C.P.; Wei, H.Y.; Lee, T.H. Machine Learning Models for Predicting Influential Factors of Early Outcomes in Acute Ischemic Stroke: Registry-Based Study. JMIR Medical Informatics 2022, 10, e32508. [Google Scholar] [CrossRef] [PubMed]
- Ke, G.; Meng, Q.; Finley, T.; Wang, T.; Chen, W.; Ma, W.; Ye, Q.; Liu, T.Y. LightGBM: A Highly Efficient Gradient Boosting Decision Tree. Advances in Neural Information Processing Systems 2017, 30. [Google Scholar]
- Nouraei, H.; Nouraei, H.; Rabkin, S.W. Comparison of Unsupervised Machine Learning Approaches for Cluster Analysis to Define Subgroups of Heart Failure with Preserved Ejection Fraction with Different Outcomes. Bioengineering 2022, 9, 175. [Google Scholar] [CrossRef]
- Fernandez-Lozano, C.; Hervella, P.; Mato-Abad, V.; Rodríguez-Yáñez, M.; Suárez-Garaboa, S.; López-Dequidt, I.; Estany-Gestal, A.; Sobrino, T.; Campos, F.; Castillo, J.; Rodríguez-Yáñez, S.; Iglesias-Rey, R. Random forest-based prediction of stroke outcome. Scientific Reports 2021, 11, 10071. [Google Scholar] [CrossRef]
- Sirsat, M.S.; Fermé, E.; Câmara, J. Machine Learning for Brain Stroke: A Review. Journal of Stroke and Cerebrovascular Diseases 2020, 29, 105162. [Google Scholar] [CrossRef]
- Zheng, Y.; Guo, Z.; Zhang, Y.; Shang, J.; Yu, L.; Fu, P.; Liu, Y.; Li, X.; Wang, H.; Ren, L.; Zhang, W.; Hou, H.; Tan, X.; Wang, W. Rapid triage for ischemic stroke: a machine learning-driven approach in the context of predictive, preventive and personalised medicine. EPMA Journal 2022, 13, 285–298. [Google Scholar] [CrossRef]
- Nugroho, A.W.; Arima, H.; Miyazawa, I.; Fujii, T.; Miyamatsu, N.; Sugimoto, Y.; Nagata, S.; Komori, M.; Takashima, N.; Kita, Y.; Miura, K.; Nozaki, K. The Association between Glomerular Filtration Rate Estimated on Admission and Acute Stroke Outcome: The Shiga Stroke Registry. Journal of Atherosclerosis and Thrombosis 2018, 25, 570–579. [Google Scholar] [CrossRef] [PubMed]
- Penn, A.M.; Croteau, N.S.; Votova, K.; Sedgwick, C.; Balshaw, R.F.; Coutts, S.B.; Penn, M.; Blackwood, K.; Bibok, M.B.; Saly, V.; Hegedus, J.; Yu, A.Y.X.; Zerna, C.; Klourfeld, E.; Lesperance, M.L. Systolic blood pressure as a predictor of transient ischemic attack/minor stroke in emergency department patients under age 80: a prospective cohort study. BMC Neurology 2019, 19, 251. [Google Scholar] [CrossRef] [PubMed]
- Arafa, A.; Kokubo, Y.; Sheerah, H.A.; Sakai, Y.; Watanabe, E.; Li, J.; Honda-Kohmo, K.; Teramoto, M.; Kashima, R.; Nakao, Y.M.; Koga, M. Developing a Stroke Risk Prediction Model Using Cardiovascular Risk Factors: The Suita Study. Cerebrovascular Diseases 2022, 51, 323–330. [Google Scholar] [CrossRef] [PubMed]
- Guzik, A.; Bushnell, C. Stroke Epidemiology and Risk Factor Management. CONTINUUM: Lifelong Learning in Neurology 2017, 23, 15–39. [Google Scholar] [CrossRef]
- Turana, Y.; Tengkawan, J.; Chia, Y.C.; Nathaniel, M.; Wang, J.; Sukonthasarn, A.; Chen, C.; Minh, H.V.; Buranakitjaroen, P.; Shin, J.; et al. Hypertension and stroke in Asia: A comprehensive review from HOPE Asia. The Journal of Clinical Hypertension 2021, 23, 513–521. [Google Scholar] [CrossRef] [PubMed]
- Lee, M.; Saver, J.L.; Chang, K.H.; Liao, H.W.; Chang, S.C.; Ovbiagele, B. Low glomerular filtration rate and risk of stroke: meta-analysis. BMJ 2010, 341, c4249–c4249. [Google Scholar] [CrossRef]
- Chao, C.H.; Wu, C.L.; Huang, W.Y. Association between estimated glomerular filtration rate and clinical outcomes in ischemic stroke patients with high-grade carotid artery stenosis. BMC Neurology 2021, 21, 124. [Google Scholar] [CrossRef]
- Hajhosseiny, R.; Matthews, G.K.; Lip, G.Y. Metabolic syndrome, atrial fibrillation, and stroke: Tackling an emerging epidemic. Heart Rhythm 2015, 12, 2332–2343. [Google Scholar] [CrossRef]
- Carson, A.P.; Muntner, P.; Kissela, B.M.; Kleindorfer, D.O.; Howard, V.J.; Meschia, J.F.; Williams, L.S.; Prineas, R.J.; Howard, G.; Safford, M.M. Association of Prediabetes and Diabetes With Stroke Symptoms. Diabetes Care 2012, 35, 1845–1852. [Google Scholar] [CrossRef]
- Ribeiro, R.T.; Macedo, M.P.; Raposo, J.F. HbA1c, Fructosamine, and Glycated Albumin in the Detection of Dysglycaemic Conditions. Current Diabetes Reviews 2015, 12, 14–19. [Google Scholar] [CrossRef] [PubMed]
- Selvin, E.; Rawlings, A.M.; Lutsey, P.L.; Maruthur, N.; Pankow, J.S.; Steffes, M.; Coresh, J. Fructosamine and Glycated Albumin and the Risk of Cardiovascular Outcomes and Death. Circulation 2015, 132, 269–277. [Google Scholar] [CrossRef] [PubMed]
- Grzywacz, A.; Lubas, A.; Smoszna, J.; Niemczyk, S. Risk Factors Associated with All-Cause Death Among Dialysis Patients with Diabetes. Medical Science Monitor 2021, 27. [Google Scholar] [CrossRef] [PubMed]
- Panwar, B.; Judd, S.E.; Warnock, D.G.; McClellan, W.M.; Booth, J.N.; Muntner, P.; Gutiérrez, O.M. Hemoglobin Concentration and Risk of Incident Stroke in Community-Living Adults. Stroke 2016, 47, 2017–2024. [Google Scholar] [CrossRef] [PubMed]
- Kim, M.Y.; Jee, S.H.; Yun, J.E.; Baek, S.J.; Lee, D.C. Hemoglobin Concentration and Risk of Cardiovascular Disease in Korean Men and Women - The Korean Heart Study. Journal of Korean Medical Science 2013, 28, 1316. [Google Scholar] [CrossRef] [PubMed]
- Prabhu, S.V.; Tripathi, B.; Agarwal, Y.; Kabi, B.; Kumar, R. Association of serum calcium levels with clinical severity of ischemic stroke at the time of admission as defined by NIHSS score: A cross-sectional, observational study. Journal of Family Medicine and Primary Care 2022, 11, 6427. [Google Scholar] [CrossRef]
- Dibaba, D.T.; Xun, P.; Fly, A.D.; Bidulescu, A.; Tsinovoi, C.L.; Judd, S.E.; McClure, L.A.; Cushman, M.; Unverzagt, F.W.; He, K. Calcium Intake and Serum Calcium Level in Relation to the Risk of Ischemic Stroke: Findings from the REGARDS Study. Journal of Stroke 2019, 21, 312–323. [Google Scholar] [CrossRef]
- Rohrmann, S.; Garmo, H.; Malmström, H.; Hammar, N.; Jungner, I.; Walldius, G.; Hemelrijck, M.V. Association between serum calcium concentration and risk of incident and fatal cardiovascular disease in the prospective AMORIS study. Atherosclerosis 2016, 251, 85–93. [Google Scholar] [CrossRef] [PubMed]
- Larsson, S.C.; Burgess, S.; Michaëlsson, K. Association of Genetic Variants Related to Serum Calcium Levels With Coronary Artery Disease and Myocardial Infarction. JAMA 2017, 318, 371. [Google Scholar] [CrossRef]
- Jahangiry, L.; Farhangi, M.A.; Rezaei, F. Framingham risk score for estimation of 10-years of cardiovascular diseases risk in patients with metabolic syndrome. Journal of Health, Population and Nutrition 2017, 36, 36. [Google Scholar] [CrossRef]
- Miyamoto, Y.; Itaya, T.; Terasawa, Y.; Kohriyama, T. Association between the Suita Score and Stroke Recurrence in Patients with First-ever Ischemic Stroke: A Prospective Cohort Study. Internal Medicine 2022, 61, 7905-21. [Google Scholar] [CrossRef] [PubMed]
- Nishimura, K.; Okamura, T.; Watanabe, M.; Nakai, M.; Takegami, M.; Higashiyama, A.; Kokubo, Y.; Okayama, A.; Miyamoto, Y. Predicting Coronary Heart Disease Using Risk Factor Categories for a Japanese Urban Population, and Comparison with the Framingham Risk Score: The Suita Study. Journal of Atherosclerosis and Thrombosis 2014, 21, 784–798. [Google Scholar] [CrossRef] [PubMed]
Figure 1.
A flow chart visualizing the model development process.
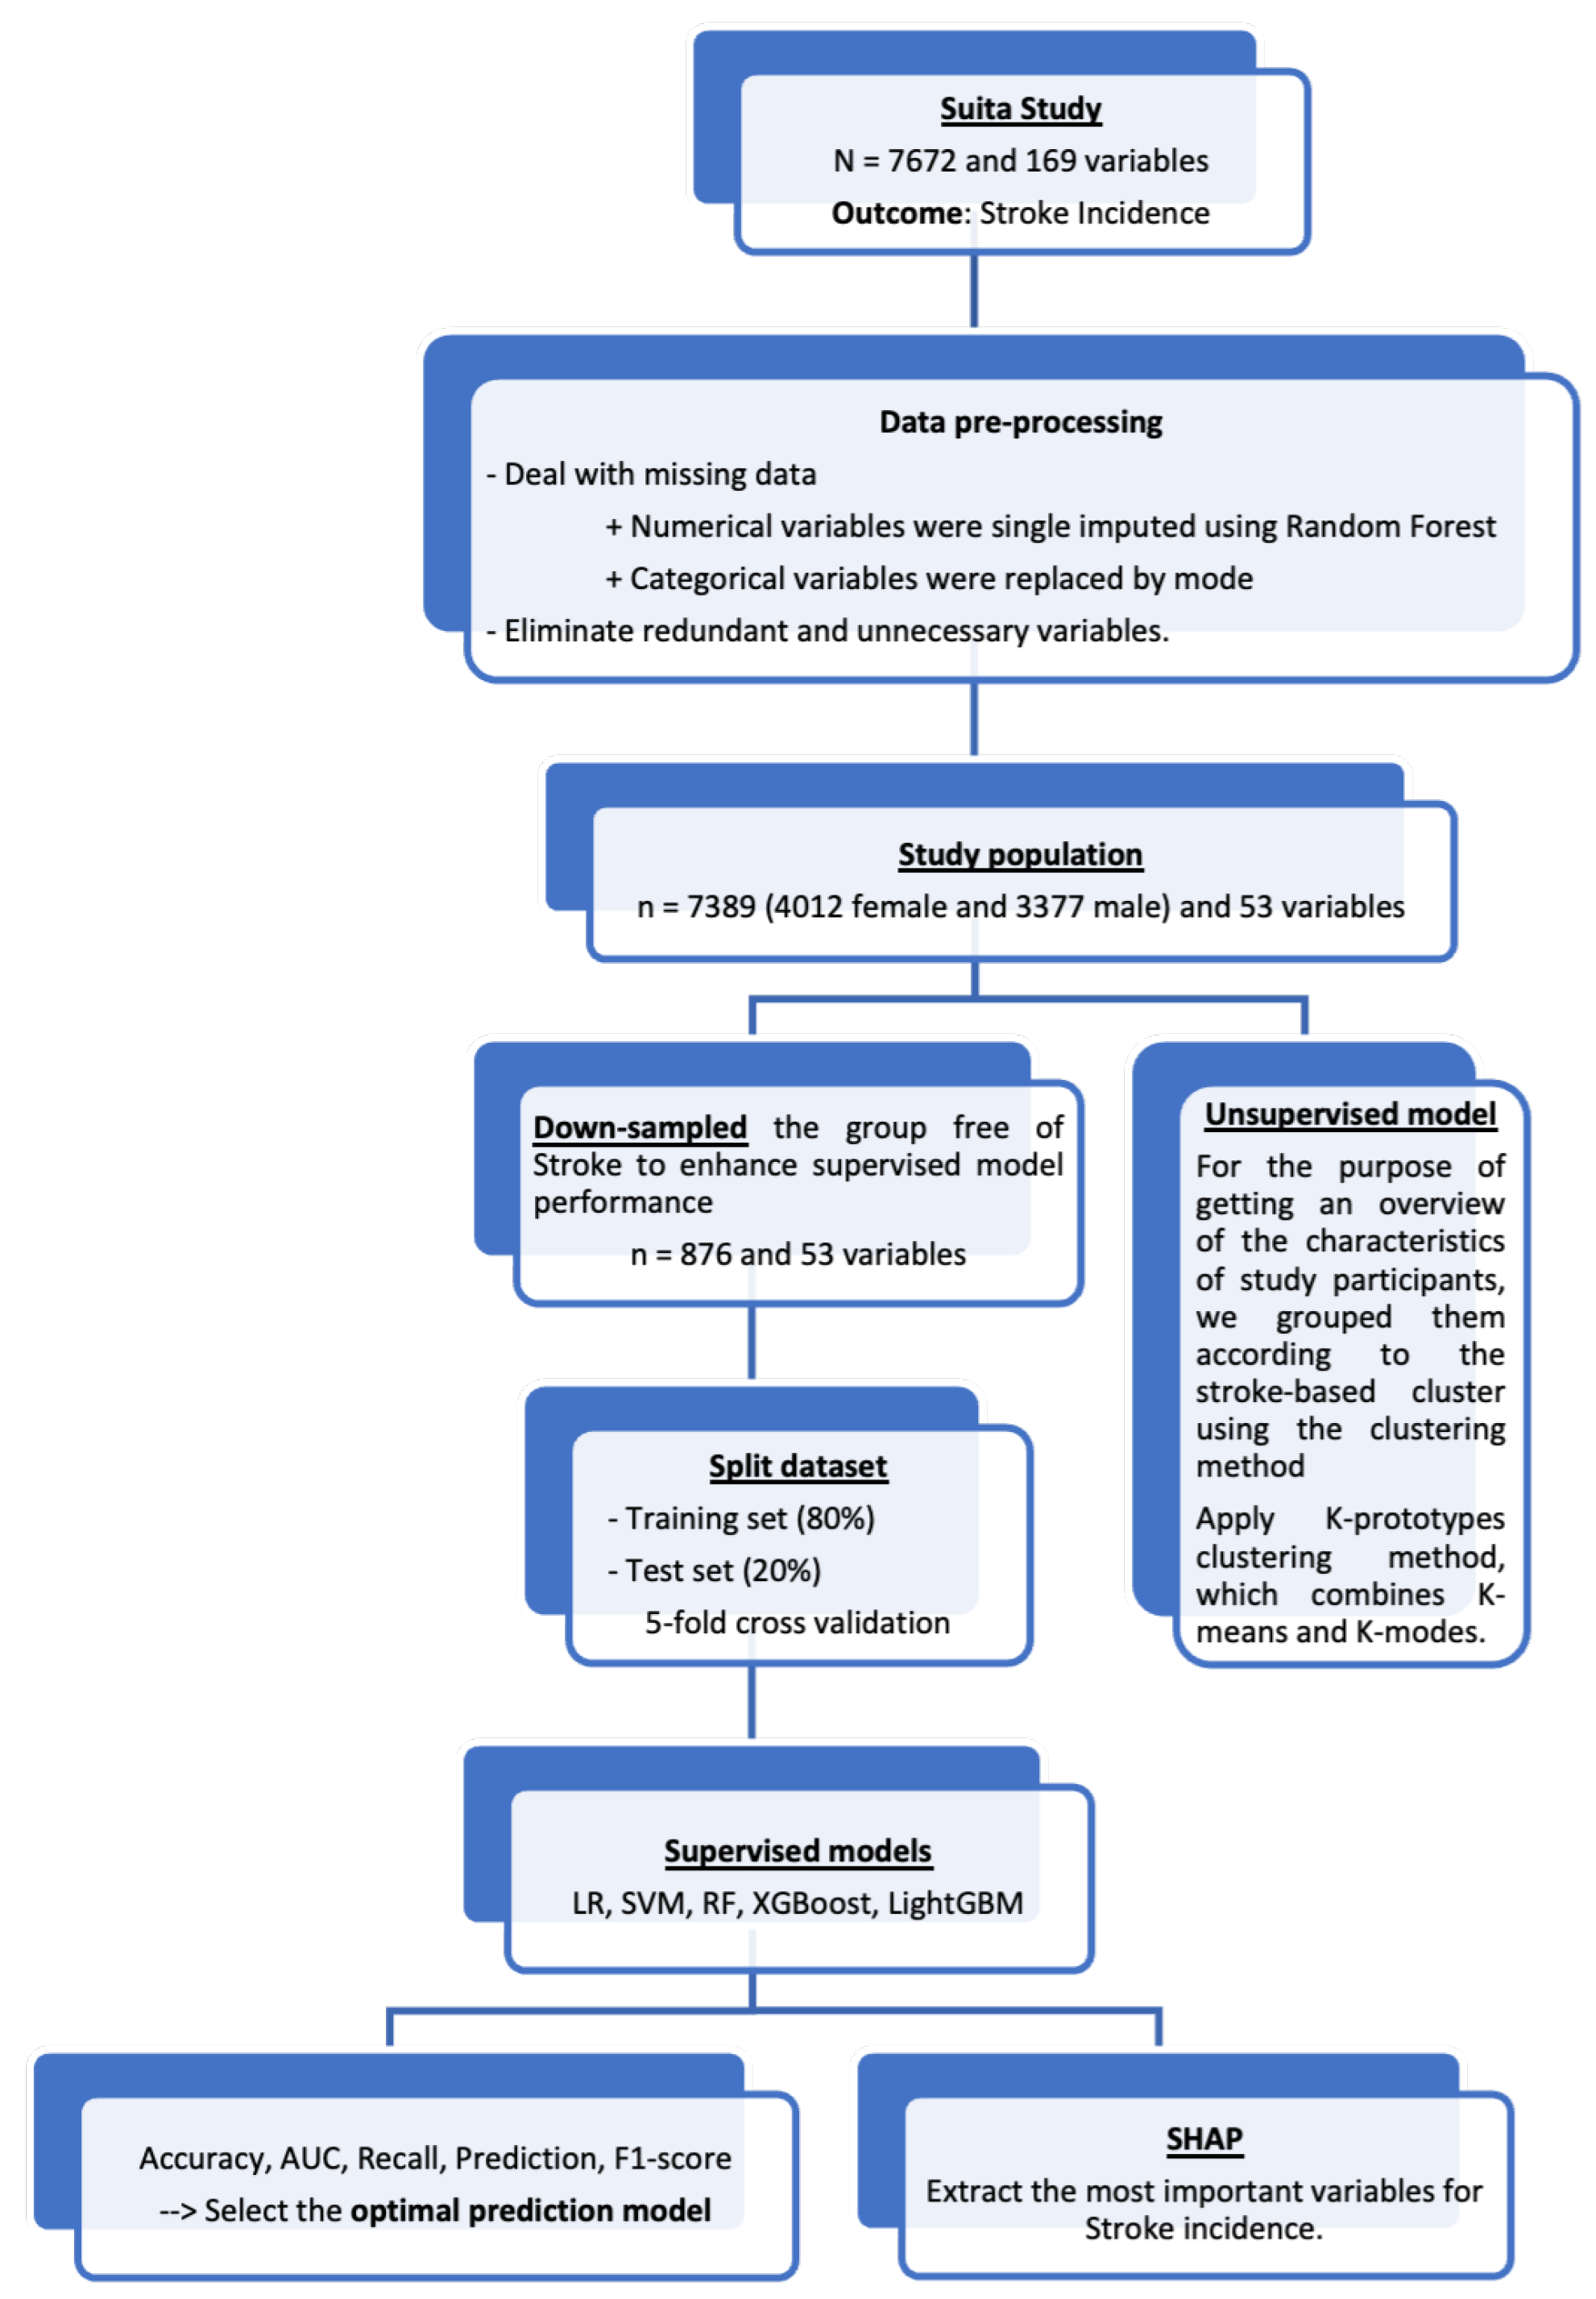
Figure 2.
(left) shows the contribution levels of these variables to Stroke incidence, with the width of the red bar representing their global importance. The SHAP value implies the degree of contribution of a specific feature (variable). The higher the SHAP value is, the larger the model contribution of a specific feature. Figure 2 (right), the heat plot of SHAP values reveals the relationships with Stroke: red indicates a positive relationship, while blue indicates a negative relationship. Abbreviations: SBP, systolic blood pressure; eGFR, estimated glomerular filtration rate; MetS, metabolic syndrome.
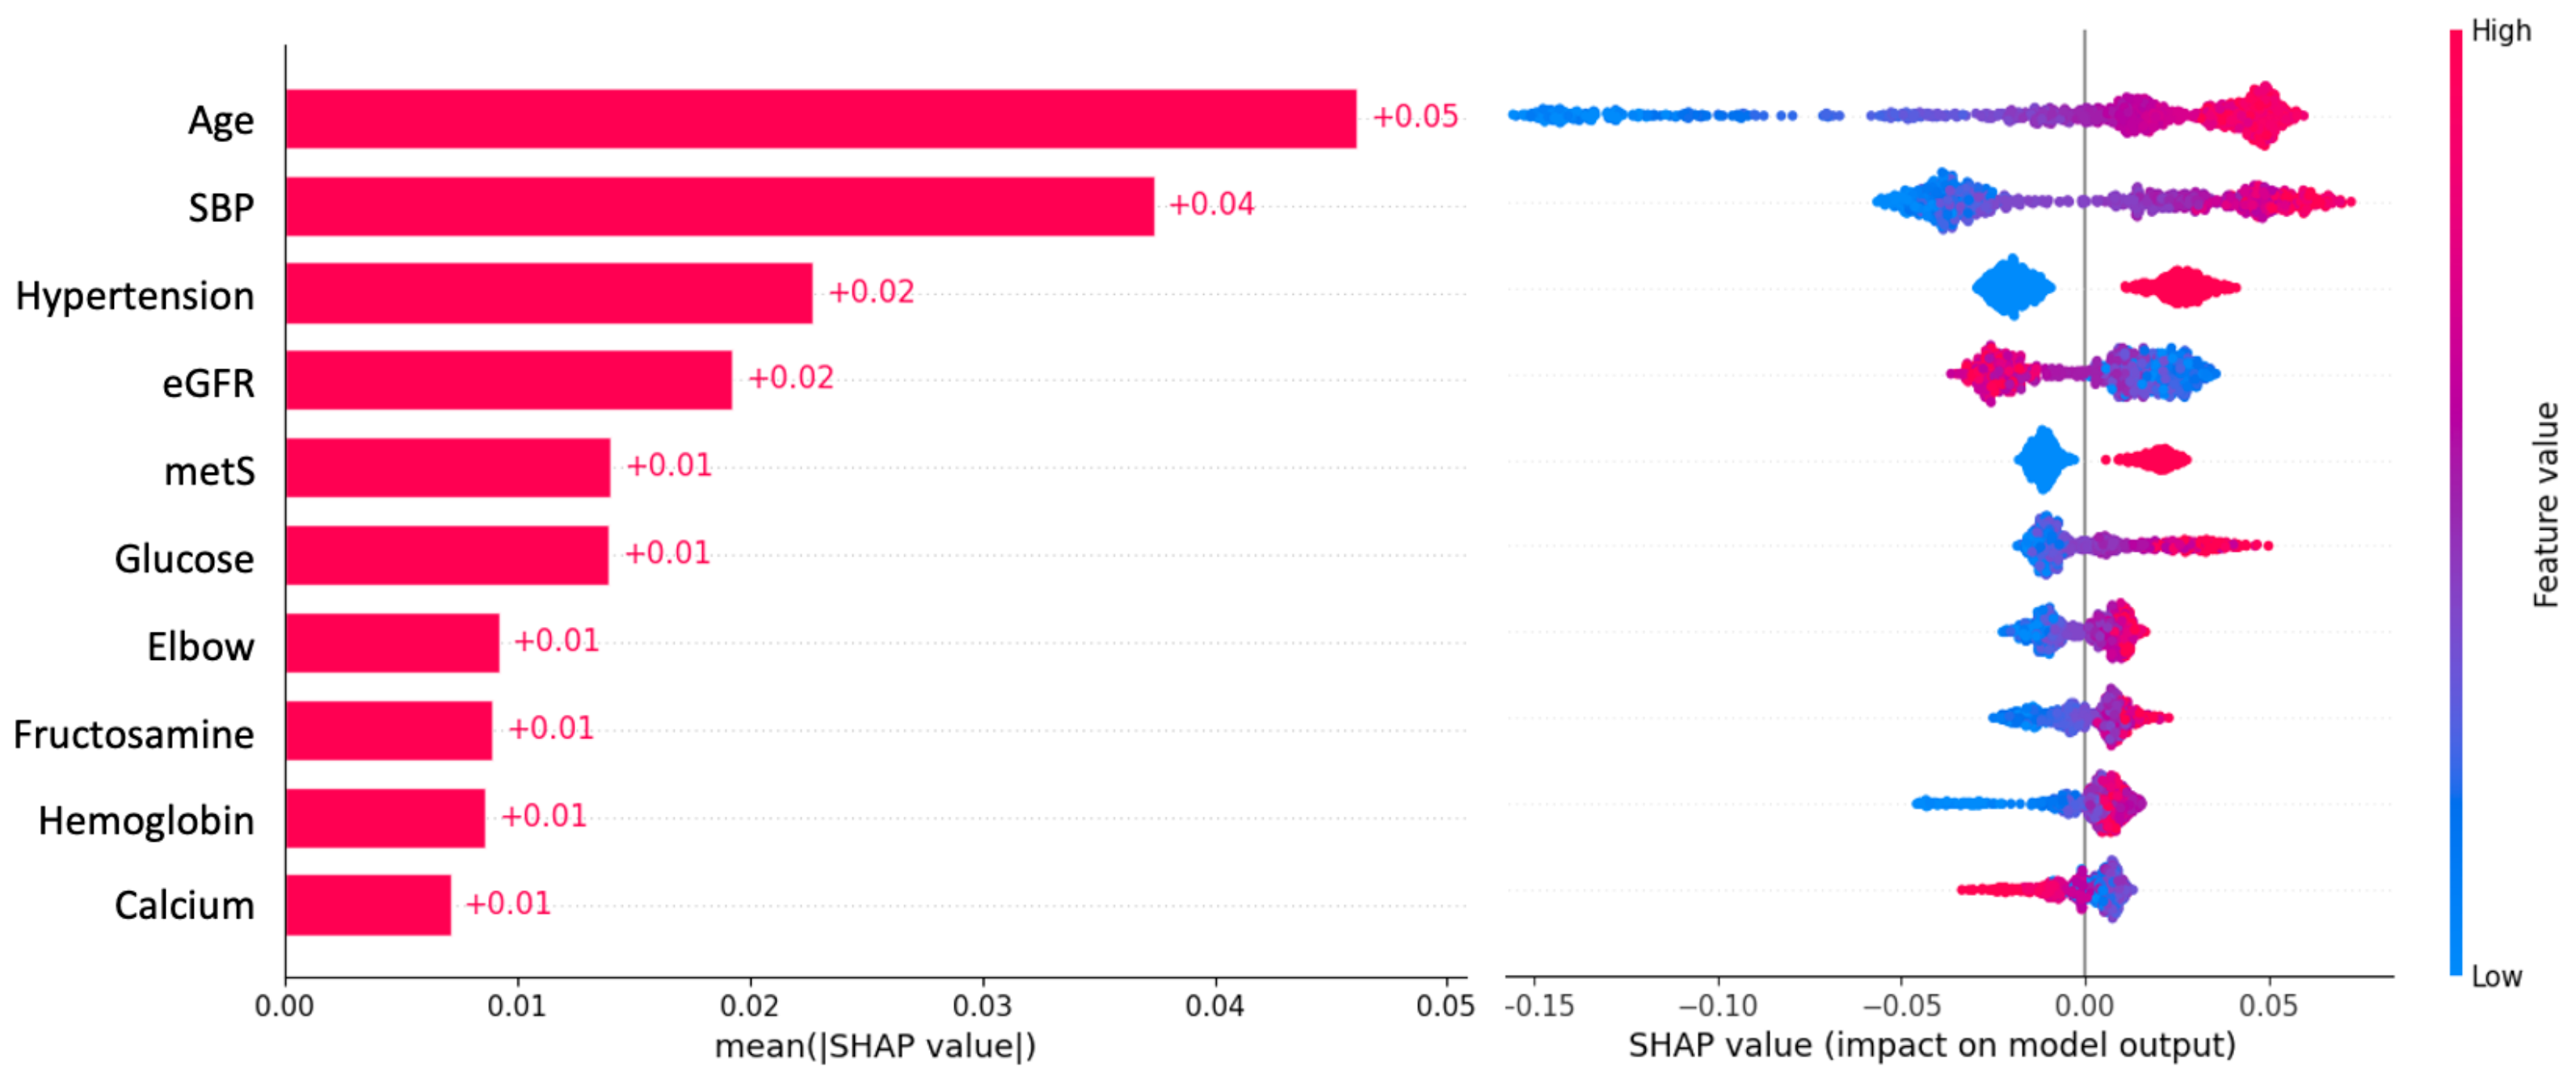
Table 1.
Characteristics of study participants with and without Stroke incidence (Healthy Japanese, Aged 30–84, Suita study at baseline).
Table 1.
Characteristics of study participants with and without Stroke incidence (Healthy Japanese, Aged 30–84, Suita study at baseline).
| Overall | Stroke incidence | |||
|---|---|---|---|---|
| No | Yes | p-value | ||
| (n = 7389) | (n = 6951, 94.1%) | (n = 438, 5.9%) | ||
| Age, Years | 56 [44, 65] | 55 [44, 65] | 66 [58, 72] | <.0001 |
| male | 3377 (45.7%) | 3143 (45.2%) | 234 (53.4%) | <.0001 |
| BMI, kg/m2 | 22.5 (3.01) | 22.5 (3.00) | 23.1 (3.21) | <.0001 |
| SBP, mmHg | 124 [110, 138] | 123 [110, 137] | 137 [122, 153] | <.0001 |
| DBP, mmHg | 77.7 (12.2) | 77.4 (12.0) | 81.2 (13.4) | <.0001 |
| Smoking, n (%) | 0.004 | |||
| Current | 2140 (29.5) | 1999 (29.2) | 141 (33.3) | |
| Past | 1162 (16.0) | 1075 (15.7) | 87 (20.5) | |
| Never | 3963 (54.5) | 3767 (55.1) | 196 (46.2) | |
| Glucose, mg/dL | 95.0 [90.0, 102.0] | 95.0 [89.0, 101.0] | 99.0 [92.0, 107.0] | <.0001 |
| Fructosamine, mol/L | 253 (22.3) | 253 (22.2) | 258 (23.7) | <0.001 |
| Elbow, mm | 6.3 (0.6) | 6.3 (0.6) | 6.4 (0.5) | 0.008 |
| Calcium, mg/dL | 9.4 (0.4) | 9.4 (0.4) | 9.3 (0.4) | 0.039 |
| Hemoglobin, g/dL | 13.9 (1.5) | 13.9 (1.5) | 14.1 (1.4) | 0.001 |
| TG, mg/dL | 99.0 [71.0, 144.0] | 98.0 [70.0, 143.0] | 112.5 [82.0, 163.8] | <.0001 |
| non-HDL-c, mg/dL | 152.6 (36.9) | 152.2 (36.9) | 158.9 (36.8) | 0.0002 |
| eGFR, mL/min/1.73 m2 | 90.0 [73.7, 104.6] | 90.3 [74.4, 104.8] | 80.0 [66.6, 95.0] | <.0001 |
| Hypertension, n (%) | 2295 (31.1) | 2054 (29.5) | 241 (55.0) | <.0001 |
| Diabetes, n (%) | 898 (12.2) | 798 (11.5) | 100 (22.8) | <.0001 |
| MetS, n (%) | 1811 (24.5) | 1630 (23.4) | 181 (41.3) | <.0001 |
Abbreviations: BMI, body mass index; SBP, systolic blood pressure; DBP, diastolic blood pressure; TG, triglycerides; non-HDL-c, non-high-density lipoprotein cholesterol; eGFR, estimated glomerular filtration rate; MetS, metabolic syndrome.
Table 2.
The characteristic of study participants across the clusters based on unsupervised learning.
Table 2.
The characteristic of study participants across the clusters based on unsupervised learning.
| Overall | Stroke Risk | ||||
|---|---|---|---|---|---|
| High | Medium | Low | p-value | ||
| (n = 7389) | (n = 1974) | (n = 2565) | (n = 2850) | ||
| Stroke incidence, n (%) | 438 (5.9) | 179 (9.1) | 169 (6.6) | 90 (3.2) | <0.001 |
| Age, Years | 56 [44, 65] | 63 [55, 71] | 55 [44, 63] | 50 [40, 62] | <0.001 |
| Gender | <0.001 | ||||
| Male, n (%) | 3377 (45.7) | 211 (10.7) | 2497 (97.3) | 669 (23.5) | |
| Female, n (%) | 4012 (54.3) | 1763 (89.3) | 68 (2.7) | 2181 (76.5) | |
| BMI, kg/m2 | 22.5 (3.0) | 24.0 (2.7) | 23.8 (2.6) | 20.3 (2.1) | <0.001 |
| Body fat, % | 23.2 (6.0) | 28.6 (5.6) | 20.6 (4.1) | 21.8 (5.3) | <0.001 |
| SBP, mmHg | 126.3 (20.8) | 138.7 (20.0) | 129.0 (19.1) | 115.4 (16.8) | <0.001 |
| DBP, mmHg | 77.6 (11.8) | 82.2 (10.8) | 81.3 (11.4) | 71.1 (9.7) | <0.001 |
| Smoking, n (%) | <0.001 | ||||
| Current | 2140 (29.0) | 194 (9.8) | 1300 (50.7) | 646 (22.7) | |
| Past | 1162 (15.7) | 157 (8.0) | 746 (29.1) | 259 (9.1) | |
| Never | 4087 (55.3) | 1623 (82.2) | 519 (20.2) | 1945 (68.2) | |
| eGFR, mL/min/1.73 m2 | 90.8 (23.7) | 86.9 (23.9) | 89.1 (22.0) | 94.9 (24.4) | <0.001 |
| Hemoglobin, g/dL | 13.9 (1.5) | 13.3 (1.1) | 15.3 (1.0) | 13.1 (1.3) | <0.001 |
| TG, mg/dL | 99 [71, 144] | 116 [87, 159.8] | 129 [91, 186] | 73 [57, 95] | <0.001 |
| non-HDL-c, mg/dL | 152.4 (36.1) | 172.2 (34.2) | 155.2 (34.2) | 136.2 (31.3) | <0.001 |
| HDL-c, mg/dL | 54.6 (14.0) | 53.3 (13.1) | 48.8 (12.5) | 60.7 (13.3) | <0.001 |
| Glucose, mg/dL | 95 [90, 101] | 97 [92, 104] | 98 [92.9, 105] | 91 [87, 96] | <0.001 |
| Fructosamine, mol/L | 253.2 (22.3) | 258.3 (23.0) | 251.9 (23.3) | 250.8 (20.4) | <0.001 |
| Elbow, mm | 6.3 (0.6) | 6.1 (0.5) | 6.8 (0.4) | 6.0 (0.5) | <0.001 |
| Calcium, mg/dL | 9.3 (0.4) | 9.5 (0.4) | 9.4 (0.4) | 9.2 (0.4) | <0.001 |
| Hypertension, n (%) | 2295 (31.1) | 1063 (53.9) | 920 (35.9) | 312 (10.9) | <0.001 |
| Diabetes, n (%) | 898 (12.2) | 334 (16.9) | 455 (17.7) | 109 (3.8) | <0.001 |
| MetS, n (%) | 1811 (24.5) | 762 (38.6) | 997 (38.9) | 52 (1.8) | <0.001 |
Abbreviations: BMI, body mass index; SBP, systolic blood pressure; DBP, diastolic blood pressure; TG, triglycerides; non-HDL-c, non-high-density lipoprotein cholesterol; eGFR, estimated glomerular filtration rate; MetS, metabolic syndrome.
Table 3.
Performance of different supervised machine learning approaches.
| Accuracy | AUC | Recall | Precision | F1-score | |
|---|---|---|---|---|---|
| LR | 0.64 | 0.68 | 0.64 | 0.64 | 0.64 |
| RF | 0.70 | 0.71 | 0.70 | 0.70 | 0.70 |
| SVM | 0.68 | 0.73 | 0.68 | 0.68 | 0.68 |
| XGBoost | 0.68 | 0.71 | 0.68 | 0.68 | 0.68 |
| LightGBM | 0.66 | 0.70 | 0.66 | 0.67 | 0.66 |
Abbreviation: AUC, Area Under the Curve; LR, Logistic Regression; RF, Random Forest; SVM, Support Vector Machine; XGBoost, eXtreme Gradient Boost; Light-GBM, Light Gradient Boosted Machine.
Disclaimer/Publisher’s Note: The statements, opinions and data contained in all publications are solely those of the individual author(s) and contributor(s) and not of MDPI and/or the editor(s). MDPI and/or the editor(s) disclaim responsibility for any injury to people or property resulting from any ideas, methods, instructions or products referred to in the content. |
© 2024 by the authors. Licensee MDPI, Basel, Switzerland. This article is an open access article distributed under the terms and conditions of the Creative Commons Attribution (CC BY) license (http://creativecommons.org/licenses/by/4.0/).
Copyright: This open access article is published under a Creative Commons CC BY 4.0 license, which permit the free download, distribution, and reuse, provided that the author and preprint are cited in any reuse.


