
Submitted:
20 January 2026
Posted:
22 January 2026
You are already at the latest version
Abstract
Pasture plants play an important role in ruminant nutrition, offering a sustainable alternative or complement to conventional concentrate feeds while potentially mitigating enteric methane emissions. This study evaluated the nutritional composition and bioactive compound content of selected terrestrial plant species from Malta to assess their suitability as plant species for goats. Representative samples of multiple species were collected and analysed for proximate composition, fibre fractions, mineral content, and antioxidant activity using near-infrared spectroscopy (NIR), the Folin Ciocalteu assay, and the 2,2-diphenyl-1-picrylhydrazyl (DPPH) assay. Methane mitigation potential was measured from chemical profiles and literature-based relationships between feed composition and rumen fermentation. Results showed considerable variation among species, with crude protein values in some forbs exceeding 25% dry matter, alongside moderate fibre content and high levels of phenolic compounds. These compositional traits suggest potential both for improving dietary protein supply and for influencing rumen microbial ecology in ways that could reduce methane emissions. However, variability in nutrient quality and bioactive content among species underscores the importance of targeted selection. The findings highlight underutilized local pasture species as promising components in sustainable goat feeding strategies, while emphasizing the need for in vivo validation of methane mitigation potential before extensive implementation.
Keywords:
ruminants
; digestibility
; forage
; wild species
; antioxidant activity
; polyphenols
; sustainability
; global warming
1. Introduction
Methane, a greenhouse gas with 22 times the global warming potential of carbon dioxide, is a significant byproduct of ruminant digestion, contributing over 5.2% of anthropogenic methane emissions [1,2]. Beyond its environmental impact, methane production in ruminants leads to dietary energy losses of 2-12%, thereby reducing feed efficiency [1]. Addressing these issues is critical for mitigating global warming and enhancing agricultural sustainability, with effective strategies such as dietary interventions and plant species playing a key role in curbing methane emissions [1].
Several EU and national policy frameworks reinforce the need to reduce nitrate and methane emissions from ruminants. The European Green Deal further emphasises the transformation of food systems to reduce their substantial contribution to greenhouse gas emissions. Enhancing feed conversion efficiency and reducing methane output from dairy ruminants align with this agenda, supporting both environmental goals and the economic sustainability of local farms. Similarly, the EU Methane Strategy highlights the urgent need to mitigate methane due to its significant short-term warming potential. This can be addressed by targeting rumen digestion pathways, optimising feed regimens, and evaluating bioactive biowaste additives that suppress methanogenic activity. Furthermore, Malta’s RIS3 Strategy 2021-2027 prioritises sustainable resource use and climate mitigation. By reducing emissions and improving farm efficiency, the outcome sustains environmental benefits while supporting long-term agricultural resilience.
Ruminant diets have a direct influence on fermentation efficiency and methane output. By optimising the nutritional composition of feed, particularly through the inclusion of higher-quality forages or targeted additives, methane emissions can be reduced while maintaining or improving animal productivity [1]. Pasture plants, particularly leguminous forages and browse species, often contain substantial crude protein (CP) and moderate fibre with high digestibility, making them valuable complements or alternatives to concentrate feeds. Higher CP and fibre digestibility improve fermentation efficiency, with each 1 kg increase in dry matter intake potentially lowering daily methane emissions by 2-6%, while better neutral detergent fibre digestibility can further reduce output [3]. Switching to improved pasture systems, such as cover crop mixtures (vetch, ryegrass, forage radish), has been shown to reduce methane emissions per animal by nearly 29% and methane yield per unit of energy intake by around 36%, compared to traditional alfalfa-fescue systems [4].
In addition to nutritional composition, many terrestrial plants are rich in phenolic compounds such as hydroxycinnamic acids, flavonoids (such as anthocyanins), and tannins, which provide antioxidant, anti-inflammatory, and antimicrobial benefits to ruminants [5,6,7]. The Folin Ciocalteu (FC) test is commonly used to estimate the total phenolic content in plant extracts, which is often linked to antioxidant activity [8]. While the test provides a rapid and effective measure of a plant’s antioxidant potential, it is not fully specific to phenolics, as other reducing agents such as ascorbic acid, sulfites, aromatic amines, and sugars may also react with the reagent and either enhance or suppress results. Phenolic compounds themselves are secondary metabolites with one or more hydroxyl (-OH) groups attached to aromatic rings, enabling them to scavenge free radicals and chelate metal ions, thereby contributing to oxidative stress defence in both plants and animals [9]. Plants often increase phenolic biosynthesis under environmental stress, such as excessive UV radiation, highlighting their role in protection and adaptation [10]
Malta’s agricultural systems are characterised by small-scale livestock production, where feed costs are high and pasture availability is limited. Despite the abundance of native and naturalised terrestrial plants, their potential as plant species, particularly for methane mitigation, remains largely untapped. Many of these species may provide both nutritional value and bioactive compounds, offering a cost-effective and sustainable strategy for local farmers. While global studies have demonstrated the methane-mitigating potential of high-quality pasture plants and phenolic-rich forages, there is limited research assessing the nutritional and bioactive properties of Malta’s terrestrial plants in the context of ruminant feeding. In particular, there is a lack of data linking their physicochemical properties to potential methane reduction benefits.
This study aims to evaluate the nutritional composition, phenolic content, and antioxidant capacity of selected terrestrial plants in Malta and to assess their potential as plant species for reducing methane emissions from ruminants. Specifically, it seeks to determine how the physicochemical properties of these plants could contribute to both improved animal health and environmental sustainability.
2. Materials and Methods
2.1. Feed Resources and Sample Preparation
Plants that are typically foraged by goats were collected to be used and tested as plant species. A total of 37 terrestrial plants were collected from various valleys around Malta, namely, Wied il-Għasel (Mosta, Malta), Wied Ħesri (Siġġiewi, Malta) and Wied Babu (Żurrieq, Malta). The collection was carried out over a one-year period (2023/2024), according to the seasonality of the plant. The list of the plant species and the proximate analysis results are shown below in Table 1. All plants were dried in an oven at 40 °C for 48 hours, then ground with a blender to pass through a 1-mm mesh sieve and stored until further testing. Methanol extracts were prepared by mixing approximately 0.5g of ground plant material, with 10ml of methanol. The samples were vortexed for 30s, ultrasonicated for 5 minutes and then transferred to a freezer at -20°C for 8 hours. The procedure was repeated prior to analysis.
2.2. Proximate Analysis
Near-infrared (NIR) spectra were obtained using a SpectraStar™ XT NIR spectrophotometer (Unity Scientific, Brookfield, WI, USA). Around 30 g of each plant species were placed in a quartz sample holder, sealed with a gold reflector, and positioned over the 1-cm diameter sample window to maintain close contact and reduce interference from light scattering. For spectral collection, each sample was rotated and scanned three times, resulting in ninety readings per sample, to improve consistency. Absorbance spectra were collected across wavelengths from 1400 to 2500 nm. Proximate analyses were conducted in triplicate on the samples. The measured parameters included dry matter (DM), crude protein (CP), ether extract (EE), neutral detergent fibre (NDF), acid detergent fibre (ADF), and total ash [11].
2.3. Inoculum Source
Ruminal fluid was obtained from the Government Abattoir from culled goats that had been maintained under controlled feeding conditions throughout lactation (commercial feed supplemented with flakes and cereals, crushed corn feed, dry goat feed) and transported from nearby farms. Samples were collected from three goats (1 L per animal), pooled, and delivered to the laboratory within 30 minutes of slaughter. Collection was carried out in vacuum-sealed flasks pre-flushed with CO₂. The rumen contents were homogenized using a sterilized blender that had also been flushed with CO₂. The homogenate was passed through sterile muslin. To allow cryopreservation at −80 °C, dimethyl sulfoxide (DMSO, 5%) was added to the rumen filtrate. The mixture was then portioned (4 mL) into sterile 15-mL centrifuge tubes pretreated with CO₂. These tubes were then placed in a −20 °C freezer in an isopropanol bath for one hour to achieve a controlled cooling rate of 1 °C per minute. Afterwards, they were transferred to a −80 °C freezer, kept at the same cooling rate in isopropanol, and finally removed from the alcohol and stored at −80 °C for the duration of the experiment [11].
2.4. In Vitro Gas Production
In vitro fermentations were carried out in 250 mL gas-tight jars fitted with a side arm and valve for gas collection. A buffered solution was prepared and maintained at 39 °C in a water bath under continuous CO₂ flushing. For each run, five jars were prepared, each containing 78 mL of buffer, 15ml of ruminal fluid and 0.5 g of randomly assigned plant material (two replicates per feed and one control). Cryopreserved ruminal fluid in DMSO was thawed in the water bath and used as inoculum, while blanks consisted only of buffer and rumen fluid. The jars were then incubated at 39 °C for 48 hr. Each feed additive was tested in triplicate, therefore, the feed additive would be added in three different jars. Furthermore, it is being confirmed that the jars positions were random, therefore avoiding any position biases.
Measurements of pH (Thermo Scientific Orion 4-Star, Thermo Fisher Scientific Inc., MA, USA) were carred out at the start and at the end of each inclubationAt time 0, CO₂ saturation and medium pH were verified by the resazurin indicator, which shifted in colour from purple to pink or colourless [11].
2.5. Methane Determinations
Methane concentration was measured at 0, 6, 24, and 48 h. A handheld infrared methane detector (EIRAA, P.R.C.) was used for the measurements. The side-arm outlet was opened, and readings were taken after 5 seconds [12].
2.6. Total Polyphenolic Content
The total phenolic content of the methanolic extracts was determined using the Folin-Ciocalteu colorimetric method, with gallic acid as the standard. A stock solution of gallic acid was prepared (960 μg/mL). Serial dilutions were then performed to obtain standard concentrations of 480, 240, 120, and 60 μg/mL, while distilled water served as the 0 μg/mL blank. The Folin-Ciocalteu reagent was prepared as a 10% (v/v) solution, and sodium carbonate was prepared as a 1 M solution.
In a 96-well microplate, 10 μL of each standard or methanolic extract was transferred in triplicate. Subsequently, 100 μL of 10% Folin-Ciocalteu reagent was added to each well, followed by 80 μL of 1 M sodium carbonate solution. The plate was incubated at room temperature in the dark for 20 minutes. Absorbance was then measured at 750 nm using a microplate reader (SpectraMAX 340PC, Molecular Devices Corporation, San Jose, CA, USA). The results were expressed as gallic acid equivalents (GAE) [13].
2.7. Antioxidant Activity
The antioxidant activity of samples was evaluated using the DPPH radical scavenging assay in a 96-well microplate format. A 0.2 M DPPH solution was prepared in methanol, and test samples were serially diluted across the plate. For each sample, wells containing sample alone (blank) and sample plus DPPH were included, alongside a DPPH control. Following the addition of DPPH, plates were covered, protected from light, and incubated at room temperature for 30 minutes. Absorbance was then measured at 517 nm using a microplate reader. Radical scavenging activity (%) was calculated relative to the control, and calibration curves were used to determine both the absolute amount of DPPH reduced and the EC₅₀ values, defined as the concentration of sample required to quench 50% of the initial DPPH radicals. All measurements were performed in triplicates.
2.8. Statistical Analysis
It should be noted that throughout the study, various data tables and figures are presented as Means and feature ± values to denote the standard deviation (SD). Statistical analyses were conducted using repeated measures ANOVA in SPSS software (version 26.0, SPSS Inc., Chicago, IL, USA). Tukey’s post-hoc test was applied to identify significant differences in methane. Methane production across time was modelled using a non-linear regression based on the first-order kinetics model described by Hashimoto [14] (Equation (1)).
In this model, BMPt (BioMethane Production) denotes the cumulative CH₄ yield (L CH₄ kg VS⁻¹) at a given time t (days), B₀ represents the maximum CH₄ yield (L CH₄ kg VS⁻¹), and k is the BMP rate constant (day⁻¹), which is substrate-dependent and reflects the time needed to reach a fraction of B₀. Principal Component Analysis (PCA) was carried out on all proximate feed parameters using XLSTAT (Microsoft, version 19.4.46756, SAS Institute Inc., Marlow, Buckinghamshire, UK) to examine correlations or differences between the plant species. A significance threshold of p < 0.05 was applied to all analyses.
3. Results
3.1. Plant Species Composition Assessment
The proximate analyses of individual plant species are presented in Table 1. The plant species varied in composition. Dry matter content ranged from 100.9±1.49% in plant number 41, known as Galactites tomentosa (Mediterranean Thistle) to 83.72 ± 1.77% in plant number 18, known as Rumex bucephalophorus (Red Dock). Ash content ranged from 17.2±0.37% in plant number 18 known as Rumex bucephalophorus (Red Dock) to 9.69% in plant number 41, known as Galactites tomentosa (Mediterranean Thistle). Crude Protein content ranged from 27.31±3.13% in plant number 68 known as Matricaria chamomilla (Scented Mayweed) to 1.157±3.01% in plant number 41 Galactites tomentosa (Mediterranean Thistle). Ether Extract content ranged from 9.457±1.16% in Galactites tomentosa (Mediterranean Thistle) to 0% in many of the plant species. NDF content ranged from 48.89 ± 0.38% in plant number 40, Asphodelus ramosus (Branched Asphodel) to 12.29 ± 4.46% in plant number 27, known as Malva sylvestris (Common Mallow). ADF content ranged from 32.55 ± 9.82% in plant number 50, known as Pallenis spinosa (Spiny Golden Star) to 9.18 ± 9.3% in plant number 28, known as Nigella damascena (Love-in-a-mist).
3.2. Folin Ciocalteu (FC) Results
From Table 2, it was observed that the plant with the lowest PolyP (% w/w) value is plant number 47, known as Prasium majus (White Hedge-Nettle) at a value of 0.074 ± 0.00, while the highest PolyP (% w/w) value is plant number 30, known as Brassica rapa subsp. sylvestris (Wild Turnip) at a value of 1.301 ± 0.03.
3.3. Methane Production
Table 3 presents methane production over the 48-hr period for all plant species.
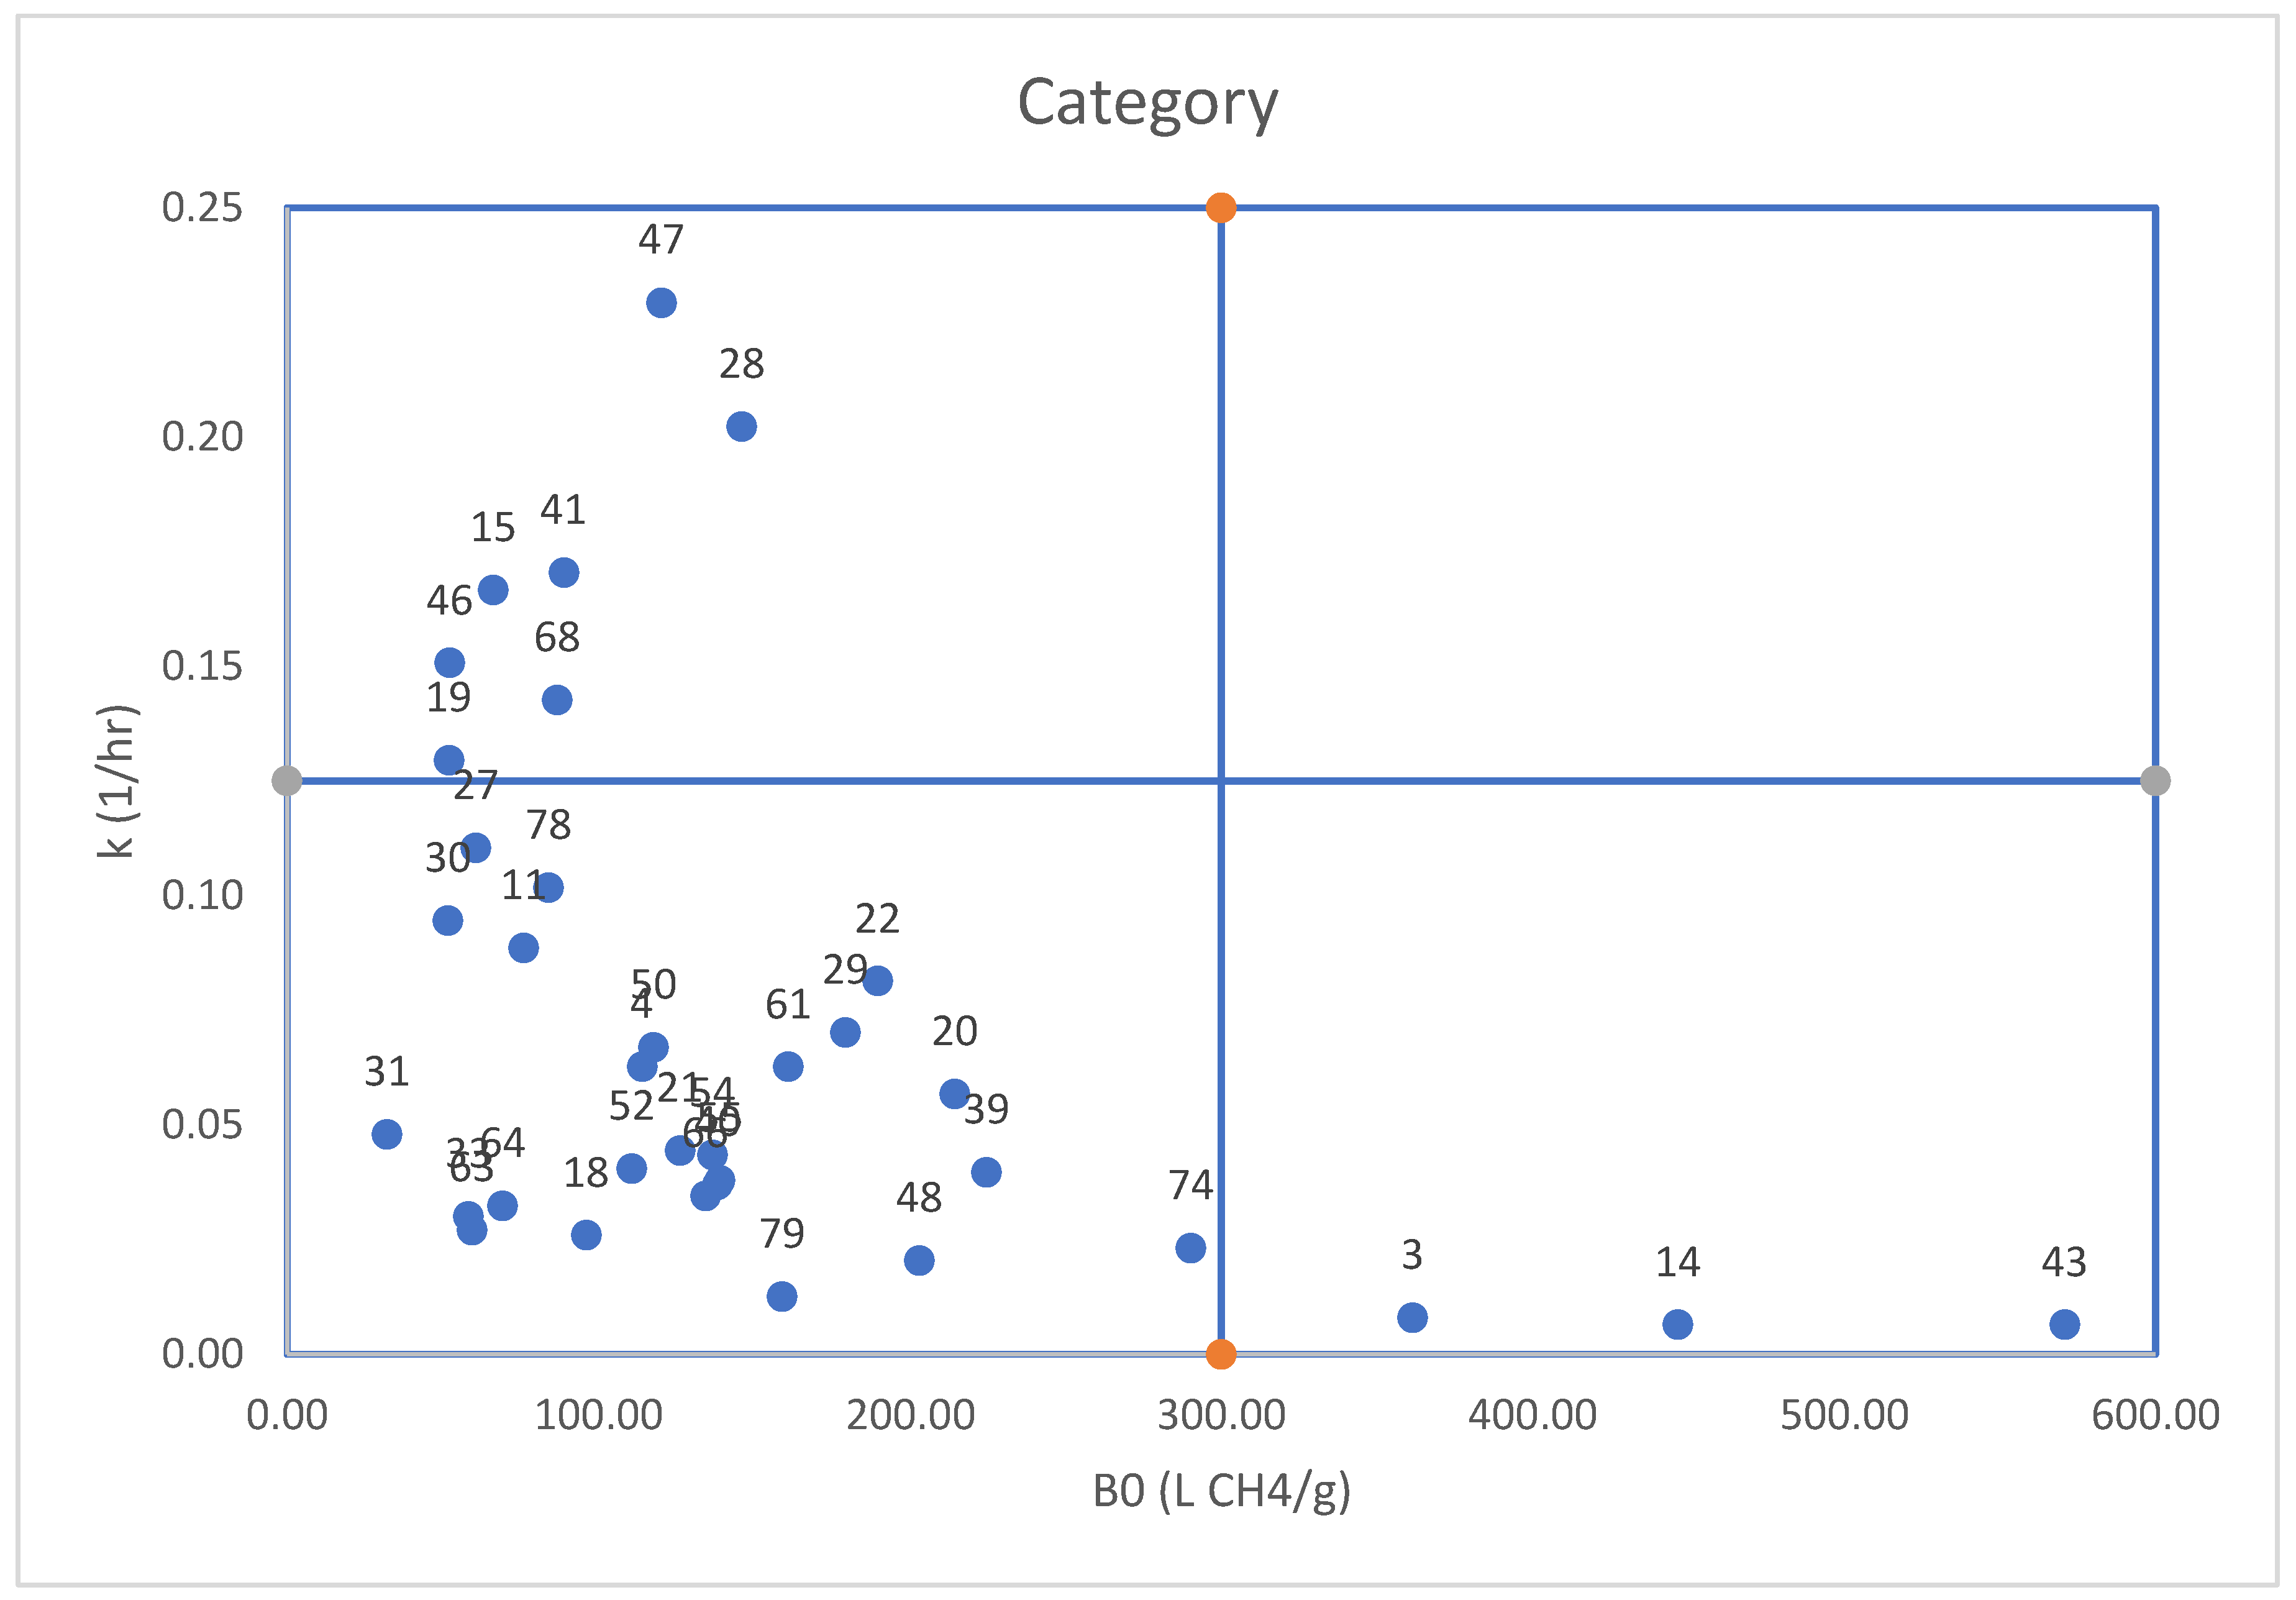
Figure 1.
The relationship between k (1/hr) and B0 (LCH4/g) for the plant species.
4. Discussion
The present study combined proximate analysis, polyphenolic content, antioxidant activity, and methane measurements to understand the nutritional and bioactive properties of the plants, allowing for stronger arguments on their potential role in methane mitigation. The nutritional composition of the studied species, particularly the balance of dry matter (DM), crude protein (CP), ether extract (EE), neutral detergent fibre (NDF), and acid detergent fibre (ADF), provides valuable insights into their suitability for ruminant diets, in the case of this study, for goats. The NIR analysis indicates diversity in the physicochemical composition of the analysed plants, with each species demonstrating unique traits that could influence both nutritional applications and their capacity to affect methane production. By measuring the quantity of light scattered off and through a material, NIR reflectance spectra provide a rapid, non-destructive method to determine these properties, avoiding the need for time-consuming and damaging alternative approaches [12].
Ash represents the inorganic portion of the plants, indicating the mineral content and the potential nutritive value of soil at the time of sample collection [15]. The high ash content in plant number 18, known as Rumex bucephalophorus (Red Dock) (83.72±1.77%) suggests these plants have a high mineral content, which could enhance their value as a nutritional supplement in livestock diets, particularly for animals requiring essential minerals for bone development, metabolic processes, and overall health [16]. However, excessive ash can dilute the nutritional value by reducing the proportion of digestible nutrients [17]. Ash content is often correlated with essential minerals. The plant family group with the lowest minimums and highest maximums was Asteraceae (As) at 9.69% and 16.39% respectively, however, the plant family with the highest mean was Xanthorrhoeaceae (Xa) at 15.46%. It should be noted that ANOVA did not reveal any statistically significant differences between the plant families for Ash.
Comparable findings on ash content across plant families have been reported in the literature. For instance, researchers analysed three Asteraceae (As) species and observed ash values generally ranging from ~5.7-11.8% DM depending on plant part, notably narrower and somewhat lower than the wider Asteraceae range observed here (9.69-16.39%) [18]. In contrast, studies on Aloe (family Asphodelaceae, formerly Xanthorrhoeaceae) frequently report higher ash contents, with Haque and Islam documenting values around 19.5% DM, consistent with the elevated mean (15.46%) for this family in the present dataset [19]. Despite these differences in group means, ANOVA in the current study did not detect significant variation between families. This outcome is consistent with previous reports that factors such as growing season or plant part can dominate variance in ash content, often overshadowing taxonomic grouping [20,21]. Moreover, even within a single family such as Aloe, substantial intra-family variation in mineral composition has been demonstrated using ANOVA, reinforcing that taxonomic level alone may not fully explain observed ash patterns [22].
The dry matter (DM) content of the plants ranged from 100.9±1.49% in plant number 41, known as Galactites tomentosa (Mediterranean Thistle) to 83.72 ± 1.77% in plant number 18, known as Rumex bucephalophorus (Red Dock). High DM values, reflect low water content, which improves storage stability, reduces spoilage risk, and increases nutrient density [21]. These traits make such species particularly suitable for incorporation into dried feed or herbal formulations and for long-term preservation in regions where feed storage is essential [21]. Conversely, species with lower DM content contain more moisture, making them less ideal for long-term storage but potentially advantageous for fresh feeding, where higher water content can enhance palatability and hydration. The plant family group with the lowest minimums was Ranunculaceae (Ra) at 83.85% while the plant family with the highest maximums was Asteraceae (As) at 100%. It should be noted that ANOVA did not reveal any statistically significant differences between the plant families for DM.
Comparable screening efforts have also examined dry matter variability across diverse plant families. For instance, another research paper evaluated 156 species from 35 botanical families and reported substantial interspecific variation in chemical composition, including dry matter, yet family level differences were not consistently significant when subjected to statistical testing [23]. Their findings mirror the present study, where although Caprifoliaceae exhibited the lowest dry matter minimums (70.64%) and Asteraceae reached the highest maximums (100%), ANOVA analysis did not indicate significant family-level effects. This convergence suggests that dry matter content may be more strongly influenced by species- or environment-specific factors than by family membership [23]
Protein is essential for growth, reproduction, lactation and metabolic functions, making these plants valuable for supplementing protein-deficient diets in ruminants [24,25]. Analysis of the dataset indicates that their nutritional composition could be particularly useful in optimizing livestock feed, especially for dairy production. In this context, high protein content in rations is crucial during early lactation, as it supports increased feed intake and enhances animal performance by meeting the elevated metabolic demands of milk production [25]. Plants such as sample number 63, known as Urtica pilulifera (Roman Nettle) and sample number 79, known as Diplotaxis erucoides (White Wall Rocket), with crude protein (CP) values exceeding 25%, could be well-suited for such dietary needs. These species could play a key role in enhancing milk yield and overall productivity during critical lactation periods. Furthermore, testing shows that the plant family with the highest maximum CP levels are the Caprifoliaceae (Ca) group at 33.11%. Conversely, the plant family with the lowest minimum amount of CP were the Boraginaceae (Bo) at 20.68% which is still relatively high. The group with the highest mean amount was the Lamiaceae (La) at 29.33%. This indicates that it is an ideal compromise to use the La family when choosing plant species for CP since the family is only slightly less rich in CP than the Ca group. However, it is important to note that CP includes both true protein and non-protein nitrogen. The presence of non-protein nitrogen, such as urea and ammonia, may affect the availability of amino acids, which are critical for tissue building and repair [26]. It should be noted that ANOVA did not reveal any statistically significant differences between the plant families for CP.
Several large-scale syntheses and experimental studies show that crude protein (CP) in forage is highly variable at the species and functional-group level, with legumes tending to have substantially higher CP than grasses or herbs and observed CP values across studies spanning roughly 2-36% [27]. Studies that sample many species in the field commonly find significant inter-specific differences in CP but much weaker or non-consistent effects once data are aggregated to higher taxonomic levels (e.g. families), a pattern that can arise when within-family variation and limited sample sizes reduce ANOVA power [28]. In other words, a family (e.g. Lamiaceae) can show a high mean or a high single-species maximum in one dataset while family-level tests remain non-significant because species-level and environmental variation dominate [29]. Finally, targeted studies of Lamiaceae herbs and rangeland medicinal species report substantial species-to-species differences and generally moderate CP (for some sampled Lamiaceae in the literature CP ≈ 8-12% DM), underscoring that treating “La” as a broadly high-protein family is dataset-dependent and should be justified by the species composition.
Ether extract (EE) primarily measures the crude fat content, which includes fats, waxes, and other lipid compounds [30]. The EE values across the species were relatively low, sample number 41, known as, Galactites tomentosa (Mediterranean Thistle) having the highest EE (9.457 ± 1.16%). While these levels indicate limited lipid content, the EE can still provide a small source of energy [30]. Furthermore, the EE levels are within the typical range for forage species, which usually contain 2-3% fats [31]. The low EE values also suggest that these plants are not ideal for applications requiring significant lipid content but may still contribute minor essential fatty acids, depending on their lipid profiles [32]. For example, sample 22, known as Sonchus asper (Prickly Sow-Thistle) and sample number 15, known as Plantago lagopus (Mediterranean Plantain), with EE values of 2.443±0.79% and 2.947±0.42%, respectively, could offer small amounts of these nutrients [32]. It is worth noting that excessive fat in feed can reduce palatability and disrupt digestion, a concern that is not relevant to these species given their low EE levels. The plant family group with the lowest amount of EE were the Urticaceae (Ur) showing negligible amounts of EE, in fact, almost all plant samples showed poor EE amounts. However, the Asteraceae (As) family did show relatively high amounts of EE with the highest value of 9.457±1.16 coming from sample number 41 known as Galactites tomentosa (Mediterranean Thistle). Conversely, the plant family with the highest mean amount was the Geraniaceae (Ge) at 4.19%, indicating that it would be the most suitable plant family to use if the goal was to increase fat. Although one Urticaceae (Ur) sample recorded the lowest EE value in the dataset (0.2467±0.22), the family’s overall mean remained relatively high (4.15%) due to another species, Urtica pilulifera (sample 63), which exhibited the second highest individual EE value at 8.05±1.27%. Furthermore, the incorporation of plants with moderate EE could contribute to methane reduction. Lipids have been shown to suppress methanogenesis by reducing protozoa populations and altering fermentation pathways [33]. It should be noted that ANOVA did not reveal any statistically significant differences between the plant families for EE.
Fibre, measured through neutral detergent fibre (NDF) and acid detergent fibre (ADF), is a critical component of ruminant diets, supporting rumination, gut health, and rumen stability. While milk fat content generally remains stable across both high- and low-fibre diets, higher fibre levels are still beneficial for maintaining digestive function [34,35]. High fibre plants may be less digestible but can be beneficial for ruminants requiring high-fibre diets. Conversely lower fibre content plants offer greater digestibility. Methane emissions in ruminants are primarily influenced by dietary composition, high-fibre diets with excessive NDF and ADF can increase methane production due to slower fermentation and prolonged rumen retention times [36]. In contrast, diets with balanced fibre and protein levels can improve feed efficiency and reduce methane emissions.
The plants analysed in this study showed wide variation in fibre content, with NDF values ranging from 10.38% in Asphodelus fistulosus (Onion Weed) to 54.84% in Avena barbata (Barbed Oat). Higher NDF, as found in Avena barbata (54.84%) and Rumex bucephalophorus (Red Dock, 51.85%), reflects greater structural carbohydrate content, which enhances rumen activity and gastrointestinal health, though excessive levels can limit dry matter intake and energy availability [37]. The plant family group with the lowest minimums was Xanthorrhoeaceae (Xa) at 11.69%, while the Asteraceae (As) plant family had the highest maximum at 48.89%. Furthermore, the plant family with the highest mean amount was the Apiaceae (Ap) at 32.37%. It should be noted that ANOVA did not reveal any statistically significant differences between the plant families for NDF.
ADF values, representing the less digestible fractions such as lignin and cellulose, ranged from 14.24% in Asphodelus fistulosus to 39.14% in Lonicera implexa (Evergreen Honeysuckle). Lower ADF values are linked with greater digestibility and energy availability, making Asphodelus fistulosus a particularly efficient feed source. In contrast, species with high ADF, such as Lonicera implexa, provide less digestible energy and are more suitable for maintenance diets, while plants with moderate ADF, such as Erica multiflora (Mediterranean Heath, 24.3%) and Urtica pilulifera (Roman Nettle, 24.28%), may serve as supplementary fibre sources. The plant family group with the lowest minimums was Caprifoliaceae (Ca) at 13.04%, while the Asteraceae (As) plant family had the highest maximum at 32.55%. Furthermore, the plant family with the highest mean amount was the Apiaceae (Ap) at 25.49% It should be noted that ANOVA did not reveal any statistically significant differences between the plant families for ADF.
To optimize dairy goat performance, a strategic balance of high-protein and high-fibre plants is recommended, tailored to the lactation stage [38]. This approach can ensure adequate milk production, sustain animal health, and potentially improve the quality of dairy products, particularly milk fat content [38]. To this end, the energy levels of each plant family were also analysed. The Asteraceae (AS) group was shown to have the lowest minimums at 337.8 kcal/100g, however, it also had the highest maximums at 408.5 kcal/100g. The plant family with the highest mean value was the Boraginaceae (Bo) family at 356.0 kcal/100g, indicating that it is more suitable for reliable energy levels if the plant species consisted of a mixture of different plant materials belonging to the same family. Nevertheless, ANOVA showed that there was not a statistically significant difference between any of the plant family groups.
Despite its non-specificity, the FC assay remains a popular, robust, and reproducible method for estimating the antioxidant capacity of phenolic-rich samples. As shown in Table 2, the plant family with the highest mean FC was the Iridaceae (Ir) family with a value of 0.68 mg GAE/g with the plant Oxalis pes-caprae (Bermuda Buttercup), belonging to the Oxalidaceae (Ox) family being the highest performer with a value of 1.92 mg GAE/g. This elevated phenolic content indicates a strong antioxidant capacity, which can contribute to reducing oxidative stress in ruminants and may also offer antimicrobial and anti-inflammatory benefits. Such properties are advantageous in the context of feed supplementation for goats, as they may help improve animal health and potentially modulate rumen fermentation in ways that reduce methane production. However, it is important to balance inclusion levels, since excessive phenolics, particularly tannins, can also affect feed intake and nutrient digestibility.
Plant species from Solanaceae (So) plant family displayed the lowest mean value of 0.074 mg GAE/g while the plant species with the lowest amount of polyphenols was the Lonicera implexa (Evergreen Honeysuckle) belonging to the Caprifoliaceae (Ca) family at a value of 0.0220 mg GAE/g, suggesting a limited concentration of phenolic compounds. This indicates a reduced antioxidant contribution compared with other species, meaning their direct impact on oxidative stress and microbial activity in the rumen may be less pronounced. Nonetheless, such plants may still serve as suitable plant species for goats, especially when phenolic load needs to be moderated to avoid negative effects on palatability or digestibility. Their value may therefore lie in a more neutral nutritional base that complements other high-phenolic forages or additives.
These results can have biological relevance for methane mitigation. Polyphenols are known to modulate rumen fermentation, inhibiting protozoa and methanogens, thereby reducing enteric methane emissions [39]. For instance, the product Polygain™, rich in sugarcane polyphenols, reduced methane emissions by ~24 % in dairy cattle when supplemented at 0.25 % of feed dry matter [40]. From these results, certain implications can be ascertained. Goats fed high-phenolic forage or concentrate exhibited improved milk phenolic content and antioxidant status, indicating rumen transfer of phenolics [41]. Given that goats share similar rumen physiology with cattle, Oxalis or Erica-rich diets may likewise enhance ruminal antioxidant capacity and reduce methane. Similar outcomes with plant extracts suggest that higher phenolic concentrations, correlate with potential methane mitigation effects.
Table 2 also shows the IC50 values determined through DPPH testing. The IC₅₀ values obtained from the DPPH radical scavenging assay showed considerable variation among the analysed species, ranging from 0.37 ± 0.09 mg/ml in 18-Po (Rumex bucephalophorus) to 55.9 ± 5.73 mg/ml in 33-Fu (Fumaria capreolata). Given that lower IC₅₀ values denote stronger antioxidant capacity, these results indicate that the antioxidant potential varied markedly across the studied taxa. The mean IC₅₀ across all species was approximately 6.84 mg/ml.
The lowest IC₅₀ value, observed in 18-Po (Rumex bucephalophorus), highlights this species as possessing the highest free radical scavenging efficiency among the samples tested. This suggests the presence of highly potent antioxidant constituents, possibly polyphenolic or flavonoid compounds, capable of effectively donating hydrogen atoms or electrons to neutralize DPPH radicals. Comparable low values were also recorded in 66-As (Centaurea nicaeensis, 0.433 ± 0.09 mg/ml) and 44-La (Teucrium fruticans, 0.633 ± 0.09 mg/ml), both of which demonstrate similarly high radical-scavenging capacities.
Conversely, 33-Fu (Fumaria capreolata) exhibited the highest IC₅₀ value (55.9 ± 5.73 mg/ml), indicating markedly weaker antioxidant activity. Such a result may be attributed to a lower concentration or reduced reactivity of phenolic compounds within its extract. A secondary cluster of relatively high IC₅₀ values was observed for 20-As (Calendula arvensis, 22.7 ± 2.17 mg/ml) and 36-Ir (Gladiolus italicus, 11.5 ± 2.33 mg/ml), suggesting limited DPPH radical scavenging capacity compared to the more active species.
Overall, the broad range of IC₅₀ values reflects significant interspecific variability in antioxidant potential among the examined taxa. The particularly low IC₅₀ values of 18-Po, 66-As, and 44-La highlight these species as promising candidates for further phytochemical and mechanistic analyses aimed at identifying the specific bioactive compounds responsible for their potent radical-scavenging activities.
In this research, fermentation trials were carried out to evaluate methane generation during ruminal digestion in goats. It is well established that the composition of feed rations influences the microbial communities present in ruminal fluid [42]. To explore this, the nutritional characteristics of each plant species were assessed individually to determine which factors might impact the fermentation process. Substrate type, retention time in the rumen, and overall feeding efficiency are among the key drivers of methane output [43].
As shown in Table 3 plant species were tested, each displaying unique methane production profiles at 6, 24, and 48 hours, highlighting differences in their temporal dynamics. The Hashimoto first-order kinetic model was applied, in which B0 (L CH4/g) denotes the maximum methane yield obtainable per gram of substrate, while k (1/h) reflects the degradation rate and conversion speed of the substrate to methane [44]. The results enabled the classification of the tested plant species into four categories, as summarized in Table 4. The thresholds used for this classification were: B0 values of ≥117.77 L CH4/g considered high and <117.77L CH4/g considered moderate, while k values of ≥ 0.0567 1/h were categorized as high, and < 0.0567 1/h as low to moderate.
B0 represents the highest possible methane yield from a substrate when given adequate time for complete degradation under optimal conditions. A large B0 value, such as 571 L CH4/g for Foeniculum vulgare subsp. vulgare (fennel), suggests that the substrate has strong methane-generating potential, likely due to its richness in organic matter that can be efficiently converted into biogas. On the other hand, Asphodelus ramosus (branched asphodel) or Avena barbata (Barbed Oat), break down more quickly as indicated by their elevated k values, but yield less methane overall. This lower potential may stem from a reduced amount of degradable organic matter or from chemical characteristics that restrict methane release, particularly in their dried form as shown through similar studies [45].
The k parameter further describes how quickly a substrate is decomposed into methane. A high k (e.g., 10.71 1/h for Asphodelus ramosus) signals rapid degradation and conversion, whereas a low k (e.g., 0.01 1/h for Foeniculum vulgare) reflects a much slower process that requires extended digestion time to reach its full methane output. This delayed breakdown often relates to structural complexity or a high lignin content, as seen in fennel, which resists microbial breakdown.
When selecting additives, both substrate type and digestion rate should be considered. To limit methane emissions, it is preferable to reduce the inclusion of plant species with high B0 values. However, degradation speed (k) is also a decisive factor, since it influences how efficiently and how quickly methane is released. Certain plant species (e.g., no. 43, 14, and 3) show high B0 but low k values, making them less suitable for goat diets aimed at methane mitigation. Conversely, additives such as no. 18, 20, 31, 33, 52, 63, and 64 demonstrated moderate B0 values coupled with low k rates, highlighting their potential role in designing low emission feeding strategies.
Principal Component Analysis (PCA) and Agglomerative Hierarchical Clustering (AHC) were carried out to determine how the plant species are related to each other. PCA revealed two principal components contributing to 43.22 % of the whole variance. Factor 1 is mainly based on energy, ADF, dry matter and fat content, i.e. the nutritional dense parameters, whereas Factor 2 is based on NDF, polyphenols, antioxidant activity, i.e. the soluble carbohydrates and phenolics group. Figure 2 revealed clear grouping tendencies among samples, with energy-dense, fibrous materials positioned on the right side of the plot, and protein- and mineral-rich samples on the left. Samples located in the upper region of the plot were characterized by higher levels of polyphenols and antioxidant potential. Overall, the PCA distinguished the samples according to their nutritional quality and bioactive composition, highlighting trade-offs between energy fibre content and protein antioxidant characteristics. AHC was carried out to determine any clustering via a dendrogram representation (Figure 3). Four clusters were revealed which superimpose those groups within the PCA, illustrated also as cluster labels C1 to C4 in Figure 2. These clusters are based on the nutritional-functional characteristics of the plant species. There is no taxonomic distinction between the species. Certain families, like Asteraceae, occur across the four clusters. Cluster C1 species are generally balanced, moderately digestible, and bioactive species. These include Erodium malacoides (Geraniaceae), Scorpiurus muricatus (Fabaceae) and Trifolium nigrescens (Leguminosae) amongst others. These are considered as balanced forages. Cluster C2 include highly digestible, moderate antioxidant species such as Borago officinalis (Boraginaceae). These are ideal for forage and feed applications, where digestibility is important. Cluster C3 is composed of high-protein, low-antioxidant forages, such as Lotus, Medicago, Trifolium nigrescens (Leguminosae) and Plantago lagopus (Plantaginaceae) amongst others. These are considered as forage legumes. Cluster C4 is the antioxidant-rich, low digestibility group, such as Convolvulus elegantissimus (Convolvulaceae), Bituminaria bituminosa (Leguminosae) and other fibrous species. These are ideal for their nutraceutical potential.
5. Conclusions
Among the additives examined, several species stand out due to their combined nutritional composition, antioxidant capacity, and methane-mitigation potential. Notably, Rumex bucephalophorus (18-Po) demonstrated particularly interesting characteristics, showing the highest ash content (83.72 ± 1.77%), which suggests high mineral availability, alongside one of the lowest IC₅₀ values (0.367 ± 0.09 mg/ml), indicating strong antioxidant activity. This dual profile, rich in minerals and potent in radical scavenging, suggests a capacity to enhance both the nutritional and oxidative balance in ruminant diets, potentially modulating rumen microbial populations and lowering methane output. Similarly, Urtica pilulifera (63-Ur) combined high crude protein (25%+) and relatively elevated ether extract (8.05 ± 1.27%), properties that support efficient digestion and may suppress methanogenesis through lipid-mediated inhibition of protozoa. In addition, Teucrium fruticans (44-La) and Centaurea nicaeensis (66-As) exhibited notably low IC₅₀ values (0.633 ± 0.09 mg/ml and 0.433 ± 0.09 mg/ml, respectively), reinforcing their high antioxidant capacity, while Oxalis pes-caprae (49-Ox) showed the highest polyphenolic content (1.920 mg GAE/g), suggesting exceptional polyphenolic content. When considered alongside the methane fermentation results, species such as Rumex bucephalophorus (18-Po) and Urtica pilulifera (63-Ur) emerge as particularly promising candidates: both displayed moderate methane potential (B₀) and low degradation rates (k), which may translate into reduced methane release during digestion. Taken together, these findings indicate that plants like Rumex bucephalophorus, Urtica pilulifera, Teucrium fruticans, and Oxalis pes-caprae are of special interest, combining favourable nutritional profiles, strong antioxidant properties, and desirable methane-reducing characteristics, making them prime targets for further evaluation as functional plant species in goat nutrition. Although these species may be considered as forage pasture for ruminants, they may also be used as part of a ration to balance out the nutritional value of the feed composition.
As this investigation was conducted under in vitro conditions, the findings should be interpreted within the limitations of a laboratory-based study. While the results provide useful indications of the potential effects of the tested compounds on ruminal fermentation processes, they do not allow for definitive conclusions regarding animal performance, health, or productivity. Consequently, any implications for outcomes such as milk yield or physiological responses in goats remain speculative. The observed effects may potentially contribute to improved performance under in vivo conditions; however, confirmation through controlled feeding trials is required before such effects can be substantiated.
Author Contributions
Conceptualization, J.B. and E.A.; methodology, J.B., E.S. and E.A.; validation, J.B., E.S. and E.A.; formal analysis, J.B.; investigation, J.B. and E.A.; resources, E.A.; data curation, E.S. and E.A.; writing—original draft preparation, J.B. and E.A.; writing—review and editing, E.S.; supervision, E.A.; funding acquisition, J.B. All authors have read and agreed to the published version of the manuscript.
Funding
The research work disclosed in this publication is funded by the Tertiary Education Scholarship Scheme.
Institutional Review Board Statement
Not applicable
Informed Consent Statement
Not applicable.
Data Availability Statement
Data is contained within the article. No voucher specimens were deposited in a formal collection. The material has been preserved and is available upon request.
Conflicts of Interest
The authors declare no conflicts of interest
References
- Ma, G.; Jing, W.; Zhang, Y.; Gai, Y.; Tang, W.; Guo, L.; Azzaz, H.H.; Ghaffari, M.H.; Gu, Z.; Mao, S.; Chen, Y. A meta-analysis of dietary inhibitors for reducing methane emissions via modulating rumen microbiota in ruminants. J. Nutr. 2024. [Google Scholar] [CrossRef]
- Moumen, A.; Azizi, G.; Chekroun, K.B.; Baghour, M. The effects of livestock methane emission on global warming: A review. Int. J. Glob. Warm. 2016, 9, 229–253. [Google Scholar] [CrossRef]
- Jayasinghe, P.; Ramilan, T.; Donaghy, D.J.; Pembleton, K.G.; Barber, D.G. Comparison of nutritive values of tropical pasture species grown in different environments and implications for livestock methane production: A meta-analysis. Animals 2022, 12, 1806. [Google Scholar] [CrossRef]
- Gere, J.I.; Restovich, S.B.; Mattera, J.; Cattoni, M.I.; Ortiz-Chura, A.; Posse, G.; Cerón-Cucchi, M.E. Enteric methane emission from cattle grazing systems with cover crops and legume–grass pasture. Animals 2024, 14, 3535. [Google Scholar] [CrossRef] [PubMed]
- Dangles, O. Antioxidant activity of plant phenols: Chemical mechanisms and biological significance. Curr. Org. Chem. 2012, 16, 692–714. [Google Scholar] [CrossRef]
- Frond, A.D.; Iuhas, C.I.; Stirbu, I.; Leopold, L.; Socaci, S.; Scurtu, A.; Ayvaz, H.; Mihai, S.; Diaconeasa, Z.; Socaciu, C. Phytochemical characterization of five edible purple-reddish vegetables: Anthocyanins, flavonoids, and phenolic acid derivatives. Molecules 2019, 24, 1536. [Google Scholar] [CrossRef] [PubMed]
- Tufarelli, V.; Casalino, E.; D'Alessandro, A.G.; Laudadio, V. Dietary phenolic compounds: Biochemistry, metabolism and significance in animal and human health. Curr. Drug Metab. 2017, 18, 905–913. [Google Scholar] [CrossRef]
- Pérez, M.; Dominguez-López, I.; Lamuela-Raventós, R.M. The chemistry behind the Folin–Ciocalteu method for the estimation of (poly)phenol content in food: Total phenolic intake in a Mediterranean dietary pattern. J. Agric. Food Chem. 2023, 71, 17543–17553. [Google Scholar] [CrossRef]
- Zagoskina, N.V.; Zubova, M.Y.; Nechaeva, T.L.; Kazantseva, V.V.; Goncharuk, E.A.; Katanskaya, V.M.; Baranova, E.N.; Aksenova, M.A. Polyphenols in plants: Structure, biosynthesis, abiotic stress regulation, and practical applications. Int. J. Mol. Sci. 2023, 24, 13874. [Google Scholar] [CrossRef]
- Buchanan, B.B.; Gruissem, W.; Jones, R.L. Biochemistry and Molecular Biology of Plants, 2nd ed.; John Wiley & Sons: Chichester, UK, 2015. [Google Scholar]
- Pastorelli, G.; Simeonidis, K.; Faustini, M.; Le Mura, A.; Cavalleri, M.; Serra, V.; Attard, E. Chemical characterization and in vitro gas production kinetics of alternative feed resources for small ruminants in the Maltese Islands. Metabolites 2023, 13, 762. [Google Scholar] [CrossRef]
- Attard, E.; Buttigieg, J.; Simeonidis, K.; Pastorelli, G. The modification of dairy cow rations with feed additives mitigates methane production and reduces nitrate content during in vitro ruminal fermentation. Gases 2025, 5, 12. [Google Scholar] [CrossRef]
- Attard, E. A rapid microtitre plate Folin–Ciocalteu method for the assessment of polyphenols. Cent. Eur. J. Biol. 2013, 8, 48–53. [Google Scholar] [CrossRef]
- Hashimoto, A.G. Effect of inoculum/substrate ratio on methane yield and production rate from straw. Biol. Wastes 1989, 28, 247–255. [Google Scholar] [CrossRef]
- Monti, A. Mineral composition and ash content of six major crops. Biomass Bioenergy 2008, 32, 216–223. [Google Scholar] [CrossRef]
- Clemente-Villalba, J.; Burló, F.; Hernández, F.; Carbonell-Barrachina, Á.A. Valorization of wild edible plants as food ingredients and their economic value. Foods 2023, 12, 1012. [Google Scholar] [CrossRef]
- Madruga, A.; Mainau, E.; González, L.A.; Rodríguez-Prado, M.; Ruíz de la Torre, J.L.; Manteca, X.; Ferret, A. Effect of forage source included in total mixed ration on intake, sorting and feeding behavior of growing heifers fed high-concentrate diets. J. Anim. Sci. 2017, 95, 3322–3330. [Google Scholar] [CrossRef] [PubMed]
- Piątkowska, E.; Biel, W.; Witkowicz, R.; Kępińska-Pacelik, J. Chemical composition and antioxidant activity of Asteraceae family plants. Appl. Sci. 2022, 12, 12293. [Google Scholar] [CrossRef]
- Haque, M.Z.; Islam, M.B.; Jalil, M.A.; Shafique, M.Z. Proximate analysis of Aloe vera leaves. IOSR J. Appl. Chem. 2014, 7, 36–40. [Google Scholar] [CrossRef]
- Giménez-Berenguer, M.; Salicola, S.A.; Formenti, C.; Giménez, M.J.; Mauromicale, G.; Zapata, P.J.; Lombardo, S.; Pandino, G. Seeds mineral profile and ash content of thirteen different genotypes of cultivated and wild cardoon over three growing seasons. Agriculture 2025, 15, 1228. [Google Scholar] [CrossRef]
- Ressurreição, S.; Salgueiro, L.; Figueirinha, A. Diplotaxis genus: A promising source of compounds with nutritional and biological properties. Molecules 2024, 29, 2612. [Google Scholar] [CrossRef]
- Galal, T.M.; Aseeri, S.A.; Soliman, M.A. Nutrients and nutritional value of nine Aloe species grown on the highlands of western Saudi Arabia. Appl. Ecol. Environ. Res. 2023, 21, 5481–5494. [Google Scholar] [CrossRef]
- Macheboeuf, D.; Coudert, L.; Bergeault, R.; Lalière, G.; Niderkorn, V. Screening of plants from diversified natural grasslands for their potential to combine high digestibility and low methane and ammonia production. Animal 2014, 8, 1797–1806. [Google Scholar] [CrossRef] [PubMed]
- Ruzic-Muslic, D.; Petrovic, M.P.; Petrovic, M.M.; Bijelic, Z.; Caro-Petrovic, V.; Maksimovic, N.; Mandic, V. Protein source in diets for ruminant nutrition. Biotechnol. Anim. Husb. 2014, 30, 175–184. [Google Scholar] [CrossRef]
- Huang, B.; Khan, M.Z.; Kou, X.; Chen, Y.; Liang, H.; Ullah, Q.; Khan, N.; Khan, A.; Chai, W.; Wang, C. Enhancing metabolism and milk production performance in periparturient dairy cattle through rumen-protected methionine and choline supplementation. Metabolites 2023, 13, 1080. [Google Scholar] [CrossRef] [PubMed]
- National Academies of Sciences; Engineering; and Medicine. Nutrient Requirements of Dairy Cattle; National Academies Press: Washington, DC, USA, 2021. [Google Scholar] [CrossRef]
- Lee, M.A. A global comparison of the nutritive values of forage plants grown in contrasting environments. J. Plant Res. 2018, 131, 641–654. [Google Scholar] [CrossRef] [PubMed]
- Oliveras, I.; Bentley, L.; Fyllas, N.M.; Gvozdevaite, A.; Shenkin, A.F.; Peprah, T.; Morandi, P.; Peixoto, K.S.; Boakye, M.; Adu-Bredu, S.; et al. The influence of taxonomy and environment on leaf trait variation along tropical abiotic gradients. 2020.
- Swart, E.; Brand, T.S.; Engelbrecht, J. The use of near infrared spectroscopy (NIRS) to predict the chemical composition of feed samples used in ostrich total mixed rations. S. Afr. J. Anim. Sci. 2012, 42, 550–554. [Google Scholar] [CrossRef]
- Kerr, B.J.; Shurson, G.C. Determination of ether extract digestibility and energy content of specialty lipids with different fatty acid and free fatty acid content, and the effect of lecithin, for nursery pigs. Prof. Anim. Sci. 2017, 33, 127–134. [Google Scholar] [CrossRef]
- Alam, M.K.; Rana, Z.H.; Islam, S.N.; Akhtaruzzaman, M. Comparative assessment of nutritional composition, polyphenol profile, antidiabetic and antioxidative properties of selected edible wild plant species of Bangladesh. Food Chem. 2020, 320, 126646. [Google Scholar] [CrossRef]
- Guil-Guerrero, J.L.; Giménez-Giménez, A.; Rodríguez-García, I.; Torija-Isasa, M.E. Nutritional composition of Sonchus species (S. asper, S. oleraceus and S. tenerrimus). J. Sci. Food Agric. 1998, 76, 628–632. [Google Scholar] [CrossRef]
- Wang, S.; Giller, K.; Kreuzer, M.; Ulbrich, S.E.; Braun, U.; Schwarm, A. Contribution of ruminal fungi, archaea, protozoa, and bacteria to the methane suppression caused by oilseed supplemented diets. Front. Microbiol. 2017, 8, 1864. [Google Scholar] [CrossRef]
- Chuang, W.; Lin, L.; Shih, H.; Shy, Y.; Chang, S.; Lee, T. The potential utilization of high-fiber agricultural by-products as monogastric animal feed and plant species: A review. Animals 2021, 11, 2098. [Google Scholar] [CrossRef]
- AlZahal, O.; Or-Rashid, M.M.; Greenwood, S.L.; Douglas, M.S.; McBride, B.W. Effect of dietary fiber level on milk fat concentration and fatty acid profile of cows fed diets containing low levels of polyunsaturated fatty acids. J. Dairy Sci. 2009, 92, 1108–1116. [Google Scholar] [CrossRef]
- Stepanchenko, N.; Stefenoni, H.; Hennessy, M.; Nagaraju, I.; Wasson, D.E.; Cueva, S.F.; Räisänen, S.E.; Dechow, C.D.; Pitta, D.W.; Hristov, A.N. Microbial composition, rumen fermentation parameters, enteric methane emissions, and lactational performance of phenotypically high- and low-methane-emitting dairy cows. J. Dairy Sci. 2023, 106, 6146–6170. [Google Scholar] [CrossRef] [PubMed]
- Shi, R.; Dong, S.; Mao, J.; Wang, J.; Cao, Z.; Wang, Y.; Li, S.; Zhao, G. Dietary neutral detergent fiber levels impacting dairy cows’ feeding behavior, rumen fermentation, and production performance during peak lactation. Animals 2023, 13, 2876. [Google Scholar] [CrossRef]
- Ziolecka, A.; Osinska, Z.; Sowinski, J.; Kuzdowicz, M. Nitrogen and energy balance in growing cattle. Part 6. Effect of reduced protein content in diets during milk feeding on growth and development of calves. Roczn. Nauk Roln. Ser. B Zootech. 1983, 101, 3. [Google Scholar]
- Vázquez, C.V.; Rojas, M.G.V.; Ramírez, C.A.; Chávez-Servín, J.L.; García-Gasca, T.; Ferriz Martínez, R.A.; García, O.P.; Rosado, J.L.; López-Sabater, C.M.; Castellote, A.I.; et al. Total phenolic compounds in milk from different species: Design of an extraction technique for quantification using the Folin–Ciocalteu method. Food Chem. 2015, 176, 480–486. [Google Scholar] [CrossRef]
- Bai, M.; Prathap, P.; Elayadeth-Meethal, M.; Flavel, M.; Eckard, R.; Dunshea, F.R.; Osei-Amponsah, R.; Ashar, M.J.; Chen, D.; Chauhan, S. Polyphenol-containing plant species Polygain™ reduces methane production and intensity from grazing dairy cows measured using an inverse method. unpublished. 2025. [Google Scholar]
- Brinsi, C.; Jedidi, S.; Dhiffalah, A.; Selmi, H.; Sammari, H.; Sebai, H. Nutritional value and phytochemical properties of different parts of dill (Anethum graveolens L.) and their effects on in vitro digestibility in ruminants. Nat. Prod. Commun. 2024, 19. [Google Scholar] [CrossRef]
- Chuang, S.T.; Li, K.Y.; Tu, P.W.; Ho, S.T.; Hsu, C.C.; Hsieh, J.C.; Chen, M.J. Investigating the reciprocal interrelationships among the ruminal microbiota, metabolome, and mastitis in early lactating Holstein dairy cows. Animals 2021, 11, 3108. [Google Scholar] [CrossRef]
- Shibata, M.; Terada, F. Factors affecting methane production and mitigation in ruminants. Anim. Sci. J. 2010, 81, 2–10. [Google Scholar] [CrossRef]
- Hashimoto, A.G. Effect of inoculum/substrate ratio on methane yield and production rate from straw. Biol. Wastes 1989, 28, 247–255. [Google Scholar] [CrossRef]
- Singh, S. Non-conventional fodder resources for feeding livestock. In Recent Approaches in Crop Residue Management and Value Addition for Entrepreneurship Development; ICAR-Indian Grassland and Fodder Research Institute: Jhansi, India, 2016; pp. 7–12. [Google Scholar]
Figure 2.
Observations plot (PCA) for the plant species based on all the parameters tested. C1 to C4 refer to clusters distinguished via AHC analysis.
Figure 2.
Observations plot (PCA) for the plant species based on all the parameters tested. C1 to C4 refer to clusters distinguished via AHC analysis.
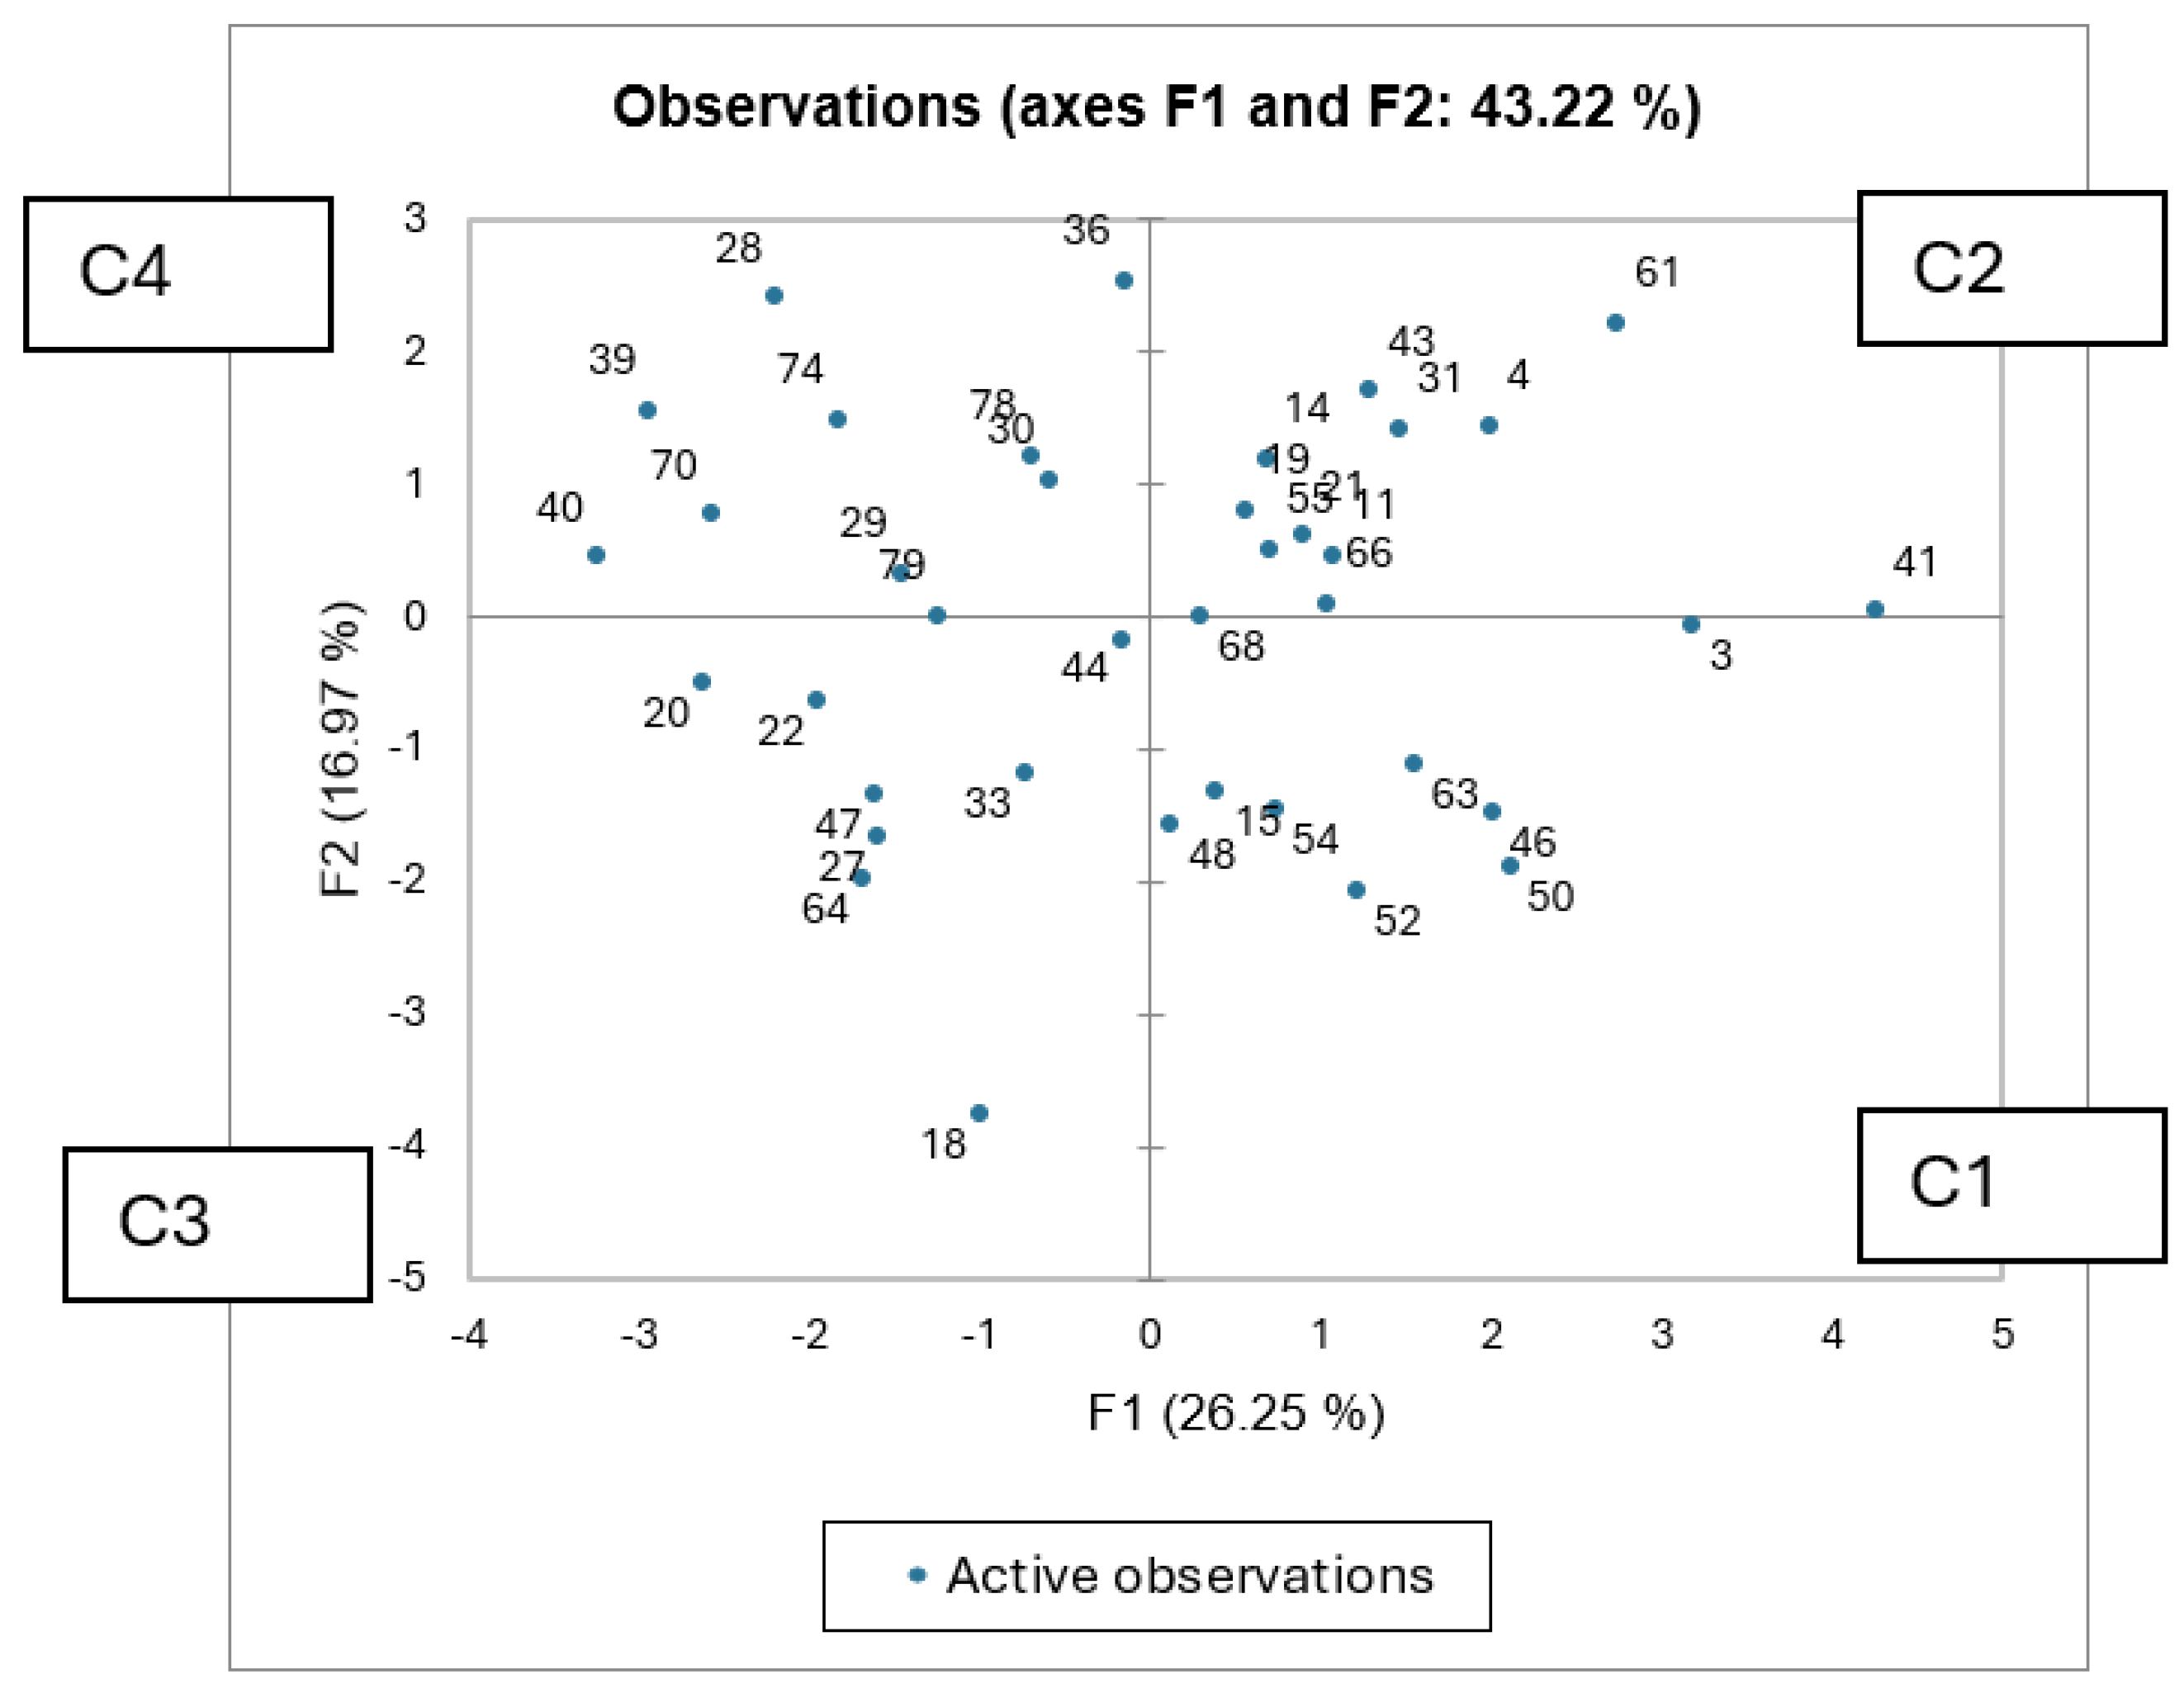
Figure 3.
AHC analysis for the plant species under study.
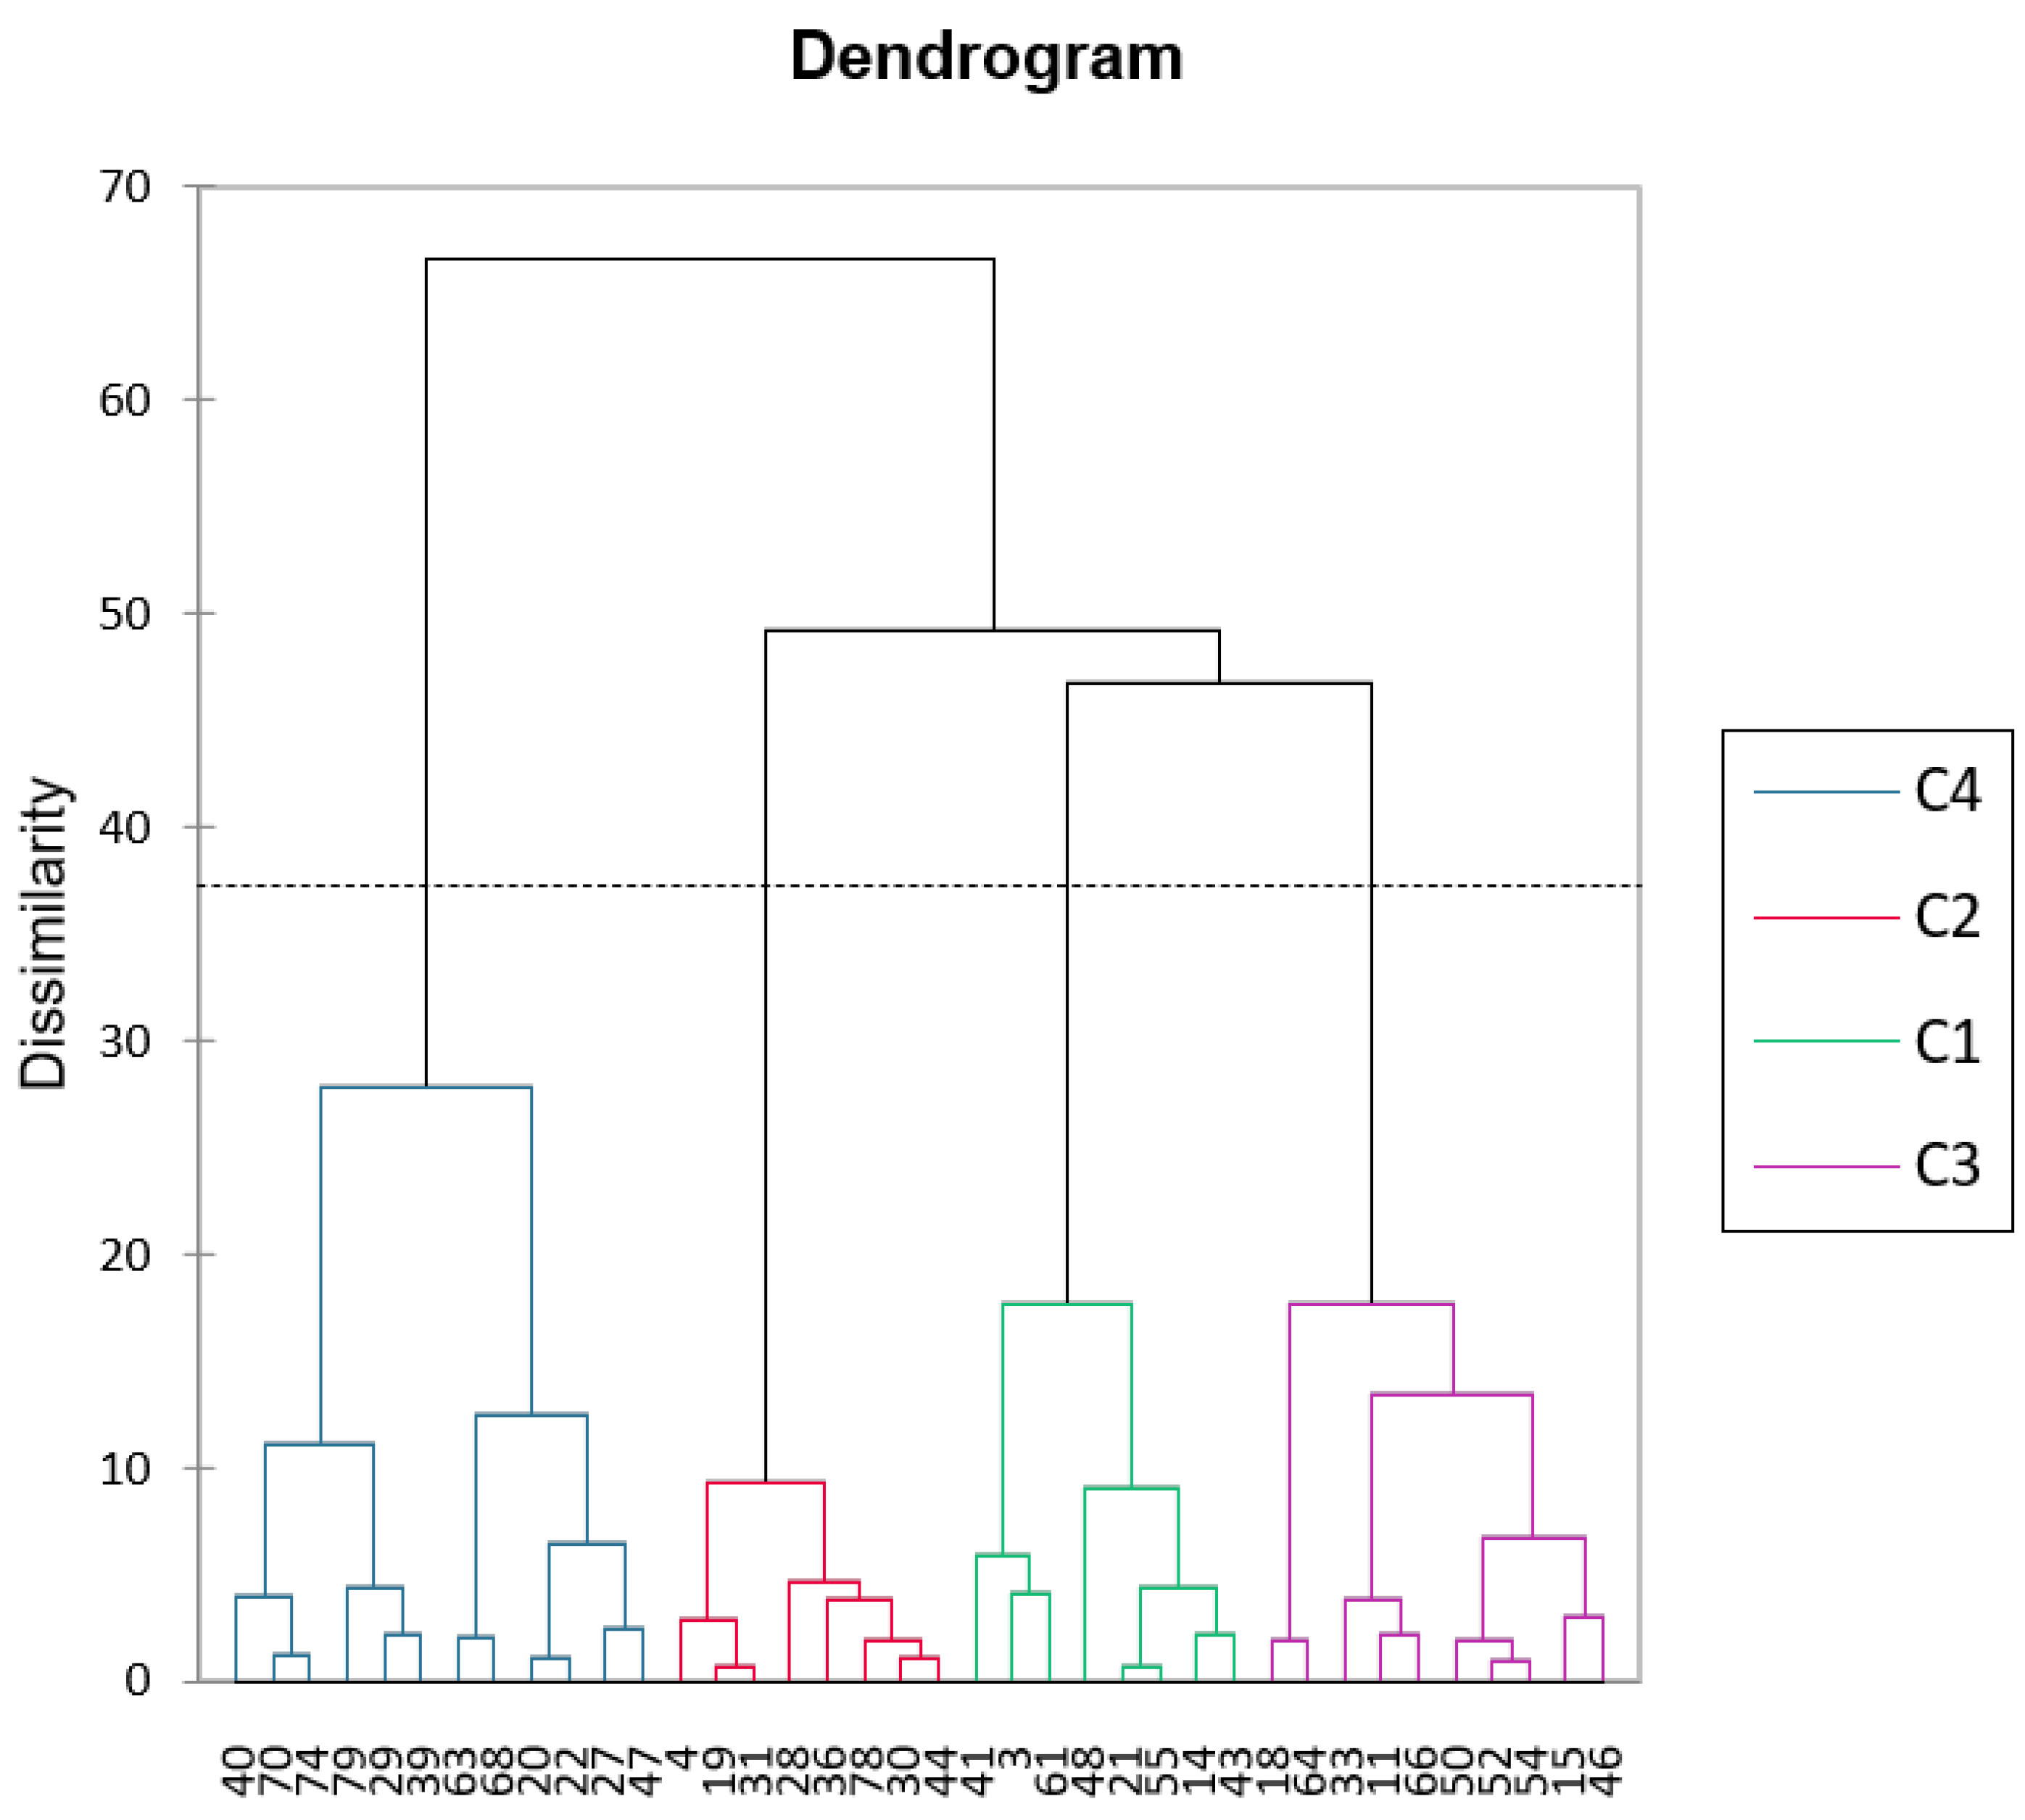

Table 1.
Chemical composition (%) of individual plant species.
| Number identifier and plant family | Latin Name (Common Name) | DM | ASH | CP | EE | NDF | ADF | NFC | Energy (kcal/100g) |
|---|---|---|---|---|---|---|---|---|---|
| 3-Ge | Erodium malacoides (Mallow-Leaved Stork's Bill) | 89.13±3.62 | 11.65±1.28 | 22.4±6.54 | 4.193±1.47 | 22.63±7.55 | 26.2±2.86 | 31.88±0.34 | 369.2±17.05 |
| 4-Bo | Borago officinalis (Common Borage) | 86.68±2.60 | 9.987±0.55 | 20.68±3.63 | 1.52±0.70 | 26.8±2.80 | 21.82±4.52 | 46.01±5.69 | 363.6±4.66 |
| 11-Le | Trifolium nigrescens (Small White Clover) | 89.47±1.85 | 13.83±0.24 | 24.88±3.69 | 0.8767±0.82 | 14.1±10.04 | 25.82±0.77 | 33.72±0.26 | 348.5±5.33 |
| 14-Fa | Scorpiurus muricatus (Many-flowered Scorpiurus) | 88.25±2.32 | 12.76±0.20 | 25.35±4.30 | 1.073±1.41 | 28.83±5.61 | 20.73±1.19 | 35.72±2.15 | 354.3±7.81 |
| 15-Pl | Plantago lagopus (Mediterranean Plantain) | 86.08±4.04 | 12.73±0.63 | 27.98±7.26 | 2.947±0.42 | 38.43±6.71 | 20.58±2.00 | 30.88±0.26 | 347±13.04 |
| 18-Po | Rumex bucephalophorus (Red Dock) | 83.72±1.77 | 17.2±0.37 | 25.3±4.98 | 0.66±0.31 | 33.68±1.92 | 29.8±3.43 | 19.99±3.10 | 326.6±3.74 |
| 19-As | Sonchus oleraceus (Smooth Sow Thistle) | 86.21±1.70 | 13.62±0.87 | 21.09±2.59 | 1.367±1.35 | 26±5.57 | 15.58±4.86 | 30.25±2.42 | 352.4±8.87 |
| 20-As | Calendula arvensis (Field Marigold) | 84.25±1.84 | 15.63±0.37 | 29.86±6.35 | 1.177±1.53 | 26.25±2.34 | 16.81±0.99 | 27.33±0.40 | 343.4±9.11 |
| 21-As | Reichardia picroides (Common Reichardia) | 86.83±1.47 | 13.77±0.05 | 21.63±3.37 | 1.637±0.92 | 18.51±7.76 | 19.47±0.65 | 36.72±0.08 | 353.1±4.50 |
| 22-As | Sonchus asper (Prickly Sow Thistle) | 86.34±3.00 | 16.39±0.80 | 27.81±3.09 | 2.443±0.79 | 24.3±1.70 | 13.47±7.02 | 36.62±5.50 | 337.8±12.38 |
| 27-Ma | Malva sylvestris (Common Mallow) | 87.21±2.46 | 14.68±0.07 | 30±3.37 | 0.85±1.19 | 12.29±4.46 | 19.48±0.50 | 26.44±0.32 | 340.5±6.40 |
| 28-Ra | Nigella damascena (Love-in-a-mist) | 83.85±0.13 | 12.61±1.46 | 28.6±4.23 | 0.6867±1.00 | 23.49±2.56 | 9.18±9.30 | 46.81±8.99 | 348±11.24 |
| 29-Ra | Adonis microcarpa (Pheasant's Eye) | 86.94±2.82 | 13.9±0.25 | 28.96±4.66 | 0.8633±1.25 | 21.87±2.38 | 23.82±1.53 | 33.88±1.02 | 343.3±7.93 |
| 30-Br | Brassica rapa subsp. sylvestris (Wild Turnip) | 83.86±1.05 | 13.89±0.17 | 25.91±2.51 | 1.553±0.81 | 27.72±2.15 | 19±0.99 | 36.78±0.53 | 352.2±4.69 |
| 31-Er | Erica multiflora (Mediterranean Heath) | 86.62±3.00 | 10.36±0.40 | 26.01±6.68 | 2.183±2.83 | 27.3±2.37 | 22.52±0.91 | 33.72±2.13 | 369.5±15.73 |
| 33-Fu | Fumaria capreolata (White Ramping Fumitory) | 86.12±2.79 | 13.65±0.37 | 29.1±5.18 | 0.8667±1.58 | 22.62±7.08 | 23.36±0.81 | 30.75±1.60 | 341.4±9.47 |
| 36-Ir | Gladiolus italicus (Field Gladiolus) | 86.12±2.52 | 12.5±0.66 | 24.94±6.05 | 1.13±1.36 | 44.78±5.03 | 18.46±0.59 | 44.28±4.05 | 351.2±10.45 |
| 39-Xa | Asphodelus fistulosus (Onion Weed) | 85.89±2.09 | 15.66±0.12 | 27.47±4.32 | 0.89±1.20 | 13.62±1.05 | 16.21±1.20 | 45.33±3.84 | 336.6±6.99 |
| 40-Xa | Asphodelus ramosus (Branched Asphodel) | 85.21±2.23 | 15.26±0.23 | 28.43±4.68 | 0.8467±1.34 | 48.89±0.38 | 17.49±0.27 | 43.19±4.27 | 336.4±8.01 |
| 41-As | Galactites tomentosa (Mediterranean Thistle) | 100.9±1.49 | 9.693±1.79 | 1.157±3.01 | 9.457±1.16 | 20.13±2.11 | 31.94±8.32 | 30.81±3.63 | 408.5±12.71 |
| 43-As | Glebionis coronaria (Crown Daisy) | 88±2.67 | 12.56±1.03 | 23.39±5.49 | 4.1±0.29 | 27.23±3.75 | 20.16±0.95 | 41.75±4.30 | 360.6±13.23 |
| 44-La | Teucrium fruticans (Olive-leaved Germander) | 85.61±2.81 | 12.91±0.68 | 26.68±6.67 | 1.17±1.48 | 38.42±6.55 | 23.1±0.62 | 33.57±1.94 | 346.4±11.04 |
| 46-Ap | Foeniculum vulgare (Fennel) | 85.51±1.77 | 12.47±1.17 | 23.02±3.94 | 2.57±0.65 | 24.41±3.31 | 27.32±5.81 | 26.53±5.86 | 347.9±10.37 |
| 47-La | Prasium majus (White Hedge-Nettle) | 85.12±3.32 | 13.93±0.18 | 31.97±4.87 | 2.613±0.51 | 23.66±1.52 | 21.03±2.64 | 31.24±0.56 | 336.5±8.49 |
| 48-So | Solanum nigrum (Black Nightshade) | 88.27±2.49 | 15.78±0.32 | 26.39±4.76 | 3.945±0.55 | 41.6±12.80 | 16.98±2.00 | 31.94±4.04 | 348.1±8.82 |
| 50-As | Pallenis spinosa (Spiny Golden Star) | 91.28±5.11 | 13.88±0.49 | 22.44±7.90 | 1.657±1.70 | 29.04±2.44 | 32.55±9.82 | 21.1±7.34 | 349.4±7.83 |
| 52-Bo | Cynoglossum creticum (Blue Hound's Tongue) | 87.8±2.13 | 13.29±0.59 | 27.62±3.80 | 1.027±1.10 | 24.07±1.53 | 28.8±0.96 | 29.74±0.66 | 348.4±8.85 |
| 54-Ap | Daucus carota (Wild Carrot) | 86.58±2.27 | 13.36±0.42 | 25.69±4.25 | 0.9967±1.13 | 28±7.28 | 27.42±1.74 | 29.42±0.37 | 347.1±8.32 |
| 55-Ac | Acanthus mollis (Bear's Breech) | 88.44±4.90 | 13.71±0.34 | 21.79±10.08 | 1.703±1.90 | 29.08±4.68 | 26.2±6.01 | 36.46±0.29 | 345.3±10.10 |
| 61-Am | Allium subhirsutum (Hairy Garlic) | 91.79±4.84 | 12.21±0.40 | 15.65±9.96 | 3.36±2.78 | 16.65±0.95 | 24.84±5.87 | 46.56±2.11 | 368±12.28 |
| 63-Ur | Urtica pilulifera (Roman Nettle) | 93.03±1.54 | 14.42±0.17 | 29.33±1.95 | 8.05±1.27 | 22.3±5.07 | 25.29±0.51 | 31.54±0.14 | 382.6±6.97 |
| 64-Ur | Parietaria judaica (Pellitory-of-the-wall) | 84.91±0.51 | 15.57±0.26 | 27.47±0.30 | 0.2467±0.22 | 29.17±1.14 | 20.99±0.89 | 34.4±4.89 | 338.9±0.15 |
| 66-As | Centaurea nicaeensis (Mediterranean Star-Thistle) | 86.86±2.04 | 11.75±0.69 | 24.94±4.83 | 0.4467±0.92 | 19.13±1.63 | 21.44±0.14 | 34.65±3.50 | 350.5±7.26 |
| 68-As | Matricaria chamomilla (Scented Mayweed) | 88.49±1.85 | 15.6±0.07 | 27.31±3.13 | 2.427±1.18 | 17.19±2.53 | 20.03±0.75 | 35.54±0.39 | 349.7±6.14 |
| 74-Pl | Bellardia trixago (Mediterranean Lineseed) | 85.8±0.66 | 13.42±0.11 | 27±0.73 | 0.99±1.26 | 17.78±3.91 | 16.18±7.02 | 42.44±3.77 | 339.6±4.95 |
| 78-Pl | Antirrhinum tortuosum (Greater Snapdragon) | 84.83±3.30 | 12.63±0.80 | 25.36±7.68 | 1.02±1.93 | 20.4±1.42 | 23.08±2.24 | 45.58±2.90 | 342.8±12.32 |
| 79-Br | Diplotaxis erucoides (White Wall Rocket) | 89.62±1.88 | 15.67±0.04 | 30.8±2.54 | 1.853±1.02 | 1.853±1.02 | 19.31±0.30 | 31.27±0.19 | 346.6±5.20 |
DM, drymatter; ASH, ashcontent; CP, crudeprotein; EE, etherextract; NDF, neutraldetergentfibre; ADF, aciddetergent fibre; NFC, non fibre carbohydrate.
Table 2.
The total polyphenolic content and antioxidant activity of the thirty-seven plant species.
| Identifier | Latin Name (Common Name) | PolyP (%w/w) | IC50 (mg/ml) |
| 3-Ge | Erodium malacoides (Mallow-Leaved Stork's Bill) | 0.19±0.00 | 1.77±0.52 |
| 4-Bo | Borago officinalis (Common Borage) | 0.26±0.01 | 2.97±0.61 |
| 11-Le | Trifolium nigrescens (Small White Clover) | 0.95±0.06 | 3.07±0.90 |
| 14-Fa | Scorpiurus muricatus (Many-flowered Scorpiurus) | 0.52±0.02 | 3.50±0.87 |
| 15-Pl | Plantago lagopus (Mediterranean Plantain) | 0.17±0.02 | 2.60±0.25 |
| 18-Po | Rumex bucephalophorus (Red Dock) | 0.14±0.02 | 0.37±0.09 |
| 19-As | Sonchus oleraceus (Smooth Sow Thistle) | 0.59±0.06 | 4.40±1.15 |
| 20-As | Calendula arvensis (Field Marigold) | 0.30±0.02 | 22.70±2.17 |
| 21-As | Reichardia picroides (Common Reichardia) | 0.11±0.02 | 5.30±0.32 |
| 22-As | Sonchus asper (Prickly Sow Thistle) | 0.11±0.01 | 10.90±1.29 |
| 27-Ma | Malva sylvestris (Common Mallow) | 0.46±0.01 | 7.23±2.42 |
| 28-Ra | Nigella damascena (Love-in-a-mist) | 0.43±0.02 | 14.40±1.83 |
| 29-Ra | Adonis microcarpa (Pheasant's Eye) | 0.46±0.03 | 5.30±1.21 |
| 30-Br | Brassica rapa subsp. sylvestris (Wild Turnip) | 1.30±0.03 | 6.10±0.96 |
| 31-Er | Erica multiflora (Mediterranean Heath) | 0.50±0.02 | 2.70±1.31 |
| 33-Fu | Fumaria capreolata (White Ramping Fumitory) | 0.68±0.02 | 55.90±5.73 |
| 36-Ir | Gladiolus italicus (Field Gladiolus) | 0.57±0.03 | 11.50±2.33 |
| 39-Xa | Asphodelus fistulosus (Onion Weed) | 0.33±0.05 | 12.50±3.32 |
| 40-Xa | Asphodelus ramosus (Branched Asphodel) | 0.20±0.01 | 3.47±0.53 |
| 41-As | Galactites tomentosa (Mediterranean Thistle) | 0.28±0.02 | 6.50±3.21 |
| 43-As | Glebionis coronaria (Crown Daisy) | 0.46±0.02 | 3.97±0.55 |
| 44-La | Teucrium fruticans (Olive-leaved Germander) | 0.24±0.03 | 0.63±0.09 |
| 46-Ap | Foeniculum vulgare (Fennel) | 0.16±0.01 | 6.50±0.30 |
| 47-La | Prasium majus (White Hedge-Nettle) | 0.07±0.00 | 1.73±0.09 |
| 48-So | Solanum nigrum (Black Nightshade) | 0.18±0.00 | 3.33±0.98 |
| 50-As | Pallenis spinosa (Spiny Golden Star) | 0.13±0.02 | 1.53±0.26 |
| 52-Bo | Cynoglossum creticum (Blue Hound's Tongue) | 0.93±0.02 | 6.17±2.04 |
| 54-Ap | Daucus carota (Wild Carrot) | 0.28±0.01 | 2.13±0.39 |
| 55-Ac | Acanthus mollis (Bear's Breech) | 0.34±0.03 | 9.73±0.29 |
| 61-Am | Allium subhirsutum (Hairy Garlic) | 0.41±0.01 | 3.93±0.73 |
| 63-Ur | Urtica pilulifera (Roman Nettle) | 0.12±0.00 | 5.57±0.43 |
| 64-Ur | Parietaria judaica (Pellitory-of-the-wall) | 0.15±0.04 | 1.17±0.27 |
| 66-As | Centaurea nicaeensis (Mediterranean Star-Thistle) | 0.23±0.03 | 0.43±0.09 |
| 68-As | Matricaria chamomilla (Scented Mayweed) | 0.23±0.01 | 4.30±0.60 |
| 74-Pl | Bellardia trixago (Mediterranean Lineseed) | 0.66±0.04 | 3.77±0.47 |
| 78-Pl | Antirrhinum tortuosum (Greater Snapdragon) | 0.30±0.01 | 9.67±2.46 |
| 79-Br | Diplotaxis erucoides (White Wall Rocket) | 0.37±0.03 | 11.90±0.38 |
Table 3.
Methane production over the 48-hr period and B0, K results.
| Methane Production (LCH4.kg−1) | |||||
| Additive No | 6h | 24h | 48h | B0 (L CH4/g) | k (1/h) |
| 3 | 22.77±5.55 | 60.37±6.81 | 115.99±6.49 | 361.45 | 0.008 |
| 4 | 13.76±5.27 | 110.42±9.00 | 97.93±12.09 | 114.01 | 0.063 |
| 11 | 38.05±6.05 | 57.38±4.05 | 80.78±4.47 | 76.07 | 0.089 |
| 14 | 14.91±4.28 | 65.25±6.08 | 119.02±22.69 | 446.71 | 0.006 |
| 15 | 37.04±14.49 | 90.47±39.25 | 44.49±9.73 | 66.32 | 0.167 |
| 18 | 9.75±3.92 | 47.01±22.27 | 67.65±24.55 | 96.07 | 0.026 |
| 19 | 25.34±5.80 | 57.22±5.24 | 46.10±8.26 | 51.96 | 0.130 |
| 20 | 22.93±6.04 | 194.82±33.77 | 184.38±4.20 | 214.51 | 0.057 |
| 21 | 16.63±3.60 | 92.65±9.73 | 107.33±27.54 | 126.21 | 0.044 |
| 22 | 68.69±2.89 | 168.79±5.52 | 182.55±5.51 | 189.76 | 0.081 |
| 27 | 32.22±13.05 | 50.57±6.91 | 64.33±25.76 | 60.63 | 0.110 |
| 28 | 105.72±37.86 | 115.01±44.67 | 173.49±47.28 | 146.03 | 0.202 |
| 29 | 35.32±2.89 | 174.87±1.44 | 158.24±27.25 | 179.35 | 0.070 |
| 30 | 22.59±4.21 | 46.10±13.27 | 51.37±14.00 | 51.74 | 0.095 |
| 31 | 12.61±9.53 | 18.23±10.67 | 30.39±14.76 | 32.08 | 0.048 |
| 33 | 12.61±5.81 | 28.09±7.65 | 45.18±7.65 | 58.30 | 0.030 |
| 36 | 38.64±8.38 | 35.78±5.18 | 40.59±2.94 | 38.34 | 10.709 |
| 39 | 35.78±6.18 | 146.54±7.16 | 188.05±2.71 | 224.66 | 0.040 |
| 40 | 56.99±40.31 | 61.00±37.14 | 122.35±2.56 | 138.30 | 0.037 |
| 41 | 57.45±30.23 | 84.51±18.80 | 91.39±13.59 | 88.90 | 0.170 |
| 43 | 37.50±19.37 | 74.07±2.48 | 153.31±29.88 | 570.99 | 0.006 |
| 44 | 72.70±6.09 | 58.02±1.95 | 61.69±4.71 | 64.14 | 5.657 |
| 46 | 29.13±5.57 | 58.82±8.94 | 45.75±5.68 | 52.31 | 0.151 |
| 47 | 89.67±29.91 | 124.30±8.54 | 116.16±7.68 | 120.36 | 0.229 |
| 48 | 7.91±4.16 | 87.61±33.67 | 124.53±23.82 | 203.03 | 0.020 |
| 50 | 30.50±8.37 | 102.97±14.00 | 108.59±7.47 | 117.77 | 0.067 |
| 52 | 31.30±17.02 | 63.41±23.06 | 96.89±32.06 | 110.70 | 0.040 |
| 54 | 5.39±1.29 | 108.02±3.71 | 111.91±6.12 | 136.60 | 0.043 |
| 55 | 48.39±6.39 | 68.91±4.12 | 121.66±3.80 | 139.01 | 0.038 |
| 61 | 78.55±6.03 | 97.58±5.79 | 166.38±45.70 | 160.98 | 0.063 |
| 63 | 12.84±4.60 | 26.03±5.67 | 44.03±10.24 | 59.48 | 0.027 |
| 64 | 10.78±5.13 | 38.30±17.10 | 54.24±13.37 | 69.219 | 0.032 |
| 66 | 26.49±6.12 | 74.76±4.47 | 109.05±7.16 | 134.36 | 0.035 |
| 68 | 33.25±8.10 | 141.38±4.17 | 40.82±6.56 | 86.85 | 0.143 |
| 74 | 57.33±29.29 | 112.37±48.84 | 198.26±21.96 | 290.24 | 0.023 |
| 78 | 28.44±20.84 | 94.26±6.17 | 71.78±12.66 | 83.99 | 0.102 |
| 79 | 20.07±5.45 | 37.15±3.25 | 73.27±15.68 | 159.07 | 0.013 |
Table 4.
Classification of plant species by methane production.
| Category | Criteria |
| (1) High B₀ & Low k | High potential yield, slow rate of production |
| (2) High B₀ & High k | High potential yield, fast production rate |
| (3) Moderate B₀ & High k | Moderate yield, fast rate |
| (4) Moderate B₀ & Moderate/Low k | Moderate yield, slow/moderate rate |
Disclaimer/Publisher’s Note: The statements, opinions and data contained in all publications are solely those of the individual author(s) and contributor(s) and not of MDPI and/or the editor(s). MDPI and/or the editor(s) disclaim responsibility for any injury to people or property resulting from any ideas, methods, instructions or products referred to in the content. |
© 2026 by the authors. Licensee MDPI, Basel, Switzerland. This article is an open access article distributed under the terms and conditions of the Creative Commons Attribution (CC BY) license (http://creativecommons.org/licenses/by/4.0/).
Copyright: This open access article is published under a Creative Commons CC BY 4.0 license, which permit the free download, distribution, and reuse, provided that the author and preprint are cited in any reuse.


