
Submitted:
20 January 2026
Posted:
22 January 2026
You are already at the latest version
Abstract
Cracks in planetary gearbox casings generate vibration responses, which, when properly isolated and analyzed, can be used for monitoring structural degradations. This paper provides a signal processing framework to effectively track casing crack related features in planetary gearboxes using carrier synchronous signal average (C-SSA). The proposed algorithm is based on processing the hunting-tooth synchronous signal average (H-SSA) to extract the C-SSA which contains the cyclic interaction between the gear loadings and the corresponding casing response. The root mean square (RMS) of the C-SSA signal can then serve as a health condition indicator (CI) to track crack propagation. Further enhancement can be achieved by applying the Hilbert transform (HT) on the C-SSA using the full bandwidth to derive squared envelope signal, which clearly shows the modulations from the crack response and further enhances the trending capability. To remove cyclic temperature influences observed in the trends, singular spectrum analysis technique (SSAT) has been used, ensuring the trend reflects the changes purely due to the damage progression. Experiments using three casing-mounted sensors show good capability to track crack progression. Tests under 100%, 125%, and 150% load levels show consistent performance across these operating conditions, with better results seen at higher loads. The results demonstrate that C-SSA and its squared envelope signal effectively enhances the sensitivity and reliability of vibration-based crack detection, providing a practical tool for long-term structural health monitoring of planetary gearbox.
Keywords:
planetary gearbox casing
; carrier synchronous signal averaging
; crack detection
; hilbert transform
; envelope analysis
; health and usage monitoring systems
1. Introduction
Planetary gearboxes are essential to most helicopter main transmissions, providing high torque capacity, compactness, and load-sharing capability. Their mechanical integrity is crucial because any undetected fault can lead to significant operational and safety risks. Condition monitoring through vibration analysis has been an essential component of Health and Usage Monitoring Systems (HUMS) and Prognostic Health Management (PHM) frameworks [1]. However, vibration signals measured on planetary gearboxes are complex. They contain mixed contributions from gears, bearings and casing structures, all modulated by the carrier and planetary rotation and convolved with transfer path effects [2]. The understating of planet gear kinematics and dynamics is very inportant as it explains the nature of the cyclic loading that the casing experiences. Molina Vicuña [3] developed a theoretical frequency framework describing how internal and external gear meshes, together with carrier rotation, generate families of sidebands and modulation orders observable in measured vibration spectra by a sensor on the casing outside the ring gear. Molina explained that the key to understand vibration signals measured on planetary gearboxes are: (1) phase differences between the meshing process present in the gearbox. This largely depends on the geometry of the gearbox and will generally be the same independent of the type of gearbox configurations. (2) Phase differences between the amplitude modulation functions due to variations in the transmission paths. This does not only depends on the geometry of the gearbox, but also on the measurement arrangement and/or configuration of the planets (e.g., number of plants and their spatial arrangement). Subsequent modeling work has refined the representation of these dynamics by including time-varying mesh stiffness, frictional excitation, and transfer path effects [4,5]. Together, these models establish a foundation for understanding how the cyclic loading from planetary motion drives nonlinear responses in the gearbox structure. Cyclic excitations impose repetitive stress fields on the ring gear and transmits to the casing through the ring gear and mounting interfaces.
The general body of research has focused mainly on gear and bearing faults in the planetary gear system such as spalling and pitting as these are the most common failure modes and require dedicated approaches to detect and diagnose. Structural faults in stationary components, particularly casing cracks, remain largely unexplored due to their rare occurrence and weak manifestation in measured vibration signals. The Defence Science and Technology Group (DSTG) recently conducted a controlled pinion gear spall propagation test on a decommissioned Bell 206B-1 Kiowa main rotor gearbox. During this test, a casing crack developed unexpectedly and progressed to the failure of the gearbox under different load conditions (100%, 125%, and 150%). The resulting HUMS 2025 dataset captured the progression of this structural fault with high-resolution vibration data [6]. This dataset provided a unique opportunity to study the dynamic response of a real gearbox casing undergoing cyclic fatigue, an area that has previously lacked experimental validation.
The phenomenon of crack breathing, the periodic opening and closing of a fatigue crack under dynamic loads, has been studied extensively in structural dynamics and fracture mechanics. Early investigations demonstrated that breathing cracks introduce a time-varying stiffness and modulation in vibration amplitude and frequency [7,8,9,10]. Long et al. [11] advanced this concept by representing a cracked beam as a bilinear two-degree-of-freedom (2-DOF) system, where stiffness alternates with each load cycle. This lumped-parameter approach shows that breathing cracks generate sub-harmonic and super-harmonic components in the response, which vary systematically with crack size and location. Along these lines, the gearbox casing coupled with the ring gear may be intuitively treated as a 2-DOF structure in which the casing behaves as a spring with stiffness that breathes under the cyclic forces transmitted from the planetary gear set.
Recent studies on vibration-based crack fault detection have expanded the analytical and computational tools for identifying such nonlinear effects. Madisetty et al. [12] reviewed advances in vibration-based crack detection and emphasized the integration of analytical, numerical, and soft computing methods for structural health monitoring. Suresha and Reddy [13] demonstrated that the nonlinear spectral signatures of breathing cracks can be captured effectively using bilinear models and harmonic analysis. Yan et al. [14] proposed a dynamic identification method for bi-linear systems that distinguishes stiffness regions by their natural frequencies, while Qiu et al. [15] provided a finite element analysis framework linking the harmonic content of a vibrating cracked-beam to crack depth and position. These developments have significantly improved the sensitivity and interpretability of crack detection techniques and motivated the use of signal processing methods capable of isolating breathing-related nonlinearities.
Building on these understandings and foundations, the present study introduces a signal processing framework for detecting and tracking casing (breathing) crack response in planetary gearboxes. The method derives a carrier synchronous signal average (C-SSA) signal from the hunting-tooth synchronous signal average (H-SSA) data to enhance features linked to the cyclic interaction between gear loading and structural response. Hilbert-based squared envelope analysis is then used to reveal modulations caused by the breathing behavior and enhance trending ability, while singular spectrum analysis technique (SSAT) removes temperature-related cyclic effects to expose the true damage trend. The framework is validated using multi-sensor vibration data from DSTG’s HUMS 2025 dataset across multiple load conditions.
The paper is organized as follow. After this introduction (Section 1), Section 2 presents the materials and methods. This section describes the test and the vibration dataset and discusses the essence of the proposed signal processing algorithm. Section 3 presents the results achieved from using the proposed algorithm. Comparisons are shown between early and late stages of the crack propagation as well as trend plots using the root-mean-square (RMS) of the C-SSA and the RMS the squared envelope signals. SSAT results are also presented in Section 3. Section 4 provides detailed discussion of the results providing physical interpretation of the crack breathing effects seen. Sensors responses under different loads and the performance of the proposed frame work are also discussed in this section. Section 5 provides the conclusions while Section 6 lists the references used in this work.
2. Materials and Methods
2.1. Test Description and the Vibration Dataset
Vibration measurements were collected during a controlled endurance test (started in October 2023) of a helicopter main rotor gearbox conducted by DSTG. This gearbox has two speed reduction stages: a spiral pinion/bevel gear stage with a reduction ratio of 3.7368:1 (71/19) and a planetary stage with a reduction ratio of 4.6666:1 (99/27 + 1) giving a total reduction ratio of 17.4386:1. In DSTG’s Helicopter Transmission Test Facility (HTTF), the gearbox is driven by a DC motor at a nominal input speed of 6000 RPM, and produces an output speed of approximately 344 RPM. The gearbox can run with either 3-planet or 4-planet configurations (number of teeth of the planet gears is 35). The 3-planet configuration has 3 equally spaced planets with all the meshes in phase. As such, the orders that are not integer multiples of 3 are suppressed. In the 4-planet version which has been used in this test, two pairs of planet gears are placed diametrically opposite from each other, but there is a non-uniform angular distribution around the sun gear (i.e., approximately 88.6°, 91.4°, 88.6°, 91.4°). Opposite planets mesh 180° out of phase, leading to zero-sum odd orders for opposite pairs and in-phase even orders.
The test was originally designed to monitor the progression of an artificially induced gear-tooth spalling fault in the input pinion. In May 2024, however, testing was interrupted following the unexpected detection of a fatigue rupture in the upper casing of the gearbox. The test was carried out at varying loads in a sequence of 100% ‒ 125% ‒ 150% ‒ 125% ‒ 100% … of the rated load, and was running at each load for approximately 20 minutes. Vibration accelerometer data was collected from the casing sensors at a sampling frequency of 65573.77 Hz. A tachometer installed at the input driving shaft was simultaneously collected as well. The present dataset includes 86 load cycles recorded between Day 3 and Day 22 of the test. Data from Days 1–2 were excluded due to a temporary control board malfunction. The test procedure is described in detail in [6]. The dataset used in this work differs from the dataset released publicly for the HUMS 2025 Data Challenge [6].
Figure 1a shows the cracked casing of the gearbox after the failure and the locations of two casing sensors: Ring Front (RF-2) and Ring Left (RL-3). Note that the third casing sensor (Ring Rear, RR-4, is obscured by the flexible duct, however its location has been highlighted and can be seen clearly in Figure 2. Figure 1b shows a side view of the fracture surface.
Figure 2a illustrates the structural configuration of the gearbox casing support and the applied load path. The blue arrow indicates gear forces, while red arrows represents the resulting reaction force and bending moment acting at the casing interface. Figure 2b shows the RF-2 and RR-4 sensors which are located close to the high-stress region where the crack initiated. Oil leakage observed during the early test stages was initially attributed to a leak from the sight glass but later identified as an early symptom of casing failure. Figure 2c shows the main crack origin area (red ellipse: C1) and its outward direction of propagation as well as the secondary origin (C2) and its upward propagation direction.
Figure 3 presents a quantitative fractography analysis of the casing crack growth under cyclic loading, to map the evolution of crack length over time. The figure highlights two crack fronts: C1, an outward-propagating crack with a larger crack area (shown in blue), and C2, upward-propagating crack with a smaller crack area (shown in orange). Crack length in millimeters is plotted against testing days, with overlaid key points marked at Days 12, 16 and 22. These milestones illustrate a clear and steady progression of crack growth.
Raw vibration data were pre-processed (angular resampled) with the aid of the tachometer to produce an H-SSA with 405,405 points per channel. This length was selected so that the data encompassed an integer number of revolutions of both the planet carrier and the planet gears, enabling direct derivation of either C-SSA or planet synchronous signal average (P-SSA) from the same dataset. The H-SSA was computed from raw vibration signals spanning 12 planet–ring hunting-tooth periods, with each period corresponding to 99 revolutions of the planet gears (99 × 4,095 samples) or 35 revolutions of the carrier (35 × 11,583 samples). This ensured strict angular synchrony among gear, carrier, and casing signals, an essential prerequisite for coherent averaging and modulation analysis. A total of 1723 H-SSA records were analyzed split between the three loads as follows: 434 records at 100% load, 860 records at 125% load and 429 records at 150% load.
2.2. Signal Processing Framework
Figure 4 presents a schematic flow diagram illustrating the main processing steps proposed to extract and track casing crack related features. The process involves reshaping the H-SSA signal (405,405) into 11,583×35 (35 carrier rotation with each rotation having 11,583 samples) then calculating the ensemble average of these 35 rotations. This gives a C-SSA of 11,583 samples. RMS of each C-SSA signal can then be calculated and used as a health condition indicator (CI). The squared envelope of the C-SSA can also be obtained using a Hilbert transform applied on the full bandwidth. This helps further enhance the modulations and trend ability by trending the RMS of the squared envelope signal.
2.2.1. C-SSA and its Squared Envelope Signal
C-SSA enhances vibration components related to the cyclic loading transmitted from the rotating carrier and planetary gear set into the flexible casing structure. Averaging across equivalent carrier cycles suppresses asynchronous gear-mesh contributions and highlights casing responses excited per carrier revolution. This transformation isolates the cyclic stiffness variation that occurs when the crack opens and closes under dynamic load, referred to as the breathing effect. Because the breathing introduces amplitude and phase modulation at carrier frequency multiples (including the planet pass frequency at 4× carrier frequency), C-SSA provides a physically meaningful representation of this interaction. Figure 5a depicts a typical C-SSA signal from RF-2 at load 125% from the last day of testing. Gear mesh periods (≈ at 3.605°) and transfer path modulations are clearly seen in the signal.
To further enhance modulations linked to the breathing mechanism, the Hilbert transform (HT) is applied to the C-SSA over the full bandwidth (FB) to produce its analytic signal. The Hilbert approach allows precise digital demodulation and ideal band selection, overcoming the limitations of analogue filtering [16,17]. The squared envelope signal (SES) of this analytic signal emphasizes amplitude modulations superimposed on the structural resonance bands. The evolution of these envelope features with increasing load and time provides a quantitative measure of the crack’s breathing activity. Figure 5b displays C-SSA corresponding SES using HT on the FB (HT_FB-SES) which better shows both amplitude and modulation effects.
The RMS of the C-SSA and of its HT-FB-SES are computed and used as condition indicators, capturing the global vibration energy variation over time. An increase in RMS indicates higher structural compliance and energy transmission due to crack growth as a direct results from decreased stiffness which causes increased vibration amplitudes.
2.2.2. Singular Spectrum Analysis Technique (SSAT) for Trend Extraction and Temperature Correction
Vibration trends derived from RMS for both the C-SSA and its squared envelope signal were further processed using singular spectrum analysis technique (SSAT) to remove temperature variations observed in the trends. SSAT is a data-driven decomposition technique that separates a time series into interpretable components representing trend, oscillation, and noise [18,19]. It requires no a-priori model and is well suited for non-stationary, nonlinear mechanical signals. SSAT involves two main stages of processing; namely decomposition and reconstruction [20]. Each of these stages has two separate steps. Decomposition stage on one side, aims at separating the signal into components of trend, seasonal (cyclic) and error (random) though embedding and singular value decomposition. Reconstruction stage on the other side aims at reconstructing the data into a new time series based on the values obtained from the decomposition step using grouping and diagonal averaging [20].
Given a discrete time series x(t) ={x1,x2,…,xN}, SSAT constructs a trajectory matrix through Hankel embedding (one dimensional converted into multi-dimensional form) as shown in Equation (1):
Where:
: Number of samples
: Window length ( and
.
Embedding stage involves the selection of a window length (L), where and that the data does not contain missing samples
The second step of the decomposition stage involves the use of singular value decomposition (SVD) to separate different components. This is in principle the same as using principal component analysis (PCA) to reduce dimensionality. The application of SVD produces components as in (2):
is an orthonormal matrix of K × L; is diagonal matrix order L; and is orthonormal square matrix L × L. is the ith Eigen value and d is the total number of Eigen values. SVD produces d Eigen-components ranked by their Eigen values. Separating components can be done by grouping m components (Eigen triple grouping) by classifying the set of indices {i=1, 2,…d}. Dominant components, i.e., highest Eigen values correspond to long-term trends, while small-energy components (lowest Eigen values) represent random fluctuations. Those in between correspond to cyclic events and can be grouped together or represented separately.
The final stage of SSAT involves reconstructing the separated components into a new series of length N though diagonal averaging.as given in Equation (3):
Here G contains m components of each group. This will produce long term, i.e., slow varying competent, Eigen vector of the highest Eigen value, a random (noise) component (lowest Eigen value) and cyclic components.
The window length L is the only parameter to choose in the decomposition stage to achieve a better separability of a periodic component with an integer period. Hassani [20] advised for the window length (L) to be proportional to that period, i.e., multiple integer of the fundamental period. Furthermore Hassani [20] indicated that it is advisable to choose an L reasonably large but smaller than N/2. Note that in the case of trending we are not intrusted in the cyclic components, but with the slow varying component which has the highest Eigen value. The average number of files/day (representing a number of loading cycles) is 22 for the 100% and 150% and 45 for the 125% case. As such L was selected to be 45 samples in the processing of trends for all loads.
Applying SSAT to the RMS indicators produces temperature-compensated crack-growth trends that can be more directly correlated with measured crack length and testing day. This final stage enhances interpretability and reliability of the condition monitoring process for long-term assessment. Figure 6 illustrates application of SSAT to C-SSA RMS trends for the 100% load case. The original trend (Figure 6a) shows some dips associated with the cold starts after nightly shutdowns in addition to some small cyclic trends between different measurements due to the cyclic loading variation. The long term (LT) trend extracted and presented in Figure 6b shows a smooth clean trend after the removal of cyclic components and random components shown in Figure 6c and Figure 6d respectively.
3. Results
The vibration analysis algorithm proposed in section 2.2 focuses on three fundamental techniques to track the evolution of the casing crack. First, the C-SSA is used to extract the cyclic response associated with carrier rotation. Second, HT-FB-SES extracts the amplitude modulation from the C-SSA. Third, SSAT is applied to remove environmental effects, mainly temperature-induced variations, to obtain a clean trend of structural deterioration. The results discussed in the section demonstrate the effectiveness of this combined approach.
3.1. C-SSA Signals and their RMS Trends
Figure 7 presents typical C-SSA waveforms at load level of 125% comparing the early test stage (Day 3) with the advanced stage (Day 22) for the three casing sensors (RF-2, RL-3 and RR-4). This figure reveals an increasing vibration amplitude reflecting the advancement of the casing crack. The RR-4 sensor, positioned closest to the crack initiation point, records a root mean square (RMS) increase of 17.4%, while the RF-2 sensor, aligned with the direction of load reaction and maximum bending stress, exhibits a more pronounced increase of 27.9%. The RL-3 sensor, located furthest from the crack, shows the lowest increase at 15.6%.
C-SSA RMS trend, presented in Figure 8, shows a steady and almost monotonic rise in the C-SSA energy across all load cycles. This increase is directly linked to the progressive reduction in local stiffness near the crack. At 100% load, the RR-4 sensor records a root mean square (RMS) increase of 12%, while the RF-2 sensor exhibits a more pronounced increase of 19%. The RL-3 sensor shows a modest 3% increase. At 150% load, these values increases to 34.1%, 16.4%, and 24.4% for RF-2, RR-4, and RL-3, respectively. The RR-4 sensor’s proximity to the crack enables it to capture localized vibration changes effectively, while the RF-2 sensor’s alignment with the load reaction direction enhances its sensitivity to the dynamic effects of stiffness loss and cyclic deflection, resulting in the highest correlation with crack growth. In contrast, the RL-3 sensor, being furthest from the crack, shows limited response at 100% load but increased amplitude at higher torque, indicating that casing distortion extends the strain field to its location as loading intensifies. The RR-4 sensor’s response stabilizes at later stages, likely due to stress redistribution as the crack extends beyond its local region. These spatial differences confirm that the observed vibration changes are localized manifestations of structural degradation, emphasizing the critical role of sensor placement near stress concentration zones for early crack detection.
3.2. C-SSA Hilbert Squared-Envelope Signals and their RMS Trends
The HT-FB-SES effectively capture the amplitude modulation resulting from the crack’s breathing mechanism. Figure 9 illustrates a noticeable difference between the early (Day 3) and advanced stages (Day 22) of testing for the three casing sensors at load 125%, demonstrating significant increases in modulation depth. RF-2 sensor exhibits a notable root mean square (RMS) increase of 66.7% in the squared-envelope signal, approximately 2.4 times greater than the corresponding C-SSA increase. RL-3 sensor and RR-4 sensor show smaller (32.1% and 35.2% respectively) but consistent RMS increases, indicating the localized effect of the crack’s progression.
The RMS evolution of the squared-envelope signal, shown Figure 10, reveals a nearly linear upward trend throughout the test duration. Compared to the C-SSA trend in Figure 8, the HT-FB-SES results are approximately 2.0–2.4 times more sensitive, confirming that Hilbert demodulation enhances the detection of nonlinear stiffness variations induced by the crack. The RF-2 sensor’s alignment with the load reaction direction results in the highest sensitivity, providing the clearest correlation with crack growth. The RR-4 sensor effectively captures localized vibration changes, while the RL-3 sensor shows limited response at 100% load but increased activity at higher torque, suggesting that casing distortion extends the strain field to its location.
3.3. Temperature-Compensated Trends Using SSAT
The RMS trends derived from C-SSA and Hilbert squared-envelope analysis contain low-frequency oscillations induced by daily temperature cycles in the test environment. These fluctuations can mask the underlying progression of structural damage caused by the crack. To address this SSAT was employed to isolate the mechanical trends by removing temperature-related variations while preserving the core structural response.
Prior to SSAT filtering, the RMS trends, as shown Figure 8 and Figure 10, exhibit some periodic oscillations that align with the daily thermal cycles of the test article, i.e., cold start of each testing day – temperature increase to a set threshold – cooling fan start – temperature drop – cooling fan stop – temperature rise again – …. After applying SSAT, presented in Figure 11 and Figure 12, temperature-induced fluctuations are effectively eliminated, revealing the smooth and monotonic increases in the RMS signals. The reconstructed trends retain only the dominant singular components associated with changes in structural stiffness, ensuring that the resulting indicators accurately reflect the progression of crack-induced deterioration.
This temperature effect correction enhances the correlation between the extracted vibration features and the measured crack length, improving the stability and reliability of the trends for long-term condition monitoring. SSAT’s ability to separate environmental effects from mechanical responses is particularly valuable for field applications, where gearbox casings are subject to continuously varying thermal and load conditions. By isolating the damage-related trends, SSAT ensures that the extracted features solely represent the physical evolution of the crack, enabling precise and consistent tracking of structural degradation over time.
4. Discussion
4.1. Physical Interpretation of Crack Breathing Behavior
Results provide strong evidence of the physical mechanism governing a breathing fatigue crack in a cyclically loaded gearbox casing. As the crack propagates, local stiffness decreases, leading to increased casing deflection and increased vibration amplitude responses. During the crack’s opening phase the decreased stiffness amplifies vibration energy, while partial contact during the closed phase introduces nonlinear stiffness variations. This dynamic behavior increases amplitudes at each gear mesh and planet passage (modulation) and can be clearly observable in both the C-SSA and the HT-FB-SES. The progressive rise in root mean square (RMS) energy reflects the combined effects of stiffness degradation, nonlinear contact, and cyclic strain redistribution. At higher load/torque levels, prolonged crack opening intensifies the amplitude modulation, resulting in steeper RMS growth in both C-SSA and its squared envelope signal.
4.2. Sensor Behavior and Structural Dynamics
The spatial variation in sensor responses offers valuable insights into the structural dynamics of the casing. The RR-4 sensor effectively captured localized vibration changes being the closest to the crack location, while the RF-2 sensor exhibits the highest sensitivity and strongest correlation with crack growth. The RL-3 sensor shows limited response at 100% load but increased amplitude at higher torque, indicating that casing distortion extends the strain field to more distant regions as loading intensifies. The RR-4 sensor’s response stabilizes in later stages, likely due to stress redistribution as the crack extends beyond its local region. These distinct patterns confirm that the detected vibration changes are localized manifestations of structural degradation rather than global excitation effects. The findings highlight the compliance of the casing as a dynamic structure, transitioning from localized crack breathing to broader flexibility as damage progresses. Practically, it is often not feasible to place multiple sensors on a single component. Most helicopter HUMS would have only one sensor on the casing. Therefore, multiple sensors would help to understand the physics behind a failure mode and perhaps provide insights into how to strategically place the accelerometer to capture both local and distributed responses for effective structural diagnostics.
4.3. Quantitative Comparison and Sensitivity Analysis
Table 1 summarizes the root mean square (RMS) increases for the RF-2, RL-3 and RR-4, sensors across load conditions, comparing the C-SSA and Hilbert-based squared-envelope (HT-FBSES) methods. The table demonstrates a consistent increase in both time-domain (C-SSA) and HT-FB-SES RMS metrics (or CI) across all sensors, reflecting the proportional relationship between vibration energy, crack severity, and applied load. The RF-2 sensor exhibits the highest RMS increases, with values of 19.1%, 27.9%, and 34.1% for C-SSA and 44.6%, 66.7%, and 74.7% for HT-FB-SES signals at 100%, 125%, and 150% loads, respectively, highlighting its superior sensitivity to crack-induced dynamic effects. The RR-4 sensor shows significant RMS increases (11.7%, 17.4%, and 16.4% for C-SSA; 20.0%, 35.3%, and 34.4% for HT-FB-SES), capturing localized vibration changes effectively. The RL-3 sensor, furthest from the crack, records the smallest increases (2.6%, 15.6%, and 24.4% for C-SSA; 4.4%, 32.1%, and 51.7% for HT-FBW-SES), with a more pronounced response at higher loads, indicating the spread of the strain field to distant regions as the crack progresses.
The HT-FB-SES / C-SSA sensitivity ratio, ranging from 1.7 to 2.4 across the sensors and load levels, underscores the enhanced diagnostic capability of the squared-envelope method, particularly for the RF-2 sensor, which consistently shows the highest sensitivity. This ratio reflects the nonlinearity introduced by the crack’s breathing behavior and the influence of load on stiffness modulation, confirming the reliability of these metrics for early-stage crack detection and monitoring across diverse sensor placements.
4.4. Integrated Framework Performance
The integrated approach combining C-SSA, Hilbert squared-envelope demodulation, and SSAT filtering establishes a robust framework for detecting and monitoring breathing-related features in gearbox casings. These techniques produce consistent and interpretable indicators that align closely with physical observations and measured crack length. This methodology bridges the gap between controlled laboratory studies and real-world operational monitoring, offering a reliable foundation for gearbox diagnostics in variable thermal and load conditions. The framework’s ability to isolate and trend damage-related features enhances its applicability for continuous structural health monitoring in practical settings.
5. Summary, Conclusions and Future Work
This study developed and validated a robust signal processing framework for detecting and monitoring breathing cracks in planetary gearbox casings using vibration sensors mounted on the casing.
The Carrier-Synchronous Signal Average (C-SSA) effectively isolates the carrier-related vibration response. It reveals a consistent increase in root mean square (RMS) energy, directly correlating with stiffness degradation due to crack propagation.
The Hilbert-Based Squared-Envelope Analysis (HB-SES) method significantly enhances sensitivity to nonlinear amplitude modulation caused by the crack’s breathing behavior. It provides earlier and more pronounced detection of structural damage compared to traditional RMS metrics, with sensitivity ratios of 1.7–2.4 times higher across load conditions.
The Singular Spectrum Analysis Technique (SSAT) successfully eliminates low-frequency oscillations induced by environmental temperature variations, ensuring that the extracted vibration indicators accurately reflect mechanical deterioration rather than external influences.
In terms of the effects of sensor placement, the RR-4 sensor, positioned closest to the crack initiation point, effectively captures localized vibration changes. Meanwhile, the RF-2 sensor, aligned with the load reaction direction and maximum bending stress, exhibits the highest sensitivity and strongest correlation with crack growth. The RL-3 sensor, located furthest from the crack, detects secondary deformation effects, particularly at higher torque levels, highlighting the spread of the strain field.
The combination of C-SSA, Hilbert squared-envelope analysis, and SSAT filtering provides a quantitative and physically interpretable approach for tracking crack progression under cyclic torque. This framework delivers reliable indicators that align well with observed crack growth and structural dynamics. These results demonstrate that the proposed vibration-based framework, integrating C-SSA, Hilbert demodulation, and SSAT, effectively captures the dynamic signature of breathing cracks in gearbox casings. It establishes a foundation for long-term health and usage monitoring systems (HUMS), enabling early fault detection and supporting predictive maintenance in aerospace and industrial applications.
Future research will focus on incorporating model-based feature extraction, multi-sensor data fusion, and validation under variable speed and load conditions to enhance the frame-work’s applicability for real-world deployment.
Author Contributions
Conceptualization, N.S. and W.W.; methodology, N.S. and W.W.; software, N.S.; validation, N.S.; formal analysis, N.S.; investigation, N.S.; resources, N.S and W.W.; data curation, N.S. and W.W.; writing—original draft preparation, N.S.; writing—review and editing, N.S., and W.W. ; visualization, N.S.; supervision, W.W. All authors have read and agreed to the published version of the manuscript.
Funding
This research received no external funding.
Institutional Review Board Statement
Not applicable.
Data Availability Statement
The data used in this work was similar to that provided in a data challenge organized in the DSTG International HUMS conference [6]. The details of the test can be accessed using the following link: https://www.dst.defence.gov.au/our-technologies/hums2025-data-challenge. Data used in this paper can be made available upon request.
Acknowledgments
The authors gratefully acknowledge the invaluable contributions and support received throughout the various stages of the Bell-206B MRG pinion gear seeded fault testing project, which led to the development of the casing crack dataset used in the HUMS2025 Data Challenge. We extend our sincere thanks to the Defence Science and Technology Group (DSTG) test team; David Blunt, Andrew Becker, James Harris, Peter Stanhope, Riyazal Hussein, Jordan Carroll, Brad Bielenberg, Eric Lee, and Anna Houston, whose efforts in designing and conducting the seeded fault tests were instrumental in generating the dataset. We also acknowledge the contributions of the crack fractography analysis team, including Vui-Tung Mau and James Niclis (QinetiQ), as well as Cathy Smith and Nick Athiniotis (DSTG), for their expertise in assessing and quantifying the fracture surfaces of the casing. Finally, the authors thank the management of the DSTG Platforms Division for their ongoing support of the HUMS Conference series. During the preparation of this manuscript/study, the authors used MATLAB® R2025a for the purposes of data analysis and signal processing. The authors have reviewed and edited the output and take full responsibility for the content of this publication.”.
Conflicts of Interest
The authors declare no conflicts of interests.
Abbreviations
The following abbreviations are used in this manuscript:
| H-SSA | Hunting-tooth Synchronous Signal Average |
| C-SSA | Carrier Synchronous Signal Average |
| HT | Hilbert Transform |
| FB | Full Bandwidth |
| SES | Squared Envelope Signal |
| SSAT | Singular Spectrum Analysis Technique |
| RMS | Root Mean Squared |
| HUMS | Health Usage and Monitoring System |
| PHM | Prognostic Health Management |
| RF-2 | Ring Front Sensor 2 |
| RL-3 | Ring Left Sensor 3 |
| RR-4 | Ring Rear Sensor 4 |
| DSTG | Defence Science and Technology Group |
| HTTF | Helicopter Transmission Test Facility |
References
- Jardine, A.K.S.; Lin, D.; Banjevic, D. A Review on Machinery Diagnostics and Prognostics. Mech. Syst. Signal Process. 2006, 20, 1483–1510. [Google Scholar] [CrossRef]
- Lei, Y.; He, Z.; Zi, Y. Condition Monitoring and Fault Diagnosis of Planetary Gearboxes: A Review. Mech. Syst. Signal Process. 2013, 38, 1–20. [Google Scholar] [CrossRef]
- Molina Vicuña, C. Theoretical Frequency Analysis for Planetary Gearboxes. Forsch. Ingenieurwes 2012, 76, 1–13. [Google Scholar] [CrossRef]
- Du, C.; Shi, Z.; Chen, J.; Li, H.; Zhang, C. Dynamics Modeling of Faulty Planetary Gearboxes by Time-Varying Mesh Stiffness and Friction Excitation. Mech. Syst. Signal Process. 2024, 210, 111291. [Google Scholar] [CrossRef]
- Nie, Y.; Lu, H.; Chen, X.; Li, G.; Zhang, C.; Wang, L. Interpreting Vibration Characteristics of Planetary Gearboxes Based on a Novel Transfer Path Effect Model. Nonlinear Dyn. 2025, 113, 9351–9371. [Google Scholar] [CrossRef]
- HUMS 2025 Data Challenge. Defence Science and Technology Group. Available online: https://www.dst.defence.gov.au/our-technologies/hums2025-data-challenge (accessed on 10 October 2025).
- Abraham, O.N.L.; Brandon, J.A. The Modelling of the Opening and Closure of a Crack. J. Vib. Acoust. 1995, 117, 370–377. [Google Scholar] [CrossRef]
- Chondros, T.G.; Dimarogonas, A.D.; Yao, J. Vibration of a Beam with a Breathing Crack. J. Sound Vib. 2001, 239, 57–67. [Google Scholar] [CrossRef]
- Rivola, A.; White, P.R. Bispectral Analysis of the Bilinear Oscillator with Application to Fatigue Crack Detection. J. Sound Vib. 1998, 216, 889–910. [Google Scholar] [CrossRef]
- Peng, Z.K.; Tse, P.W.; Chu, F.L. An Improved Hilbert–Huang Transform and Its Application in Fault Detection of Gearboxes. Mech. Syst. Signal Process. 2005, 19, 974–988. [Google Scholar] [CrossRef]
- Long, H.; Liu, Y.; Liu, K. Nonlinear Vibration Analysis of a Beam with a Breathing Crack. Appl. Sci. 2019, 9, 3874. [Google Scholar] [CrossRef]
- Madisetty, K.K.; Garikapati, D.; Jena, S.P. Detection of Faults and Vibration Analysis in Beam Structures—A Review. INCAS Bull. 2021, 13, 97–111. [Google Scholar] [CrossRef]
- Suresha, S.; Mallikarjuna Reddy, D. Dynamic Analysis of Beam with a Breathing Crack. Int. J. Mech. Eng. Technol. 2021, 12, 45–53. [Google Scholar]
- Yan, G.; De Stefano, A.; Matta, E.; Feng, R. A Novel Approach to Detecting Breathing-Fatigue Cracks Based on Dynamic Characteristics. Mech. Syst. Signal Process. 2012, 28, 703–717. [Google Scholar] [CrossRef]
- Qiu, S.; Zhang, L.; Hu, J.; Jiang, Y. Nonlinear Dynamic Response Analysis of a Cantilever Beam with a Breathing Crack. Eng. Struct. 2019, 188, 603–614. [Google Scholar] [CrossRef]
- Randall, R.B.; Sawalhi, N.; Blunt, D. A New Method for the Extraction of Planetary Gearbox Fault Features Using Synchronous Signal Averaging. Mech. Syst. Signal Process. 2011, 25, 1739–1752. [Google Scholar] [CrossRef]
- Bonnardot, F.; Randall, R.B.; Antoni, J. Enhanced Unsupervised Noise Cancellation Using Angular Resampling for Planetary Bearing Fault Diagnosis. Int. J. Acoust. Vib. 2004, 9, 83–89. [Google Scholar] [CrossRef]
- Golyandina, N.; Zhigljavsky, A. Singular Spectrum Analysis for Time Series. In Springer; Berlin, Germany, 2013. [Google Scholar]
- Vautard, R.; Yiou, P.; Ghil, M. Singular-Spectrum Analysis: A Toolkit for Short, Noisy Chaotic Signals. Physica D: Nonlinear Phenom. 1992, 58, 95–126. [Google Scholar] [CrossRef]
- Hassani, H. Singular Spectrum Analysis: Methodology and Comparison. Journal of Data Science 2007, Vol. 5(No. 2), 239–257. [Google Scholar] [CrossRef]
Figure 1.
(a) The cracked casing of the gearbox after failure (b) Side view of the fracture surface of the casing.
Figure 1.
(a) The cracked casing of the gearbox after failure (b) Side view of the fracture surface of the casing.
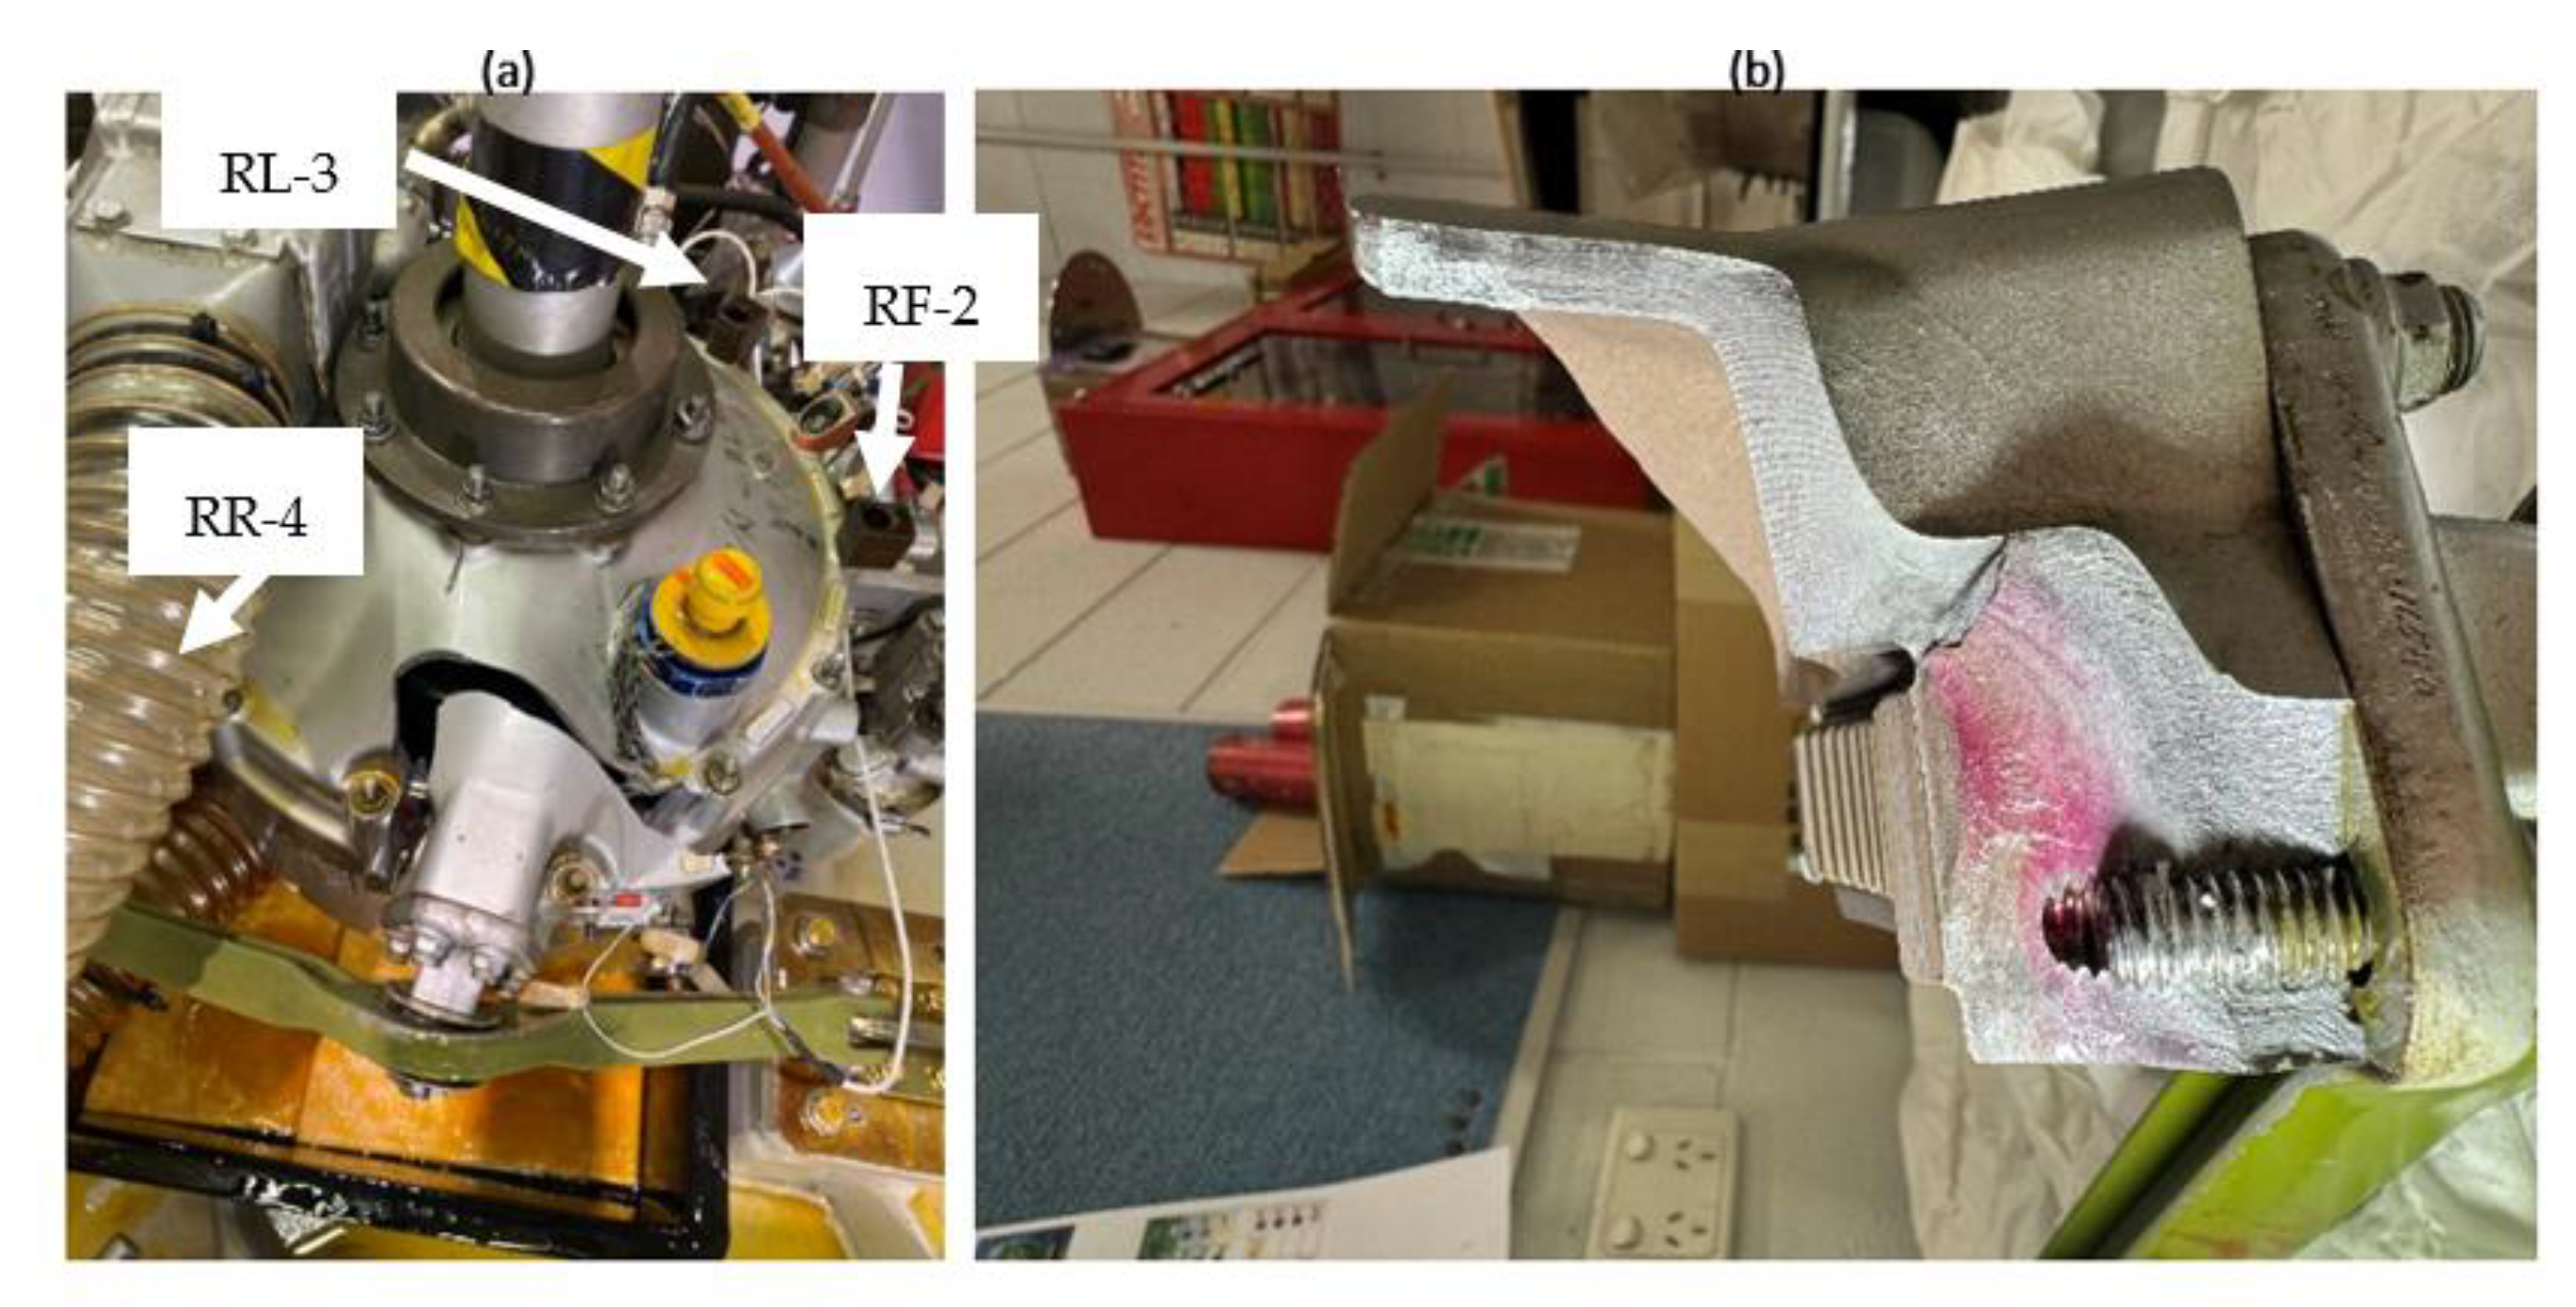
Figure 2.
(a) Casing support with reaction forces (b) the upper casing after piece detachment (c) Crack/initiation/propagation.
Figure 2.
(a) Casing support with reaction forces (b) the upper casing after piece detachment (c) Crack/initiation/propagation.
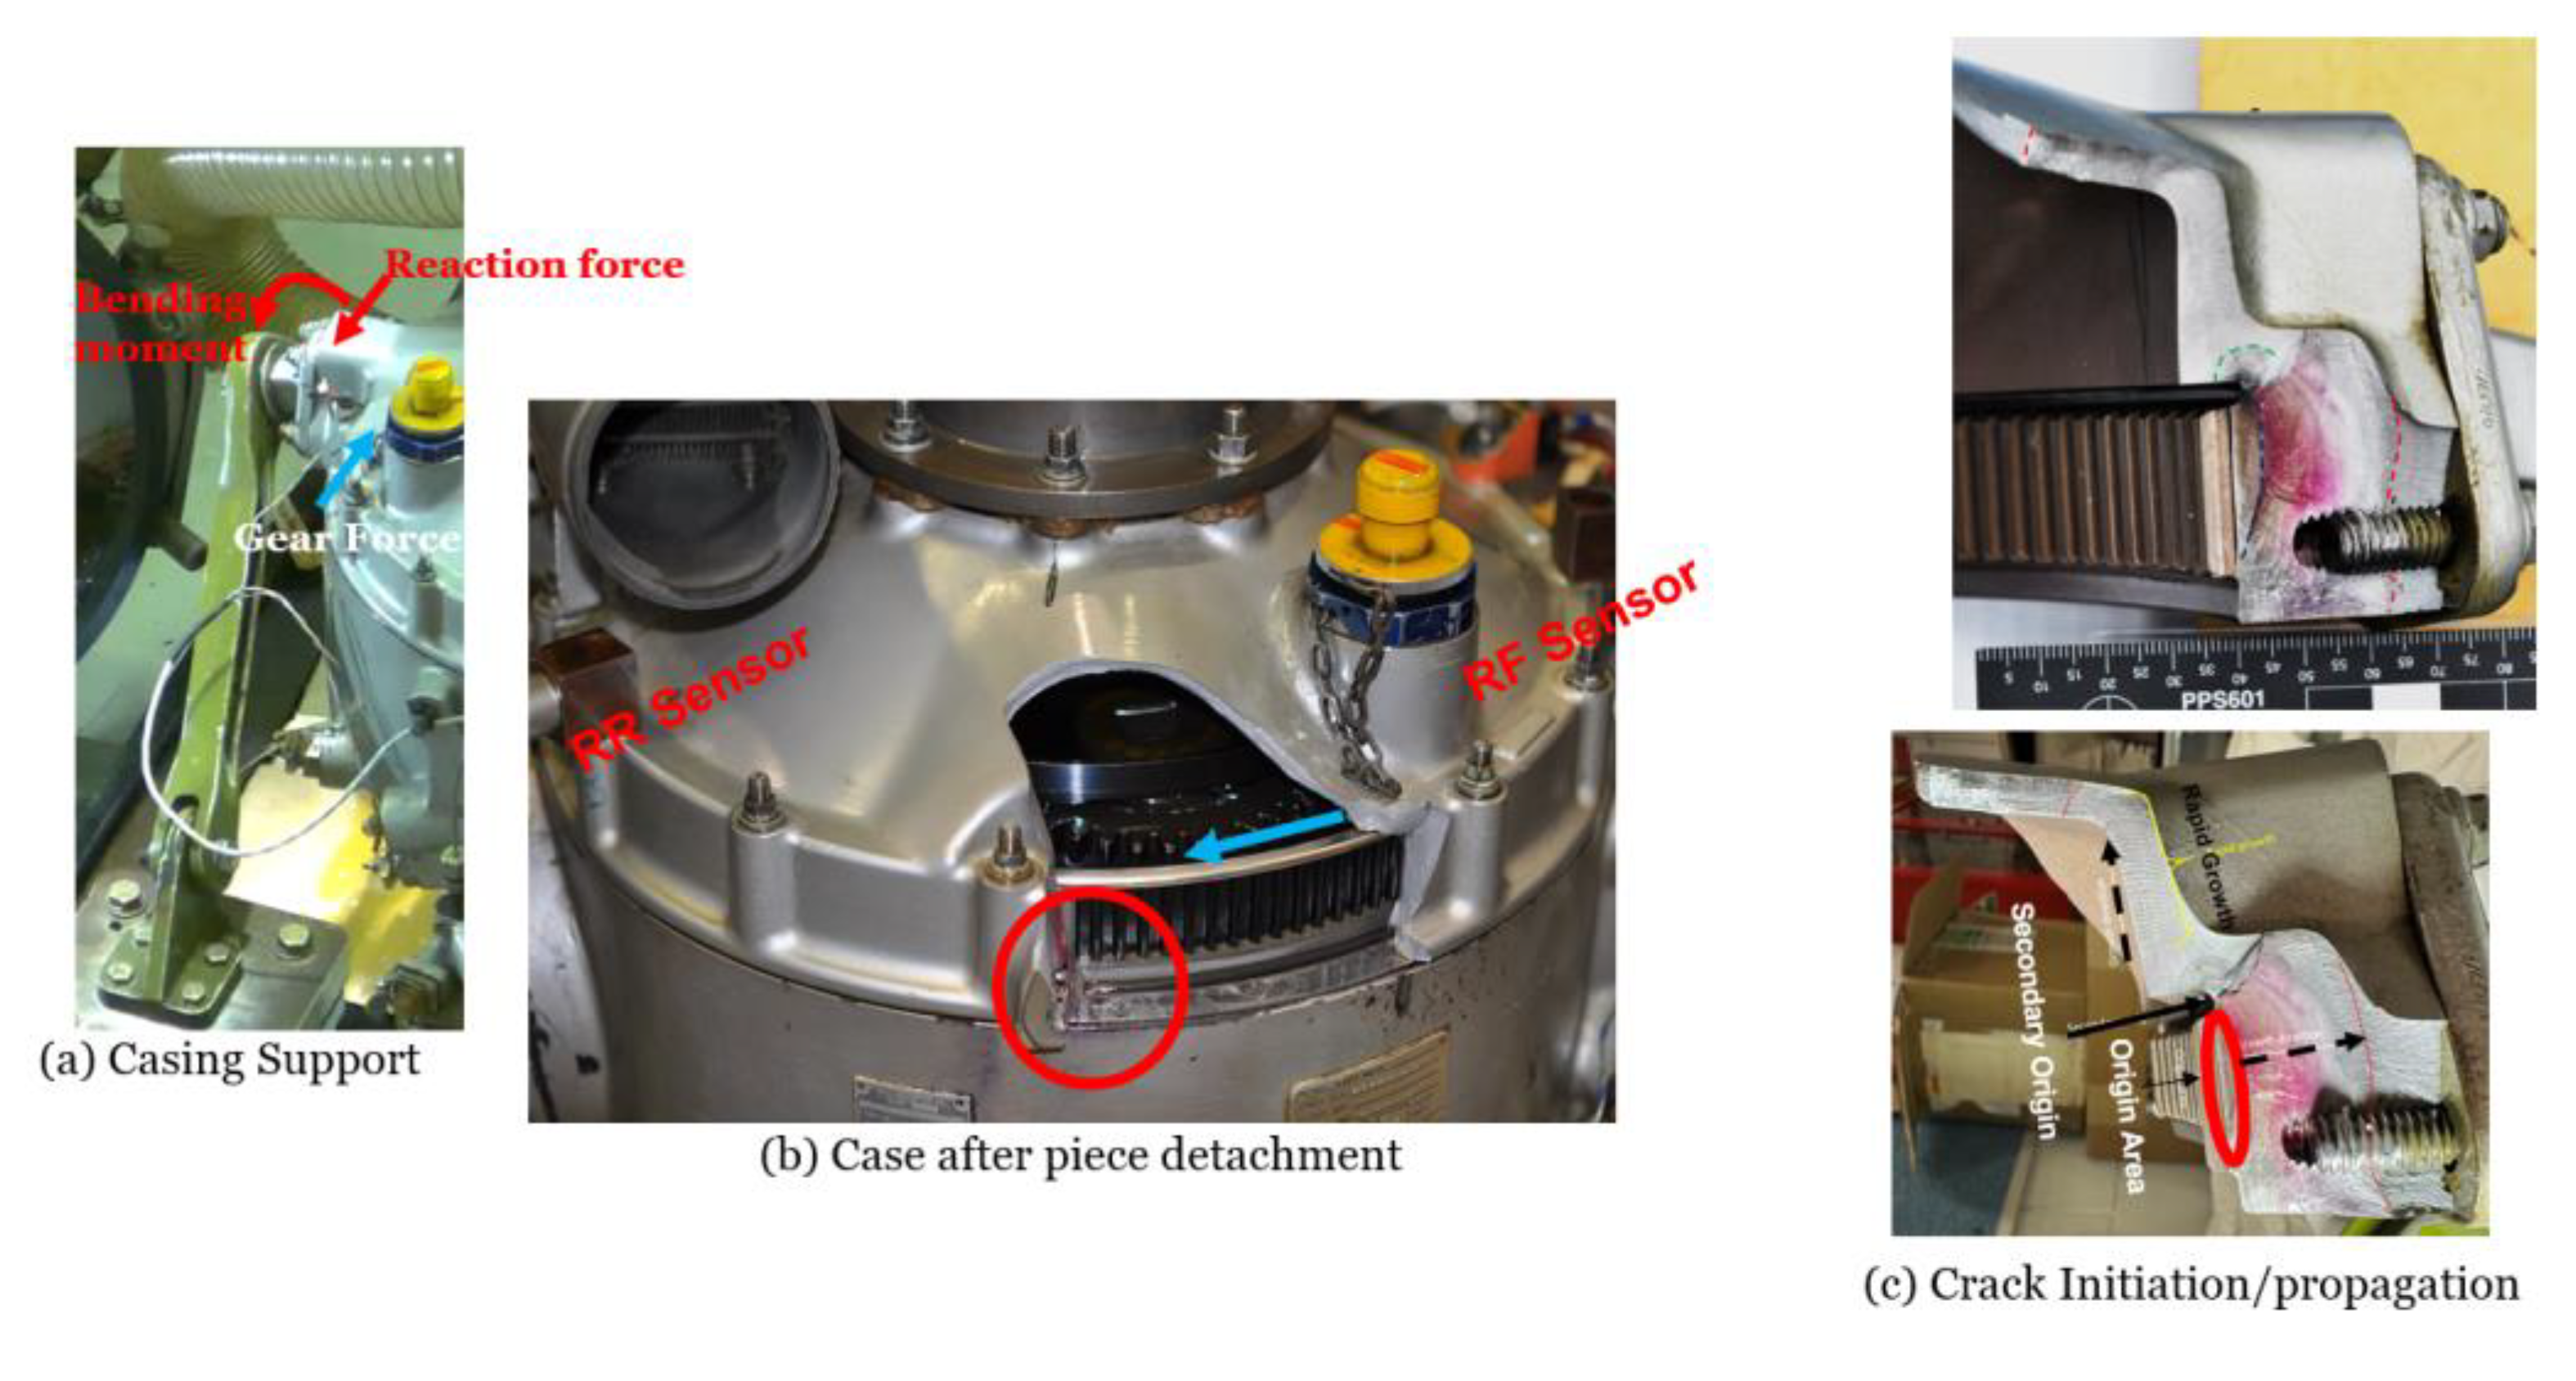
Figure 3.
Quantitative Fractography for Casing Crack Length Vs day of testing.
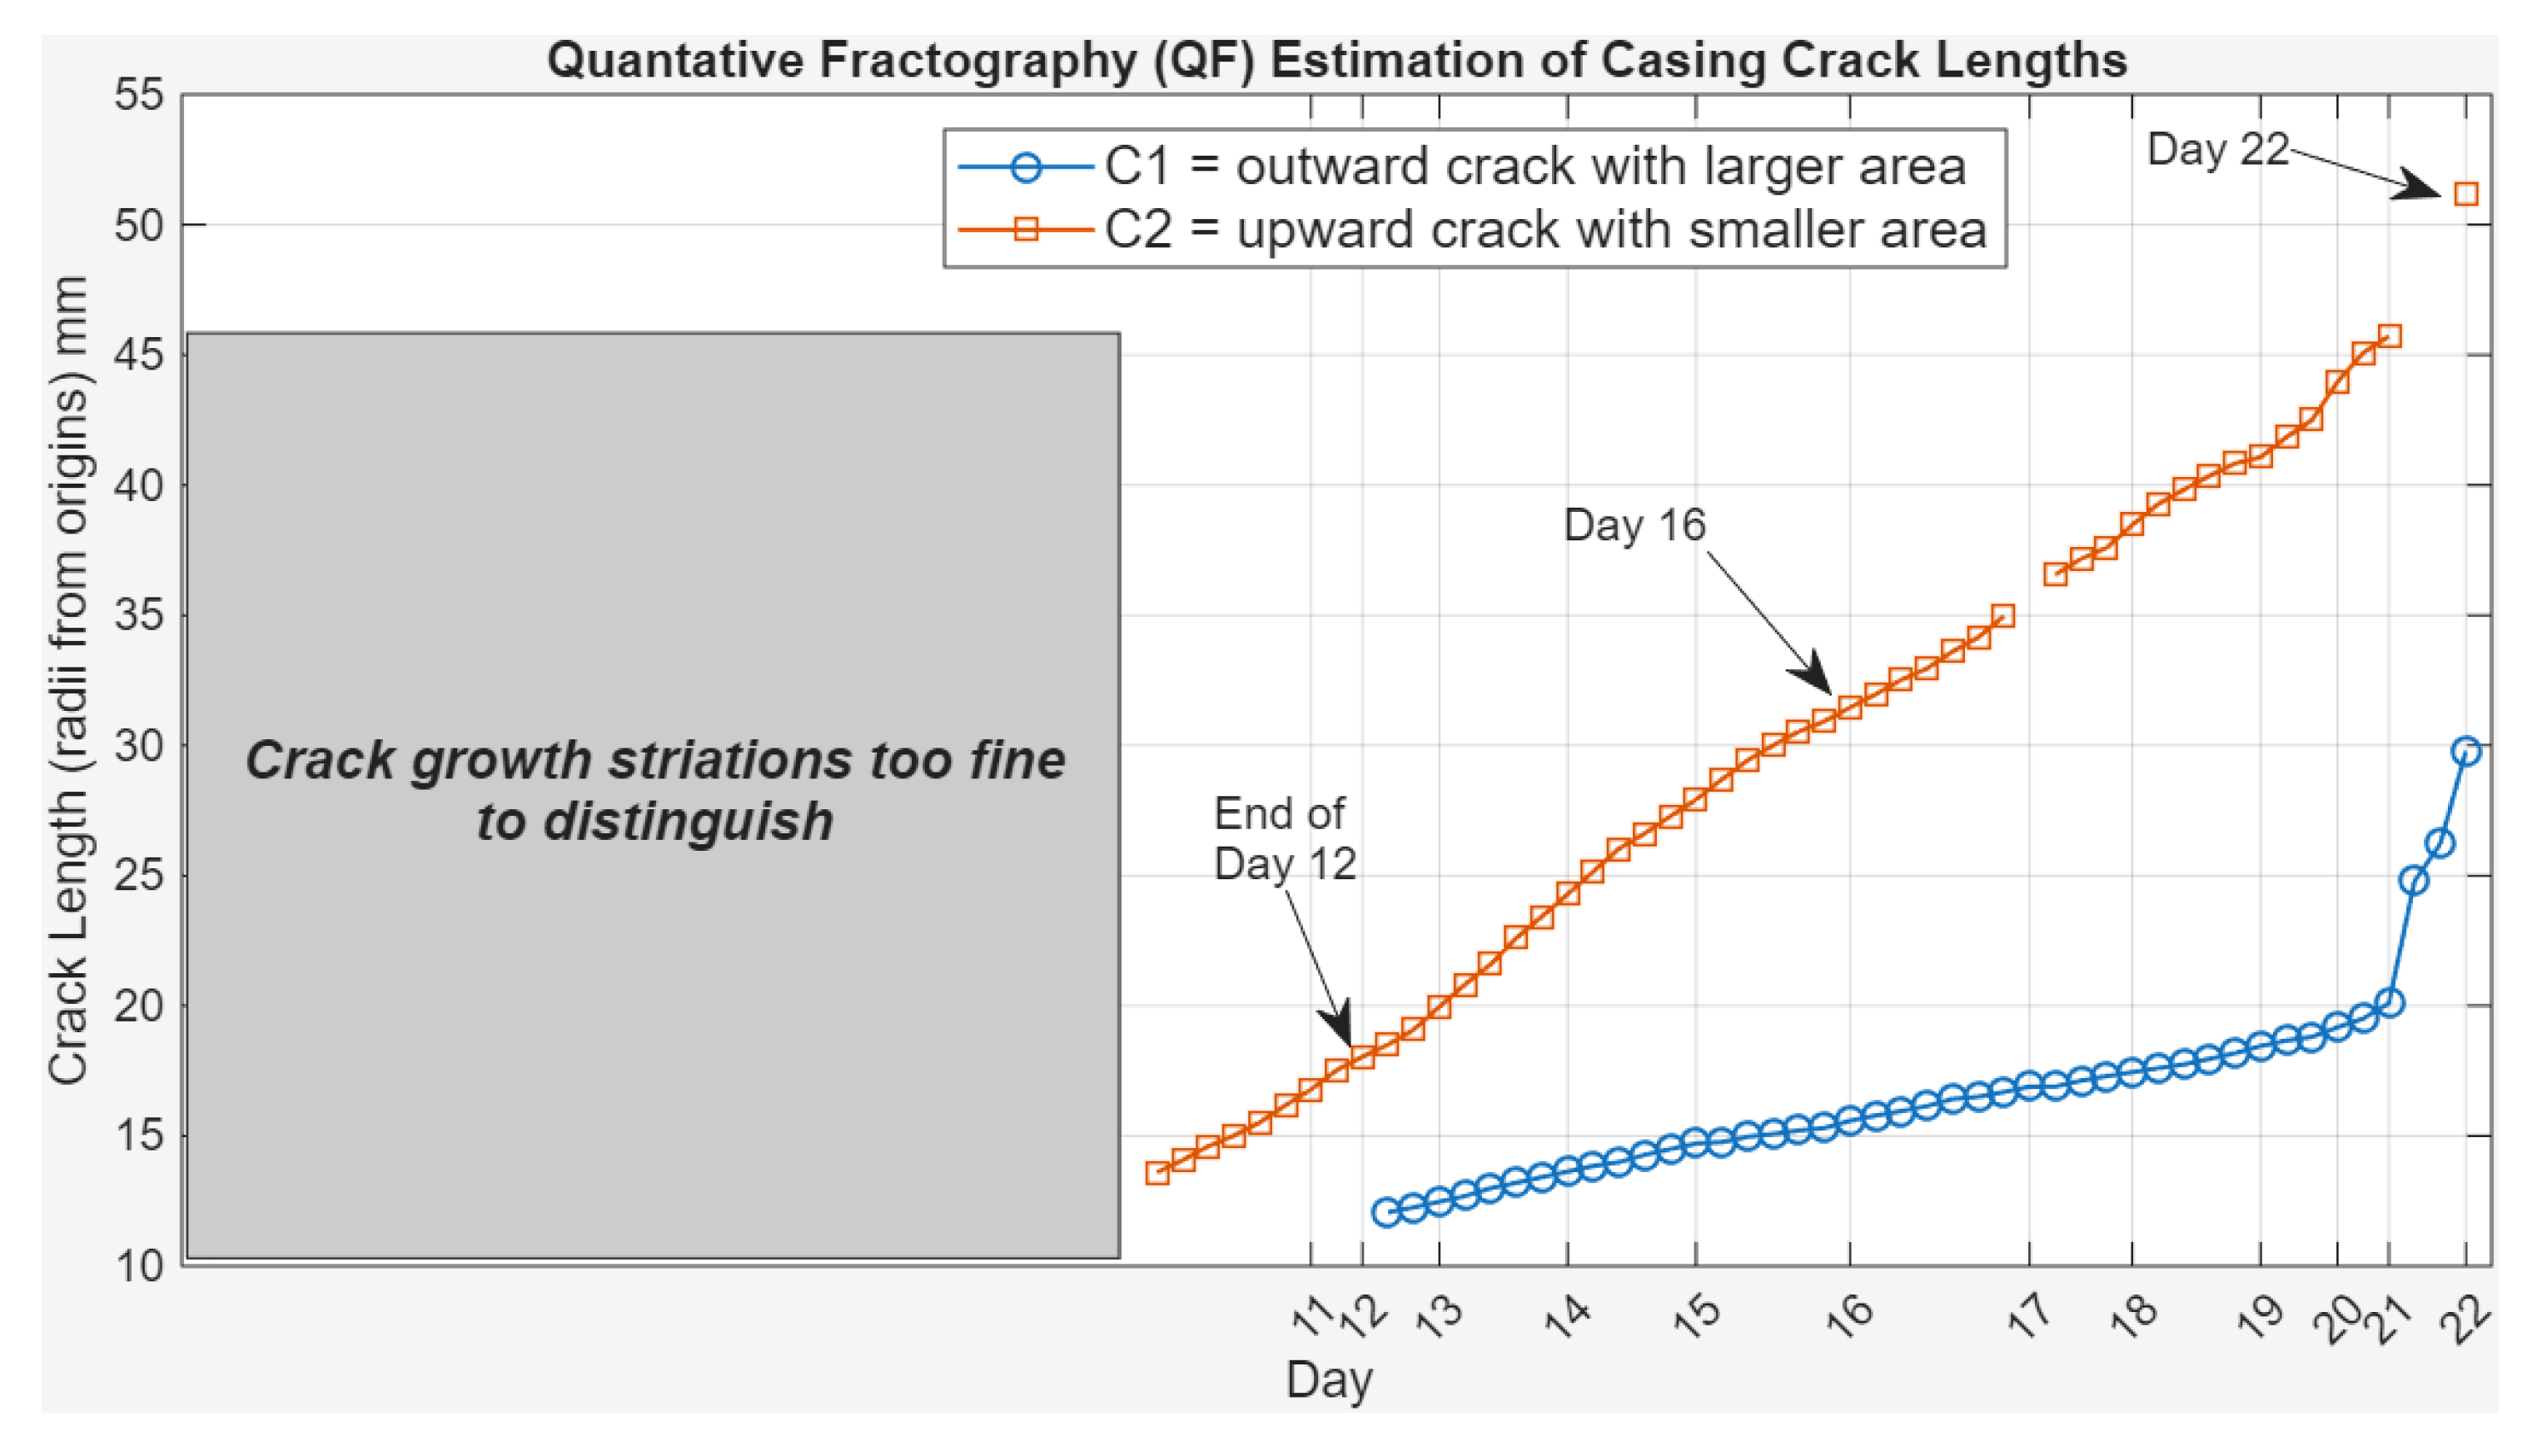
Figure 4.
Schematic Flow Diagram of the proposed signal processing algorithm.
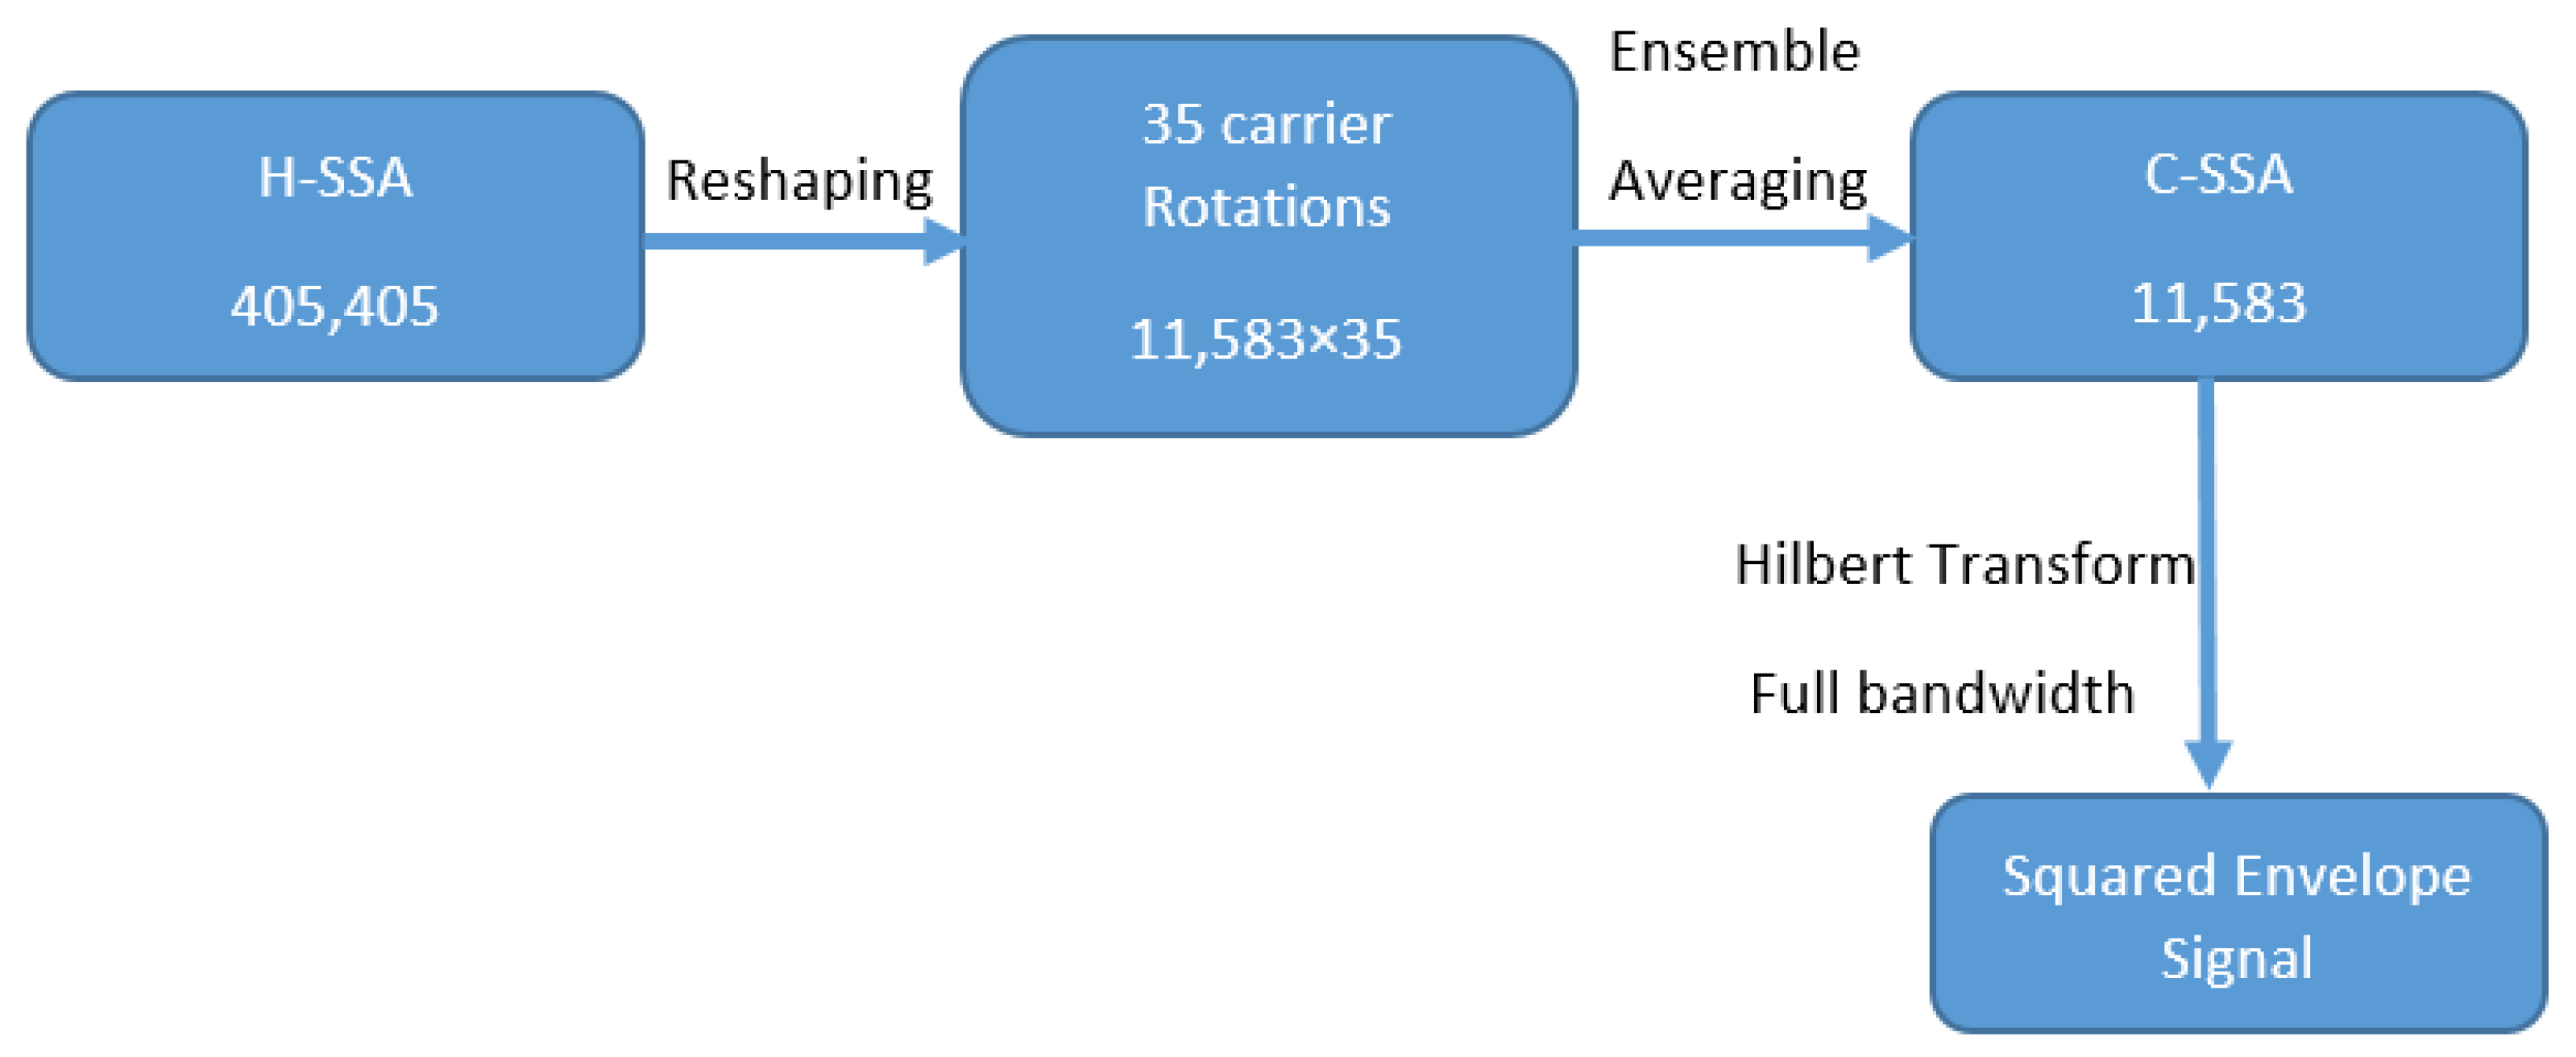
Figure 5.
(a) C-SSA RF-2 for Day 22 at 125% (b) C-SSA HT-FB-SES RF-2 for Day 22 at 125%.
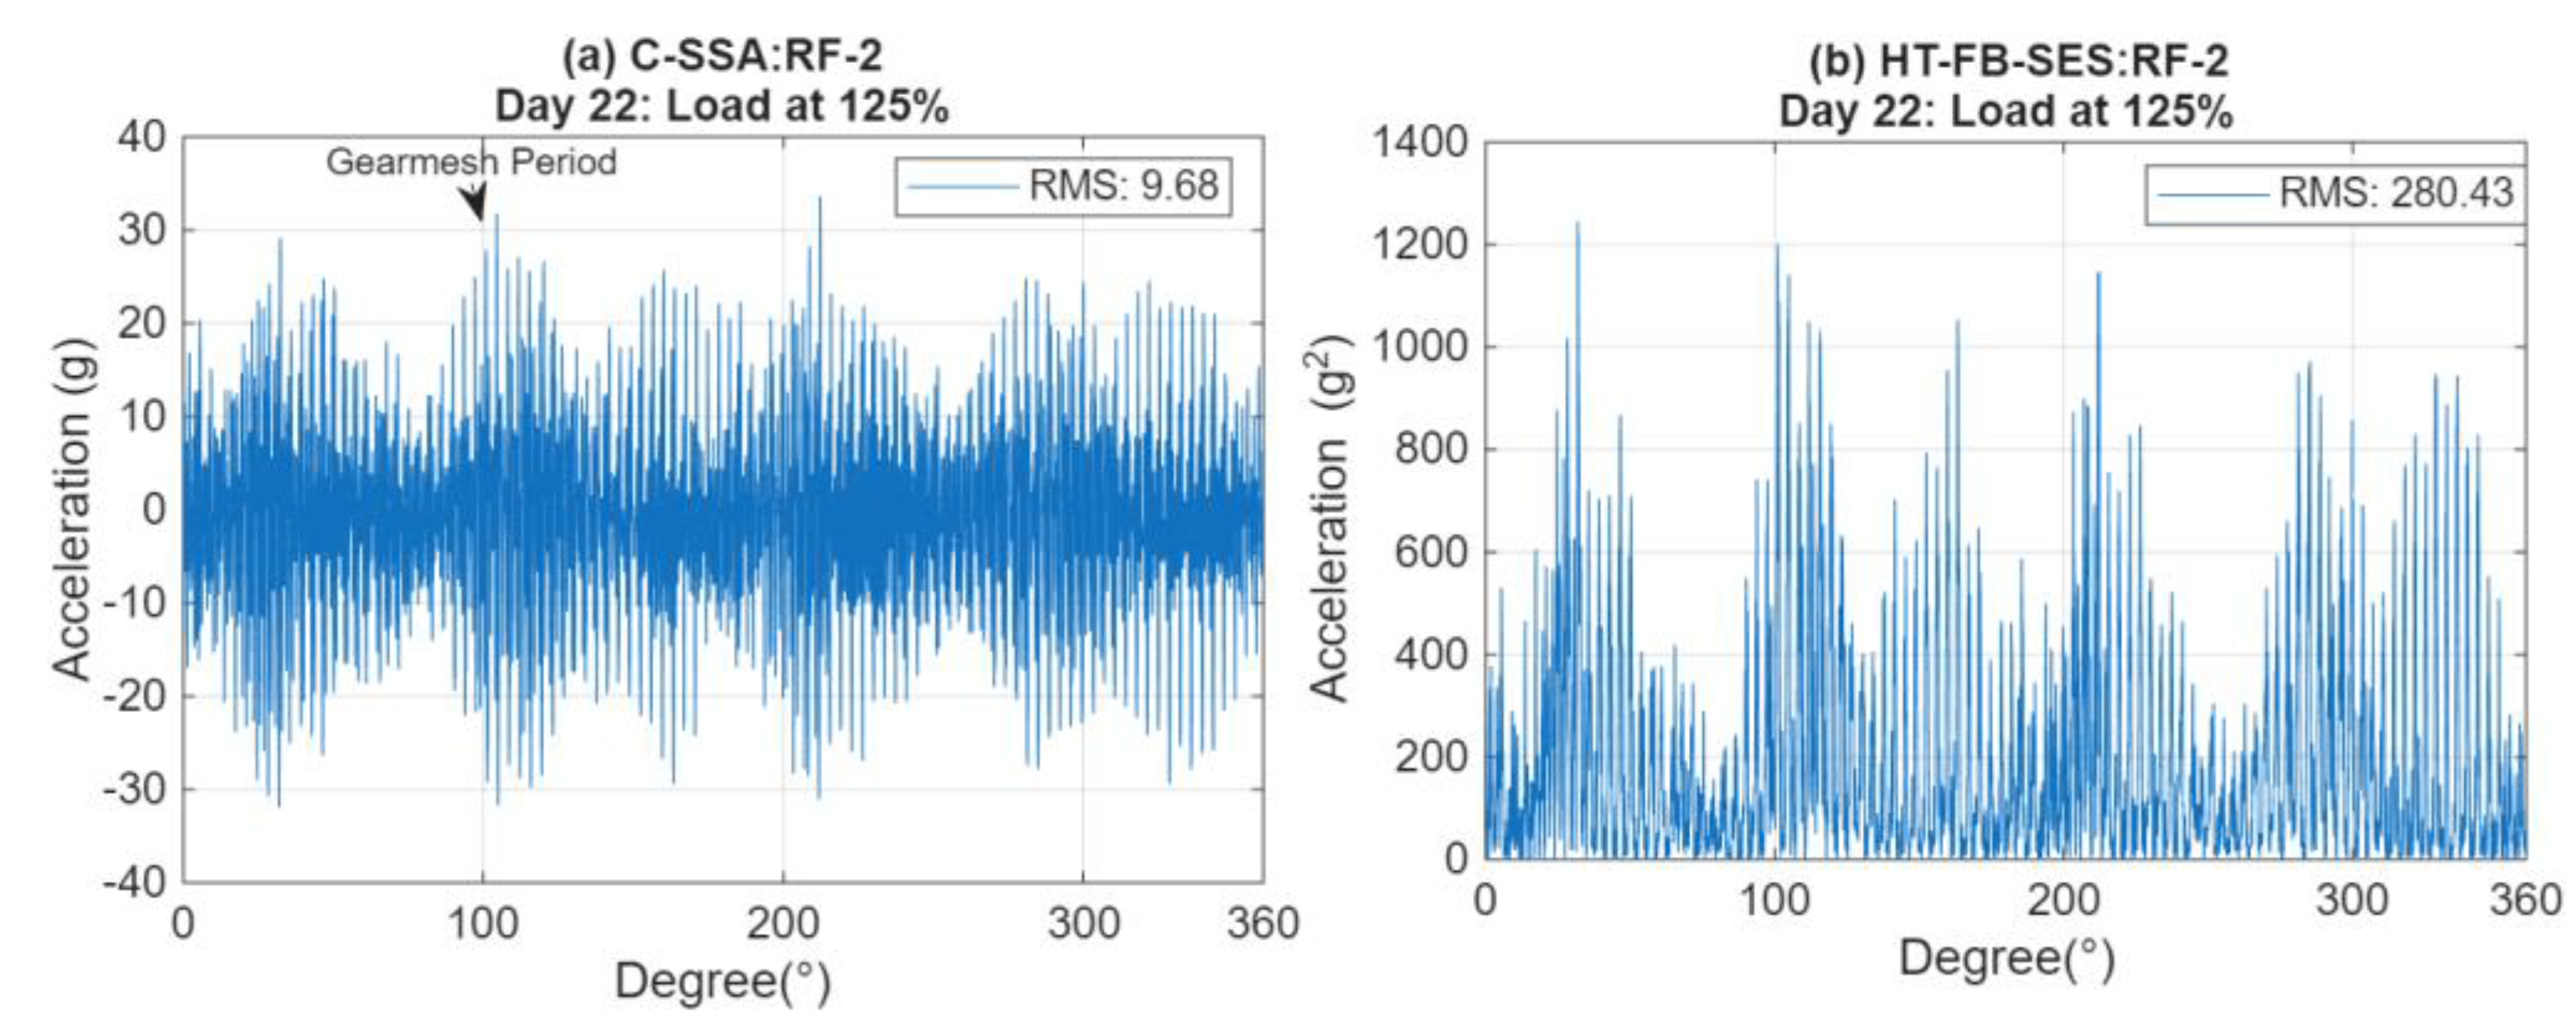
Figure 6.
(a) 100% RMS C-SSA Trends (b) 100% RMS C-SSA Long term trends (c) 100% RMS C-SSA cyclic trends (d) 100% RMS C-SSA random trends.
Figure 6.
(a) 100% RMS C-SSA Trends (b) 100% RMS C-SSA Long term trends (c) 100% RMS C-SSA cyclic trends (d) 100% RMS C-SSA random trends.

Figure 7.
C-SSA signals at an early stage (Left: day 3) and late stage (Right: day 22) of the crack at 125% load for RF-2 (top), RL-3 (middle) and RR-4 (bottom).
Figure 7.
C-SSA signals at an early stage (Left: day 3) and late stage (Right: day 22) of the crack at 125% load for RF-2 (top), RL-3 (middle) and RR-4 (bottom).
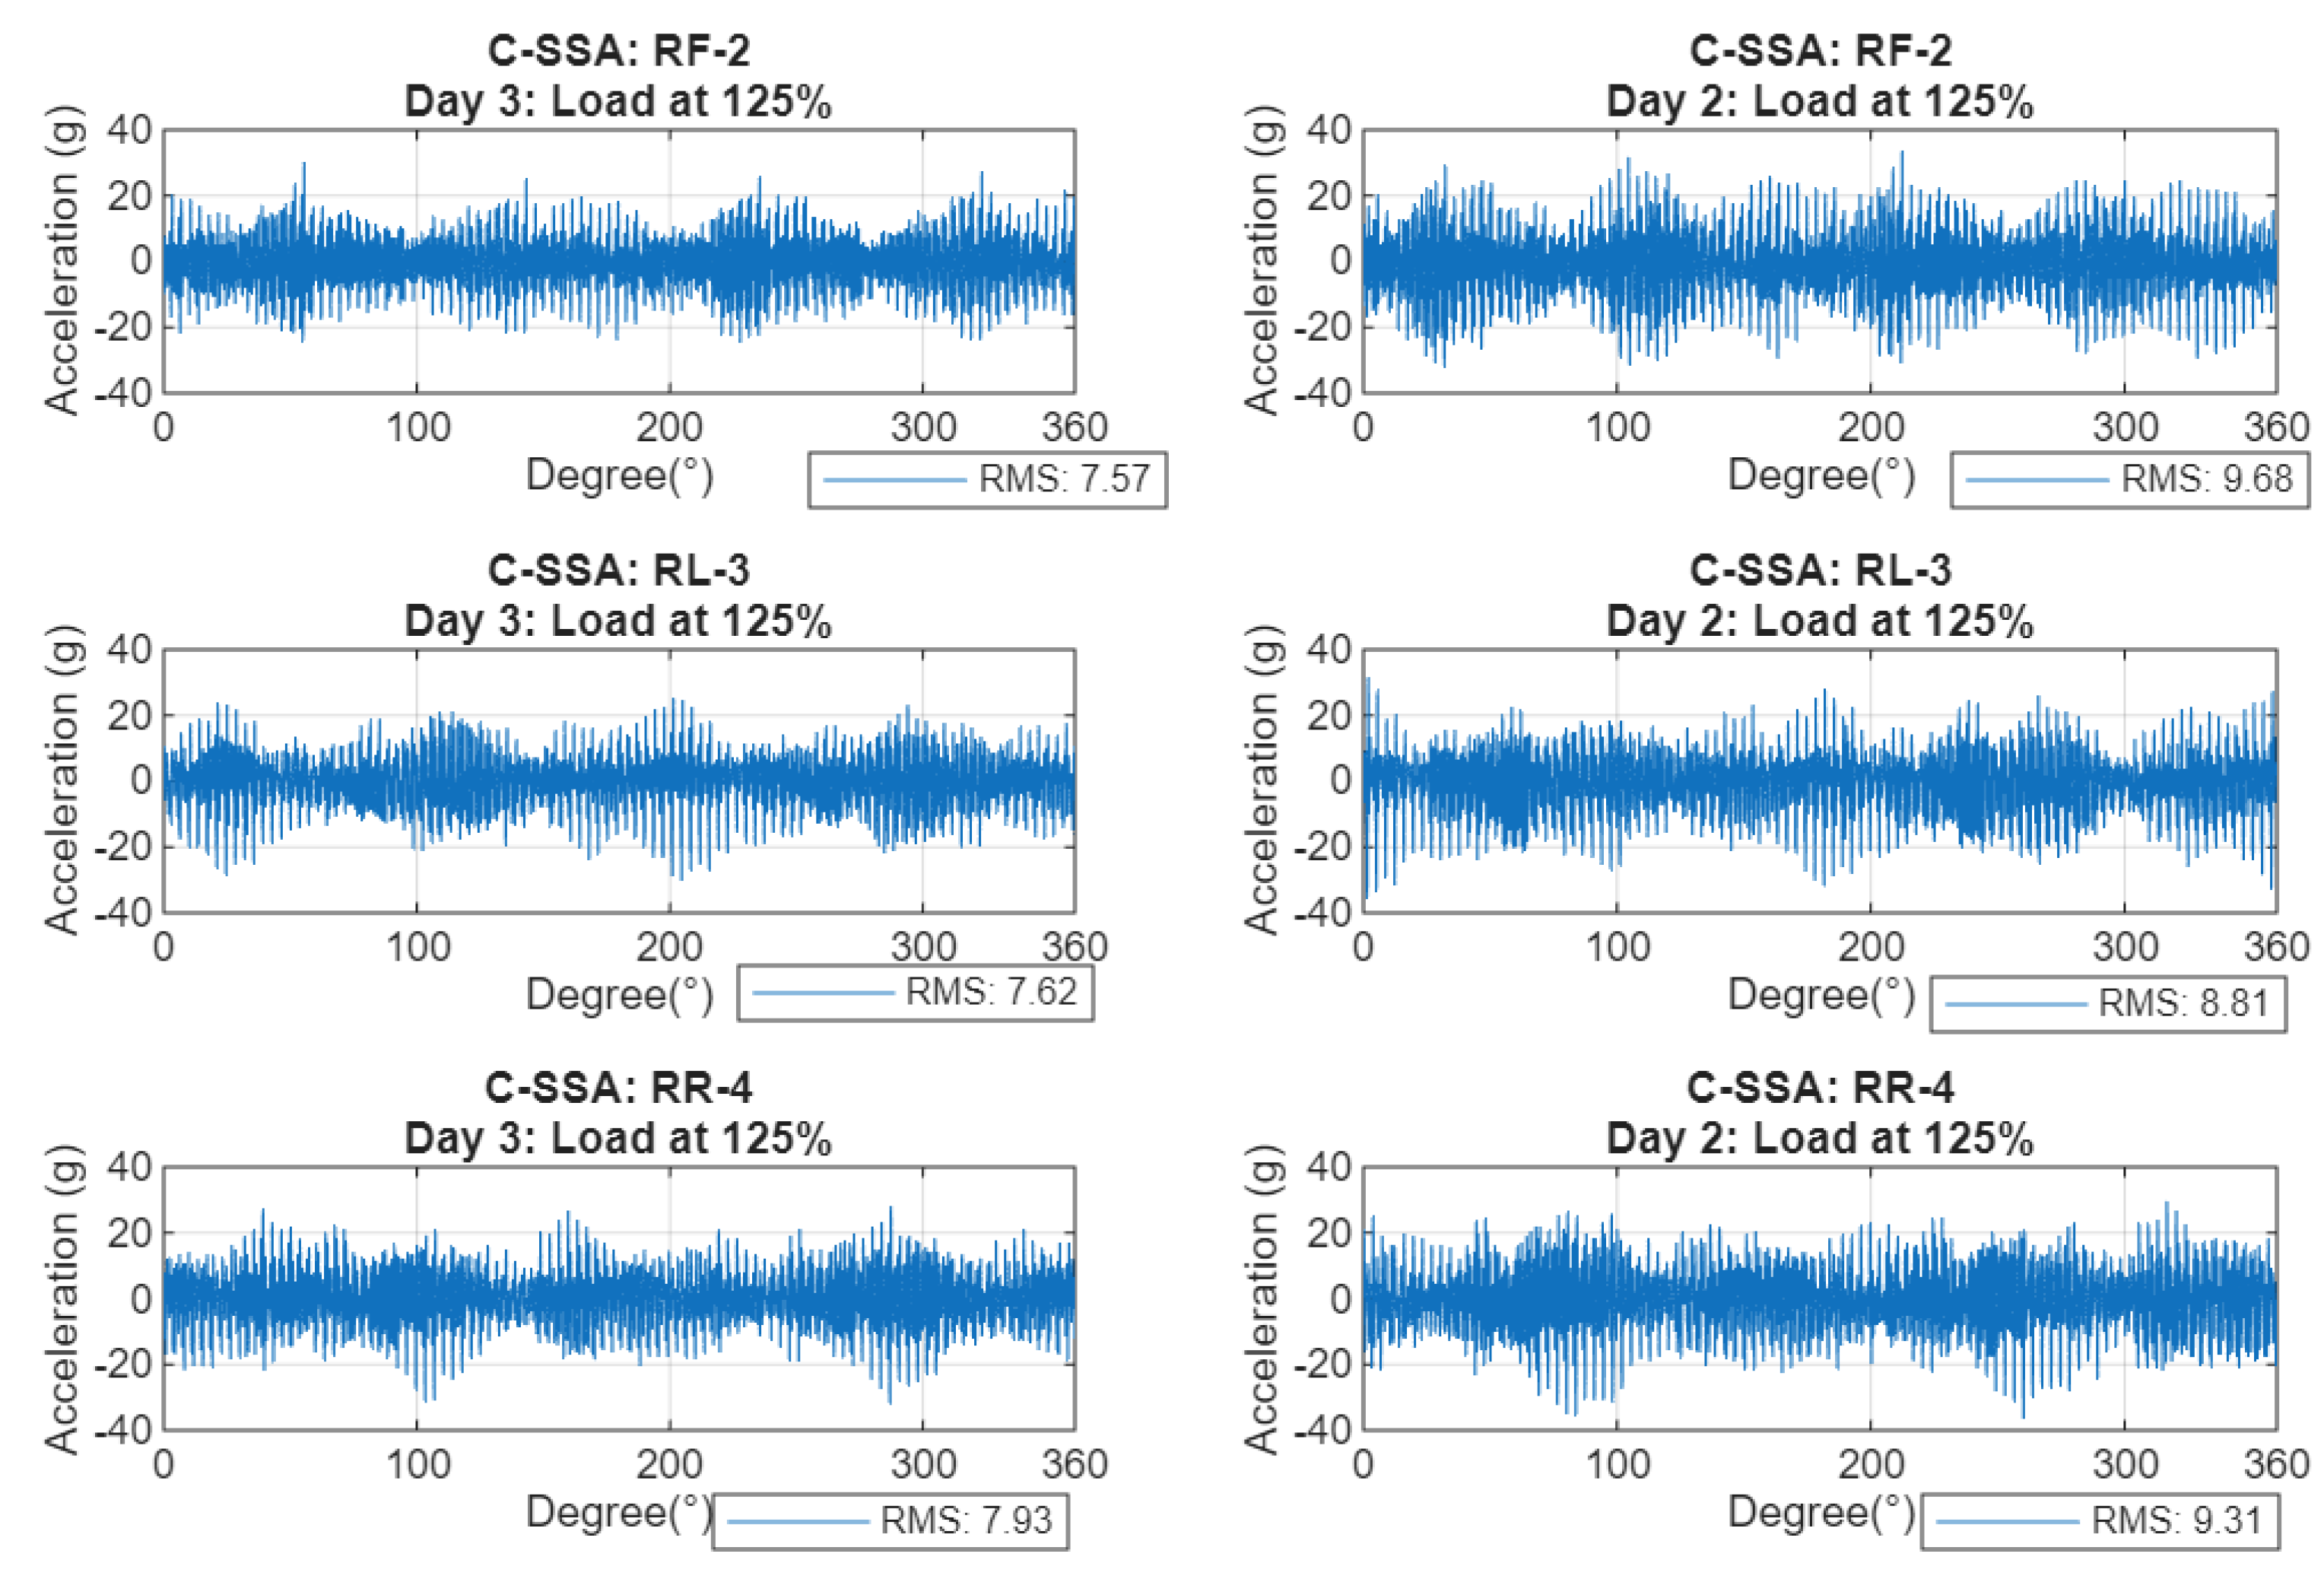
Figure 8.
C-SSA trends at (a) 150%, (b) 125% and (c) 100%.
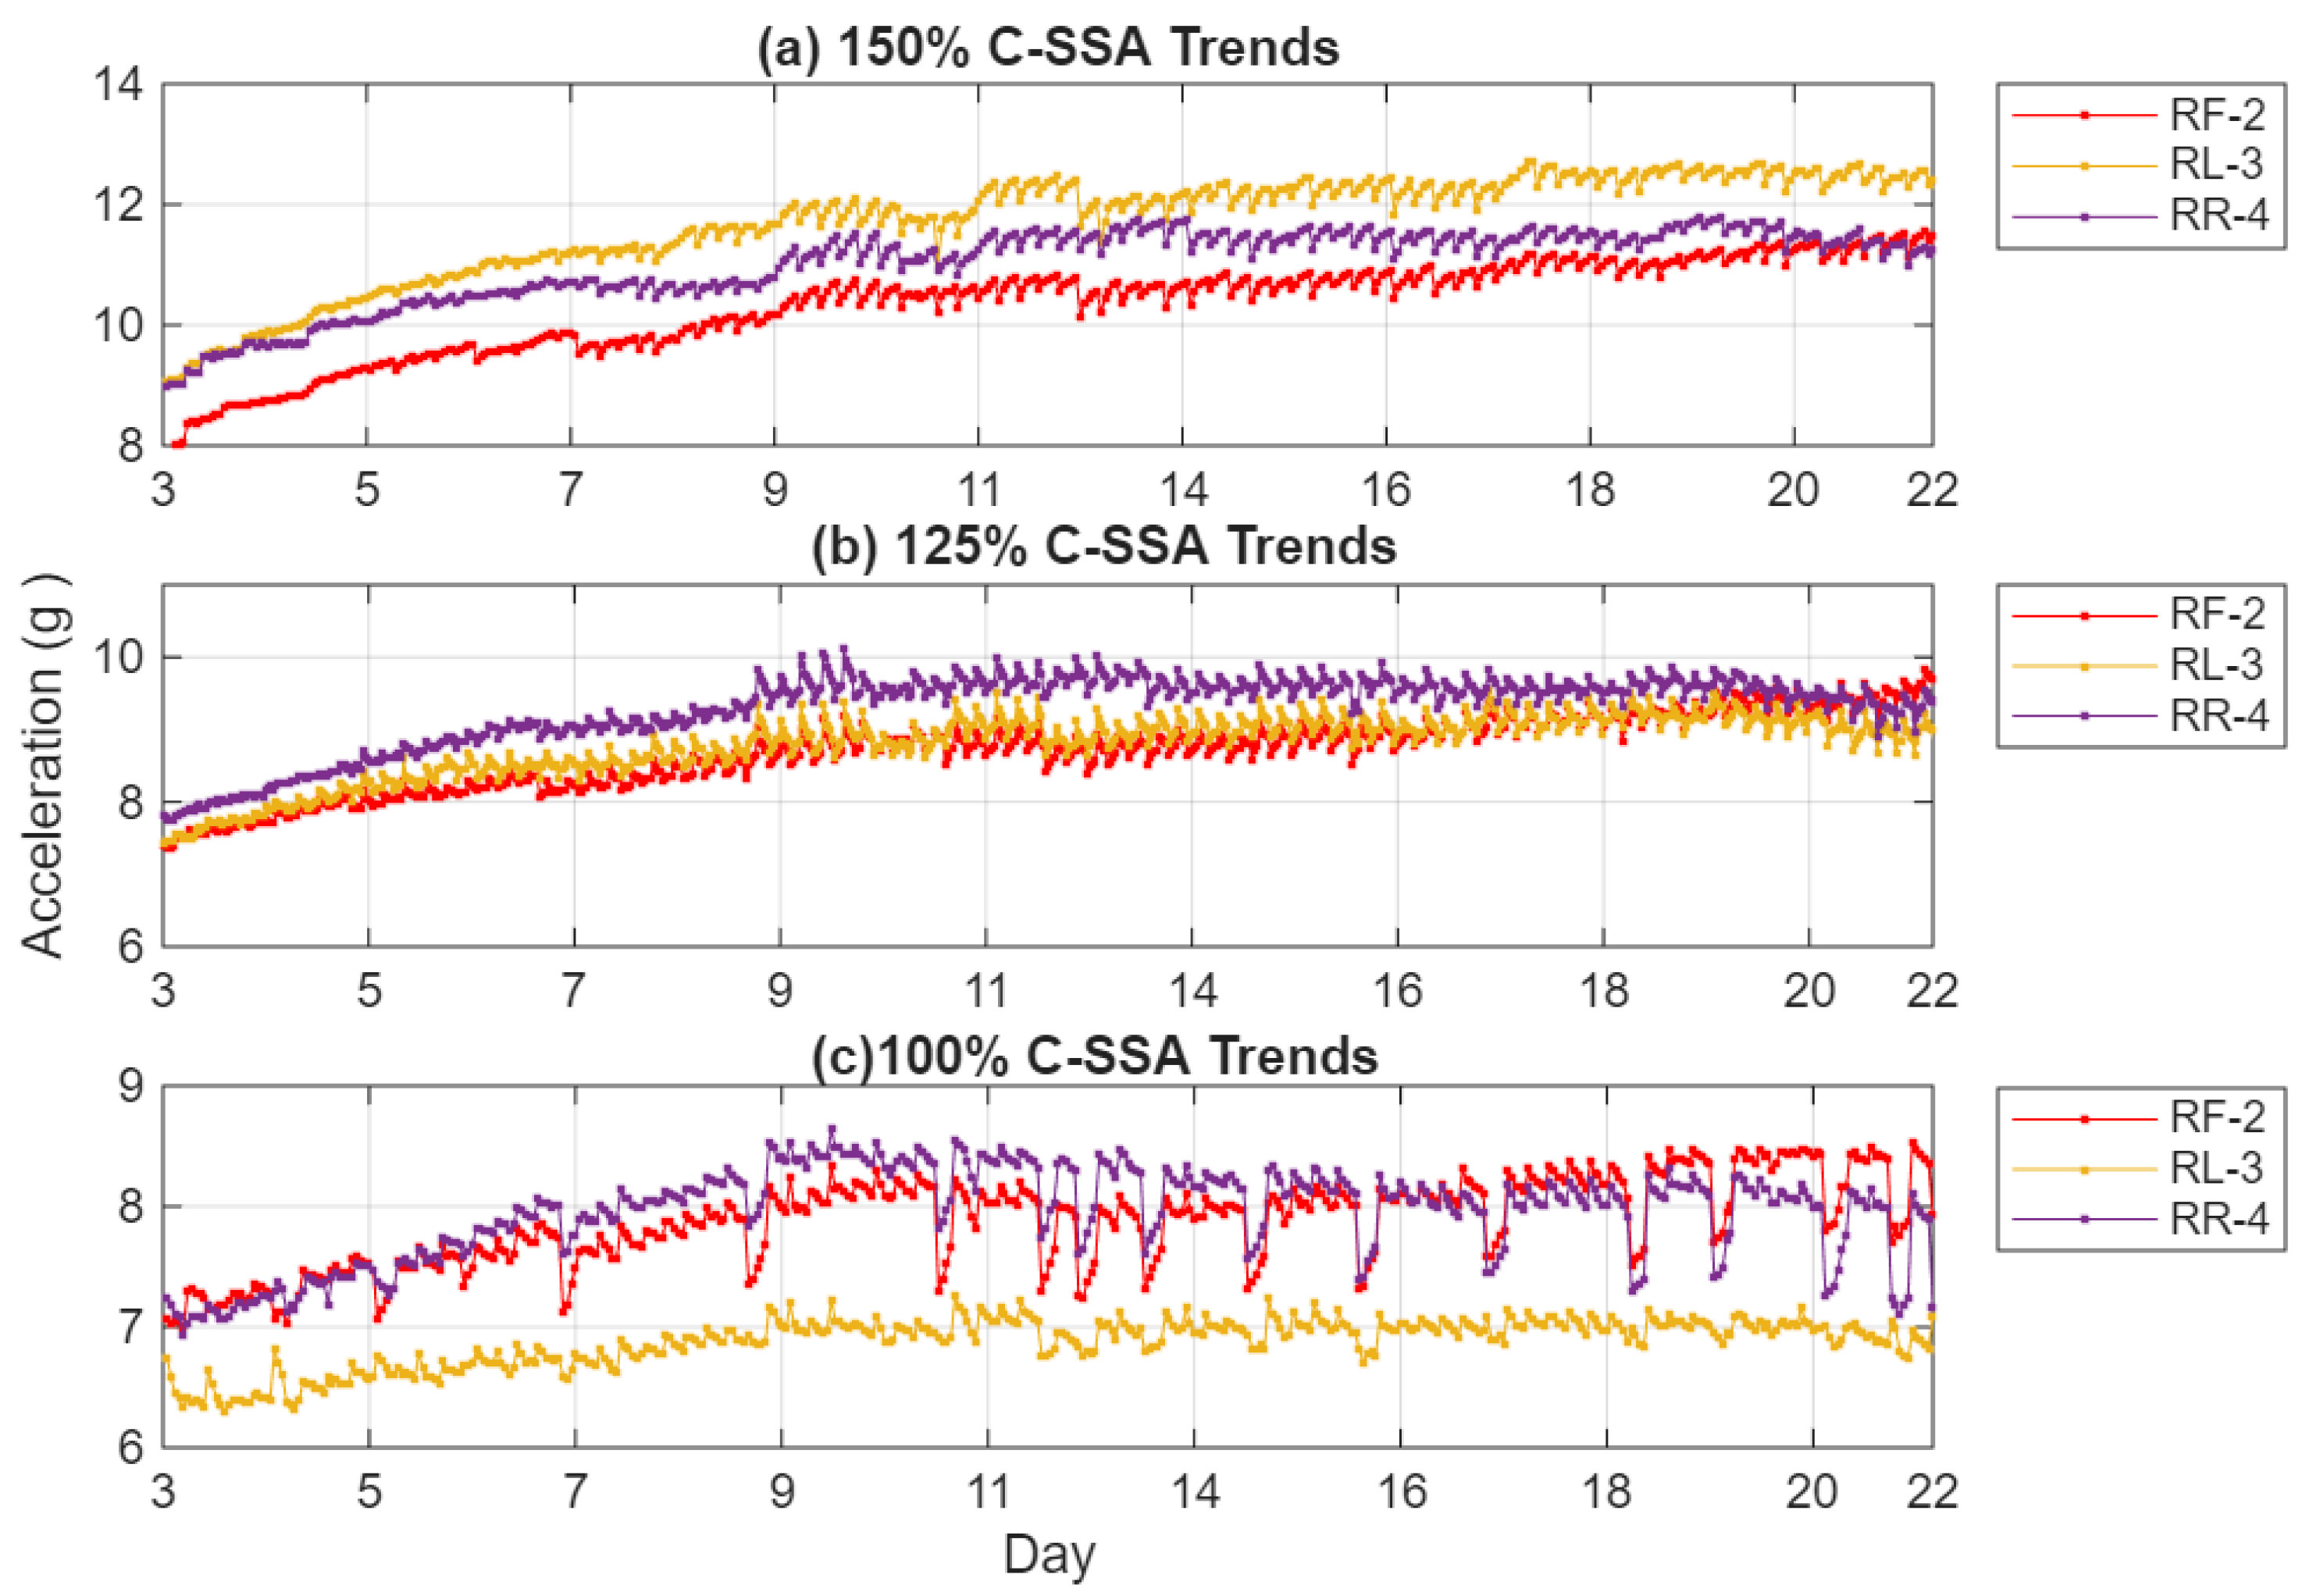
Figure 9.
HT-FB-SES of C-SSA signals at an early stage (Left: day 3) and late stage (Right: day 22) of the crack at 125% load for RF-2 (top), RL-3 (middle) and RR-4 (bottom).
Figure 9.
HT-FB-SES of C-SSA signals at an early stage (Left: day 3) and late stage (Right: day 22) of the crack at 125% load for RF-2 (top), RL-3 (middle) and RR-4 (bottom).
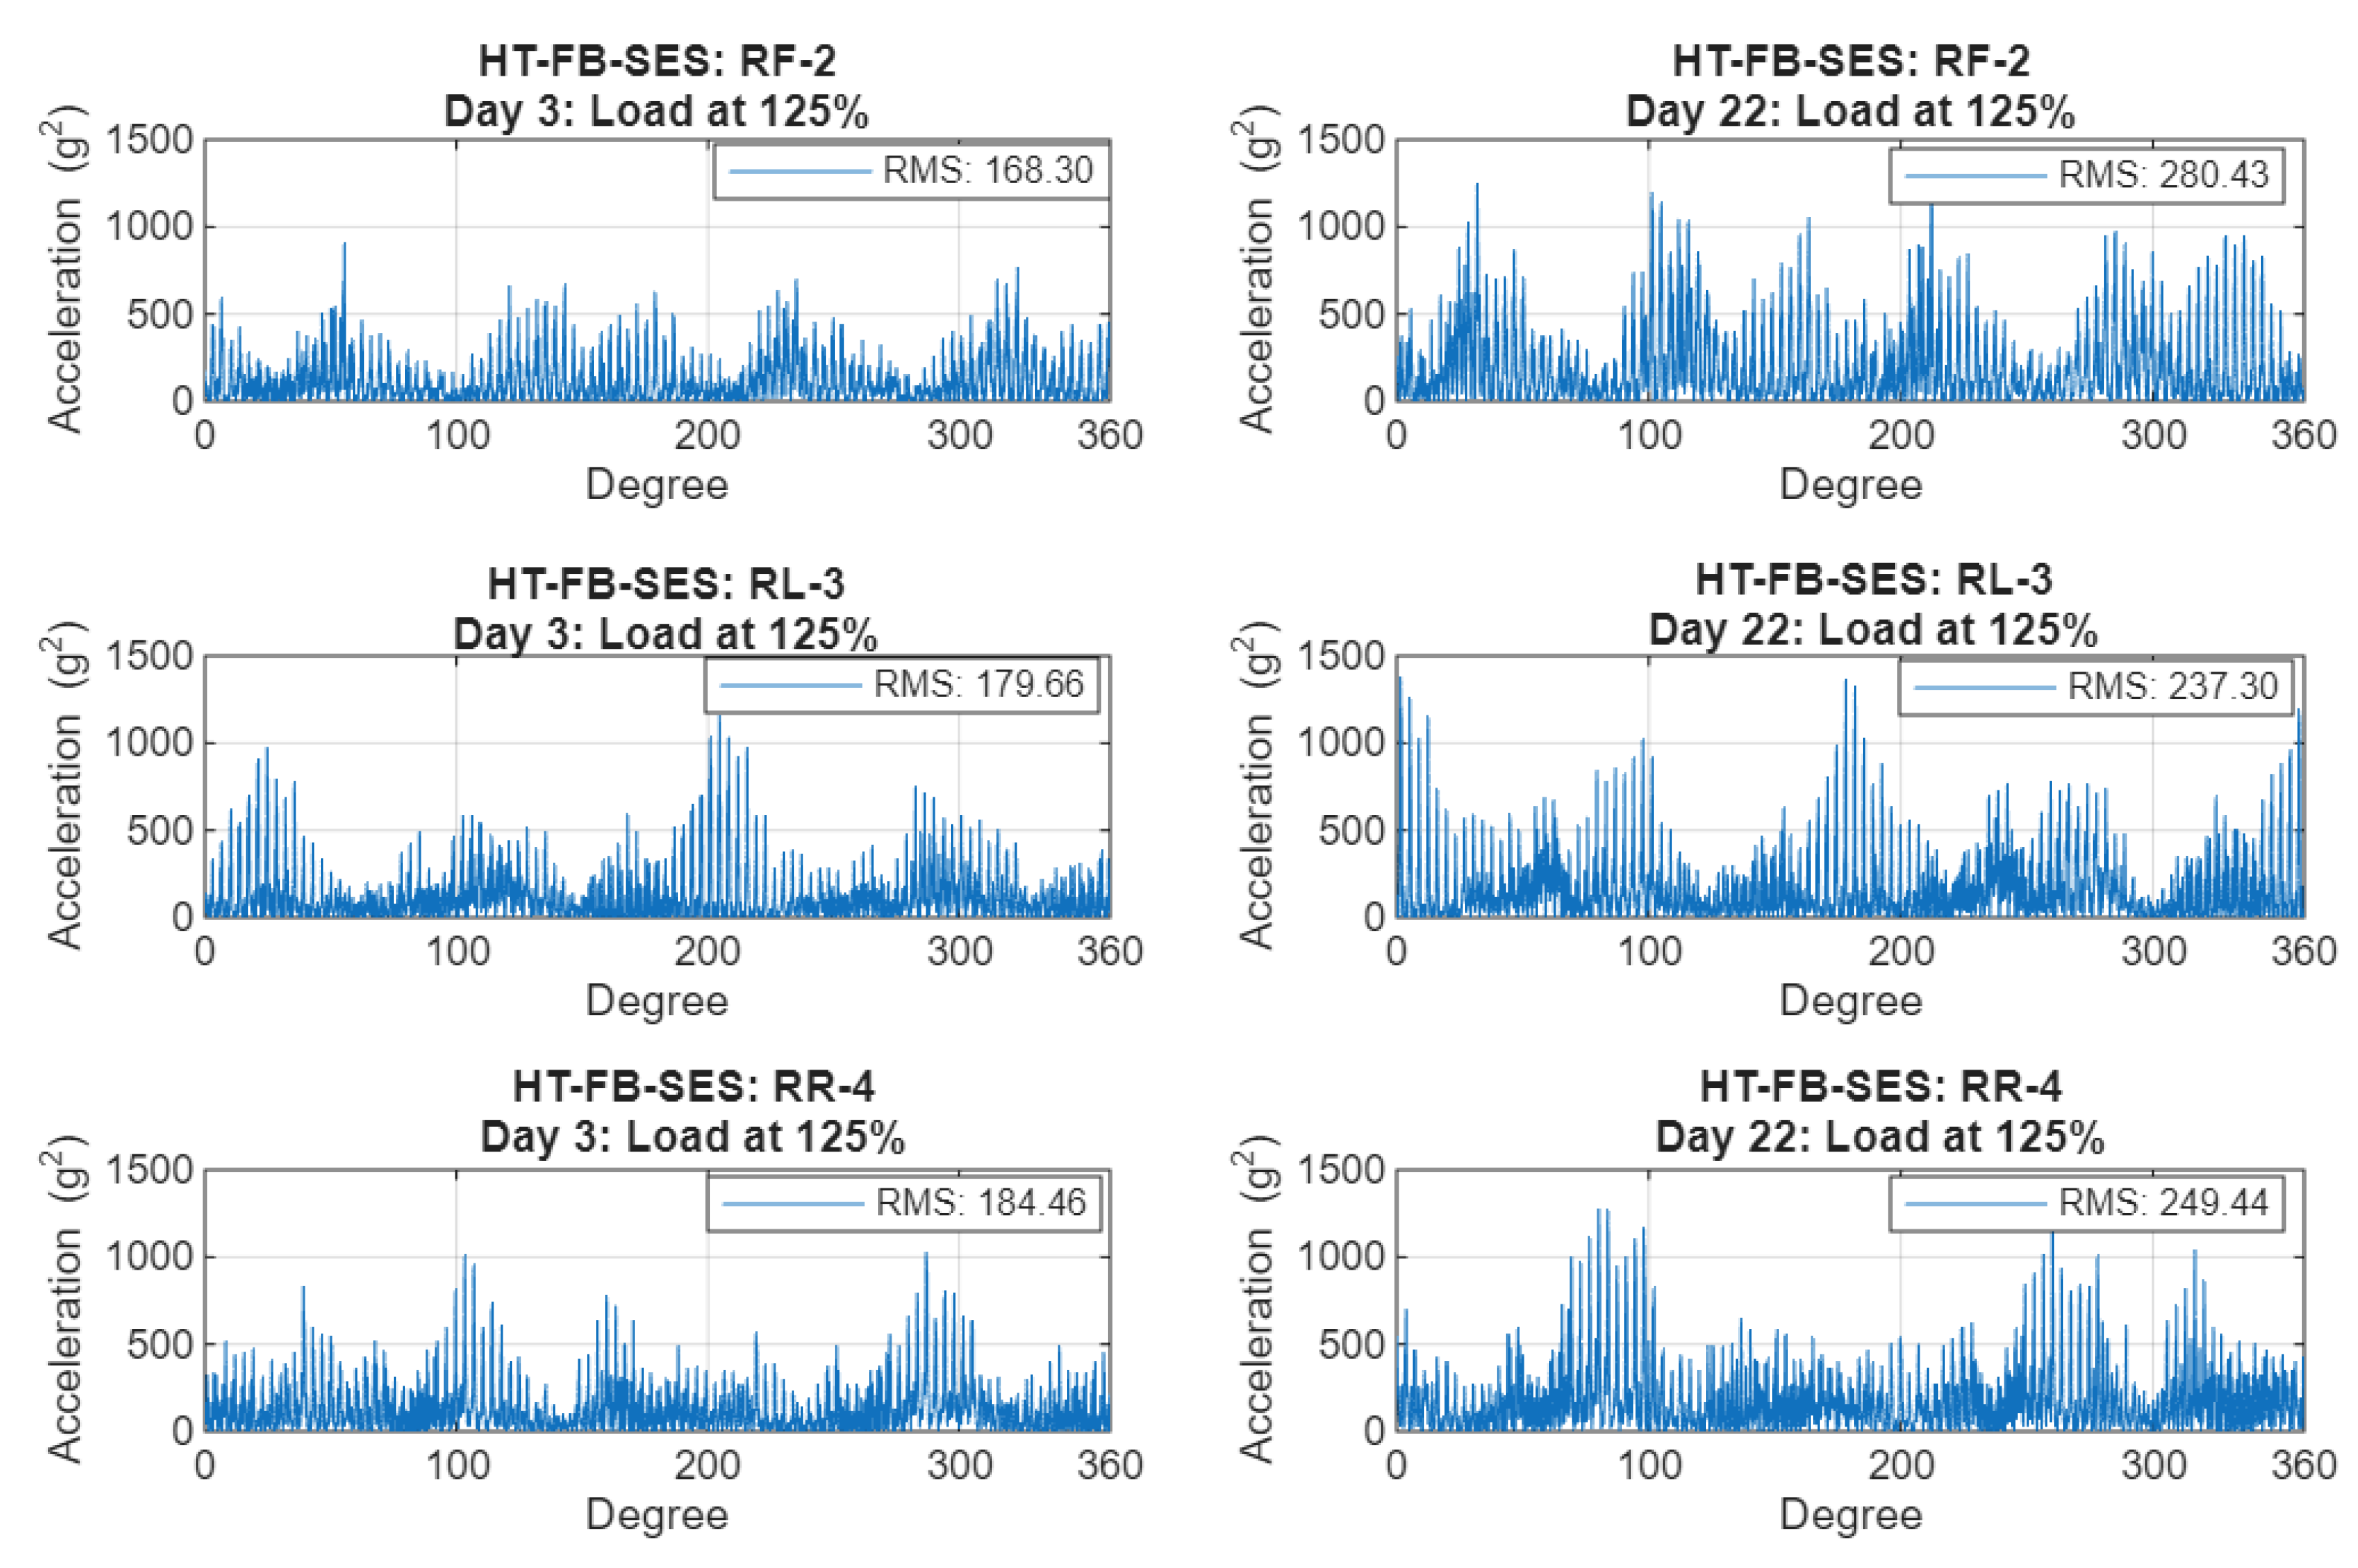
Figure 10.
HT-FB-SES trends at 150%, 125% and 100%.
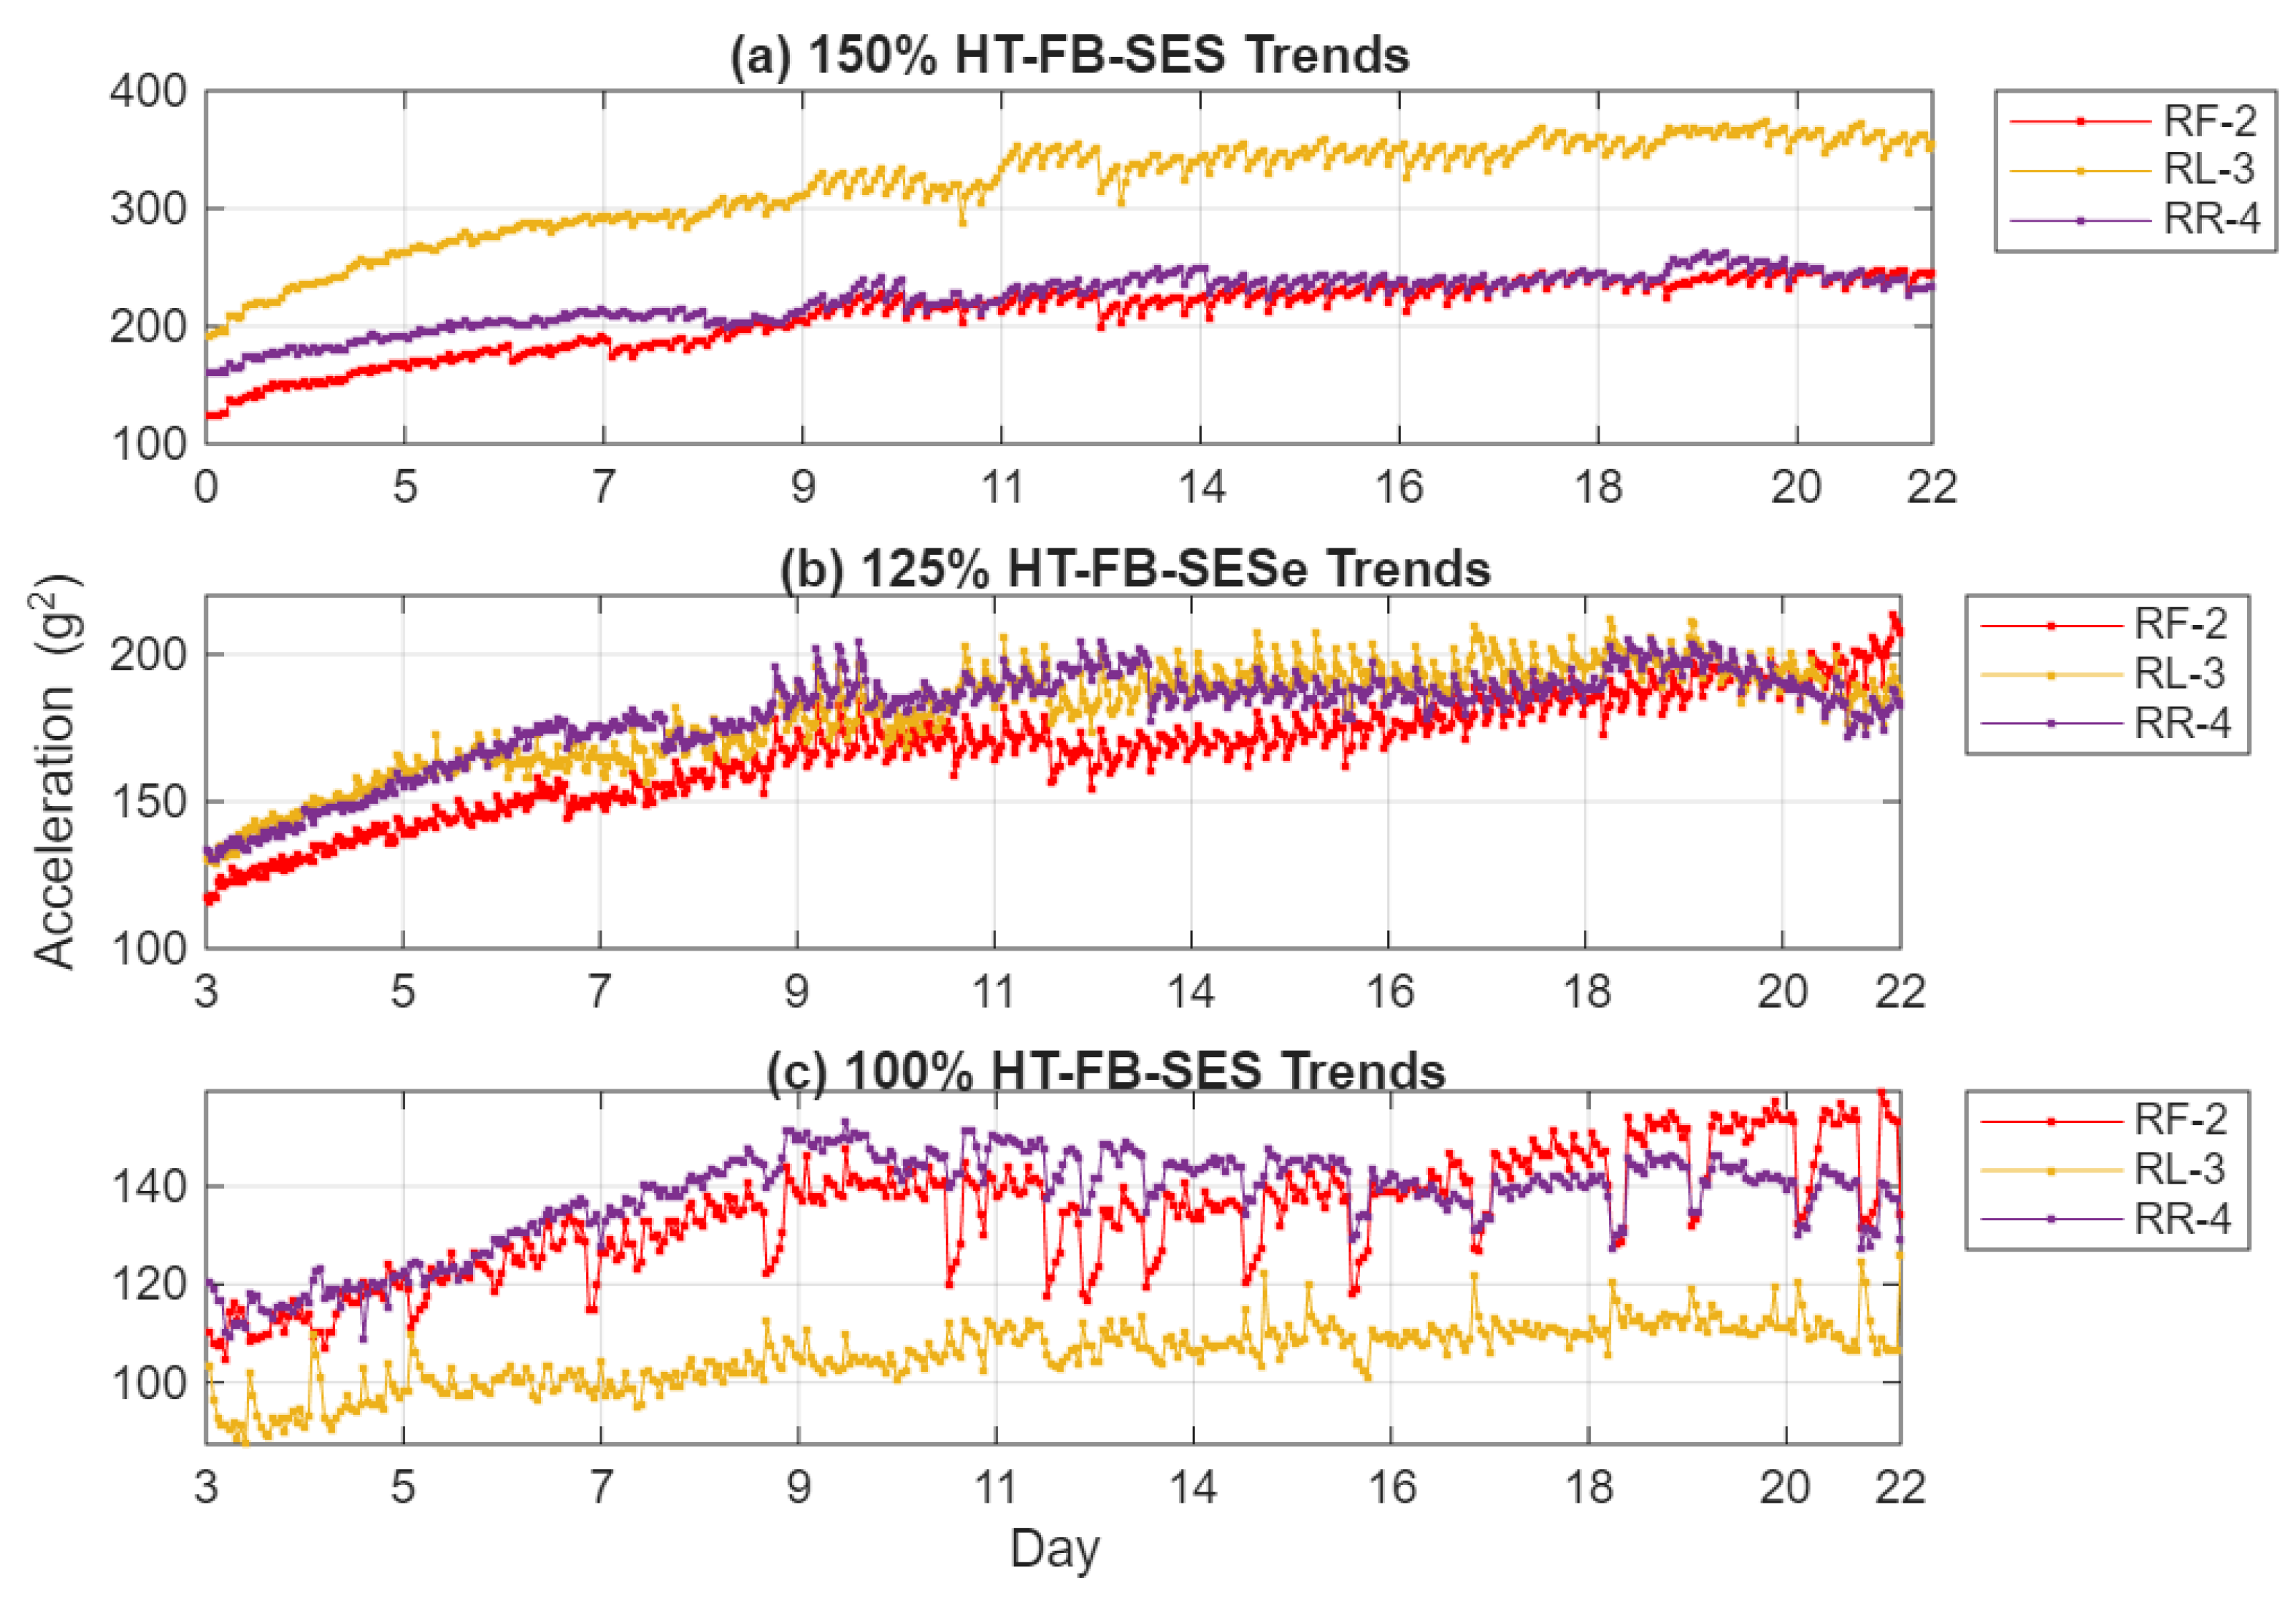
Figure 11.
C-SSA LT trends (a) 150% Load (b) 125% Load (c) 100% Load.
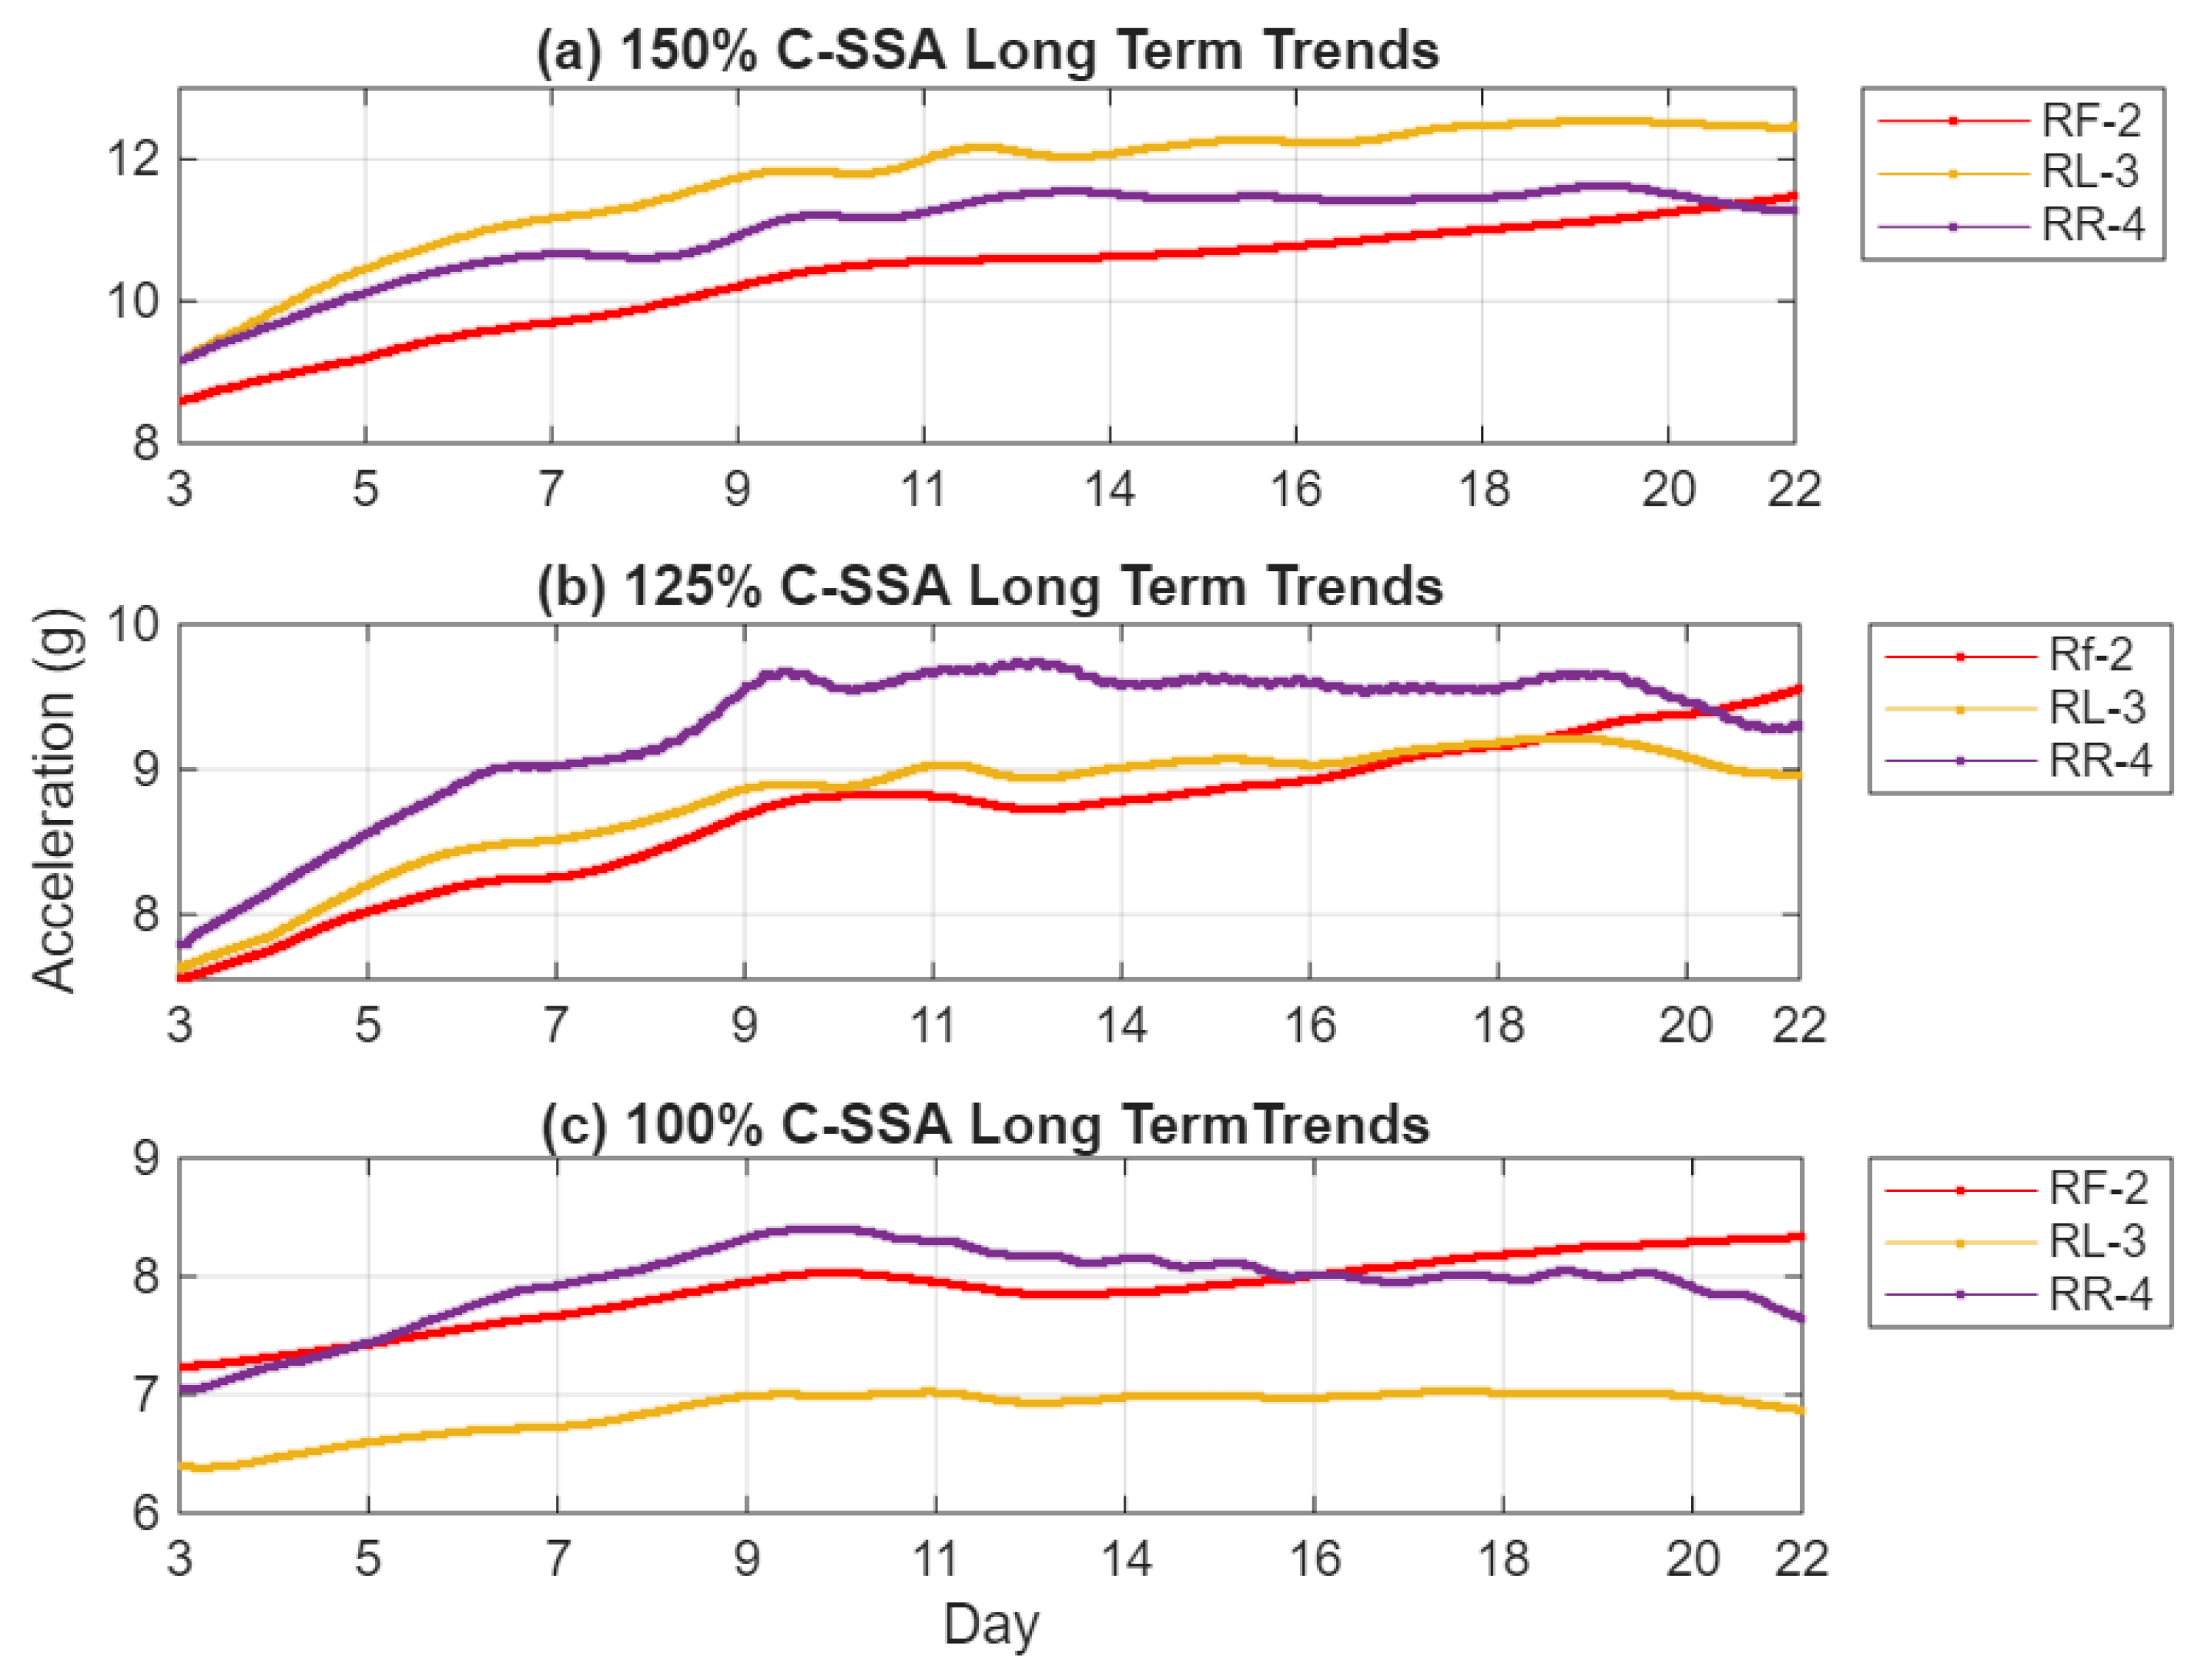
Figure 12.
HT-FB-SES LT trends (a) 150% Load (b) 125% Load (c) 100% Load.
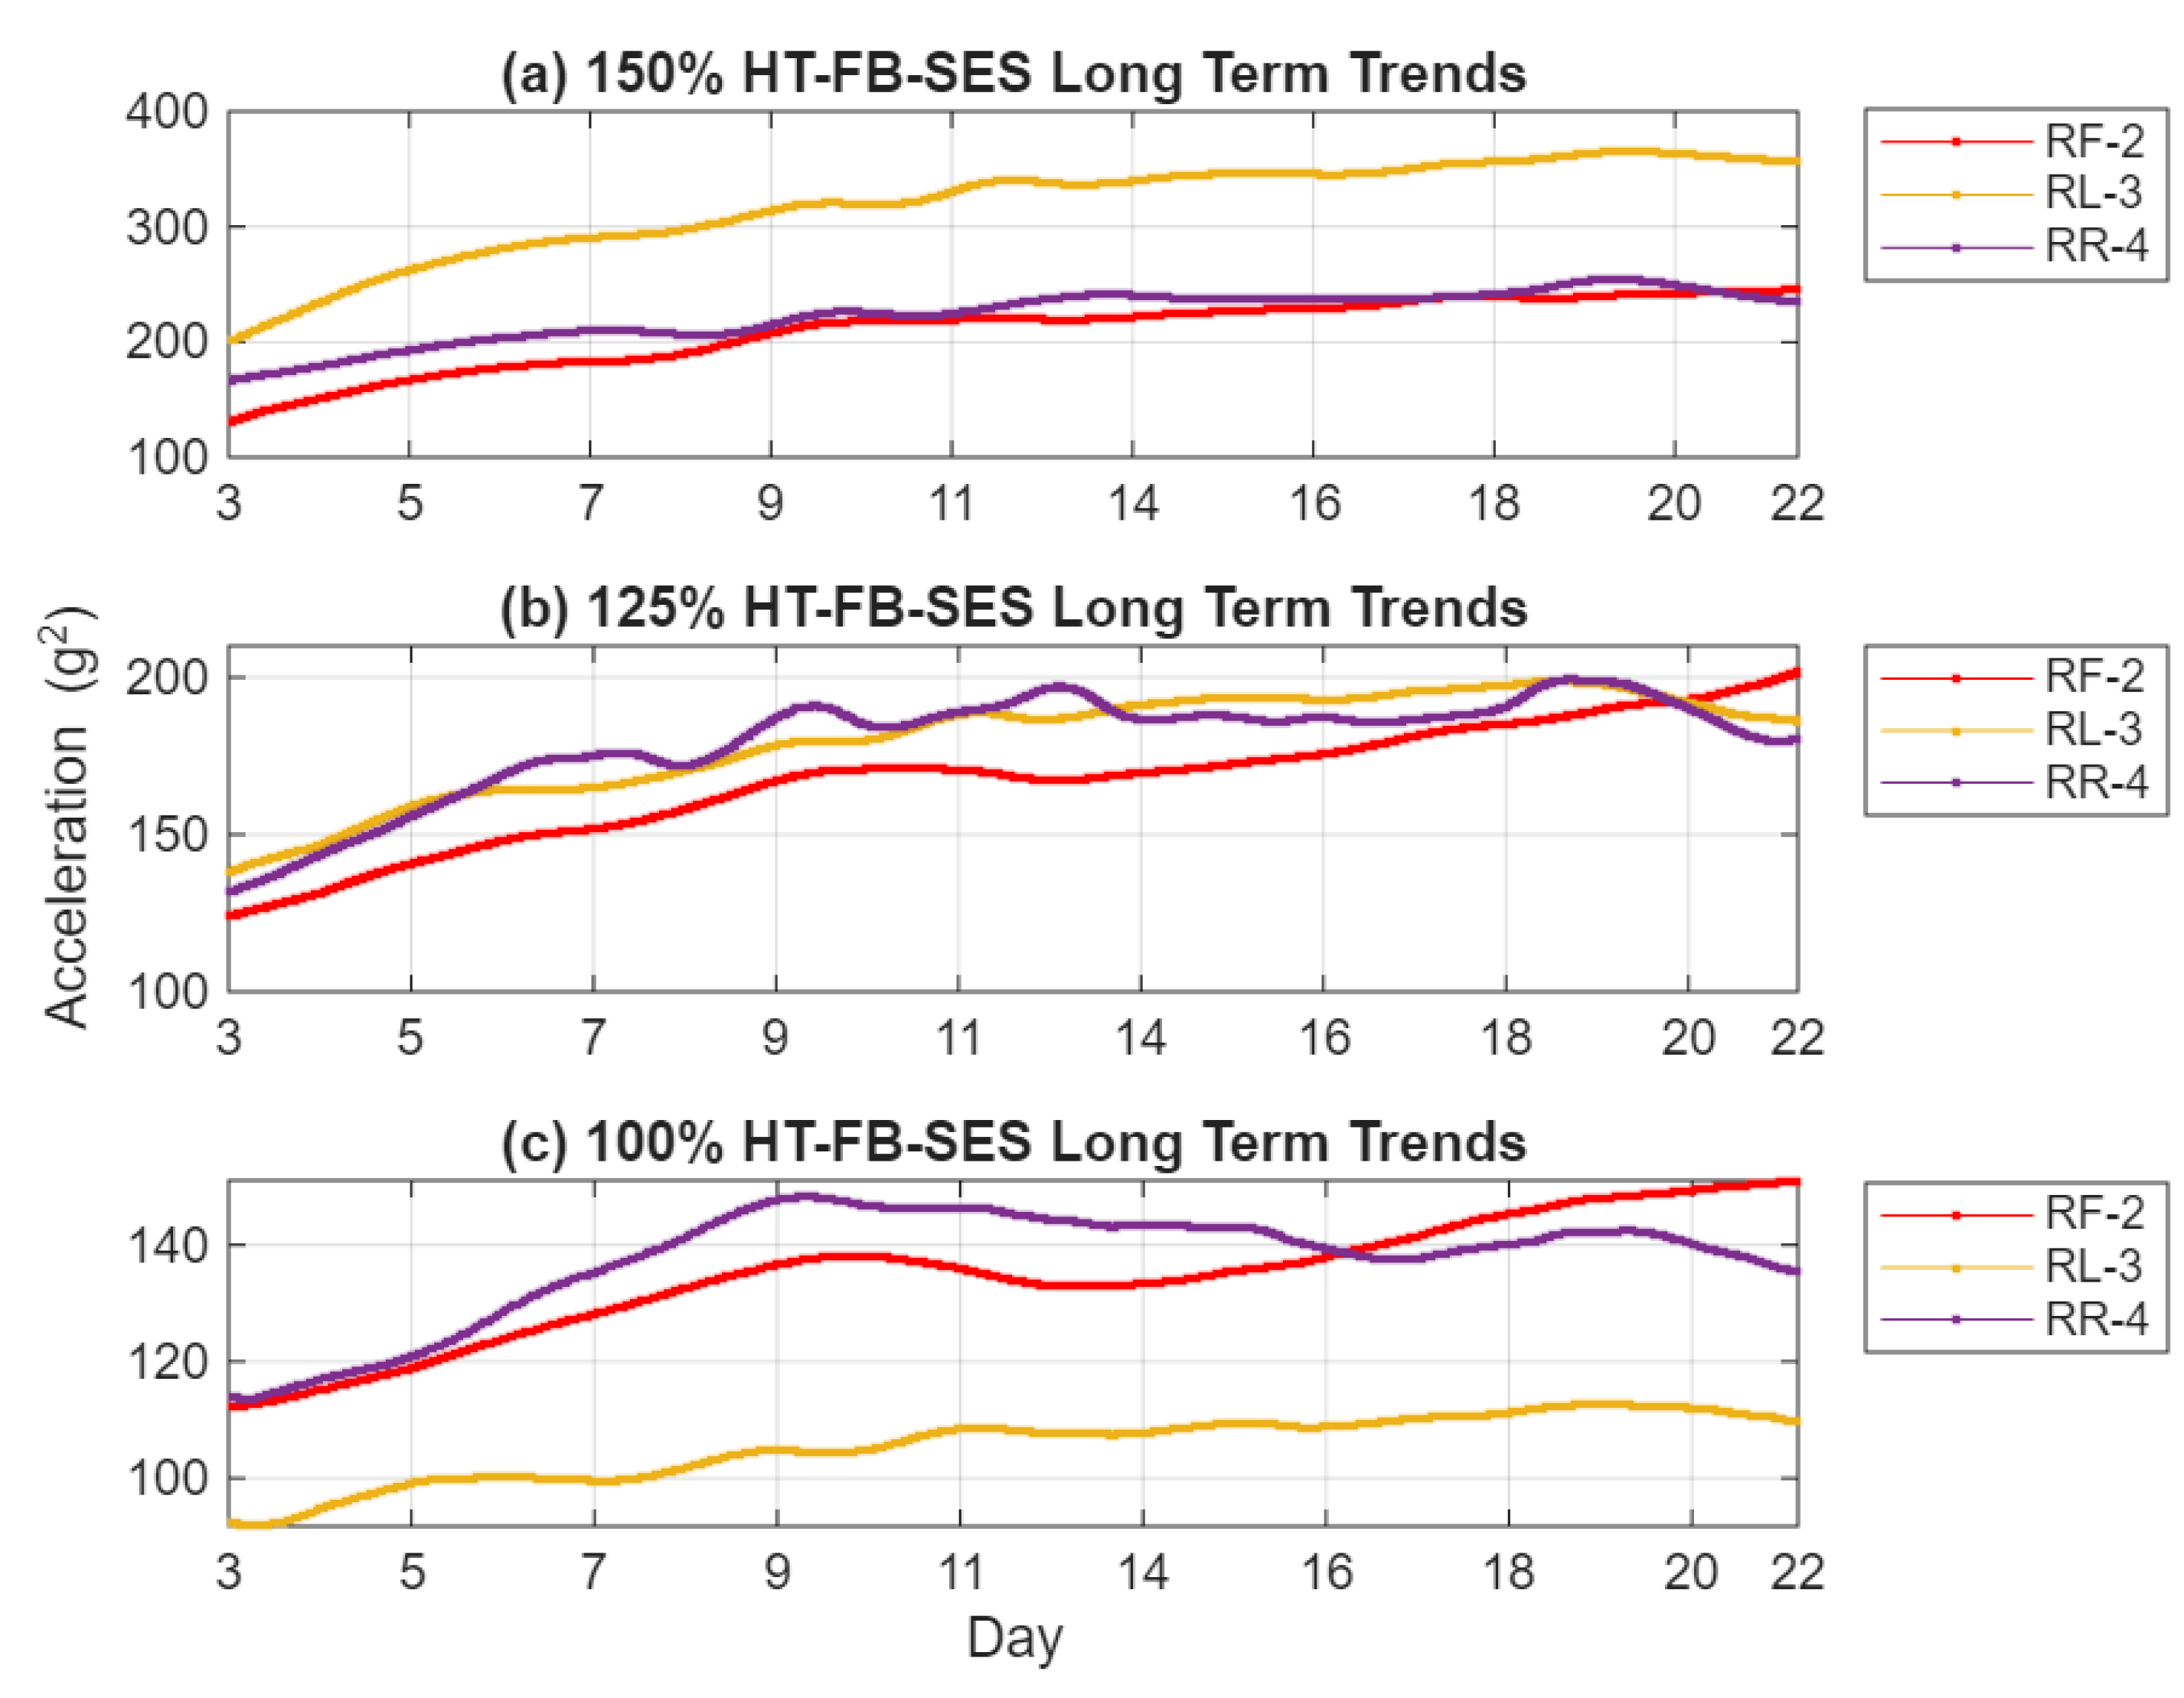

Table 1.
C-SSA and HT-FBW-SES RMS increases for casing sensors across load conditions.
| Load (%) | Sensor | C-SSA RMS Increase (%) | HT-FB-SES RMS Increase (%) | RMS Ratio (HT-FB-SES / C-SSA) |
|---|---|---|---|---|
| 100 | RF-2 | 19.1 | 44.6 | 2.3× |
| RL-3 | 2.6 | 4.4 | 1.7× | |
| RR-4 | 11.7 | 20.0 | 1.7× | |
| 125 | RF-2 | 27.9 | 66.7 | 2.4× |
| RL-3 | 15.6 | 32.1 | 2.1× | |
| RR-4 | 17.4 | 35.3 | 2.0× | |
| 150 | RF-2 | 34.1 | 74.7 | 2.2× |
| RL-3 | 24.4 | 51.7 | 2.1× | |
| RR-4 | 16.4 | 34.4 | 2.1× |
Disclaimer/Publisher’s Note: The statements, opinions and data contained in all publications are solely those of the individual author(s) and contributor(s) and not of MDPI and/or the editor(s). MDPI and/or the editor(s) disclaim responsibility for any injury to people or property resulting from any ideas, methods, instructions or products referred to in the content. |
© 2026 by the authors. Licensee MDPI, Basel, Switzerland. This article is an open access article distributed under the terms and conditions of the Creative Commons Attribution (CC BY) license.
Copyright: This open access article is published under a Creative Commons CC BY 4.0 license, which permit the free download, distribution, and reuse, provided that the author and preprint are cited in any reuse.


