
Submitted:
14 December 2024
Posted:
17 December 2024
You are already at the latest version
Abstract
This research aims to advance the understanding and application of dynamic models for gears within agricultural machinery drive trains by developing analytical solutions. Despite significant advancements in vibration analysis, there is a notable scarcity of comprehensive research that addresses the analytical modeling of gear dynamics, particularly using advanced mathematical techniques such as the Multiple Scale Method (MSM). This research aims to bridge this gap by starting with the simplest gear mathematical models and progressively scaling to more complex systems. Such models facilitate gearbox design optimisation, fault diagnosis, and maintenance planning, effectively reducing downtime and increasing the reliability of agricultural machinery. The study is oriented toward employing the MSM to derive analytical solutions to determine the vibration frequency ranges and identify emitted components. This mathematical approach offers a generalized framework for understanding vibration propagation and can significantly enhance the precision of vibration management strategies. Based on these insights, the research can contribute to the sustainable design of agricultural machinery drive trains, emphasizing vibration reduction and efficient propagation control. Ultimately, this work seeks to enhance these machinery’s durability and operator comfort, fostering safer and more effective agricultural practices.
Keywords:
gear mesh
; vibration analysis
; analytical solution
; numerical modeling
; Multiple Scale Method (MSM)
; agricultural machinery
; agricultural sustainability
1. Introduction
Gear meshing is a complex process in which precision of calculations, design, machining, and assembly stands extremely important. The proper mating between gears not only assures lesser chance of failures of other elements of the machine, such as bearings [1]. It also extends the working life of the gears themselves and improves safety of operation [2]. Thus, throughout the years a visible effort is put into analysing meshing performance in different types of gear arrangements [3,4,5]. Optimal distribution of forces and lubrication decreases overall levels of different loads emerging on the surfaces and edges of the gears which effect in wear and pitting [6]. In some specific applications, new types of teeth are introduced to improve general efficiency, such as concave-convex ball teeth for hydraulic pumps [7], as well as novel drives [8,9] or arrangements [10,11]. Multiple methods are present in the field of gear meshing analysis, such as tooth contact analysis or finite element analysis. Interesting modifications to them are presented continuously [12], and new methods are introduced simultaneously [13,14] resulting in better performance achievable.
In comparison with passenger cars, the users of agricultural equipment are subjected to completely different spectrum of vibroacoustic (VA) signals. Two main reasons for that might be highlighted, namely the working conditions and design requirements, which coincide strictly with each other. To be able to undertake various tasks such as hauling, plowing or harvesting in various weather and on adverse surfaces, a proper engine torque and chassis/instrumentation durability is required, yet unnecessary complexity should be avoided. This results in high rigidity of underbody, most often with complete lack or very simplistic suspension, combined with big-diameter tires made of hard rubber with aggressive type of tread. To conclude, big unsprung mass, high chassis stiffness, big-displacement compression ignition engines, multitude of geared mechanisms and types of ground excitations create extremely hazardous work environment, as basically only the seat and it’s suspension isolates the operator from harmful vibroacoustic signals [15,16,17,18,19]. But the non-direct influence on the environment and surroundings should not be omitted [20,21]. Formerly rural areas close to the big cities are being urbanized with growing pace, hence neighbourhood of big estates of apartments or single-family houses with farmlands and farms is not unusual sighting anymore. As the farm works follow specific schemes which cannot be disturbed (in terms of type of the equipment, season and time of its use) it is crucial to reduce all types of pollution, including vibroacoustic, to ensure some kind of balance between a job that has to be done, and living comfort of the residents. Lately, reduction of engine noises whether by dampening internal combustion engines or switching to electric motors introduced new challenges, as the noise generated by transmissions and gears became more evident for operators and surroundings [22,23,24,25].
As it was clearly stated above, vibrations are an inherent part of agricultural machinery operation which affect the operators and environment [15]. To complete the picture, an influence of the vibrations on the machine itself should also be highlighted [17,26]. The presence of vibrations can indicate both normal operation of the drive system [27,28] and the beginning of a failure [29,30]. Therefore, it is crucial to be able to recognize and interpret the characteristics of generated vibrations. One of the main sources of vibrations in agricultural machinery are gearboxes [24]. Their operation is associated with the occurrence of parametric vibrations [28,31,32,33,34,35]. These are vibrations whose frequency changes over time. In addition to gearboxes, forced vibrations can be generated by other elements of the drive system, such as: driveshafts (mass imbalance, bending, or damage to the shafts lead to the generation of centrifugal forces, which cause vibrations) [36,37,38], bearings (bearing damage, such as wear of the raceway or rolling elements, causes increased noise and vibrations) [1,37]. Analysis of vibrations generated by the drive system of an agricultural machine allows for early detection of potential failures and prevention of more serious damage [39,40,41]. Thanks to appropriate sensors and analysis (supported by analytical solutions), it is possible to track changes in vibration characteristics and, based on this, make decisions regarding the need for inspection or repair [27,42]. Vibrations in the drive systems of agricultural machinery are a complex phenomenon resulting from many factors. Understanding their causes and characteristics is crucial for ensuring the reliability and durability of machines [43]. Gearboxes are the main source of parametric vibrations, while other elements of the drive system generate mainly forced vibrations [31,44].
Regardless of their type and source, noise and vibrations generated by gearboxes pose a significant challenge to sustainable development. Their negative impact on the environment and human health is undeniable. High noise levels contribute to stress, sleep disturbances, and prolonged exposure can lead to hearing loss [18,21,45,46,47]. Reducing noise and vibrations generated by gearboxes is of great importance for the quality of people’s lives. Silence and peace are essential for the proper functioning of the human body. Reducing noise in the workplace improves working conditions, increases efficiency, and reduces the risk of occupational diseases [48,49,50]. In addition, noise reduction in the residential environment contributes to improving people’s mental and physical health. Vibrations, in turn, can damage machinery and structures, as well as affect work comfort [36]. There are many ways to reduce noise and vibrations generated by gearboxes. It’s possible to apply damping materials [46,51], vibration isolation [2,52,53], structural optimization [54,55,56] or lubrication [55,57,58]. However, there are many scenarios when it’s not possible to elimite VA energy emission. Vibration energy can be treated as an aspect of sustainable development. Gearbox vibrations, although undesirable due to noise, can be a valuable source of energy. Thanks to technological development, it is possible to harvest vibration energy and convert it into electrical energy. This opens up new perspectives for sustainable development, enabling a reduction in the consumption of conventional energy and limiting the emission of harmful substances [24,59]. The problem of noise and vibrations generated by gearboxes requires a comprehensive approach. On the one hand, efforts should be made to reduce them in order to improve the quality of the environment and human health [18,20,45]. On the other hand, vibrations can be a valuable source of energy, which opens up new opportunities for sustainable development. Therefore, research on ways to reduce noise and vibrations and to effectively utilize vibration energy is extremely important [21,60].
Therefore, the problem of vibration reduction (VR) and simultaneous energy harvesting (EH) is becoming increasingly urgent in the context of technological development. Many stuctures are exposed to vibrations that can lead to failures and energy losses. Given that, the search for effective methods of vibration reduction and efficient energy harvesting from this phenomenon is the subject of intensive research [52,61]. There are many vibration reduction methods, such as passive (vibration dampers, vibration isolation, high damping materials) [62], active (control systems that generate forces opposite to the forces exciting vibrations) [41], and hybrid (a combination of passive and active methods) [63]. The choice of a suitable method depends on many factors, such as: vibration frequency, vibration amplitude, operating environment, and cost and mass requirements. Energy harvesting from vibrations involves converting the mechanical energy of vibrations into electrical energy. Few types of phenomena can be useful in order to reach this goal: piezoelectricity (the use of materials that generate an electric voltage when deformed), electromagnetism (the use of the electromagnetic induction phenomenon), or electrostatics (the use of electric charges). Analytical solutions can significantly facilitate the process of selecting vibration reduction and energy harvesting methods [61]. Thanks to them, it is possible to quickly assess the effectiveness of different solutions, optimize system parameters or minimize the number of costly experiments [57]. It allows to state that vibration reduction and energy harvesting is very complex and requires interdisciplinary knowledge. Thanks to the development of new materials, computational methods, and sensor technologies, it is possible to create increasingly advanced solutions [2]. Analytical solutions play a key role in this process, enabling the rapid and efficient design of vibration reduction and energy harvesting systems.
Agricultural machines, including tractors and harvesters, produce complex vibration profiles. These vibrations originate from both internal machine dynamics, such as the drive train, and external interactions, including terrain variability [26,64]. The primary sources of these vibrations are internal combustion engines, gearboxes, and other drive train components, which generate low-frequency oscillations that propagate through various mechanical components. The attachement of supplementary devices further amplifies these vibrations, particularly through three-point linkage systems, exacerbating operator exposure during tasks such as tillage [56,65,66]. The operational activities such as tilling, harvesting, and soil preparation amplify these vibrations through dynamic interactions with the terrain, and towed or mounted implements [47,50,53,67].
Vibration propagation in agricultural machinery represents a complex phenomenon rooted in the interactions among various mechanical and structural components [64]. Vibrations generated in core components like the engine and gearbox propagate through the drive shafts, framework, and connected parts. It can be termed as transmission through structural elements (machinery components). The gearboxes, in particular, are critical nodes of vibration due to their dynamic mechanical interactions. Studies indicate that gear meshing imperfections and load variations in gearboxes can significantly amplify vibration transmission.
Many research text delves into the propagation mechanisms, impacts, and mitigation strategies, focusing on the intricate role of drive systems, especially gearboxes, in these processes. The transmission of vibrations through the drive train and gearboxes hastens wear on bearings, seals, and interconnected components. Research highlights that repeated vibratory stresses lead to microstructural fatigue, precipitating premature failures (accelerated component wear). Prolonged vibration exposure can induce structural degradations (cracks) and deformations in structural elements. This mechanical degradation is particularly pronounced in the connections between drive systems and the chassis, where stress concentrations are the highest.
Designing agricultural machinery focusing on vibration reduction differs significantly from designing cars or other vehicles. Unlike conventional vehicles, agricultural machines are exposed to a diverse array of operational conditions, demanding robust structural frameworks. These frames, while providing essential strength and support, often contribute to the efficient transmission of vibrations from the source, such as the drive train, to the entire machinery body.
Vibration in agricultural machinery propagates through the entire structure. This process is a result of complex interactions between various machine components [64,68]. Understanding the nature and transmission of these vibrations is crucial for mitigating their impact on operators’ health and ensuring optimal performance [46,66,69]. The operational environment of agricultural machinery subjects operators to significant whole-body vibration (WBV). Vibrations predominantly occur in the frequency range of 1–10 Hz, aligning with the resonance frequencies of human organs, which can lead to amplified mechanical responses and potential health issues [49,59]. In particular, the vertical axis (z-axis) vibrations tend to be most pronounced and pose significant ergonomic challenges with significant health implications when combined [47,53].
The European Directive 2002/44/EC sets exposure action and limit values for WBV, indicating the importance of adhering to safety thresholds to prevent health risks [45]. Research has shown that many current agricultural practices exceed these thresholds, highlighting the need for enhanced compliance measures and operator training. Prolonged exposure to WBV has well-documented adverse effects, including musculoskeletal disorders, spinal degeneration, and lower back pain [46,48]. Moreover reduces performance and chronic health issues such as cardiovascular strain [67,69]. Studies indicate that the resonance frequencies between 4–7 Hz, which coincide with human body responses, exacerbate these conditions. Research on seat and cabin suspension systems has shown that without appropriate damping measures, the transmission of vibrations from the drive train and other machine components can significantly compromise operator health [26,45,46,59,70].
The ISO 2631 standard specifies vibration thresholds to protect against these effects. However, research indicates that even with standard-compliant equipment, drivers can experience discomfort, particularly at frequencies resonant with the human body’s natural response (4–7 Hz), leading to fatigue and drowsiness, which could impair driver performance linked to cognitive effects [26,51,56,69].
Vibrations are not confined to solid structures. They can also generate acoustic waves, which propagate through the air, manifesting as noise (acoustic wave propagation). This acoustic transmission is particularly notable in older machinery models where cabin insulation is inadequate. The repercussions of vibration propagation extend beyond machine components, affecting the machinery’s operational integrity and the well-being of operators [48,50]. Vibrations convert into noise, creating an auditory disturbance both for the operator and the surrounding environment [45,49]. Elevated noise levels, often exceeding permissible exposure limits, can impair hearing and lead to long-term occupational health risks. That is the key impacts include.
The insights mentioned above allow us to state that understanding the processes of vibration propagation in agricultural machinery is crucial for designing safe and comfortable machines. The use of appropriate materials, optimization of the design, and the application of vibration damping systems are just some of the methods that can significantly reduce vibration levels and improve operator working conditions.
Understanding vibration propagation in agricultural machinery, particularly through drive trains and gearboxes, is essential to designing equipment that ensures both machine longevity and operator safety. The integration of advanced damping systems and innovative gearbox designs holds promise for reducing vibration levels. In this respect, it is particularly important to reduce the impact of gearbox vibration on the wear and tear of bearings, seals and connected parts. It must be borne in mind that gearboxes are critical vibration nodes due to their dynamic internal interactions resulting from the nature of their operation. Gears generate parametric vibrations as a result of time-varying gear meshing. It is therefore extremely important to carry out research into the effects of gear meshing on load variations in gearboxes, which contribute to significantly amplifying the propagation of vibrations to the entire machine structure. Continuous research emphasizing vibration reduction and effective propagation control is part of the policy of sustainable design of drive systems for agricultural machinery. This has a direct bearing on increasing the durability of these machines and operator comfort, fostering a safer and more efficient farming practices, and more efficient agricultural work environment. These are undoubtedly key aspects of sustainable design of agricultural machinery.
Modelling of gear dynamics is important field of theoretical engineering (designing) [5,71]. Numerous models allow to simulate the operation of gearboxes under various conditions, analyze their strength, and predict potential failures [63]. Important case is parametric vibration, which is characterized by time-varying system parameters such as stiffness and damping [28,31,34,35].
Parametric vibrations differ significantly from other types of vibrations because their characteristics depend not only on the properties of the system but also on its operating conditions. Understanding the mechanisms of the generation and propagation of these vibrations is crucial for ensuring the reliability and durability of gearboxes. Parametric vibrations can lead to resonances, which in turn can cause damage to structural components [38,41].
Applications of dynamic models are as follows:
1. Design: dynamic models allow for the optimization of gearbox designs to minimize vibration and noise [72]. They can be used to select appropriate materials, element geometries, and bearing parameters to ensure a long service life of the device [71,73];
2. Diagnostics: analysis of vibration signals obtained from an operating gearbox allows for the early detection of faults such as tooth wear, shaft clearances, or bearing damage. This makes it possible to plan preventive maintenance and avoid costly downtime [27,30,37,43,72];
3. Reducing downtime: early detection and elimination of the causes of parametric vibrations significantly reduces the number of failures and increases machine availability [39].
Dynamic modeling of gearboxes, with a particular focus on parametric vibrations, is an invaluable tool for engineers. It enables to better understand the complex phenomena occurring in these devices and, consequently, to design more reliable and durable gearboxes. In addition, modeling enables early fault detection, which significantly reduces downtime and optimizes maintenance costs.
Although numerical methods provide very broad set of approaches to analyze the problem in question and are widely used, analytical solutions where applicable are advantageous in many aspects [74] [75]. Firstly, properly defined and assessed formulas ensure repeatability of obtainable results. Secondly, even though analytical solution primarily might be more time-consuming than its numerical counterparts, it shortens the overall analysis time as a simple substitution of different parameter values is sufficient enough to obtain new results. On contrary each change of parameters with numerical approach requires running the simulations once again. Given so, a demand arises for precise computational methods based on the determination of analytical solutions also in the aspect of gear meshing analysis [27,41,76]. Unfortunately, obtaining such a solution for a complex process of gear meshing is difficult, especially in the case of multiple degree of freedom transmissions with high-speed gears, which are subjected to broad changes of rotational speeds, heavy loads, and numerous excitation sources, as every pair of working gears have time varying mesh stiffness (TVMS). Given that, numerical methods are far more popular, but still approaches to obtain hybrid analytical-numerical [77] and fully analytical solutions are regarded. One of the recent works introduced an improved analytical model for calculating mesh stiffness, based on contact mechanics and gear engagement principle, which correctly calculates varying stiffness under non-stationary conditions [52]. The model is based on evaluating the potential energy of the non-uniform cantilever beam consisted of four parts: local contact energy (Hertz contact energy), bending energy, axial compressive energy and shear energy with additional consideration of addendum modification, and was verified experimentally. Similar topic is analyzed in [78], where the empirical ISO (ISOSM) standard model and deformation energy based model (DEM) are compared with finite element method results. It was proved, that due to results being highly approximated in case of ISOSM, it should be applied rather to gears with standard profile, whereas DEM shows much higher accuracy thanks to possibility of including exact geometry of the analysed gearing. Another examples introduce the kinematics and the dynamical effects of centrifugal forces for high-speed transmissions [79], time-varying backlash [80], models for meshing stiffness, load sharing and transmission errors [27,62,81,82], load sharing and friction torque of involute spur and helical gears considering a non-uniform line stiffness and line load [83]. TVMS is also a great tool for analysing and predicting defects in gears, such as spalling, pitting, and cracking, and analytical approaches are also utilized in this aspect [60,84,85]. The variable stiffness raises an interest not only in the case of analysing the dynamics of mating gears [86,87], but also when focusing on the gear shaping process. In [88] the authors introduced a novel TVMS method, which improves contact stiffness model considering processing textures. It might be noticed, that as mostly the solutions introduced throughout the years derive from basic cantilever beam approach, still major modifications of often different sources are needed to properly represent specific behaviour. In the present study, a formal analysis of the possibility to utilize TVMS-based parametric vibration solutions of non-linear equations of motion with Multiple Scale Method (MSM) is conducted, and how this approach could possibly simplify the process of identifing and including different phenomena and geometries in analytical analysis.
The primary objective of this research is to advance the understanding and application of dynamic models for gears within agricultural machinery drive trains by developing analytical solutions. Despite significant advancements in vibration analysis, there is a notable scarcity of comprehensive research that addresses the analytical modeling of gear dynamics, particularly using advanced mathematical techniques such as the Multiple Scale Method. This research aims to bridge this gap by starting with the simplest gear models and progressively scaling up to more complex systems.
The focus of this study is on employing the MSM to derive analytical solutions that enable the determination of vibration frequency ranges and the identification of emitted components. This mathematical approach offers a generalized framework for understanding vibration propagation and can significantly enhance the precision of vibration management strategies. By leveraging these insights, the research aims to contribute to the improved design of agricultural machinery drive trains, emphasizing vibration reduction and efficient propagation control. Ultimately, this work seeks to enhance these machinery’s durability and operator comfort (with particular concern for his welfare), fostering safer and more effective agricultural practices.
2. Dynamic Model of Gear Meshing and Intertooth Force
Gears in normal mesh (where engagement factor falls between 1 and 2) experience both single-tooth and double-tooth contact along their engagement path. To understand the overall stiffness of normal mesh, it is first necessary to analyse the stiffness of individual teeth as they come into contact. This can be done analytically for a single pair of teeth (denoted as ). Method B from ISO 6336 standard [73] can be used to find the maximum stiffness () for this single pair. Equation (1) is then applied for the complete depiction, as described in detail in reference [89].
where:
- - stiffness of single pair of teeth;
- - maximum stiffness;
- - engagement factor;
- - period of mesh stiffness variation;
- t
- - time.
The equation of motion of gears system that was reduced to a single degree of freedom is given by the equation (2), where time-varying stiffness is given as a Fourier expansion of rectangular signal:
where:
- F
- - excitation force;
- - mesh damping;
- - equivalent mass;
- - mesh stiffness;
- - formula representing stiffness variation (Fourier expansion of rectangular signal);
- - small parameter;
- z
- - gear vibration displacement;
- - gear vibration velocity;
- - gear vibration acceleration.
In order to obtain a beneficial data from the point of view of mathematical analysis of the mesh stiffness signal the anlytical method of Fourier series expansion is applied. Obtained expression is a result of numerical integration of the mentioned signal. Formulas regarding expansion coefficients are presented below. Additionally the Fast Fourier Transform (FFT) was involved as an efficient tool to determine the the influence of specific harmonics on the signal amplitude:
where:
From the properties of analyzed function it can be observed that only odd terms of the series will be non-zero. Additionaly, from the theorem about integration of odd functions in the symmetrical domain, which is the case here, it occurs that only cosine terms will be present. In such case, a large number of terms would be required for satisfactory approximation, so the FFT algorithm is used to analyze the singal in the frequency domain to obtain the amplitudes of particular harmonics.
The formula (1) includes the parameter , which represents the period of mesh stiffness variation that corresponds to the time of meshing gear teeth. The pair of teeth is in contact at this time. This means that a pair of teeth is on a path of contact followed by the point of contact between two meshing gear teeth. The contact points of the teeth line up with the line-of-action (pressure line) during the rotation of the gear. In general, for involute gears the tooth-to-tooth force is always directed along the same line. That is, the line-of-action is constant – along which the force vector between two meshing gear teeth is directed. It is worth noting the crucially, that the comprehensive mesh stiffness of gear is the elastic response of the comprehensive meshing effect of each pair of teeth in the whole meshing area, which is directly related to the elastic deformation of single tooth, the comprehensive elastic deformation of single pair of teeth and the coincidence degree of gear system itself. For the spur gear system with coincidence degree greater than 1 and less than 2, the gear includes single-tooth meshing area and double-tooth meshing area in one meshing cycle. For such a case, the time course of mesh stiffness in the single-tooth meshing region (a single-tooth pair mesh stiffness) takes the shape of a parabolic function. However, in the double-tooth meshing area, the stiffness is calculated through superposition, treating both pairs as parallel-connected springs with varying characteristics. The method to calculate the combined mesh stiffness of two interacting pairs of teeth is to add the mesh stiffness of two pairs of teeth together. The comprehensive time-varying mesh stiffness causes changes with a constant period, as shown in Figure 1. A higher stiffness value corresponds to double-tooth meshing, while a lower stiffness value corresponds to single-tooth meshing. Here, four different signals are presented:
1. reference - typical parabolic shape;
2. wave-shaped - commonly used to represent the parabolic character of teeth meshing due to the sufficient representation of physical properties;
3. rectangular - rather less popular for gear meshing approximation, worse in accuracy in comparison with wave-shaped;
4. rectagular’s Fourier approximation - an approach proposed in the study.
The FFT spectra based on the time-course (Figure 1) are shown in Figure 2 and Figure 3. A detailed description of determining the overall time-varying mesh stiffness course has been provided in the following paper [90]. All the calculations were made for the data presented in the Table 1, based on research [71].
A series of numerical simulations of the equation (2) was conducted to evaluate the effectiveness of the adopted gear stiffness models (Figure 1). These simulations were made to initially check the correctness of the gear meshing displacements (Figure 4, Figure 5, and Figure 6) for each stiffness model.
Observations of graphs in Figure 4, Figure 5, and Figure 6 allow for comparison of the simulation results obtained based on solution of the gear system, where mesh stiffness is given consecutively as a wave signal (WS), rectangular signal (RS), and its Fourier approximation (AP). This comparison aims to conclude the differences in obtained waveforms. All simulations were conducted for the same period to avoid doubts about the frequencies of obtained signals and allow for pure comparison of waveform shape and amplitude. In general, the amplitudes corresponding to single-tooth and two-teeth contact reach similar values, but bigger discrepancies are clearly visible when referring to the shape of the plots. Qualitatively, the RS and AP waveforms represent the physical behavior of the meshing gears with higher accuracy than WS. Moreover, AP waveform includes signal modulation, enhancing the overall information carried.
The apparent differences in the transient phases are striking when performing a comparative analysis of the RS (Figure 5) model and its Fourier approximation AP (Figure 6). This is due to the use of simplification in the case of approximated waveform (Figure 6). Namely, using Fourier series expansion results in smoother stiffness variation, while locally the susceptibility (mesh displacement) values can be artificially overstated (overloaded) or underestimated. In the case of the WS model (Figure 4), sudden changes result in longer transients, which are evident when the number of pairs of teeth in the contact line is changed. It is impossible to remove excess stiffness in the Fourier approximated model due to the Gibbs phenomenon, which is an immanent feature of the Fourier series of a periodic function with low smoothness (C0 class).
The equivalent meshing force for the pair of gears reduced to a single degree of freedom is given by formula (7):
where:
- - equivalent meshing force;
- - meshing force.
Further transformation of the formula (7) allows to obtain the following form of the analyzed equation:
where:
- - natural frequency;
- h
- - damping coefficient.
The time-varying meshing force waveform based on the Fourier approximated model and including damping along the line-of-action is shown in Figure 7.
The apparent transients associated with the stabilisation of the inter-tooth force values are due to the damping occurring in the mesh system. The time course of meshing force changes with a constant period, which correlates with the mesh stiffness (Figure 6). The distribution of the meshing force is characterised by sudden increments of force when one pair of teeth starts to mesh. This corresponds to the temporal moment the meshing force takes its maximum value. A lower meshing force values occurs when two pairs of teeth are in contact along the line-of-action – specifically, from entering the line-of-action to exiting it and sudden increments value when one pair of teeth is in contact.
3. Analytical Solution
General formulation of the dynamic model provided in (2) can be simplified for analytical investigation. Equation (9) is given in more convenient way for further analysis, where natural frequency of the system is substituted with meshing frequency. To ensure that natural frequency will be much higher than meshing frequency a relationship between these two frequencies was selected as , hence the appearance of numerical values of 256 and 582 in consecutive parts of the equation. The small parameter in the considered system indicates the elements of the equation that influence the main part of the solution and the perturbative components. Using the Multiple Time Scales Method (MTSM), a perturbation system of the equations of motion was formulated. The resulting system of equations is recursive in nature. It is solved in a sequential way by looking for solutions to successive approximations.
where:
- - static deflection;
- - detuning parameter;
- - meshing frequency.
The solution is approximated by a Taylor polynomial. For the initial conditions, it is assumed that the solution can be approximated by a sum of functions, each of which depends on small parameter. This provides a recursive structure for solving the equations [91].
where:
- - sequence of solution approximations.
Formulas that represent arguments of approximation (time scales) are as follows:
Consecutive derivatives of the functions are calculated and substituted into the equation (9). By grouping the elements with respect to small parameter a set of equations can be formulated. Their solution estimates the approximation functions. At this stage, the solution was approximated for different orders of . These approximations provide increasing accuracy with respect to the original nonlinear equation.
In the MTSM, the function is approximated in regard to different time scales (denoted as , , , ..., ). Each time scale represents a different rate of change in the system’s dynamics. The resulting partial functions are substituted back into original function and derivatives are calculated which later can be substituted into equation of motion.
where:
- - first time derivatives of time scales;
- - second time derivatives of time scales.
The resulting approximated equation of motion is as follows:
The ordering and separation of equation (20) in terms of the power of a small parameter leads to obtaining a recursive sequence of linear equations of motion leading to the solution of the nonlinear equation. The zeroth-order approximate linear equation is given in (21):
The next component of a recursive sequence of linear equations of motion leading to the solution of the considered nonlinear one is given in ():
The system was solved and an important issue was to remove the secular terms. When the secular terms were removed, the following solution was obtained in the form of a power series of a small parameter:
where:
- - integration constants.
It is necessary to determine the relative velocity from the first derivative for further calculations:
The MTSM made it possible to obtain approximate relationships describing the speed and relative position of the gear (measured along the line-of-action). The obtained dependencies have the character of a series of small parameter. This makes it possible to estimate the size of the error occurring in the approximate solution. In the case under consideration, it is at the level of .
The obtained formulas allow analytical study of the dynamics of the considered system despite its approximate nature. In particular, to analyze the forces and slip rates occurring in the system.
4. Sensitivity Analysis
Several analyses were run to compare the signals of displacements z, velocities , and accelerations . The objective of this comparison was to identify (demonstrate) which of the time-varying quantities better represent the dynamic behaviour of the system, i.e. vibration amplitudes or interim states (transients). It was assumed that the analyses would be performed for selected values of mesh stiffness, mesh damping and gear inertia. The corresponding results were compared in the time-domain (Figure 8, Figure 9, Figure 10, Figure 11, Figure 12, Figure 13 and Figure 14) and frequency-domain (Figure 15, Figure 16, Figure 17, Figure 18 and Figure 19). Reference values of the system’s parameters are presented in the Table 2.
The numerical investigation of these approximated analytical solutions began with a stiffness analysis. Figure 8 shows the time-varying displacement for eight mesh stiffness values.
Analysis of the vibration displacement of the gear system leads to the following conclusion. Observations of the system vibrations displacement based on the time-domain signals in Figure 8 and Figure 11) indicate the amplitude dependence on mesh stiffness. Lower stiffness results in greater vibration amplitude. The displacement amplitudes decrease consistently as gear mesh stiffness increases. A periodic pattern is evident in displacement. This has to do with the parametric nature of the gear system as evidenced by the meshing ratio, which indicates the time-varying number of teeth pairs in contact along the line-of-action. There is a clear periodic change in the displacement value when the second pair of teeth comes into contact, and this occurs when transitioning from single-tooth to double-tooth meshing. The time course of the displacement (tooth deflections) changes with a constant period, which correlates with the mesh stiffness. This pattern is due to the time when the second pair of teeth are in contact – specifically, from entering the line-of-action to exiting it. A lower displacement occurs when two pairs of teeth are in contact (within the line-of-action), resulting in higher mesh stiffness. Conversely, a higher displacement occurs when only one pair of teeth is in contact (along the line-of-action), leading to lower mesh stiffness. The occurrence of periodicity confirms the inherent time-varying nature of gear meshing and the associated occurrence of parametric vibration of the gear system
The mesh stiffness has a direct effect on the displacement of the gear system. Lower stiffness leads to higher amplitudes, indicative of weaker resistance to deformation. On the other hand, higher stiffness corresponds to more rapid stabilization and smaller oscillatory amplitudes. The trend suggests higher stiffness contributes to reduced system displacement vibrations. The signals show periodic vibrations with consistent periods across different stiffness values, indicating that gear system frequency remains largely unaffected by stiffness within the examined range.
Observations from the frequency-domain signals in Figure 15 allow to conclude that peaks in the displacement frequency spectrum appear at specific harmonic frequencies, corresponding to the gear mesh frequency ( = 632.7 Hz) and its multiples. Gear systems concentrate vibratory energy at fundamental harmonics in the frequency domain. Peaks in the frequency spectrum diminish as mesh stiffness values increase. Notably, lower stiffness values show pronounced displacement energy concentrations, whereas higher stiffness disperses this energy. At higher values, the displacement energy reflects greater damping effects from increased stiffness. Increased mesh stiffness reduces displacement amplitude, suggesting a beneficial effect in terms of mechanical stability.
Observations of the system vibrations velocity based on the time-domain signals in Figure 9 and Figure 12 indicate the velocity signals are highly dynamic and exhibit a more nuanced representation of transient behavior than displacement. Velocity amplitudes increase in transients when there is a step-change in the mesh stiffness resulting from the time-varying number of teeth pairs along the line of action. However, velocity oscillations exhibit gradually reducing peak amplitudes as the mesh stiffness value increases. The frequency of these oscillations increases slightly for multiples of the mesh stiffness value. Higher values lead to quicker damping of velocity peaks in transients, reflecting enhanced energy dissipation dynamics. The zero-crossing frequency remains stable, consistent with the displacement analysis. It can be clearly seen the vibration velocity pattern corresponds to the time-varying number of teeth pairs in contact along the line-of-action. In steady states, the velocity oscillations amplitudes are constant, but slightly greater in the case of single-tooth meshing than in the case of double-tooth meshing.
The frequency-domain signals in Figure 16 and Figure 17 allow to conclude the velocity spectrum reveals sharp peaks at higher harmonic frequencies. These peaks become more distinct as stiffness increases. Similar to displacement, velocity spectrum peaks diminish with increasing stiffness. Increased gear mesh stiffness significantly dampens velocity oscillations and redistributes energy across a wider frequency range indicating a shift in system dynamic behavior towards higher-frequency components. Velocity analysis provides insights into the system’s dynamic transitions. Increased stiffness reduces peak velocity amplitudes, showcasing better control over vibrational dynamics. The dominance of higher harmonics in the frequency domain highlights the coupling effects of damping and inertia within the gear system. Velocity is a critical indicator of dynamic stability, showing smoother and milder transitions at higher stiffness. On the other hand, the Figure 16 shows that velocity oscillations are characterised by rapid (sharp) amplitude peaks in transients.
Observations of the system vibrations acceleration as the time-domain signals (Figure 10, Figure 13, Figure 14) show that the acceleration amplitudes exhibit a constant value regardless of the increase in mesh stiffness. The acceleration amplitude modulates, i.e. increases in transients when there is a step-change in the mesh stiffness resulting from a time-varying number of teeth pairs in contact along the line-of-action. The sharp increase in the amplitude of the mesh vibrations acceleration is particularly noticeable when there is a transition from single-tooth to double-tooth meshing (while the second pair of teeth additionally comes into contact along the line-of-action) – and somewhat less when there is a transition from double-tooth to single-tooth meshing (while the second pair of teeth leaves the line-of-action). The behavior remains consistent as can be seen in Figure 13 and Figure 14. To summarize, the periodic gear system excitation in transients is due to the peculiarities of parametric meshing during gear operation. Nevertheless, for different values of mesh stiffness, the vibration acceleration in the transient states is characterised by a constant peak amplitude, although the frequency of vibration increases.
Figure 18 and Figure 19 show the system’s vibration acceleration waveforms in the frequency domain. Peak acceleration for / was estimated for / at . For analysis based on curve for value / it was observed, that acceleration was no higher than / and appeared at . Simulations carried out for / showed, that the system responded in frequnecy domain with peak acceleration of / at . Simulations for / resulted in / peak acceleration value appearing at . Basing on numerical research carried out for / peak acceleration took value of / at . Simulations carried out for / showed, that the system responded in frequnecy domain with peak acceleration of / at . Analysis of an acceleration curve representing system’s response in frequency domain for value / resulted in peak of / at . Analysis of the curve for value / showed that peak of acceleration was not higher than / and was registered at .
Observations from the frequency-domain signals in Figure 18 and Figure 19 allow to conclude the acceleration waveforms demonstrate significant peaks during transitions between single-tooth and double-tooth meshing (i.e., single-pair and double-pair teeth meshing). However, the transient behavior (transitional condition) remains consistent as can be seen in Figure 13, and also in Figure 11 and Figure 12. The frequency associated with the gear meshing ( = 632.7 Hz) has a dominant peak value, which is clearly visible at lower values of mesh stiffness. This peak frequency value remains visible, regardless of the stiffness, indicating a fixed excitation, although acceleration spectra show concentrated energy at higher frequencies as mesh stiffness increases. While peak magnitudes decrease as mesh stiffness increases, the high-frequency concentration is more pronounced at higher stiffness levels. This is because an increase in mesh stiffness causes an increase in transient vibration frequency, i.e., during transitions from two-pair teeth meshing to one-pair teeth meshing. When a single pair of teeth is in contact at the line of action, the lower mesh stiffness for single-tooth meshing enhances frequency effects, increasing the risk of fatigue and damage. In general, energy distribution expands across the spectrum as stiffness increases, which amplifies damping-like effects, as previously observed. This reflects the enhanced system strength under high stiffness conditions. It is also important to remember that acceleration is a vital metric for assessing material degradation and fatigue.
The general observations are as follows. This analysis demonstrates the critical role of mesh stiffness of gear vibrational behavior in the drive system. Increased mesh stiffness improves overall vibrational stability by reducing displacement, velocity, and acceleration amplitudes., indicating better vibrational control. Fundamental frequencies remain stable across stiffness levels, while energy redistribution occurs towards higher frequencies as stiffness increases. Higher mesh stiffness values lead to broader energy dispersion across frequency spectra, suggesting enhanced mechanical stability. The energy redistribution across higher frequencies implies reduced wear and tear from parametric resonance. The reduction of resonance effects, especially low-frequency resonance risks, promotes a longer machinery lifespan.
The important thing is that transitions between single-tooth and double-tooth meshing produce noticeable peaks in all vibratory metrics. These transient effects are more pronounced in systems with lower stiffness, highlighting the need for robust design against such dynamic behavior. The sharpness of the transitions in the approximated waveforms might be influenced by the Gibbs phenomenon, which is an inherent characteristic of Fourier series approximations of periodic functions with low smoothness.
Based on the analyses, it can be concluded that the displacements in the time domain give more intuitive results than the other dynamic quantities, i.e. velocity and acceleration. On the other hand, the analysis in the frequency domain is clearer for and , since the mean value that dominates the spectrum of the displacement z (frequency equal to zero) is eliminated. In summary, it was decided that further simulation studies would be carried out as follows: with displacements being analysed in the time domain and accelerations in the frequency domain.
Subsequently, a study was carried out on the system’s dynamic behavior for different values of the reduced mass of the gears. Overall, Figure 20 and Figure 21 demonstrate that larger mass values result in more pronounced dynamic responses. For an assumed constant mesh stiffness, an increase in mass results in less favourable system dynamics, which need more time to stabilise (vibration damping). As can easily be seen, the greater the mass for an assumed gear stiffness, the greater the vibration amplitude. Observations from time-domain signals (Figure 21 and Figure 22) indicate the displacement amplitudes increase consistently as the equivalent mass () increases from 0.2 to 3.0. Lower masses result in higher displacement vibrations. The amplitude increase with increasing mass suggests a direct correlation between mass and the system’s ability to suppress vibrational responses. It is also easy to see the values of equivalent mass affect the instability of the oscillation period (sweeping). The mass affects both the amplitude and frequency of the oscillation. For smaller masses displacement signals show concentrated energy at lower amplitudes, reflecting a system prone to larger oscillatory behavior.
In Figure 23 and Figure 24 the system’s acceleration response in the frequency domain is shown. Basing on numerical research carried out for peak acceleration took value of / at . It was observed that for value peak appeared at with a value of /. Analysis of an acceleration curve representing system’s response in frequency domain for value resulted in peak of / at . Simulations carried out for showed, that the system responded in frequnecy domain with peak acceleration of / at . Analysis of the curve for value 1 showed that peak of acceleration was not higher than / and was registered at . For analysis based on curve for value it was observed, that acceleration was no higher than / and appeared at . Analyzed spectra for value 2 had peak of / at . Peak value for was estimated at / for . Basing on numerical research carried out for peak acceleration took value of / at .
Observations from frequency-domain signals in Figure 23 and Figure 24 indicate the lower masses ( < 0.6 kg) exhibit significantly higher acceleration peaks (greater susceptibility to vibration). Additionally for smaller masses acceleration spectra exhibit a distribution of vibrational energy over a broader range of frequencies with a preponderance of higher frequency peaks. The increase in mass narrows the range of vibrational energy distribution toward lower frequencies. Higher masses ( = 1.5 kg, and more) show a marked reduction in peak acceleration.
Howaever it should be noted the observed trends are specific to the analyzed gear system and operating conditions. The sensitivity analysis of the gear system to an increase in mass was carried out for specific parameters (Table 1) and reference values of simulation parameters (Table 2). Normally, it is the case that an increase in may is correlated with an increase in the geometric dimensions of the gearbox. This is accompanied by an increase in stiffness and damping. Thus, increased equivalent mass significantly enhances vibrational stability, reducing displacement and acceleration magnitudes under dynamic conditions act as natural dampers.
In these simulation studies, the increase in mass was implemented with an assumed value of stiffness and damping, which determines the dynamic behavior of the transmission system. Above a certain value of equivalent mass, the stability of the solution of the system mathematical model is lost. Figure 21 shows that in the case of a mass of = 3 the displacement periodically each obtain minimum negative values, what should be interpreted as a loss of contact between teeth (lack of meshing). Meanwhile, the model does not consider backlash. Therefore, the mass of 3kg is the limit, the model is not applicable above this value. Sensitivity analysis reveals the identification of the system’s parameters is essential, and the data cannot be selected completely arbitrarily. The limit values of the parameters determine the range of model applicability in the physical sense.
Nevertheless, the analysis showed the system’s sensitivity to a change in mass and its importance in managing vibration dynamics. This should be considered in the sustainable design of drive system gears.
The graphs in Figure 25, Figure 26, and Figure 27 show the system’s acceleration response over time for different damping coefficients.
Displacement amplitudes decrease as the mesh damping coefficient increases from 3000 to 90000 /, indicating logarithmic decrement increases, hence stabilization occurs faster and oscillations decrease. Lower damping values allow for larger displacement oscillations. As can be seen from Figure 27 as the mesh damping coefficient () increases the subsequent amplitudes are much smaller, indicating that the system is being damped more rapidly. For lower damping ( = 3000 / and = 6000 /), displacement amplitudes are significantly higher and exhibit slower decay. For higher damping ( = 60000 /, and = 90000 /), displacement signals rapidly approach minimal amplitudes, reflecting efficient energy dissipation. In particular, a zoomed-in view in Figure 26 shows that higher damping coefficients suppress peaks more effectively, confirming the role of cg in moderating displacement magnitudes. Increasing the mesh damping coefficient reduces displacement amplitudes and accelerates vibrational energy dissipation. Higher cg values stabilize the system more effectively, with a clear threshold effect evident at > 12000 /.
The effect of varying mesh damping is particularly evident during a two-pair mesh period when both pairs of teeth are along the line-of-action. In this case, displacement values are lower, the vibration period decreases, and the number of oscillations increases. In contrast, higher displacement values occur when only one pair of teeth is in contact (along the line-of-action). In this case, the mesh damping is less effective due to the periodic excitations caused by the second pair of teeth entering and exiting the line-of-action.
In turn, Figure 28 and Figure 29 show the acceleration of the system vibrations in the frequnecy domain for different mesh damping coefficients. Simulations for / resulted in / peak acceleration value appearing at . Peak acceleration for / was estimated for / at . Simulations carried out for / showed, that the system responded in frequnecy domain with peak acceleration of / at . Analyzed spectra for value 12000 / had peak of / at . Peak value for / was estimated at / for . Analysis of the curve for value 18000 / showed that peak of acceleration was not higher than / and was registered at . For analysis based on curve for value 30000 / it was observed, that acceleration was no higher than / and appeared at . For value 60000 /, peak acceleration of / was observed at . Analyzed spectra for value 90000 / had peak of / at . Peak value for / was estimated at / for .
Similarily to the case of stiffness, the shape of the FFT plot remains almost unchaged. A predictible behavior of highest amplitude peaks is observed, where for increasing damping the accelertions decrease. The frequency at which highest peak appears remains constant except for the extremely high damping value /.
Observations from frequency-domain signals in Figure 28 and Figure 29 show the acceleration peaks are highest for low damping coefficients ( = 3000 /), indicating higher vibrational forces. As damping coefficient increases, peak acceleration values drop significantly, with the most substantial reductions observed for >= 18000 /. For lower damping, energy is concentrated at a fundamental frequency. Higher damping coefficients redistribute this energy across a broader range of frequencies, reducing resonance risks. At > 60000 /, peak acceleration values are minimal, with energy spread thinly across frequencies, confirming effective damping.
In general, Higher mesh damping coefficients enhance system stability by minimizing displacement and acceleration responses to dynamic loads. Acceleration amplitudes decrease sharply with higher damping coefficients. Fundamental frequencies remain stable across all damping coefficients, while higher redistributes vibrational energy across a broader spectrum. Energy redistribution across frequencies improves mechanical stability and mitigates resonance risks. This leads to increased resistance of the system to dynamic behavior.
Effective damping reduces vibrational energy more rapidly, promoting efficient system operation and reducing mechanical fatigue. Optimizing damping coefficients can mitigate vibrational forces, critical for improving the operational reliability and lifespan of machinery.
5. Application of Obtained Results for Energy Harvesting System
Piezoelectric energy harvesters are based on converting vibration displacements into electrical voltage. Therefore, they should be selected based on the analysis of the frequency of vibrations occurring in the system (related to vibration phenomena in the device).
The resonance frequency of the energy harvester system corresponds to the point at which the largest amount of electrical energy can be generated. Therefore, to achieve maximum efficiency of the energy harvester, a piezoelectric material with a resonance frequency close to the major vibration frequency in the system should be selected to ensure the resonance vibrations of the device, providing the largest amplitude at a given frequency.
To effectively select a piezoelectric material, it is necessary to thoroughly examine the vibration characteristics in the system. Both the highest vibration frequencies and locations should be identified. For this purpose, the following can be used: modal analysis, measurement methods, numerical simulations. In the case under consideration, a series of analyses were carried out, presented in the energy spectra Figure 30, Figure 31, Figure 32, Figure 33, Figure 34 and Figure 35 obtained with a formula:
where:
- - energy of i-th frequecy stamp;
- - amplitude of i-th frequency stamp;
- - i-th frequency stamp.
Analysis of the plots (Figure 30, Figure 31, Figure 32, Figure 33, Figure 34 and Figure 35) allowed to draw conclusions about how the changes of values of subsequent parameters affect the energy generation. In the case of stiffness, the shape of the plots stays constant, with only difference in values of the energy - the higher the stiffness, the less energy is generated. Changes in the mass affect the energy waveforms both qualitatively and quantitatively. With the mass increasing, the overall values of energy also increase, but the span in which visible peaks appear shortens rapidly. When considering damping, with increase in it’s value, the generated energy decreases and bigger discrepancies in the plot shape are visible - the range of frequencies in which the highest peaks of energy appear gradually shortens and and shifts towards lower values.
In Figure 36, energy levels for reference data (Table 2) are shown. The highest energy peak appears at , what constitutes the optimal working point of such pair of gears from the point of view of energy harvesting. Hence, as stated above the piezoelectric device should be chosen in such a manner, as to respond the best for said frequency value. If from any reason such application is not possible, further analysis of the plot shows at least five different points, at which the amount of generated energy would not be as high, but still reasonable in comparison with the highest peak. Application of piezoelectric device reposnding to frequencies higher than 1000 would not provide satisfactory effect for such configuration of the system.
The harvester’s operating point is strongly related to the system parameters, so depending on their configuration, a different material and piezoelectric system solution should be selected. The analysis indicates that using analytical solutions allows the preliminary identification of the problem and estimation of the harvester’s performance. It should be emphasized that the presented analysis can be performed before conducting expensive experimental studies or at the design stage. That is why it is worth applying analytical solutions. Mathematical models allow for an initial estimation of the range of resonant frequencies and initial calculations of the profitability of using the energy harvester.
6. Conclusions
This study provides an analytical framework for understanding and optimizing gear mesh dynamics in machinery drive systems. The research bridges critical gaps in vibration analysis by employing the Multiple Scale Method (MSM) to model time-varying mesh stiffness and parametric vibrations. The main objective was to develop and validate analytical solutions and advance the understanding of gear’s dynamic models within drive trains. MSM is used to derive analytical solutions to determine the vibration frequency ranges and identify emitted components. The authors argue for the need to integrate such methods to optimize gearbox design, reduce vibrations, and improve operational reliability.
Using ISO 6336 standards and Fourier series, it formalizes stiffness variations during single-tooth and double-tooth meshing cycles. The model captures the periodic and parametric nature of gear vibrations, providing a solid mathematical foundation for analysis. Basd on this model the authors derived a series of approximations using MSM to solve nonlinear equations of motion for the gear system. These solutions reveal insights into displacement, velocity, and acceleration dynamics, emphasizing the role of damping and stiffness in modulating vibration amplitudes.
Based on the conducted simulation investigation of the gear system and comparison of the results for the analytical and numerical approaches, the following conclusions can be drawn:
1) The proposed model of varying stiffness based on the approximation of rectangular signal with Fourier series expansion allows for obtaining a more accurate representation of the meshing process.
2) The said approximated stiffness model stands as initially sufficient input for Hill’s equation, so the amplitudes and frequencies of the gear mechanism can be correctly identified.
3) The Hill’s equation approach itself enables vibration signals analysis of the working gear mechanism, despite the type of gear transmission system or gear meshing.
4) The analytical solution ensures the reliability and repeatability of results. A single run of the solving process allows results to be obtained for different parameters by substituting new values into the solution already given, which significantly reduces calculation time.
5) The proposed approach allows for quick and effective analysis of the vibracoustic properties of drive systems, including finding the operating point of machinery.
6) The possibility of energy-based determination of the machinery operating point is an important factor in the sustainable design of agricultural machinery. Using the analytical solution allows for a faster and more accurate selection of single gear (mass) and transmission (meshing stiffness, damping) physical parameters, so overall VA influence on operators and the environment can be diminished.
7) Energy analysis showed, that when considering different equivalent mass, mesh stiffness, and mesh damping values changes in these parameters influence the peak amplitude values and their position in the spectrum. Moreover, multiple operating points could be chosen, allowing for optimization regarding energy harvesting and other technical requirements for the system.
The analyses conducted showed that the operating point of the energy harvesting strongly depends on the system parameters. The presented results confirm the area application of the model for selecting energy harvesting parameters described in the introduction. Based on the simulations, it can be concluded that the model for selected gear parameters allows a preliminary determination of the amount of energy harvested and the operating point. Thus, it confirms the purpose of the article.
The general conclusion is that the Multiple Scale Method provides a robust analytical framework for predicting and managing parametric vibrations in gear systems. Increasing gear mesh stiffness effectively reduces vibrational amplitudes and shifts energy distribution to higher frequencies, enhancing stability. Optimised damping coefficients minimise transient oscillations, which contributes to improved machine durability and operator comfort.
The authors highlight the utility of their analytical solutions in enhancing gearbox configurations to minimize vibrations and improve durability and early detection of failures through vibration signal analysis. The application of MSM in gear mesh dynamics offers precision in predicting vibration behavior. The presented research results can be helpful in the sustainable design of gear meshing to optimise the drive systems dynamics, especially in agricultural machinery, where vibration control is important for the comfort and health of the operator. One can venture the far-reaching utilitarian conclusion that detailed mathematical modeling and a focus on computing performance can contribute to fostering safer and more efficient agricultural practices.
References
- Gong, J.; Liu, K.; Meng, F.; Wang, H.; Xu, H. Effect of meshing-induced deformation on lubrication for journal planet gear bearings. International Journal of Mechanical Sciences 2024, 284, 109747. [Google Scholar] [CrossRef]
- Zhu, L.Y.; Li, Z.F.; Gou, X.F.; Jin, G.G. Evolutionary mechanism of safety performance for spur gear pair based on meshing safety domain. Nonlinear dynamics 2021, 104, 215–239. [Google Scholar] [CrossRef]
- YuJie, W.; HongHui, L.; ZaiXin, L.; LingYu, L. Meshing performance analysis of tapered roller enveloping end face meshing worm drive (MT). Journal of Mechanical Strength 2023, pp. 931–938. [CrossRef]
- XIAN, W.; CHEN, Y.; GAO, J.; LUO, W.; CHEN, B. Meshing performance investigations on face worm gear drive with the variable worm cone angle. Journal of Advanced Mechanical Design, Systems, and Manufacturing 2023, 17, JAMDSM0073–JAMDSM0073. [Google Scholar] [CrossRef]
- Chen, M.; Xiong, X.; Zhuang, W. Design and Simulation of Meshing Performance of Modified Straight Bevel Gears. Metals 2021, 11. [Google Scholar] [CrossRef]
- Wang, Y.; Yu, X.; Wu, C.; Luo, S.; Long, X. Initiation and evolution of interference wear and pitting for spur gears considering the concurrent effects of meshing impact and mixed lubrication. Tribology International 2024, 200, 110081. [Google Scholar] [CrossRef]
- Shao, C.; Yang, Y.; Yang, W. Research of the Meshing Performance of New Concave-convex Ball Teeth. Journal of Physics: Conference Series 2024, 2747, 012048. [Google Scholar] [CrossRef]
- Ye, X.; Chen, Y.; Dou, C.; Wang, X.; Luo, W.; Chen, B. Meshing performance and error sensitivity of mismatched TI worm drive. Mechanism and Machine Theory 2022, 171, 104738. [Google Scholar] [CrossRef]
- XuDong, W.; ZaiXin, L.; LingYu, L. Meshing performance analysis of face roller enveloping hourglass worm dirve. Journal of Mechanical Strength 2022, 44, 921–929. [Google Scholar] [CrossRef]
- Li, Z.; Chen, Y.; Luo, W.; Chen, B. Study on meshing performance of a novel point-contact hourglass worm drive based on modified involute. Mechanism and Machine Theory 2023, 185, 105339. [Google Scholar] [CrossRef]
- Dou, C.; Chen, Y.; Liu, F.; Luo, W.; Chen, B. Meshing performance investigations on a novel end-face roller enveloping cylindrical worm drive with non-backlash. Mechanism and Machine Theory 2023, 182, 105235. [Google Scholar] [CrossRef]
- YANG, Z.; CHEN, Y.; GAO, J.; LUO, W.; CHEN, B. Meshing performance investigations on oblique worm drive. Journal of Advanced Mechanical Design, Systems, and Manufacturing 2024, 18, JAMDSM0007–JAMDSM0007. [Google Scholar] [CrossRef]
- Li, Z.; Wang, S.; Li, F.; Li, L.; Zou, H.; Liu, L. Research on Multiobjective Optimization Design of Meshing Performance and Dynamic Characteristics of Herringbone Gear Pair Under 3D Modification. Journal of Mechanical Design 2022, 144, 103401. [Google Scholar] [CrossRef]
- Lu, B.; Chen, Y.; Li, S.; Chen, B. Meshing performance investigations of involute worm and helical gear drive based on counterpart rack. Journal of mechanical science and technology 2021, 35, 3533–3548. [Google Scholar] [CrossRef]
- Huang, Q.; Gao, M.; Guo, M.; Wei, Y.; Zhang, J.; Jin, X. Vibration comfort assessment of tractor drivers based on sEMG and vibration signals. Computer methods in biomechanics and biomedical engineering 2024, 27, 1875–1892. [Google Scholar] [CrossRef] [PubMed]
- Novikov, V.V.; Pozdeev, A.V.; Chumakov, D.A.; Kolesov, N.M.; Timoshin, N.V.; Kagochkin, T.A.; Skribunova, V.E. Computational and experimental studies of vibration protection properties of the pneumatic wheel of the MTZ-82 B̎ELARUSẗractor with external spring-hydraulic mini suspension. Tractors and Agricultural Machinery 2024, 91. [Google Scholar]
- Rekem, J.; Janečková, R.; Otipka, V.; Prokop, A.; Řehák, K.; Žlábek, P. Multi-Body Model of Agricultural Tractor for Vibration Transmission Investigation. Applied Sciences 2024, 14. [Google Scholar] [CrossRef]
- Thaper, R.; Sesek, R.; Garnett, R.; Acosta-Sojo, Y.; Purdy, G.T. The Combined Impact of Hand-Arm Vibration and Noise Exposure on Hearing Sensitivity of Agricultural/Forestry Workers—A Systematic Literature Review. International journal of environmental research and public health 2023, 20, 4276. [Google Scholar] [CrossRef]
- Awwad, A.A.; Hilal, Y.Y.; Rajab, R.H. The Effect of Diesel Fuel Improvers on the Vibrations, Noise and Fuel Consumption of the Agricultural Tractor Engine During the Tillage Process. IOP Conference Series: Earth and Environmental Science 2023, 1213, 12098. [Google Scholar] [CrossRef]
- Venkatesan, V.; Nallusamy, N.; Nagapandiselvi, P. Reduction of vibration and noise pollution from agricultural tractor engine using novel pine oil and soapnut oil methyl ester as fuel. Environmental science and pollution research international 2023, 30, 36392–36404. [Google Scholar] [CrossRef] [PubMed]
- Cecchini, M.; Assettati, L.; Rossi, P.; Monarca, D.; Riccioni, S. Noise Exposure, Prevention, and Control in Agriculture and Forestry: A Scoping Review. Safety (Basel) 2024, 10, 15. [Google Scholar] [CrossRef]
- Ahn, D.V.; Shin, I.K.; Oh, J.; Chung, W.J.; Han, H.W.; Kim, J.T.; Park, Y.J. Reduction of Torsional Vibration in Resonance Phenomena for Tractor Power Take-Off Drivelines Using Torsional Damper. Transactions of the ASABE 2021, 64, 365–376. [Google Scholar] [CrossRef]
- Choi, C.; Ahn, H.; Park, Y.J.; chul Kim, S.; Yu, J. Dynamic behavior of an agricultural power take-off driveline for rattle noise reduction: Part 1. Effect of spline tolerance on the power take-off rattle noise. Journal of Terramechanics 2021, 98, 7–14. [Google Scholar] [CrossRef]
- Choi, C.; Ahn, H.; Yu, J.; Han, J.S.; Kim, S.C.; Park, Y.J. Optimization of gear macro-geometry for reducing gear whine noise in agricultural tractor transmission. Computers and Electronics in Agriculture 2021, 188, 106358. [Google Scholar] [CrossRef]
- Choi, C.; Ahn, H.J.; Park, Y.J.; Yu, J. Experimental Evaluation of Transmission Gear Noise in Agricultural Tractors. Journal of biosystems engineering 2023, 48, 283–290. [Google Scholar] [CrossRef]
- Jahanbakhshi, A.; Ghamari, B.; Heidarbeigi, K. Vibrations analysis of combine harvester seat in time and frequency domain. Journal of Mechanical Engineering and Sciences 2020, 14, 6251–6258. [Google Scholar] [CrossRef]
- Pedrero, J.I.; Pleguezuelos, M.; Sánchez, M.B. Analytical model for meshing stiffness, load sharing, and transmission error for helical gears with profile modification. Mechanism and Machine Theory 2023, 185, 105340. [Google Scholar] [CrossRef]
- Lin, J.; Parker, R.G. Planetary gear parametric instability caused by mesh stiffness variation. Journal of Sound and Vibration 2002, 249. [Google Scholar] [CrossRef]
- Chen, K.; Ma, H.; Che, L.; Li, Z.; Wen, B. Comparison of meshing characteristics of helical gears with spalling fault using analytical and finite-element methods. Mechanical Systems and Signal Processing 2019, 121, 279–298. [Google Scholar] [CrossRef]
- Gear Vibration Analysis: An Analytical and Experimental Study, Vol. Volume 6C: 18th Biennial Conference on Mechanical Vibration and Noise, International Design Engineering Technical Conferences and Computers and Information in Engineering Conference, 2001. [CrossRef]
- Zhang, D.; Wang, S. Parametric vibration of split gears induced by time-varying mesh stiffness. Proceedings of the Institution of Mechanical Engineers, Part C: Journal of Mechanical Engineering Science 2015, 229. [Google Scholar] [CrossRef]
- Litak, G.; Friswell, M.I. Vibration in gear systems. Chaos, Solitons & Fractals 2003, 16, 795–800. [Google Scholar] [CrossRef]
- Cao, Z.; Chen, Z.; Jiang, H. Nonlinear dynamics of a spur gear pair with force-dependent mesh stiffness. Nonlinear Dynamics 2020, 99, 1227–1241. [Google Scholar] [CrossRef]
- Gao, N.; Meesap, C.; Wang, S.; Zhang, D. Parametric vibrations and instabilities of an elliptical gear pair. Journal of Vibration and Control 2020, 26, 1721–1734. [Google Scholar] [CrossRef]
- Liu, Z.; Wei, H.; Wei, J.; Xu, Z.; Liu, Y. Parametric modelling of vibration response for high-speed gear transmission system. International Journal of Mechanical Sciences 2023, 249, 108273. [Google Scholar] [CrossRef]
- Aihara, T.; Sakamoto, K. Theoretical analysis of nonlinear vibration characteristics of gear pair with shafts. Theoretical and Applied Mechanics Letters 2022, 12, 100324. [Google Scholar] [CrossRef]
- Time-varying dynamic analysis for a helical gear pair system with three-dimensional motion due to bearing deformation. Advances in Mechanical Engineering 2020, 12, 1687814020918128. [CrossRef]
- Velex, P.; Flamand, L. Dynamic Response of Planetary Trains to Mesh Parametric Excitations. Journal of Mechanical Design 1996, 118, 7–14. [Google Scholar] [CrossRef]
- Mohammed, O.D.; Rantatalo, M. Gear fault models and dynamics-based modelling for gear fault detection – A review. Engineering Failure Analysis 2020, 117, 104798. [Google Scholar] [CrossRef]
- Ottewill, J.; Neild, S.; Wilson, R. An investigation into the effect of tooth profile errors on gear rattle. Journal of Sound and Vibration 2010, 329, 3495–3506. [Google Scholar] [CrossRef]
- Bahk, C.J.; Parker, R.G. Analytical Solution for the Nonlinear Dynamics of Planetary Gears. Journal of Computational and Nonlinear Dynamics 2011, 6. [Google Scholar] [CrossRef]
- Analytical and experimental study of vibrations in a gear transmission, 27th Joint Propulsion Conference, Sacramento, CA, USA, 24 June 1991 - 26 June 1991, 1991. [CrossRef]
- Feng, K.; Ji, J.C.; Ni, Q.; Beer, M. A review of vibration-based gear wear monitoring and prediction techniques, 2023. [CrossRef]
- Wan, Z.; Cao, H.; Zi, Y.; He, W.; Chen, Y. Mesh stiffness calculation using an accumulated integral potential energy method and dynamic analysis of helical gears. Mechanism and Machine Theory 2015, 92, 447–463. [Google Scholar] [CrossRef]
- Vallone, M.; Bono, F.; Quendler, E.; Febo, P.; Catania, P. Risk exposure to vibration and noise in the use of agricultural track-laying tractors. Annals of Agricultural and Environmental Medicine 2016, 23, 591–597. [Google Scholar] [CrossRef]
- Cvetanovic, B.; Cvetković, D.; Praščević, M.; Cvetković, M.; Pavlović, M. An analysis of the impact of agricultural tractor seat cushion materials to the level of exposure to vibration. Journal of Low Frequency Noise, Vibration and Active Control 2017, 36, 116–123. [Google Scholar] [CrossRef]
- Singh, A.; Samuel, S.; Dhabi, Y.K.; Singh, H. Whole-body vibration: Characterization of seat-to-head transmissibility for agricultural tractor drivers during loader operation. Smart Agricultural Technology 2023, 4, 100164. [Google Scholar] [CrossRef]
- Aybek, A.; Kamer, H.A.; Arslan, S. Personal noise exposures of operators of agricultural tractors. Applied Ergonomics 2010, 41, 274–281, Special Section: Behavioural Effects and Drive-Vehicle-Environment Modelling in Modern Automotive Systems. [Google Scholar] [CrossRef]
- Solecki, L. Preliminary recognition of whole body vibration risk in private farmers’ working environment. Annals of Agricultural and Environmental Medicine 2007, 14. [Google Scholar]
- Sümer, S.K.; Say, S.M.; Ege, F.; Sabanci, A. Noise exposed of the operators of combine harvesters with and without a cab. Applied Ergonomics 2006, 37, 749–756. [Google Scholar] [CrossRef]
- Servadio, P.; Marsili, A.; Belfiore, N. Analysis of driving seat vibrations in high forward speed tractors. Biosystems Engineering 2007, 97, 171–180. [Google Scholar] [CrossRef]
- Dai, H.; Long, X.; Chen, F.; Xun, C. An improved analytical model for gear mesh stiffness calculation. Mechanism and Machine Theory 2021, 159, 104262. [Google Scholar] [CrossRef]
- Marsili, A.; Ragni, L.; Santoro, G.; Servadio, P.; Vassalini, G. PM—Power and Machinery: Innovative Systems to reduce Vibrations on Agricultural Tractors: Comparative Analysis of Acceleration transmitted through the Driving Seat. Biosystems Engineering 2002, 81, 35–47. [Google Scholar] [CrossRef]
- Ma, H.; Zeng, J.; Feng, R.; Pang, X.; Wen, B. An improved analytical method for mesh stiffness calculation of spur gears with tip relief. Mechanism and Machine Theory 2016, 98, 64–80. [Google Scholar] [CrossRef]
- Zajíček, M.; Dupal, J. Analytical solution of spur gear mesh using linear model. Mechanism and Machine Theory 2017, 118, 154–167. [Google Scholar] [CrossRef]
- Brunetti, J.; D’Ambrogio, W.; Fregolent, A. Analysis of the Vibrations of Operators’ Seats in Agricultural Machinery Using Dynamic Substructuring. Applied Sciences 2021, 11. [Google Scholar] [CrossRef]
- Marafona, J.D.; Marques, P.M.; Martins, R.C.; Seabra, J.H. Approximate expression for the single tooth pair slice mesh stiffness. Mechanism and Machine Theory 2023, 187, 105367. [Google Scholar] [CrossRef]
- Kahraman, A.; Singh, R. Interactions between time-varying mesh stiffness and clearance non-linearities in a geared system. Journal of Sound and Vibration 1991, 146, 135–156. [Google Scholar] [CrossRef]
- Fernandes, J.C.d.M.; Silva, L.d.H.; Schutzer, V.M.; Catarino, J.M.; Panini, R.L.; Garnica, G.B.; Meneguetti, D.; Guarnetti dos Santos, J.E. Ergonomic aspects and evaluation of vibration in the operating position of agricultural tractors. Revista Ação Ergonômica 2018, 13, 244–250. [Google Scholar] [CrossRef]
- Kong, Y.; Jiang, H.; Dong, N.; Shang, J.; Yu, P.; Li, J.; Yu, M.; Chen, L. Analysis of Time-Varying Mesh Stiffness and Dynamic Response of Gear Transmission System with Pitting and Cracking Coupling Faults. Machines 2023, 11. [Google Scholar] [CrossRef]
- Fernandez del Rincon, A.; Viadero, F.; Iglesias, M.; García, P.; de Juan, A.; Sancibrian, R. A model for the study of meshing stiffness in spur gear transmissions. Mechanism and Machine Theory 2013, 61, 30–58. [Google Scholar] [CrossRef]
- Pleguezuelos, M.; Sánchez, M.B.; Pedrero, J.I. Analytical model for meshing stiffness, load sharing, and transmission error for spur gears with profile modification under non-nominal load conditions. Applied Mathematical Modelling 2021, 97, 344–365. [Google Scholar] [CrossRef]
- Nevzat Özgüven, H.; Houser, D. Mathematical models used in gear dynamics - A review. Journal of Sound and Vibration 1988, 121, 383–411. [Google Scholar] [CrossRef]
- Rekem, J.; Janečková, R.; Otipka, V.; Prokop, A.; Řehák, K.; Žlábek, P. Multi-Body Model of Agricultural Tractor for Vibration Transmission Investigation. Applied Sciences 2024, 14. [Google Scholar] [CrossRef]
- Mehta, C.; Shyam, M.; Singh, P.; Verma, R. Ride vibration on tractor-implement system. Applied Ergonomics 2000, 31, 323–328. [Google Scholar] [CrossRef] [PubMed]
- Gao, Y.; Yang, Y.; Fu, S.; Feng, K.; Han, X.; Hu, Y.; Zhu, Q.; Wei, X. Analysis of Vibration Characteristics of Tractor–Rotary Cultivator Combination Based on Time Domain and Frequency Domain. Agriculture 2024, 14. [Google Scholar] [CrossRef]
- Gialamas, T.; Gravalos, I.; Kateris, D.; Xyradakis, P.; Dimitriadis, C. Vibration analysis on driver’s seat of agricultural tractors during tillage tests. Spanish Journal of Agricultural Research 2017, 14, e0210. [Google Scholar] [CrossRef]
- Günther, A. Modellierung der Ausbreitung elektromagnetischer Wellen durch Pflanzenmaterial in Erntemaschinen. agricultural engineering.eu 2022, 77. [Google Scholar] [CrossRef]
- Singh, A.; Nawayseh, N.; Samuel, S.; Dhabi, Y.K.; Singh, H. Real-time vibration monitoring and analysis of agricultural tractor drivers using an IoT-based system. Journal of Field Robotics 2023, 40, 1723–1738. [Google Scholar] [CrossRef]
- Gohari, M.; Tahmasebi, M.; Rafieian, F.; Pak, A. Optimisation, development and evaluation of a tractor seat suspension via artificial intelligent method. Journal of Theoretical and Applied Vibration and Acoustics 2023, 9, 54–64. [Google Scholar] [CrossRef]
- Drewniak, J. Projektowanie kół zębatych walcowych, stożkowych i ślimakowych wg norm ISO; Wydawnictwo ATH: Bielsko – Biała, 2009.
- Park, C.I.L. Characteristics of noise generated by axial excitation of helical gears in shaft-bearing-plate system. Journal of Mechanical Science and Technology 2015, 29, 1571–1579. [Google Scholar] [CrossRef]
- ISO 6336-1:2019 Calculation of load capacity of spur and helical gears. Part 1: Basic principles, introduction and general influence factors. https://www.iso.org/standard/63819.html, 2019. Published (Edition 3, 2019) by Technical Comittee ISO/TC 60, Gears - Subcommittee SC 2, Gear capacity calculation.
- Żurawski, M.; Chiliński, B.; Zalewski, R. A Novel method for changing the dynamics of slender elements using Sponge Particles Structures. Advances in Mechanical Testing of Engineering Materials 2020, 13(21). [CrossRef]
- Chilinski, B.; Mackojc, A.; Zalewski, R.; Mackojc, K. Proposal of the 3-DOF model as an approach to modelling offshore lifting dynamics. Ocean Engineering 2020, 203, 287–314. [Google Scholar] [CrossRef]
- Li, Y.; Yuan, S.; Wu, W.; Song, X.; Liu, K.; Lian, C. Dynamic Analysis of the Helical Gear Transmission System in Electric Vehicles with a Large Helix Angle. Machines 2023, 11. [Google Scholar] [CrossRef]
- Huangfu, Y.; Dong, X.; Chen, K.; Tu, G.; Long, X.; Peng, Z. A tribo-dynamic based pitting evolution model of planetary gear sets: A topographical updating approach. International Journal of Mechanical Sciences 2022, 220, 107157. [Google Scholar] [CrossRef]
- Flek, J.; Dub, M.; Kolář, J.; Lopot, F.; Petr, K. Determination of Mesh Stiffness of Gear—Analytical Approach vs. FEM Analysis. Applied Sciences 2021, 11. [Google Scholar] [CrossRef]
- Zheng, X.; Luo, W.; Hu, Y.; He, Z.; Wang, S. Analytical approach to mesh stiffness modeling of high-speed spur gears. International Journal of Mechanical Sciences 2022, 224, 107318. [Google Scholar] [CrossRef]
- Yang, H.; Shi, W.; Chen, Z.; Guo, N. An improved analytical method for mesh stiffness calculation of helical gear pair considering time-varying backlash. Mechanical systems and signal processing 2022, 170, 108882. [Google Scholar] [CrossRef]
- Liu, Z.; Jiang, Y.; Luo, R.; Wu, Y.; Huang, J.; Feng, N.; Li, K. Improved analytical model for calculating mesh stiffness and transmission error of helical gears considering root curve: Theoretical analysis and experiments. Advances in Mechanical Engineering 2024, 16, 16878132241228196. [Google Scholar] [CrossRef]
- Chung, W.J.; Park, J.H.; Yoo, H.G.; Park, Y.J.; Kim, S.c.; Sohn, J.; Lee, G.h. Improved analytical model for calculating mesh stiffness and transmission error of helical gears considering trochoidal root profile. Mechanism and machine theory 2021, 163, 104386. [Google Scholar] [CrossRef]
- Marques, P.M.; Marafona, J.D.; Martins, R.C.; Seabra, J.H. A continuous analytical solution for the load sharing and friction torque of involute spur and helical gears considering a non-uniform line stiffness and line load. Mechanism and machine theory 2021, 161, 104320. [Google Scholar] [CrossRef]
- Jin, Y.; Zhang, Q.; Chen, Y.; Zu, T. A shape-independent analytical method for gear mesh stiffness with asymmetric spalling defects. Scientific reports 2024, 14, 15545–19. [Google Scholar] [CrossRef]
- Wu, X.; Luo, Y.; Li, Q.; Shi, J. A new analytical model for evaluating the time-varying mesh stiffness of helical gears in healthy and spalling cases. Engineering Failure Analysis 2022, 131, 105842. [Google Scholar] [CrossRef]
- Shen, L.; Zhou, Z.; Wu, X.; He, S.; Yang, N.; Luo, Y. Study on the gear-rack meshing dynamic performance based on a multi-body dynamic model of rack rail vehicle. Advances in Mechanical Engineering 2024, 16, 16878132241286640. [Google Scholar] [CrossRef]
- Jian, G.x.; Wang, Y.q.; Zhang, P.; Li, Y.k.; Luo, H. Analysis of lubrication performance for internal meshing gear pair considering vibration. Journal of Central South University 2021, 28, 126–139. [Google Scholar] [CrossRef]
- Li, Y.; Li, G.; Wang, Z.; Mayfield, W. On gear time-varying meshing stiffness calculation considering indexing feeds and processing characteristics of gear shaping processing. Precision Engineering 2024, 91, 418–432. [Google Scholar] [CrossRef]
- Li, S.; Kahraman, A. A tribo-dynamic model of a spur gear pair. Journal of Sound and Vibration 2013, 332, 4963–4978. [Google Scholar] [CrossRef]
- Cai, Y.; Hayashi, T. The Linear Approximated Equation of Vibration of a Pair of Spur Gears (Theory and Experiment). Journal of Mechanical Design 1994, 116, 558–564. [Google Scholar] [CrossRef]
- Chilinski, B.; Mackojc, A.; Mackojc, K. Analytical solution of parametrically induced payload nonlinear pendulation in offshore lifting. Ocean Engineering 2022, 259, 111835. [Google Scholar] [CrossRef]
Figure 1.
Comparison of rectangular signal and approximated mesh stiffness
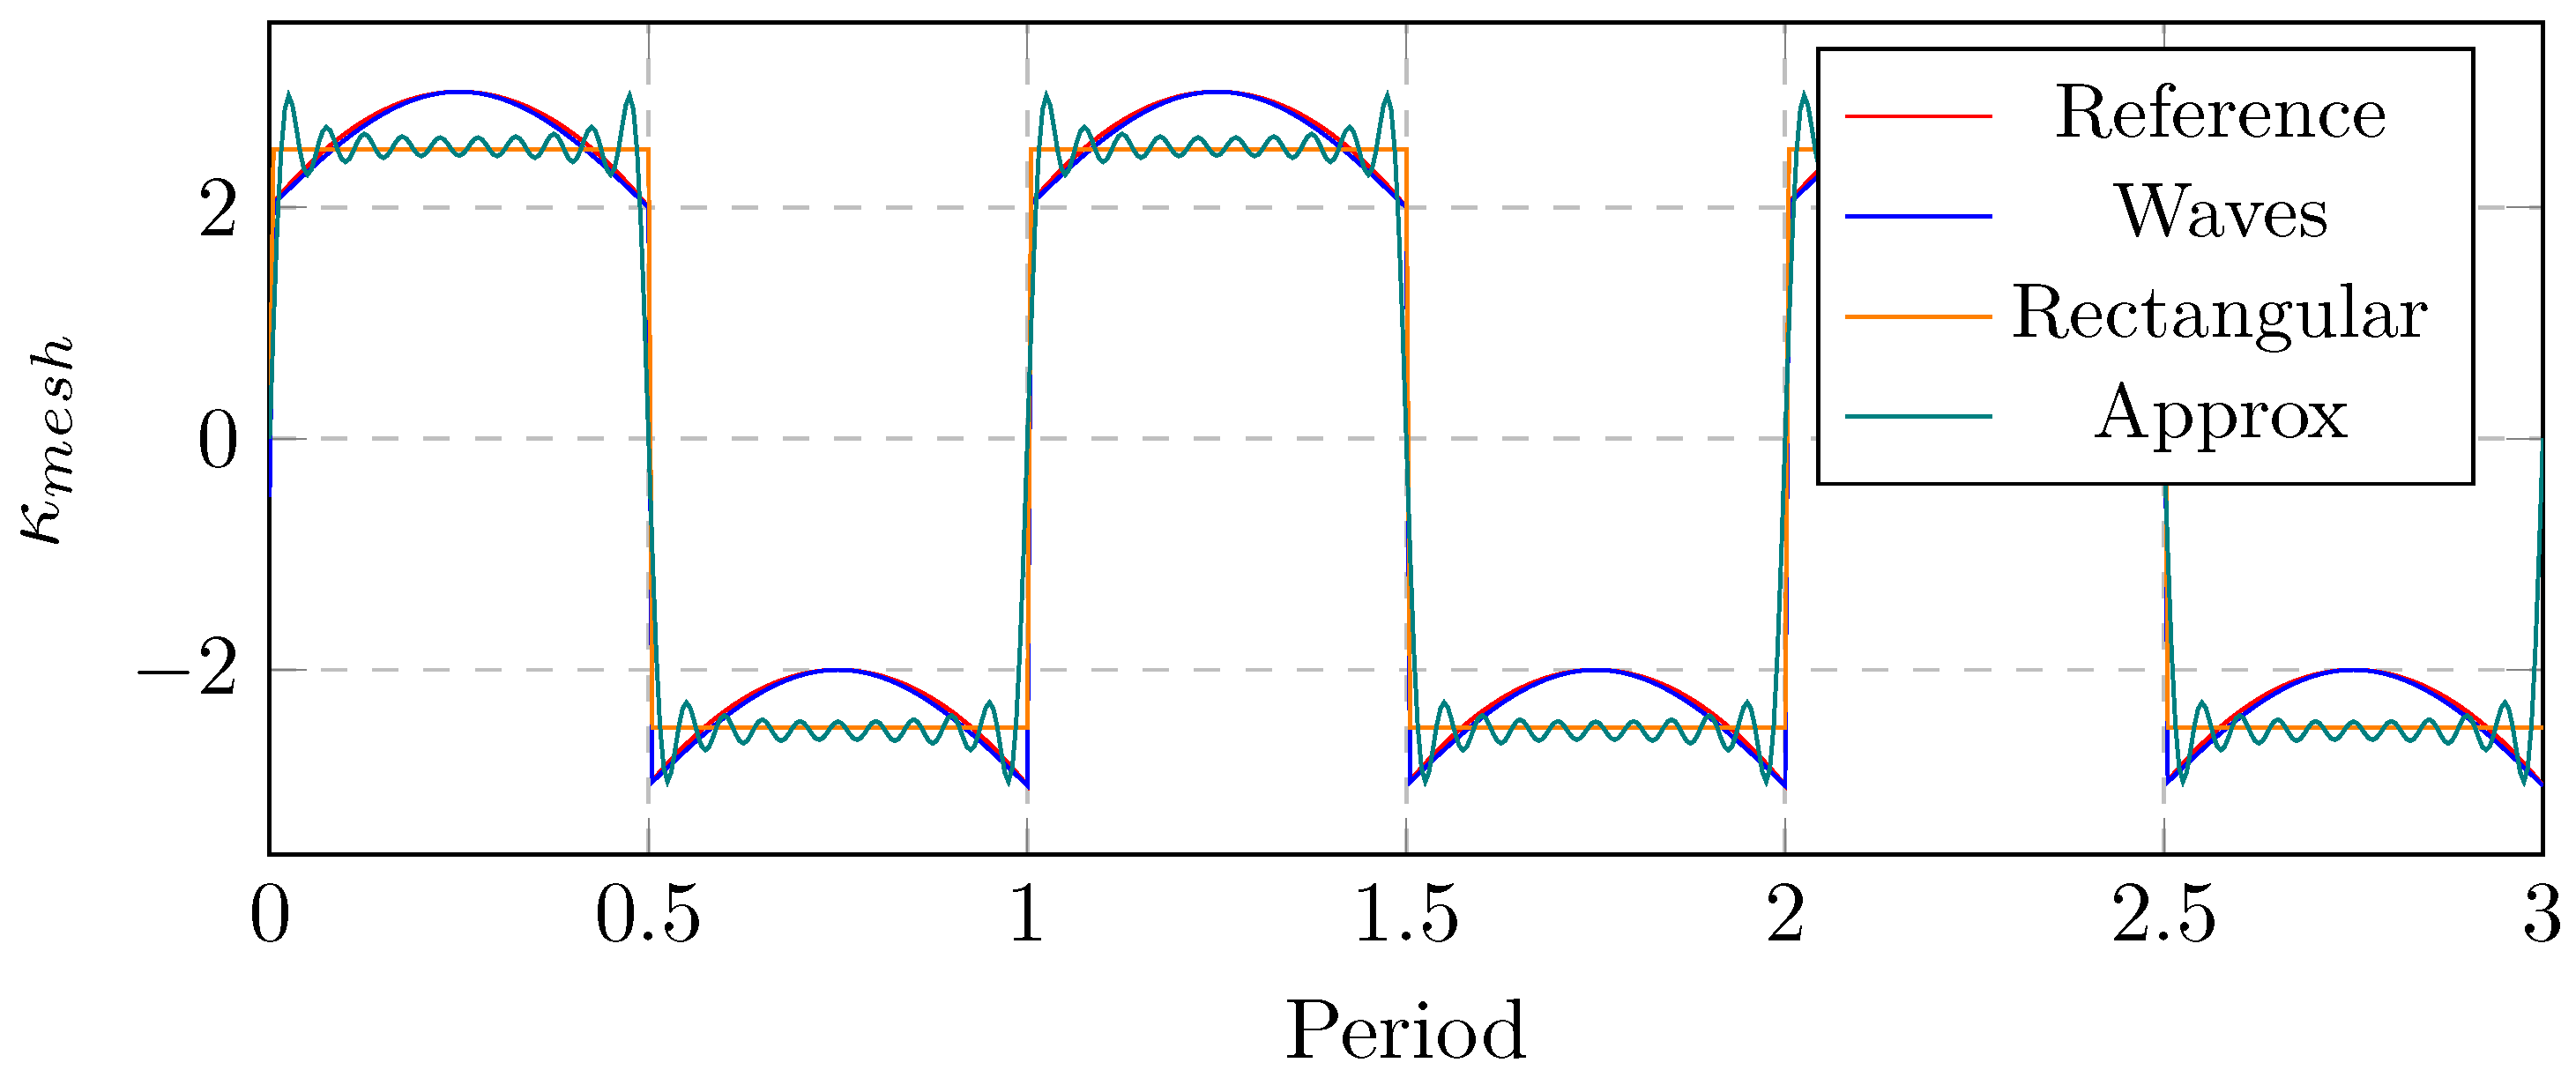
Figure 2.
Comparison between FFT spectra for different stiffness models
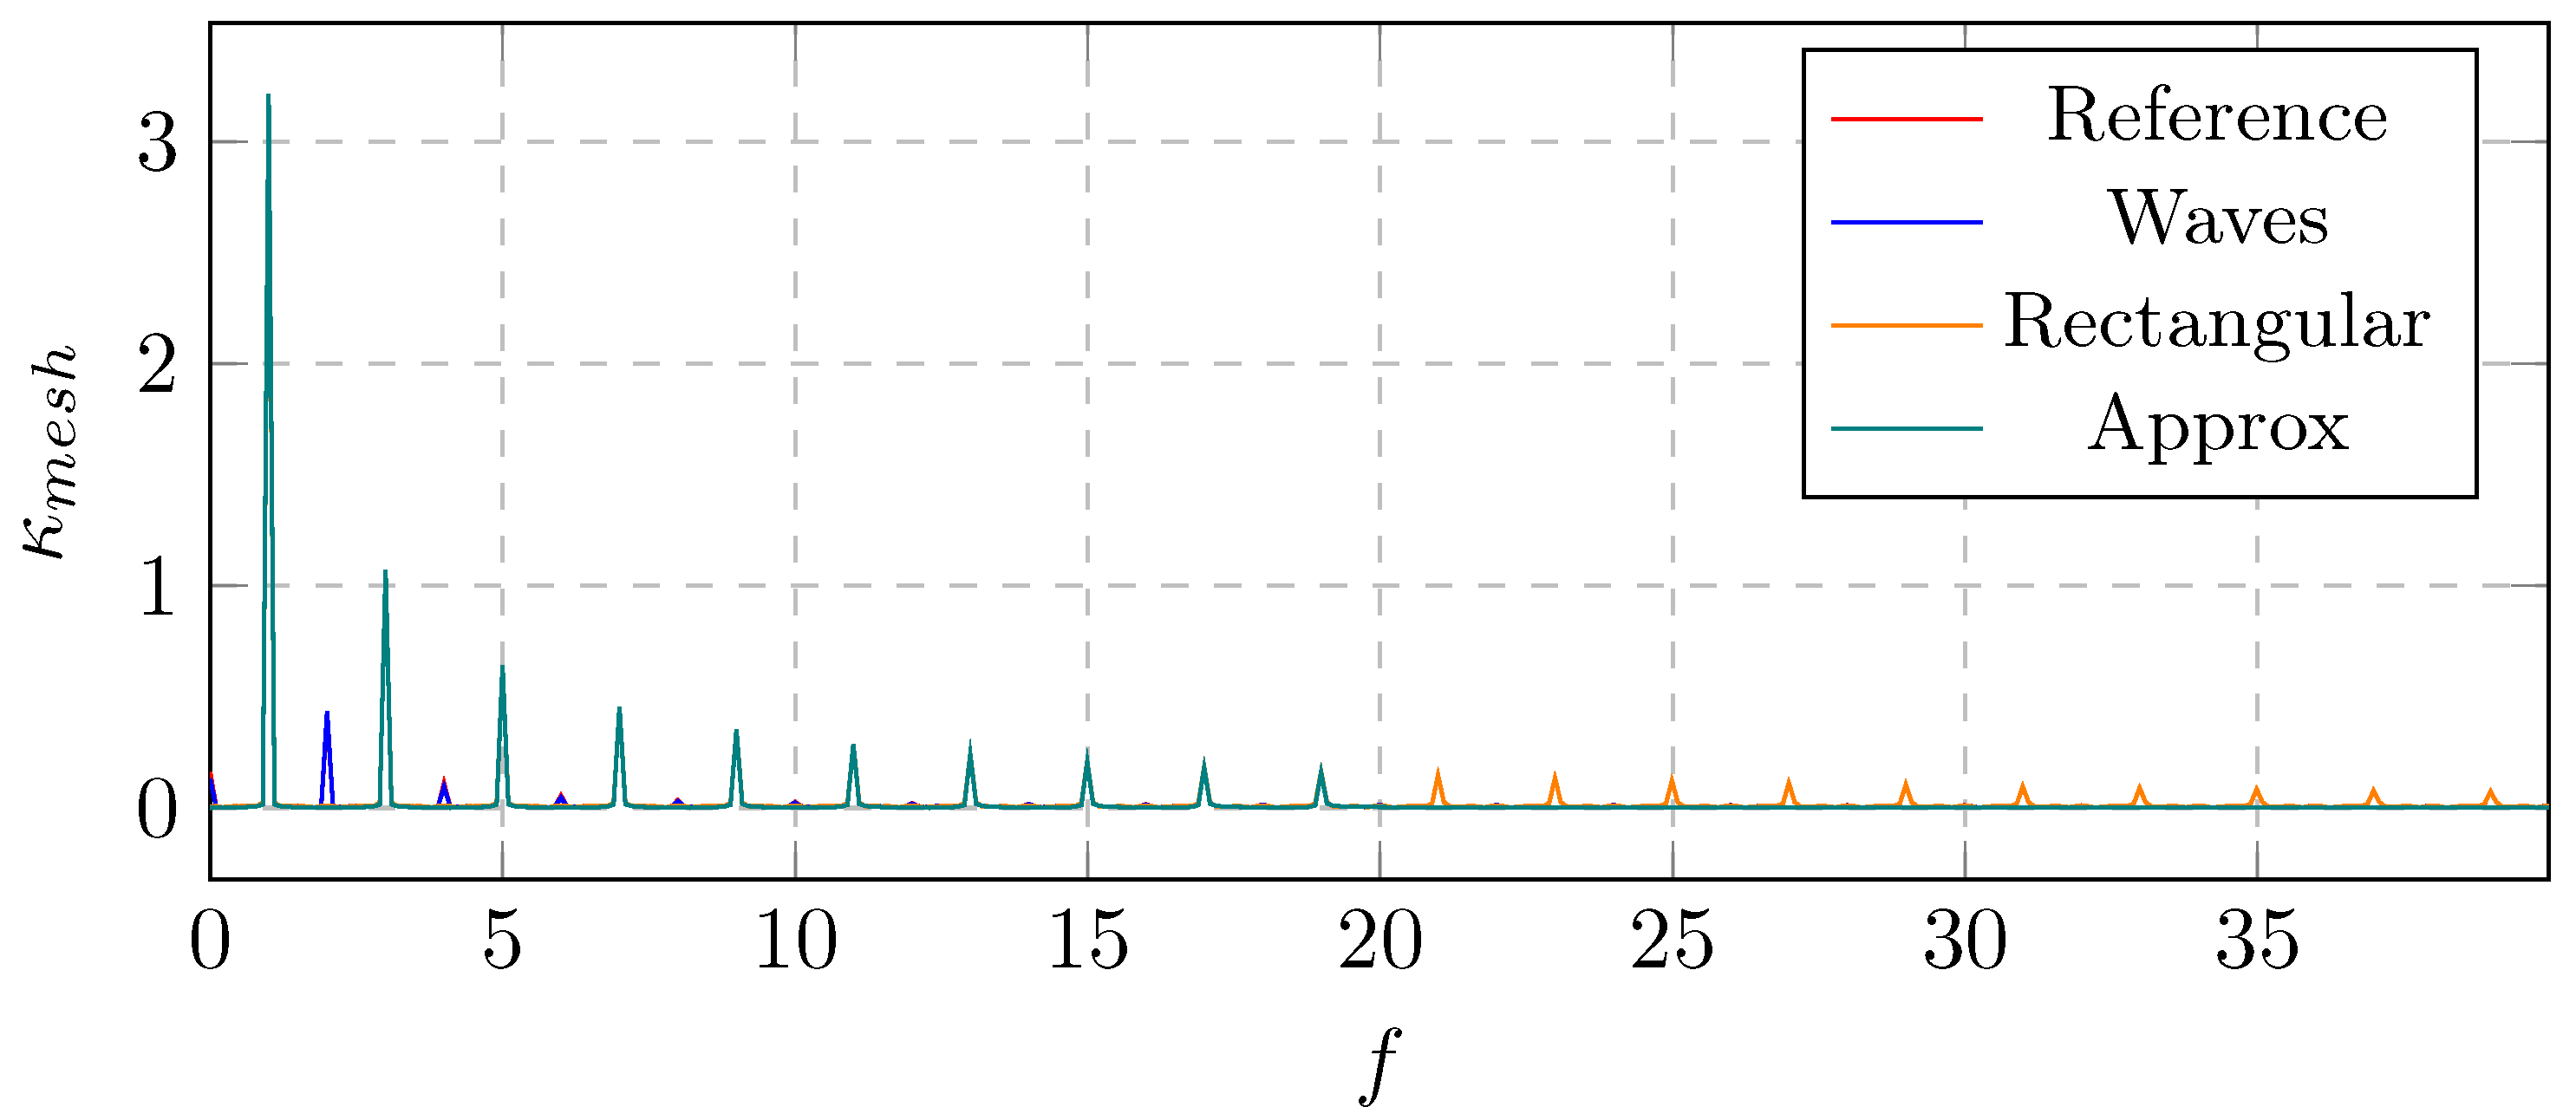
Figure 3.
Comparison between FFT spectra for different stiffness models - separate view
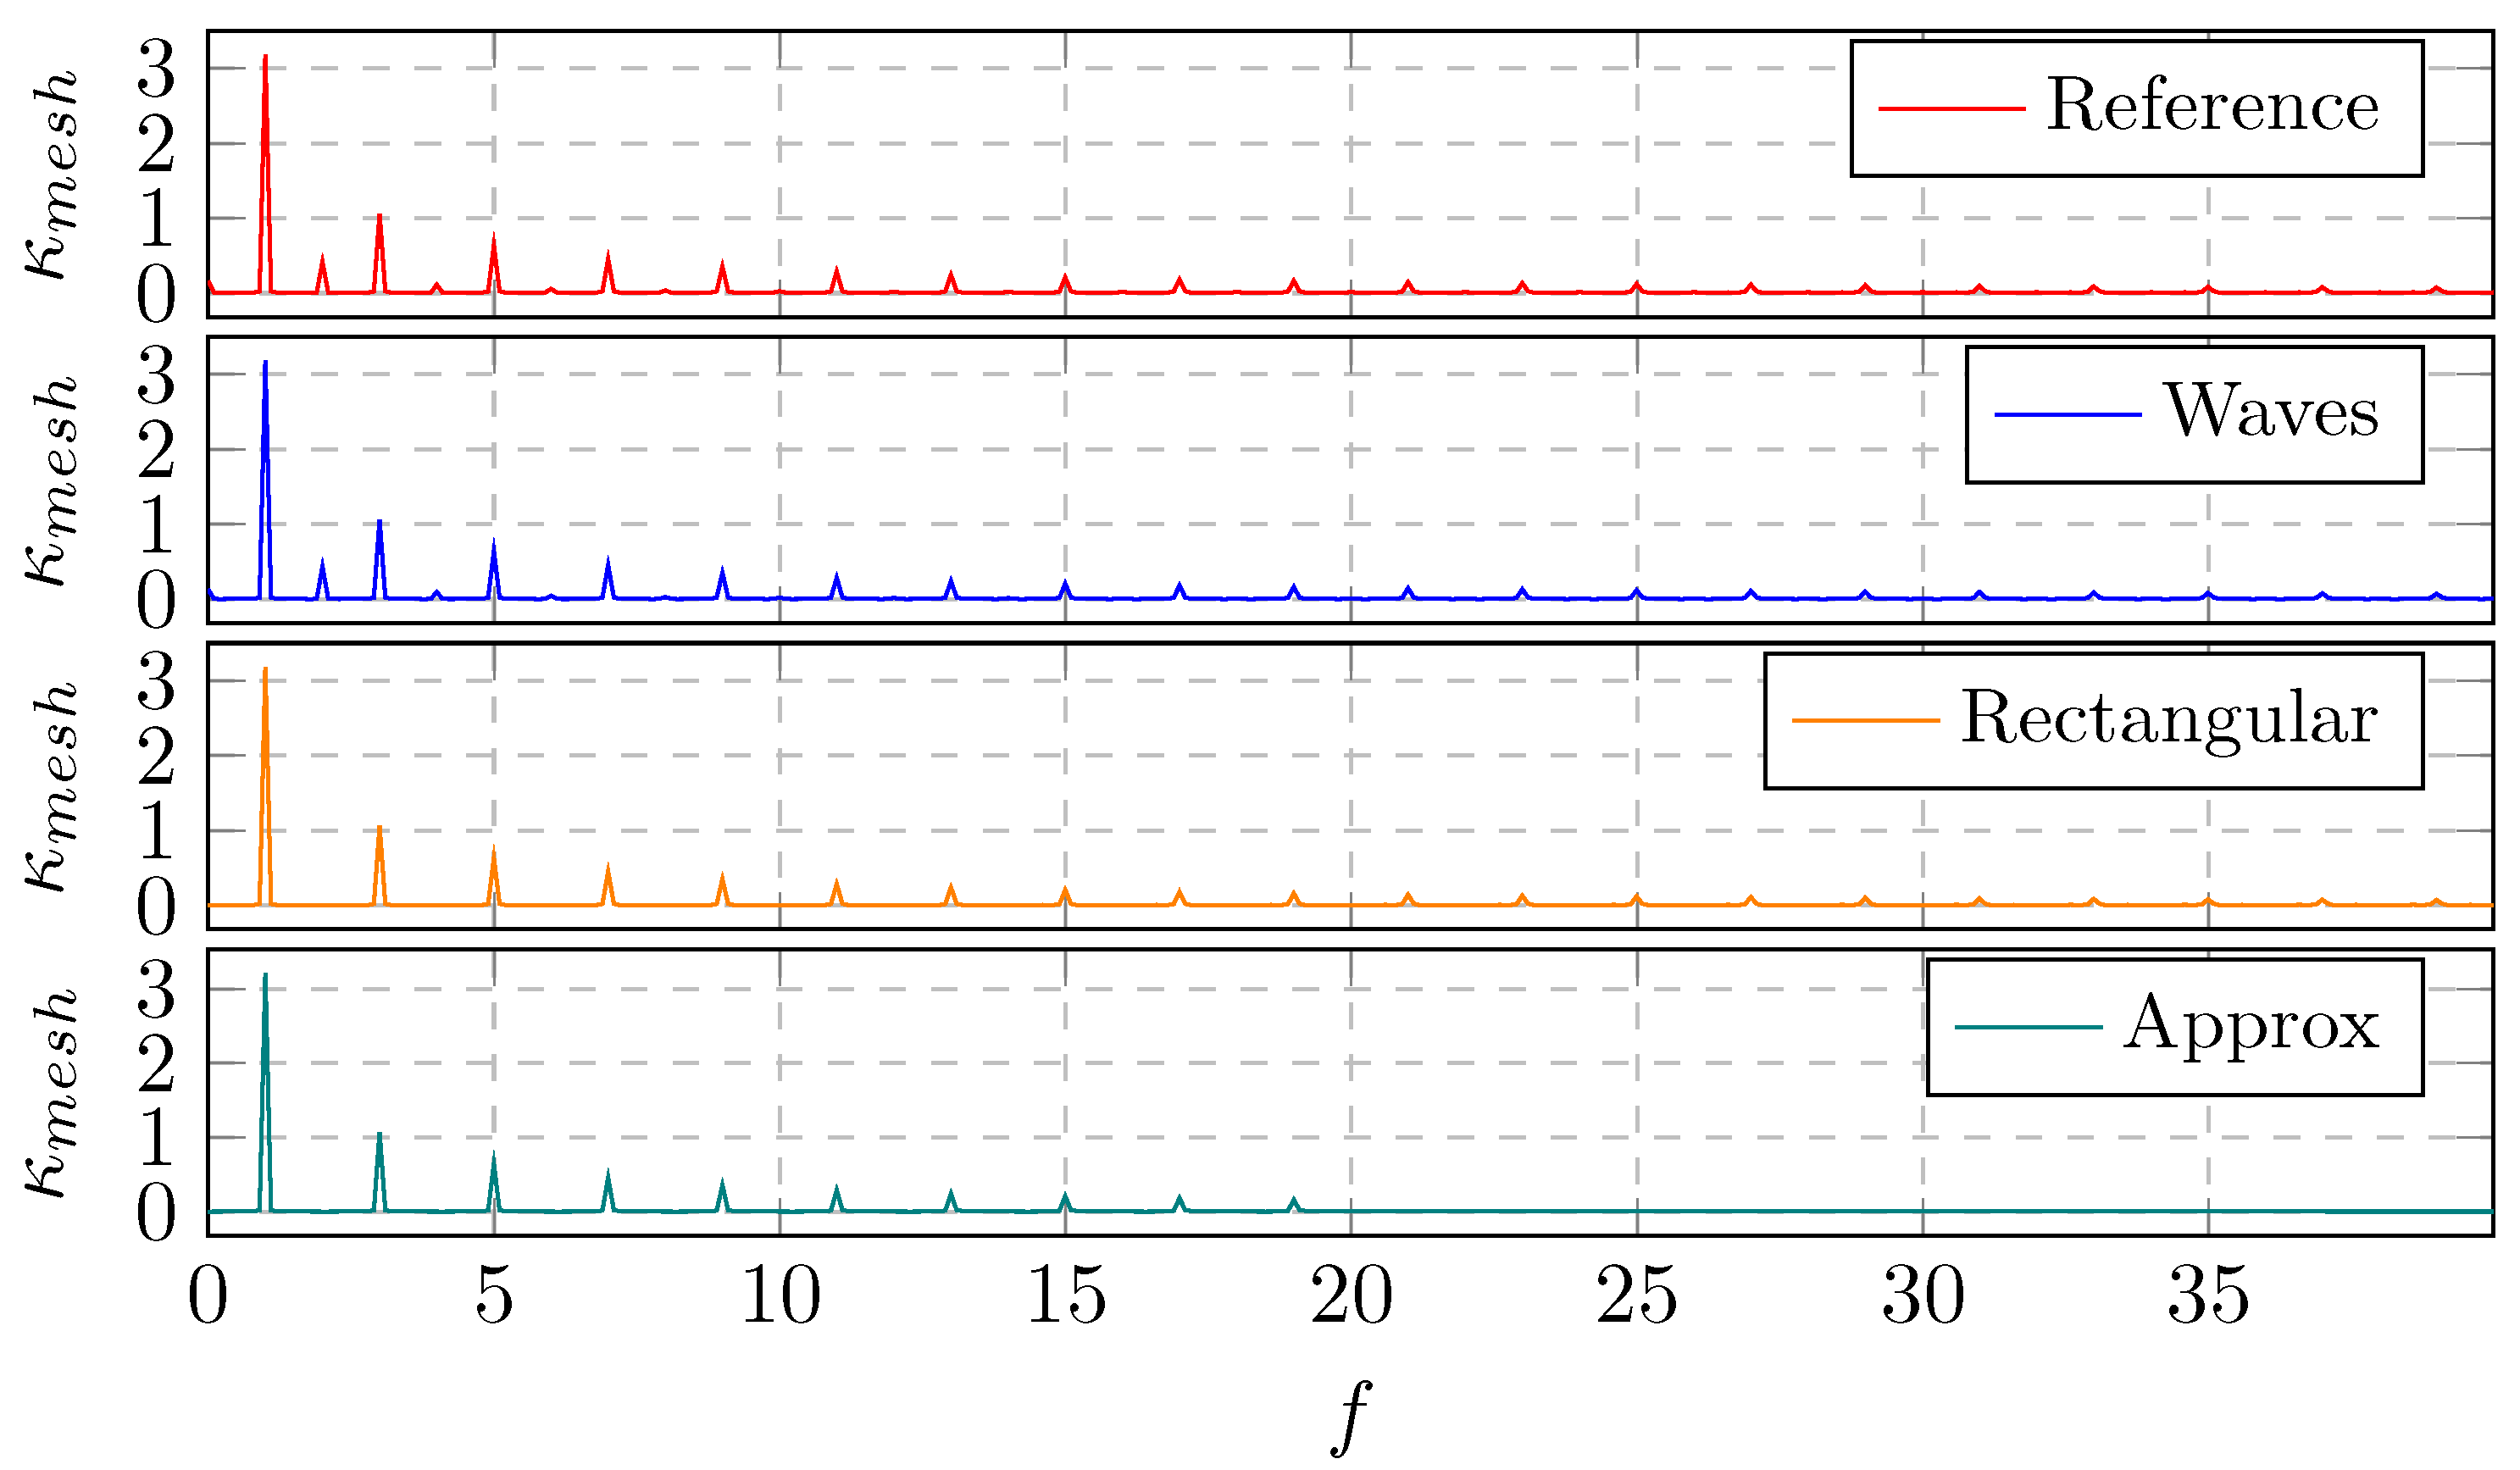
Figure 4.
Displacement of the system vibrations with time-varying mesh stiffness as waves signal
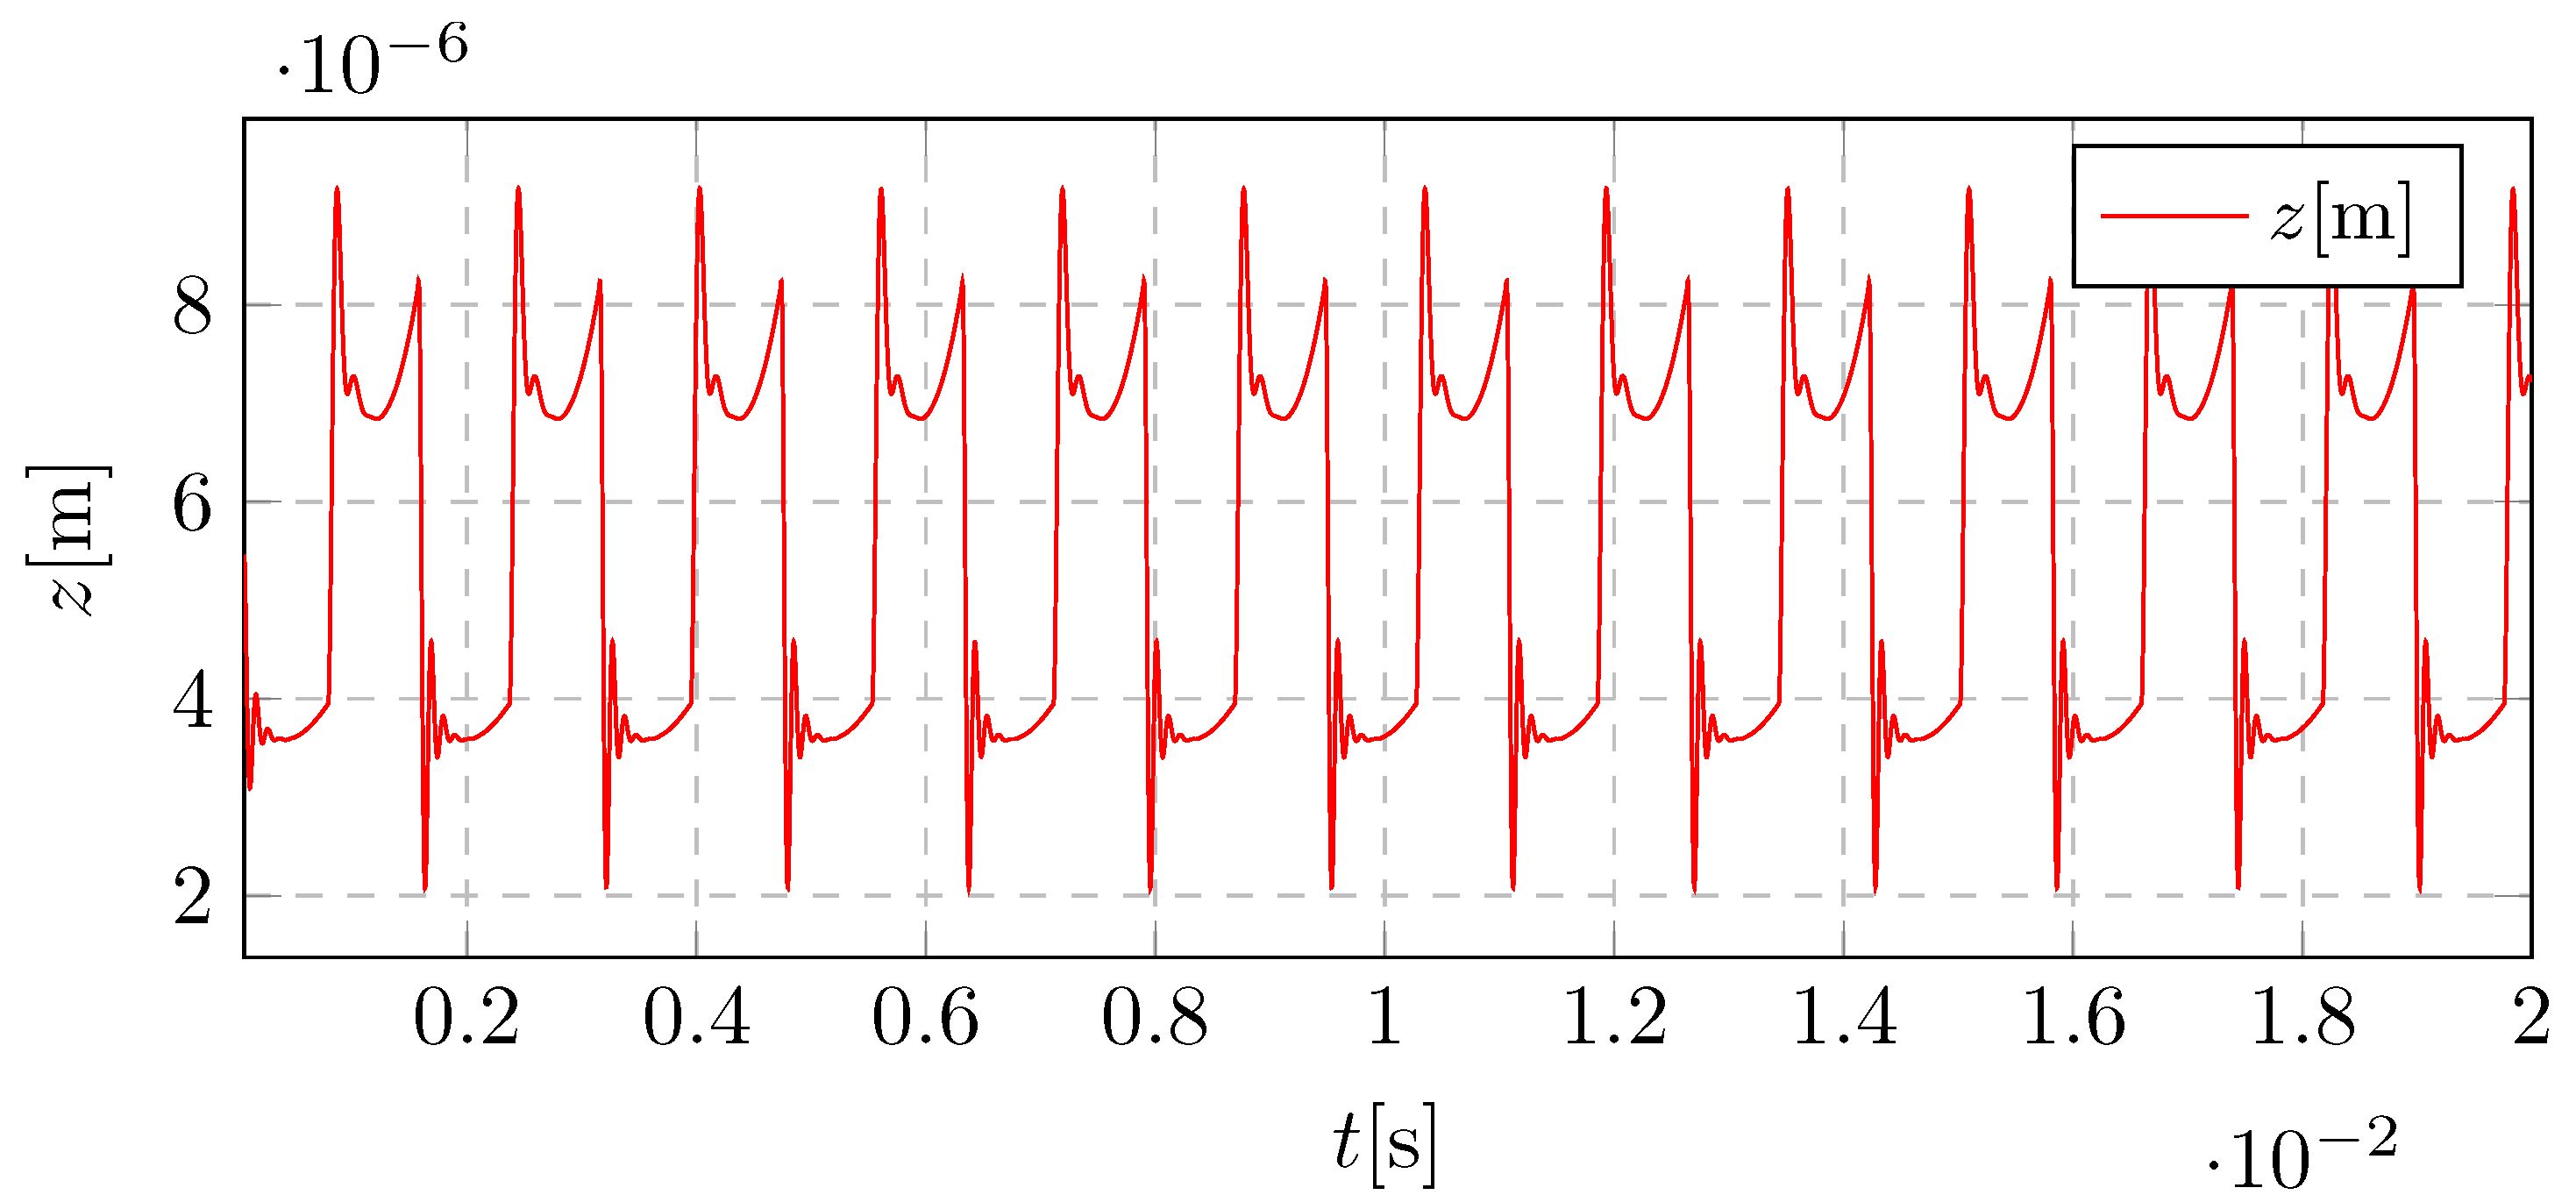
Figure 5.
Displacement of the system vibrations with time-varying mesh stiffness as rectangular signal
Figure 5.
Displacement of the system vibrations with time-varying mesh stiffness as rectangular signal
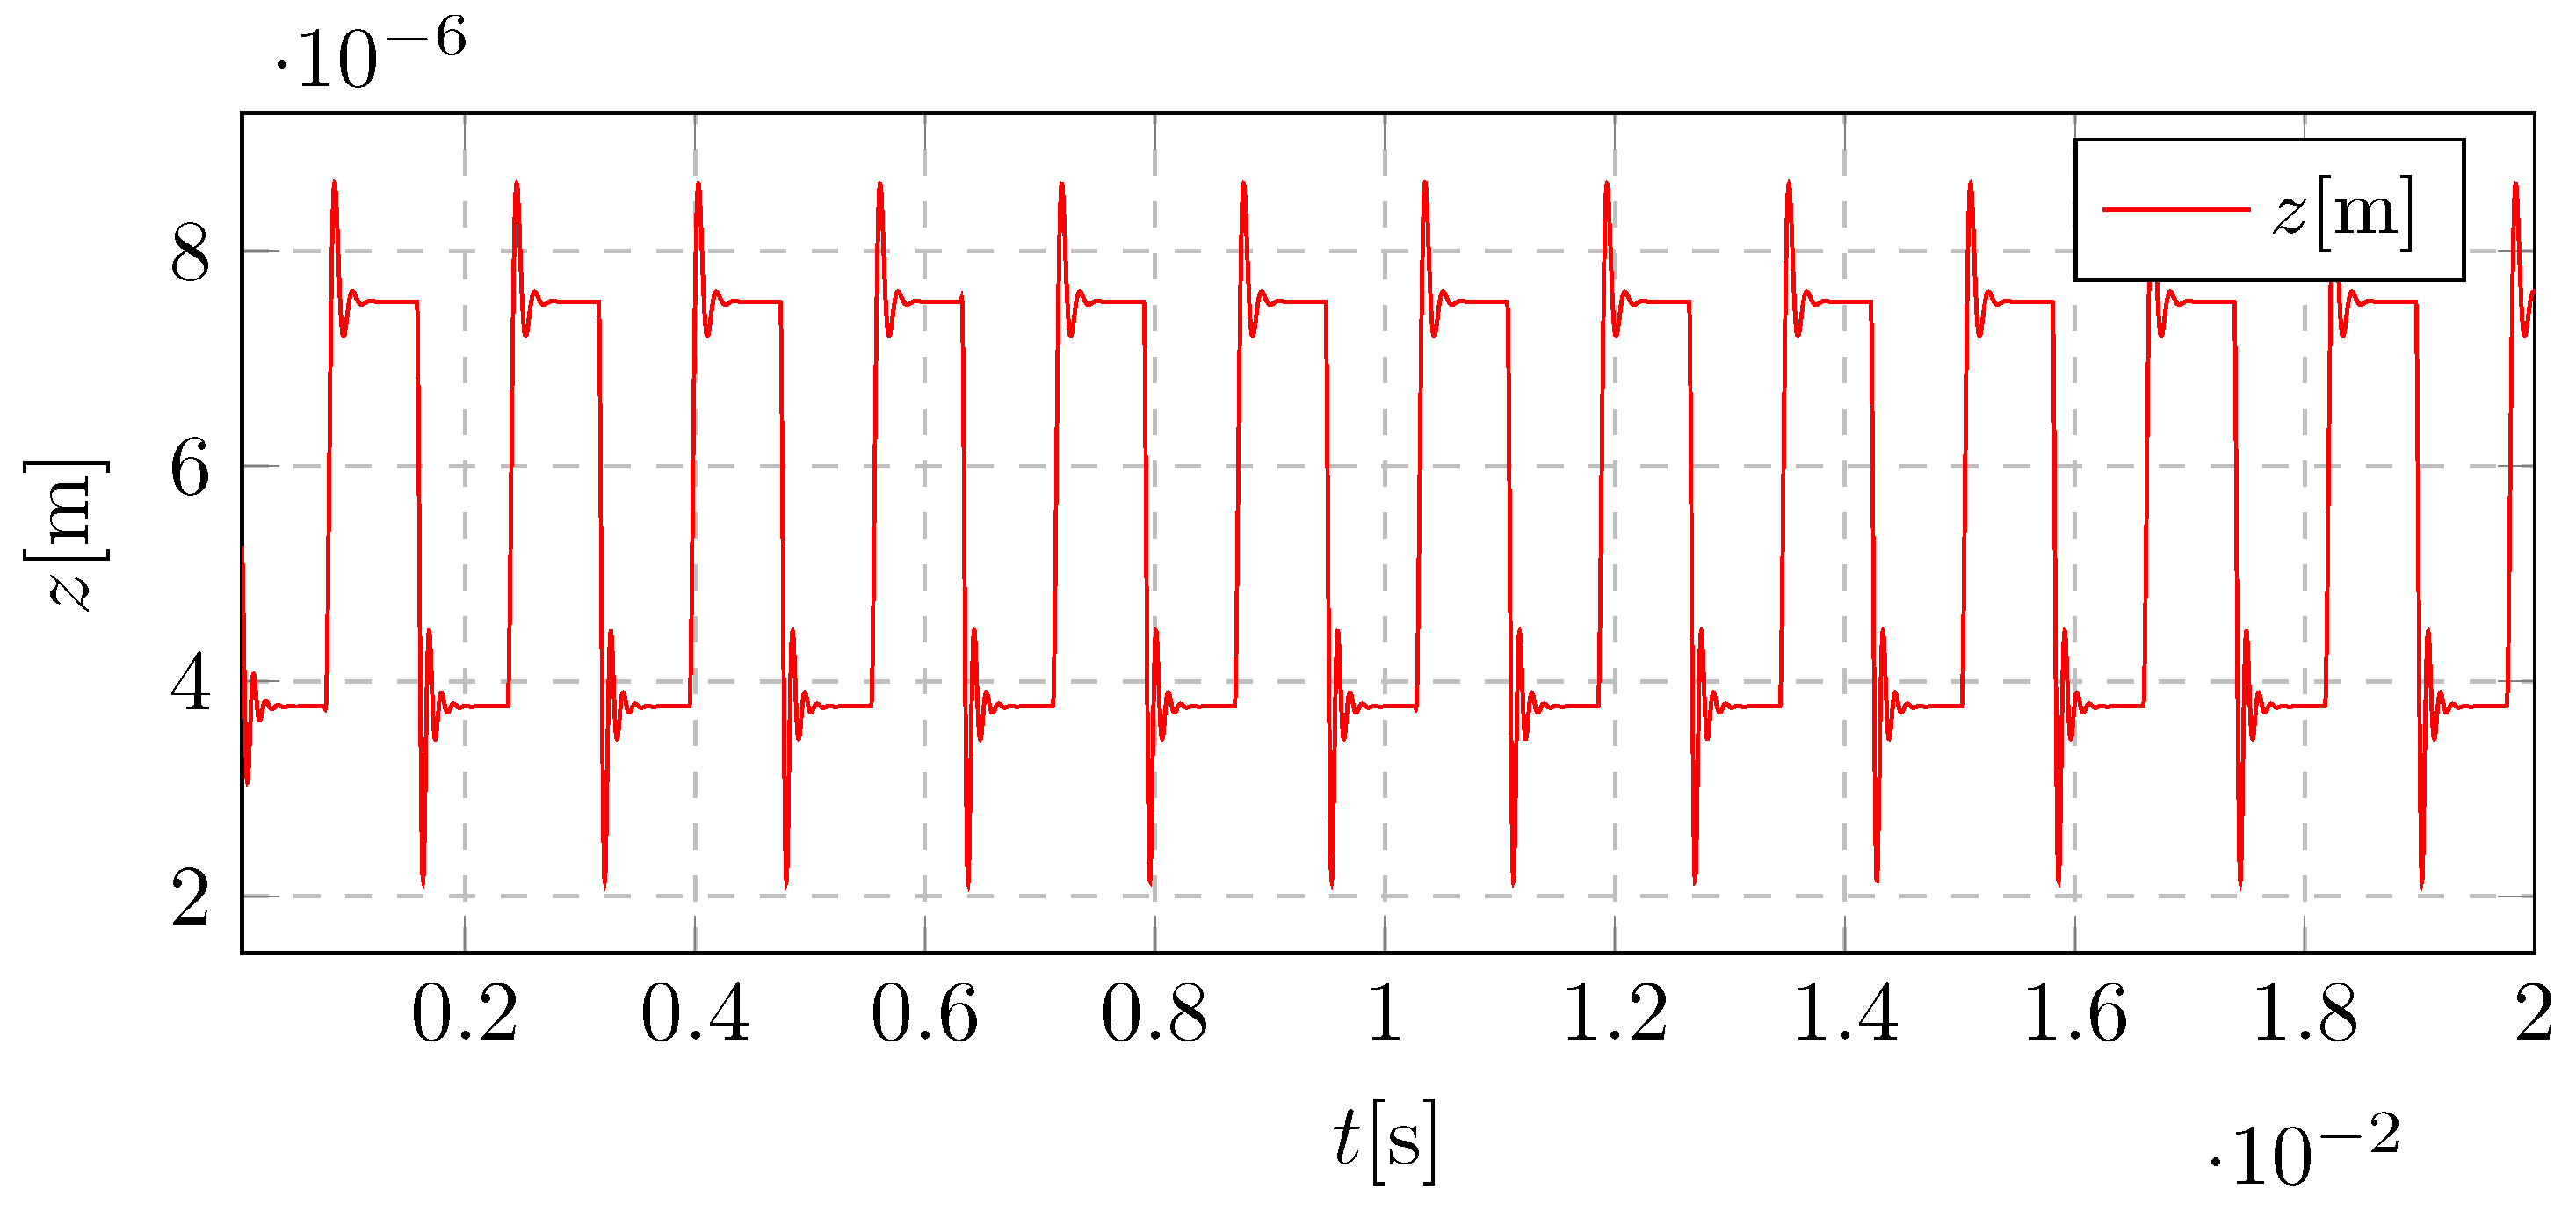
Figure 6.
Displacement of the system vibrations with time-varying mesh stiffness as a Fourier expansion signal
Figure 6.
Displacement of the system vibrations with time-varying mesh stiffness as a Fourier expansion signal
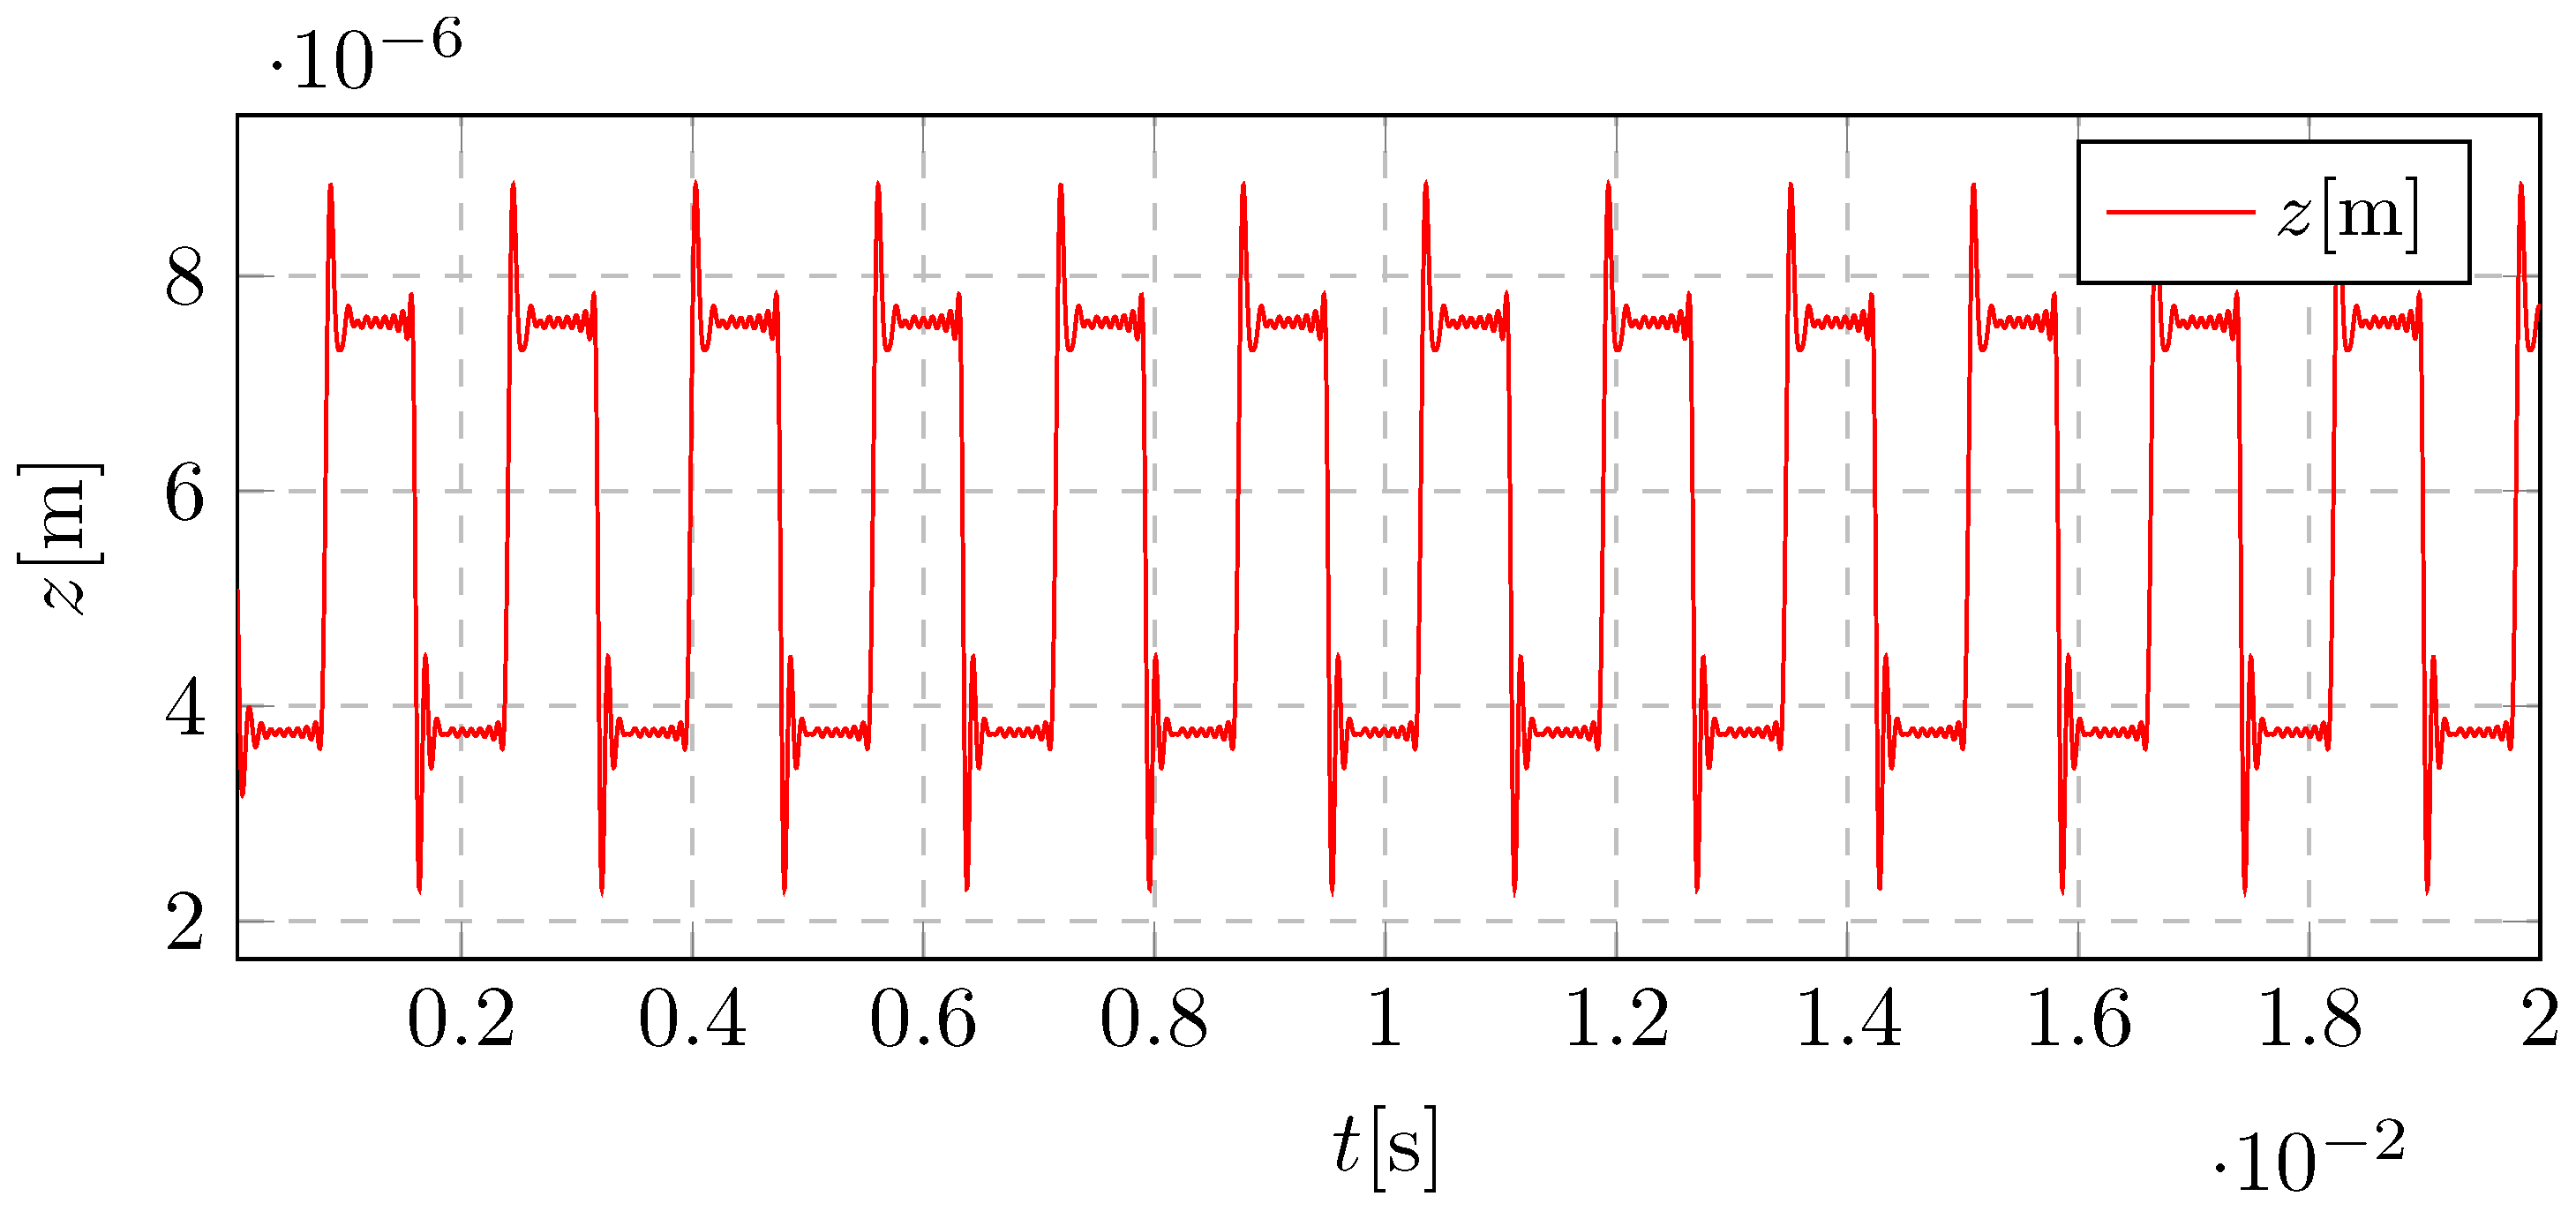
Figure 7.
Time-varying meshing force along the line-of-action
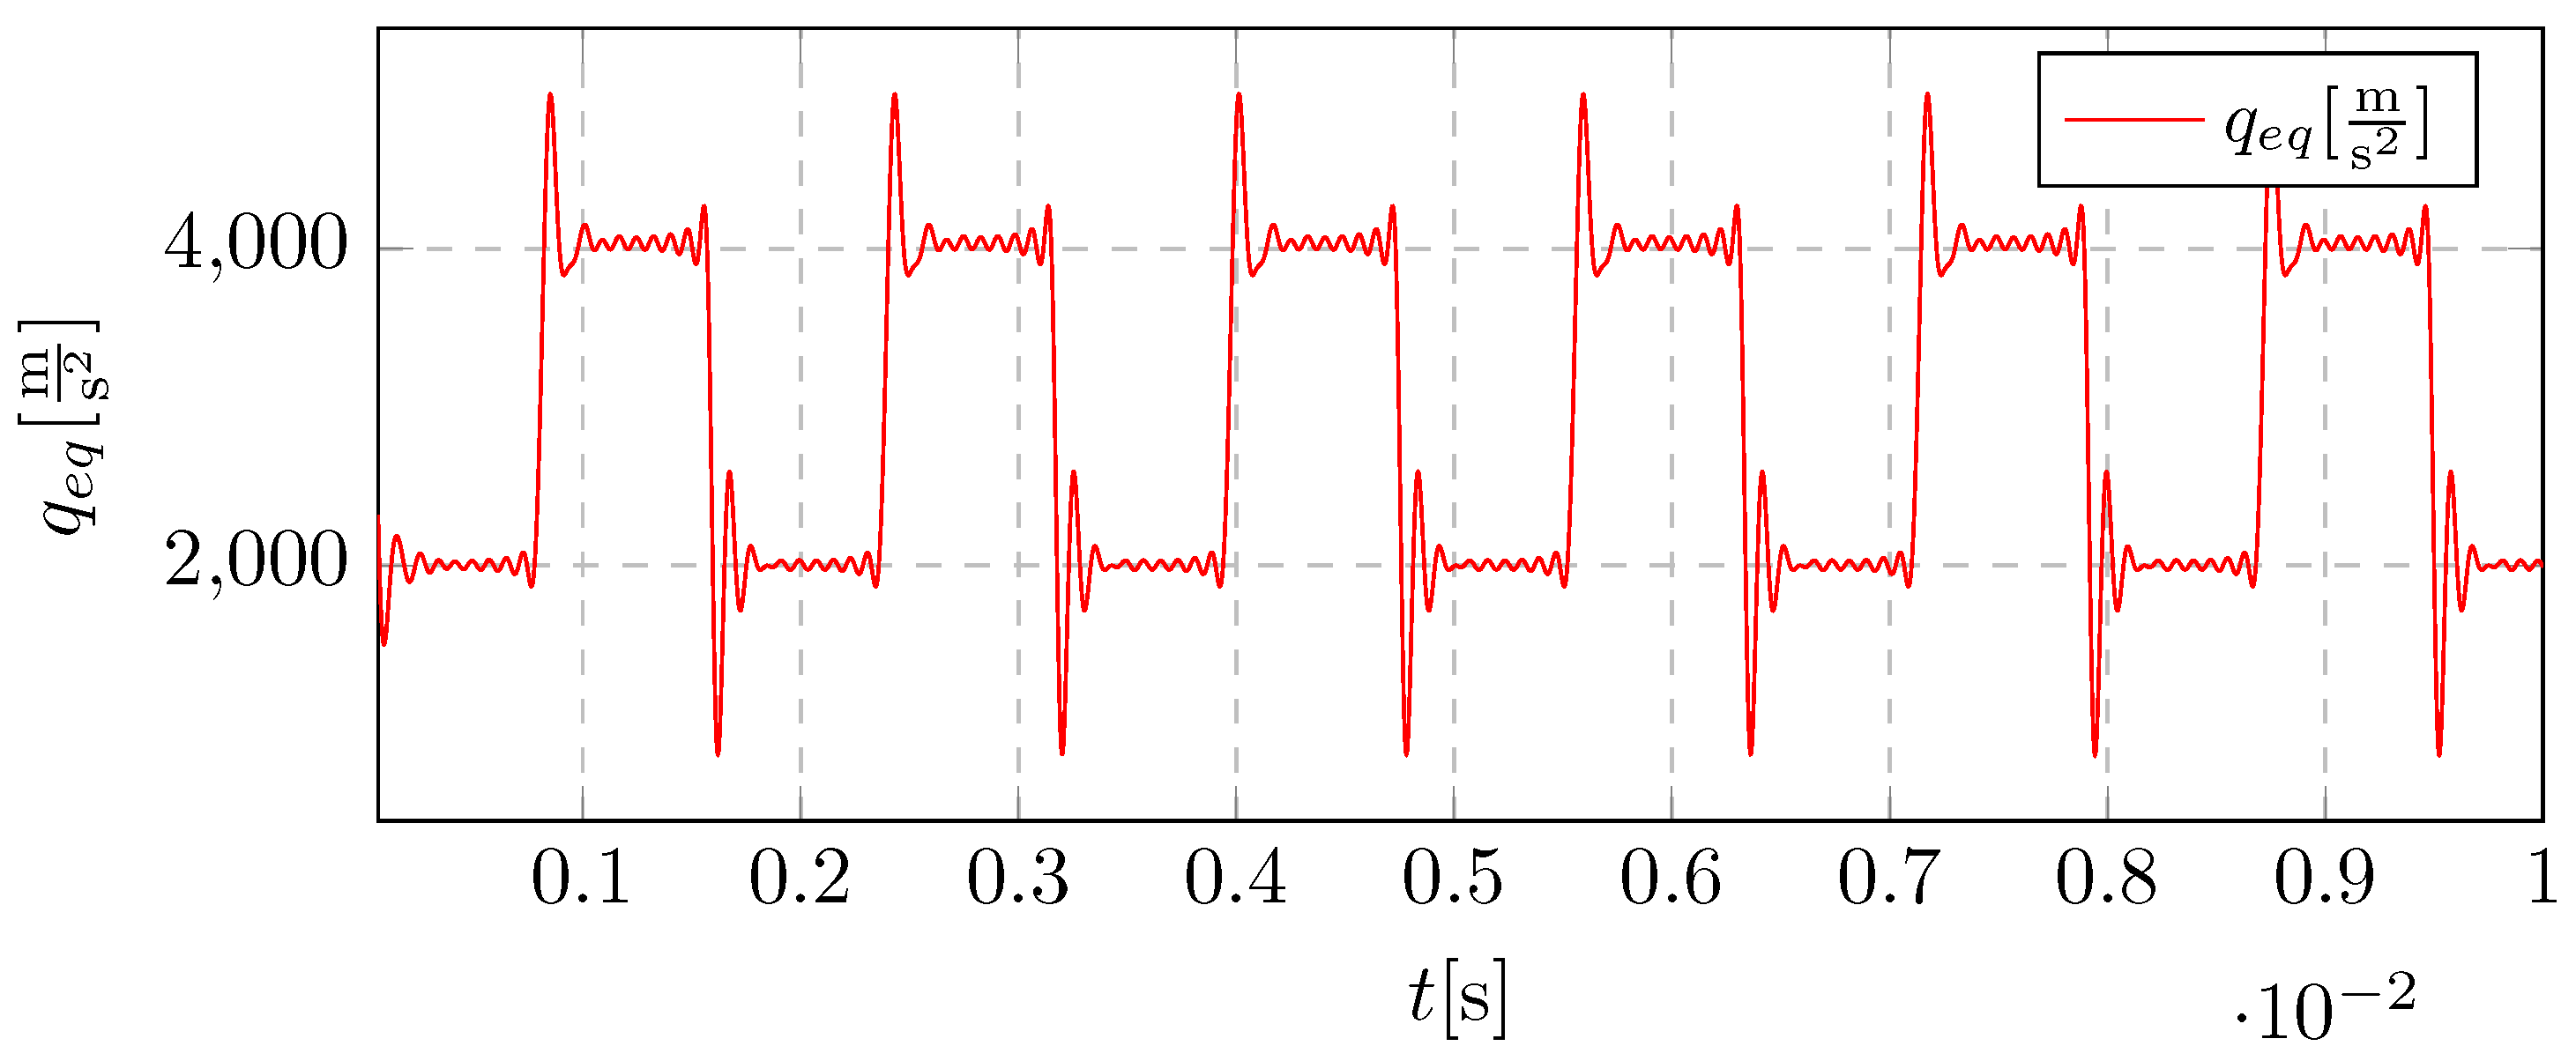
Figure 8.
Displacement of the system vibrations: time-domain signals for different mesh stiffness
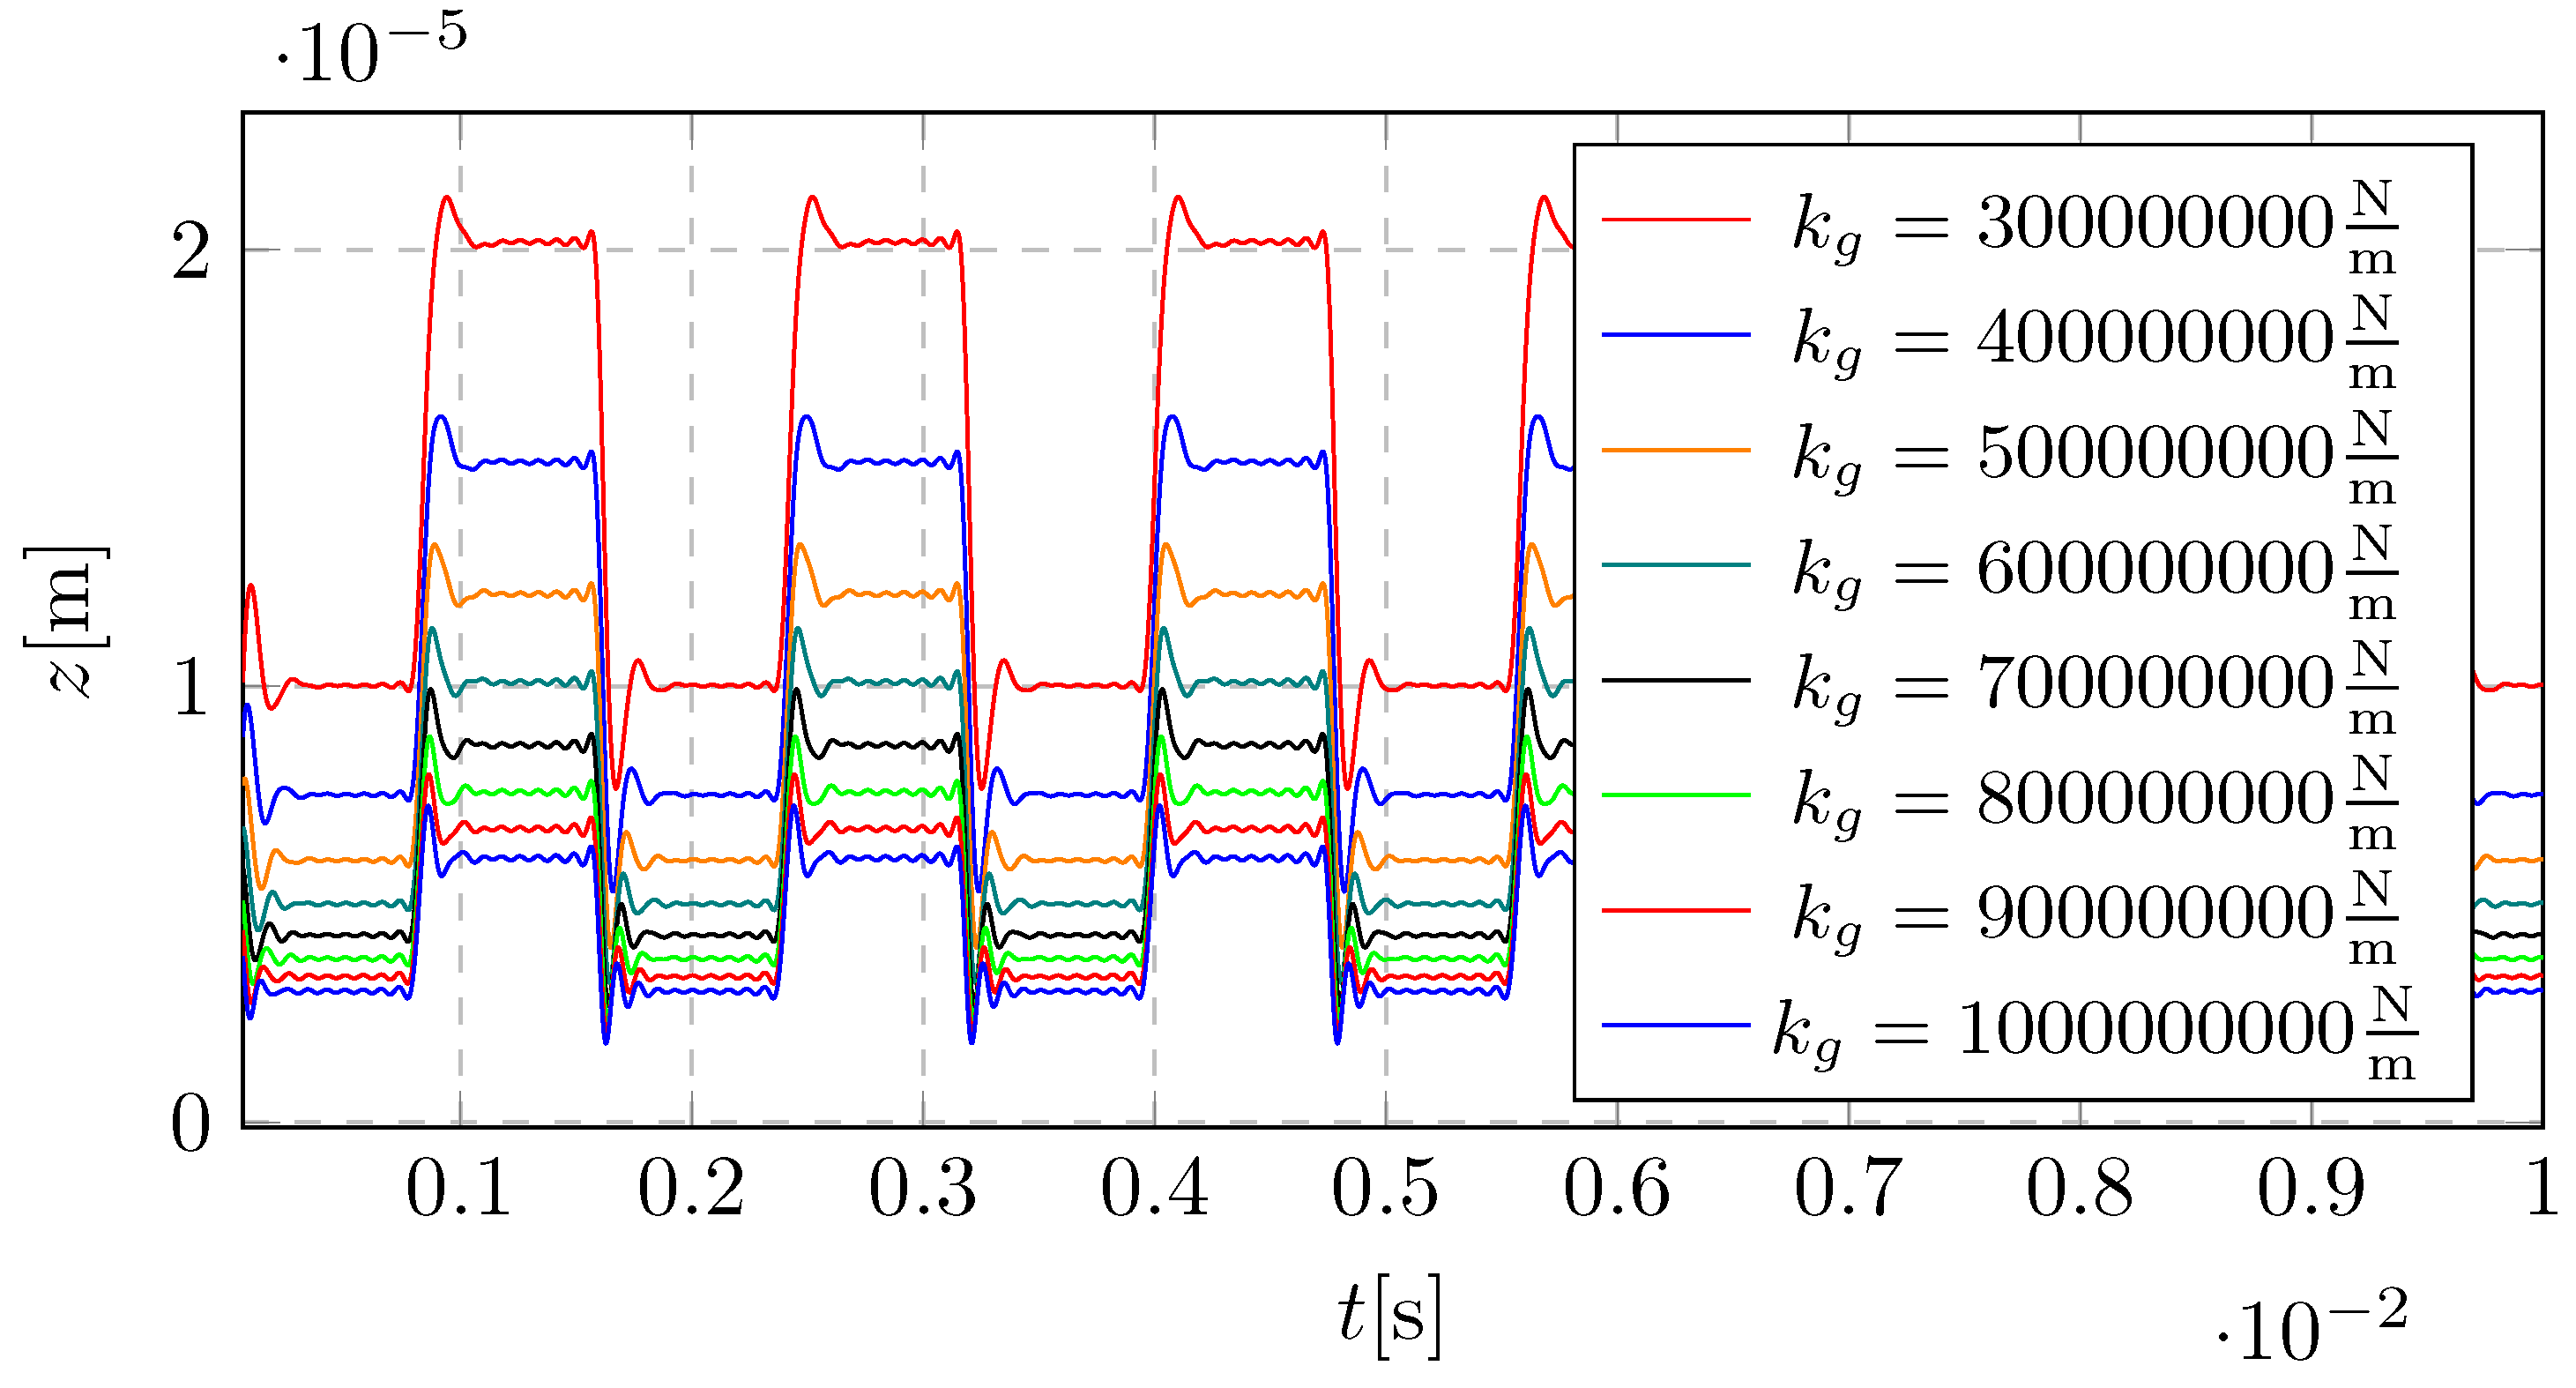
Figure 9.
Velocity of the system vibrations: time-domain signals for different mesh stiffness
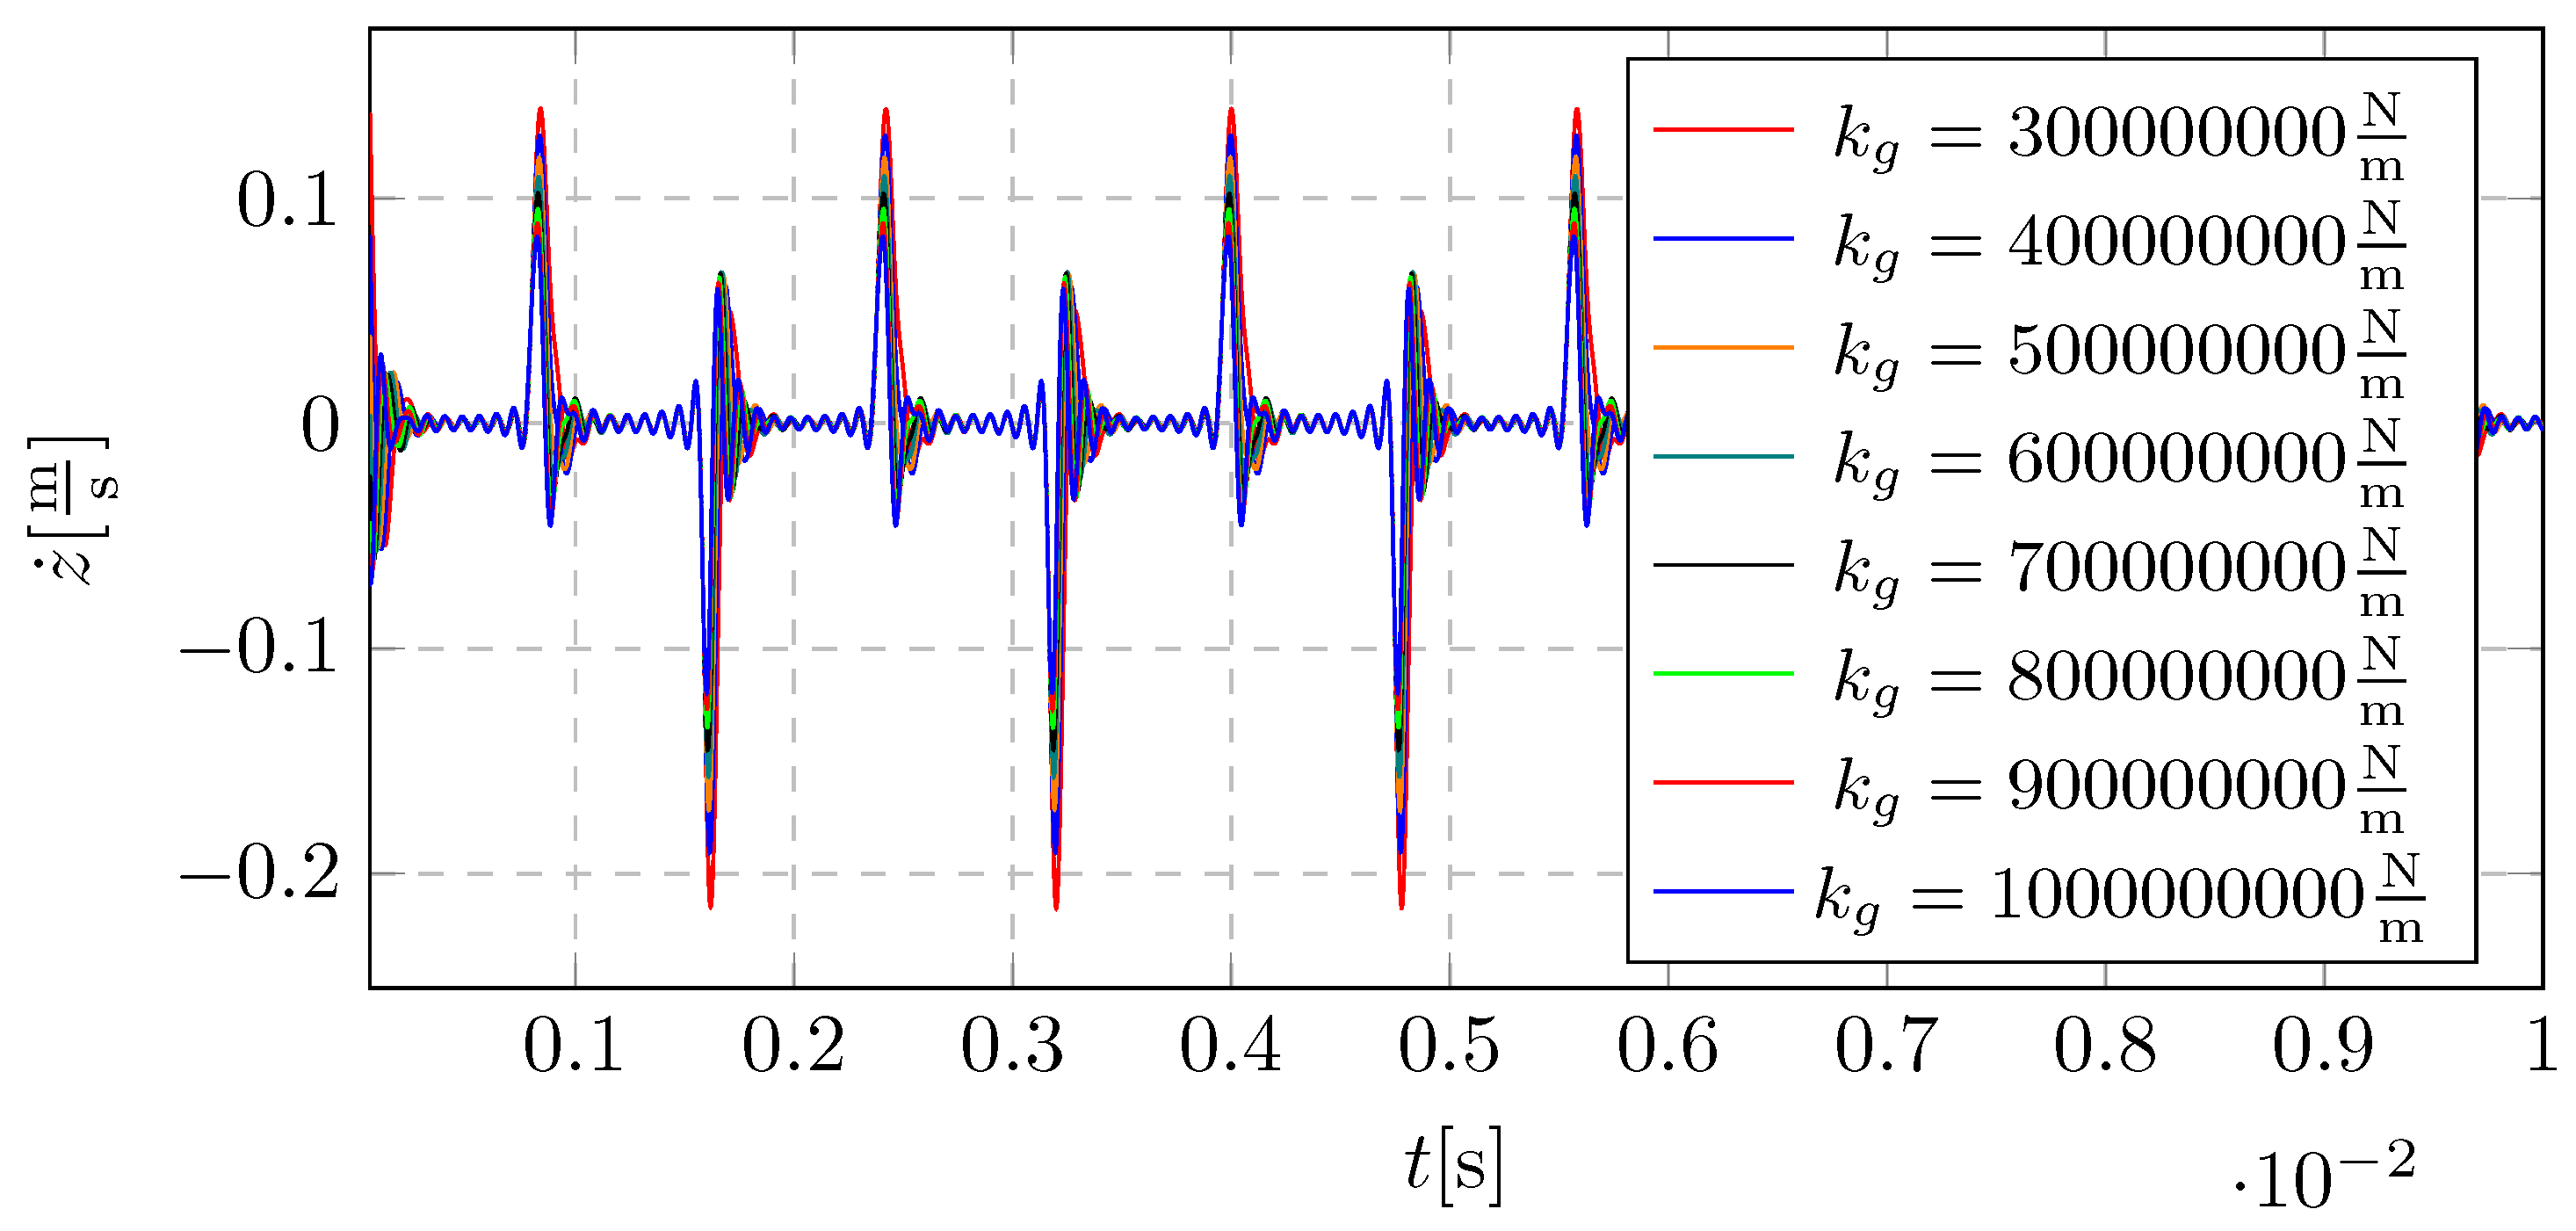
Figure 10.
Acceleration of the system vibrations: time-domain signals for different mesh stiffness
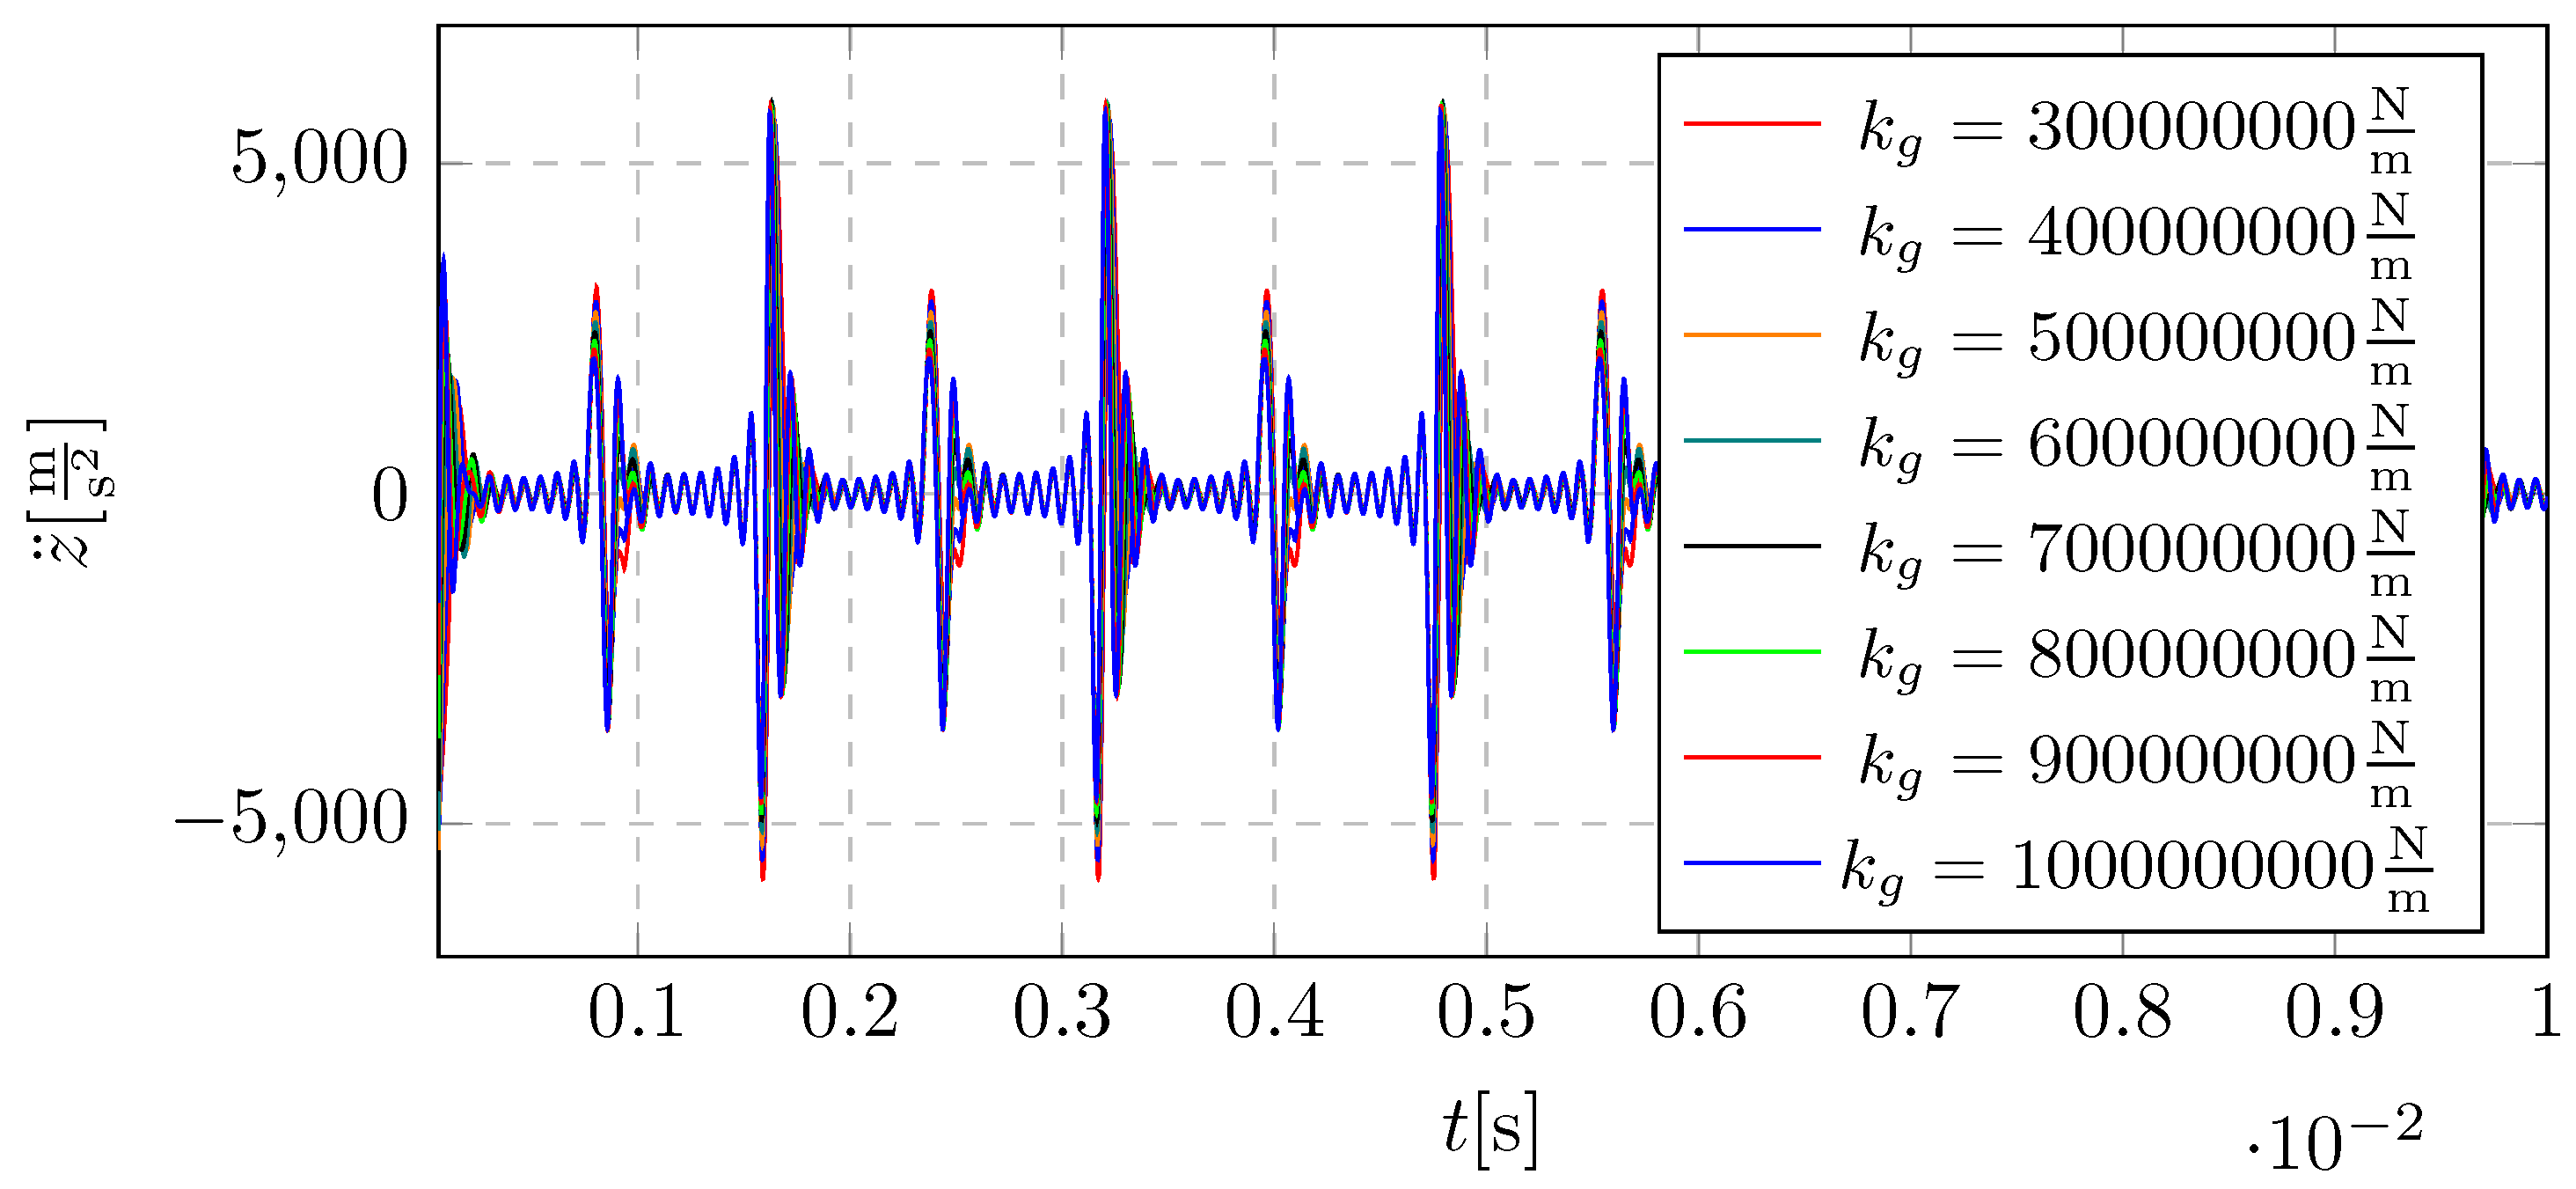
Figure 11.
Displacement of the system vibrations for different mesh stiffness values: narrowing the time-domain (qualitative zoom of the signals in Figure 8)
Figure 11.
Displacement of the system vibrations for different mesh stiffness values: narrowing the time-domain (qualitative zoom of the signals in Figure 8)
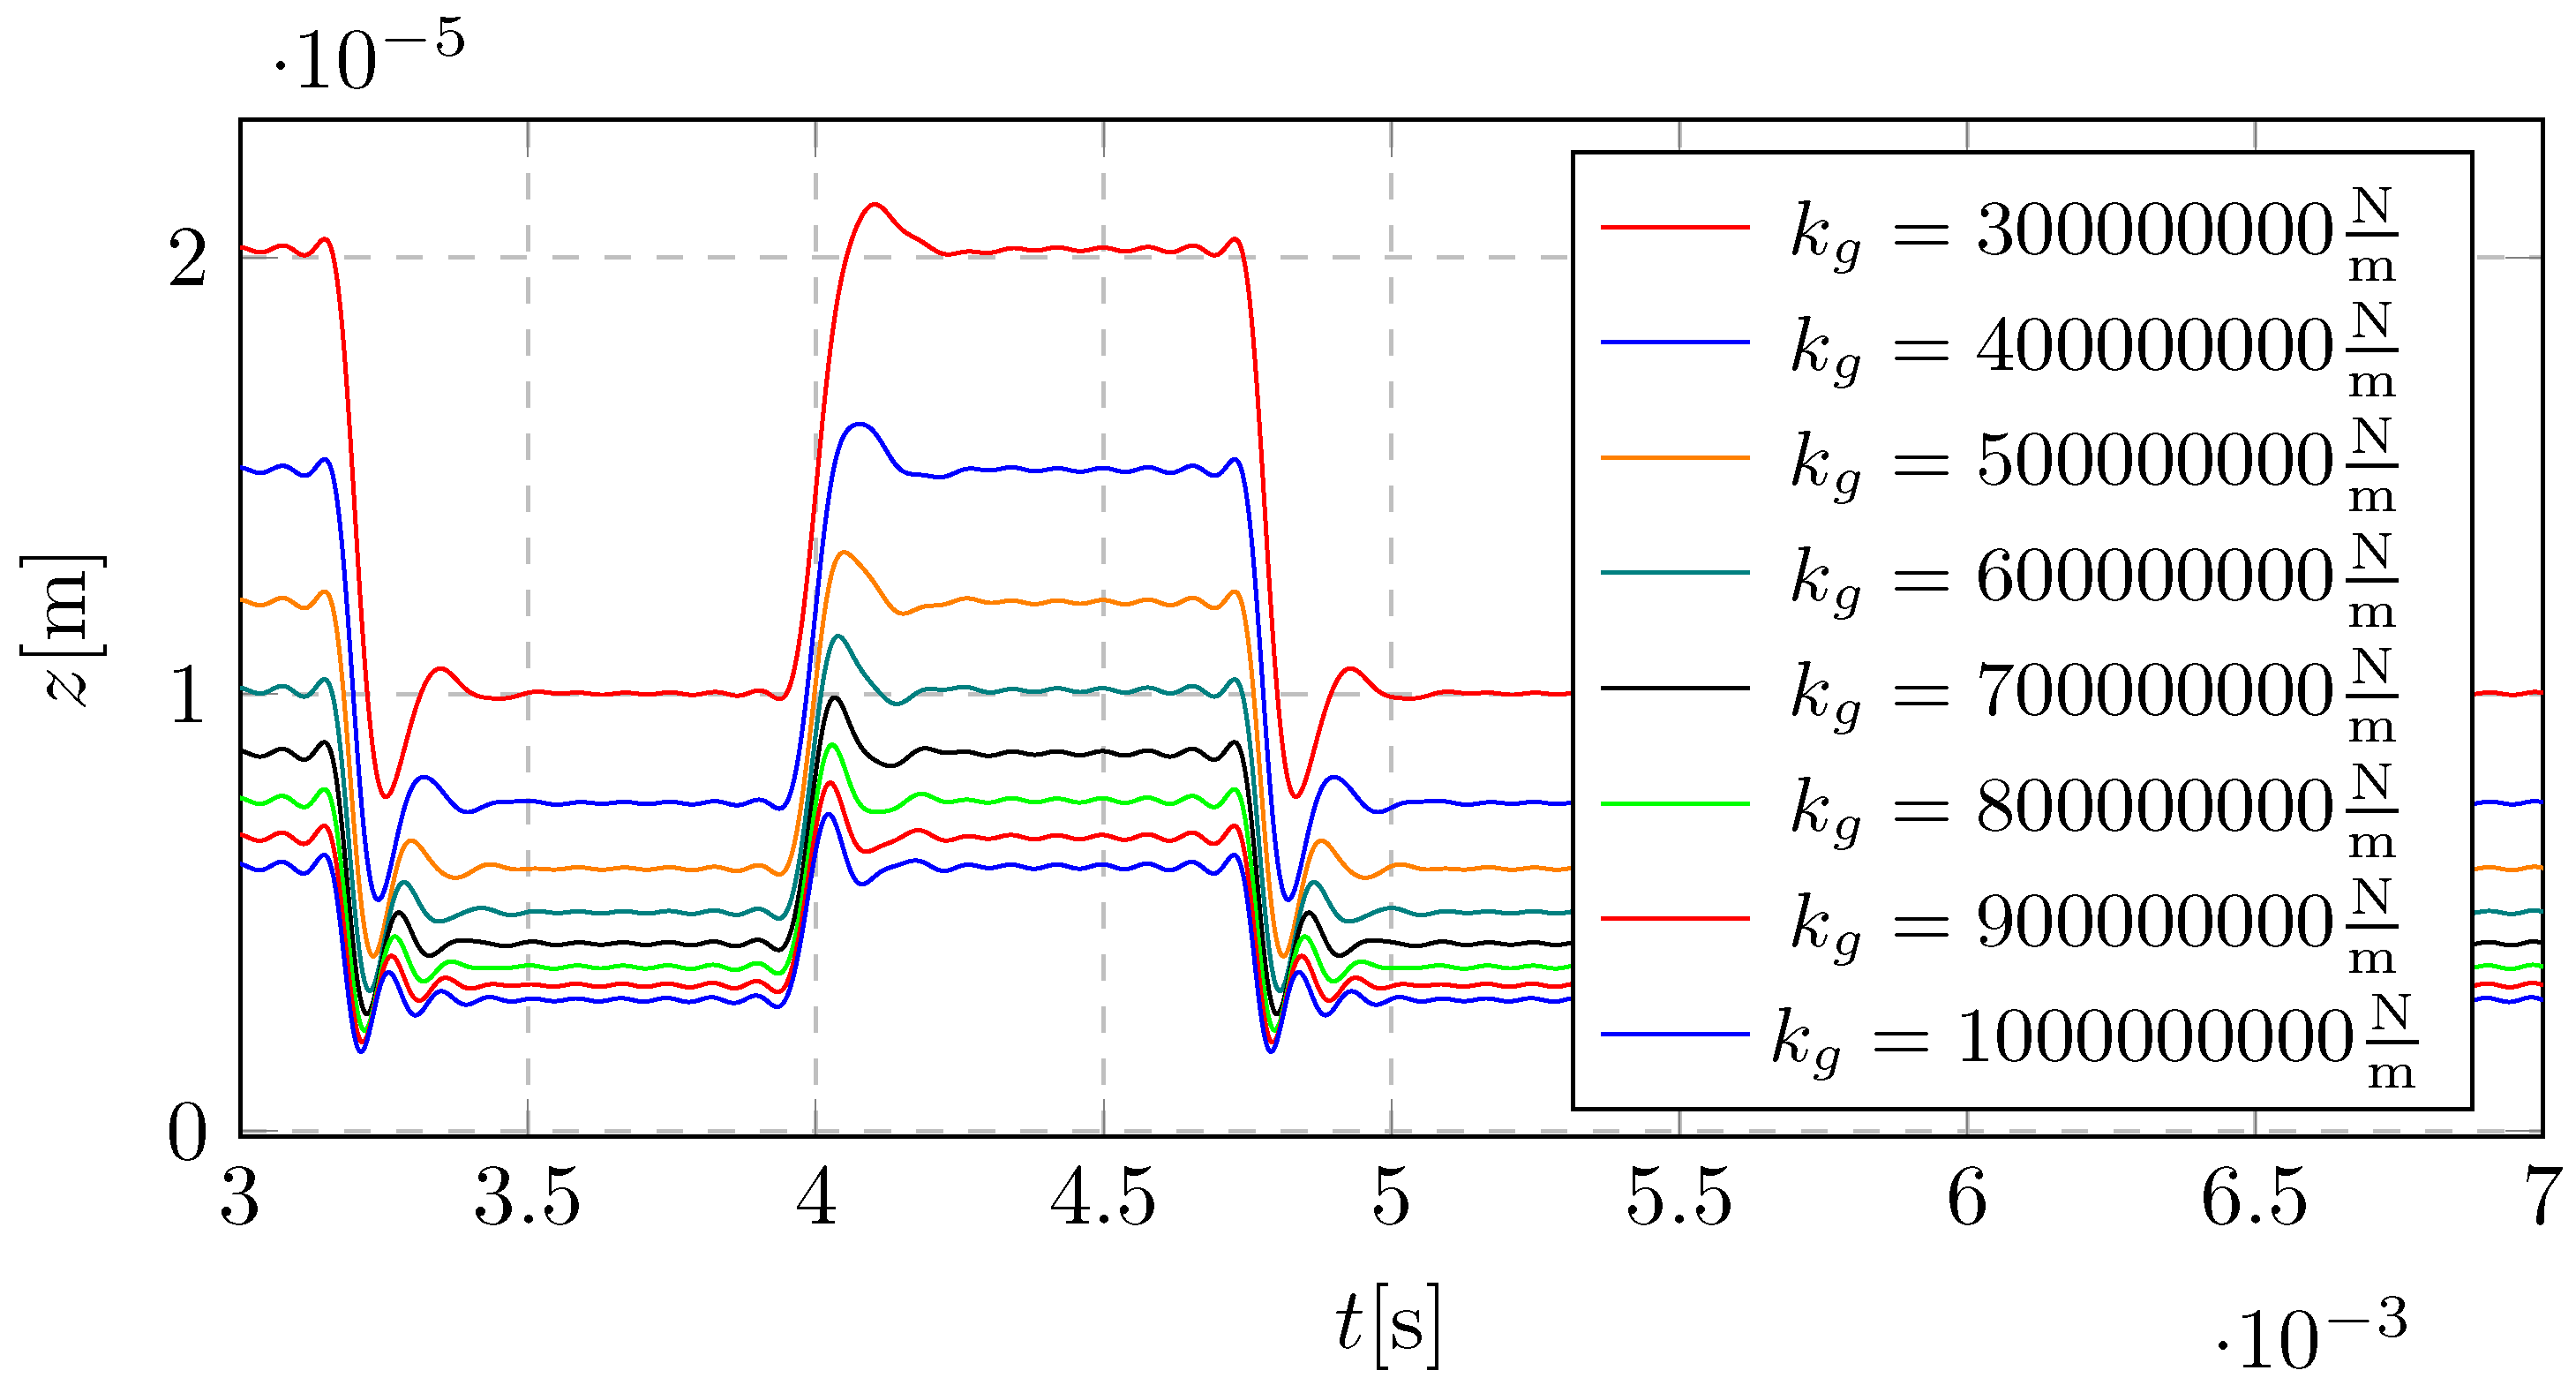
Figure 12.
Velocity of the system vibrations for different mesh stiffness: narrowing the time-domain (qualitative zoom of the signals in Figure 9)
Figure 12.
Velocity of the system vibrations for different mesh stiffness: narrowing the time-domain (qualitative zoom of the signals in Figure 9)
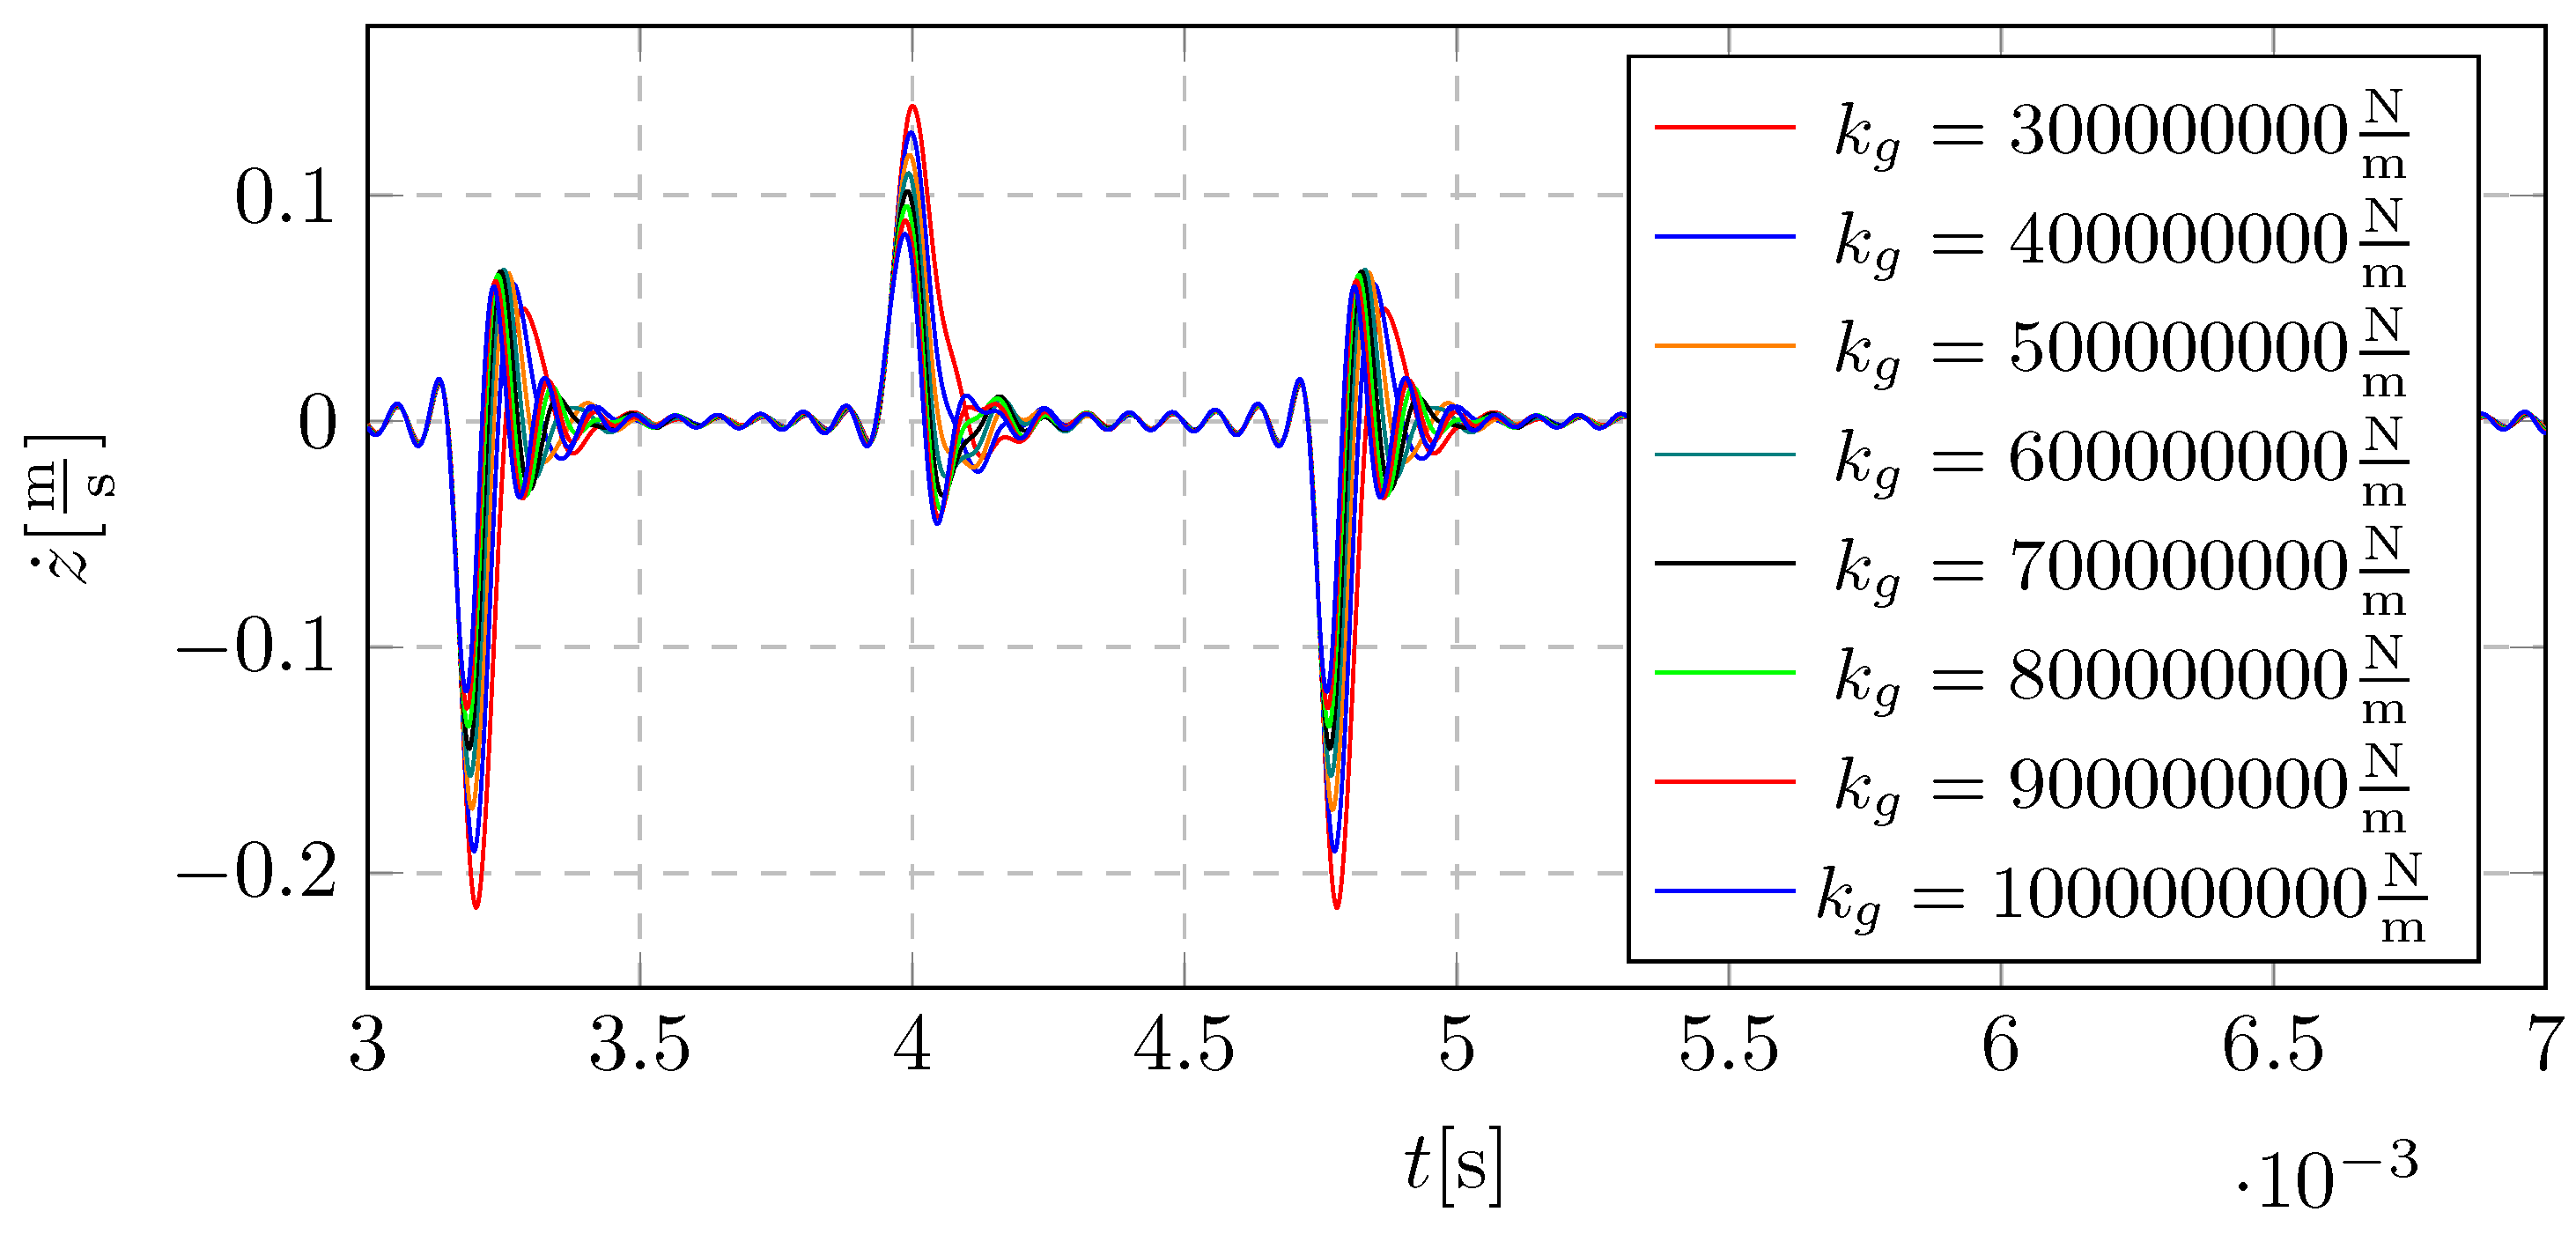
Figure 13.
Acceleration of the system vibrations for different mesh stiffness: narrowing the time-domain (qualitative zoom of the signals in Figure 10)
Figure 13.
Acceleration of the system vibrations for different mesh stiffness: narrowing the time-domain (qualitative zoom of the signals in Figure 10)
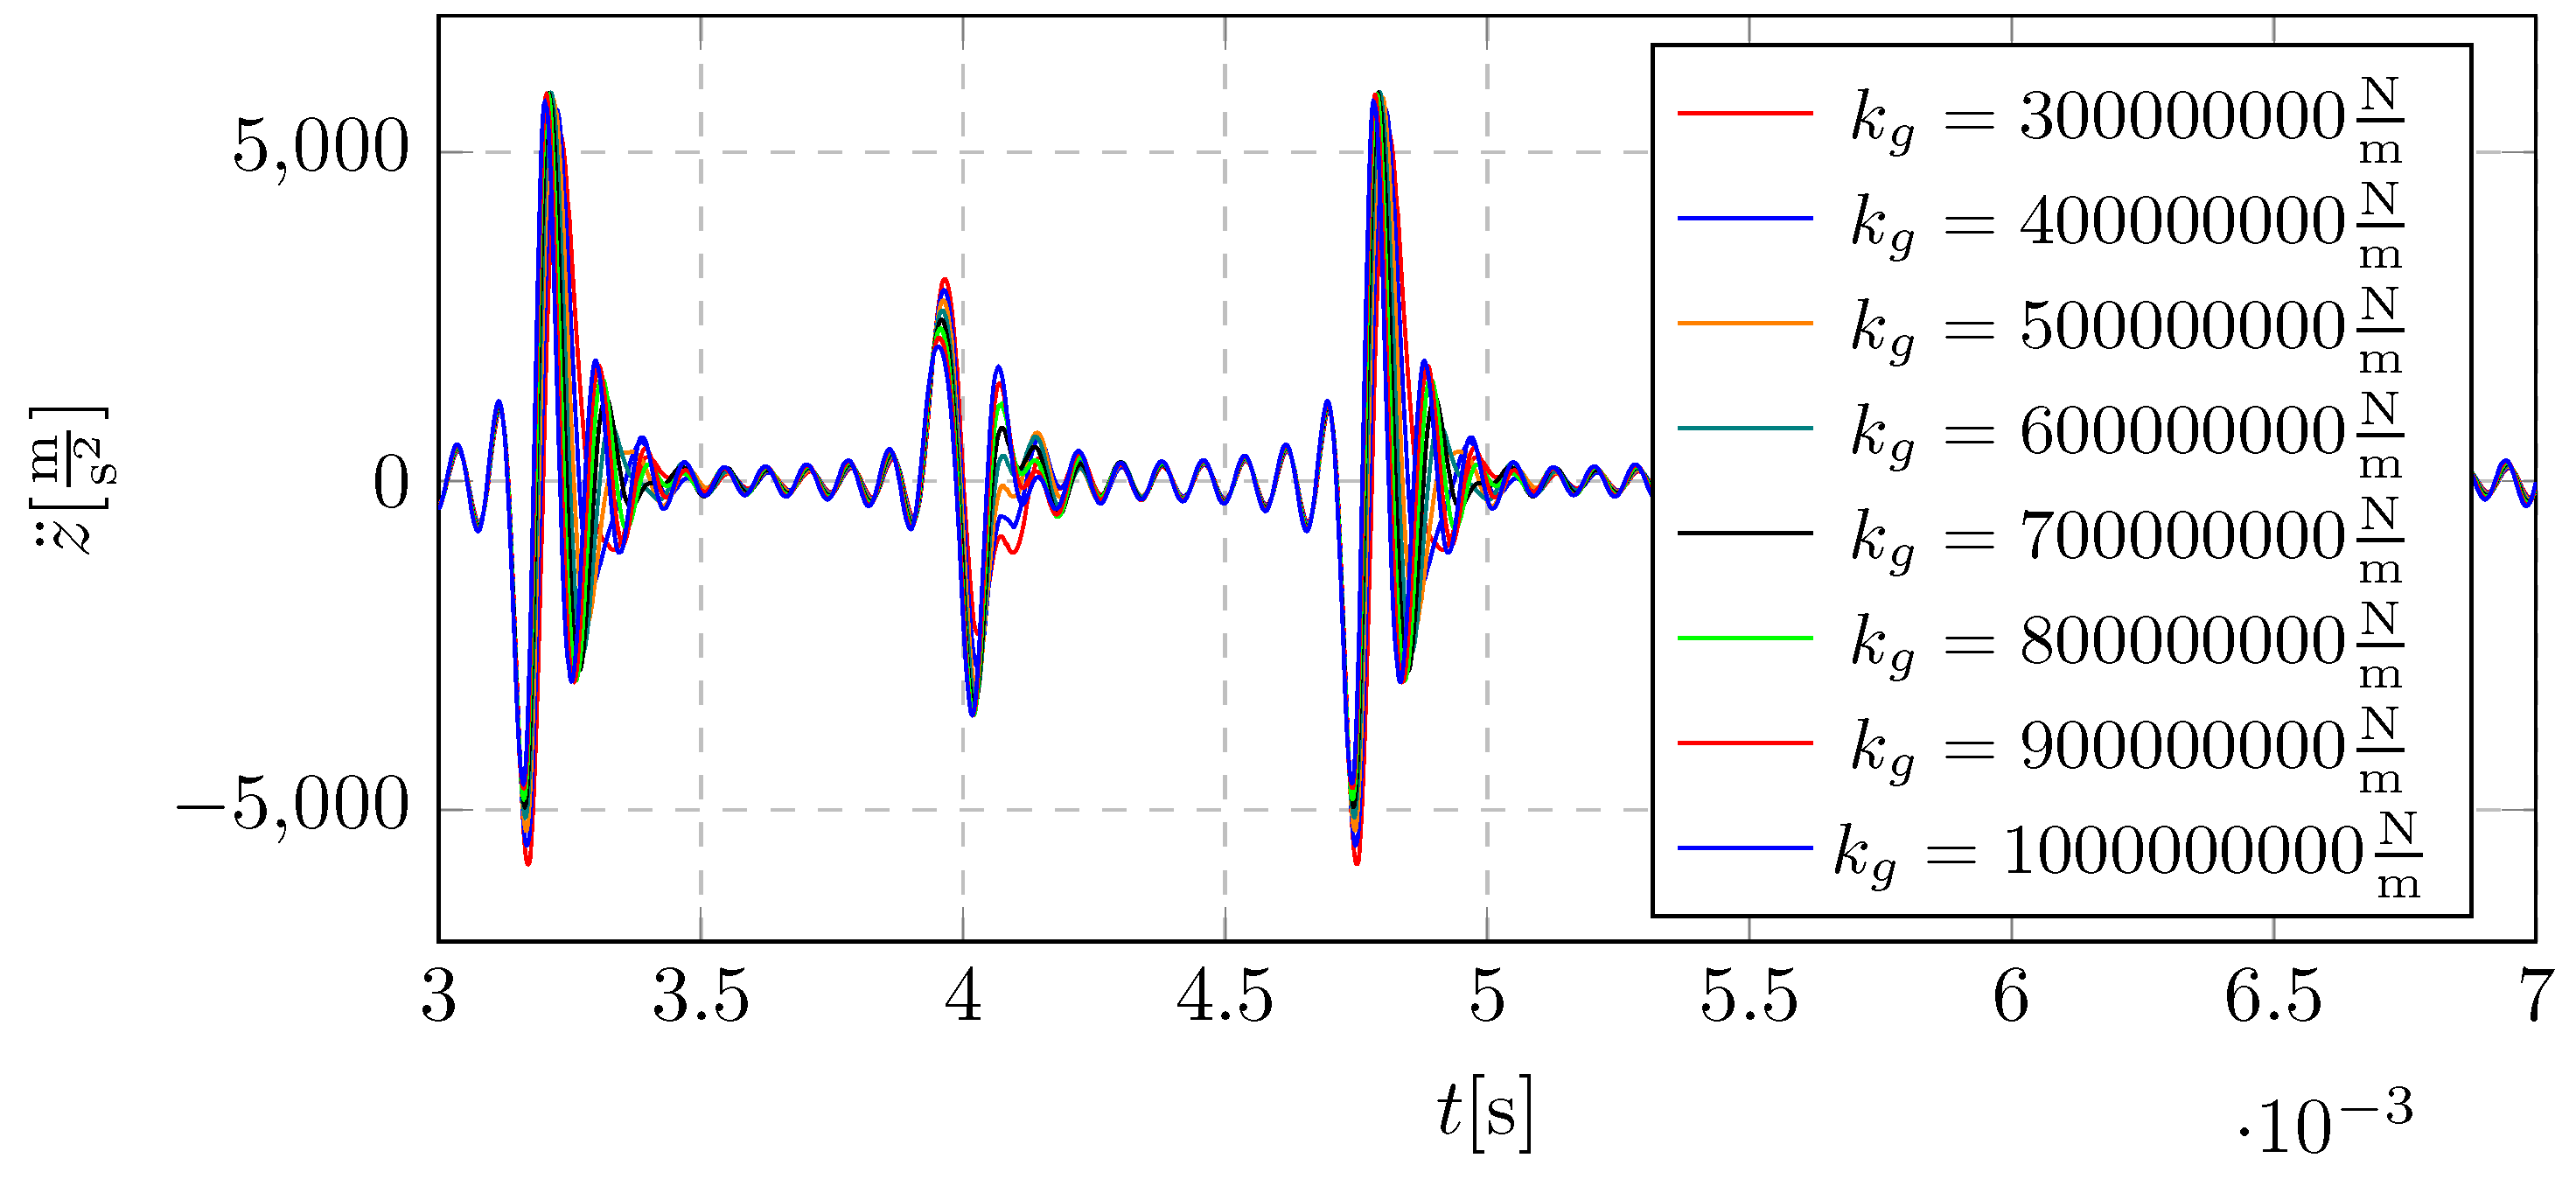
Figure 14.
Acceleration of the system vibrations for different mesh stiffness: narrowing the time-domain (qualitative zoom of the signals in Figure 13)
Figure 14.
Acceleration of the system vibrations for different mesh stiffness: narrowing the time-domain (qualitative zoom of the signals in Figure 13)
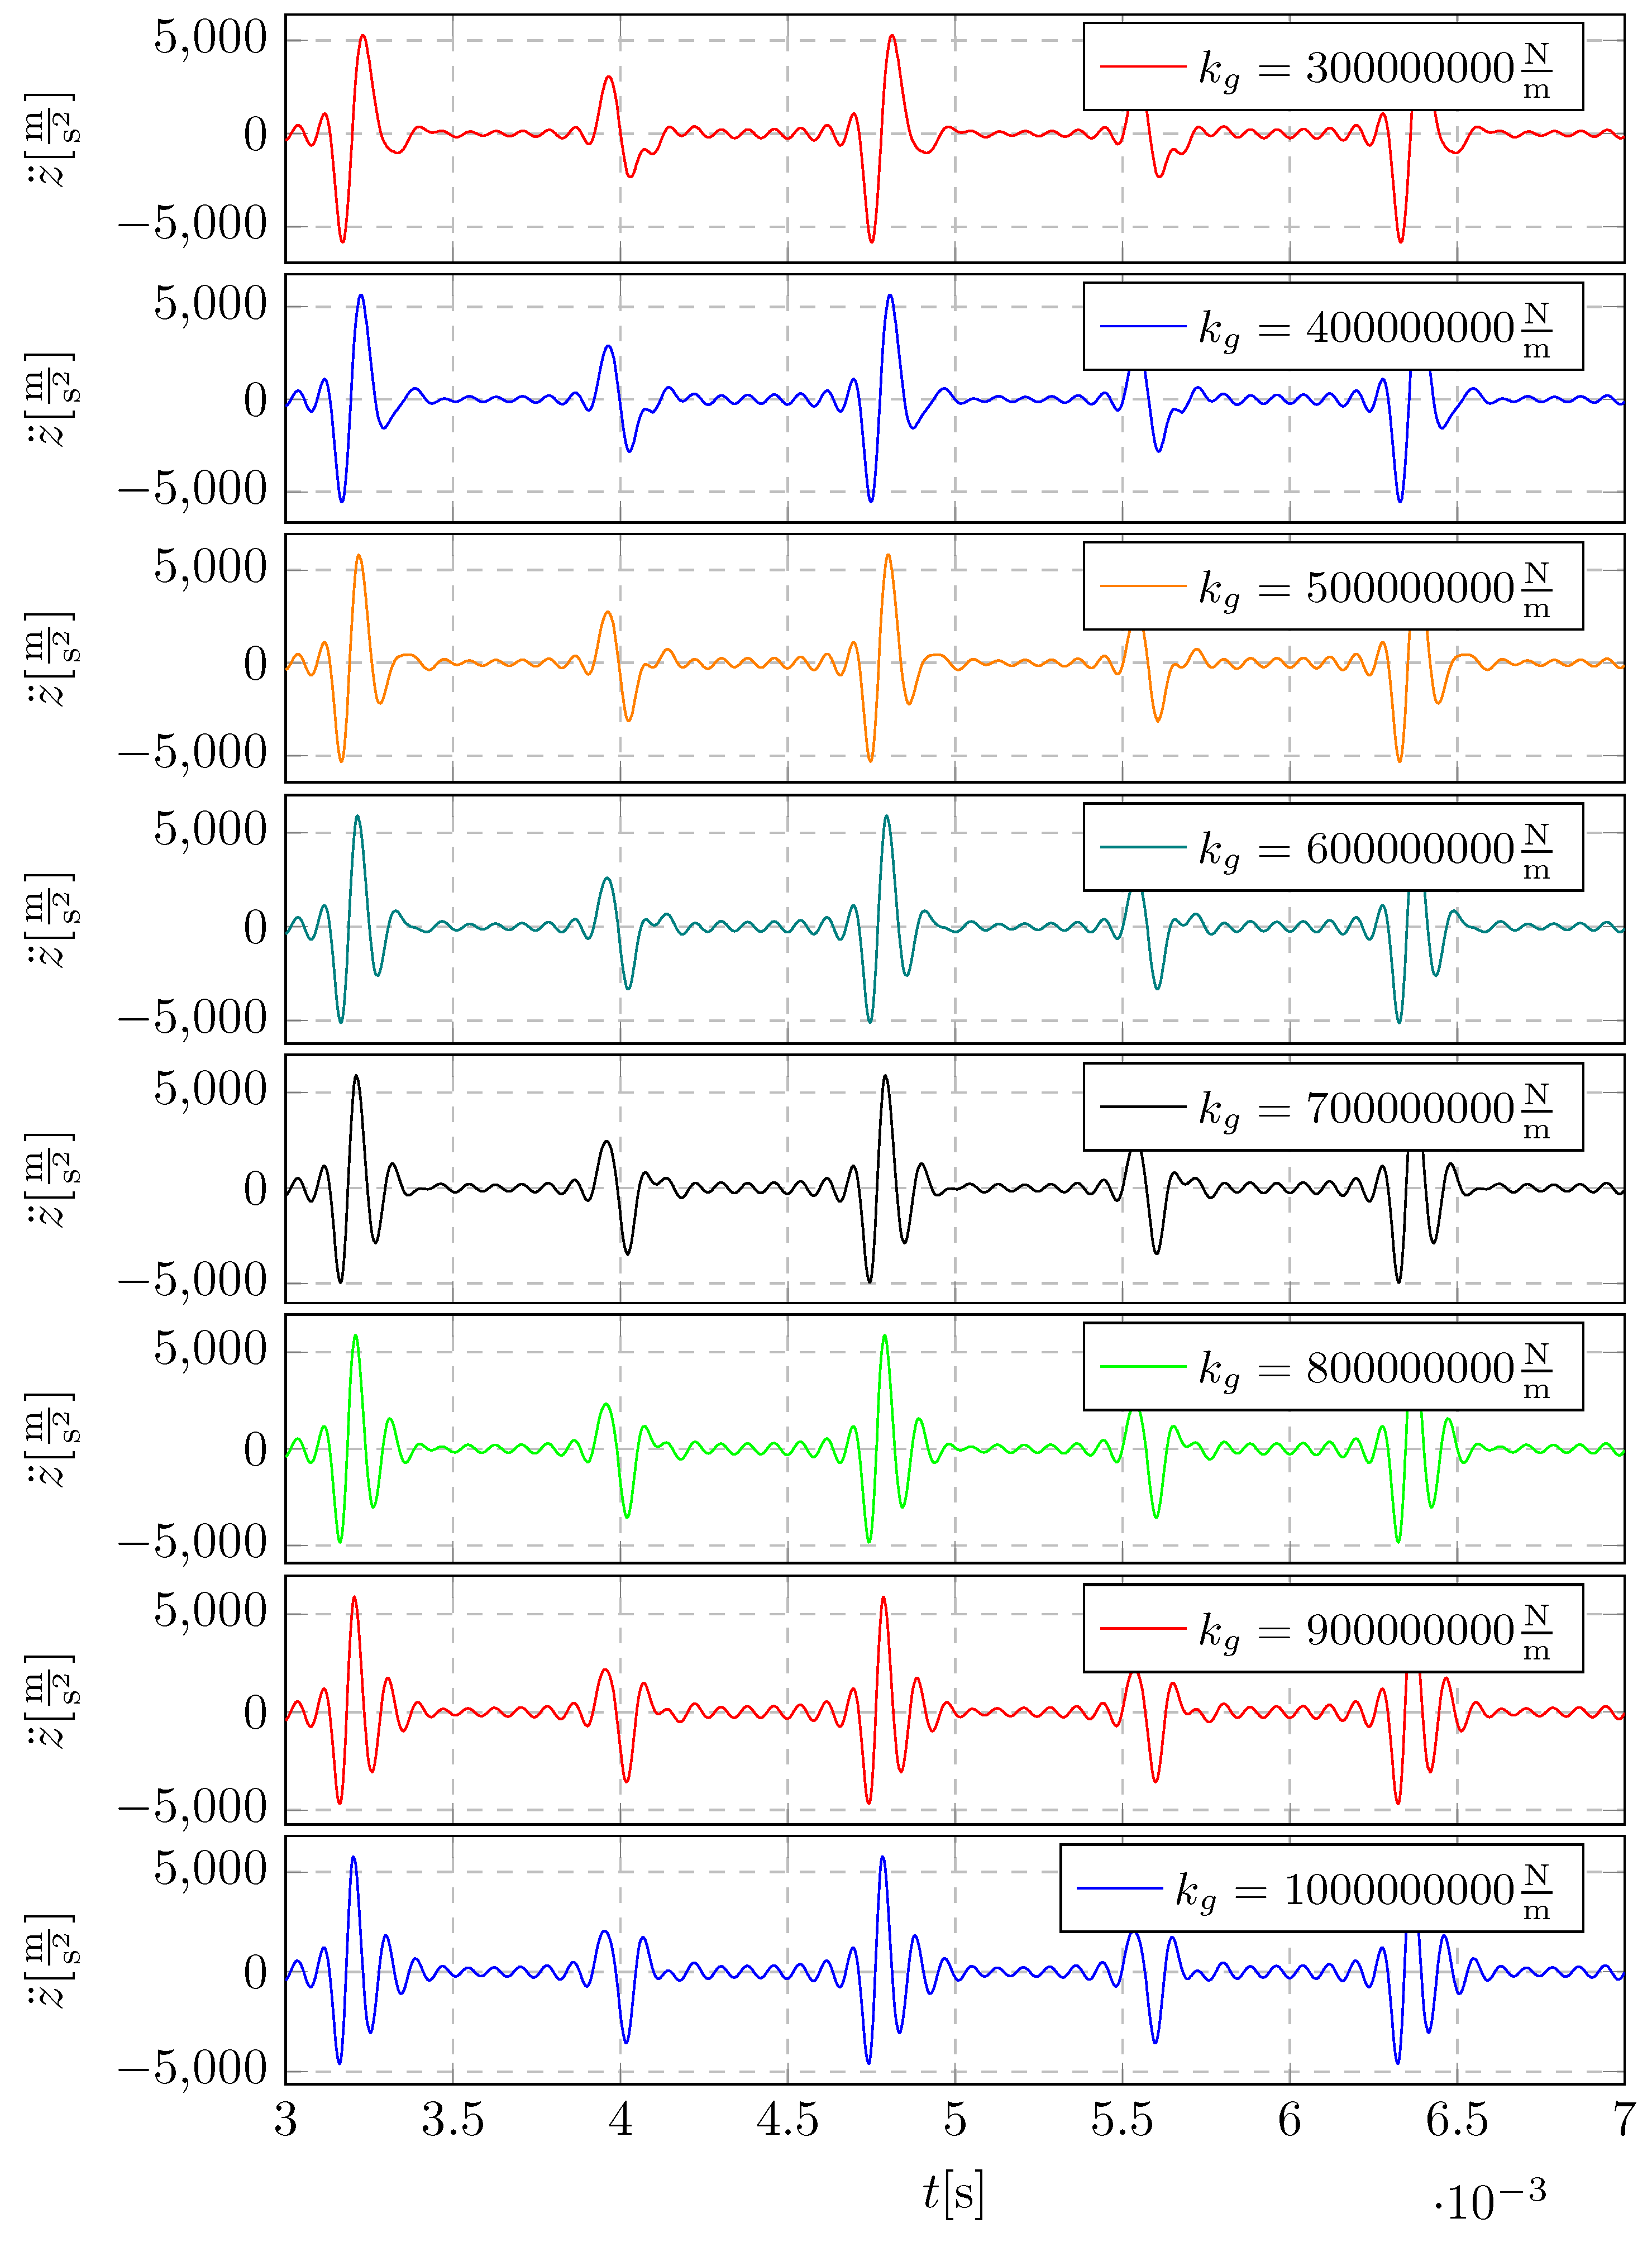
Figure 15.
Displacement of the system vibrations: frequency-domain signals for different mesh stiffness
Figure 15.
Displacement of the system vibrations: frequency-domain signals for different mesh stiffness
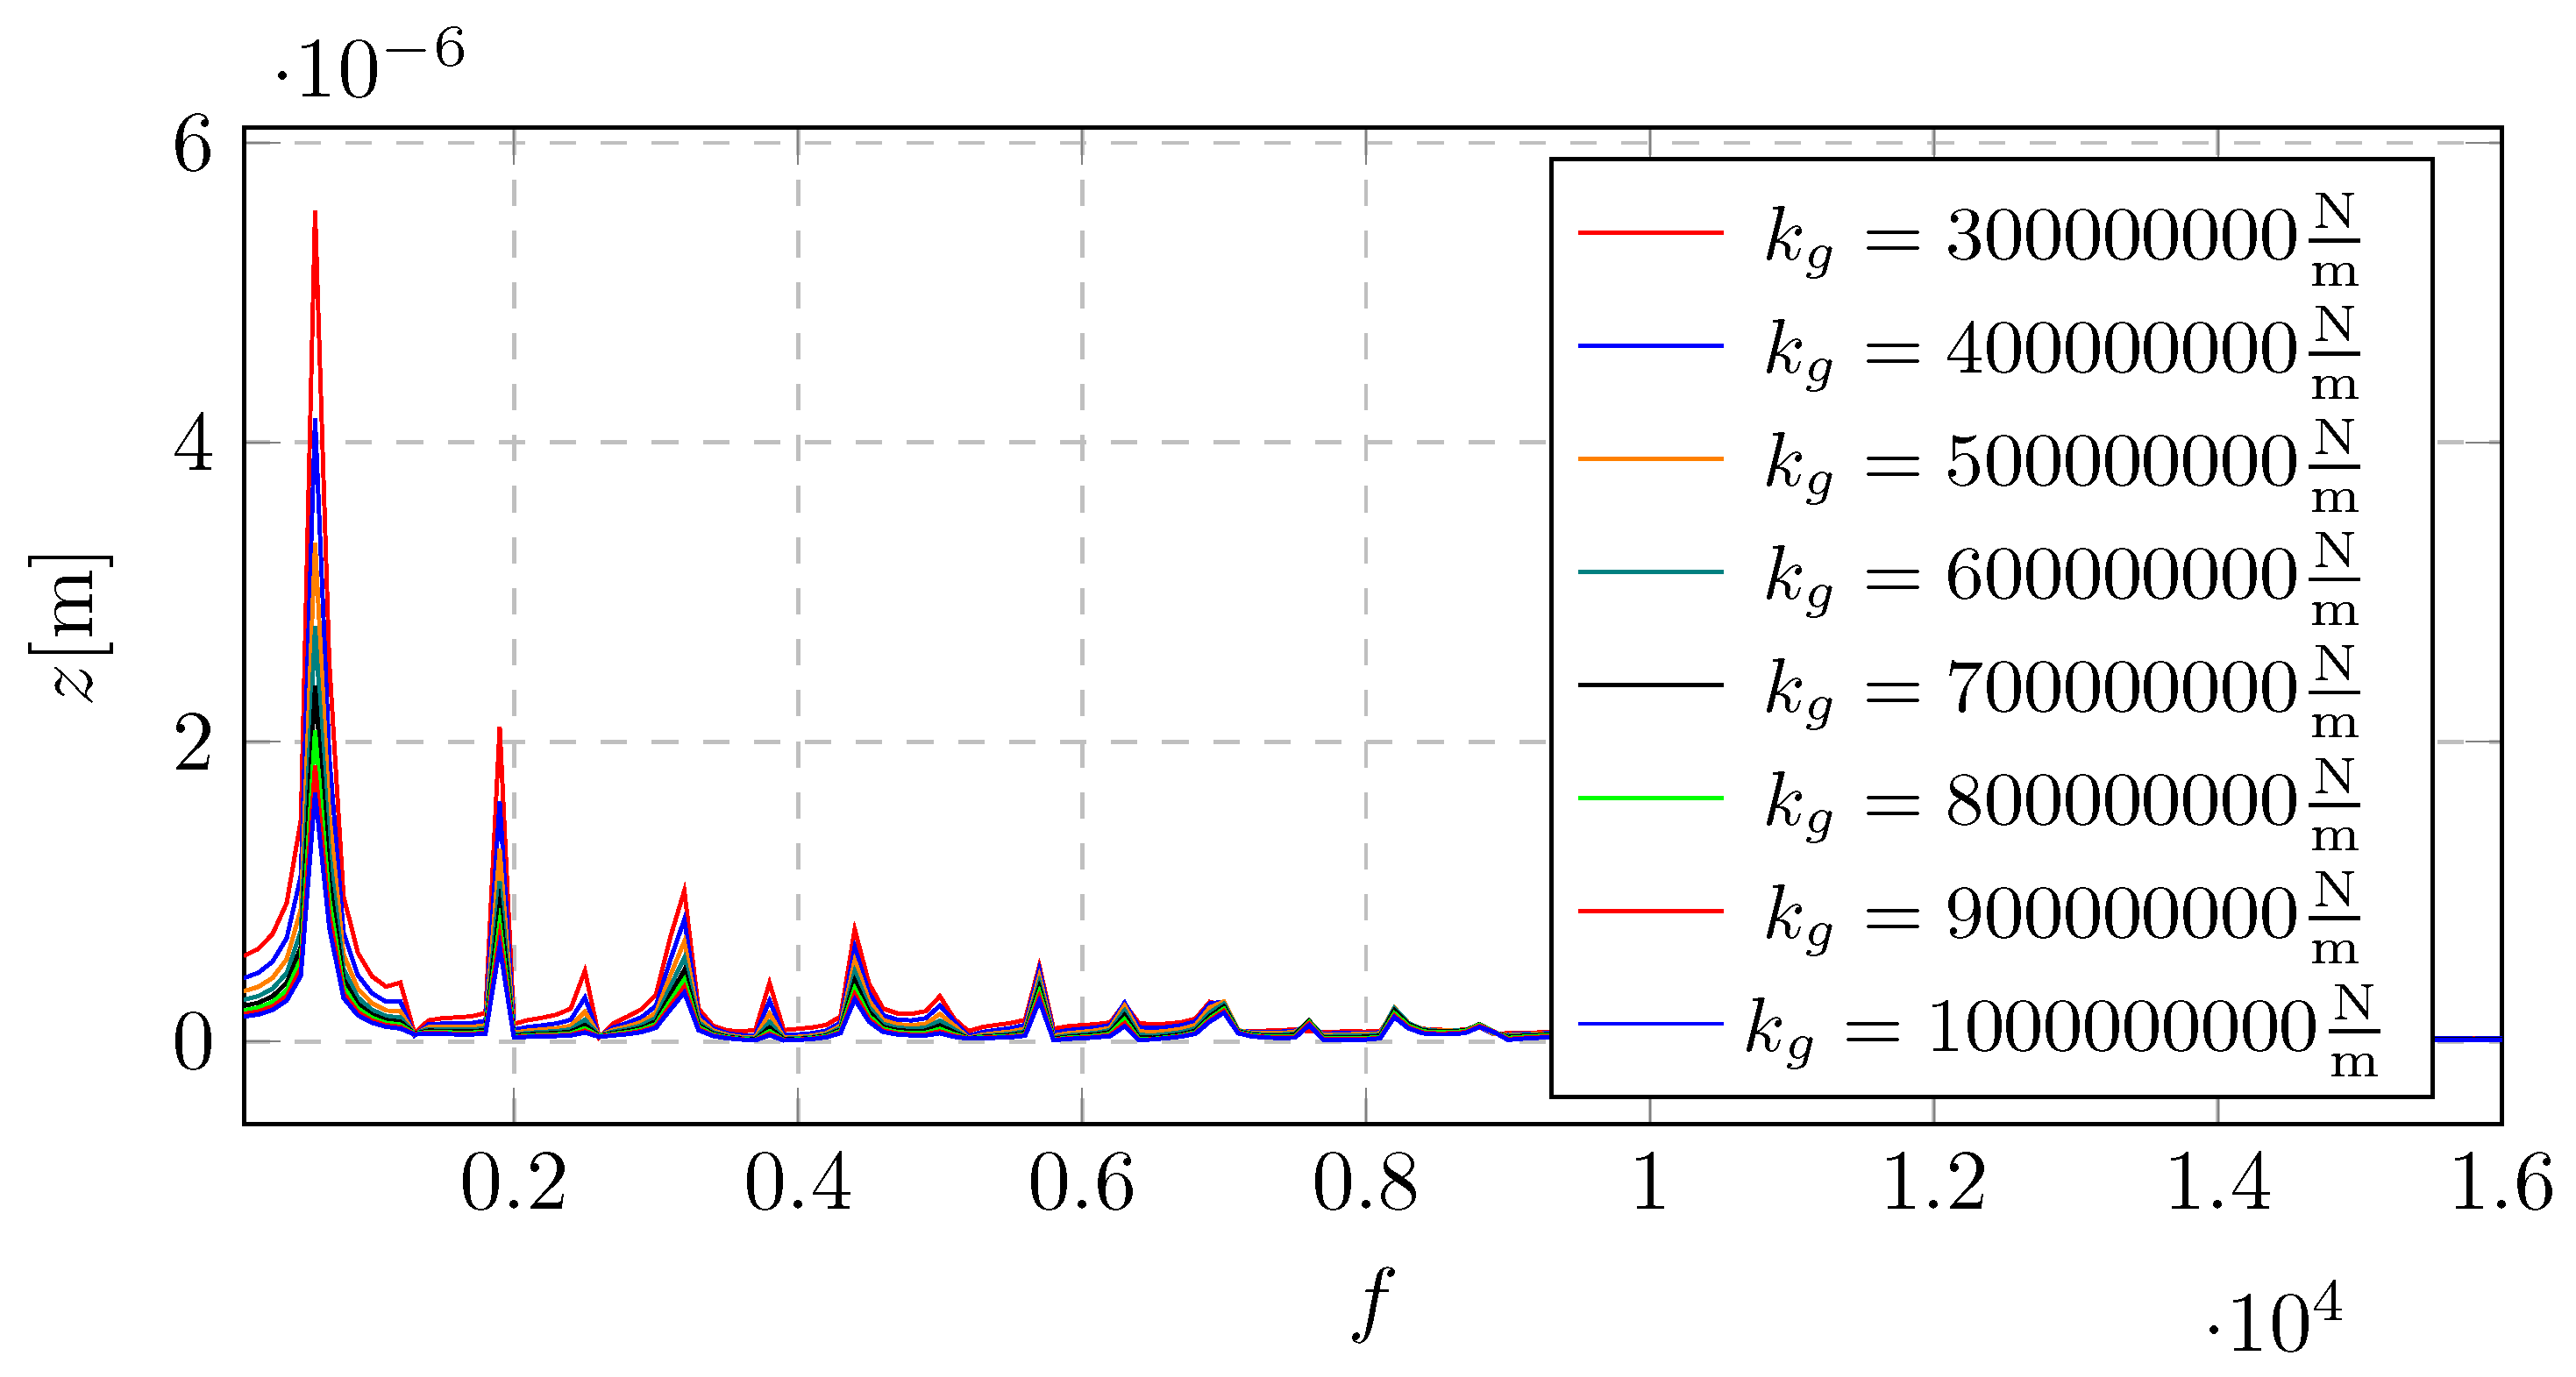
Figure 16.
Velocity of the system vibrations: frequncy-domain signals for different mesh stiffness
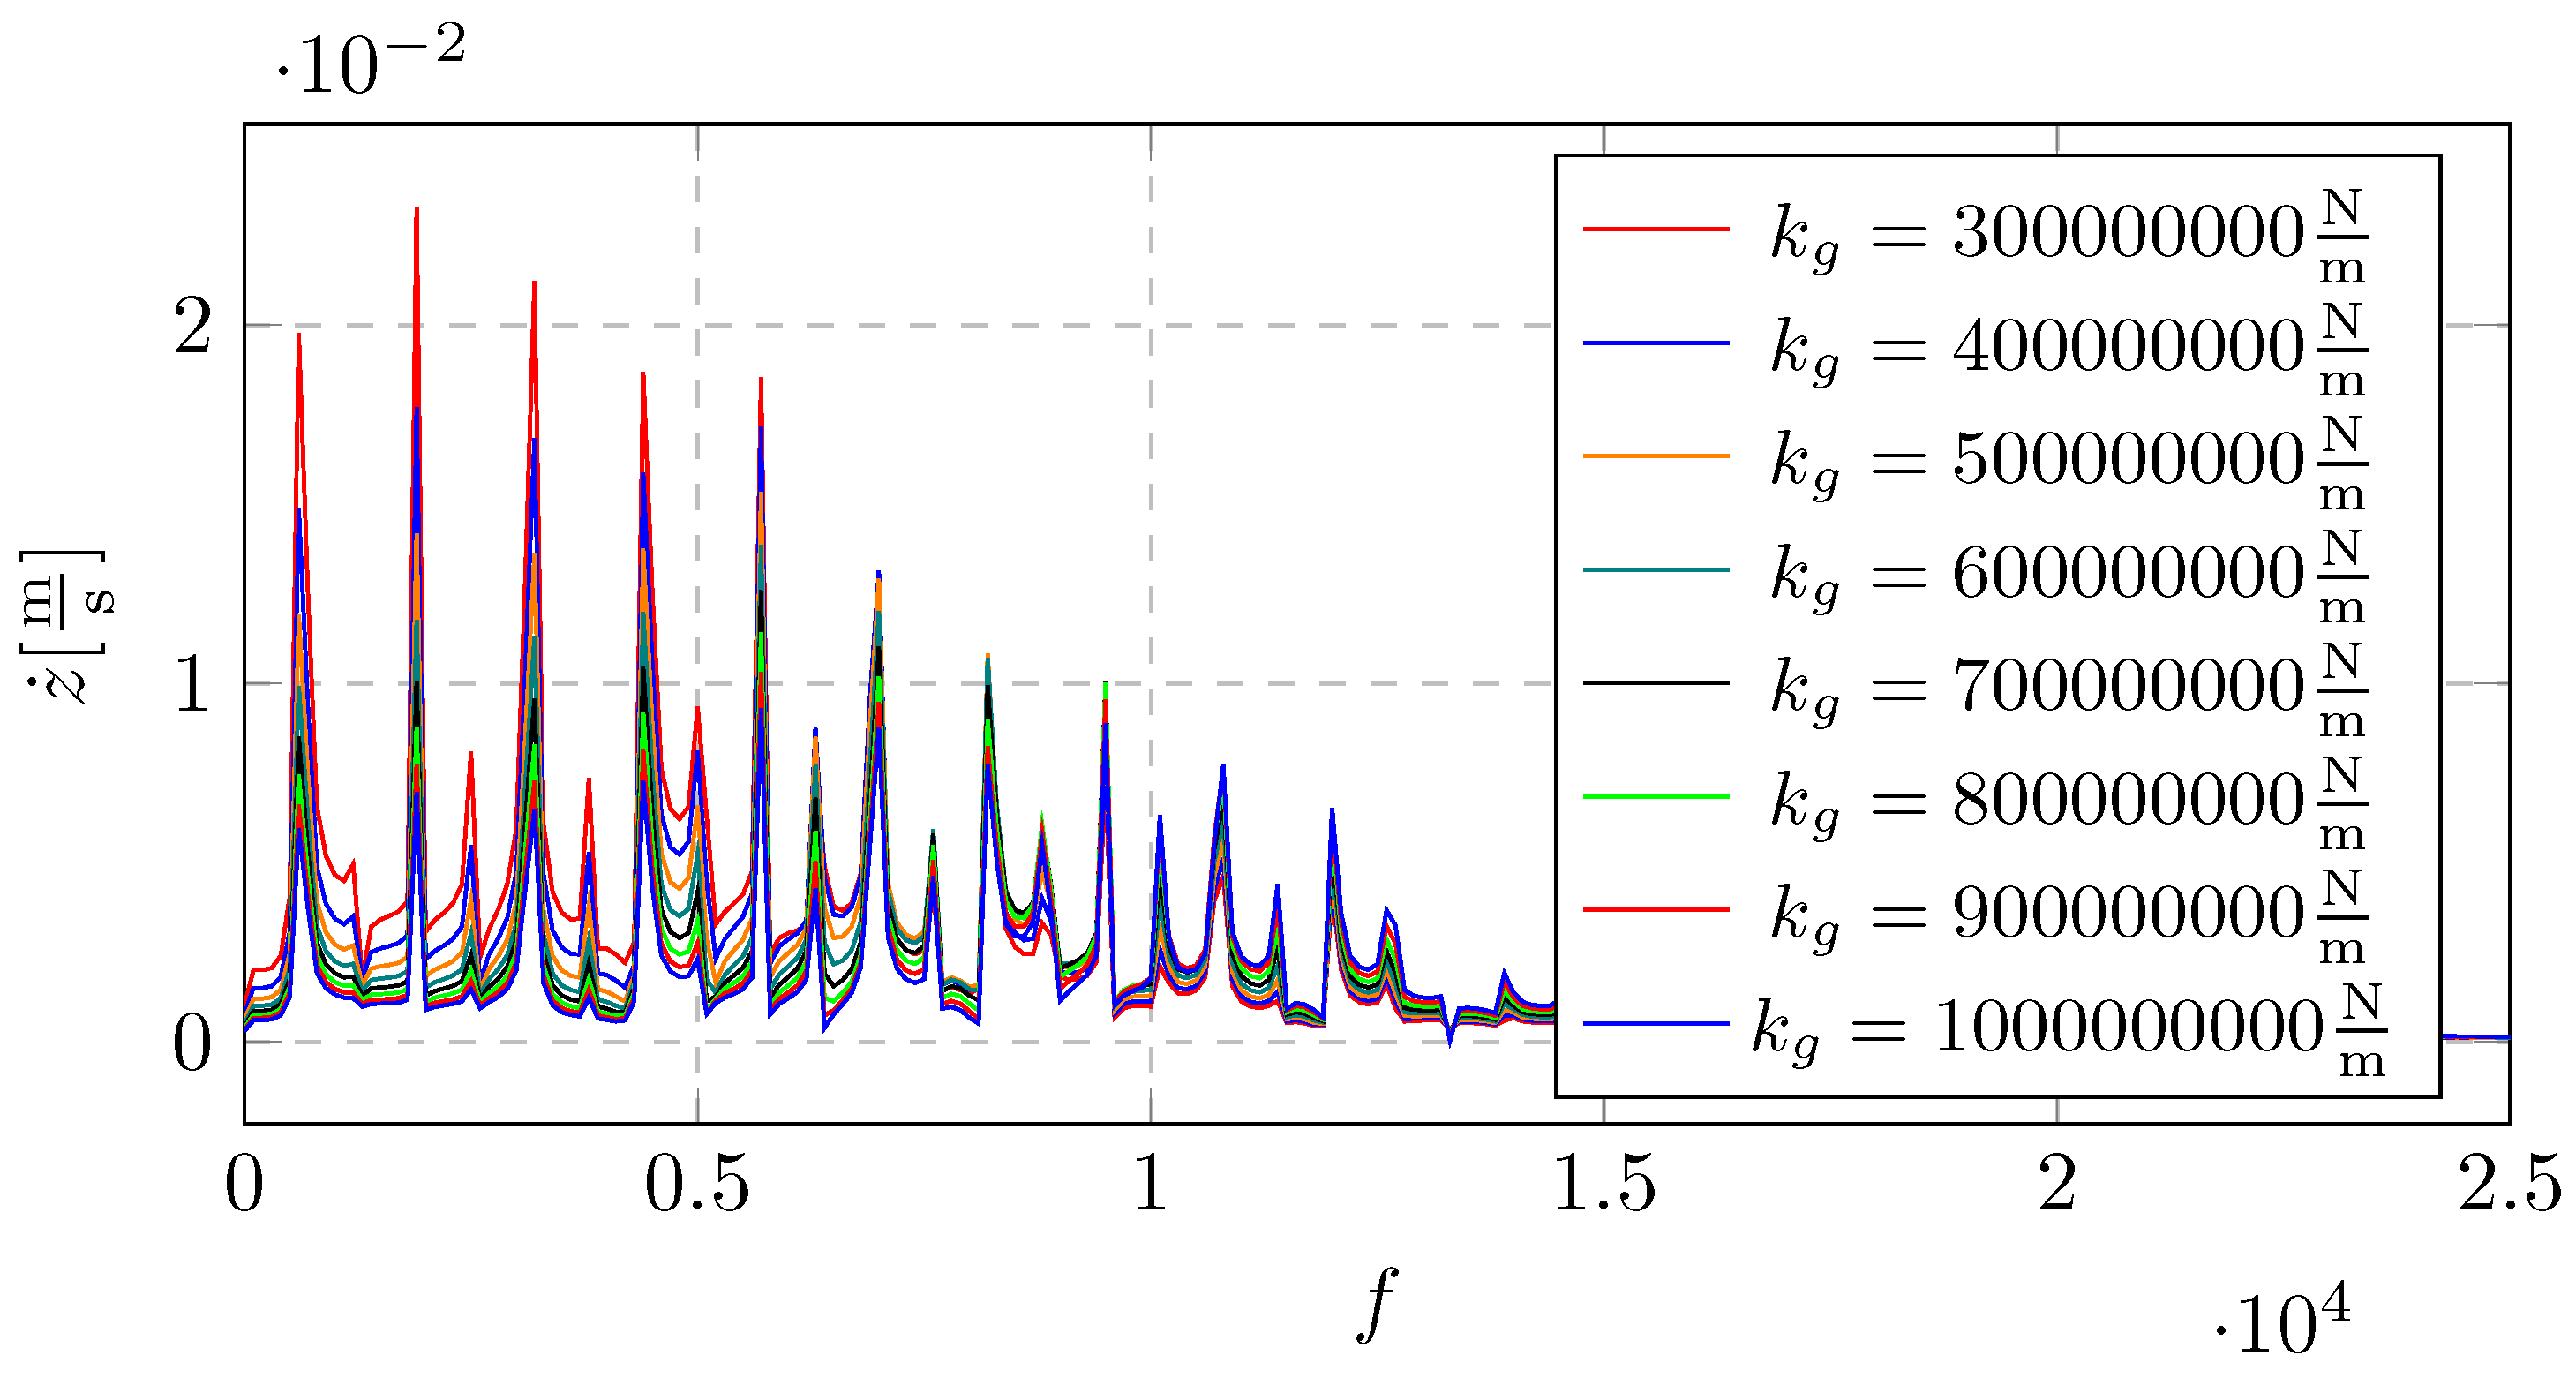
Figure 17.
Velocity of the system vibrations: frequncy-domain signals for different mesh stiffness - separated view based on Figure 16
Figure 17.
Velocity of the system vibrations: frequncy-domain signals for different mesh stiffness - separated view based on Figure 16
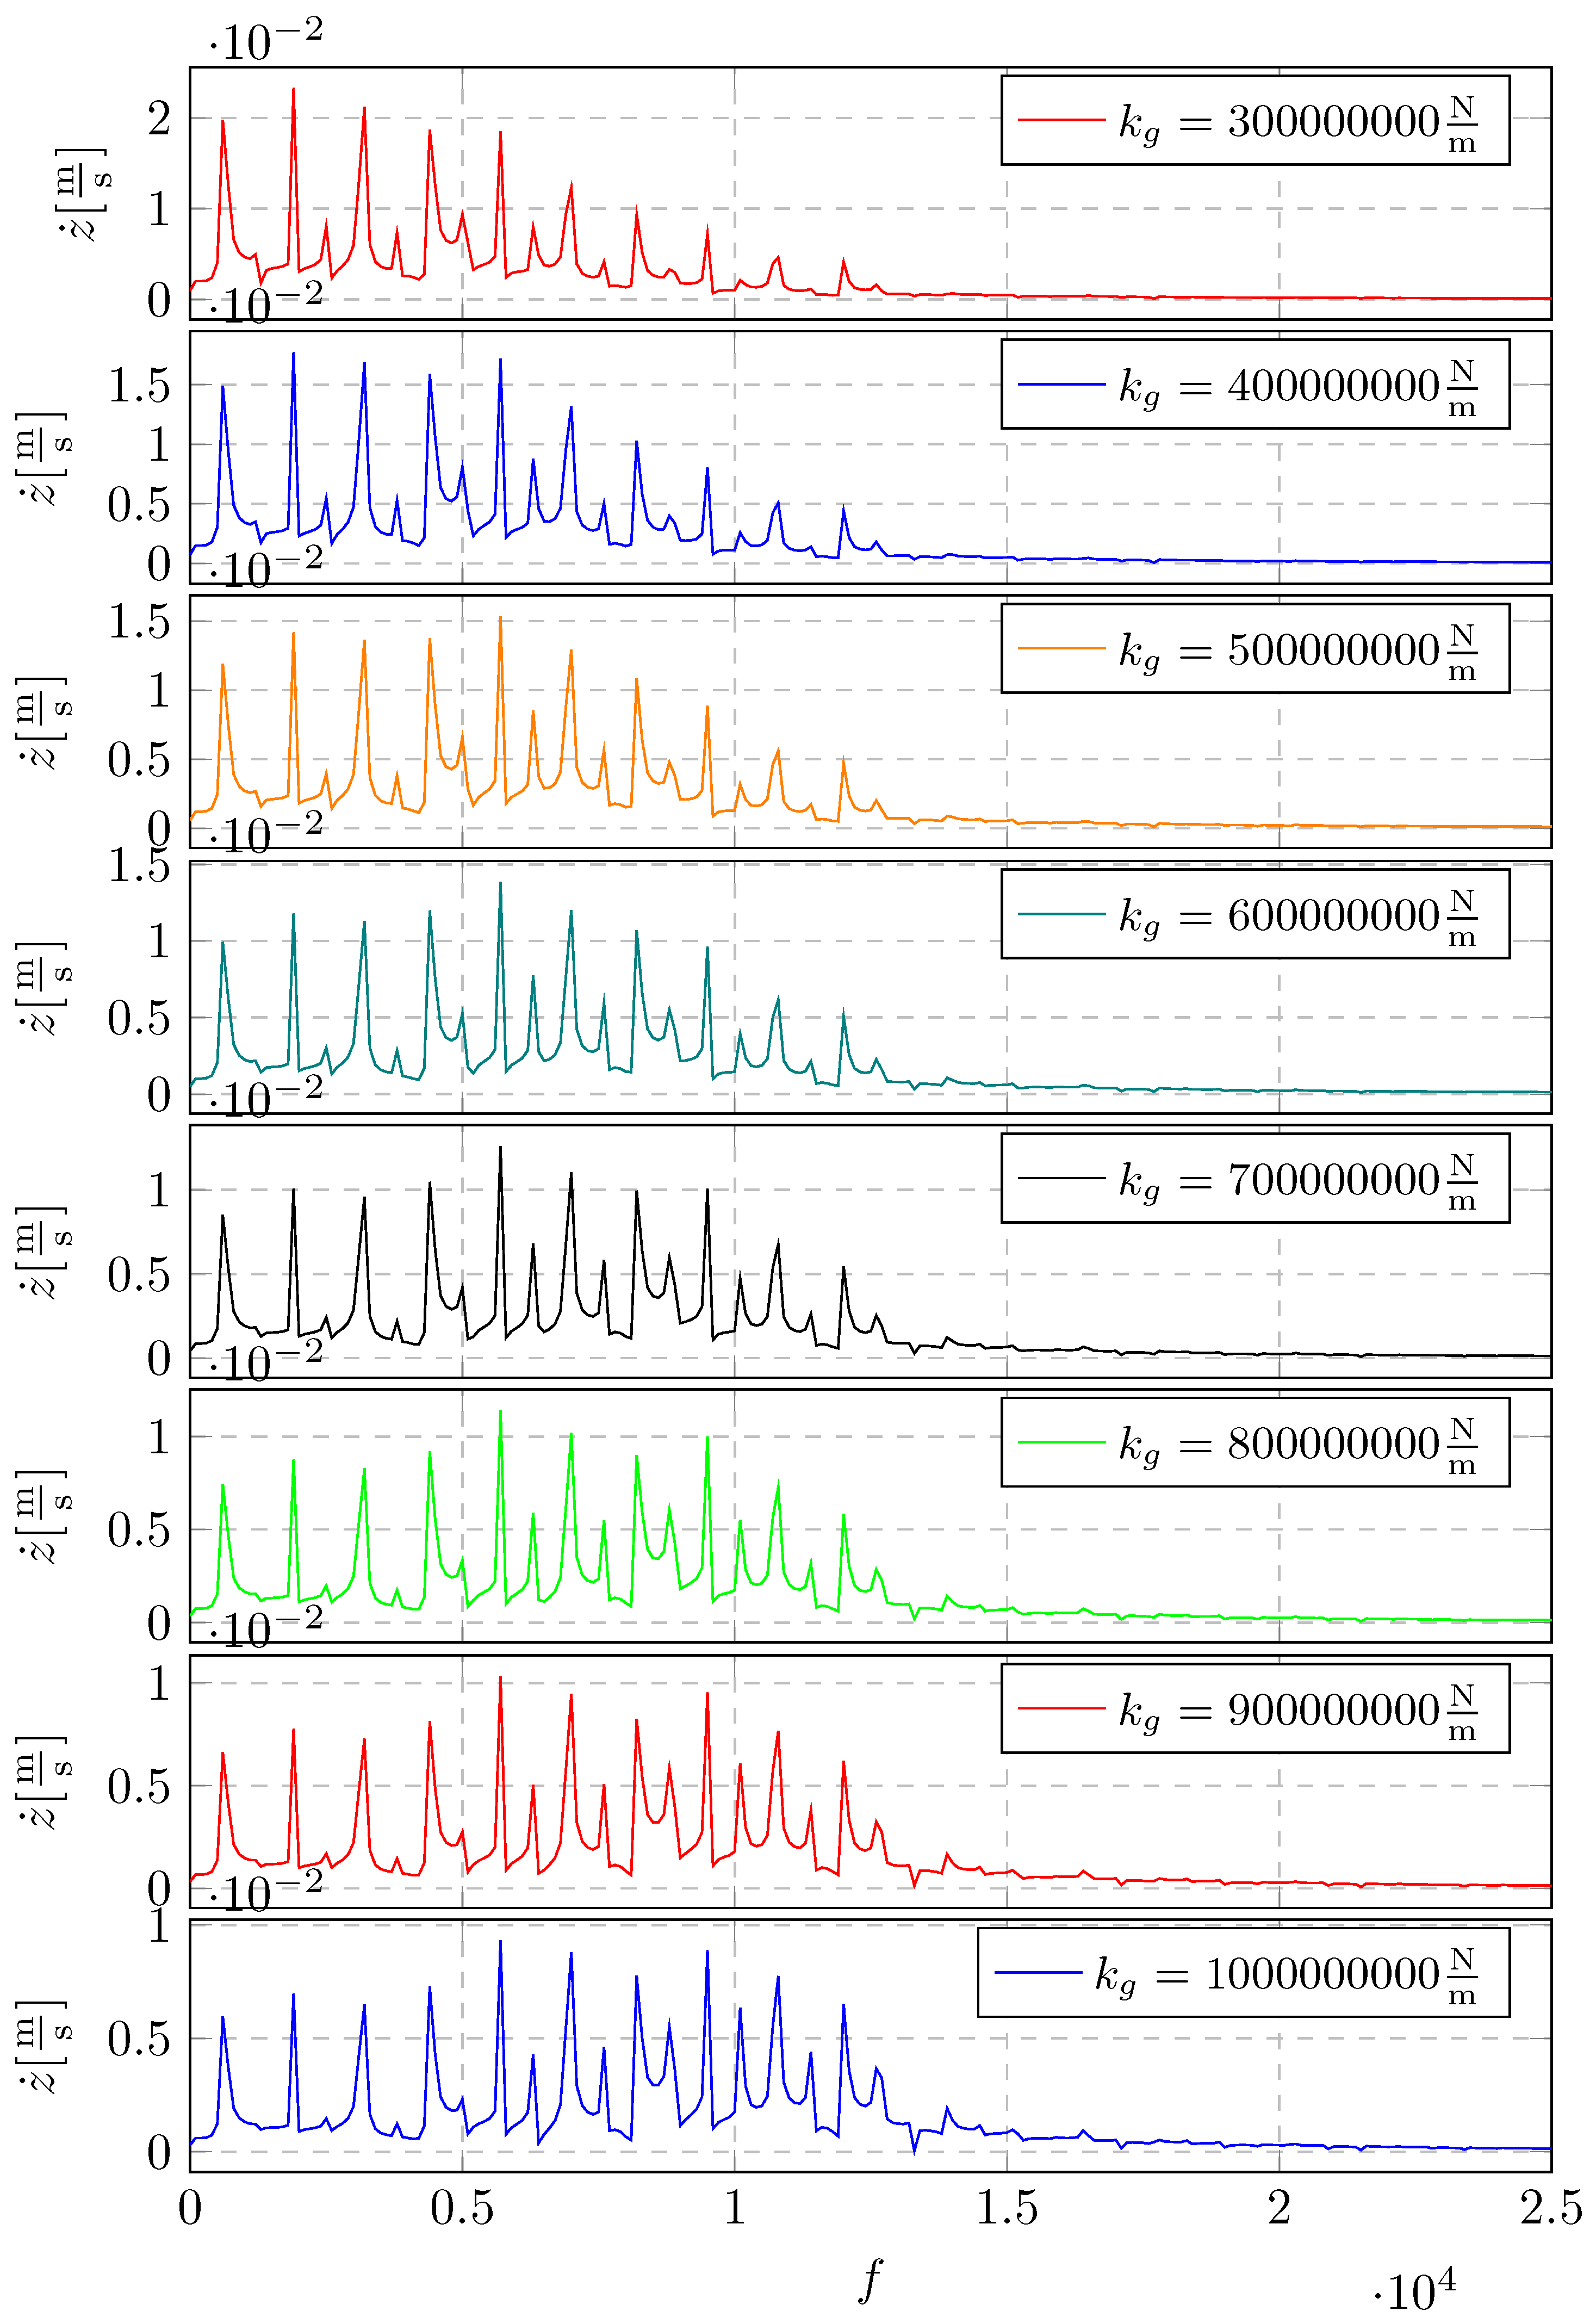
Figure 18.
Acceleration of the system vibrations: frequency-domain signals for different mesh stiffness
Figure 18.
Acceleration of the system vibrations: frequency-domain signals for different mesh stiffness
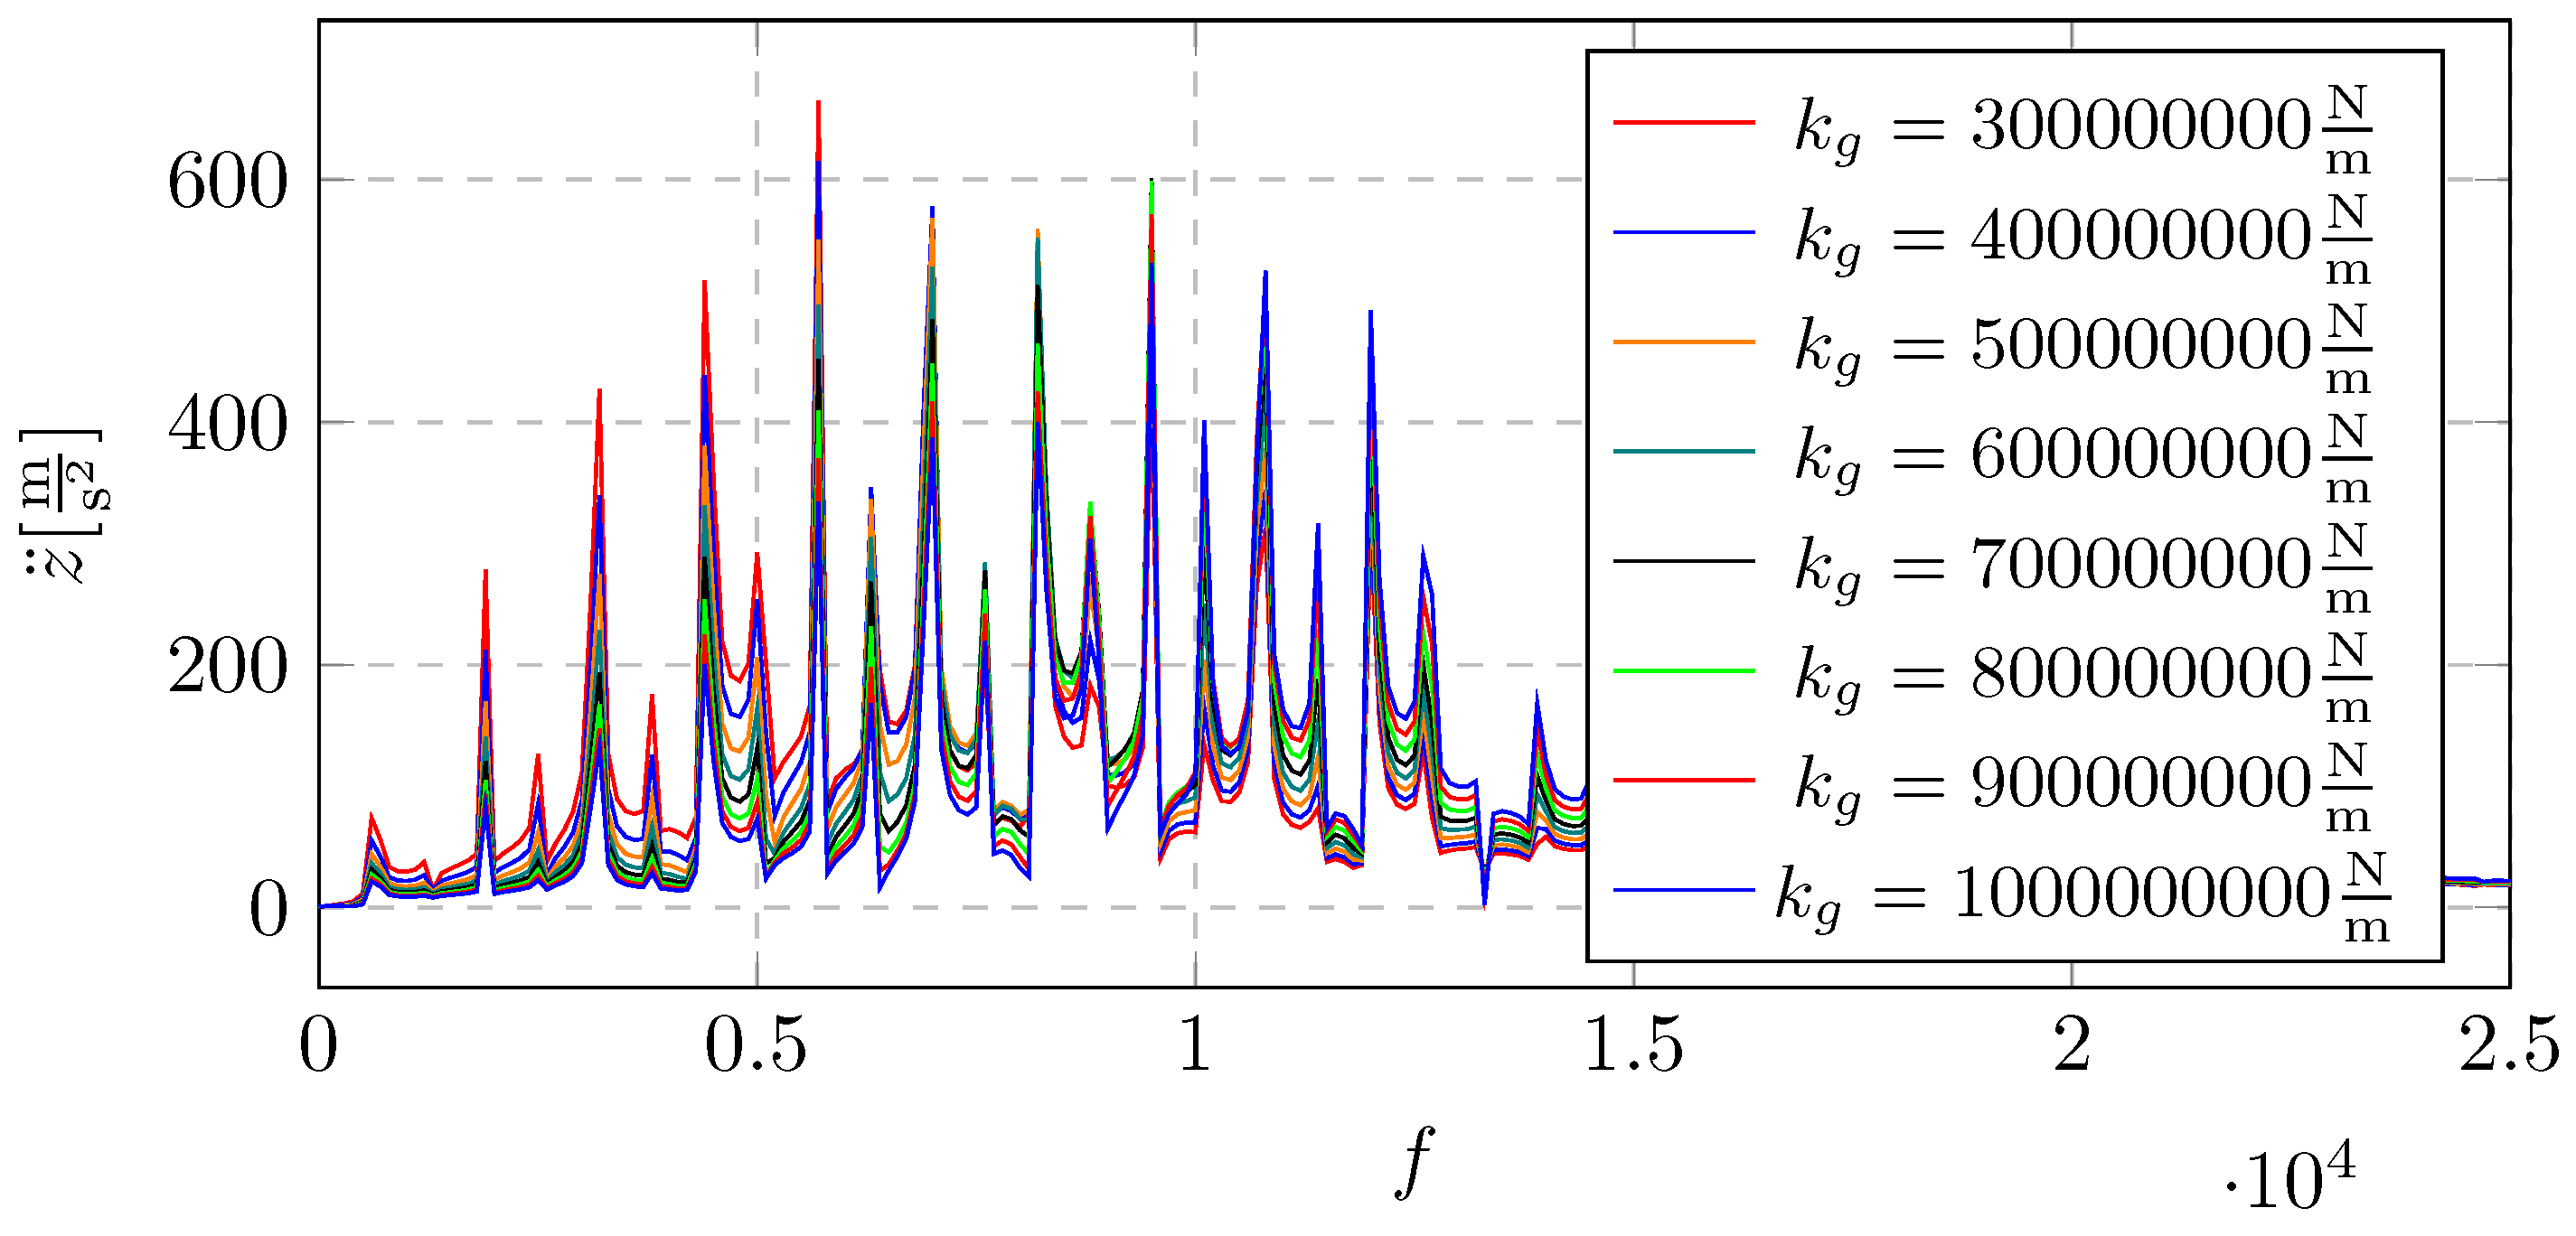
Figure 19.
Acceleration of the system vibrations: frequency-domain signals for different mesh stiffness - separated view based on Figure 18
Figure 19.
Acceleration of the system vibrations: frequency-domain signals for different mesh stiffness - separated view based on Figure 18
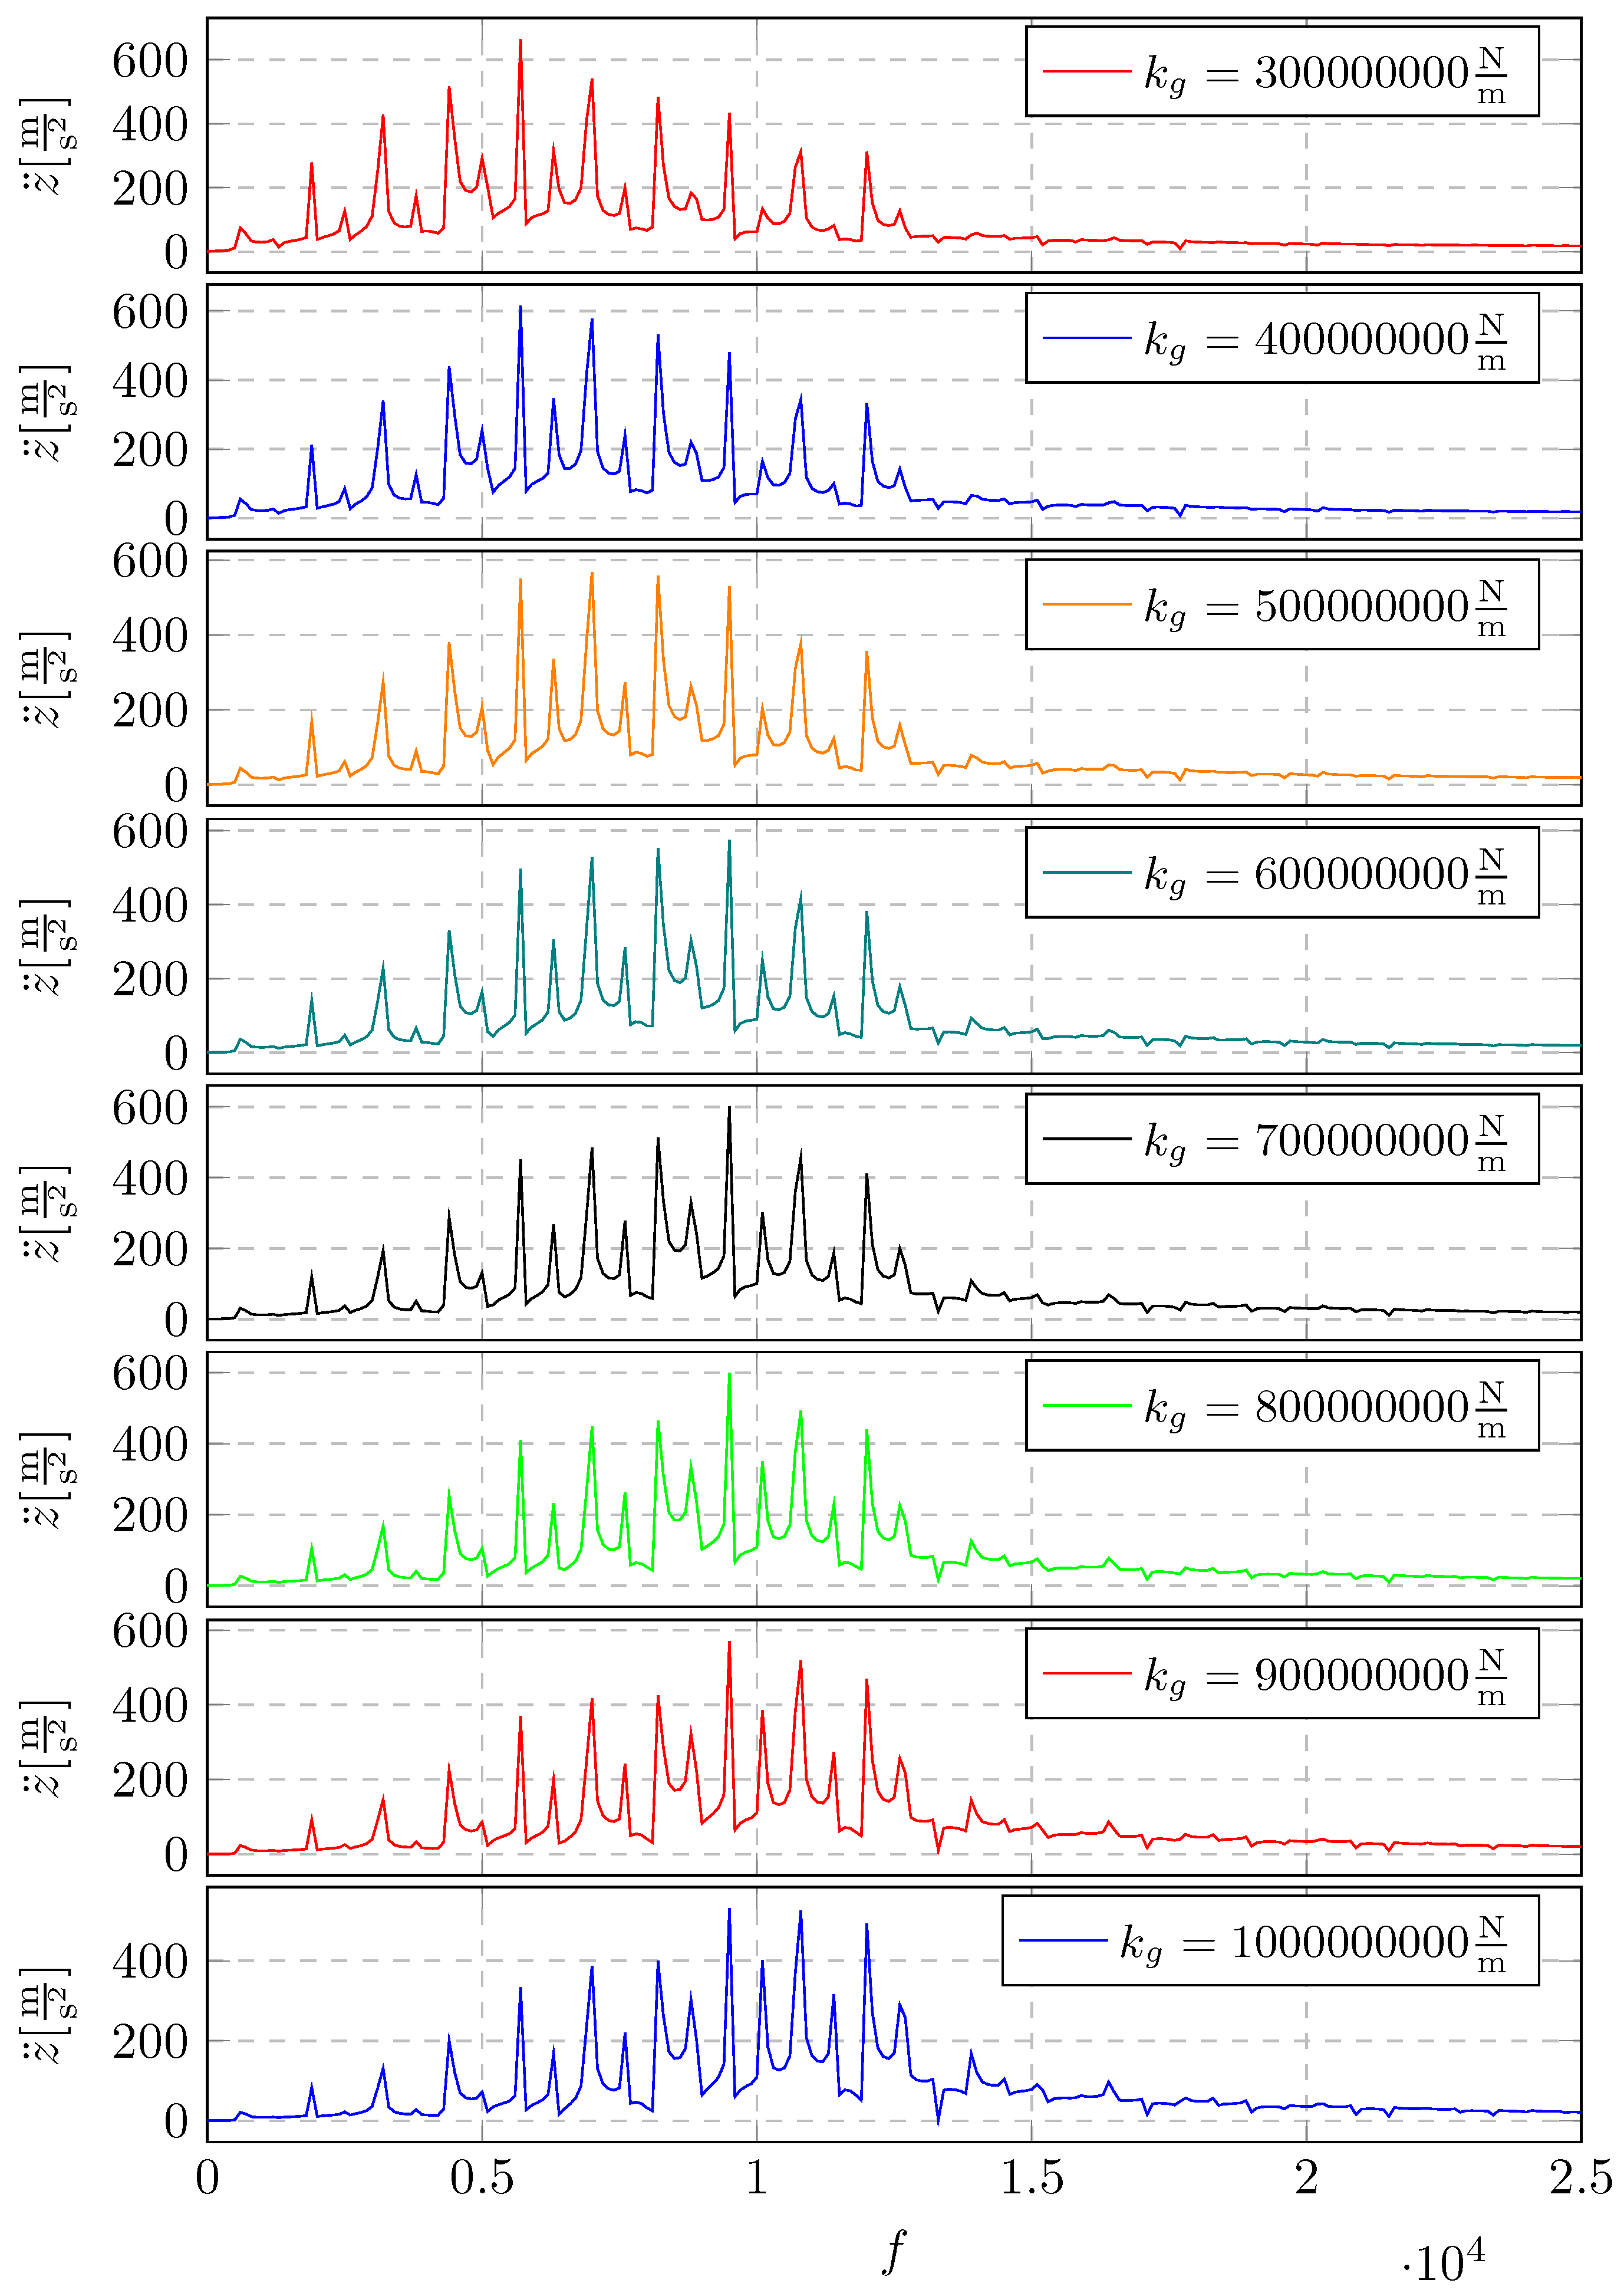
Figure 20.
Displacement of the system vibrations: the time-domain signals for different equivalent mass
Figure 20.
Displacement of the system vibrations: the time-domain signals for different equivalent mass
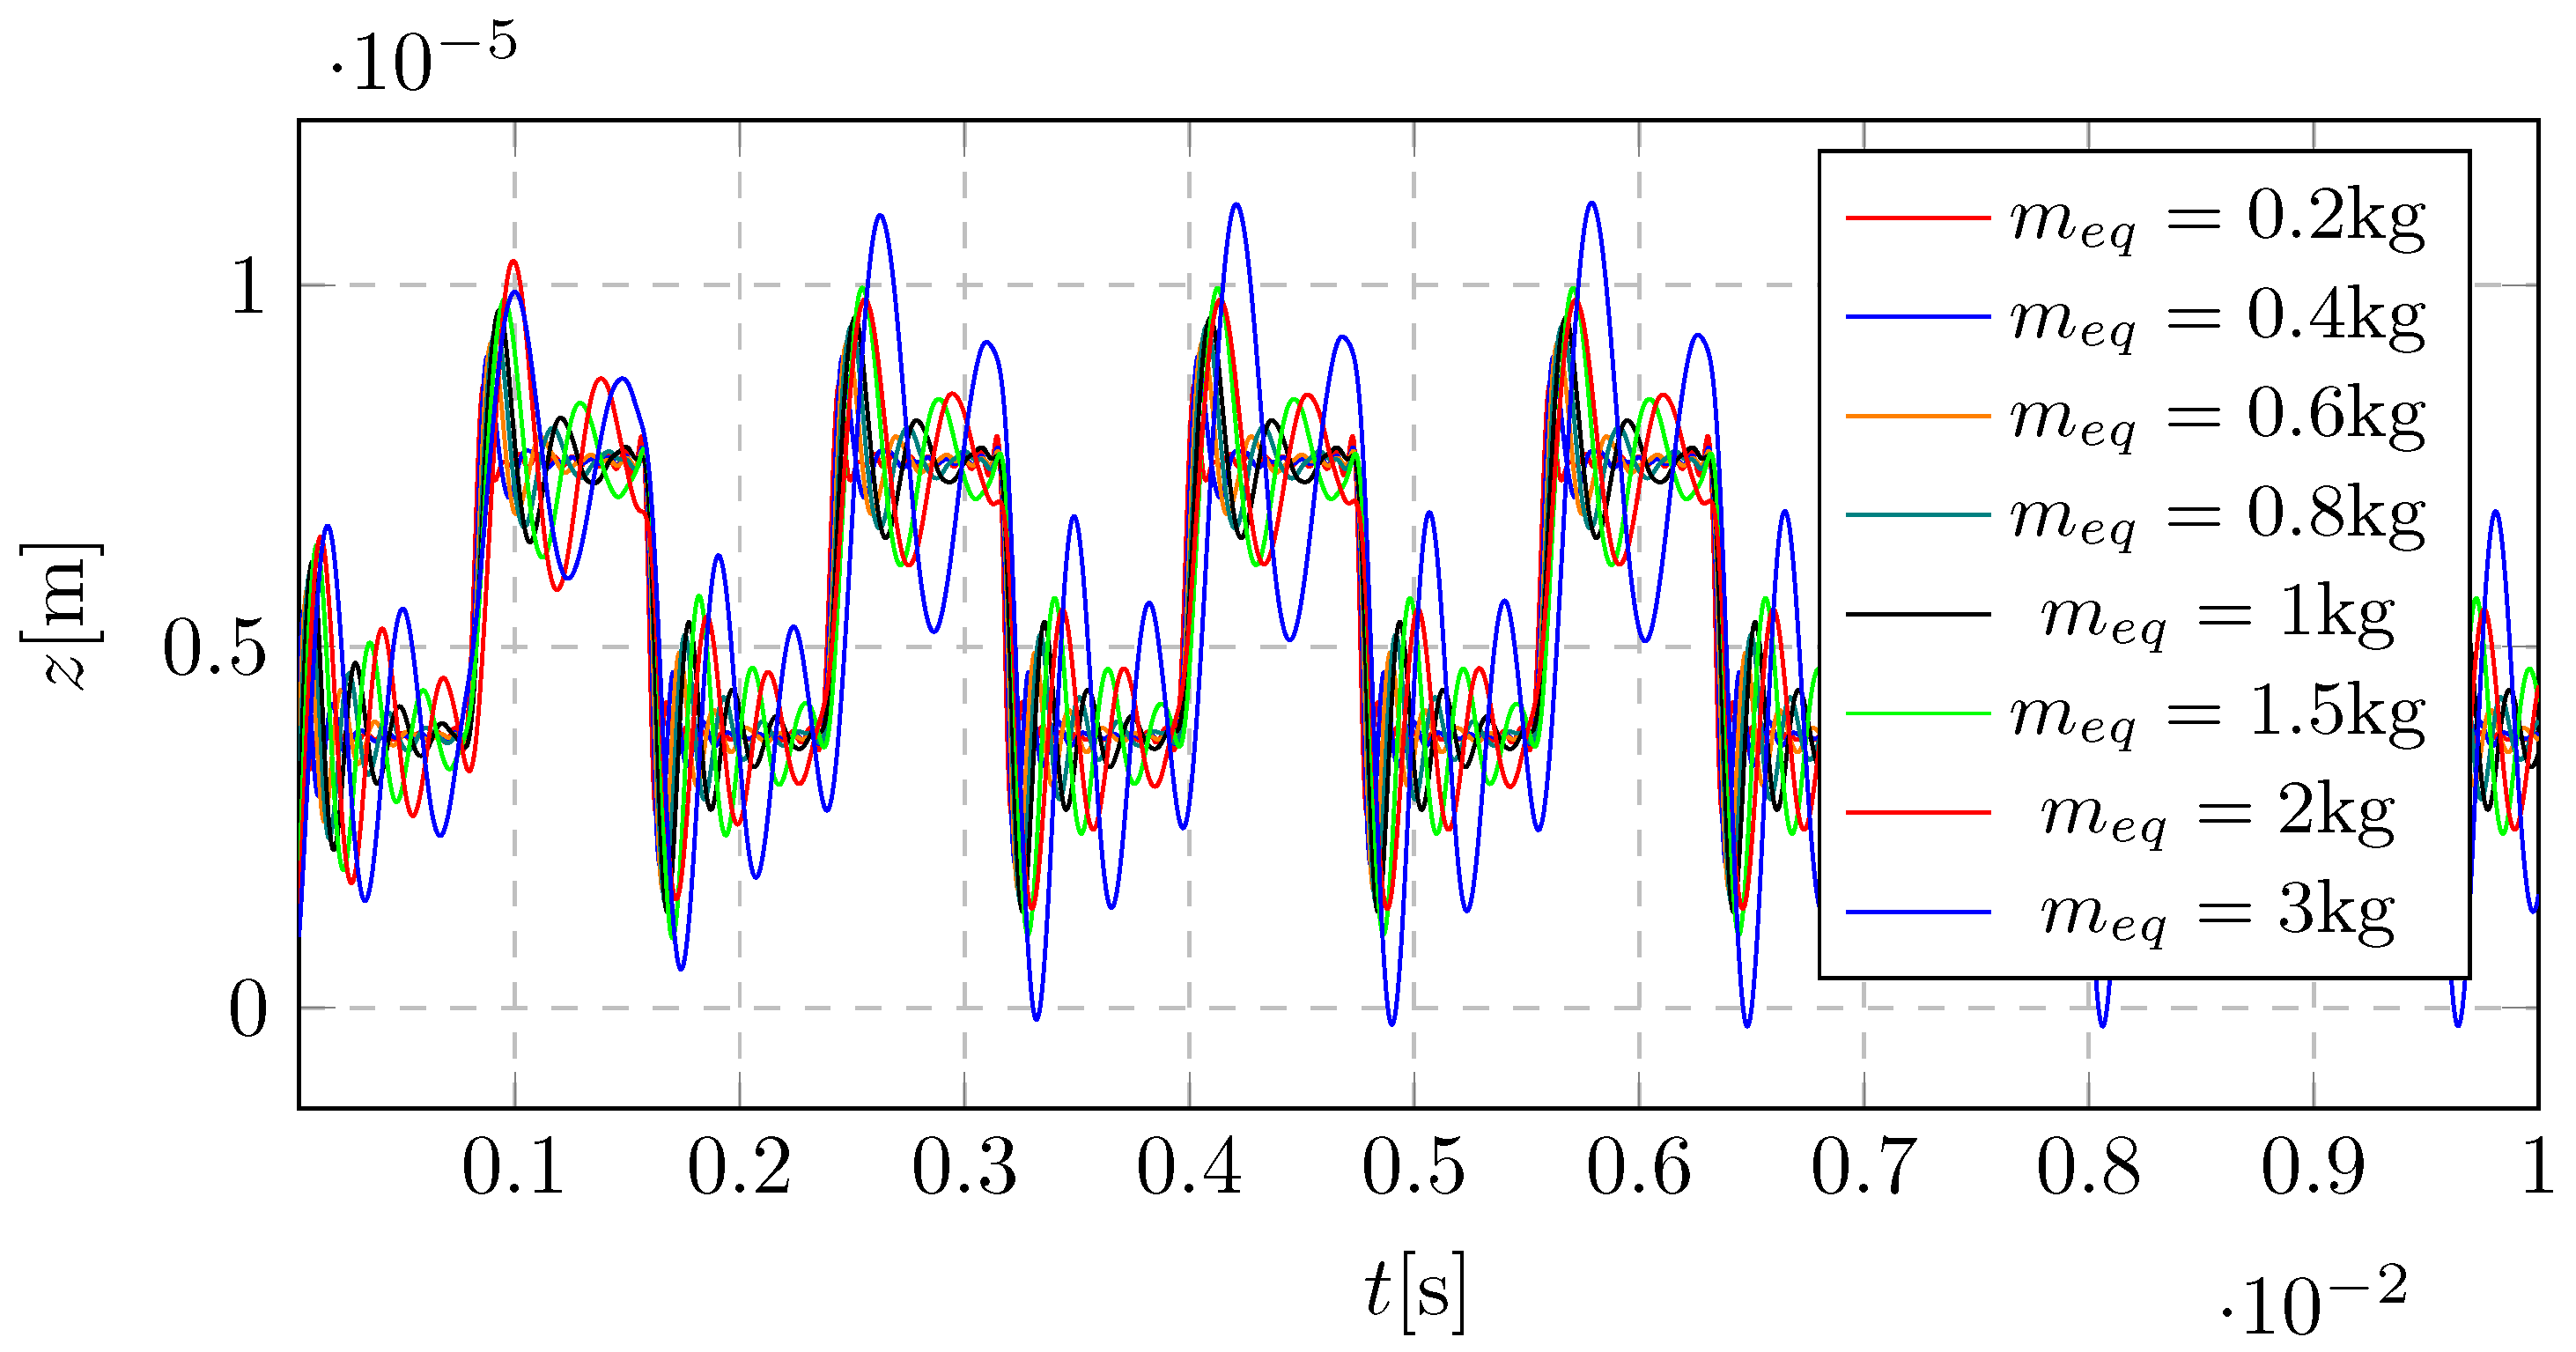
Figure 21.
Displacement of the system vibrations for different equivalent mass: narrowing the time-domain (qualitative zoom of the signals in Figure 20)
Figure 21.
Displacement of the system vibrations for different equivalent mass: narrowing the time-domain (qualitative zoom of the signals in Figure 20)
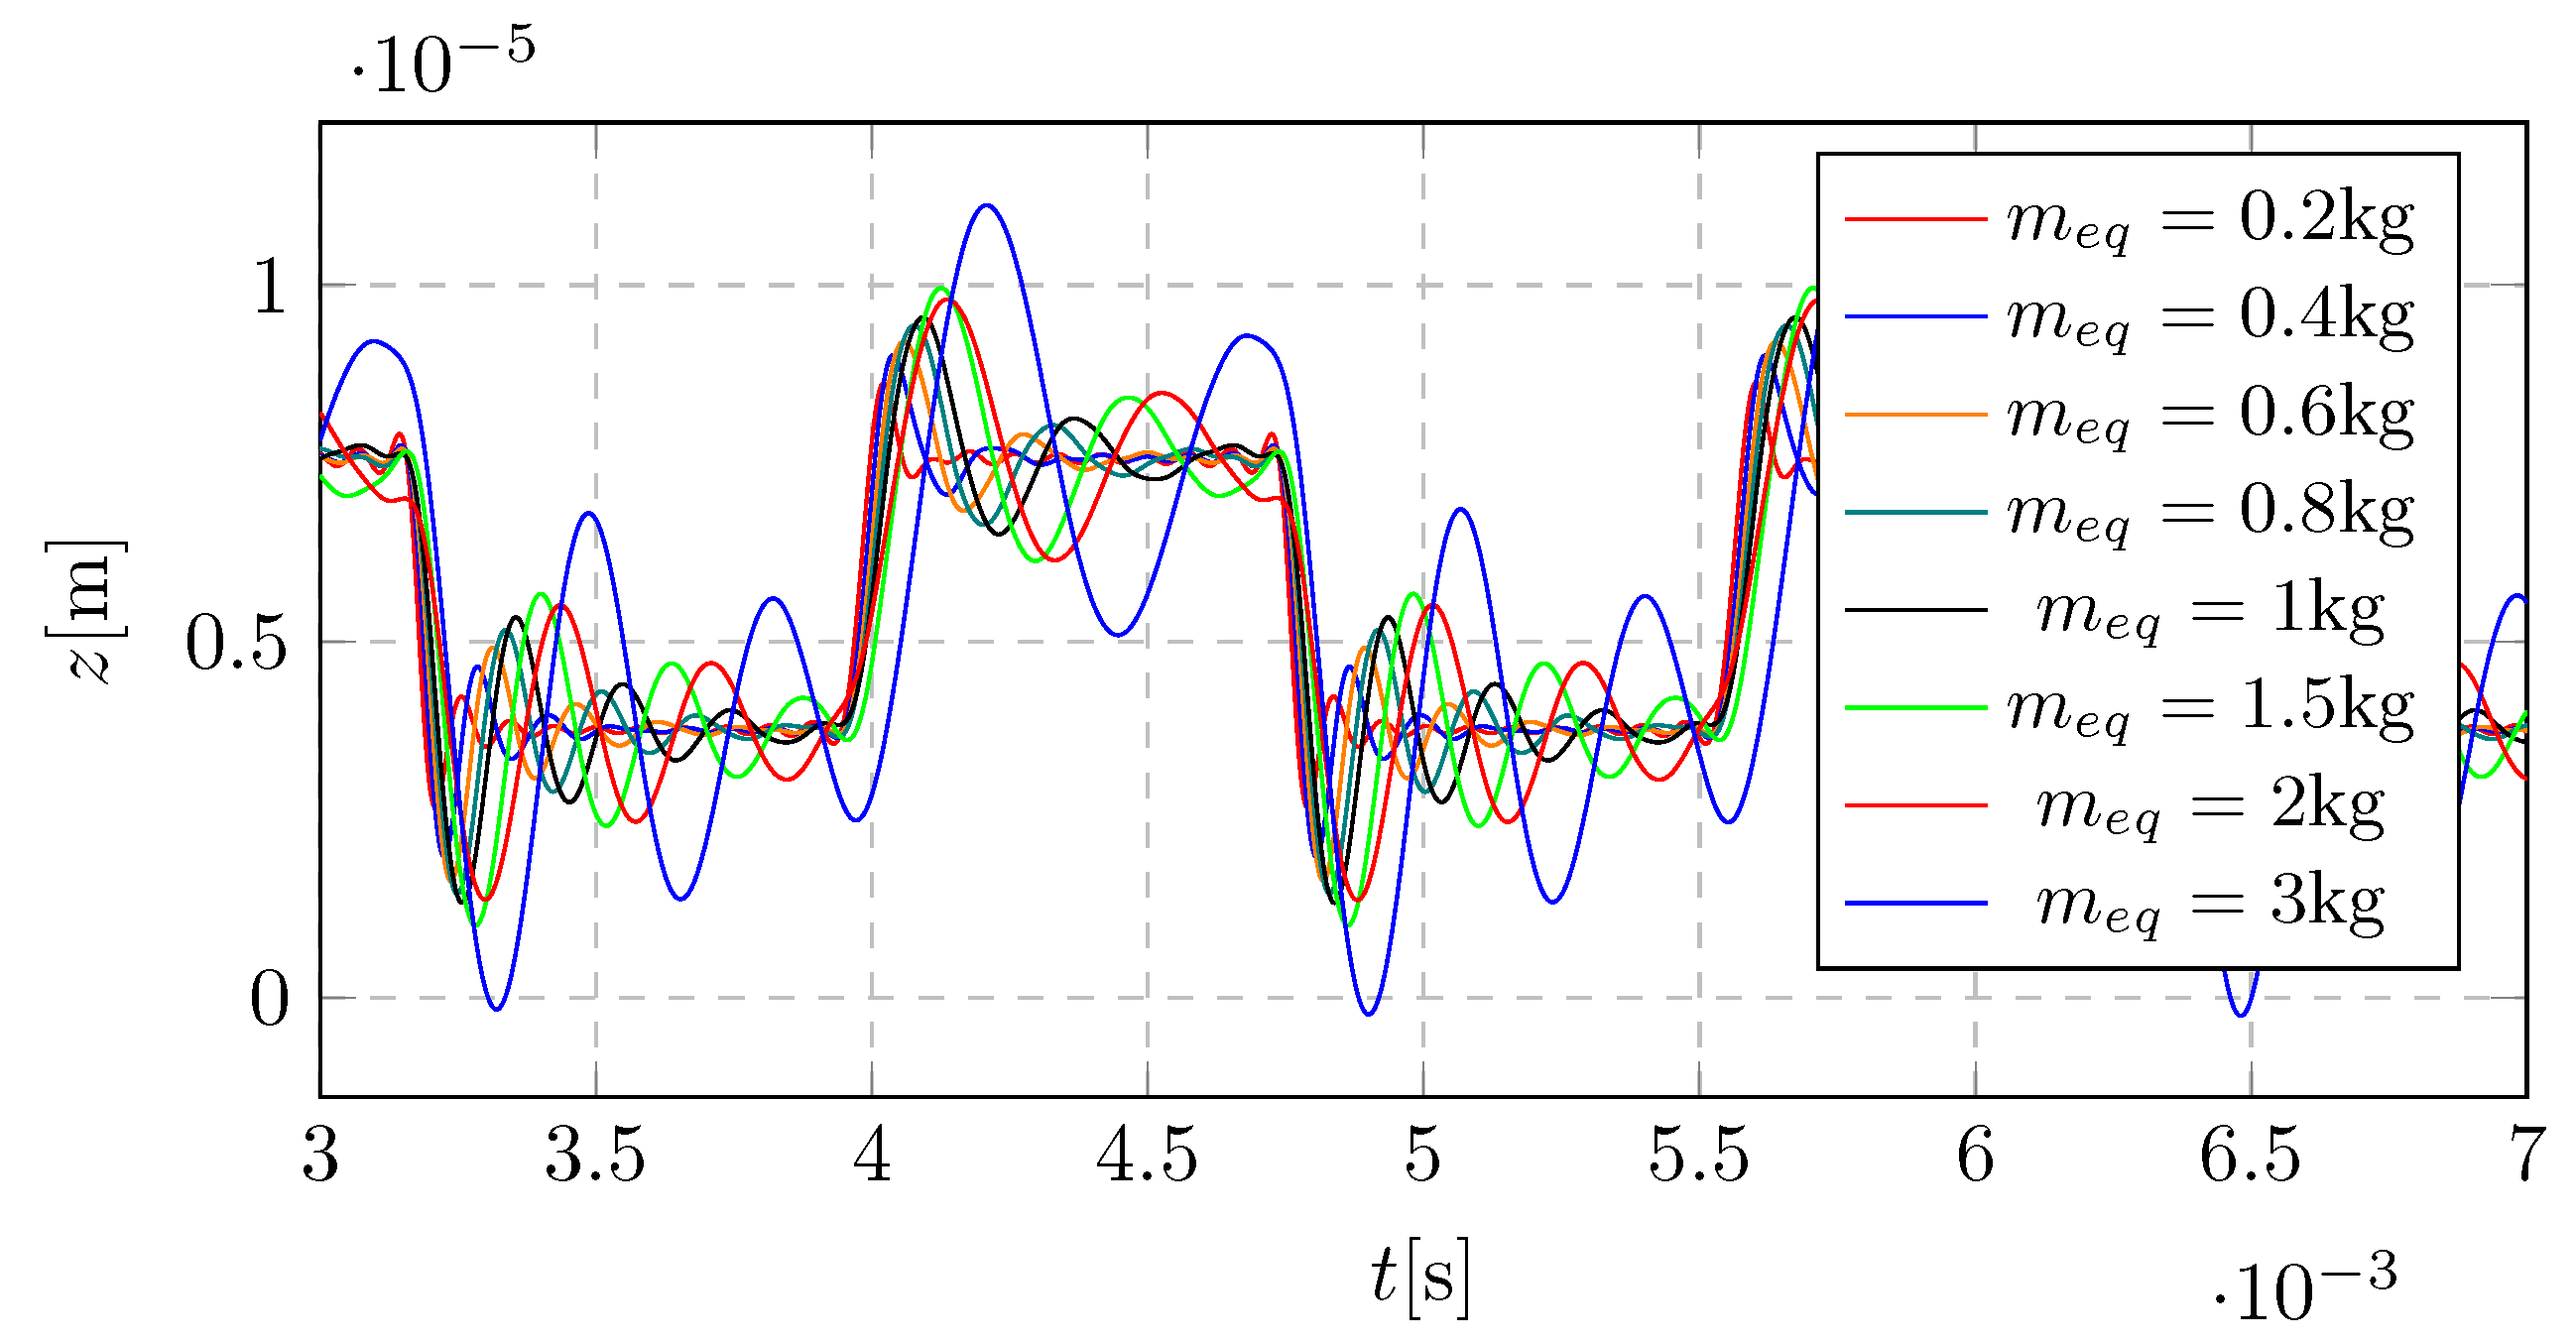
Figure 22.
Displacement of the system vibrations for different equivalent mass: separate time-domain signals based on Figure 20
Figure 22.
Displacement of the system vibrations for different equivalent mass: separate time-domain signals based on Figure 20
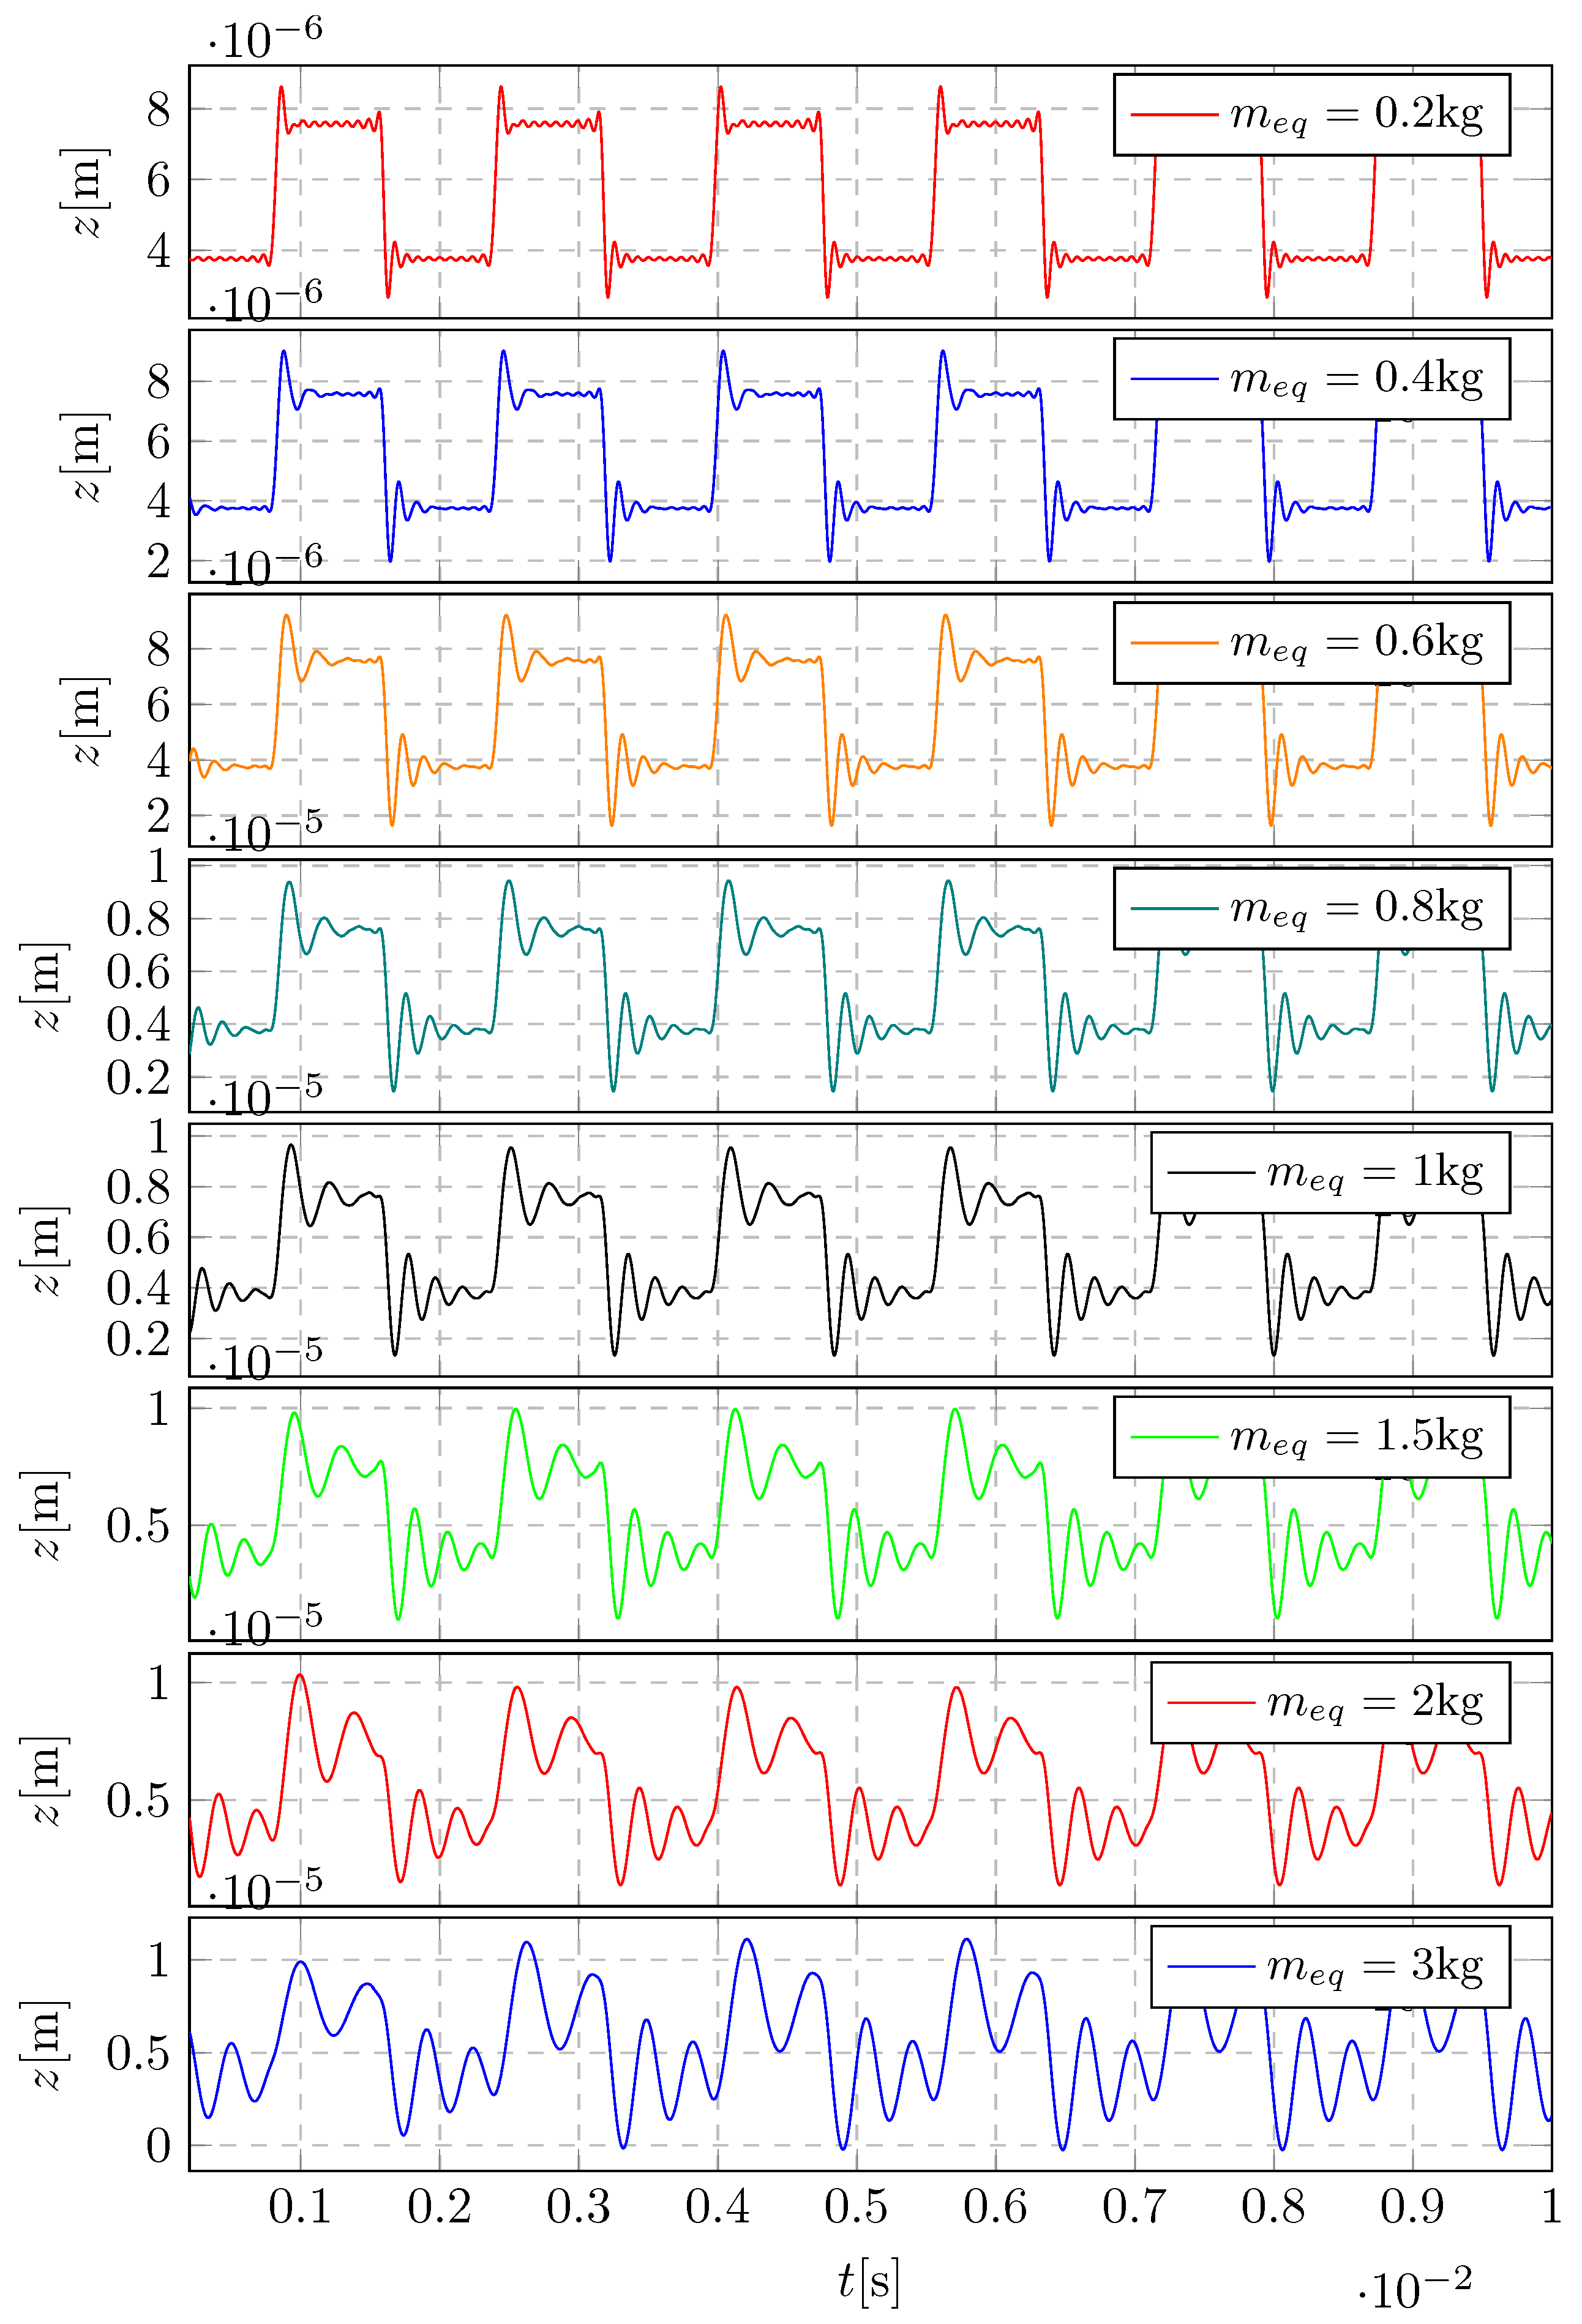
Figure 23.
Acceleration of the system vibrations: the frequency-domain signals for different equivalent mass
Figure 23.
Acceleration of the system vibrations: the frequency-domain signals for different equivalent mass
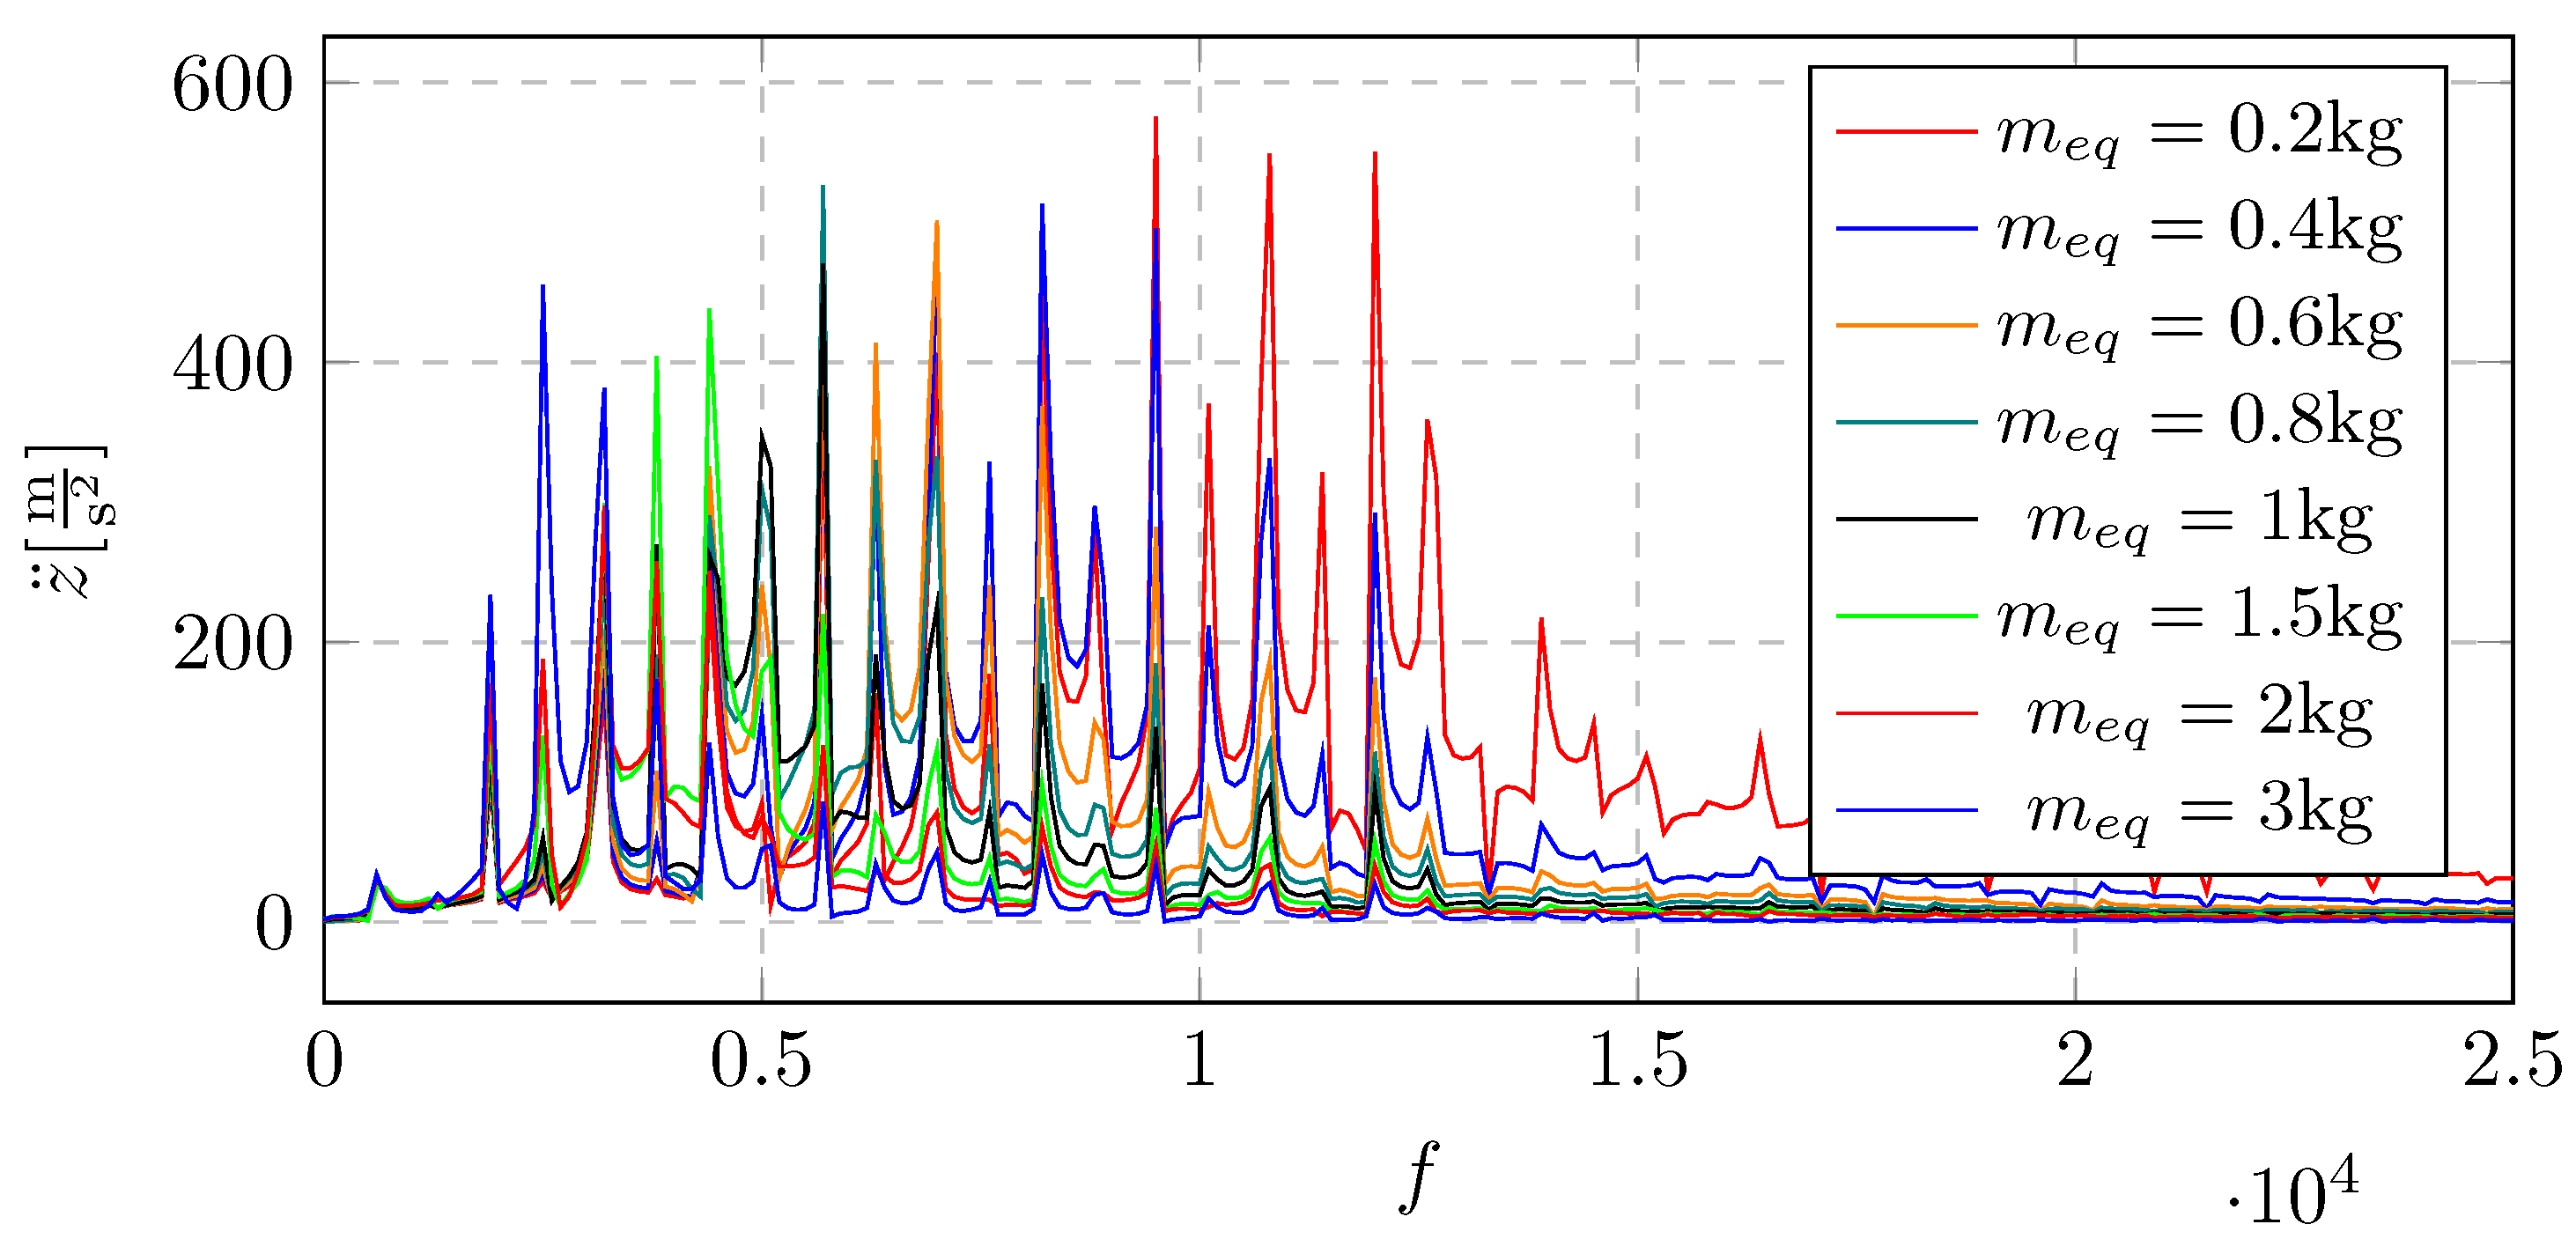
Figure 24.
Acceleration of the system vibrations for different equivalent mass: separate frequency-domain signals based on Figure 23
Figure 24.
Acceleration of the system vibrations for different equivalent mass: separate frequency-domain signals based on Figure 23
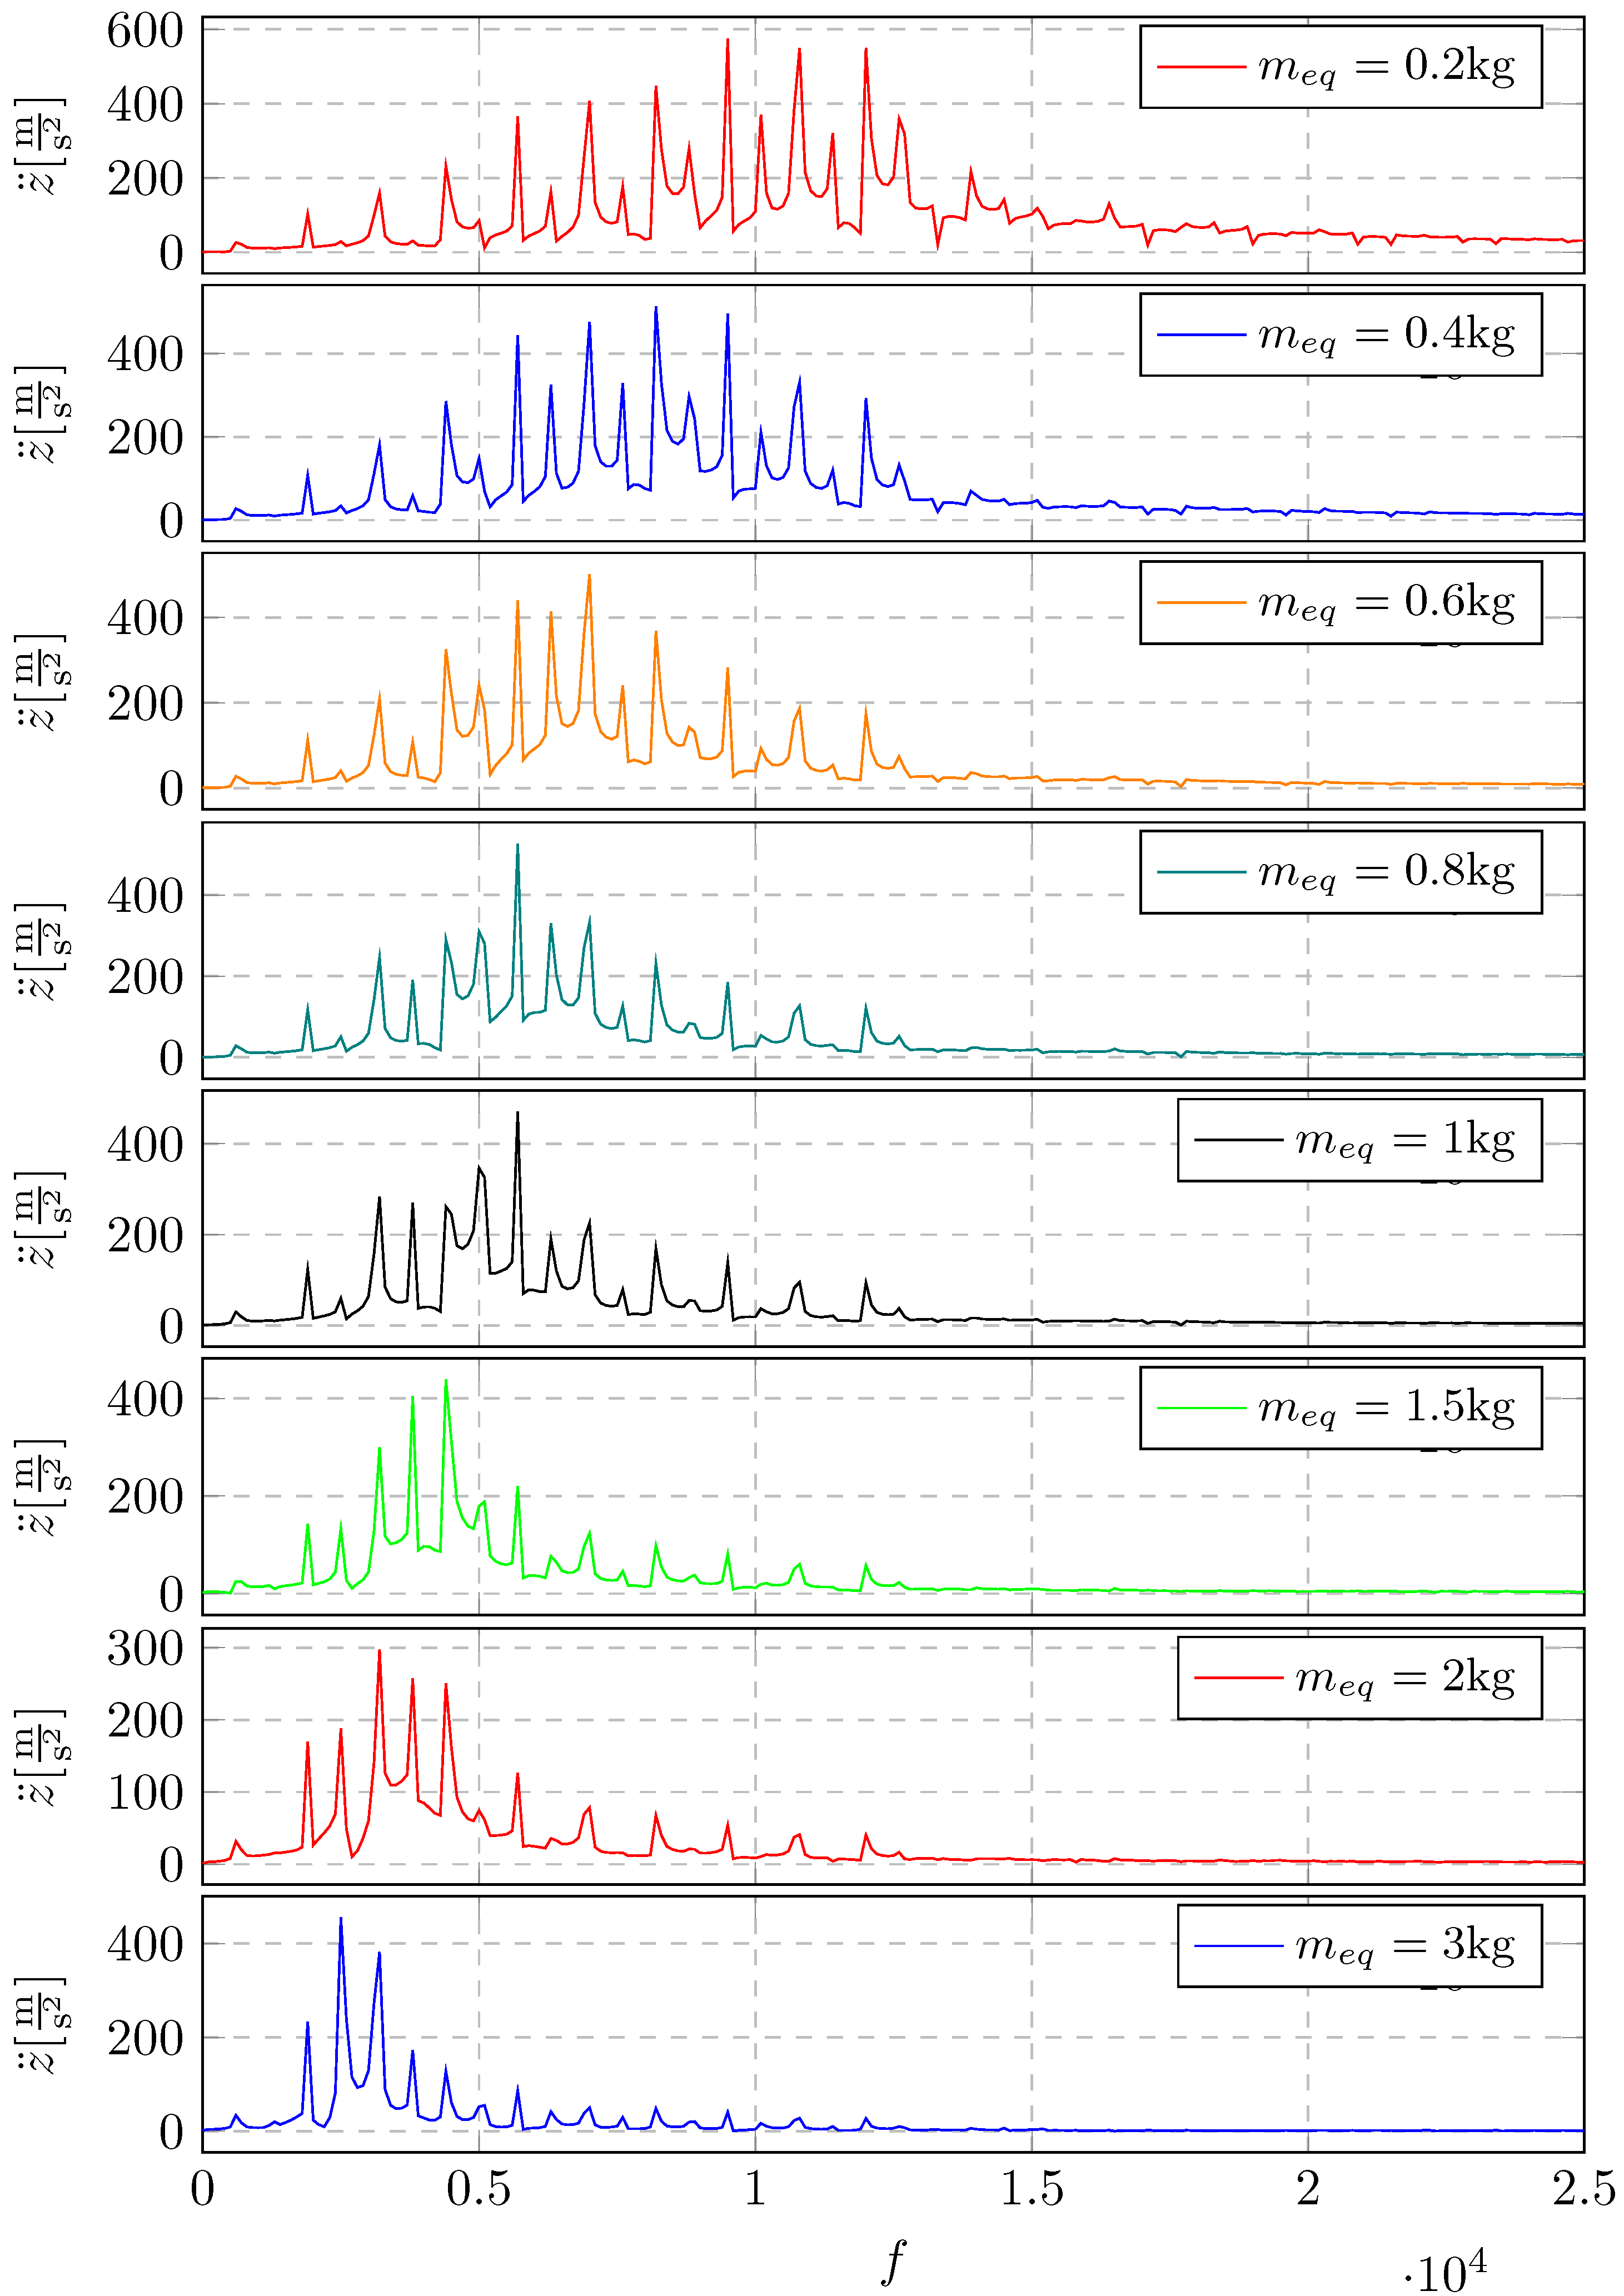
Figure 25.
Displacement of the system vibrations: the time-domain signals for different mesh damping coefficient
Figure 25.
Displacement of the system vibrations: the time-domain signals for different mesh damping coefficient
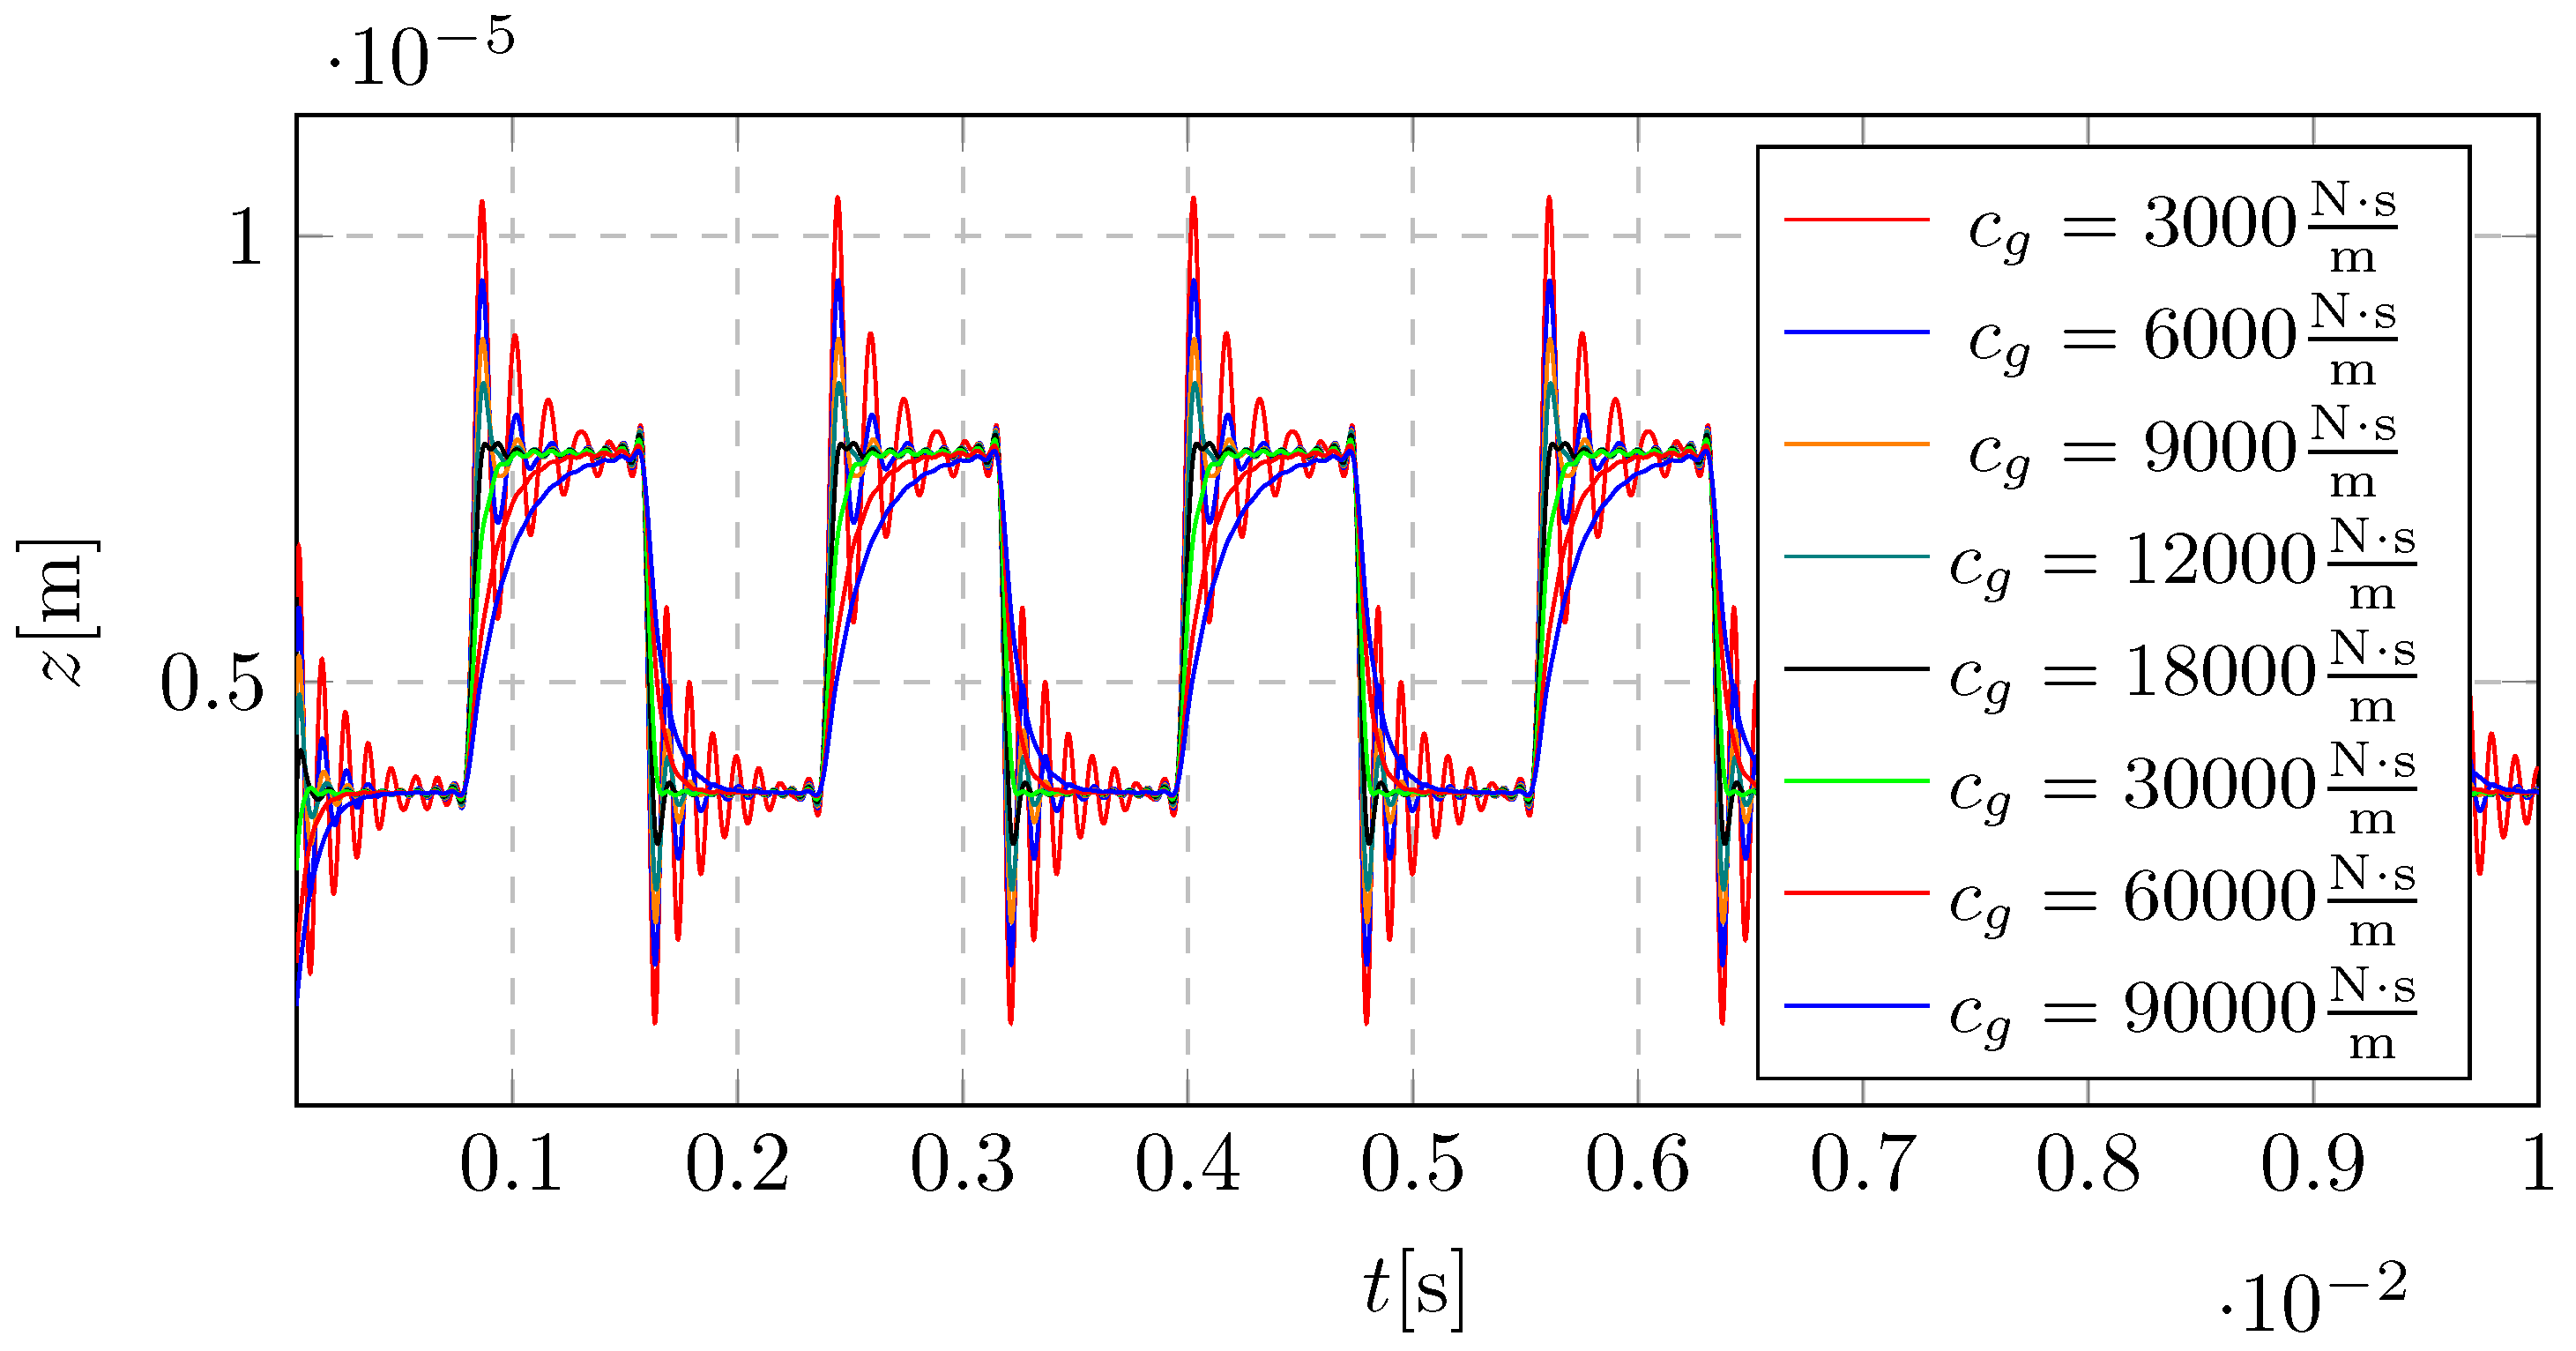
Figure 26.
Displacement of the system vibrations for different mesh damping coefficient: narrowing the time-domain (qualitative zoom of the signals in Figure 25)
Figure 26.
Displacement of the system vibrations for different mesh damping coefficient: narrowing the time-domain (qualitative zoom of the signals in Figure 25)
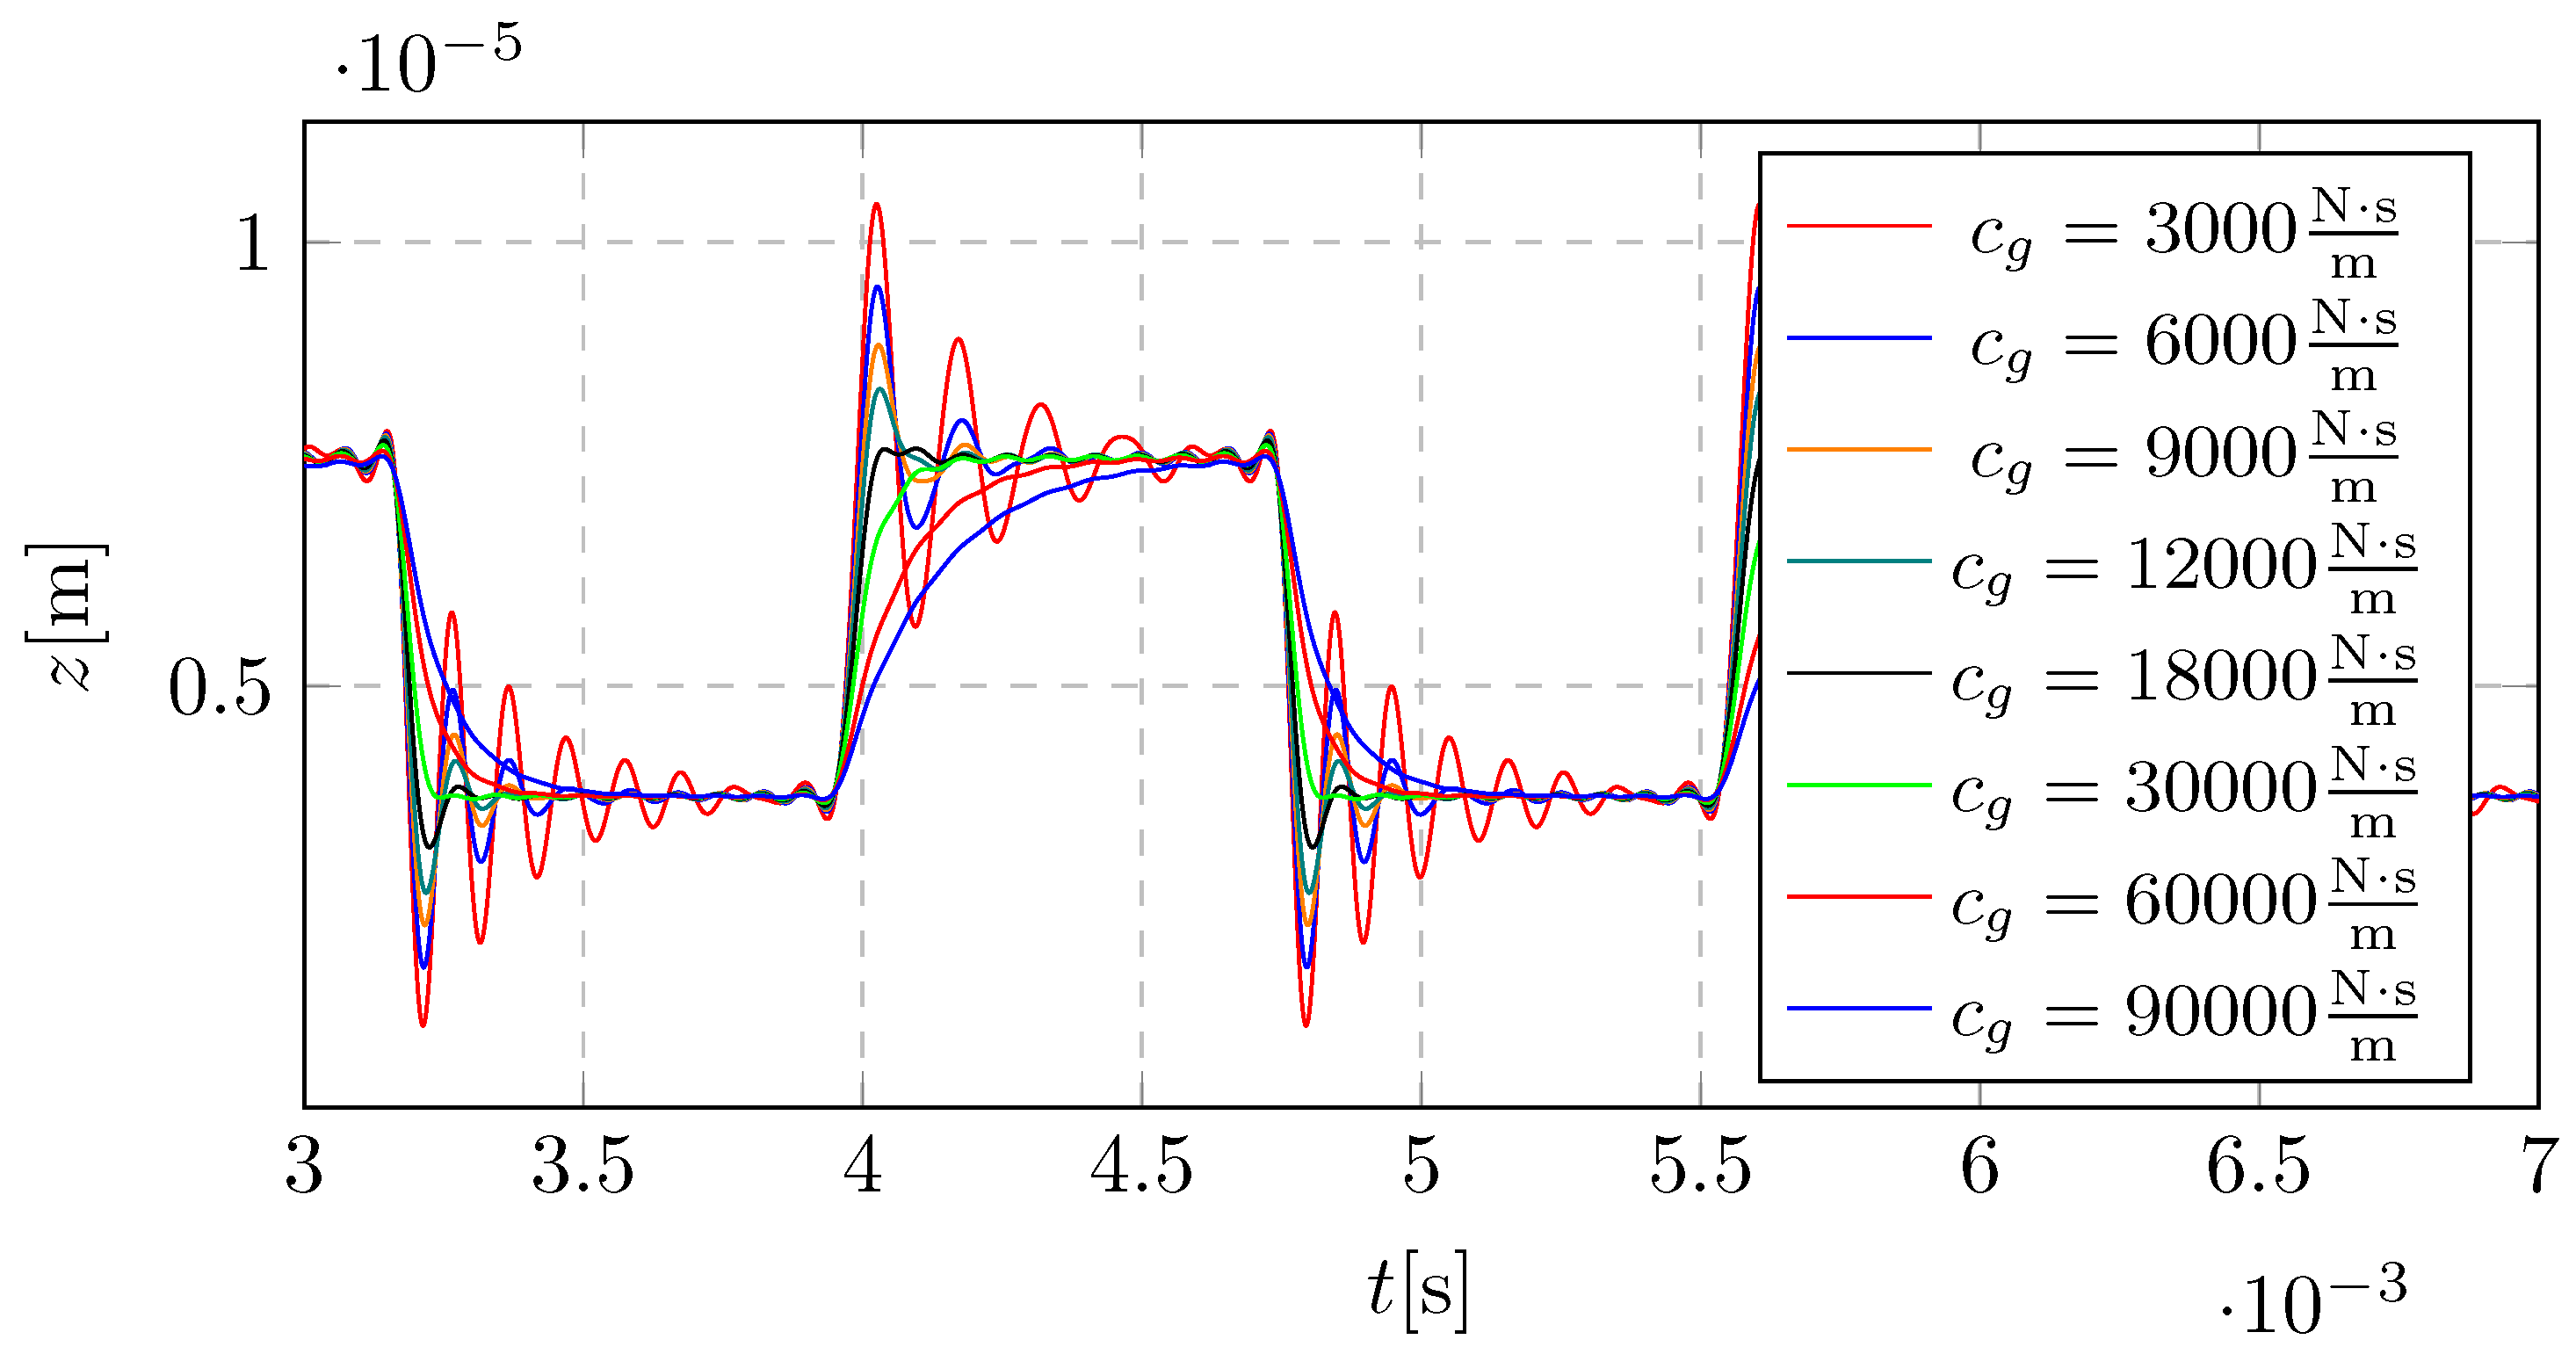
Figure 27.
Displacement of the system vibrations for different mesh damping coefficient: separate time-domain signals based on Figure 25
Figure 27.
Displacement of the system vibrations for different mesh damping coefficient: separate time-domain signals based on Figure 25
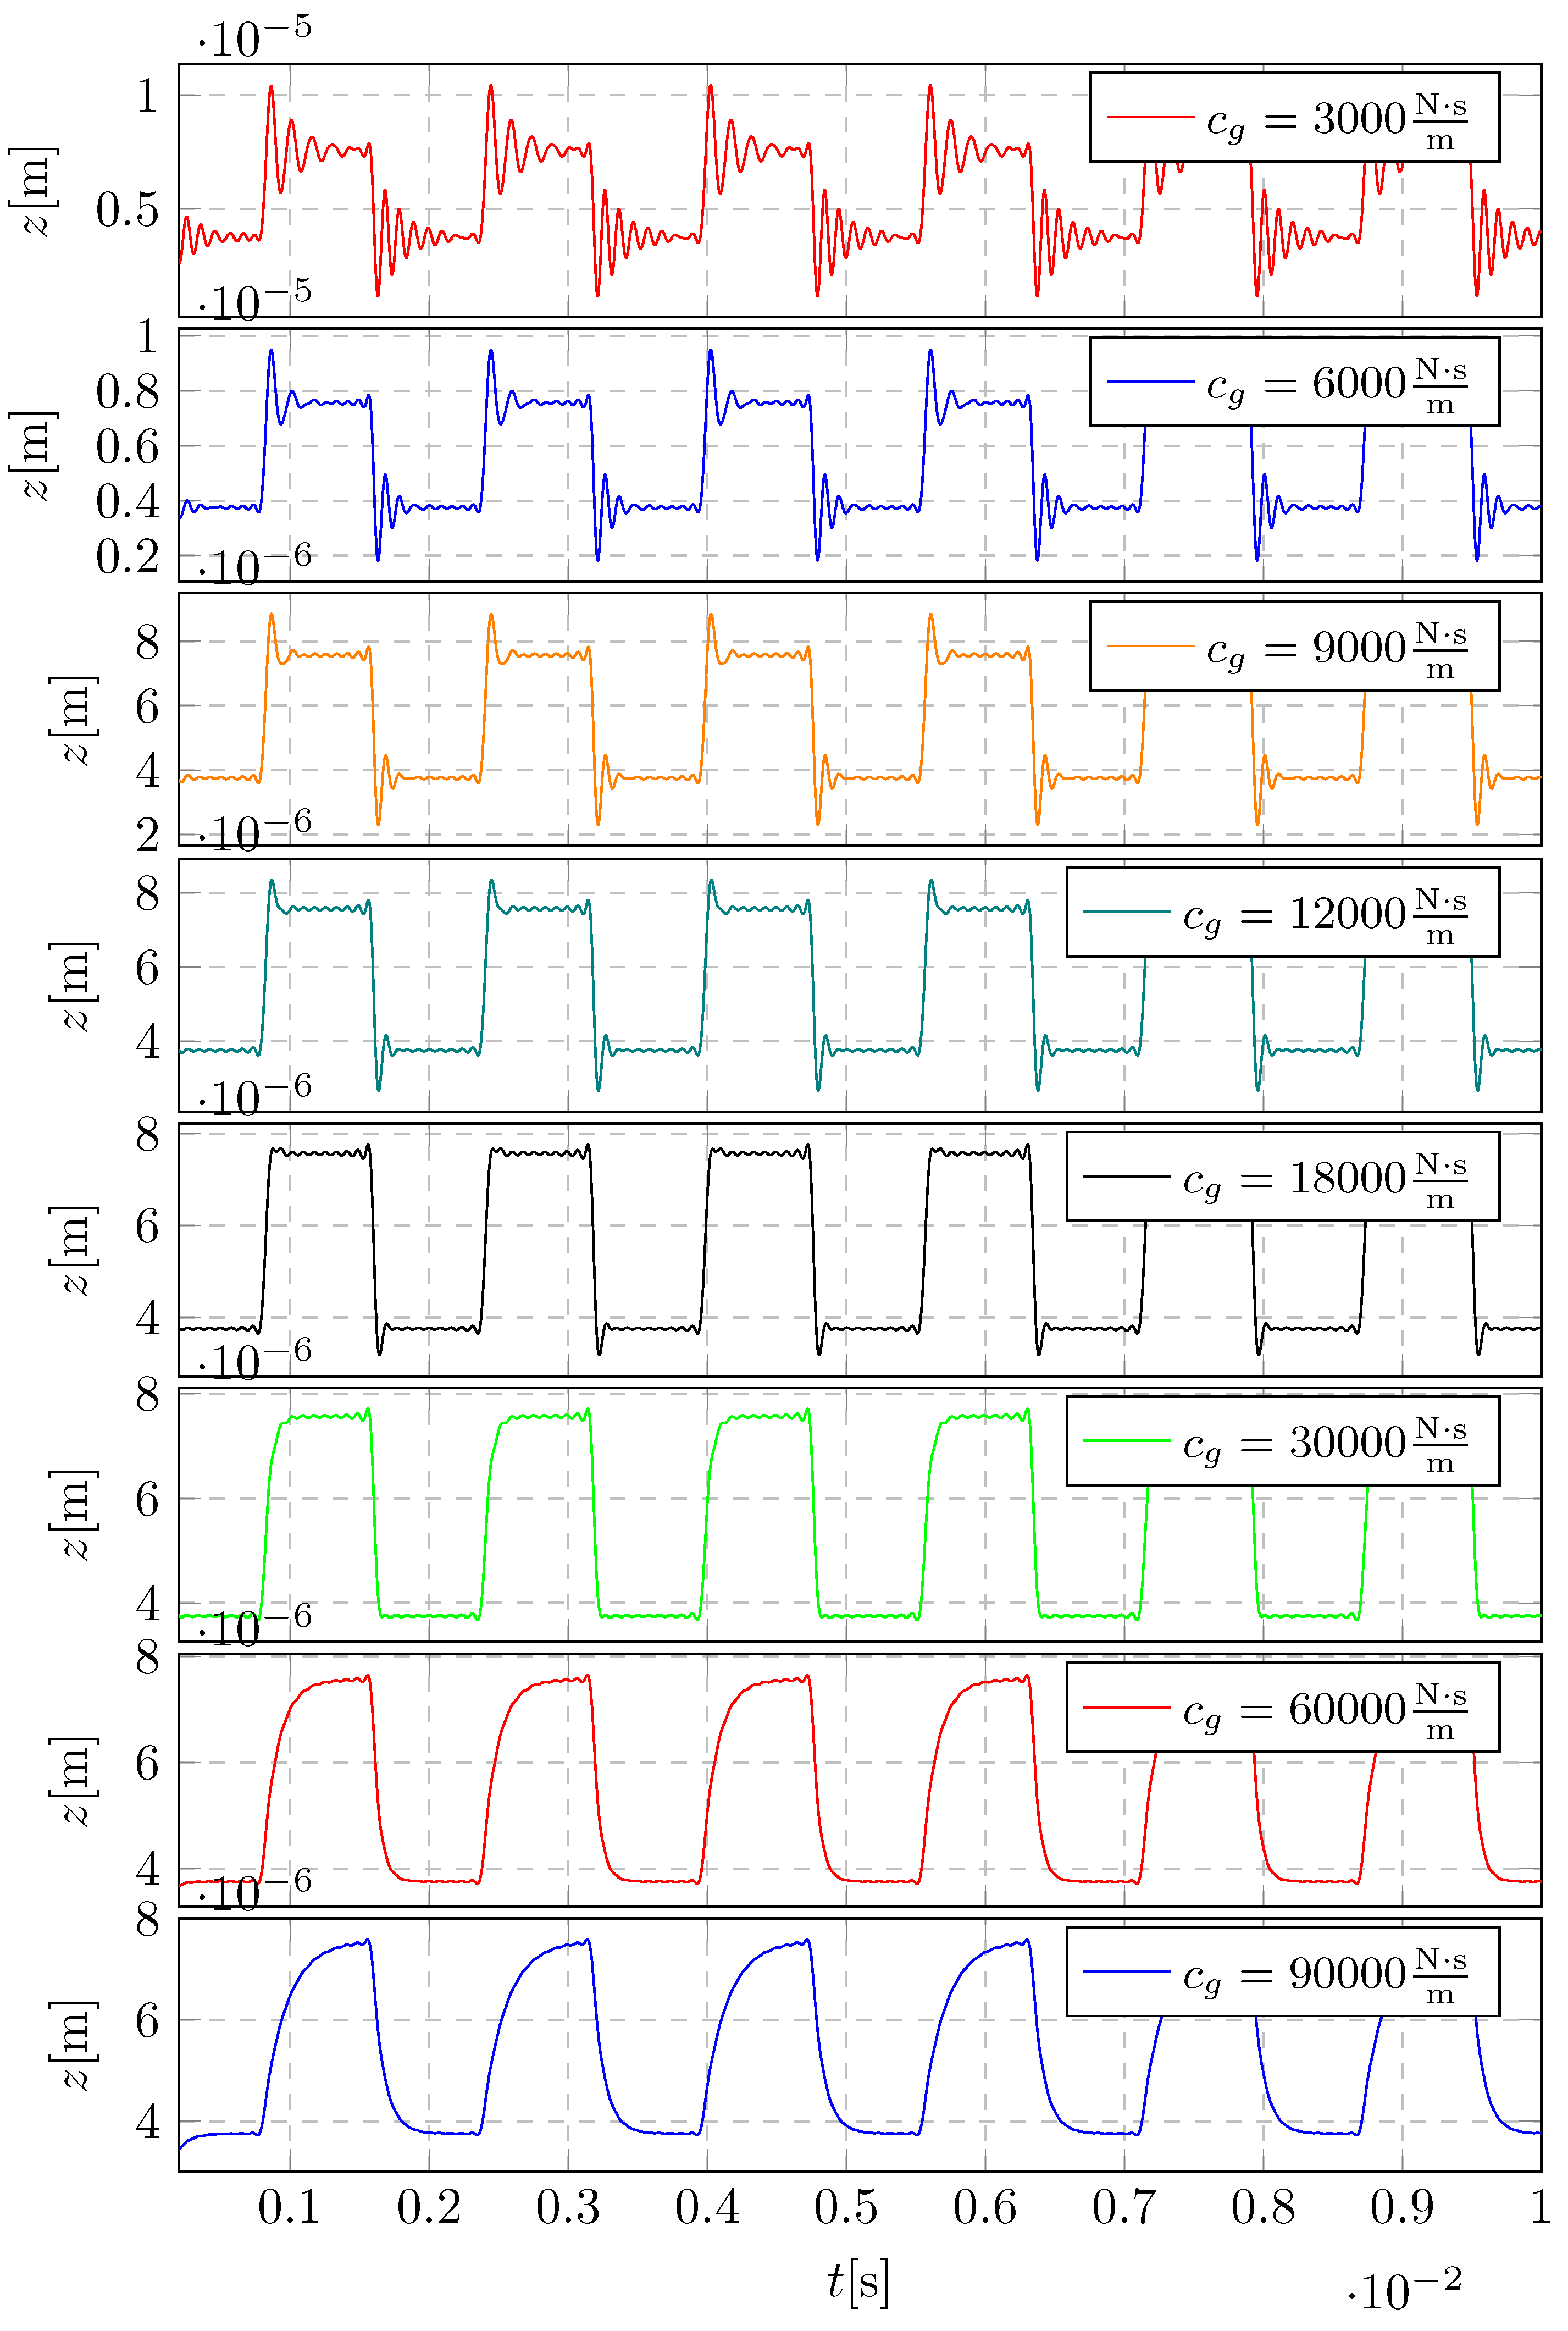
Figure 28.
Acceleration of the system vibrations: the frequency-domain signals for different mesh damping coefficient
Figure 28.
Acceleration of the system vibrations: the frequency-domain signals for different mesh damping coefficient
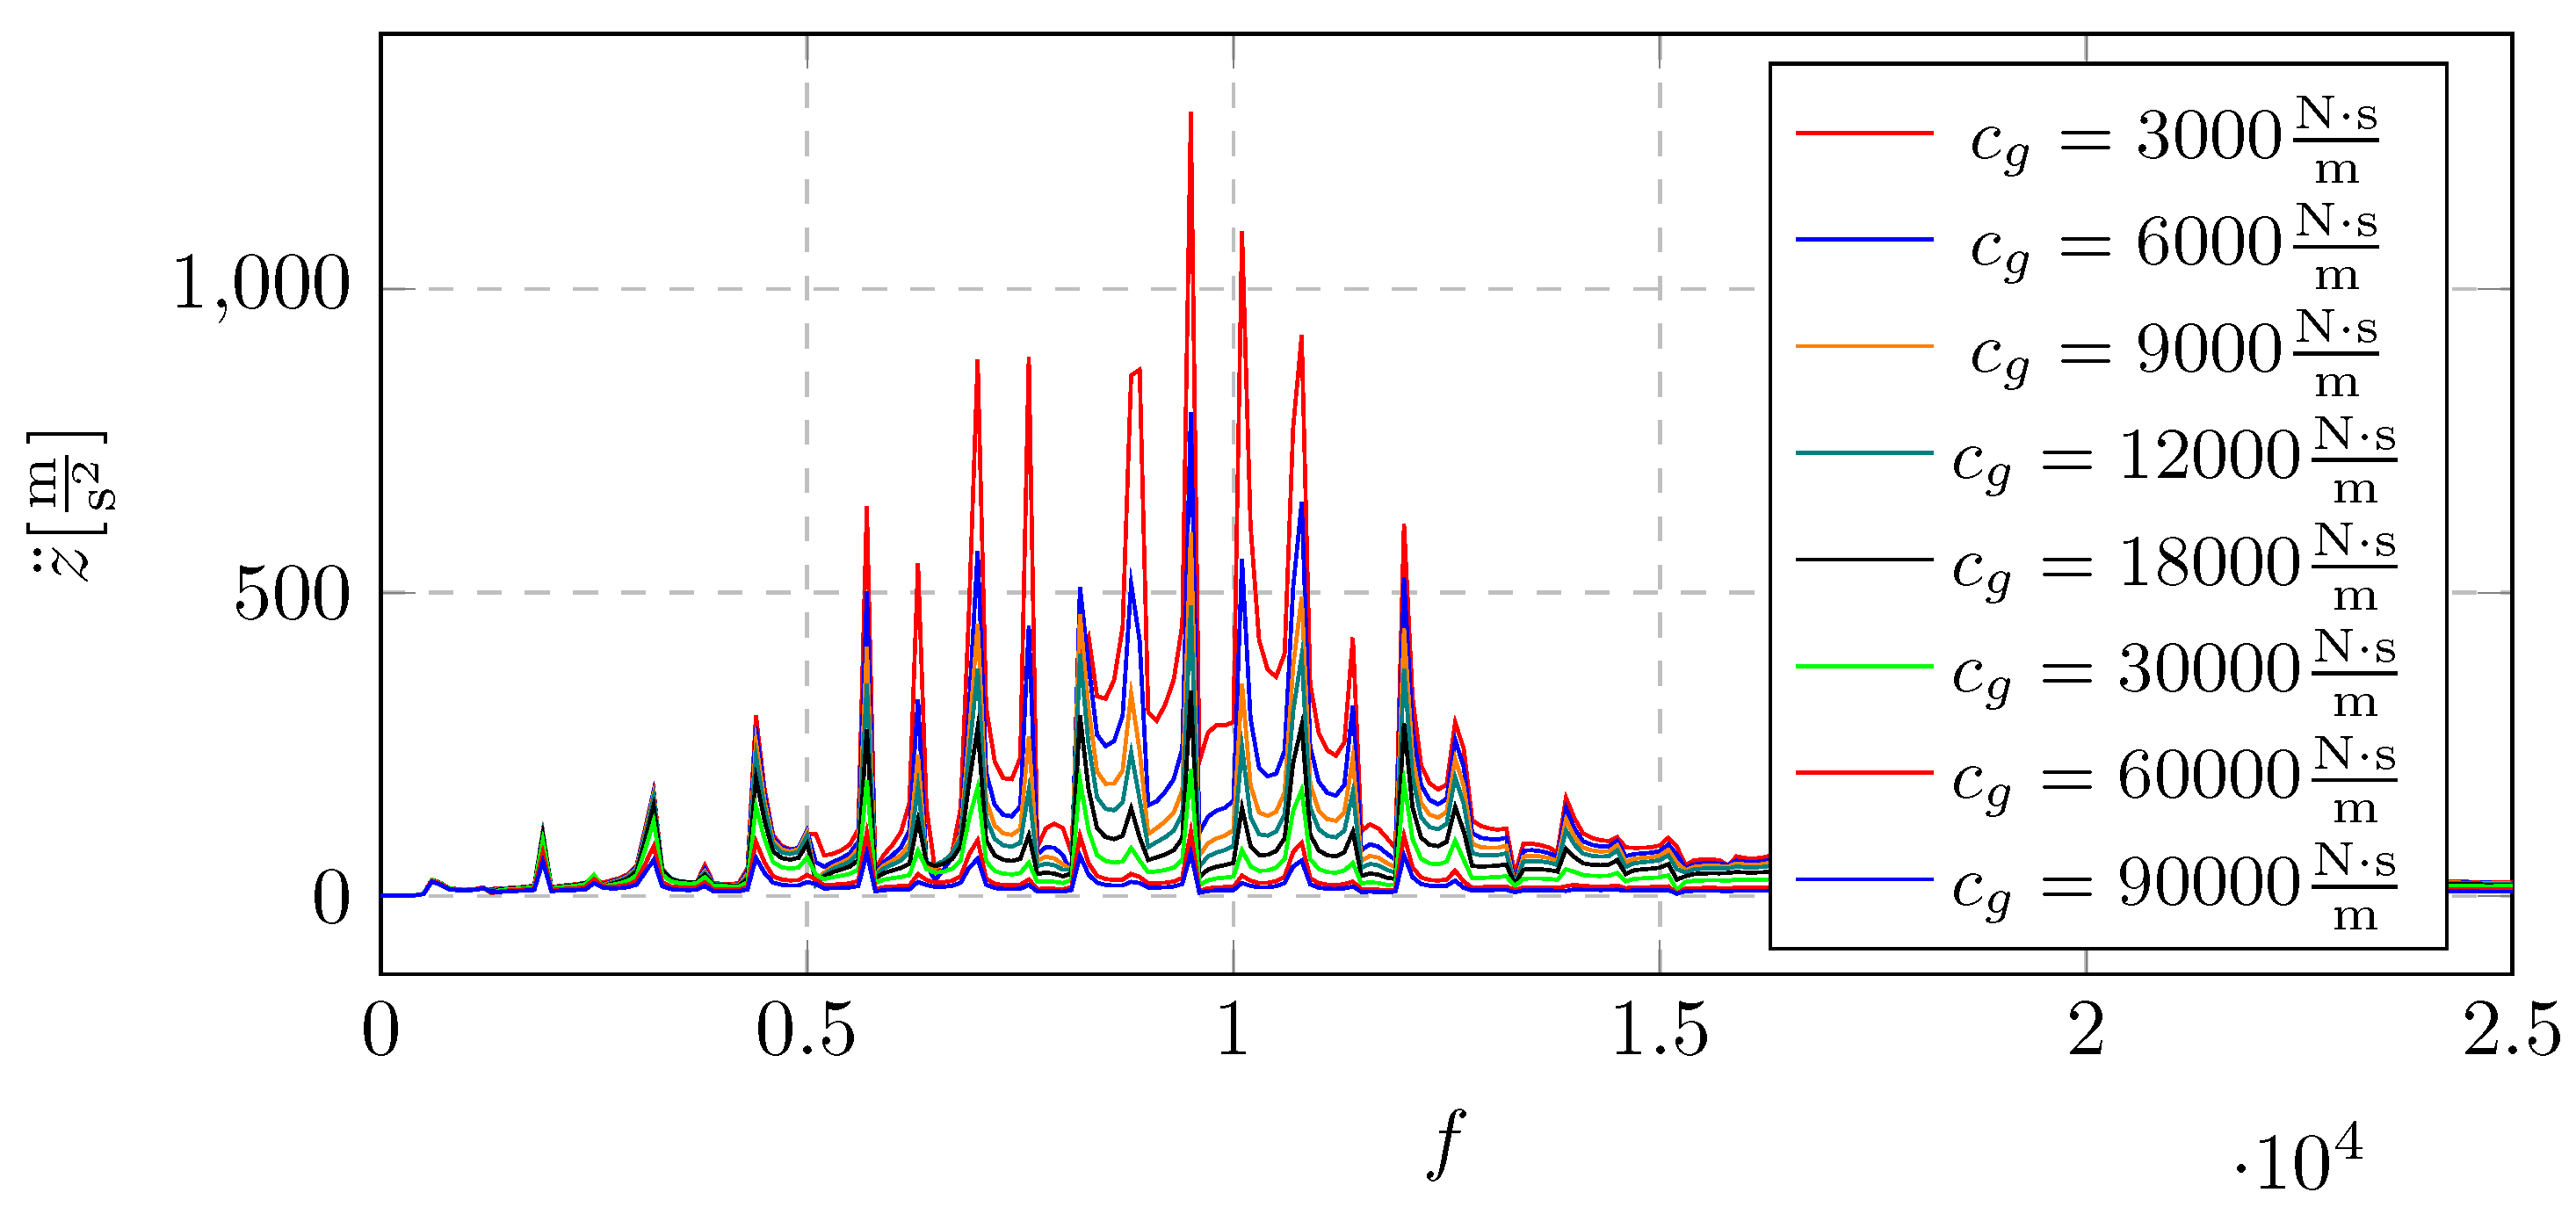
Figure 29.
Acceleration of the system vibrations for different mesh damping coefficient: separate frequency-domain signals based on Figure 28
Figure 29.
Acceleration of the system vibrations for different mesh damping coefficient: separate frequency-domain signals based on Figure 28
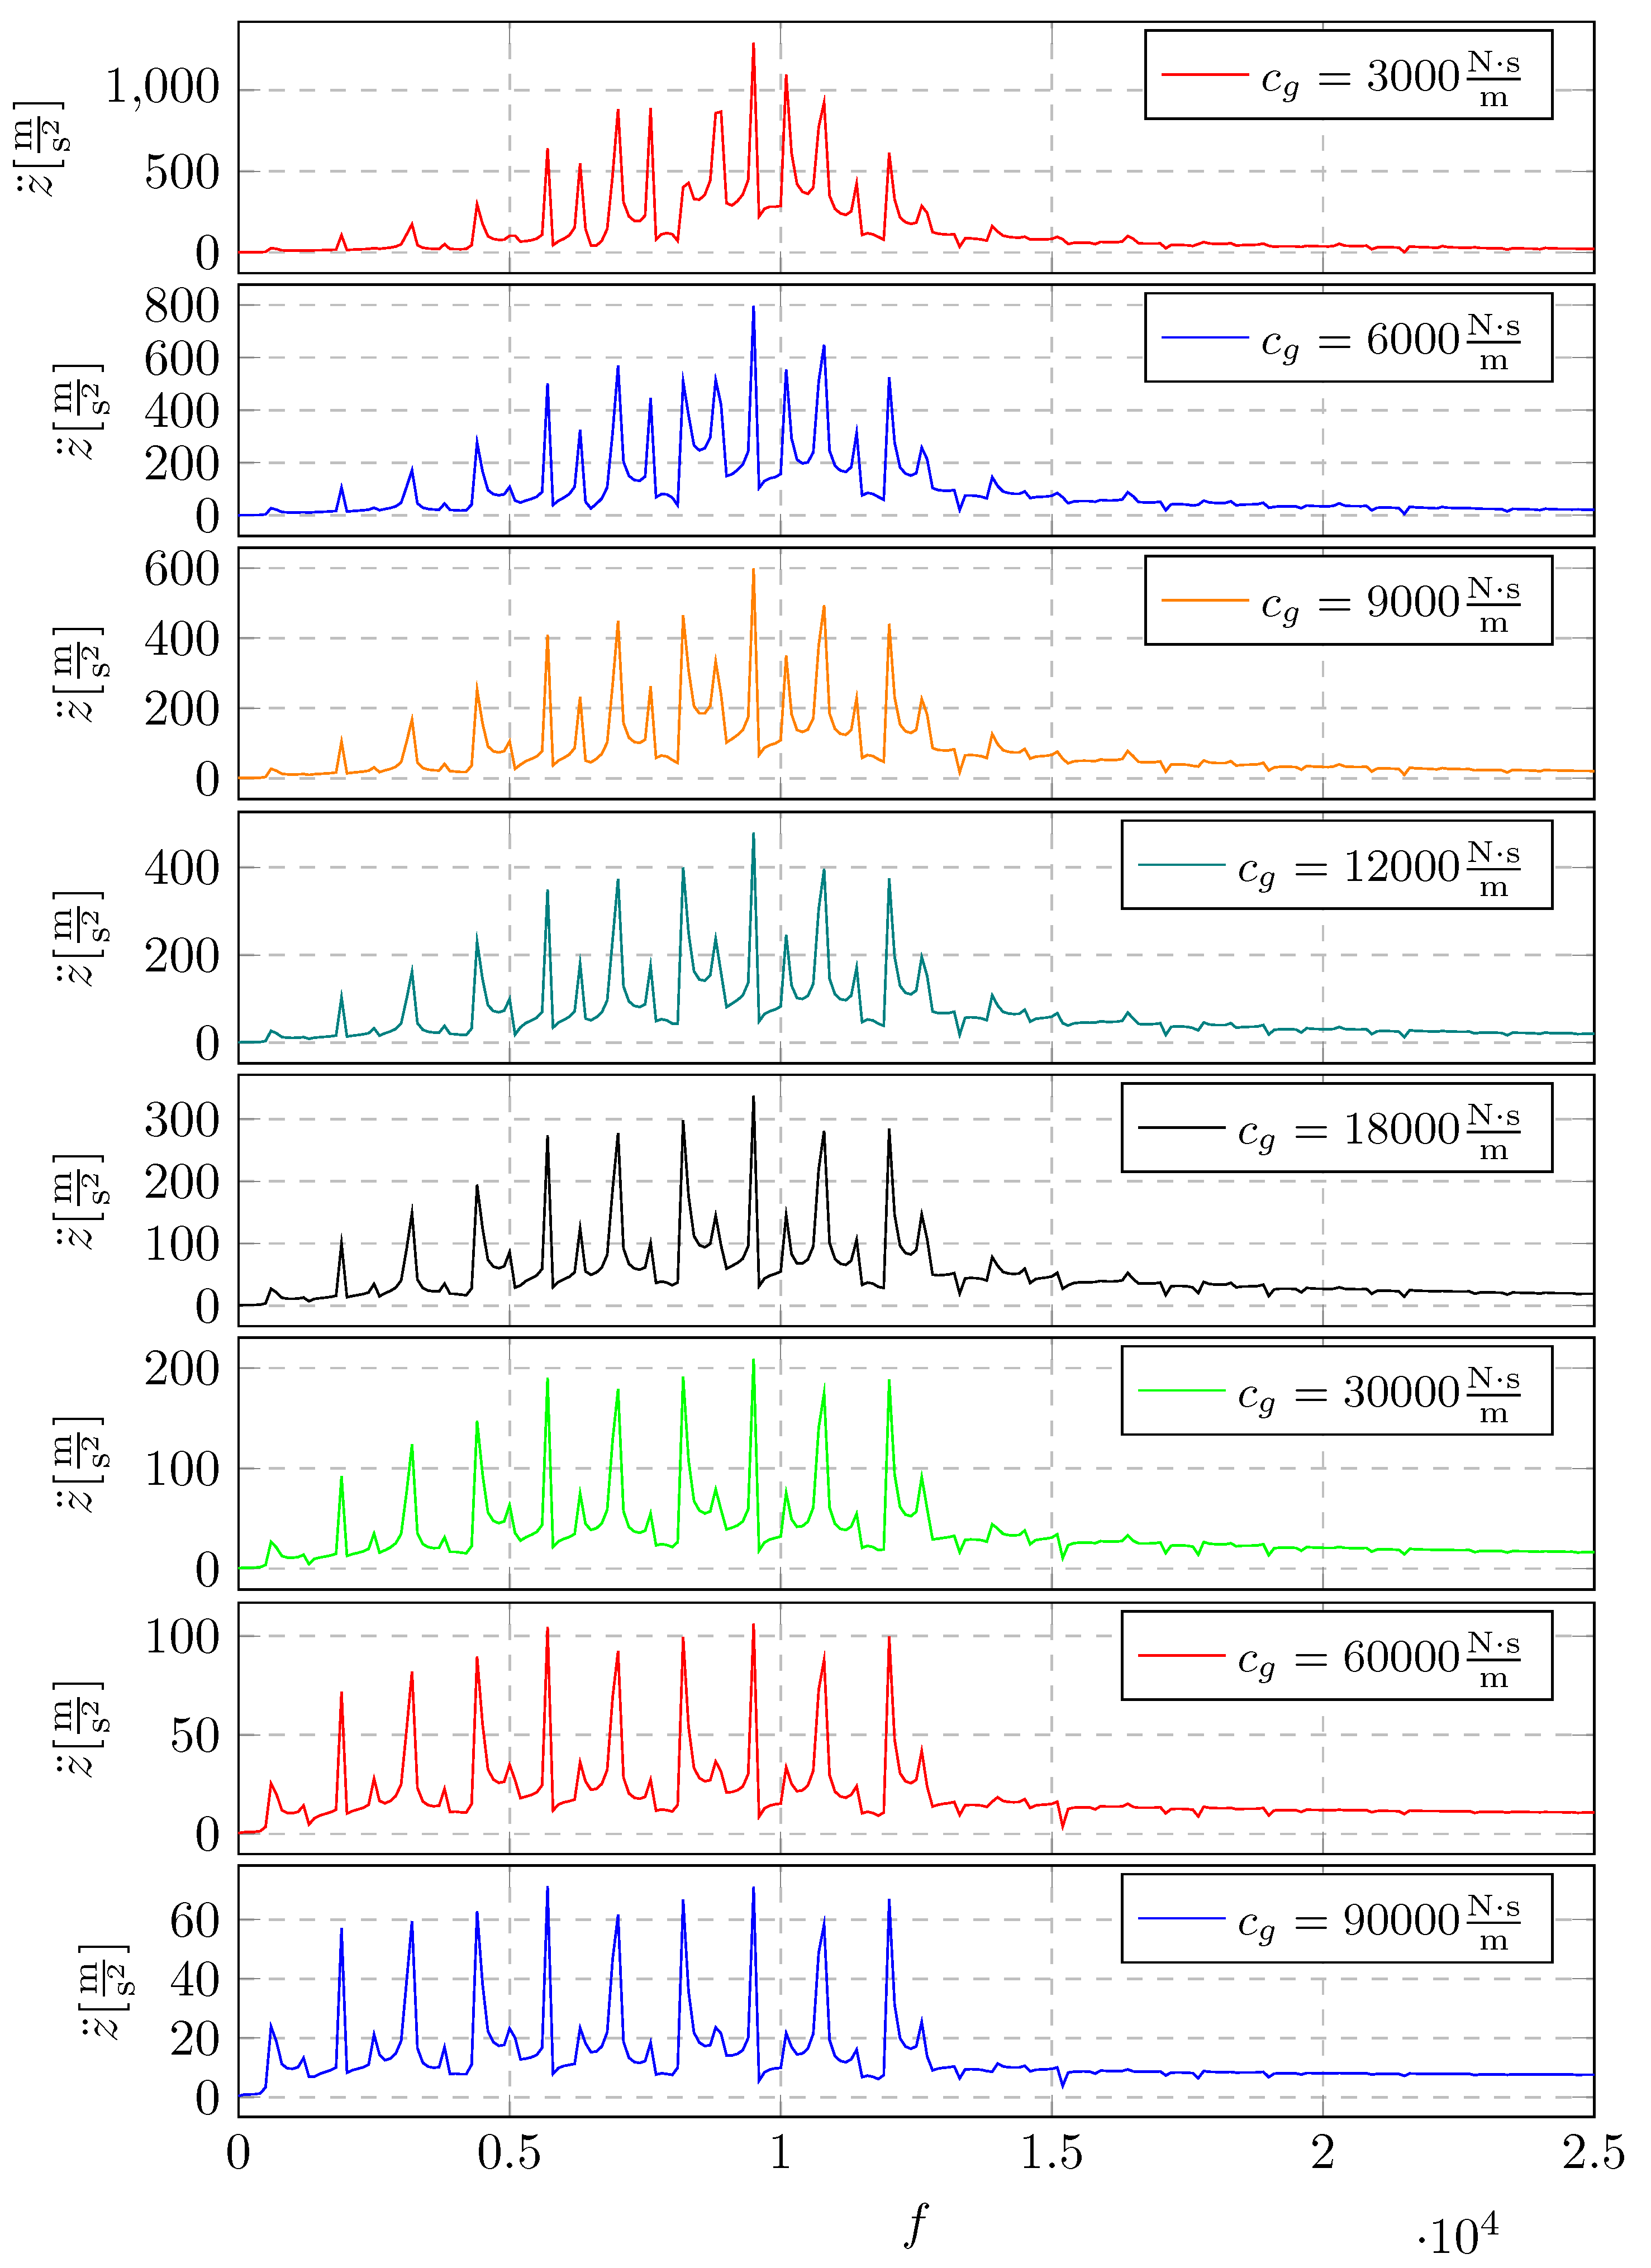
Figure 30.
Energy generated by displacement vibrational signal in the frequency domain for different mesh stiffness
Figure 30.
Energy generated by displacement vibrational signal in the frequency domain for different mesh stiffness
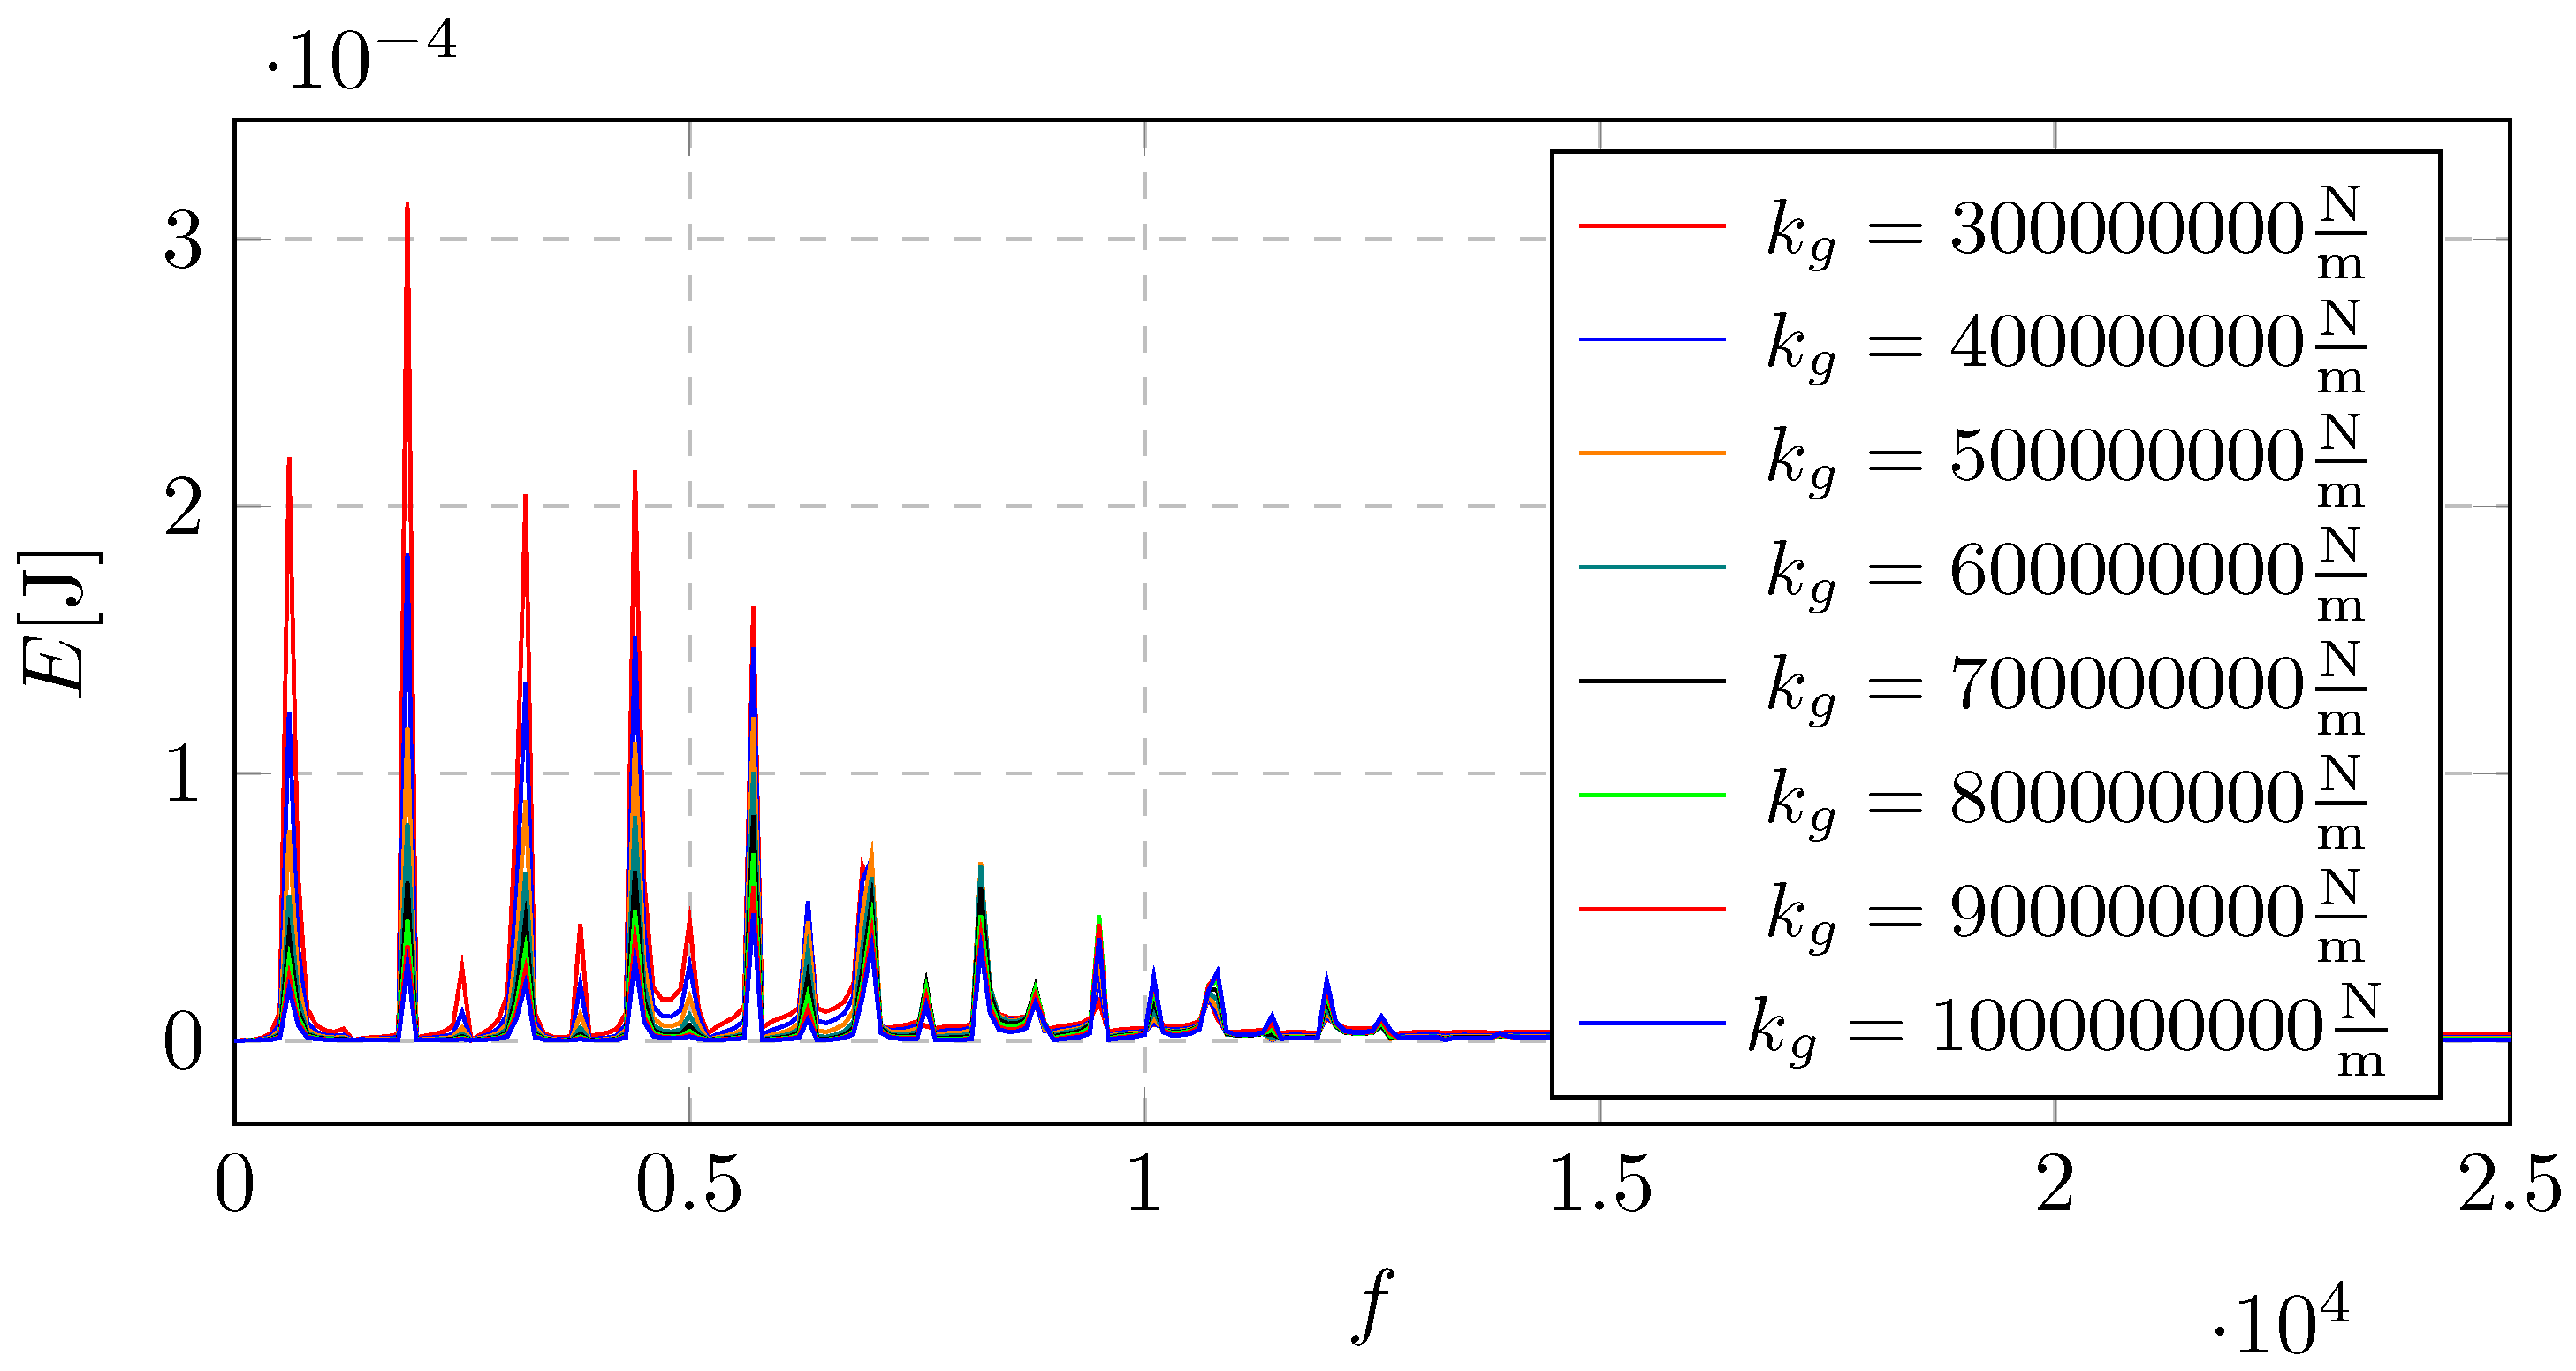
Figure 31.
Energy generated by displacement vibrational signal in the frequency domain for different mesh stiffness - separated view based on Figure 30
Figure 31.
Energy generated by displacement vibrational signal in the frequency domain for different mesh stiffness - separated view based on Figure 30
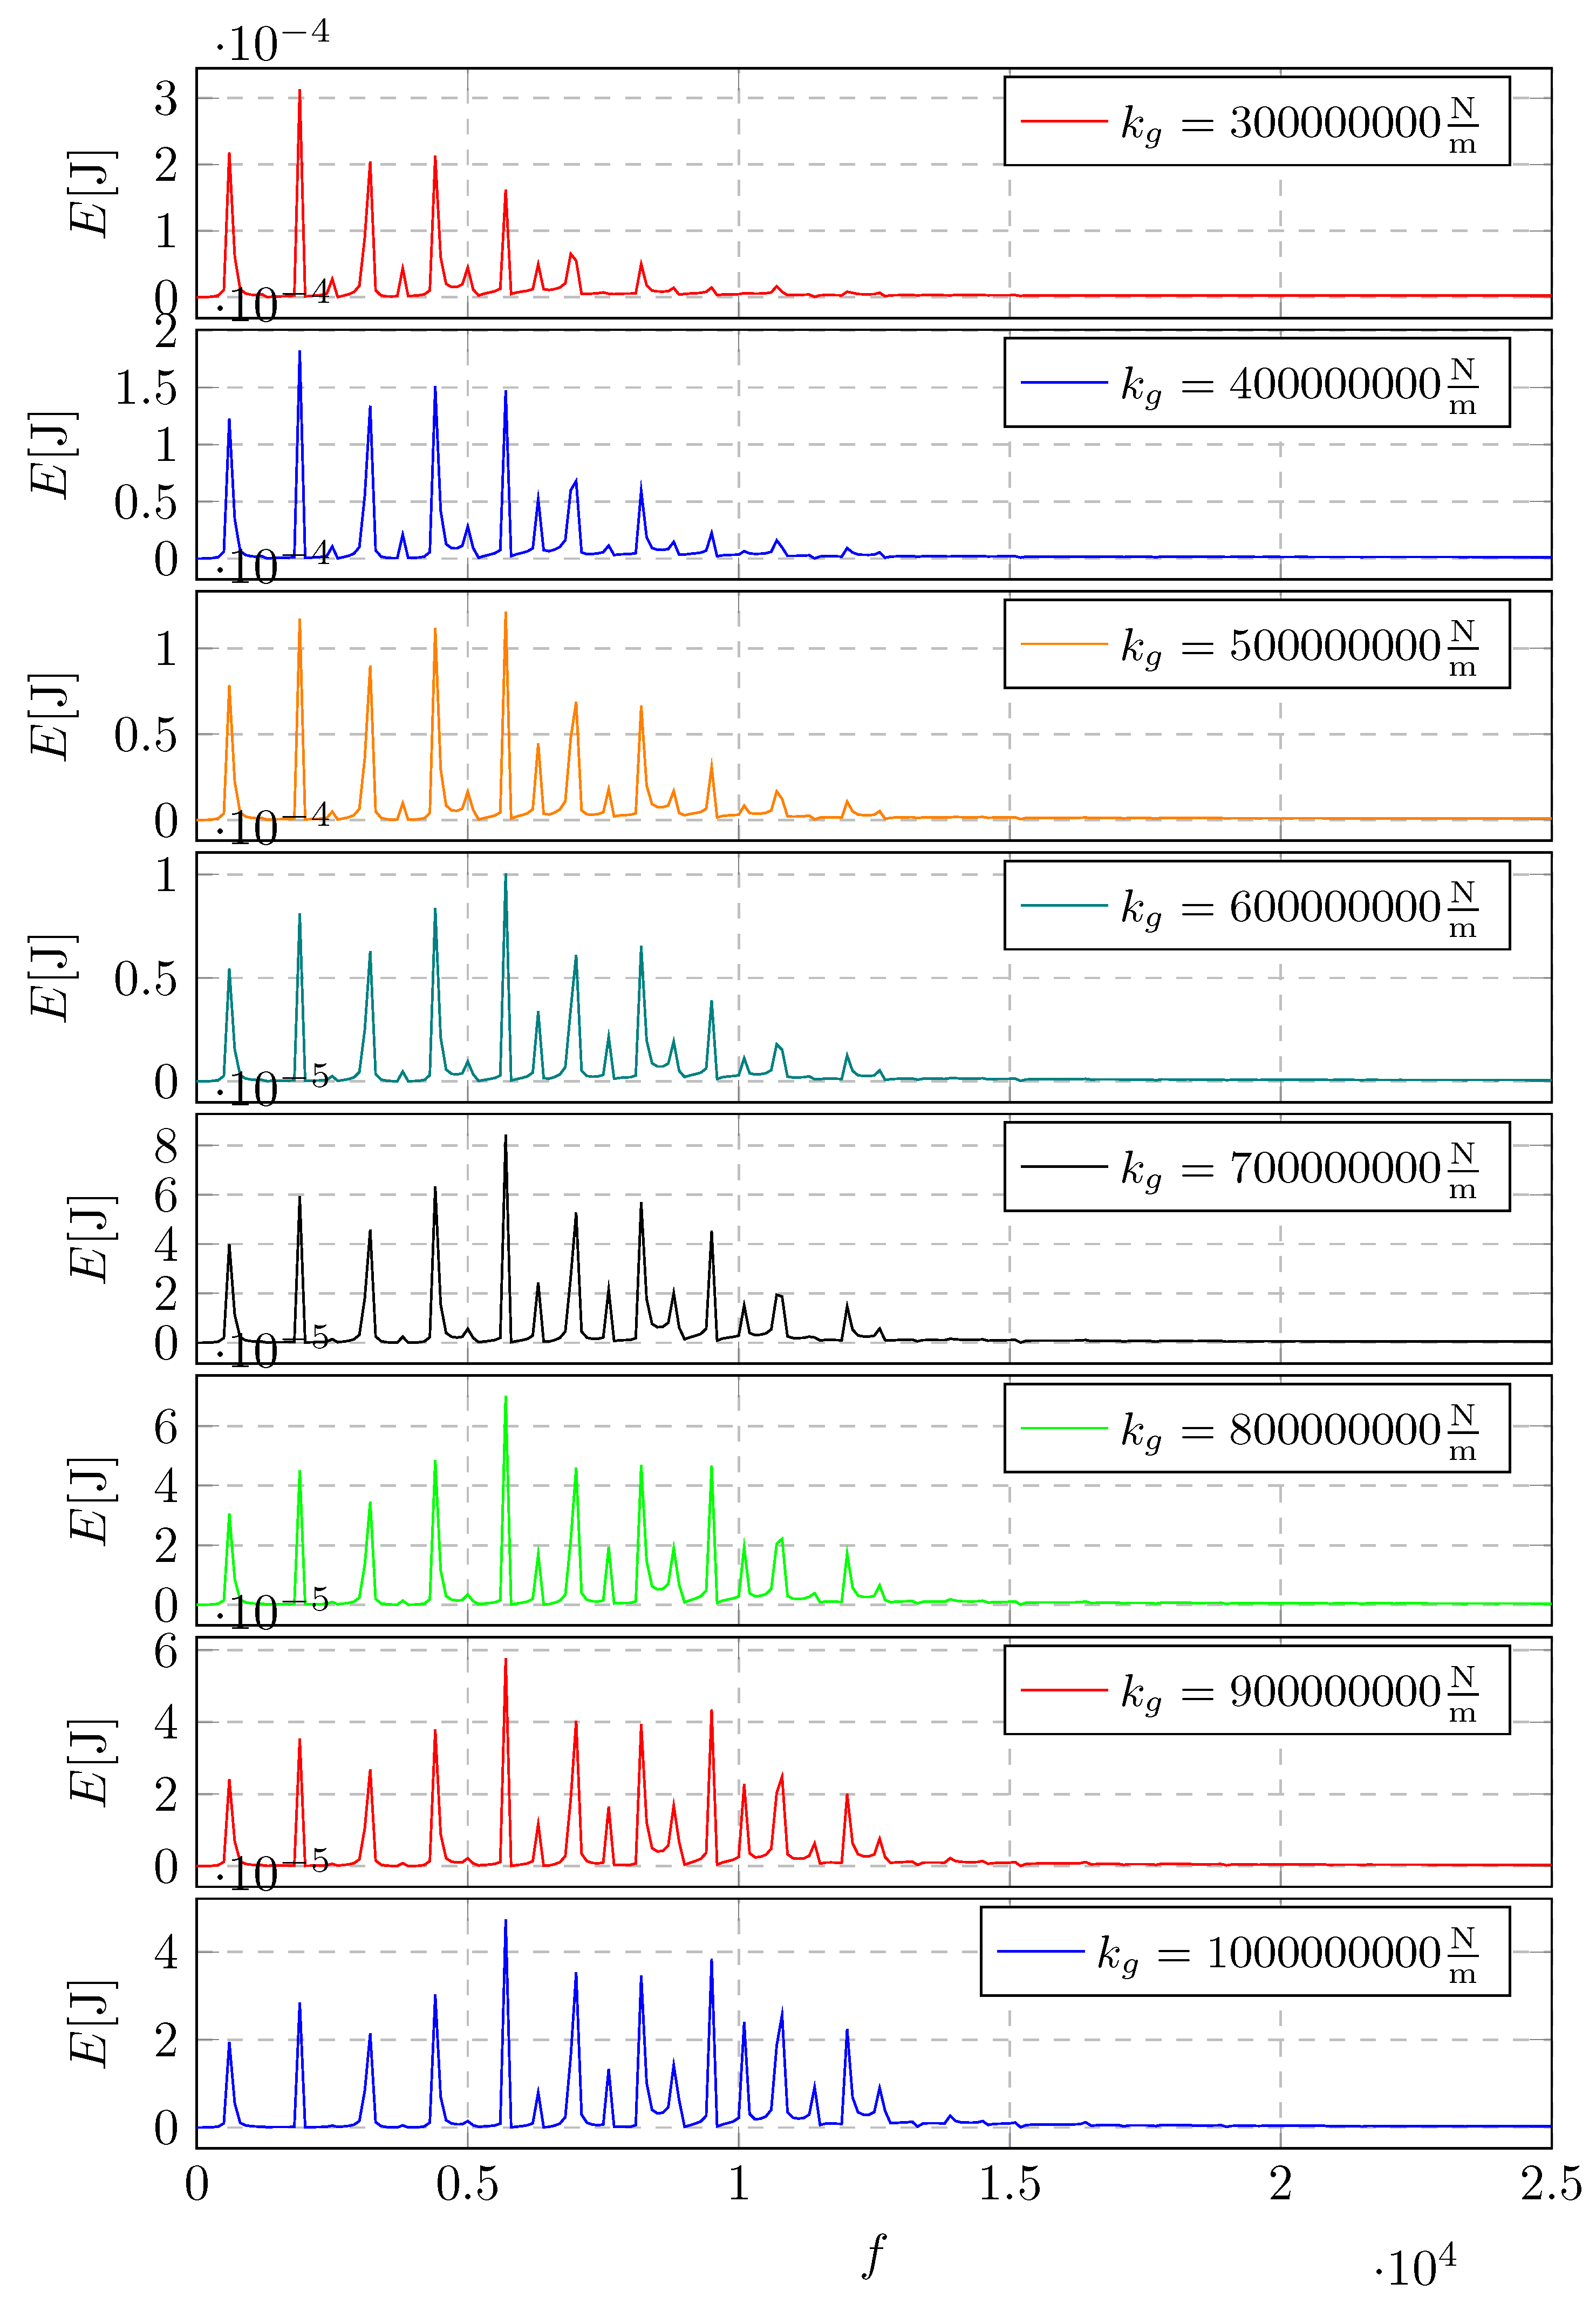
Figure 32.
Energy generated by displacement vibrational signal in the frequency domain for different equivalent mass
Figure 32.
Energy generated by displacement vibrational signal in the frequency domain for different equivalent mass
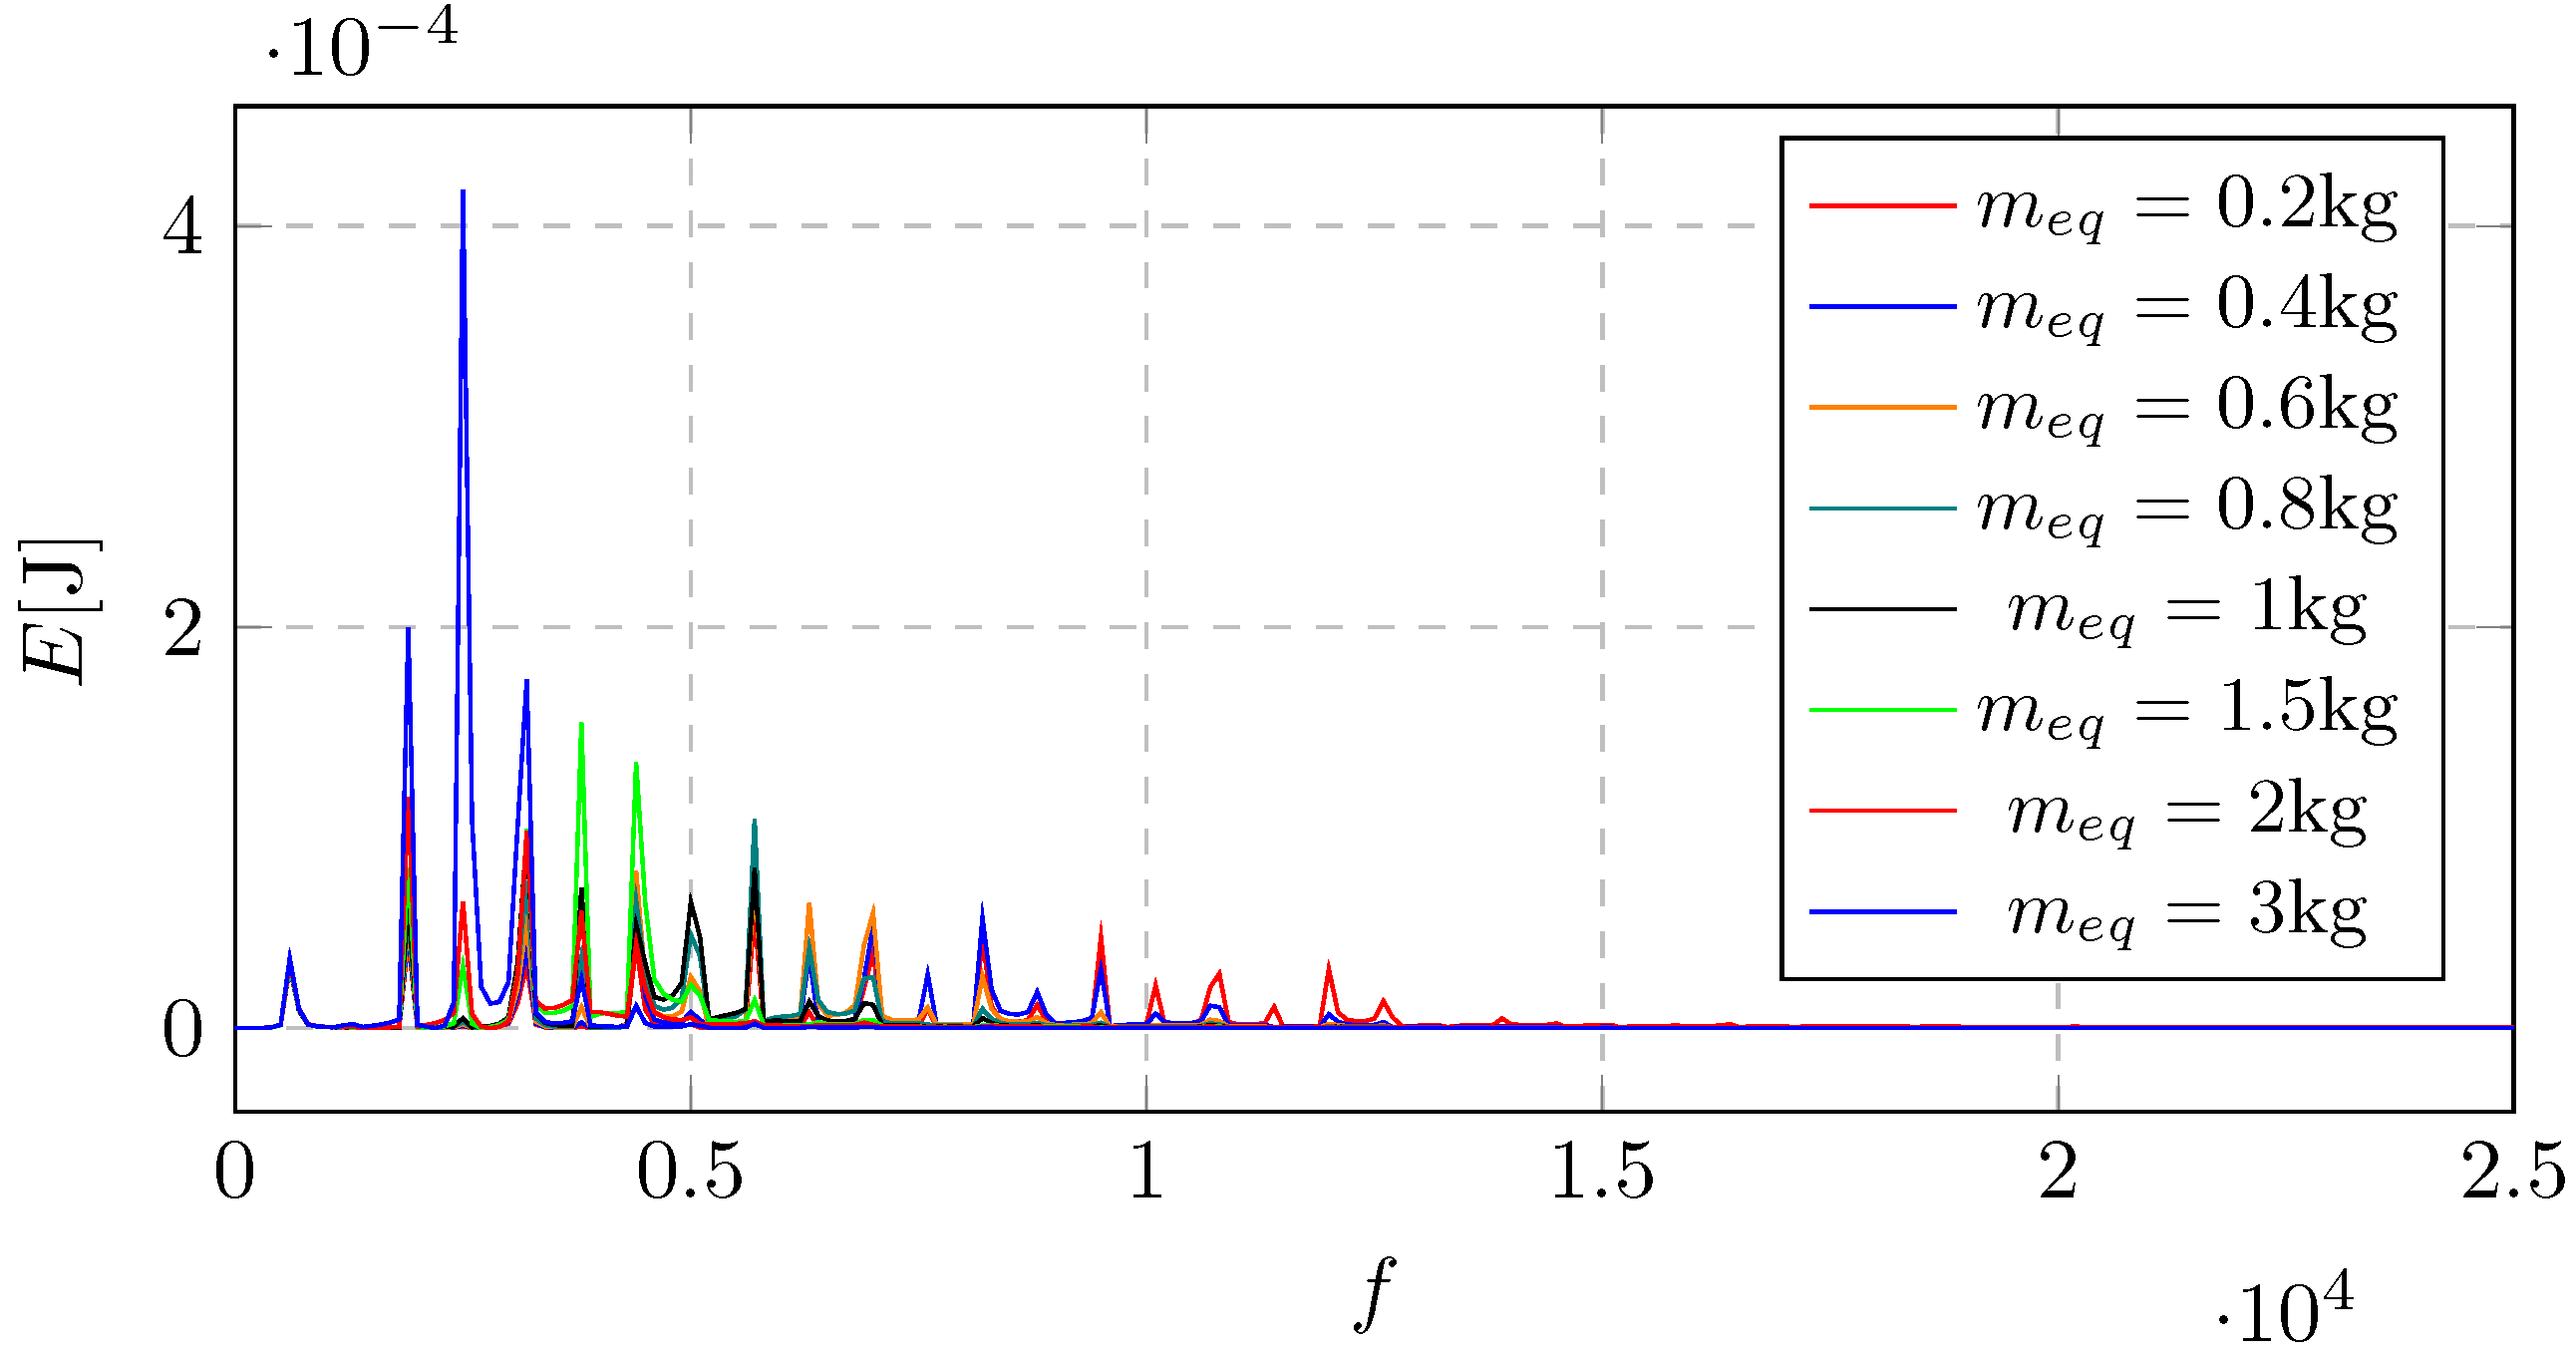
Figure 33.
Energy generated by displacement vibrational signal in the frequency domain for different equivalent mass - separated view based on Figure 32
Figure 33.
Energy generated by displacement vibrational signal in the frequency domain for different equivalent mass - separated view based on Figure 32
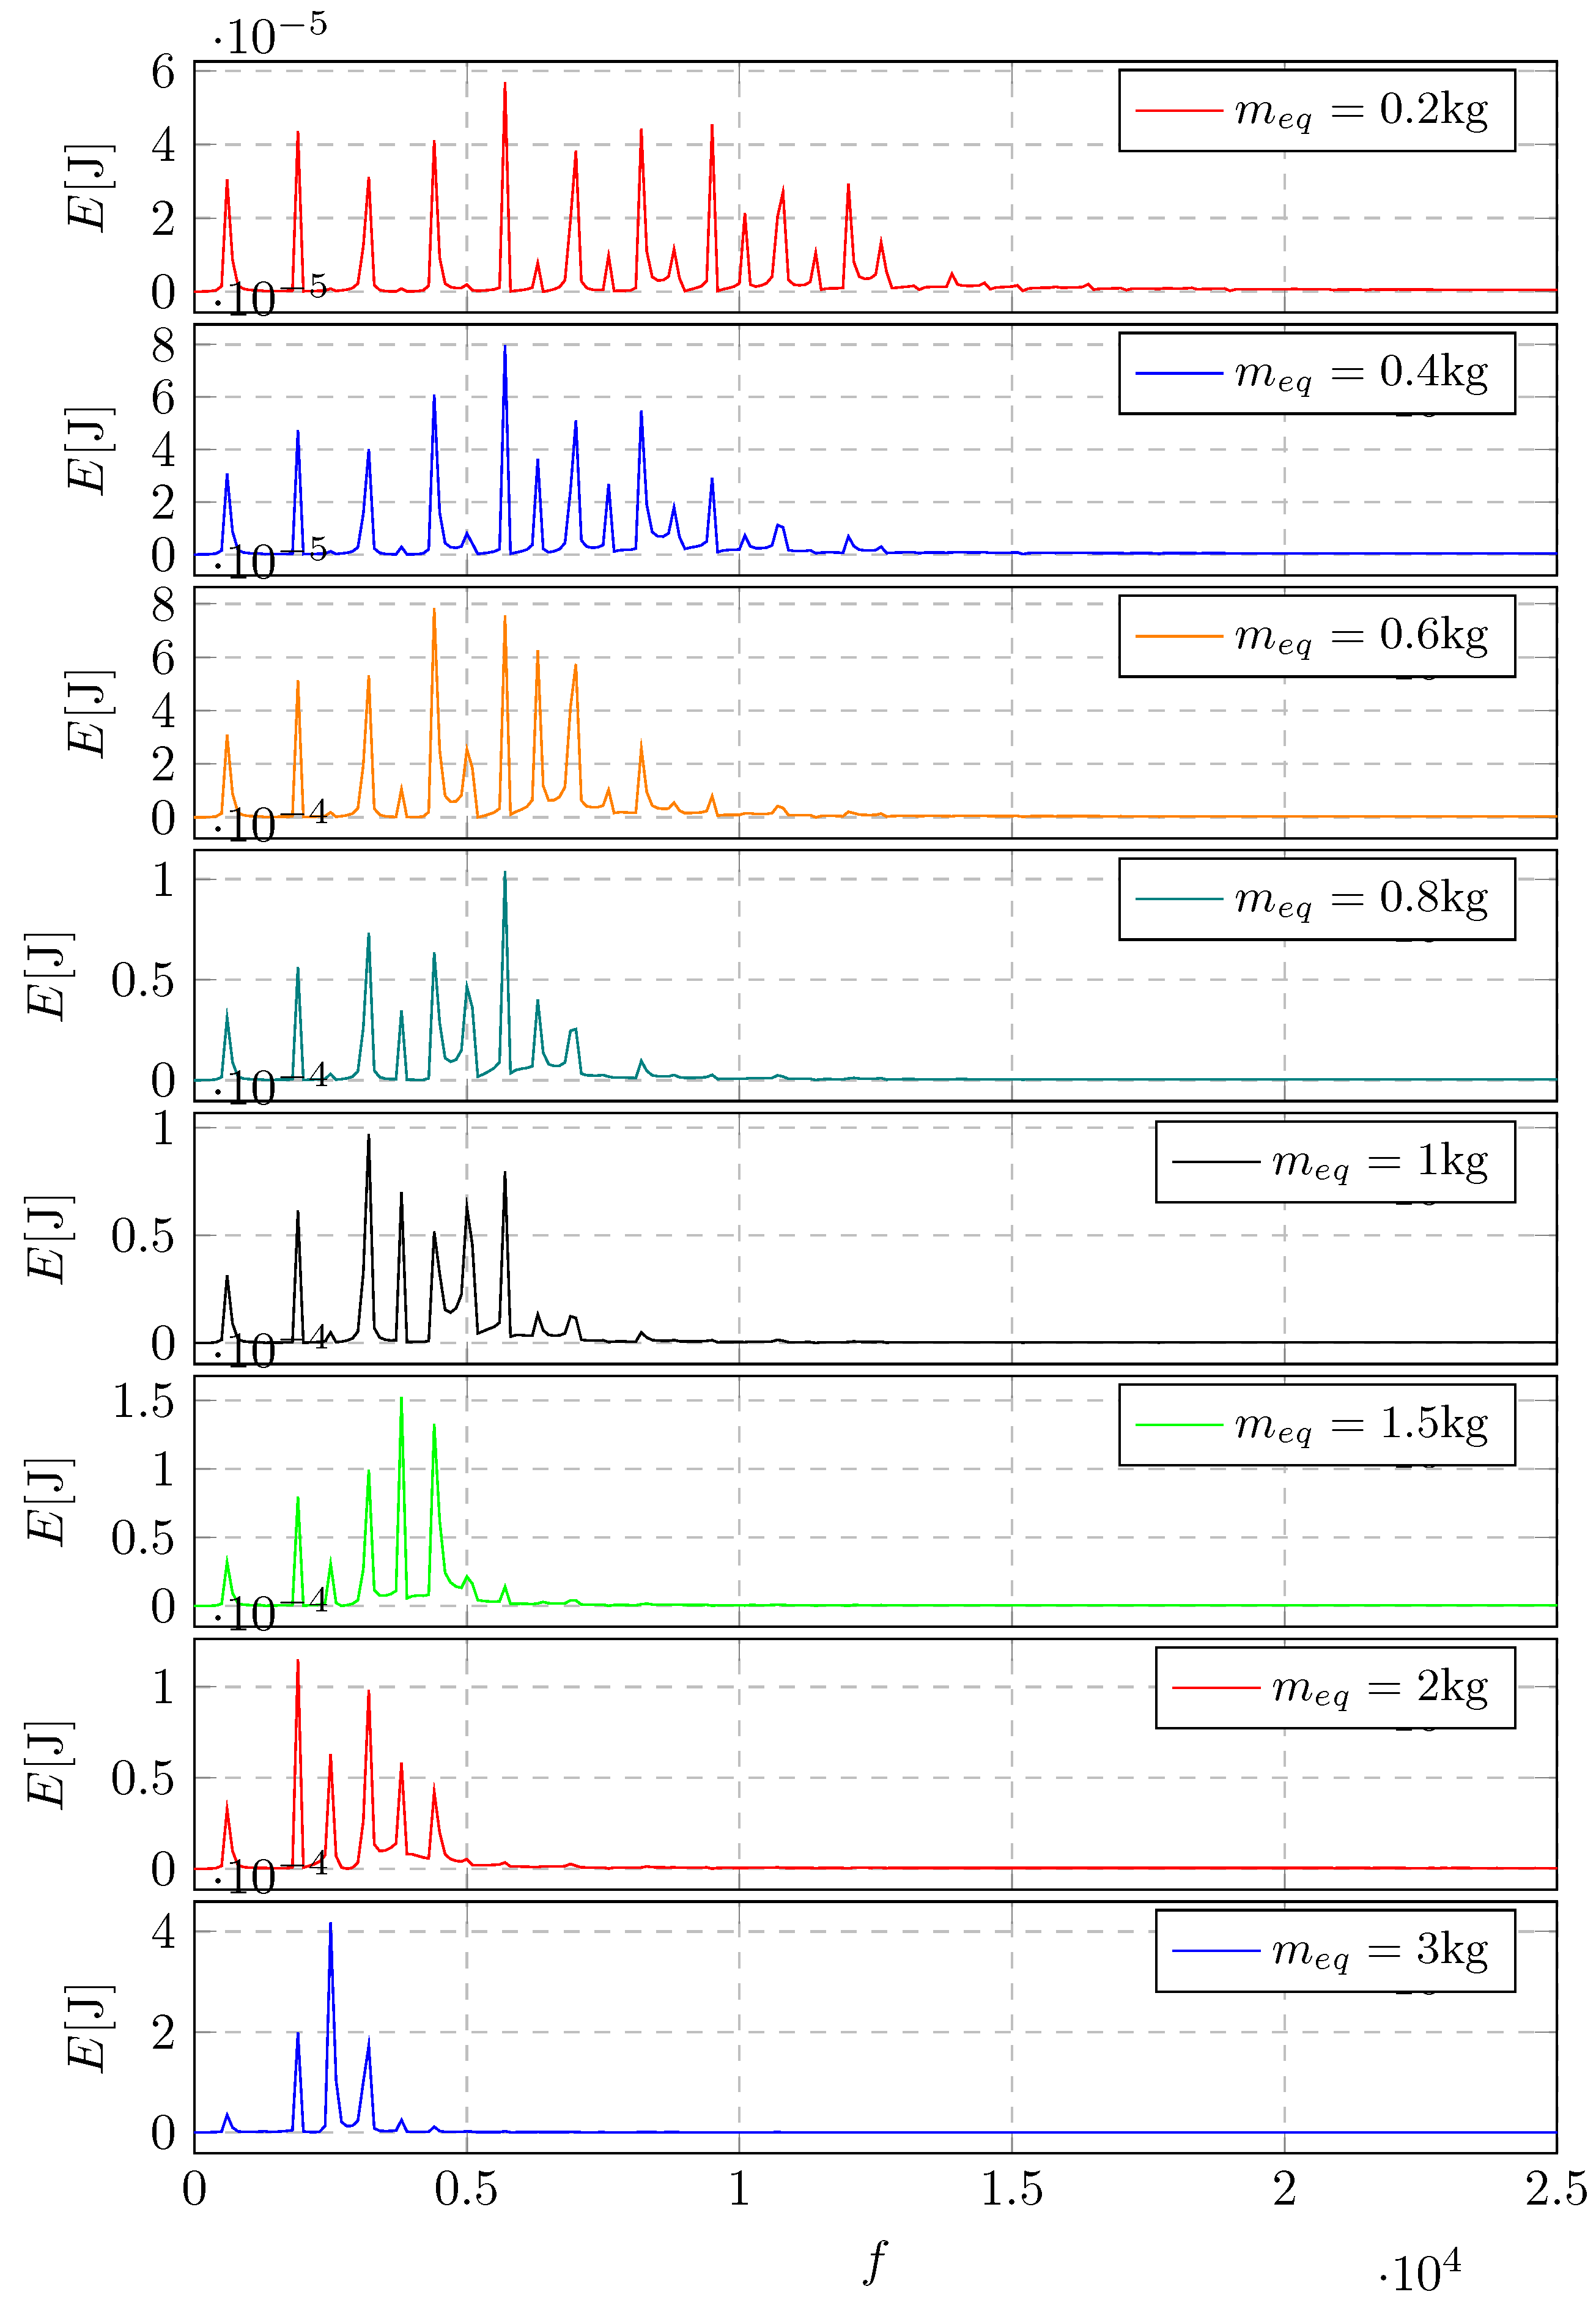
Figure 34.
Energy generated by displacement vibrational signal in the frequency domain for different mesh damping
Figure 34.
Energy generated by displacement vibrational signal in the frequency domain for different mesh damping
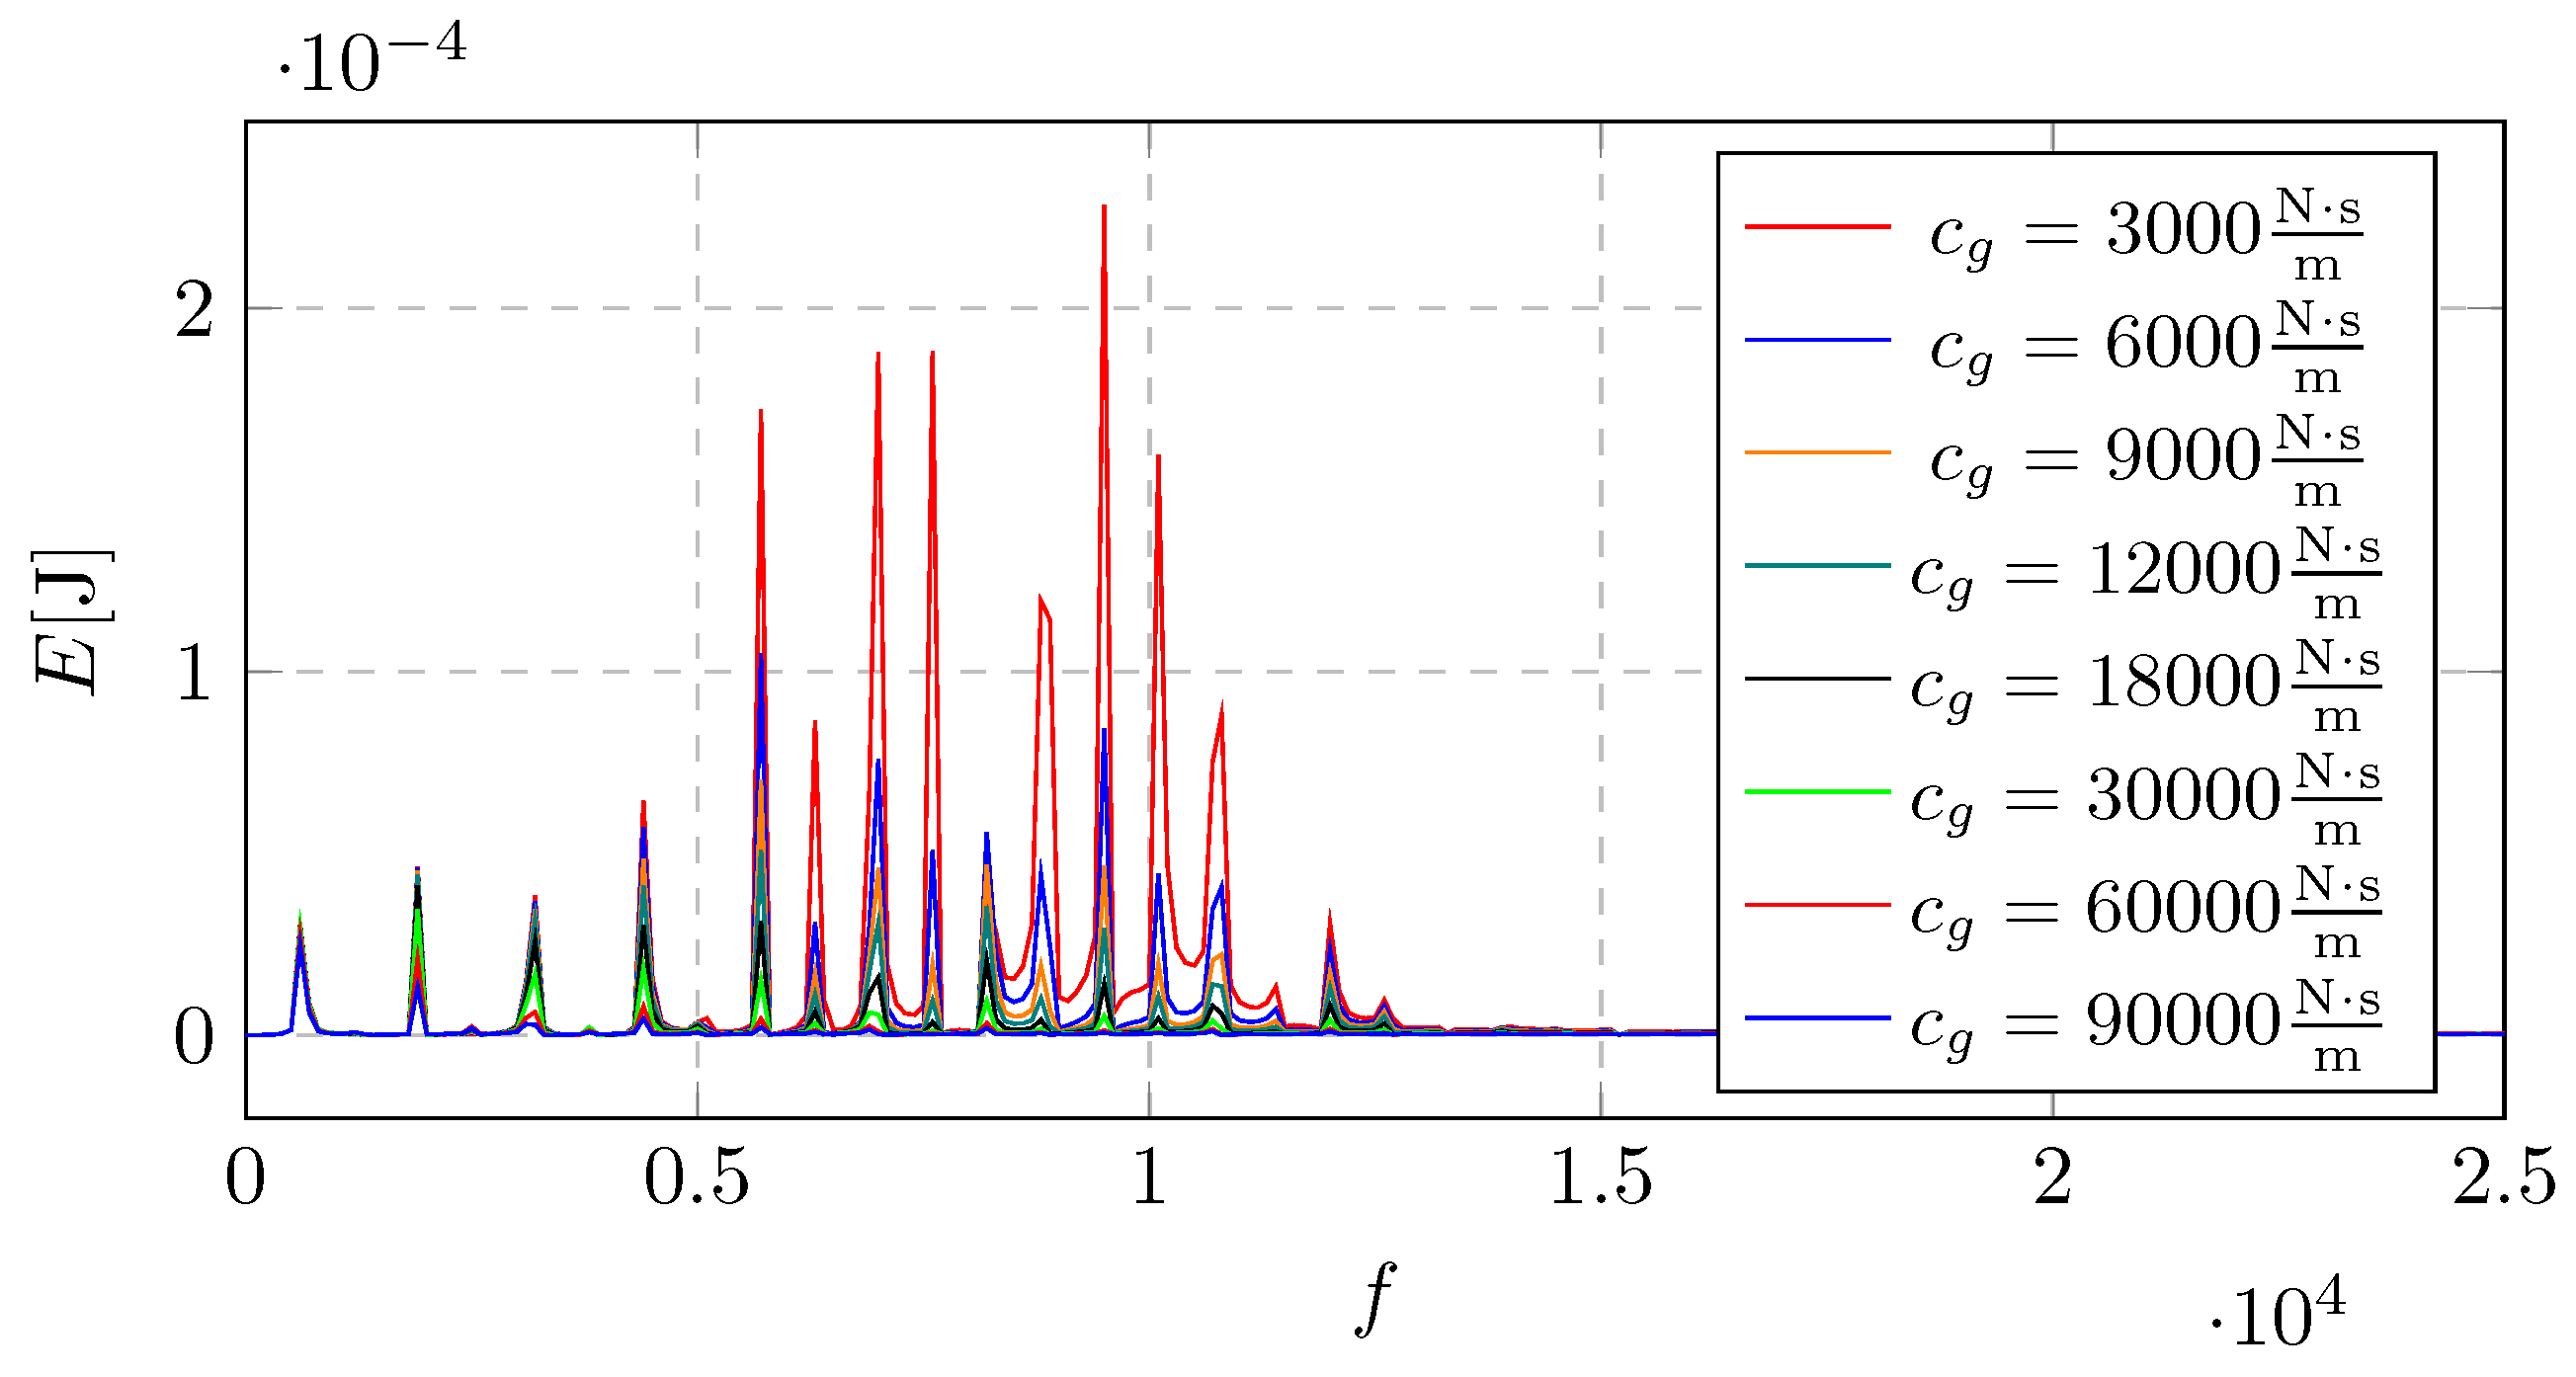
Figure 35.
Energy generated by displacement vibrational signal in the frequency domain for different mesh damping - separated view based on Figure 34
Figure 35.
Energy generated by displacement vibrational signal in the frequency domain for different mesh damping - separated view based on Figure 34
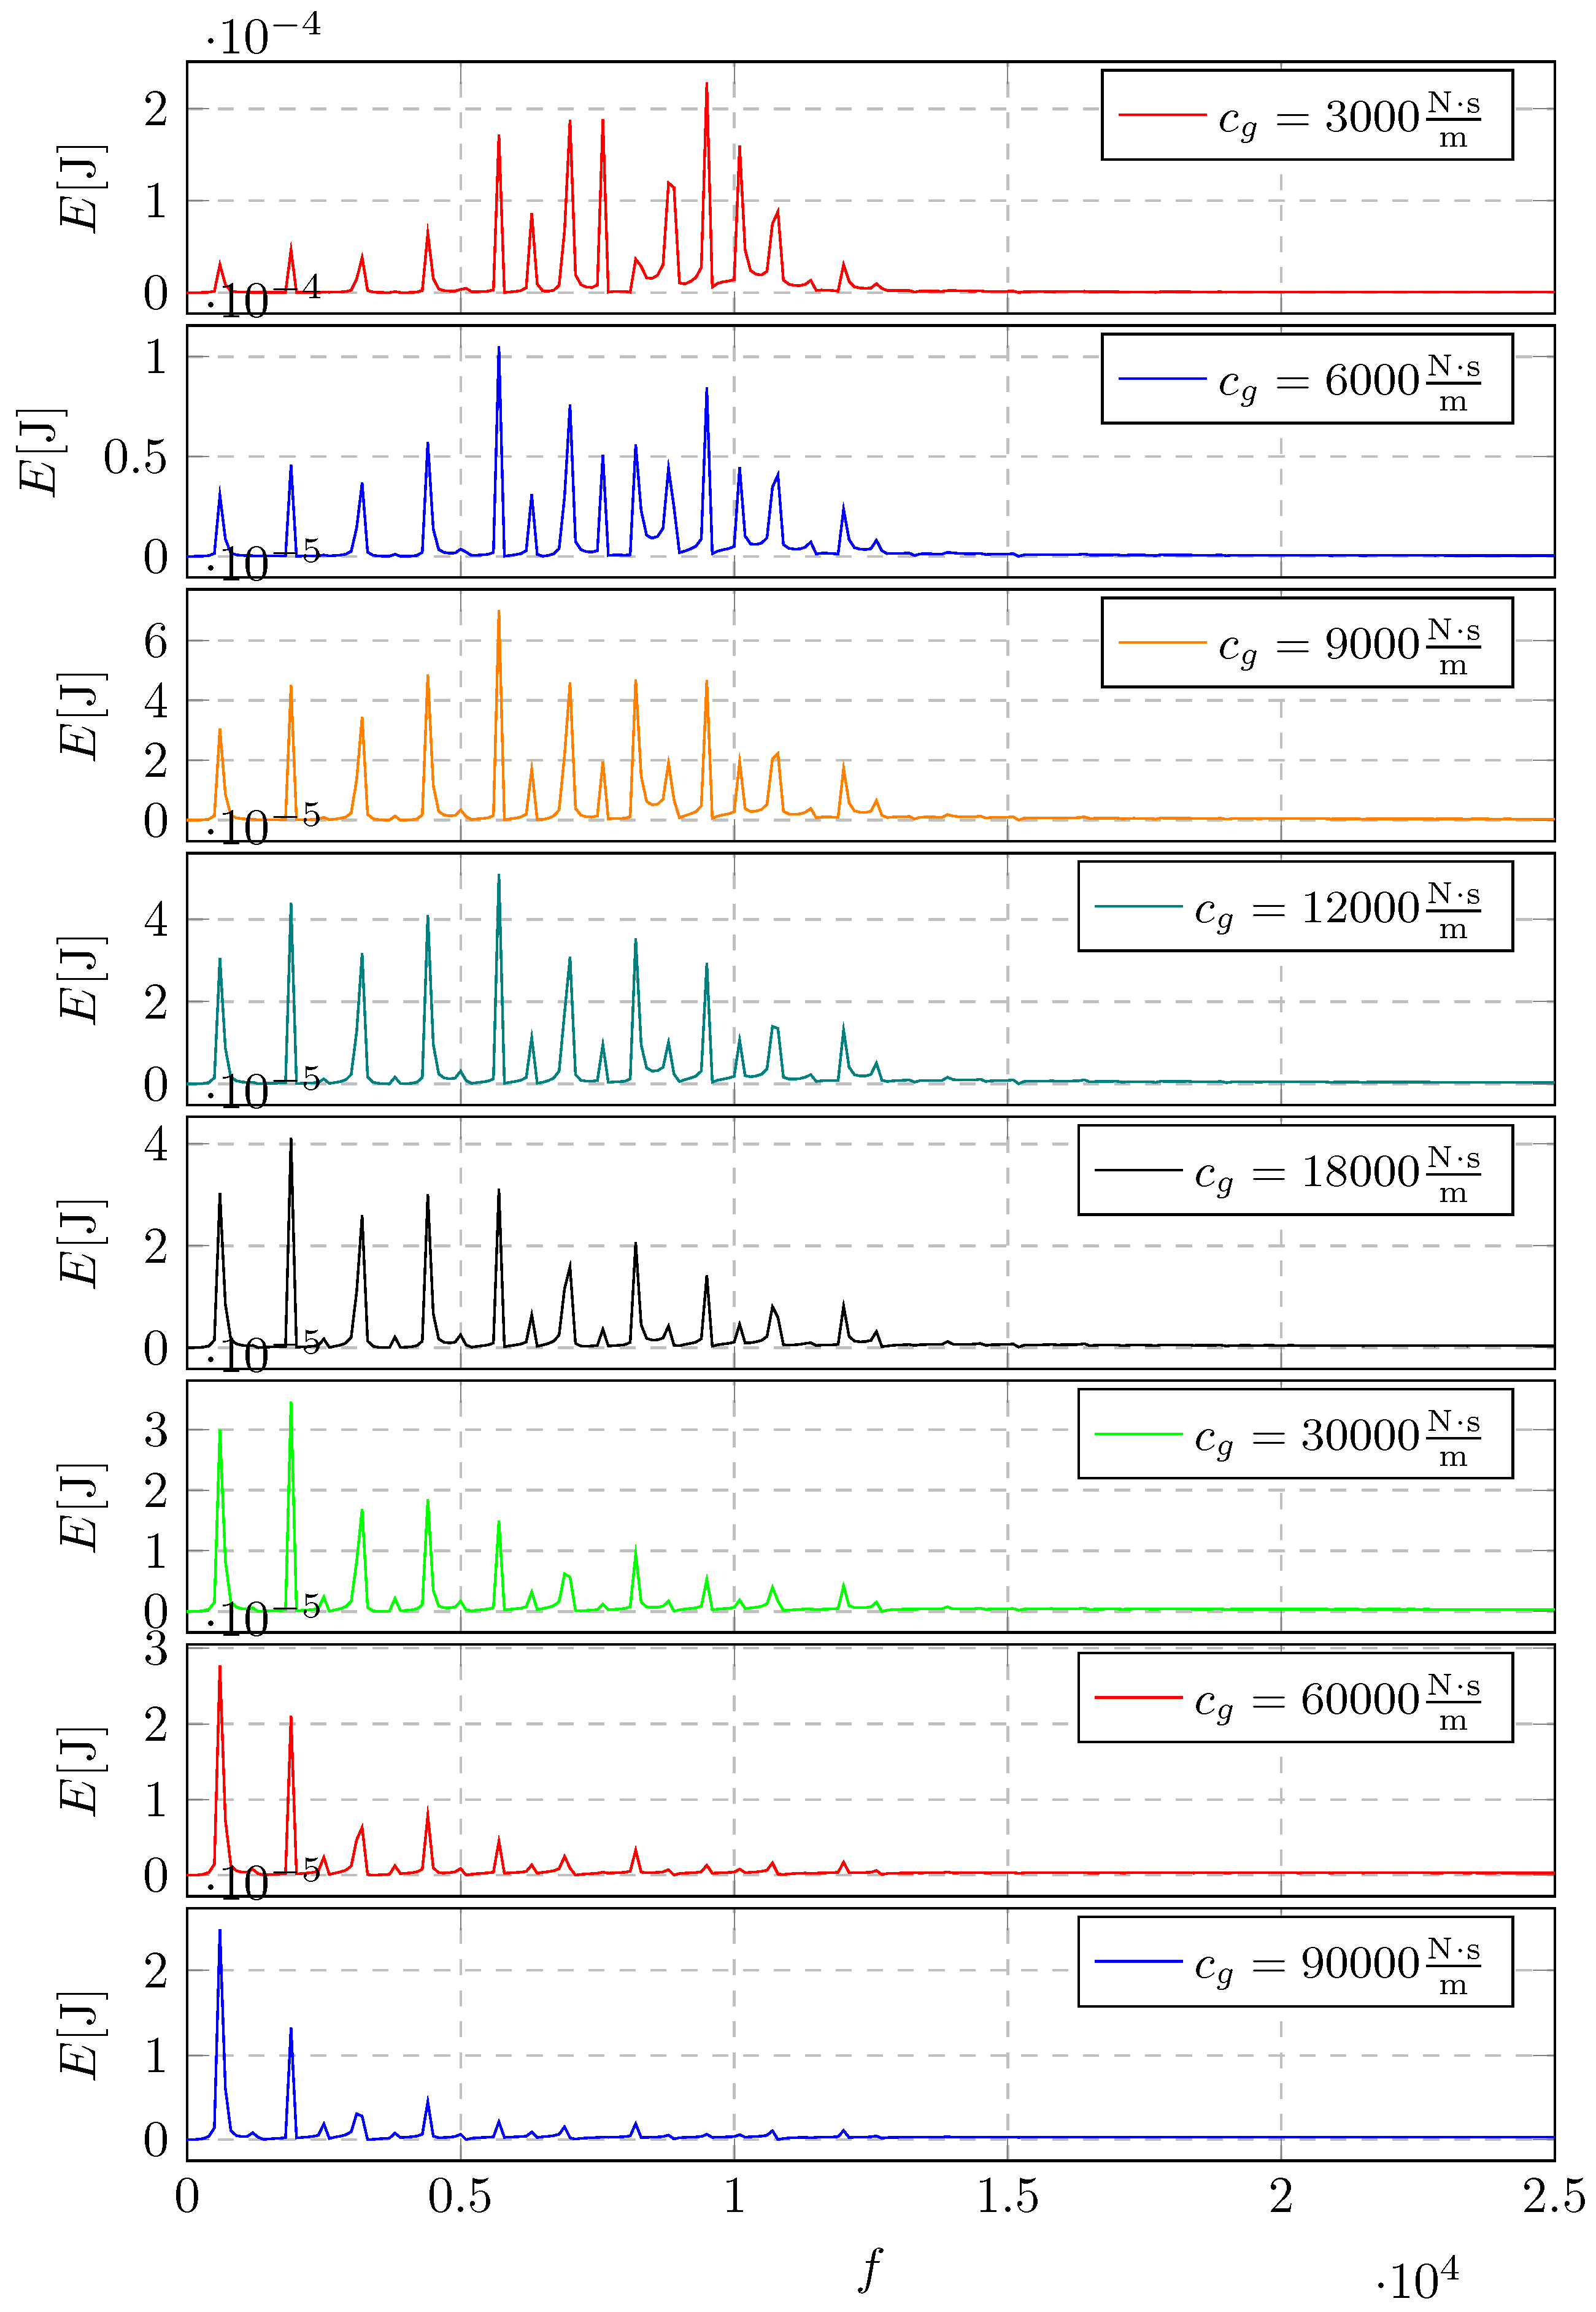
Figure 36.
Energy generated by displacement vibrational signal in the frequency domain for reference data
Figure 36.
Energy generated by displacement vibrational signal in the frequency domain for reference data
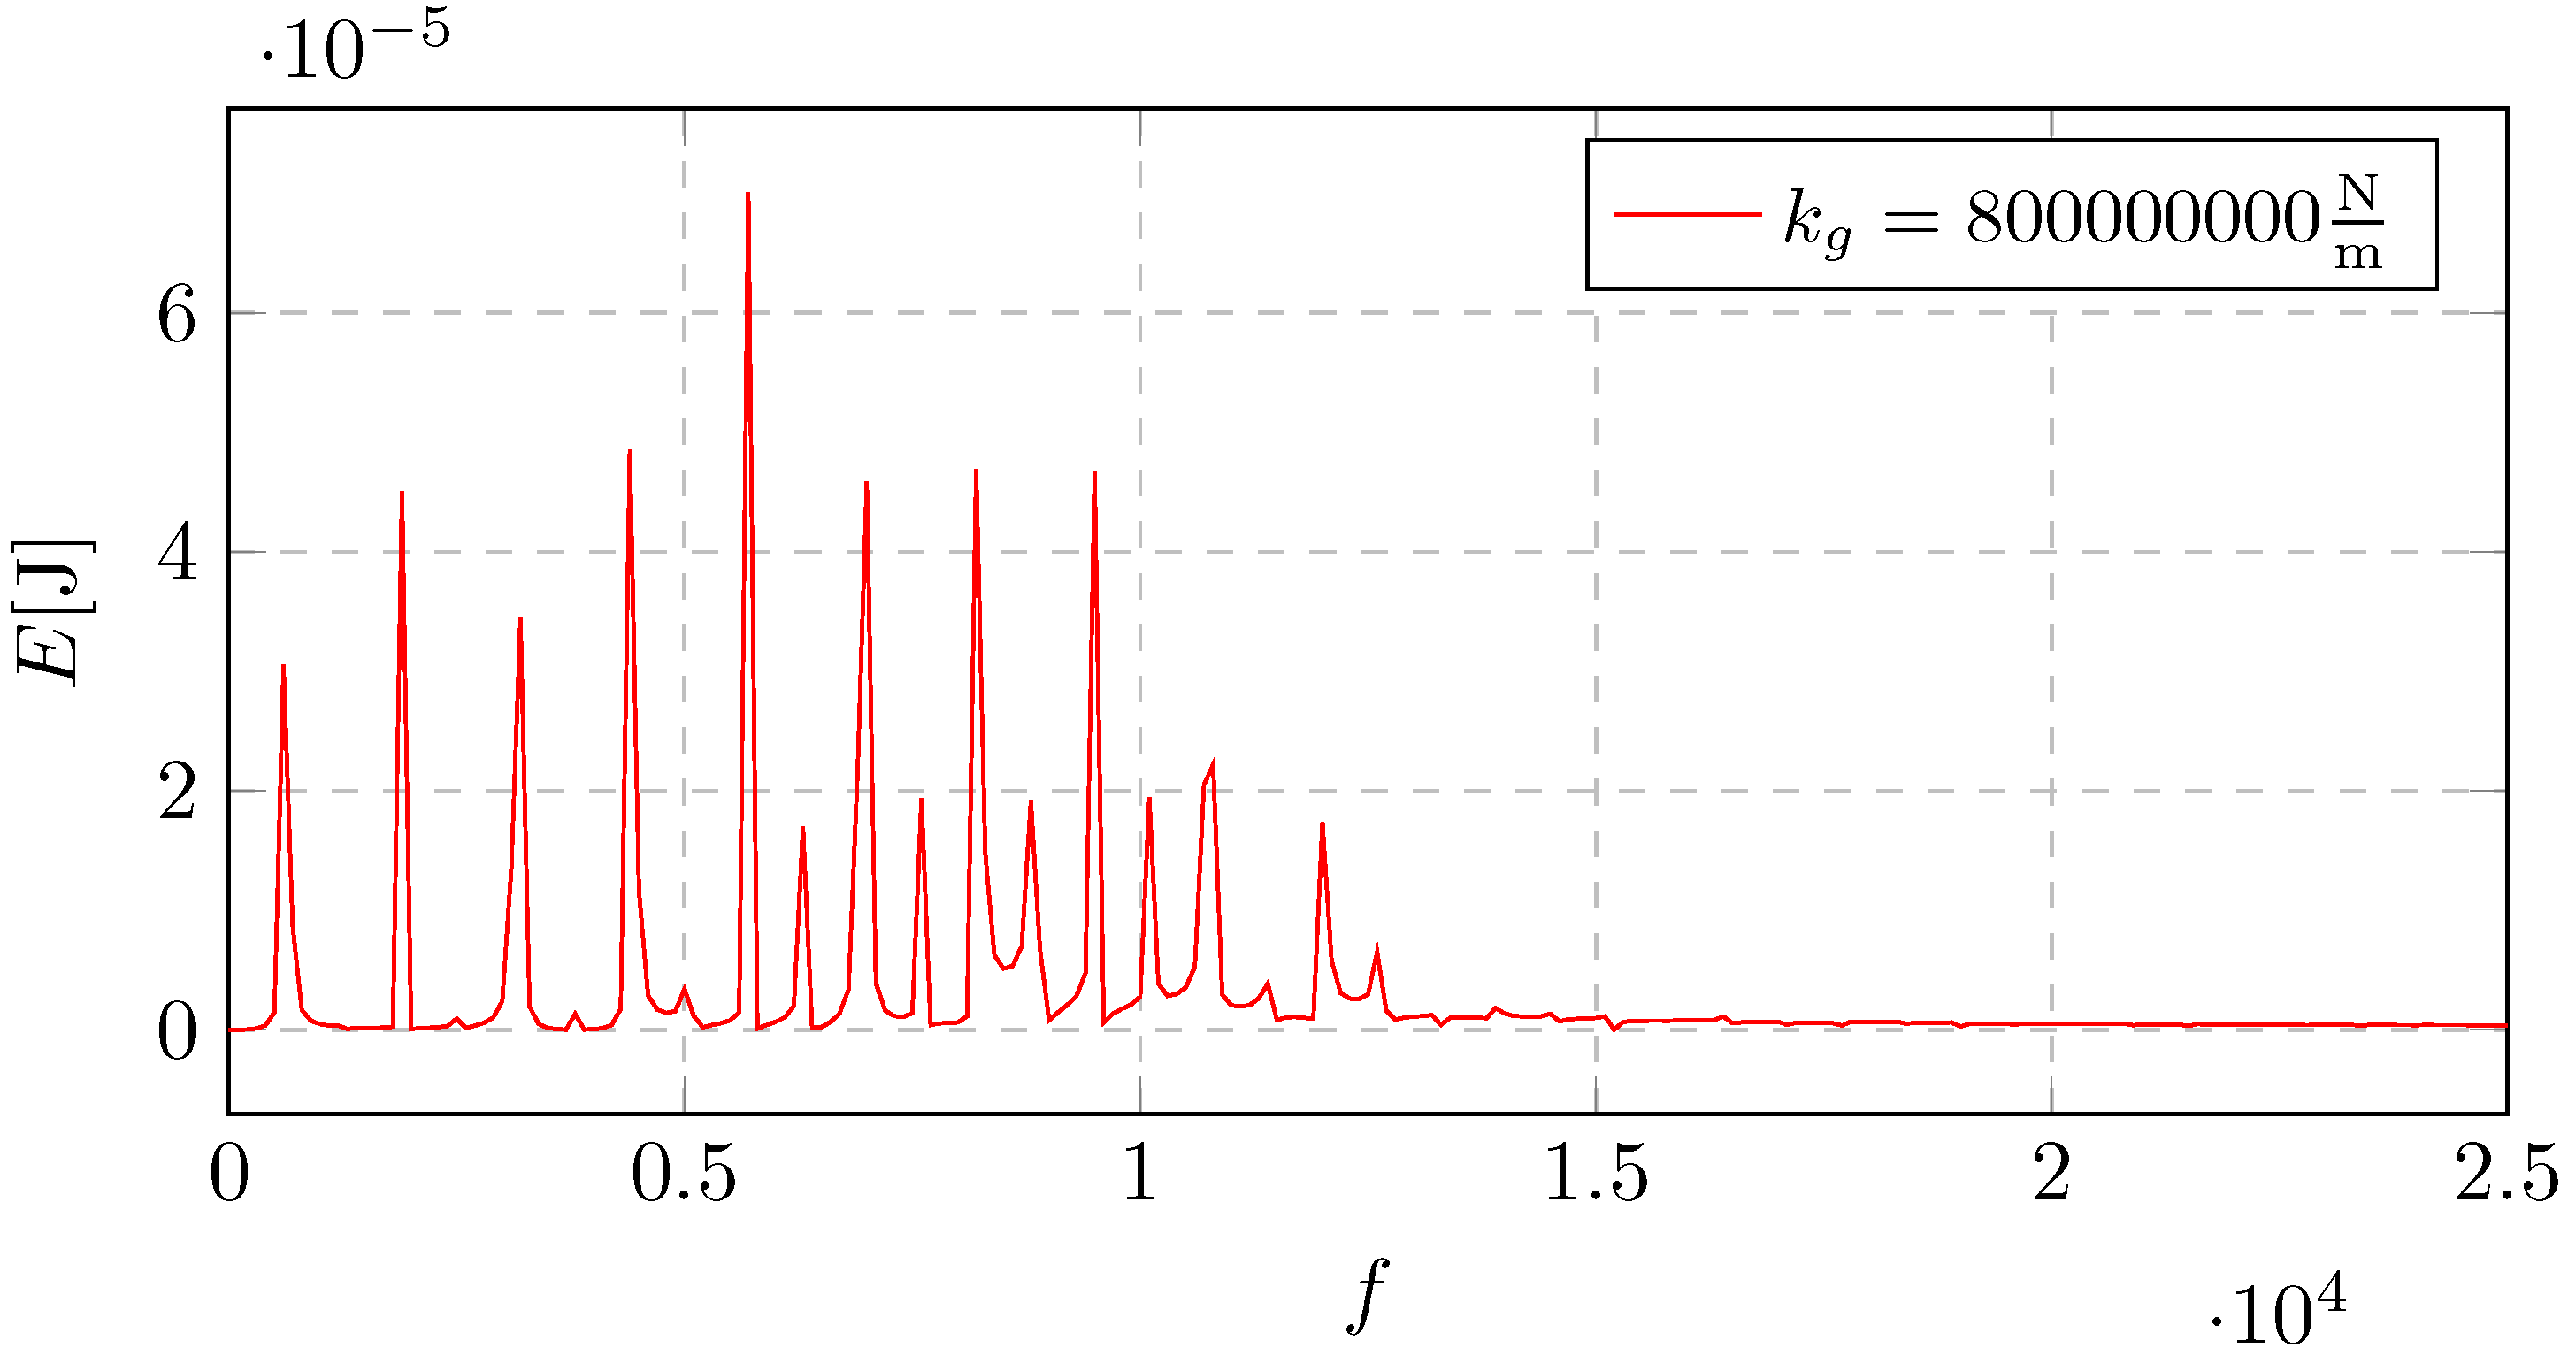

Table 1.
Basic parameters of helical gear
| Symbol | Value | Unit | |
|---|---|---|---|
| Number of teeth of the pinion | 26 | - | |
| Number of teeth of the gear | 53 | - | |
| Module (gear system parameter) | 2 | mm | |
| Center distance of the pinion | 52 | mm | |
| Center distance of the gear | 106 | mm | |
| Gear ratio | u | 2.04 | - |
| Pressure angle | 20 | ∘ | |
| Pitch diameter of the pinion | 48.864 | mm | |
| Pitch diameter of the gear | 99.607 | mm | |
| Face width ratio | 1.412 | - | |
| Length of the contact line | 8.338 | mm | |
| Rotational speed of the pinion | 1460 | rpm | |
| Input torque | 98.12 | Nm |
Table 2.
Reference values of the parameters for simulations
| Symbol | Value | Unit | |
|---|---|---|---|
| Stiffness | 8.0e+8 | N/m | |
| Force | F | 4.0e+3 | N |
| Damping | 9.0e+3 | Ns/m | |
| Period | T | 0.0016 | s |
| Mass | 0.28 | kg | |
| Small parameter | 0.13 | - |
Disclaimer/Publisher’s Note: The statements, opinions and data contained in all publications are solely those of the individual author(s) and contributor(s) and not of MDPI and/or the editor(s). MDPI and/or the editor(s) disclaim responsibility for any injury to people or property resulting from any ideas, methods, instructions or products referred to in the content. |
© 2024 by the authors. Licensee MDPI, Basel, Switzerland. This article is an open access article distributed under the terms and conditions of the Creative Commons Attribution (CC BY) license (http://creativecommons.org/licenses/by/4.0/).
Copyright: This open access article is published under a Creative Commons CC BY 4.0 license, which permit the free download, distribution, and reuse, provided that the author and preprint are cited in any reuse.


