Submitted:
19 January 2026
Posted:
20 January 2026
You are already at the latest version
Abstract
The challenges of inadequacies and disparity in quantity of fresh water supply as experience in many regions of the world Altogether, can be attributed to issues such as climate change, rapid population growth, institutional failures and growing water demand., thus resulting in water accessibility issues. While efforts have been made to analyse willingness to buy water or pay for improve water services no single study has pointed to the inequalities associated with informal water market (IWM) in Nigeria. Therefore, this study is an attempt to examine the impact of IWM on access to water in Ijebu-Ode Nigeria. Adopting questionnaire for the survey of 507 and connecting household socio-economic characteristics to household access to water sources. Analytical Method includes in investigating the inequalities associated with informal water market operation. Chi-Square, t-test, ANOVA Also further, inquiry into the associated inequality followed Lorenz Curve and Atkinson Index technique. The findings showed that, Gini index for the study area is 49.45, while that of water expenditure is 49.23 the Atkinson Index remains 0.361, showing existing inequality in access to water. Therefore, recommendations comprise the establishment of regulatory body, provision of loans services for the informal water market sector.
Keywords:
informal
; water
; market
; access
; inequalities
; willingness
; services
; inadequacies
; fresh
; quantity
1. Introduction
The challenges of inadequacies and disparity in quantity of fresh water supply as experience in many regions of the world altogether, can be attributed to issues such as climate change, institutional failures and increased water demand. In addition, rapid population growth, also creates pressure on water use, [1,2,3].
However, exploitation principles have enclosed water as a socioeconomic good within public policy [4], with focus on maximizing social welfare by linking allocation decisions to users’ collective demand or willingness to pay for water services, it is also critical to the identification of the comprehensive health, social, and environmental benefits of providing basic water services to one and all. [5,6].
Natural resource governance and utility services are instrumental in shaping and sustaining inequalities in many developing countries, including Nigeria. The spatial distribution of resource utilization is essential for fostering the development of local, regional, and national economies while setting the stage for sustainability. [7].
Water is an indispensable life moisturizer, critical for growth and development, significantly shapes social, economic, and spatial transformations. Typically, disparity in access to water ensues widely across different regions and periods, potable water availability, distribution, and accessibility are influenced by a complex interplay of cultural, institutional, economic, and social elements, [8,9]. This interaction of forces serves as basis for examining power relations and provides valuable insights into the evolving social and spatial inequalities in access to water supply services, [10,11].
There is a surprizing disparity in global access to water, with two interrelated issues of water access debates that are often regarded as distinct. The foremost is termed ‘water for life,’ referring to the moderate quantity of water necessary for essential life-sustaining activities, such as drinking, hygiene, and sanitation. This underlines the universal need for safe water in adequate amounts for domestic use, personal hygiene, and sanitation facilities, which are vital for social dignity and physical wellbeing. Therefore, access to safe and reliable water can be taken as a fundamental human right. Conversely, the subsequent issue emphasizes ‘water for means of production,’ highlighting the larger volumes of water required for productive activities and economic endeavours. Recent evidences have shown that the acute shortage of water in Africa continent where about 418 million people have no access to an essential level of drinking water, 779 million people lack access to basic sanitation services, also in urban area, two out of five people lack access to safely manage drinking water, women and children take the major share of the number of people affected, which is primarily driven by a decline in the quantity of available water and the increased demand stemming from rapid population growth, in addition to the deterioration of water quality due to pollution, [12,13,14,15].
2. Review of Literature
In Nigeria, the responsibility for water supply services and delivery rests with the state government, while the federal government through the Federal Ministry of Water Resources (FMWR) performs oversight functions and is also responsible for national water sanitation and health policies, directives, rules, and plans. However, most water facilities have not functioned for a long time as they break easily and often fall into disrepair, the continuous failure of water, sanitation, and hygiene infrastructure in providing access to water for households and poor level of services by public water service providers has led to seeking for an alternate source of water supply on the side of the household, [16,17]. The government’s effort to improve access to water supply is indicated in the private sector participation agenda that, the government will actively include the private sector for the provision of well-organized and sustainable water services by allowing for appropriate Public-Private partnerships to attain better and more efficient service delivery, adequate distribution and increased water resources facilities, utilization of the private sector fund potentials for the infrastructure development corporation for better efficiency and benefiting from private sector, [18,19]
Studies have shown that about six out of every ten Nigerians lack access to safe water for domestic usage. Within Nigeria scenery, the policy design has not successfully enhanced access to water services, as urban areas have experienced a huge reduction in access to improved water sources, within 1990 and 2004, [20]. Consequentially, millions depend on non-state water suppliers such as the informal for-profit water vendors, which are individuals of small enterprises that produce, and dispense or sell water to households at grassroots levels in cities and towns, [21,22,23,24]
Trend in access to water shows a decline in the number of people with access to water to be 11%, 9% and 10% for the year 2018, 2019 and 2021 respectively, similarly World Bank report on access to water in Nigeria indicates an estimate of 2.31 million water points in Nigeria three quarter (75%) are self-supplied out of which 43% are boreholes, [25,26]. Accessibility to potable water in Nigeria’s cities has taken a downward trend within the last thirty years, with a decline of 25% between 1990 and 2015 (that is between 32% to 7% between 1990 and 2015), in the face of the initial low percentage of service delivery, [27]. Nigeria like most developing nations, still experiences practical difficulties in extending this right to all its citizens, [28]. Many parts of urban centres, and slums in Nigeria are still left out of public water infrastructure till today, [2,28,29], The Nigeria water supply demand estimate for the year 2010 is said to be 3,047 million Cubic Meters per year (MCM/year), and the projection for the year 2030 is estimated to be around 8,852 million Cubic meters per year (MCM/year), [19]
This occurrence could be attributed to a rapid increase in population growth changes in consumption patterns, unrestrained urbanization, poor resource allocation, combined with poor institutional efficiencies, infrastructural decay and corruption, as part of the multifaceted difficulty facing adequate potable water supply in Nigeria, and only about half of the population have main access to safe water [30,31,32,33,34]. As a consequence, most households depend on water vendors and self-supplied groundwater extraction through boreholes for water supply. Water vendors in the informal economy are the main source of water for the urban poor in developing and less developed countries as Nigeria, whose role is not yet clearly understood. There is also limited knowledge about whether the charges for service provision by informal water vendors are reasonable or not. Although there are argument that the high fee for water sold by distributing vendors is usually higher compared to public water supply agencies, [29].).
The United Nations recommended daily water consumption for basic human need is 50 litres per day, [35] consequently, an average household (of five members based on 1991 National population policy) requires a minimum of two hundred and fifty litres (250 litres) of water daily, where such household depends on informal water market, a greater portion of the household income is to be expended on water therefore having effects on other household needs. On the other hand, the Ogun State average volume of water per person per day supply standard stood at 14 litres per person per day, [26]. The water supply services in Nigeria implement both “top-down and supply-side tactics, showing poor performance due to reasons such as poor community base involvement, neglected infrastructure management, and poor funding. Study has indicated that there was an unswerving slump in the amount of water supply statistically significant below 50% in some southwestern States of Nigeria amid 2014 and 2016, of which prominence is Ogun State, [36].
Ijebu Ode a major urban centre in Ogun State southwestern Nigeria faces the difficulty of limited water supply, the main river that supplies the inhabitants of the area is the river Yemoji water scheme. The present supply coverage from the Yemoji water scheme is 14,100 cubic metre of water per day, about 50 percent of the total daily demand of the residents of the area from the needed 28,200 cubic metre of water per day, regardless of the evidence showing the rehabilitation of water treatment plant, the quantity from existing water treatment plant is insufficient for the supply of the total projected water requirement of the inhabitants of the city with a population of about 368,749 people, as the water treatment plant output is about 50 percent of its installed capacity after rehabilitation, [37]. This makes the city to struggle in meeting her citizens’ water demand, leveraging at supplying less than 50% water needed to the population therefore causing a situation where people currently have poor access to potable water provision from state water agency, indicating considerable problems in water supply set-up and state supply failure toward water provision, [38].
Aside from the above, the major source of water within the neighbourhood in Ijebu Ode is the borehole/well owned by individuals. Never-ending electricity power outage, causes people to suffers much for water as result water scarcity all over the city persist. The presence of some surface water from streams which can serve as an alternative water supply gives no help due to pollution. Thus, the increase in population being experienced in the city has increased the water demand. Consequently, the residents within the study area suffers from inadequacies of water supply and would be willing to pay for supply of potable, reliable and quality water. However, daily water supply to the metropolis has been short from been adequate cumulating from continuous waning in accessibility and reliability; engineered by rapid population growth and city sprawl. Thereby compelling residents to compliment public water supply systems with communal and self-supply sources of water as a coping strategy against inconsistent water service in the study area, utilisation of superficial groundwater for domestic purposes, through the construction of hand-dug wells, is prevalent, signifying shortage of the public water supply system.
Therefore, the scope of this study, based on the theoretical background and the causative factors highlighted as the basis for inadequacy in public water supply/inadequate access to safe water in the study area more significantly, the study attempts to analyze the inequalities features affecting access to water and its associated social function problems, it is therefore important to empirically assess the level of disparity of both social and economic norms in the provision of potable water by informal water market from an equity and sustainable perspective and to determine whether vendors play sustainable roles in providing equal access for households irrespective of their socio-economic status.
2.1. Sustainable Access to Water
The Capability of access to water being sustained is a model that reassures the functional thoughtfulness of yet to be and longstanding goals, combined with contemporary intended goals in the way water resources, demand, supply and services are governed, [39]. The reviews of literatures have presented evidence of huge investment in water infrastructure project with a view to improve access as well to accelerate socioeconomic well-being in Africa, but much is still needed to be done, as report indicates that, access to clean water services is left in an unchanged state of difficult task and partially available mainly in less privilege communities, [40,41,42].
The concept of sustainable development as developed in 1987, by the Brundtland Commission Report, defining Sustainable Development as “development that meets the needs of the present generation without endangering the ability of future generations to meets their own needs”. Giving opportunity with which society can relate with the environment, by way of not detrimental to or destroying the resource for the future It is a development paradigm as well as concept to development which uses resources in a way that considers the resource continuity for others, [43]. Imbedded in the concept of sustainable development is equity across generations, recognizing both short and the long-term effects of sustainability and sustainable development, [44,45].
Both sustainability and sustainable development are two concepts distinguishable from each other the point raised by scholars’ argument is that sustainability may be taken as the final target or endpoint of a process of sustainable development, in addition while “sustainability” could be referred to as a state, sustainable development refers to the mechanism for achieving this state [46,47]. Sustainable access to water requires the planning and administrative management of water schemes to safeguard the availability, access, quality, and affordability of water resources in the face of social, environmental, and economic challenges, as entrenched within the interaction among the pillars of sustainability i.e., Environmental, Economic, and Social, [48,49].
There are complex challenges impacting access to clean water in Africa, these include are not limited to precarious water service infrastructure, cultural and environmental peculiarities, lop-sided access; water scarcity, poor water quality, fiscal challenges, inadequate governance and institutional frameworks, human resource constraints, social beliefs, pollution, corruption and resource scheme administration challenges seen within inadequate infrastructure and weak policies to ensure their maintenance and improvement, there is also a surge in water need due to the increase in population, improve socio-economic wellbeing, and unrestrained urbanization worsened by climate change, [50,51]. These factors have reconstructed forces at work in water services provision, highlighting the relevance of the hydrosocial cycle in the management of this vital resource, [52]. The hydrosocial cycle helps in the identification of how water and society have shaped each other through political and economic decisions perpetuating inequality in access to water, intensifying the stratification within urban and rural areas, [53]. To achieve sustainable access to water, there is the need for political will from the nation state to move away from the old perennial way of delivering water services before expecting a different positive result. There is a need for a better future blueprint, from the understanding of the system, the associations between and among the different elements, and identifying the drivers of change that influences access sustainability.
3. Materials and Methods
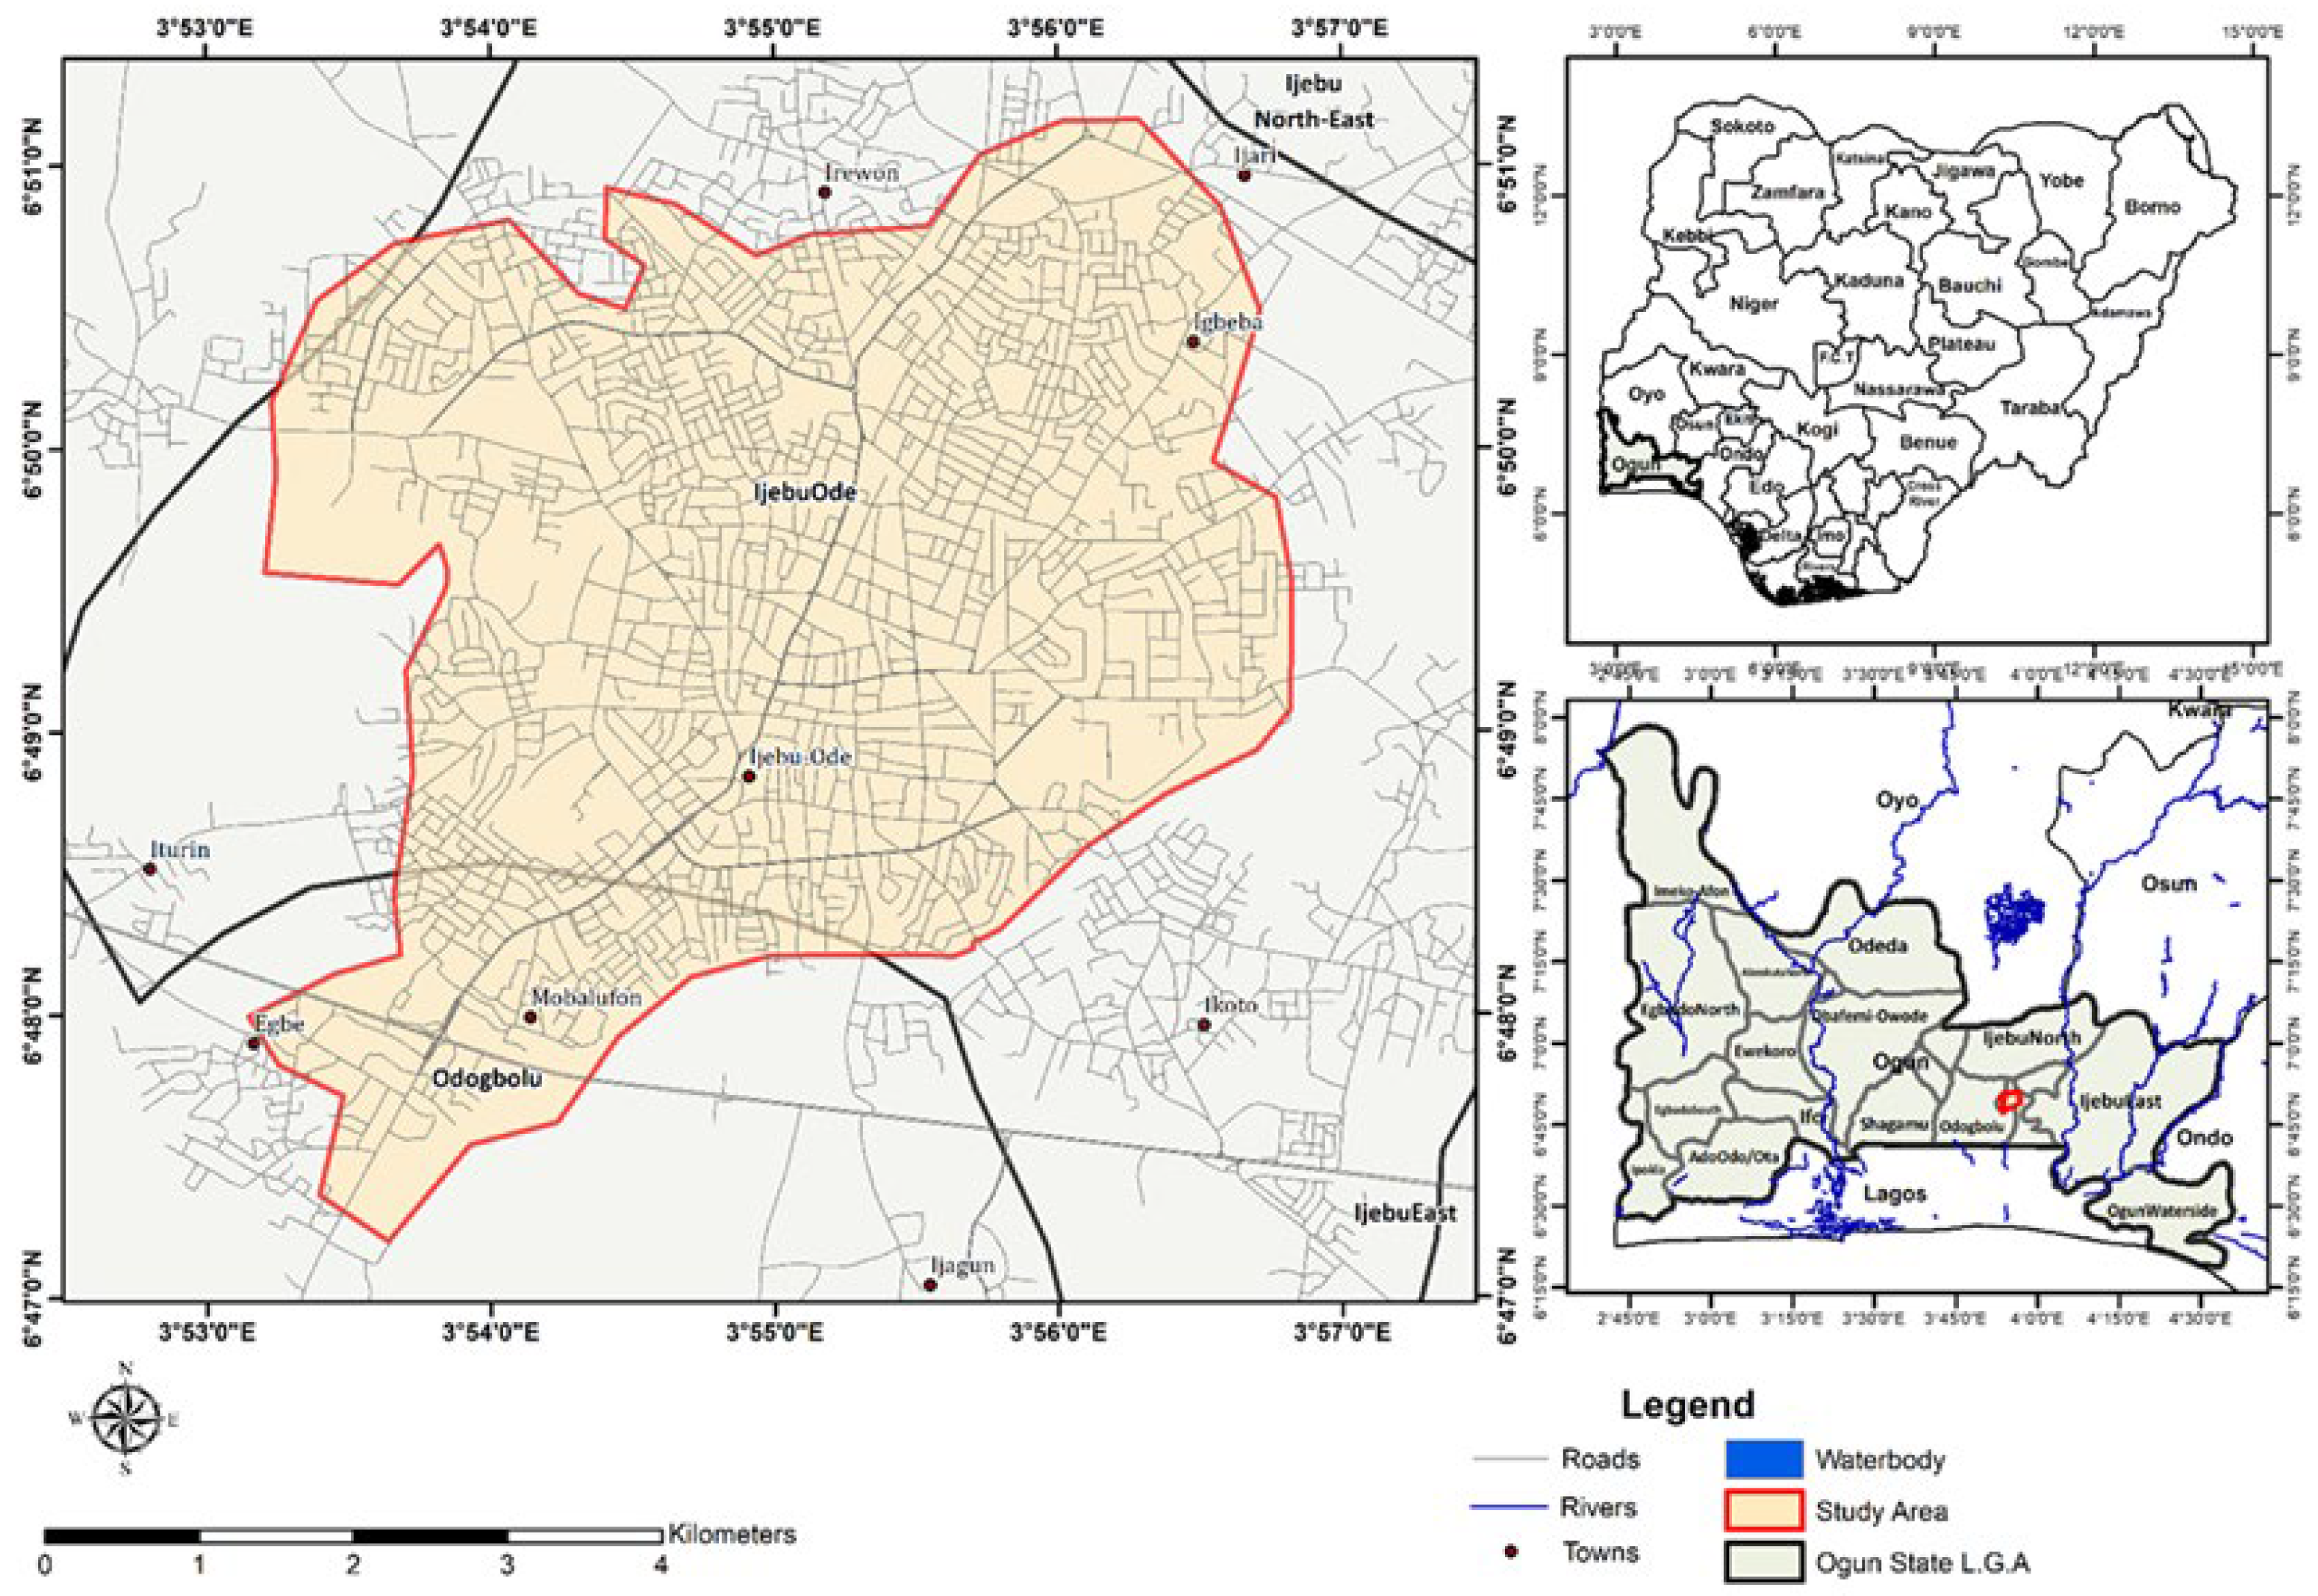
The operational design of this study is set within the metropolitan area of Ijebu-Ode, which covers nine (9) out of eleven (11) polling units (PU) as delineated by the Independent National Electoral Commission, (INEC, 2015). The geographically built-up area for the metropolis is strewn across two local government areas (Odogbolu and Ijebu-Ode local government) concurrently. Therefore, study is restricted only to the of the city within the Ijebu-Ode local government based on the historical perspective used in highlighting these polling delineations, comprising of Porogun 1 and 2, Imepe 1 and 2, Itantebo, Ijasi/Idepo, Isokun, Odoesa and Odoegbo/Oliworo, and extended to the adjacent built-up areas outside the Ijebu-Ode local government area. In determining the extent of the area covered by the city concisely, metadata extraction from Open Street Maps was used in defining the study area, which was merged as a single map of the study area. Ijebu-Ode located in the interior of the South-Western Nigeria, absolutely, the study area lies within Latitude 6,793130 to 6.859210 North and Longitude 3.899470 and 3.951160 East, it serves as second order city in Ogun State after Abeokuta, with an area of about 192 kilometres square. Due to uncontrolled urbanization, it has practically merged with nearby settlements. [54,55].
Ijebu-Ode enjoys the Warm Tropical climate, with a mean annual rainfall of between 1523 mm and 2340 mm, while mean temperature is between 25° C and 32° C, daily temperature ranges between 26° C to 34° C, with the averages daily temperature put up at about 280 C, (Bakare et al. 2015). Rainfall is generally heavy, exhibiting two regime called “Double Maxima” April-July and a short break in August, called “August break” and September-October, nevertheless rainfall usually reaches its peak in both July and September. Humidity is high with significant drop during the Harmattan season, from mid-November till early January, annual relative humidity is about 81%.
The vegetation is characterized by the tropical lowland rain forest and the flora cover is made up of different species of trees arranged in a straight down forest structure with an emerging layer of large trees of about 60 meters in height notable tree species includes Mahogany (Khaya entandrophragma), Obeche (Triplochiton), Afara (Terminalia), Iroko (Chlorophora), African Walnut (Lovoa trichilioides). Topographically, Ijebu Ode is largely an area of gentle rolling plain of about 100 metre above the sea level, in addition geologically on basement complex rock of old rigid crystalline rock of igneous and metamorphic origin, [55,56].
The population of Ijebu-Ode is on the increase, due to influences such as, immigration and rural-urban migration. The National Population Commission made no data available for the 1991 census for the area, but based on the national population growth rate this is expected to double between 1991 and 2018 following the path of current economic development trends and due to rural-urban economic interactions in addition to a portion of the population living within the outer fringes of the urban area. By 2006 census, the city has a population estimate of 157,161, (National Bureau of Statistics, 2006). Currently due to migration, Ijebu-Ode is rapidly growing with widely dispersed sub-urban region, with a projected population of 368,749 coupled with a population growth rate of 3.36%, the population density is about 1224 person/km2, [57].
Figure 1.
Map of the study area. (Source: OSM 2025, Author’s Fieldwork, 2025).
Research Design
The data for the study was primary data set and exploiting a mixed-method research design, by adoption of quantitative approach following, [58]. Cluster sampling procedure was used in the selection of 9 residential quarters. Where five hundred and seven (507) Geo-tagged households were randomly chosen for the administration a well-structured questionnaire, the survey was based on field observation. Observation approach on the field remain longitudinal studies because the observations are performed at different points in time. Prior to the field survey, research questions were identified and well related to the study objectives. The null hypotheses “There is no significant relationship between income and inequality in access to water from Informal water market operation” were built to prove the significance of the result, in addition, a criterion p-value for evaluating statistical significance of the results, was set to be either 0.05 or 0.01 respectively, using a null hypothesis significance testing (NHST) based on observations of samples. Methods for administering the survey are face-to- face approach.
The analytical technique used for the study include Chi-square test, One sample t-test, Analysis of Variance (ANOVA) Gini Index and Atkinson Index. Using primary data obtained from 507 household survey, a total of 507 questionnaire were administered in the study area, 102 were rejected and are not included in the analysis due to incomplete answers or multiple response therefore 405 accurately completed questionnaire were included in the analysis. All analysis was carried out using Statistical Package for Social Sciences (SPSS) 20.
3. Results
This study investigates disparities in water access within the informal sector, and further analyses of how income and cost of water influences reliance and access to different water sources by residents, taking average monthly income as a determinant of vendor water source, Chi-square analysis was employed to examine if there is a significant pattern in vendor water source based on resident’s income.
Table 1, present the cross tabulation of average monthly income and vendor water source reveals significant patterns in water access across different income brackets. The analysis shows that a majority of individuals with lower incomes (less than 30,000) rely heavily on hand pumps or boreholes (20.0%) and public taps (2.7%) for their water supply, indicating dependence on more affordable or communal sources. As income levels rise, there is a noticeable shift towards piped connections (6.2%) and packaged water (9.4%) among higher income brackets. Conversely, the reliance on public taps and hand pumps decreases with increasing income. This suggests that access to more reliable or private water sources increases with income levels, highlighting inequalities in water access within the informal sector.
However, the Chi-square test results in Table 2, indicate that there is no statistically significant association between average monthly income and vendor water source within the informal sector. The Pearson Chi-Square value of 24.500 with 24 degrees of freedom yields a p-value of 0.433. This value exceeds the conventional threshold of 0.05, suggesting that we fail to reject the null hypothesis of independence between income and choice of water source
The results of the one-sample t-test analysis for variation in the average cost of water purchased by households in Table 3, shows a t-value of 37.518 with 404 degrees of freedom which correspond to a p-value of 0.000, indicating a highly significant result (p < 0.001). With a mean difference of 1.380, this result suggests that there is a significant variation in the average cost of water purchased by households. The results imply differences in water costs among households, highlighting notable disparities in water expenditure within Ijebu Ode metropolis.
3.1. Inequality in Average Cost of Water Purchased by Household
The ANOVA (Analysis of Variance) results presented in Table 4 for the examination of inequality in informal water sources based on income group show a statistically significant difference. The analysis indicates that there is variability between income groups in terms of their reliance on informal water sources, as evidenced by a significant F-value of 3.260 (p = 0.012). The between-groups variation (Sum of Squares = 31.377) is statistically greater than the within-groups variation (Sum of Squares = 962.391), suggesting that income level influences the choice of informal water sources among households. This finding implies that income-based disparities play a role in determining access to informal water sources in Ijebu-Ode metropolis. Thus, we reject the null hypothesis which posits that no significant relationship between income and inequality in access to water from Informal water market operation
3.1.1. Examination of Inequality in Informal Water Source Based on Income
The Gini index analysis result shown in Table 5 and Table 6, respectively, for the examination of inequality in informal water sources based on income indicates that the Gini index for the nine polling units range between 49.25 ( Odoesa), 49.33 (Ijasi), 49.37 (Porogun), 49.38 (Idepo), 49.39 (Odoegbo) 49.47 (Imepe), 49.48 (Itantebo), 49.50 (Oliworo) and 49.54 (Isokun) while the Gini index for the entire study area base on income is 49.45 (0.49), furthermore, the Gini index for the water expenditure for the study area is 49.23 (0.49). This corroborates the findings above that income has major influence in determining the choice of informal water sources among households. This finding emphasizes the fact that income-based disparities play a role in determining access to informal water sources in Ijebu-Ode metropolis. Therefore, we accept the alternate hypothesis that suggests the occurrence of significant relationship between income and choice of informal water market vendor water source.
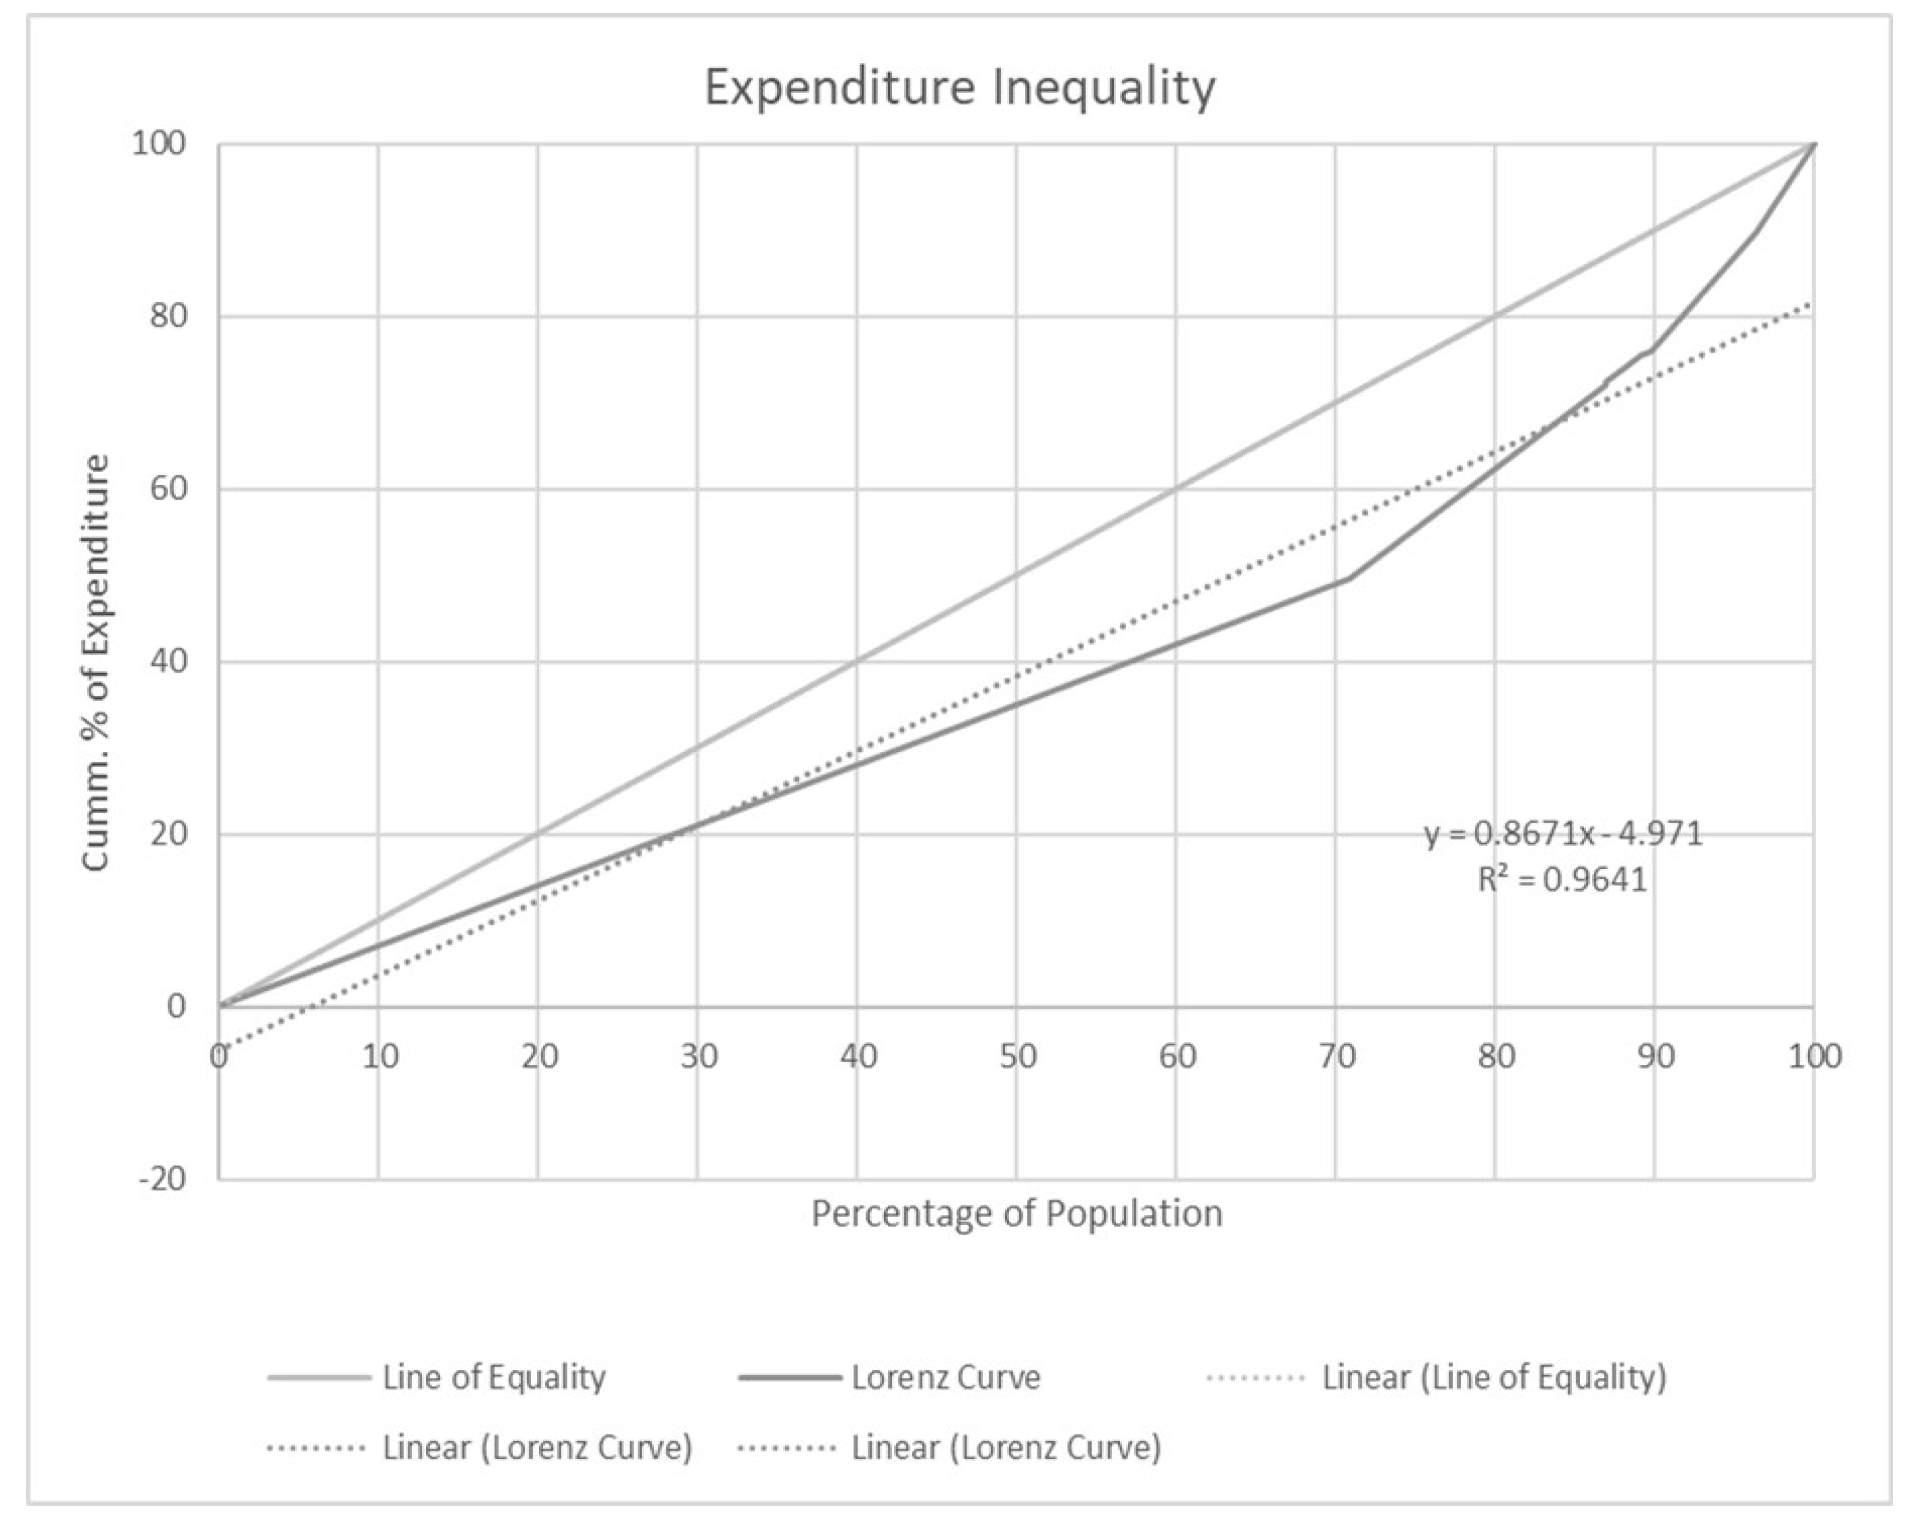
Figure 3, shows the Lorenz curve for water expenditure in the study area as a single area unit, from the analysis of the chart it shows that the arear under Lorenz curve has a value of 38.36, while the area under A depict a value of 22.46, the Gini index for the expenditure stood at 49.45 (0.49) while the R2 value indicates 0.97. This gives a similar value to the values obtained for each of the portioned unit within the study area.
Figure 2.
illustrate the Lorenz curve pattern of income for the whole study area as a single unit, the area under Lorenz curve has a value of 27.56, while area under A equals 22.46, the Gini index for the whole area stood at 49.45 (0.49) while the R2 value shoes 0.92, from the chart analysis the value for the study area as a unit does not show great disparity from the partitioned units.
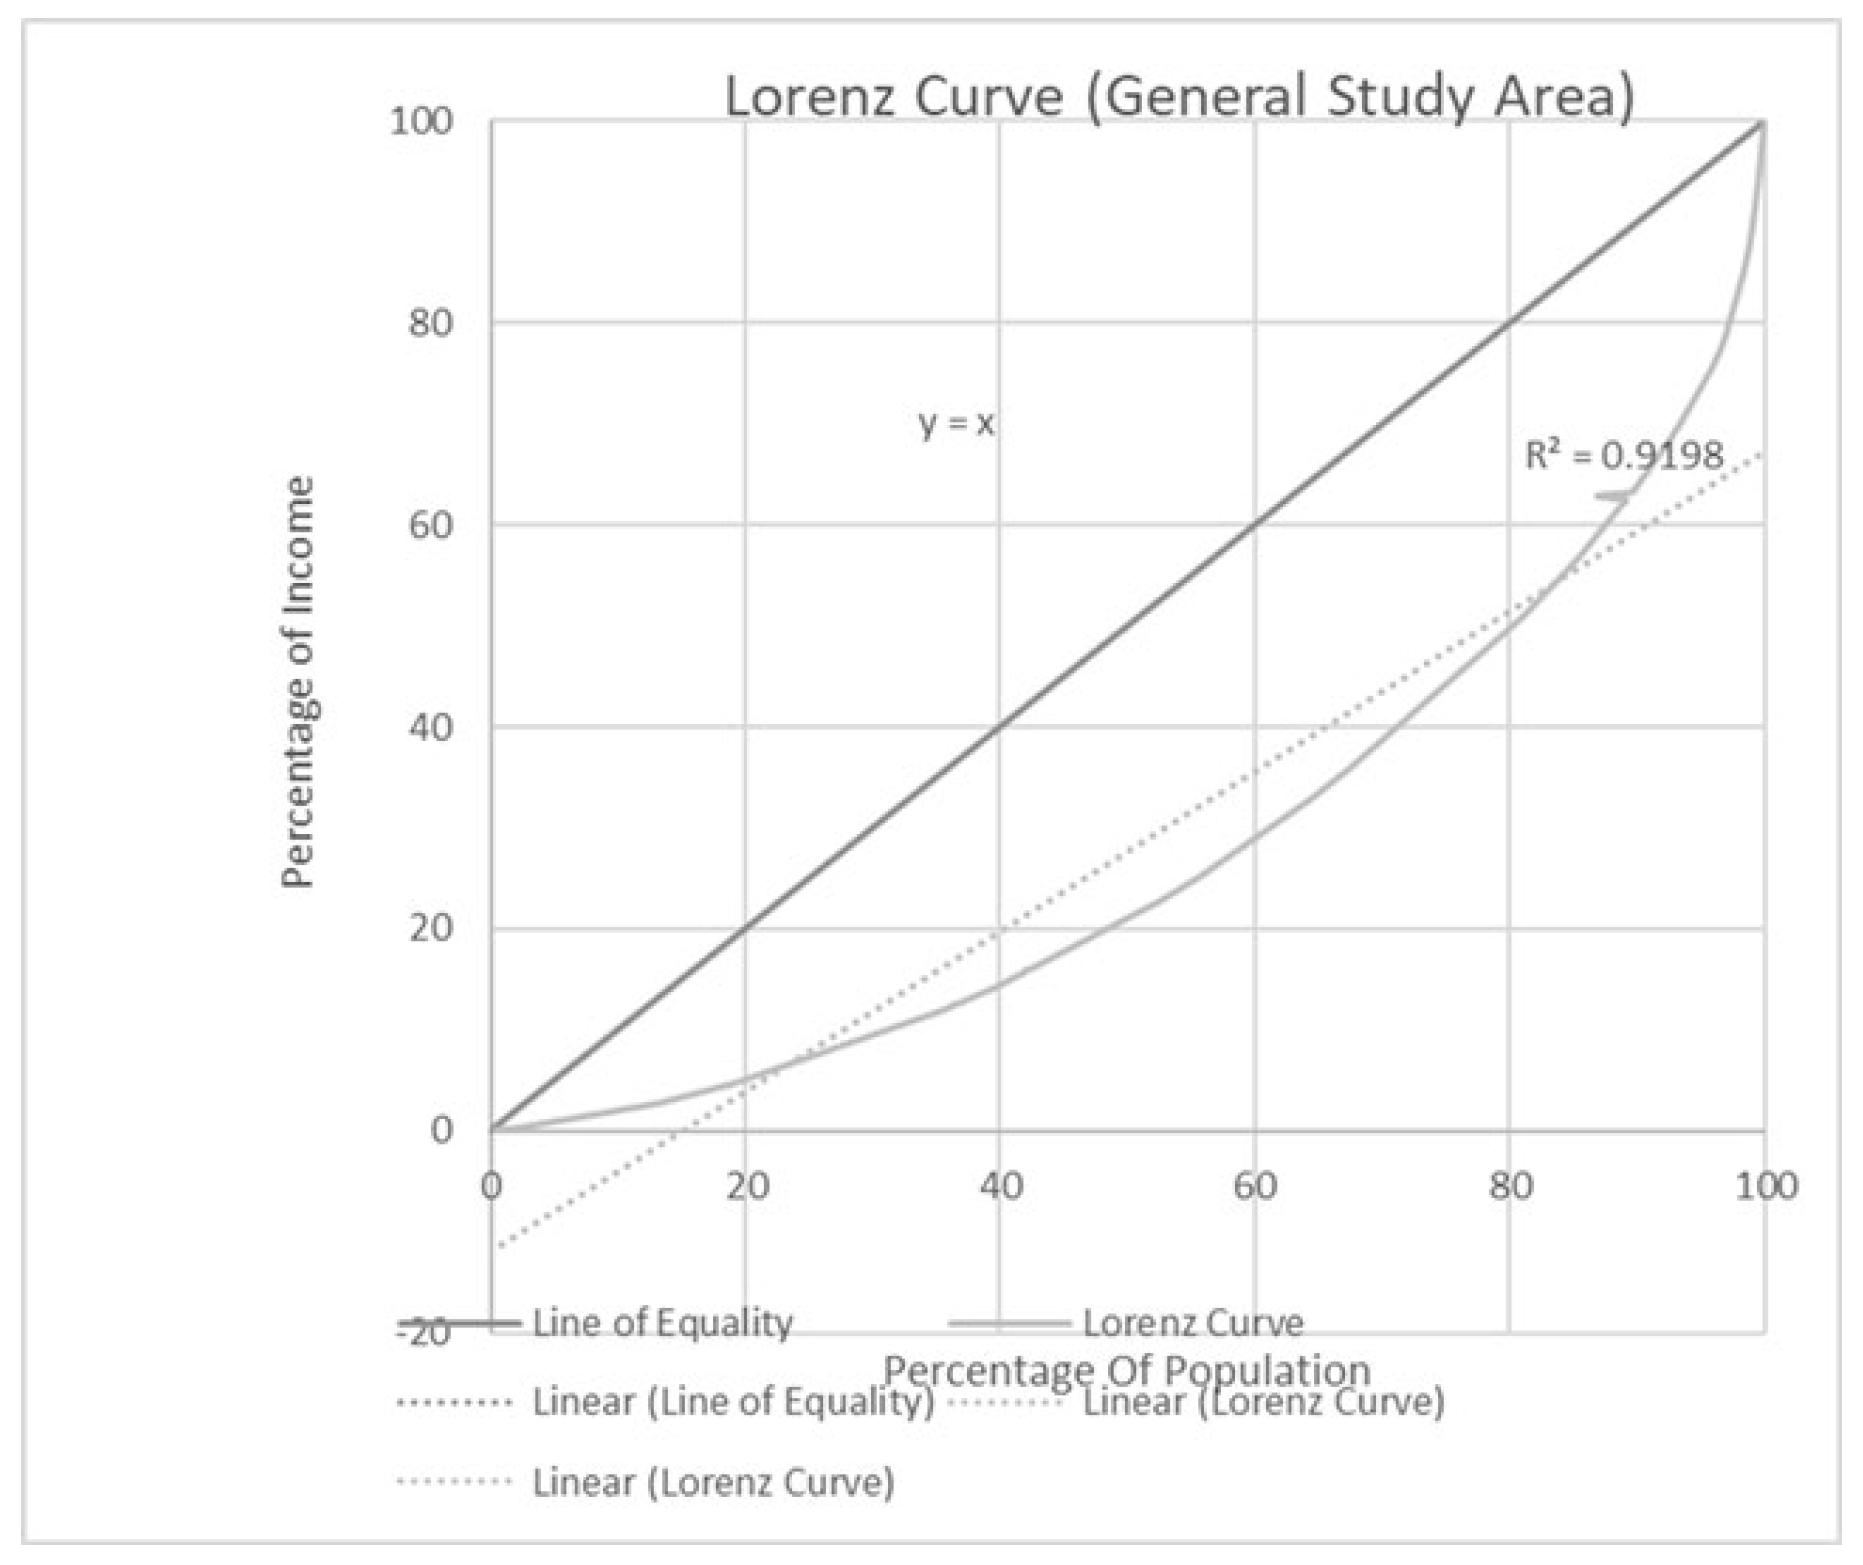
Figure 3.
Lorenz Curve Graph for general water Expenditure in the study Area.
Atkinson Index and Social Welfare Function
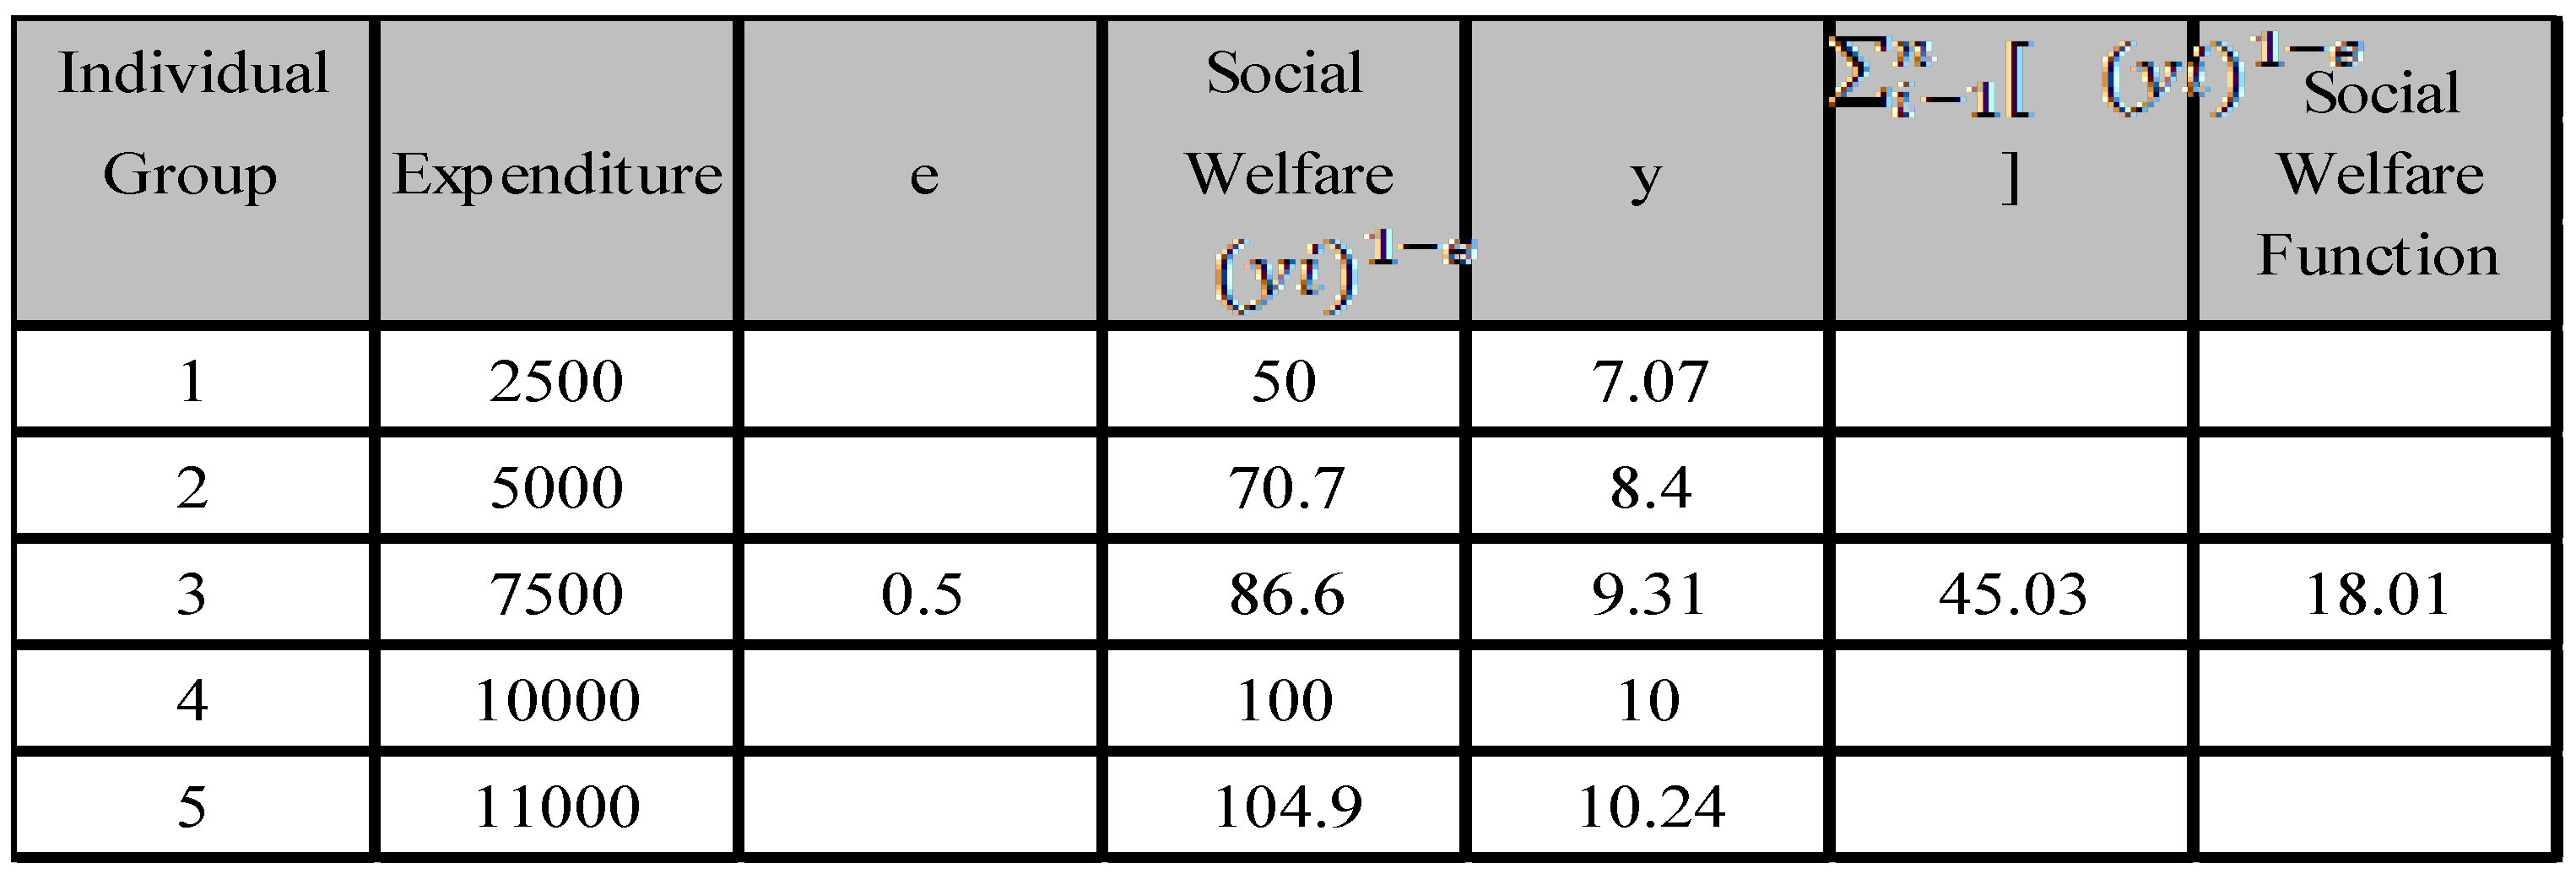
On the other hand, the analysis for the Atkinson Inequality Index measurement, based on water expenditure presented in Table 7, has a value of 0.361, the implication of the findings shows variability in water expenditure thus indicating disparity in access to water consumption, The results imply variances in water costs among households, therefore highlighting the need for the society to sacrifice 36.1 per cent of water expenditure to have equally distributed access as seen from Table 8, within Ijebu Ode metropolis. In addition, Table 9 show the social welfare function of 18.01 indicating the level of social welfare delimited in the income distribution within the study area.
Discussion
Chi-square analysis cross tabulation of average monthly income and vendor water source reveals significant patterns in water access across different income brackets. The analysis shows that a majority of individuals with lower incomes rely heavily on hand pumps or boreholes and public taps for their water supply, indicating dependence on more affordable or communal sources. As income levels rise, there is a noticeable shift towards piped connections and packaged water among higher income brackets. Conversely, the reliance on public taps and hand pumps decreases with increasing income. This suggests that access to more reliable or private water sources increases with income levels which culminate into improve household wealth [59,60].
Similarly, the results of the one-sample t-test for variation in the average cost of water purchased by households indicated a highly significant result, this result suggests that there is a significant variation in the average cost of water purchased by households. The results imply differences in water costs among households, highlighting notable disparities in water expenditure within Ijebu Ode metropolis, this highlight inequalities in water access within the informal sector. The ANOVA (Analysis of Variance) results for the examination of inequality in informal water sources based on income group show a statistically significant difference. The analysis indicates that there is variability between income groups in terms of their reliance on informal water sources, as evidenced by a significant F-value, The between-groups variation is statistically greater than the within-groups variation), suggesting that income level influences the choice of informal water sources among households. This finding implies that income-based disparities play a role in determining access to informal water sources in Ijebu-Ode metropolis, [61].
In addition, to obtain the Gini indices for access to water, the cumulative percentages of income for each of the polling unit on the y-axis of the Lorenz curve and the cumulative percentage of population for the regions on the x-axis, was carried out, this was also done for water expenditure. With no complete taxonomy of the Gini index present for water access, the one used in this study is centred around, [62] justification of the Gini index, a Gini index of less than 0.2 is presented as low inequality, 0.2–0.3 is regarded as moderate inequality, and greater than 0.3 is taken as high level of inequality. The Gini index for income within the nine polling units lies between 49.25 and 49.54 while the Gini index for the entire study area base on income is 49.45, this pinpoint the importance of income on access to water, furthermore, the Gini index for the water expenditure for the study area is 49.23, this sum up to an average Gini indices of 0.49, the implication is that there is variability and higher inequality in water access exist in the study area (Cole et al. 2018), this corroborated the findings above that income has major influence in determining the choice of informal water sources among households. This finding emphasizes the fact that income-based disparities play a role in determining access to informal water sources in Ijebu-Ode metropolis.
On the other hand, the Atkinson Inequality Index based on water expenditure presented in Table 7, has a value of 0.361, the implication of the findings shows variability in water expenditure which creates disparity in access to water consumption, if compared to the Lorenz curve result and also following, [62] the results imply variances in water costs among households, therefore highlighting existence of notable disparities in water expenditure within Ijebu Ode metropolis.
Conclusion
The major task of the research investigates disparities in water access within the informal sector, and further analyses of how income and cost of water influences reliance and access to different water sources by residents, taking average monthly income as a determinant of vendor water source to examine if there is a significant pattern in vendor water source based on resident’s income. Result indicates that, as income levels rise, there is a noticeable shift towards piped connections (6.2%) and packaged water (9.4%) among higher income brackets. Conversely, the reliance on public taps and hand pumps decreases with increasing income. This suggests that access to more reliable or private water sources increases with income levels, highlighting inequalities in water access within the informal sector. In addition to the above, on the examination of inequality in informal water sources based on income and expenditure indicates that the Gini index all the nine spatial areal units ranges between 49.25 to 49.54 while Gini Index for expenditure is 49.23, this is also reflected in the Atkinson Index of 0.361.
Originating from the highlights above, the provision of water for fair access must be based on the structure of the prevailing social links, in which societies should not be measured as a set of those who only would pay for use of a water source, those who are unable to bear high cost before having access to water must be considered. In addition, channel for access to loans services for the informal water market sector and where possible, water subsidy should be incorporated into the water supply policy to reduce the effects of market forces affecting price of services.
Funding
Please add: “This research received no external funding”.
Acknowledgments
The authors acknowledge the support and necessary advice given by Dr W.O. Otun, during the entire period of this study and preparation of the manuscript.
Conflicts of Interest
“The authors declare no conflicts of interest.
References
- Un-Water,, “The United Nations World Water Development Report 2021: Valuing water,” UN, 2021.
- United Nation, , “The United Nations world water development report 2014,” UN-Water, 2014.
- Food and Agriculture Organization, “Water for sustainable food and agriculture,” 2017.
- Rogers P., Bhatia R., and Huber H., “Water as a social and economic good: How to put the principle into practice,” Global Water Partnership, vol. 2, pp. 4-35, 1998.
- Opschoor, J. H., “Water and merit goods. International Environmental Agreemen,” Politics, Law and Economics, vol. 6, no. 4, pp. 423-428, 2006.
- Van der Zaag, P., & Savenije, H. H, “Water as an economic good: The value of pricing and the failure of markets.,” UNESCO, 2006.
- UNESCO, ISSC, & IDS., “World social science report 2016: Challenging inequalities: Pathways to a just world,” UNESCO, ISSC, & IDS., 2016.
- Luis, A. A., Chellaraj, G., Das Gupta, B., Grabinsky, J., & Joseph, G, “An evaluation of the contributing factors of water scheme failures in Nigeria,” in Policy Research Working Paper No. 8371, 2018.
- Du Plessis, A, “Global water availability, distribution and use. In Freshwater challenges of South Africa and its Upper Vaal Rive,” Springer., pp. 3-19, 2016.
- Akpabio, E. M., Udofia, E. S., & Takara, T., “VThe nexus of water and socio-spatial inequality in sub-Saharan Africa: Legacies, strands and agenda for research.,” WATERLAT GOBACIT, vol. 3, no. 2, 2017.
- Akpabio, E. M., & Takara, K., “Understanding and confronting cultural complexities characterizing water, sanitation and hygiene in sub-Saharan Africa.,” Water International. [CrossRef]
- Ingrao, C., Strippoli, R., Lagioia, G., & Huisingh, D., “Water scarcity in agriculture: An overview of causes, impacts and approaches for reducing the risks,” vol. 9, no. 8, 2023. [CrossRef]
- Samra, S., Crowle, J., & Fawzi, M. C. S, “The right to water in rural Punjab: Assessing equitable access to water through the Punjab Rural Water Supply and Sanitation Projec,” Health and Human Rights, vol. 3, no. 2, pp. 36-49, 2011.
- Nation, United, “Beyond scarcity: Power, poverty and the global water crisis. New York: United Nations Development Programme.,” UNDP, New York, 2006.
- UNICEF., “Water, sanitation and hygiene sector-wide sustainability checks report.,” UN, 2022.
- Andres, L. A., Bhatt, S., Dasgupta, B., Echenique, J., Gething, P. W., Zabludovsky, G., & Joseph, G, “Geo-spatial modeling of access to water and sanitation in Nigeria,” 2018. [CrossRef]
- Andres, L A., Borja-Vega, C., Fenwick, C., de Jesus Filho, J., & Gomez-Suarez, R., “Overview and meta-analysis of global water, sanitation, and hygiene (WASH) impact evaluations.,” World Bank, 2018.
- Federal Ministry of Water Resources,, “National water sanitation policy,” Federal Ministry of Water Resources, Abuja, 2004.
- Federal Ministry of Water Resources, “National water resources policy,” FMWR, Abuja, Nigeria, 2016.
- Acey, C., “Access to water in Nigerian cities: Advocating for Africa’s urban poor,” GRCA Publication, 2007.
- Agada, S, “Nigeria’s informal water providers: Filling in the public gaps,” in Public water and COVID-19: Dark clouds and silver linings, S. J. S. &. D. C. D. A. McDonald, Ed., Amsterdam, Municipal Service Project (Kingston), Transnational Institute (Amsterdam) and Latin America Council of Social Sciences, 2020, pp. 281-290.
- Obeta, M. C., “Private for-profit rural water supply in Nigeria: Policy constraints and options for improved performance.,” Journal of Water and Land Development, vol. 41, no. 4-6, pp. 101-110, 2019. [CrossRef]
- Ezenwaji, E. E., Eduputa, B. M., & Okoye, C., “Water demand and supply in Enugu metropolitan area, Nigeria,” American Journal of Water Resources, vol. 4, no. 1, pp. 22-29., 2016.
- Adeleye, B., Medayese, S., & Okelola, O., “Adeleye, B., Medayese, S., & Okelola, O.,” Journal of Culture, Politics and Innovation, vol. 2, no. 1-9, pp. 1-29, 2014.
- UNICEF., Federal Ministry of Water Resources. (2021). Water sanitation and hygiene national outcome routine mapping: Summary of survey findings., “Water sanitation and hygiene national outcome routine mapping: Summary of survey findings. UNICEF.,” UNICEF, Ngeria, 2021.
- Federal Ministry of Water Resources, “WASHNORM 2021 Report,” UNICEF, Abuja, 2021.
- , World Bank, “Reducing inequalities in water supply, sanitation, and hygiene in the era of the Sustainable Development Goals,” World Bank, Abuja Nigeria, 2017.
- Mirosa, O., & Harris, L, “Human right to water: Contemporary challenges and contours of a global debate.,” pp. 932-949, 2012. [CrossRef]
- Njiru, C., & Albu, M., “Improving access to water through support to small water providing enterprises,” vol. 15, no. 2, pp. 30-36., 2004. [CrossRef]
- Joint Monitoring Programme ((JMP), “Progress on household drinking water, sanitation and hygiene 2000-2022: Special focus on gender. World Health Organization,” WHO/UNICEF, 2023.
- WHO & UNICEF., “Progress on household drinking water, sanitation and hygiene 2000–2017: Special focus on inequalities,” World Health Organization (WHO) and the United Nations Children’s Fund (UNICEF) Joint Monitoring Programme (JMP)., New York, 2015.
- Ishaku, T. H., “Planning for sustainable water supply through partnership approach in Wukari Town, Taraba State of Nigeria,” ournal of Water Resource and Protection, vol. 2, no. 10, pp. 916-922, 2010.
- Emioabino I. U. & Alayande A. W, “Water demand management, problems and prospects of implementation in Nigeria,” in International Congress River Basin Developmen, Antalya, Republic of Turkey, 2007.
- Montgomery M., Bartram J. & Elimelech, M., “Increasing functional sustainability of water and sanitation supplies in rural sub-Saharan Africa,” Environmental Engineering Science, vol. 26, pp. 1017-1023., 2009. [CrossRef]
- United Nations Environmental Programme,, “Global environment outlook 2002. United Nations Environment Programme,” UNEP, 2002.
- Balogun, O. R. & Redina, M. M., “Water supply regulation in Nigeria: Problems, challenges, solutions and benefits,” ournal of Ecology and Life Safety, vol. 27, no. 1, p. 65–81, 2019. [CrossRef]
- Ogun State Water Corporation, “gun State Water Corporation investment plan,” OGSWC, Abeokuta, 2010.
- Coster, A. S. & Otufale, G. A., “Households’ water-use demand and willingness to pay for improved water services in Ijebu Ode Local Government Area, Ogun State, Nigeria,” Journal of Environment and Earth Science,, vol. 4, no. 17, pp. 166-174, 2016.
- George-Williams, H.E.M.; Hunt, D.V.L.; Rogers, C.D.F., “Sustainable water infrastructure: visions and options for Sub-Saharan Africa,” Sustainability, vol. 16, no. 1592, 2024. [CrossRef]
- Mutschinski, K. & Coles, N.A., “The African Water Vision 2025: Its influence on water governance in the development of Africa’s water sector, with an emphasis on rural communities in Kenya,” Water Policy, vol. 23, p. 838–861, 2025. [CrossRef]
- Dangui, K. & Jia, S., “Water Infrastructure Performance in Sub-Saharan Africa: An Investigation of the Drivers and Impact on Economic Growth,” Water, vol. 14, 2025. [CrossRef]
- Aiyetan, A.O. & Das, D.K, “Evaluation of the Factors and Strategies for Water Infrastructure Project Delivery in South Africa,” vol. 6, p. 65, 2021. [CrossRef]
- Mohieldin, M., “The sustainable development goals and private sector opportunities,” EAFIT. University of Medellín Available, 2017.
- Dernbach, J. C., “Sustainable development as a framework for national governance,” Case Western Reserve Law Review, vol. 49, no. 1, p. Case Western Reserve Law Review, 1998.
- Mensah, J., “Sustainable development: Meaning, history, principles, pillars, and implications for human action: Literature review,” Cogent Social Sciences, vol. 5, no. 1, 2019. [CrossRef]
- Gray, R., “Is accounting for sustainability actually accounting for sustainability and how would we know? An exploration of narratives of organisations and the planet.,” Accounting, Organizations and Society, vol. 35, no. 1, pp. 47-62, 2010. [CrossRef]
- Diesendorf, M, “Sustainability and sustainable development.,” in Sustainability: The corporate challenge of the 21st century, Sydney, Allen & Unwin., 2000, pp. 19-37.
- Roger C, Makana L., Leach J. & UKCRIC Community, The Little Book of THEORRY OF CHANGE for Infrastructures and Cities, Birmingham: University of Birmingham, 2023.
- Roger, C., “Engineering future liveable, resilient, sustainable cities using foresight,” Civil Engineering, vol. 171, no. 2, pp. 1-7, 2018.
- Barde, J.A., “What determines access to piped water in rural areas? Evidence from small-scale supply systems in rural Brazi,” World Dev., 2017. [CrossRef]
- Empinotti, V., “What if I don’t want to participate? The case of non- participation in the election of the Sao Francisco River Basin Committee,” Campinas, vol. 14, no. 1, p. 2011, 2011.
- Rodríguez, C, Serrano . J, Sánchez. R. & Leiva, E., “The Hydrosocial Cycle and the Inequalities in Access to Water in Rural Areas of Metropolitan Region of Santiago, Chile,” Water, vol. 16, no. 2811, 2024. [CrossRef]
- Boelens .R, Hoogesteger . J, Swyngedouw, E, Vos . J & Wester. P., “Hydrosocial Territories: A Political Ecology Perspective.,” Water International, vol. 41, pp. 1-14, 2016.
- Inc, Encyclopædia Britannica, “Encyclopædia Britannica Inc,” Encyclopædia Britannica Inc, 2012. [Online]. Available: http://www.britannica.com/EBchecked/topic/282512/Ijebu-Ode.
- Mabogunje. A. L., & Roberts. K. W, “Sustainable development in Ijebu-Ode, Nigeria: The role of social capital, participation, and science and technology.,” Sustainable Development Program, Harvard, 2004.
- M. &. O. O. Oke, “Assessment of rainwater harvesting potential and challenges in Ijebu Ode, Southwestern part of Nigeria for strategic advice,” Scientific Annals of Al. I., vol. 60, 2012.
- Review, World Population, “Ijebu-Ode population,” World Population Review., 2022. [Online]. Available: worldpopulationreview.com.
- Kothari. C. R, Research methodology: Methods and techniques, New Age International (P) Ltd., 2007.
- Oskam. M. J., Pavlova. M., Hongoro, C. & Groot, W., “Socio-economic inequalities in access to drinking water among inhabitants of informal settlements in South Africa,” International Journal of Environmental Research and Public Health,, vol. 18, no. 10528, 2021. [CrossRef]
- Mulenga. J. N., Bwalya B. B., & Kaliba-Chishimba, K., “Determinants and inequalities in access to improved water sources and sanitation among the Zambian households,” International Journal of Development and Sustainability, vol. 6, no. 6, pp. 746-762., 2017.
- Omondi, B. A. & Jackson, M. I., “Household heads characteristics and access to water in Kenya,” European Scientific Journal, vol. 18, no. 15, 2022. [CrossRef]
- Cole, M. J, Bailey, R. M Cullis, J. D. S. & New, M. G., “Spatial inequality in water access and water use in South Africa,” Water Policy, vol. 20, pp. 37-52., 2018. [CrossRef]

Table 1.
Cross tabulation of Average Monthly Income * Vendor water source.
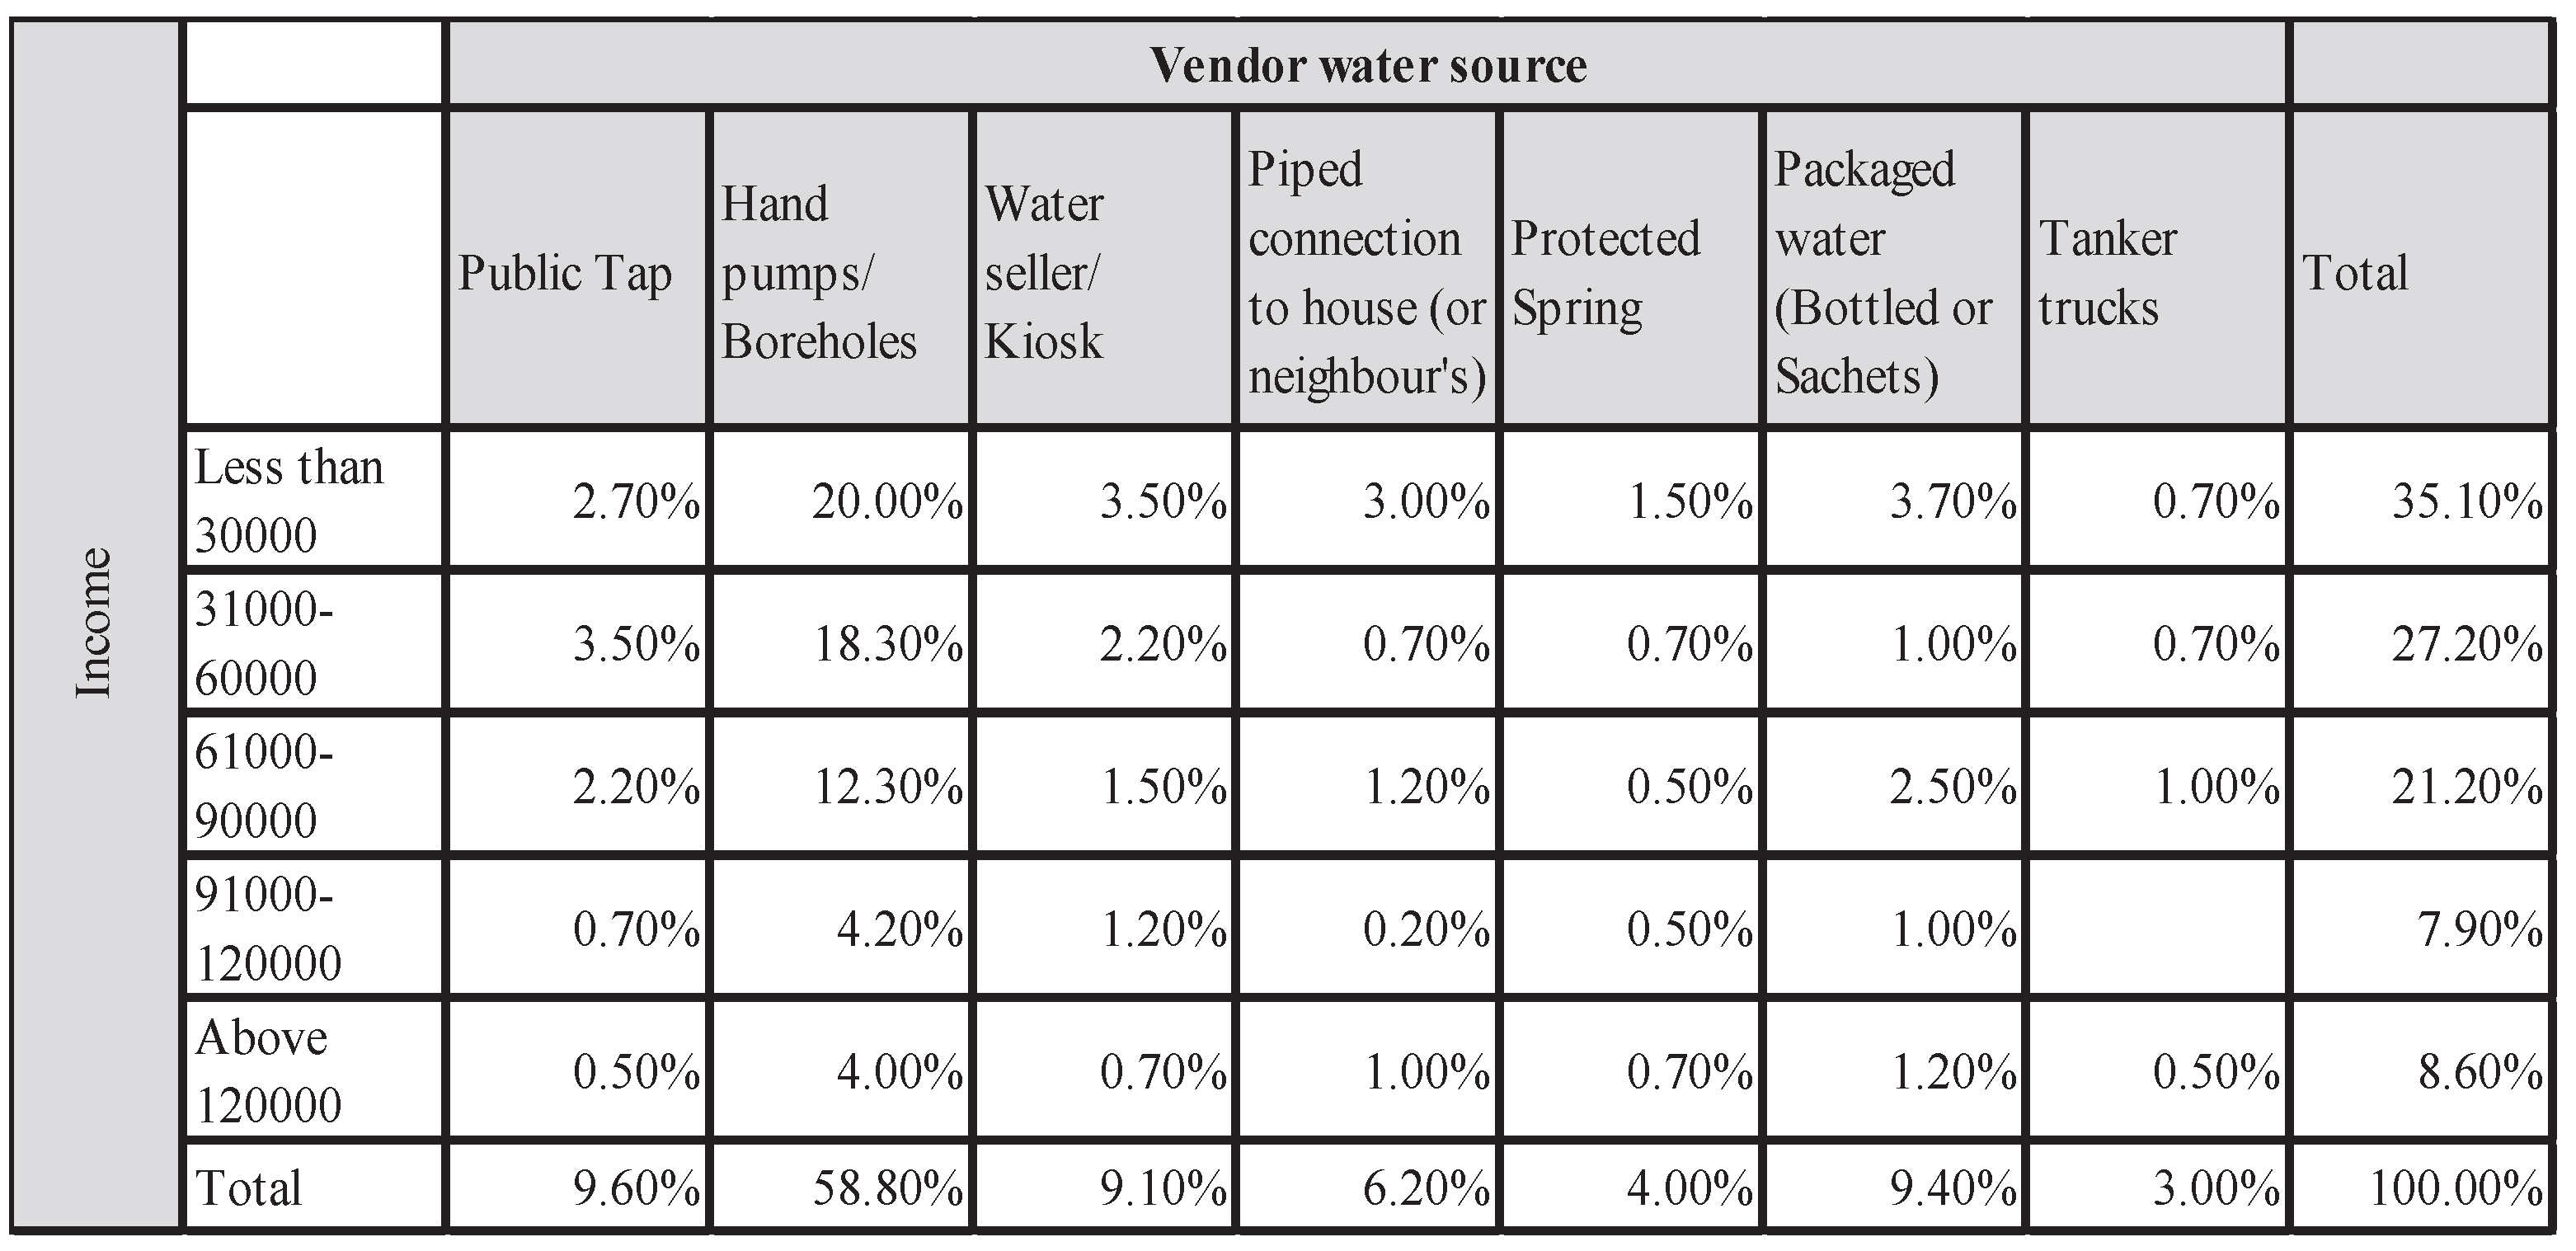 |
Table 2.
Chi-Square Tests of Average Monthly Income and Vendor water source.
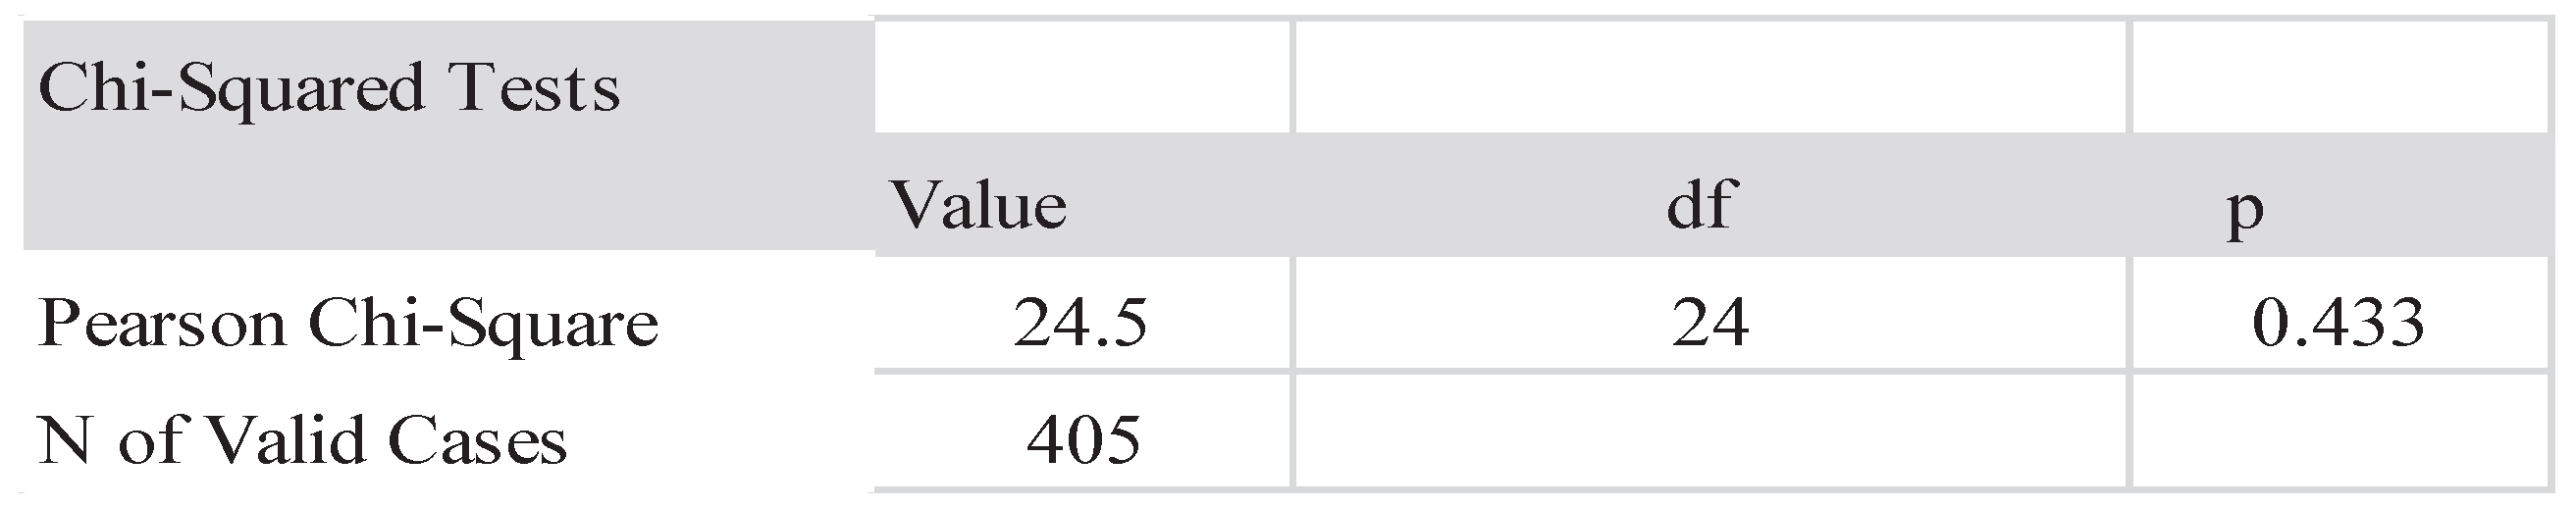 |
Table 3.
One sample t-test of variation in Cost of water purchased by households.
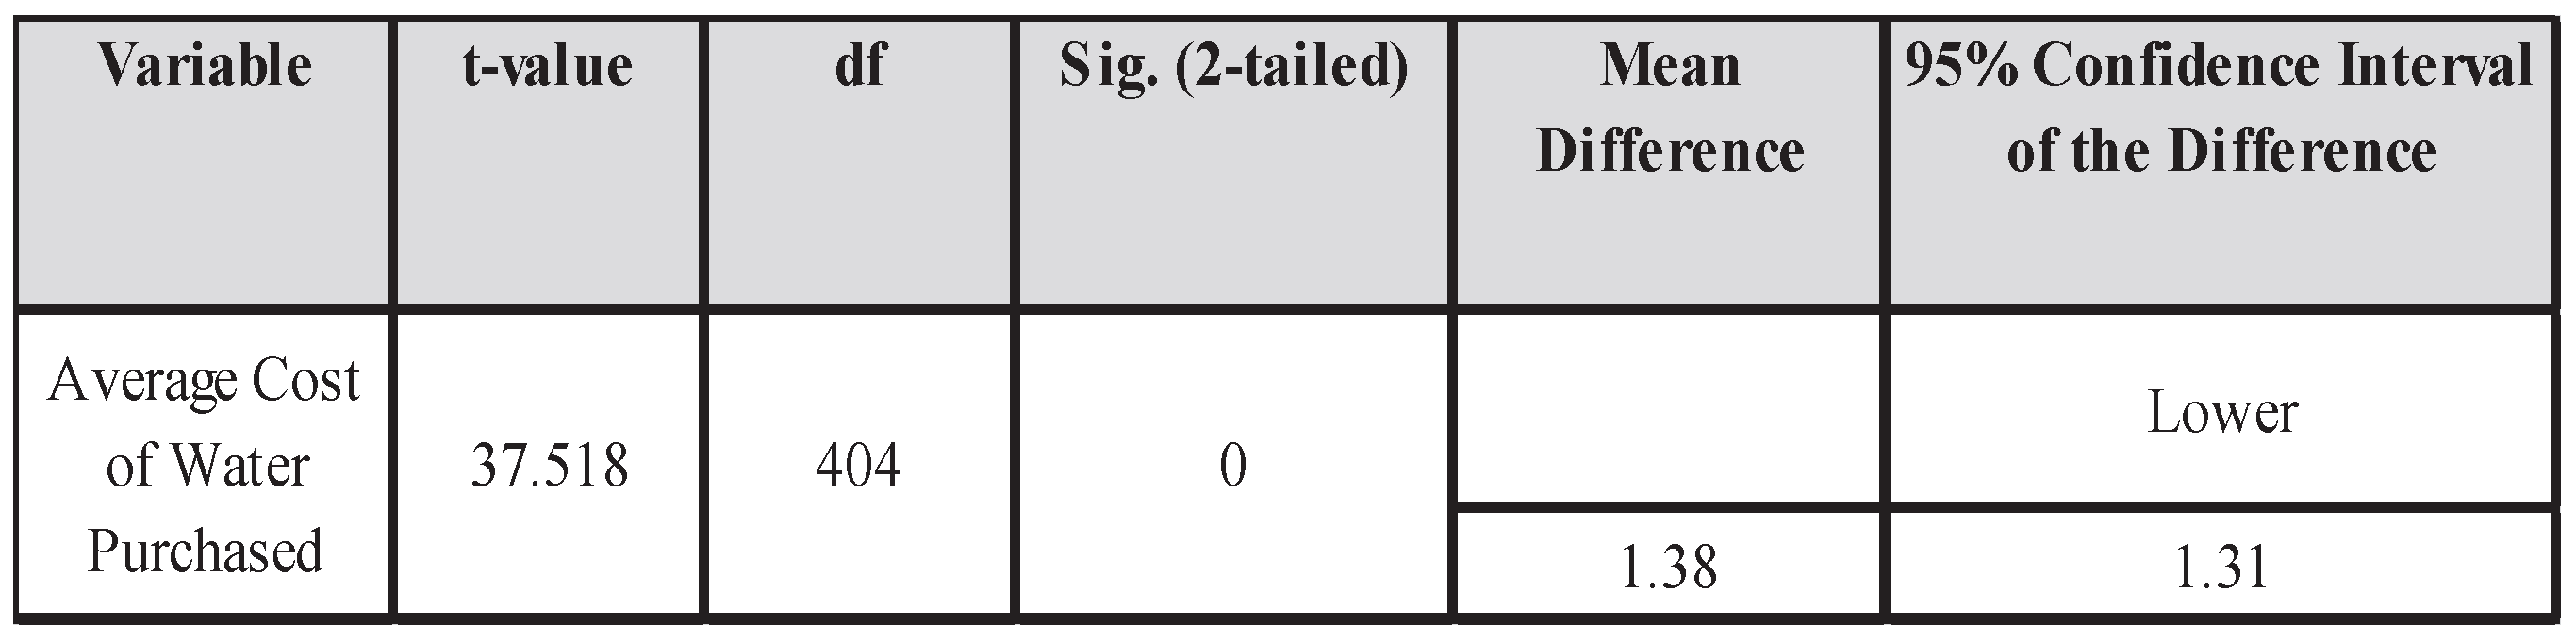 |
Table 4.
ANOVA Result of variation in Income Group.
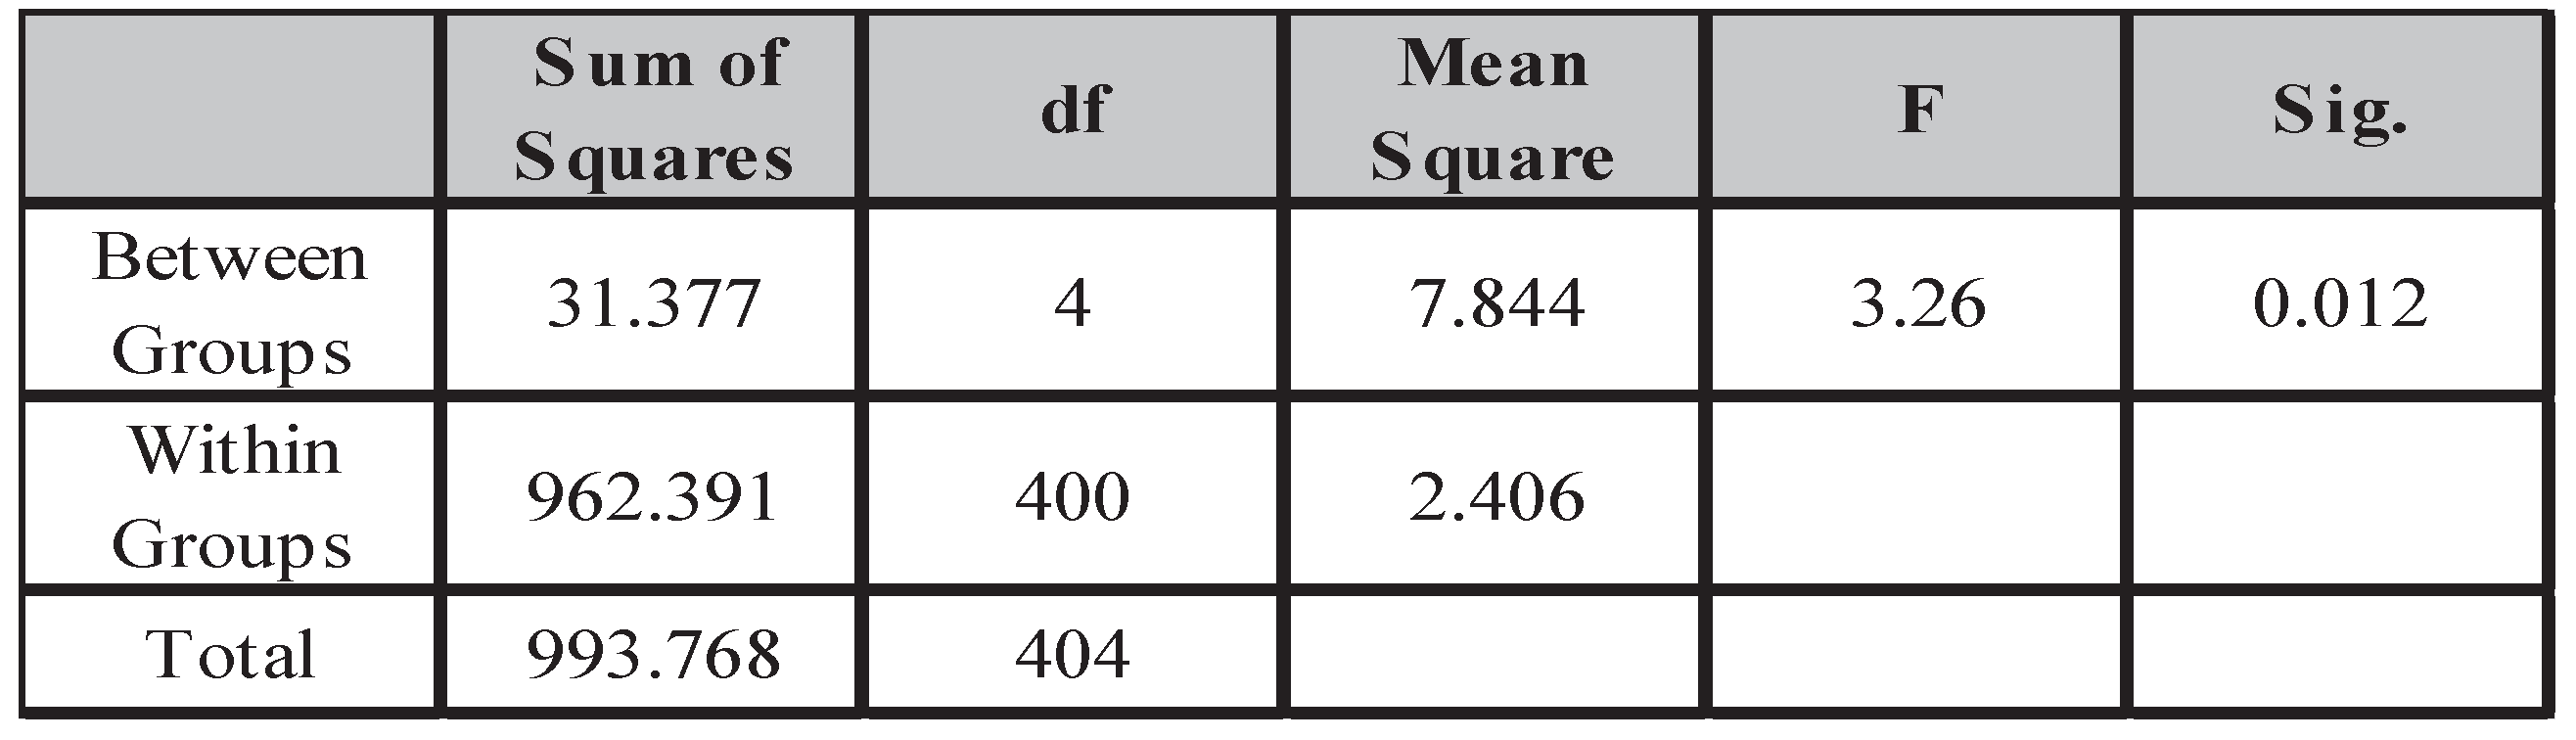 |
Table 5.
Summary of the Lorenz Curve Analysis.
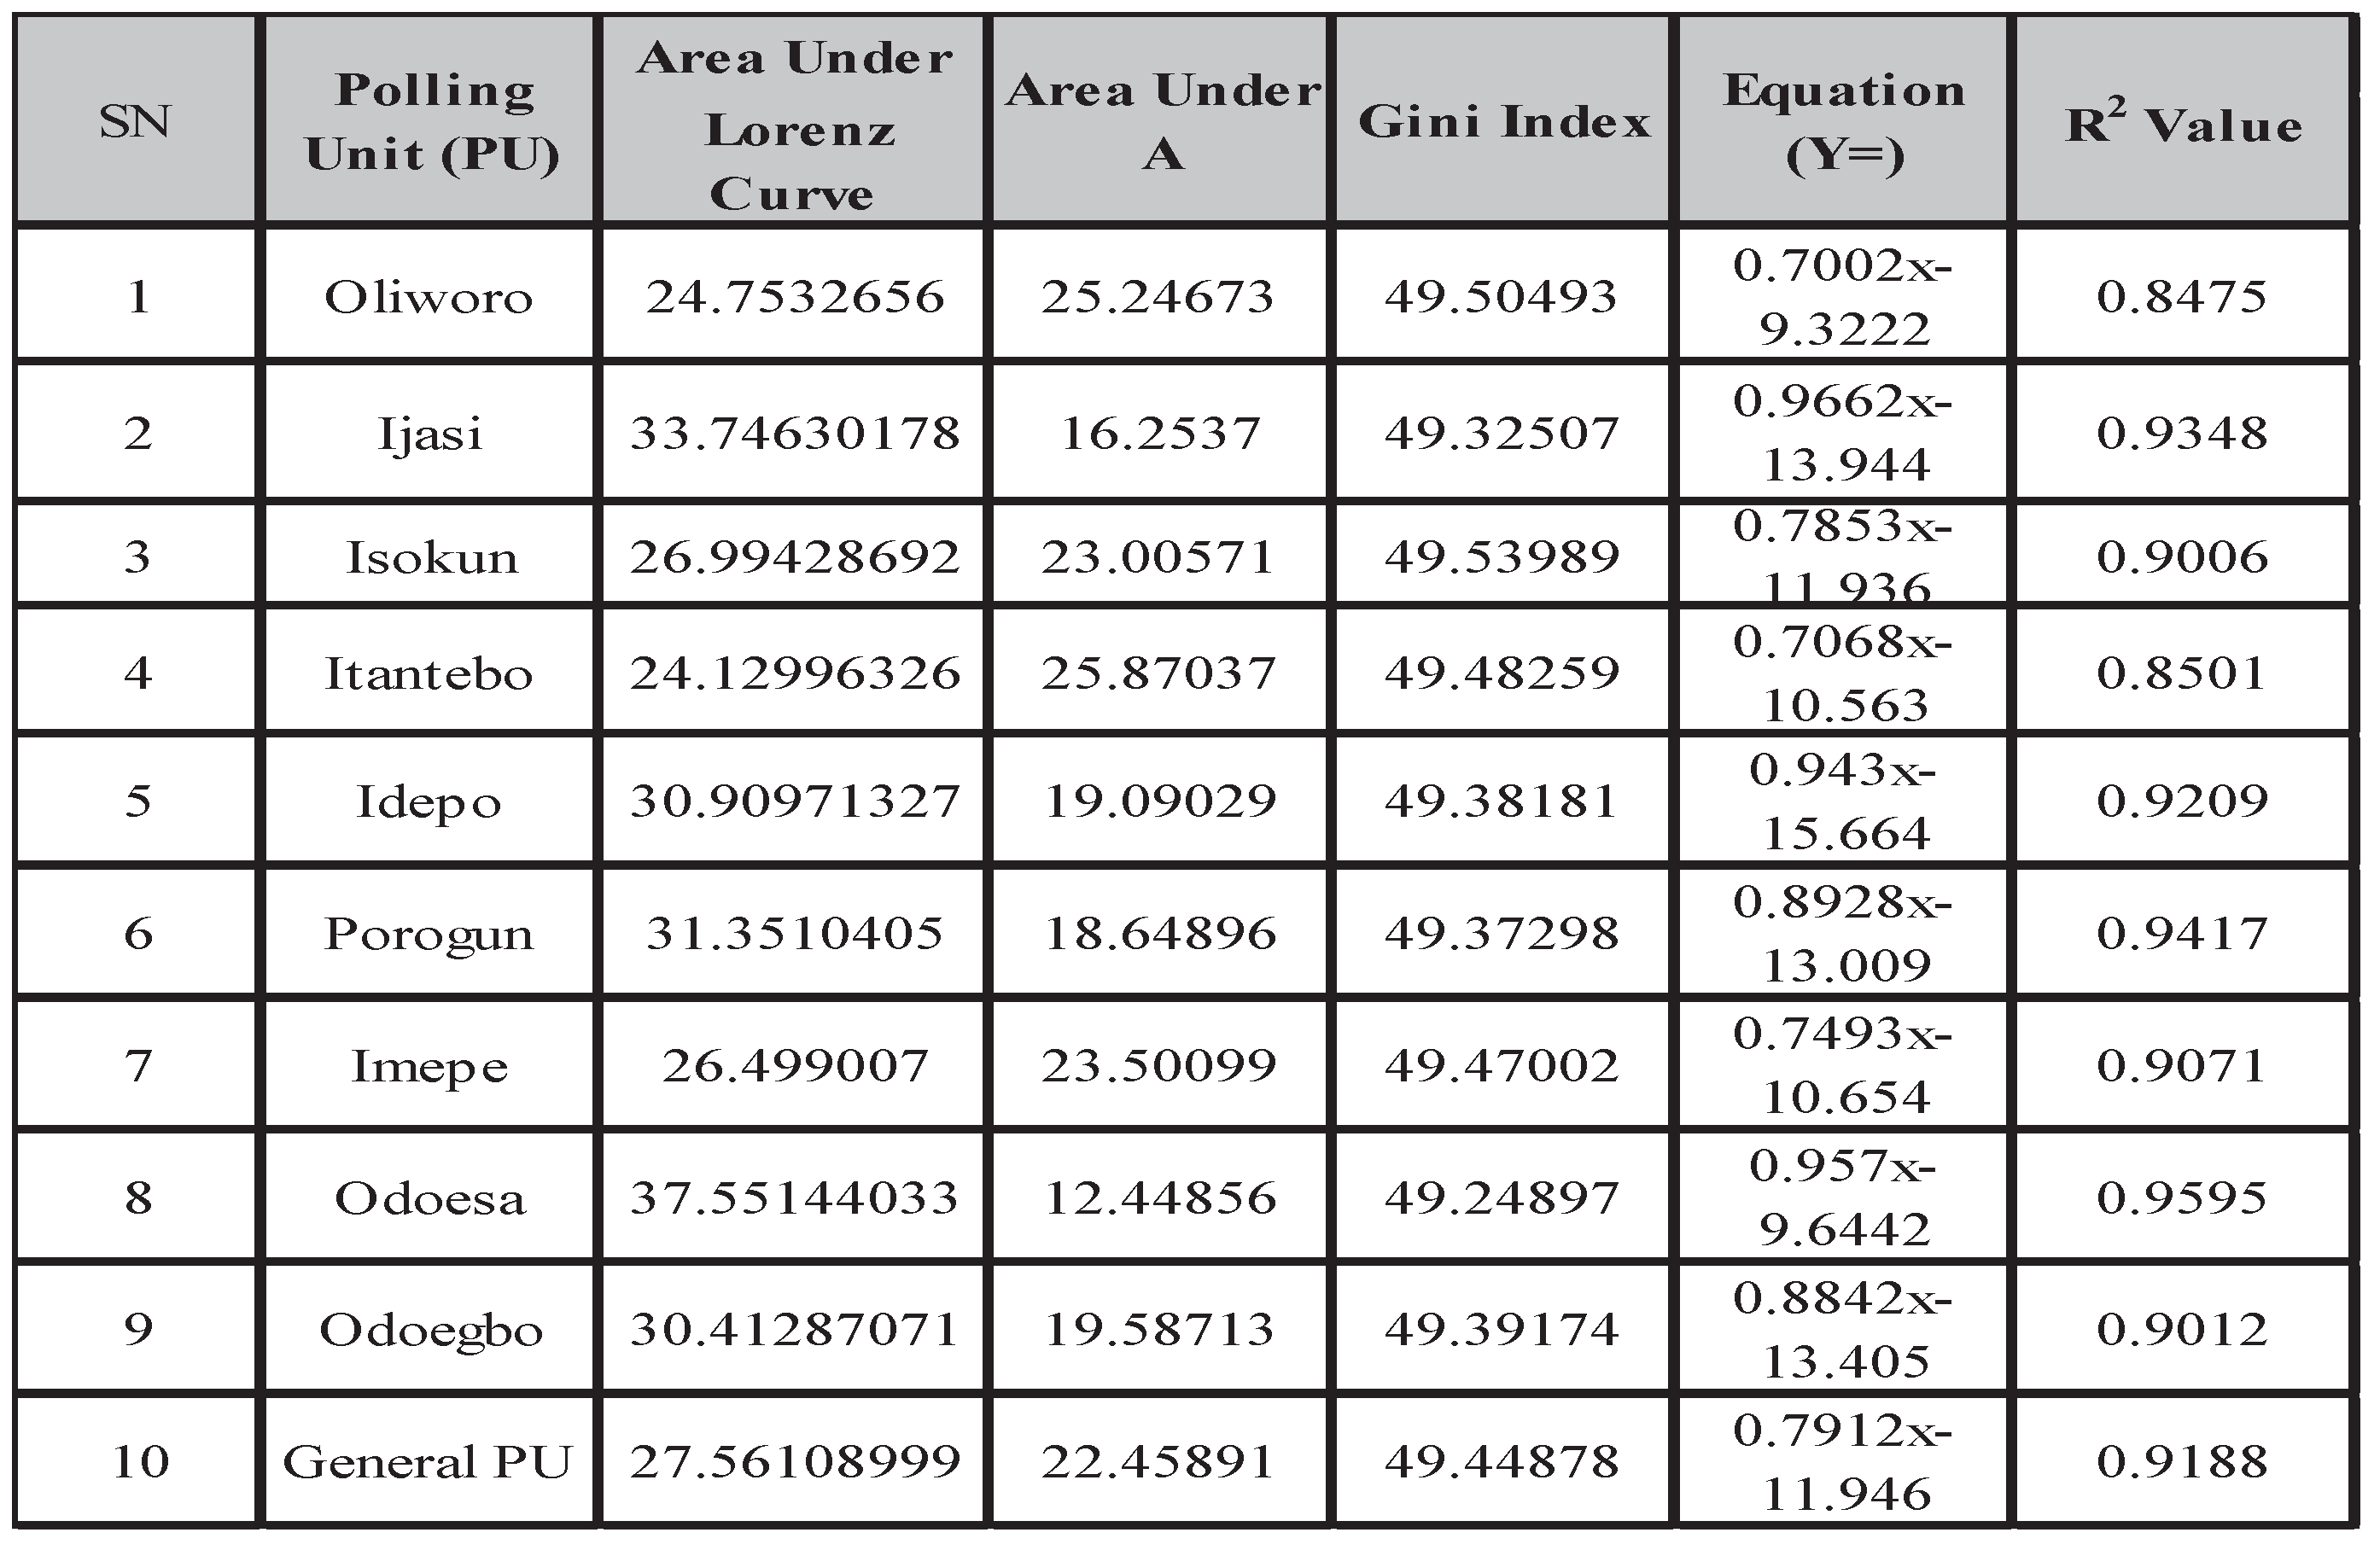 |
Table 6.
Summary of the Lorenz Curve Analysis for Water Expenditure.
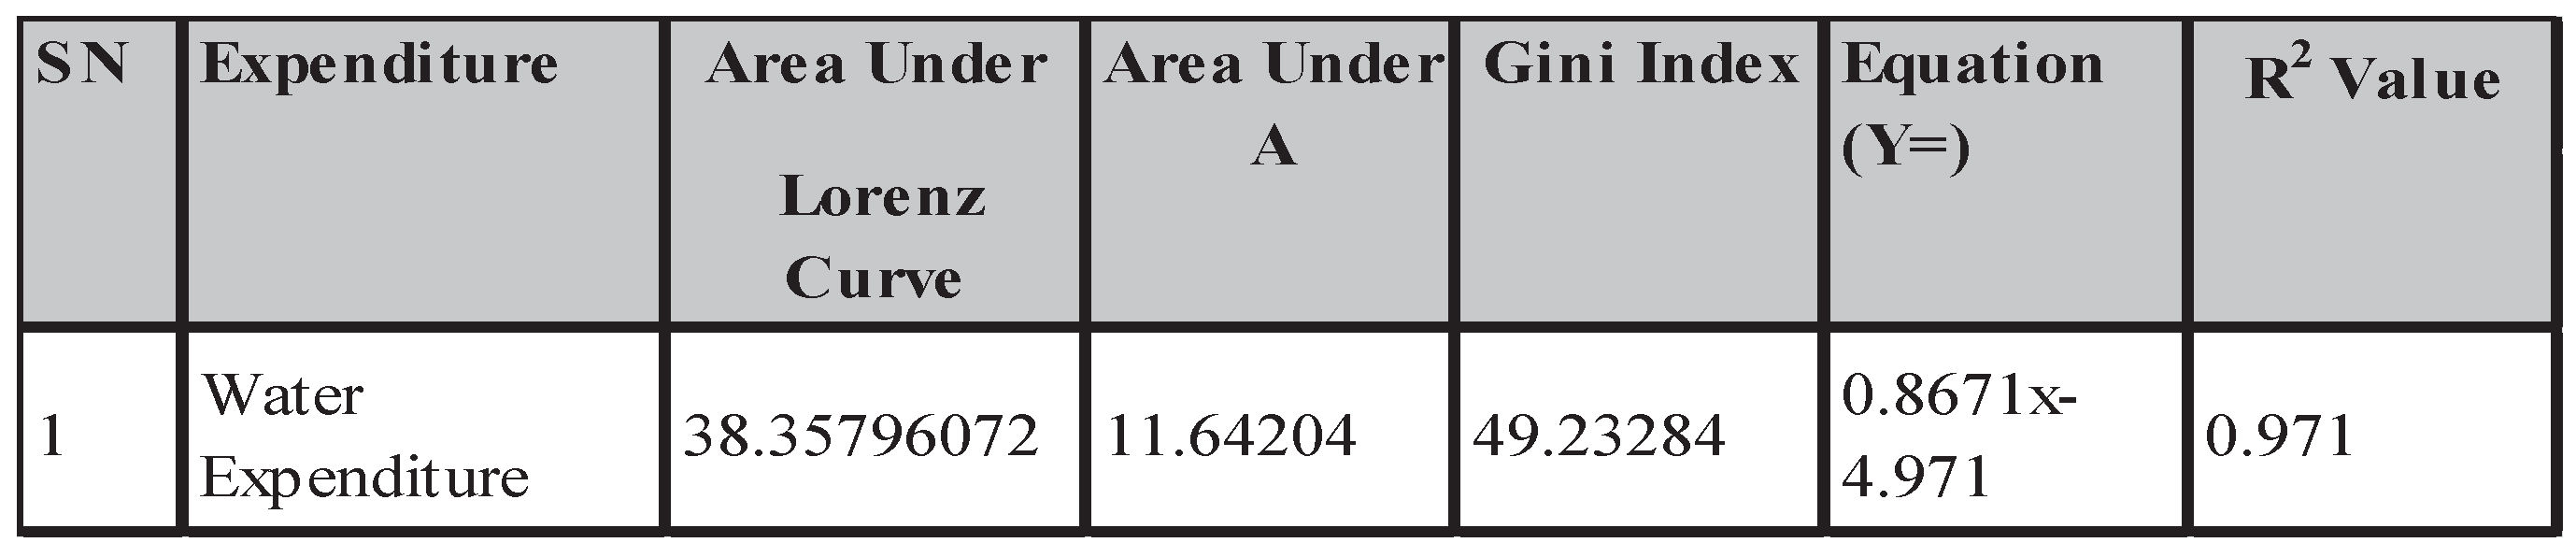 |
Table 7.
Summary Table for Atkinson Index.
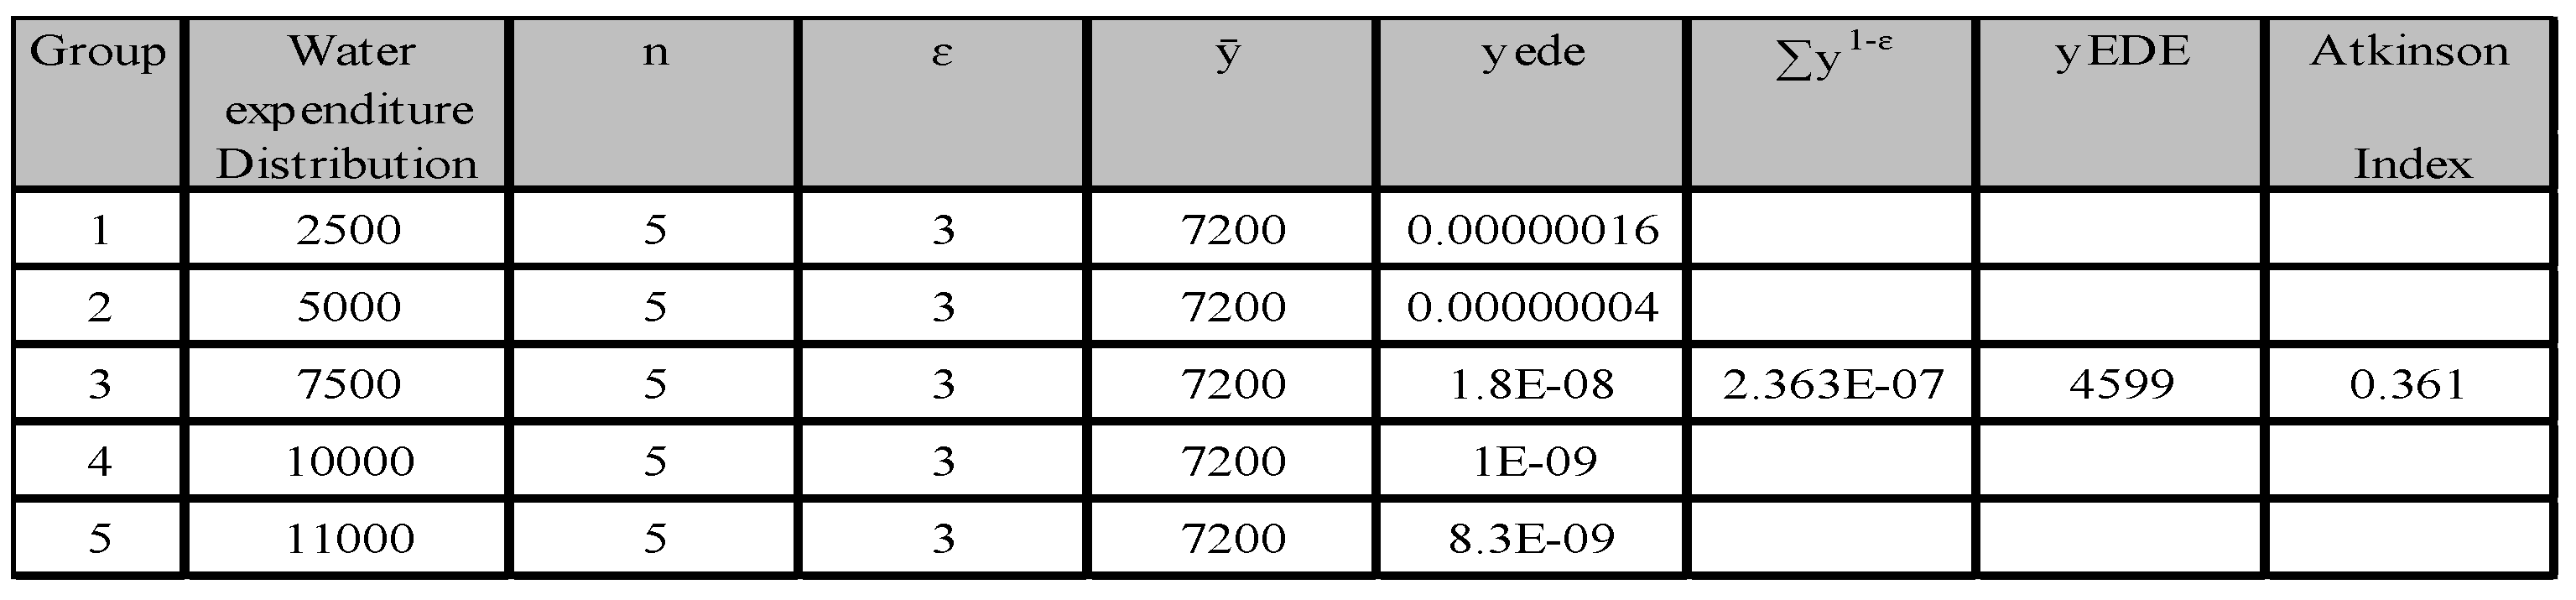 |
Table 8.
Summary table for Social Welfare Function and Inequality Aversion.
 |
Disclaimer/Publisher’s Note: The statements, opinions and data contained in all publications are solely those of the individual author(s) and contributor(s) and not of MDPI and/or the editor(s). MDPI and/or the editor(s) disclaim responsibility for any injury to people or property resulting from any ideas, methods, instructions or products referred to in the content. |
© 2026 by the authors. Licensee MDPI, Basel, Switzerland. This article is an open access article distributed under the terms and conditions of the Creative Commons Attribution (CC BY) license (http://creativecommons.org/licenses/by/4.0/).
Copyright: This open access article is published under a Creative Commons CC BY 4.0 license, which permit the free download, distribution, and reuse, provided that the author and preprint are cited in any reuse.


