Submitted:
12 January 2026
Posted:
20 January 2026
You are already at the latest version
Abstract
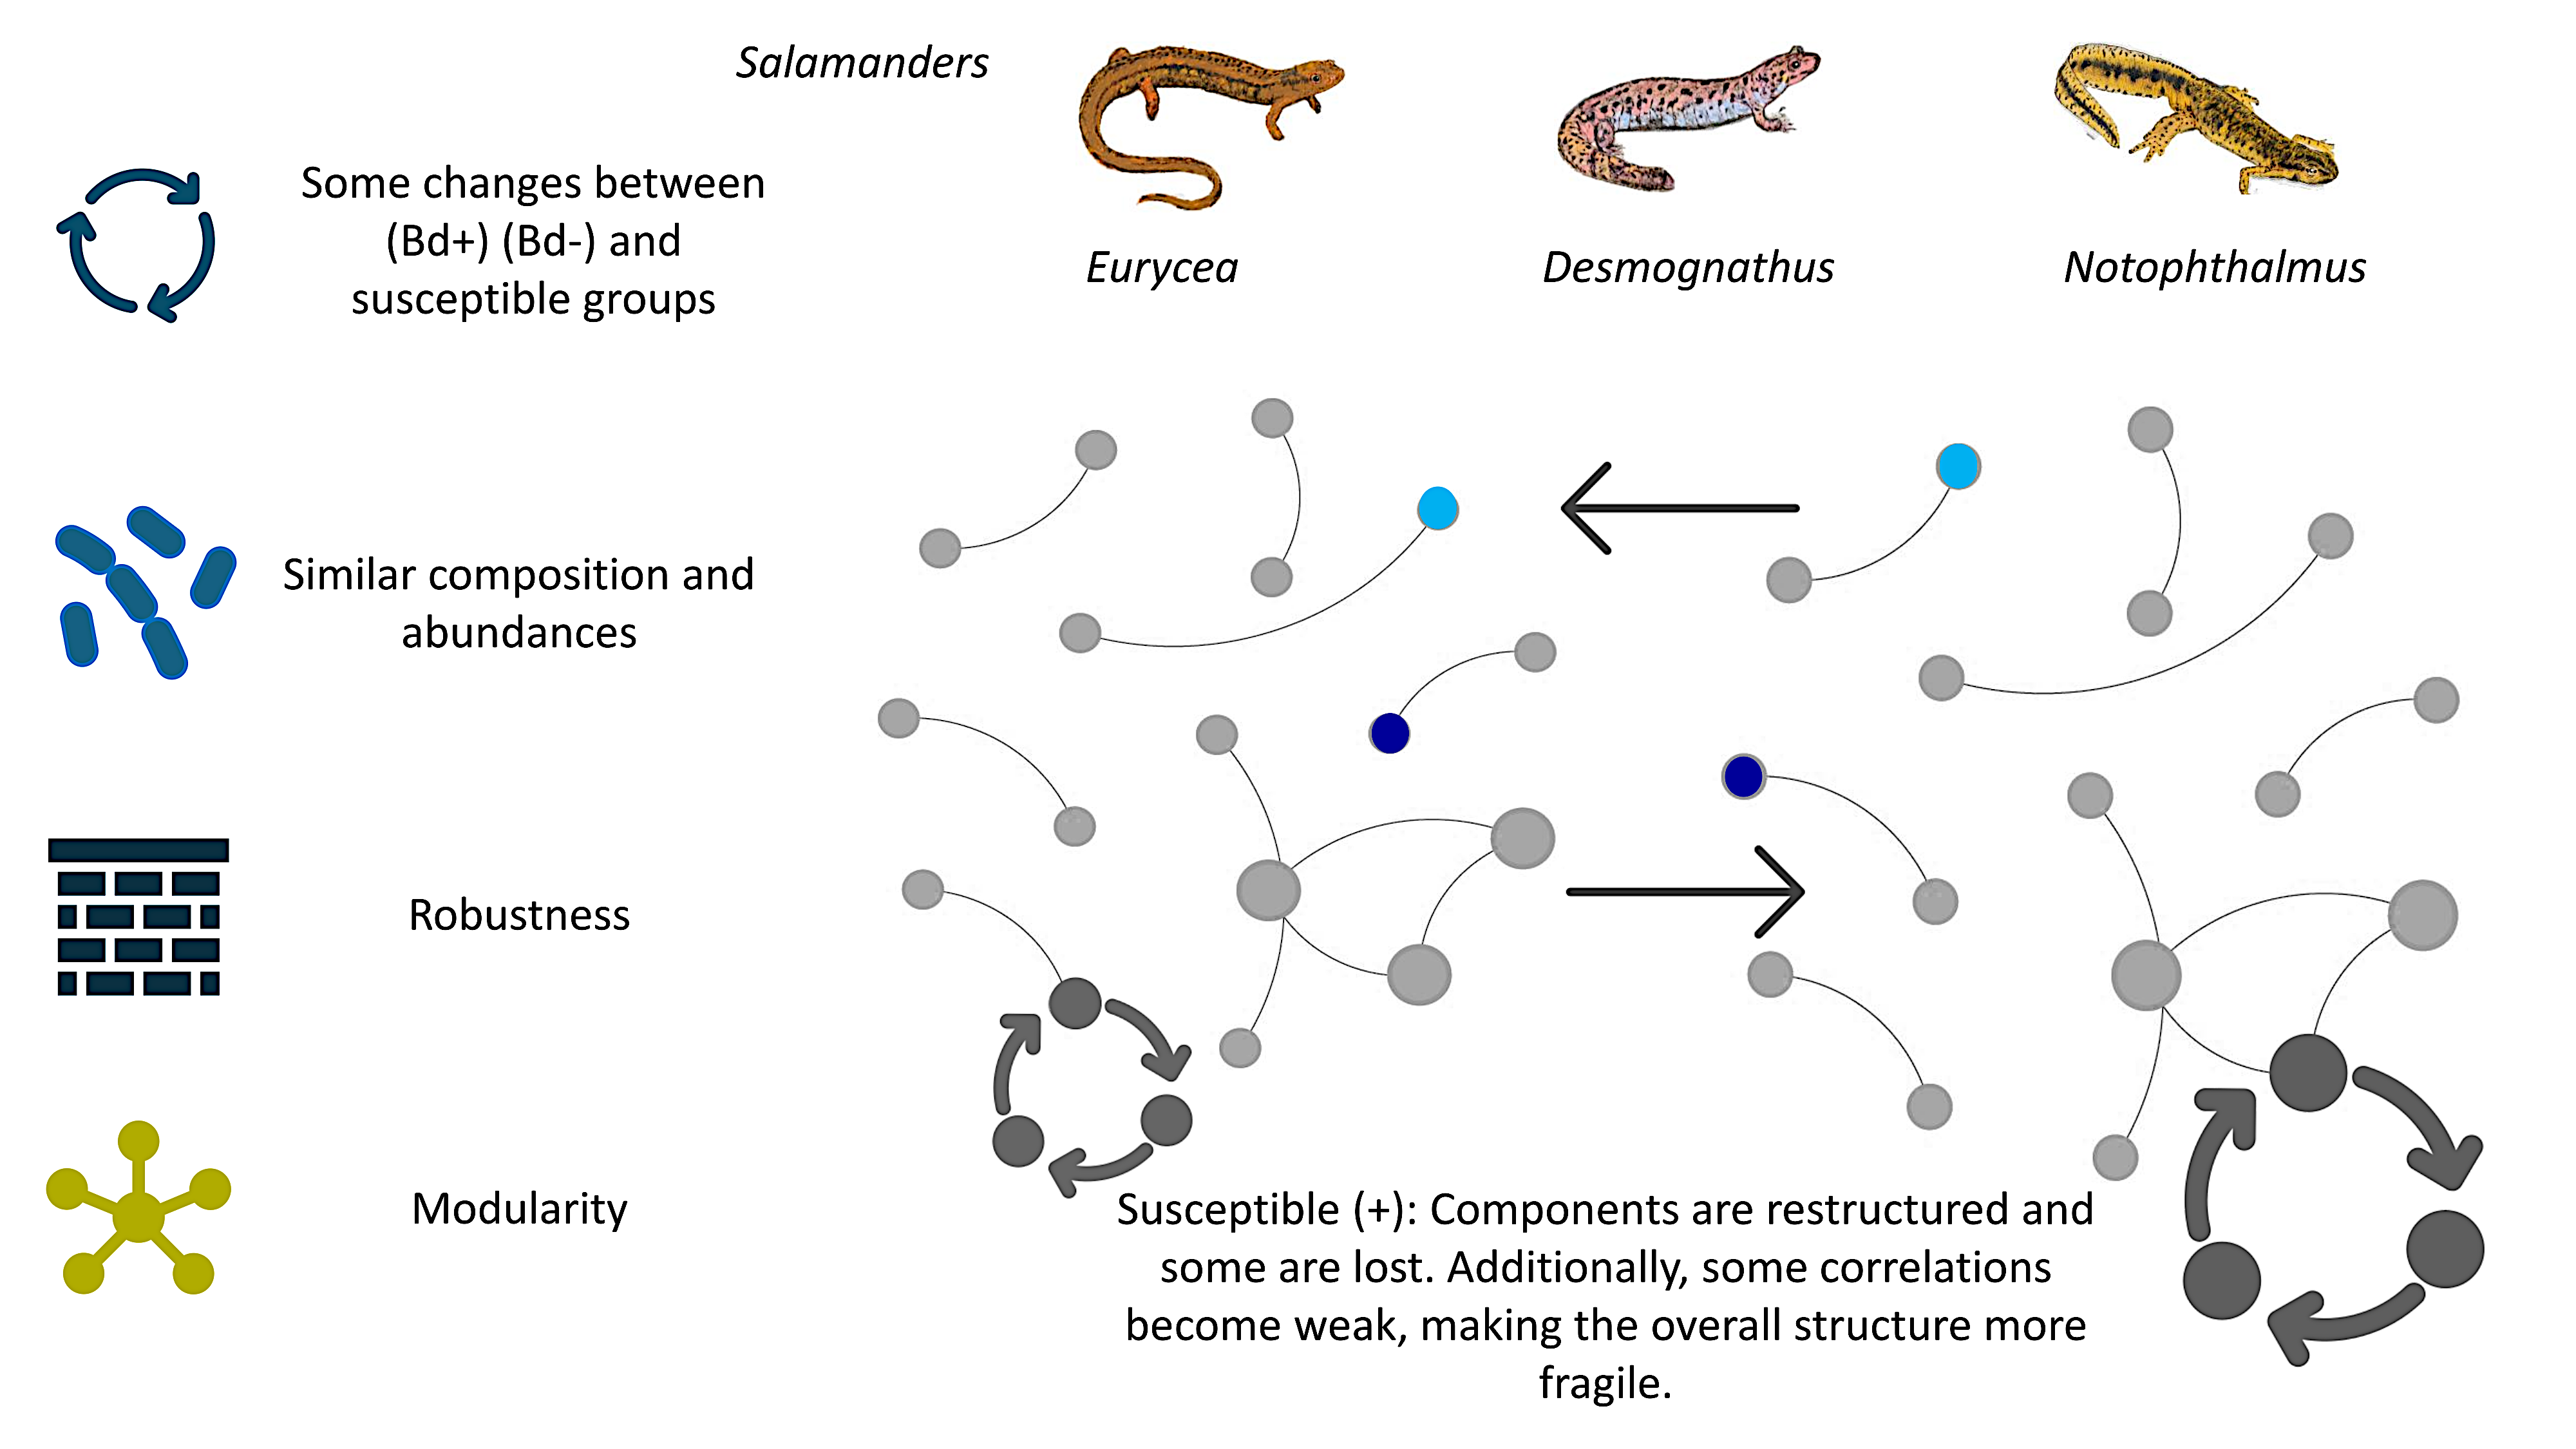
Chytridiomycosis caused by Batrachochytrium dendrobatidis (Bd) continues to threaten amphibian biodiversity; however, Bd-associated microbiome signatures in salamanders remain inconsistent across studies. Here, we tested whether Bd detection is linked to shifts in salamander skin bacterial communities and, critically, whether it alters the architecture of microbial associations. We reanalyzed publicly available 16S rRNA amplicon data from Eurycea bislineata, Notophthalmus viridescens, and Desmognathus monticola, comparing Bd-detectable (Bd+) and Bd-non-detectable (Bd−) samples. Standard diversity and compositional analyses (alpha/beta diversity, PERMANOVA) showed no significant Bd-associated differences at broad community scales, and the dominant phyla were conserved across conditions. In contrast, differential abundance approaches (LEfSe and ANCOM-BC) identified the targeted Bd-associated taxa. Network inference and community detection revealed pronounced reorganization of the modular structure, with minimal overlap in module membership between Bd+ and Bd− networks and strong condition-specific turnover in stringent “core” networks. Modularity and robustness patterns were host-dependent and highlighted clearer contrasts between tolerant and susceptible hosts under targeted node removal. Together, these results show that Bd detection may leave the overall composition largely intact while reshaping the microbial association structure, supporting network topology as a sensitive complementary lens for detecting disease-linked community changes in amphibian skin microbiomes.
Keywords:
bacteriome
; networks
; emergent diseases
; chytridiomycosis
1. Introduction
The microbiome is increasingly recognized as a key determinant of host health, contributing to immune regulation, pathogen resistance, and metabolic homeostasis in vertebrates [1,2,3,4,5,6,7]. However, translating microbiome knowledge into effective disease mitigation remains challenging because microbial communities are dynamic systems whose composition and function depend on both host traits and environmental context [8,9,10,11]. In amphibians, the skin microbiome is particularly relevant as it constitutes a primary interface with the environment. It can directly modulate susceptibility to skin-associated pathogens through competitive exclusion, niche occupancy, and production of antifungal metabolites [12,13].
Microbiome variation is shaped by multiple factors, including habitat, climate, developmental stage, host species, and sex [8,9,10,11]. Consequently, characterizing “who is there” (community composition) is necessary but often insufficient for understanding microbial community behavior under infection or perturbation. An additional layer of insight is obtained by examining how taxa are organized into association structures, which may reflect shared niches, co-dependence, or antagonistic relationships. Network-based approaches have therefore become helpful in summarizing community organization, identifying modules and highly connected taxa, and evaluating whether perturbations lead to fragmentation, re-wiring, or shifts in putative community hubs [14,15,16]. Under infection or pathogen exposure, microbial networks may lose connections, change their modular structure, or display altered association strengths and topologies; conversely, new associations may emerge as communities reorganize [17,18]. Importantly, such structural changes can occur even when the overall community composition appears to be stable.
A primary amphibian disease motivating microbiome-informed research is chytridiomycosis, caused by the fungal pathogen Batrachochytrium dendrobatidis (Bd), which has contributed to severe amphibian population decline globally [19]. Conservation concerns are heightened because disease impacts frequently interact with stressors, such as climate variability, pollution, and habitat fragmentation, potentially increasing host vulnerability and limiting recovery [20,21,22,23,24,25]. Moreover, the emergence and spread of additional fungal pathogens, including Batrachochytrium salamandrivorans (Bsal), further underscore the need for predictive and mechanistic frameworks to understand host–microbiome–pathogen dynamics [26,27,28]. Despite extensive efforts, there is still no universally effective and safe field-ready intervention for chytridiomycosis; tested strategies include thermal treatments and probiotic inoculations, often with variable outcomes across host taxa and environments [29,30,31,32].
One central challenge is that treatment attempts to target infections embedded in a complex and interacting microbial ecosystem. Cutaneous bacteria can facilitate the colonization of beneficial community members, compete for resources, or inhibit other microorganisms via secondary metabolites, producing context-dependent and potentially non-linear outcomes [33,34,35,36,37,38]. Therefore, understanding community organization and how it changes with Bd detection may help identify candidate taxa or community features associated with resistance, tolerance, or dysbiosis and guide the rational design of microbiome-informed mitigation strategies [39,40]. However, the extent to which Bd is related to changes in the structure and composition of salamander skin bacterial communities remains unclear. Prior work has reported taxa that differ in abundance across lesion types or body regions and highlighted particular antifungal bacteria (e.g., Janthinobacterium lividum) as potential protective symbionts [41,42,43,44,45,46,47,48]. In contrast, evidence for consistent opportunistic bacterial signatures that may facilitate Bd infection or reproducible network-level rearrangements linked to Bd status is still limited.
Here, we investigated whether Bd detection is associated with compositional and structural differences in the skin bacteriome of salamanders. We focus on three species that differ in reported susceptibility or outcomes to Bd and Bsal: Eurycea bislineata, Notophthalmus viridescens, and Desmognathus monticola [49,50]. Using amplicon sequencing of skin bacterial communities, we compared Bd-detectable and Bd-non-detectable individuals within and across species and inferred microbial association networks to evaluate changes in community organization. Specifically, we addressed two core questions: (i) to what extent do community composition and network structure depend on host species, and (ii) are Bd-detectable individuals characterized by consistent genus-level shifts and/or network-level reorganization relative to Bd-non-detectable individuals?
2. Materials and Methods
2.1. Data Source and Study Selection
A literature search was performed in PubMed to identify publicly available amplicon datasets suitable for the comparative analysis of salamander skin bacteriomes under contrasting Bd detection statuses. The eligibility criteria were as follows: (i) 16S rRNA gene amplicon sequencing, (ii) consistent targeted the hypervariable region (V3-V5) of the 16S rRNA gene and sequencing platform MiSeq across samples, and (iii) availability of Bd detection data allowing classification of individuals into Bd-detectable and Bd-non-detectable groups. Raw sequence data were obtained from Muletz-Wolz et al. (2022), Inhibitory Bacterial Diversity and Mucosome Function Differentiate Susceptibility of Appalachian Salamanders to Chytrid Fungal Infection, available under NCBI BioProject PRJNA659464. We analyzed samples from three salamander species (Eurycea bislineata, Notophthalmus viridescens, and Desmognathus monticola). Samples were stratified into two conditions based on Bd detection status (Bd-detectable vs. Bd-non-detectable). The final dataset included 15 Bd-detectable and 17 Bd-non-detectable samples.
2.2. Amplicon Processing and Taxonomic Assignment
Raw reads were processed in R using DADA2 for quality filtering, denoising, chimera removal, and amplicon sequence variant (ASV) inference. Taxonomic assignment was conducted within the phyloseq package using the SILVA v138 reference database and DECIPHER classifier. Downstream analyses were performed on genus-level agglomerated tables when required (e.g., network inference), and diversity analyses were conducted at the ASV level unless otherwise specified.
2.3. Community Composition and Diversity Analyses
Relative abundance profiles were computed to characterize both dominant and low-abundance taxa across the samples. Alpha diversity was quantified using the Shannon, Simpson, and Chao1 indices. Differences in alpha diversity between the Bd-detectable and Bd-non-detectable groups were evaluated using the Wilcoxon rank-sum test (Mann–Whitney U test).
Beta diversity was assessed using Bray–Curtis dissimilarities and visualized using principal coordinate analysis (PCoA). Differences in community composition between groups were tested using permutational multivariate analysis of variance (PERMANOVA) implemented with adonis2 (vegan package; 9,999 permutations). To assess within-group dispersion (i.e., community heterogeneity within conditions), we evaluated variance/dispersion in the multivariate space using appropriate dispersion analyses (e.g., beta dispersion) before interpreting the PERMANOVA results. All statistical analyses were conducted in R.
2.4. Differential Abundance and Biomarker Discovery
Differentially abundant taxa between Bd-detectable and Bd-non-detectable samples were identified using two complementary approaches. First, Linear Discriminant Analysis Effect Size (LEfSe) was applied to detect taxa with consistent differences between conditions, reporting discriminant scores at the family and genus levels. Significance was assessed using the Kruskal–Wallis test as implemented in the MicrobiomeMarker package. Second, ANCOM-BC was used at the family and genus levels to account for compositionality and correct for bias in the differential abundance estimation. For ANCOM-BC, taxa were ranked using the W statistic (or the method’s corresponding test statistic), providing an additional and more conservative validation of candidate biomarkers.
2.5. Microbial Association Network Inference
Microbial association networks were inferred at the genus level to compare community organization across the conditions. Networks were inferred separately for Bd-detectable and Bd-non-detectable samples, and within each salamander species to assess species-specific patterns. Network inference combined mutual information-based inference (ARACNE-like approaches) and sparse graphical model inference, as implemented in R packages such as minet and SPIEC-EASI. Associations were estimated using rank-based correlations (Spearman) and/or model-based sparse inverse covariance estimation, and edges were retained according to stringent significance/selection criteria to reduce the number of spurious links. Networks were visualized using Gephi and Cytoscape software. For each inferred network, we computed standard node centrality measures, including degree, betweenness, and closeness centralities, to identify highly connected and potentially influential taxa (putative hubs).
2.6. Network Topology and Robustness Analyses
To quantify the structural differences between the networks, we evaluated their robustness using the NetSwan package. The program calculates the robustness of each graph after a node is removed by determining three important metrics. (i) SwanEfficiency: measures the change in the sum of distances between all node pairs when a node is excluded. (ii) SwanCloseness: Measures the change in the sum of inverse distances (closeness) when a node is removed. (iii) SwanConnectivity: calculates the loss of connectivity (i.e., the number of connected node pairs) after a node is removed. Robustness was assessed by progressively removing nodes under multiple removal strategies: (i) random removal to estimate baseline resilience and (ii) targeted removal based on centrality rankings (degree and betweenness) to model vulnerability to the loss of highly connected taxa and quantify cascading effects. Robustness metrics were compared between Bd-detectable and Bd-non-detectable networks, and where applicable, across species-specific networks). For robustness parameters, group comparisons were performed using one-way ANOVA, followed by Tukey’s post hoc tests when normality assumptions were met (Shapiro–Wilk test); otherwise, non-parametric alternatives were used.
3. Results
Across all samples, the skin bacteriome was dominated by Proteobacteria, with Actinobacteria consistently representing the second most abundant phylum. This pattern was observed in both Bd-detectable and Bd-non-detectable salamanders (Figure 1, top panel). Visual inspection of relative abundance profiles did not reveal marked shifts in the dominant phyla between conditions, suggesting a broadly comparable high-level community composition across Bd statuses.
At a finer taxonomic resolution, the relative abundances at the family level showed highly similar profiles between the Bd-detectable and Bd-non-detectable groups (Figure 1, middle panel). In both conditions, Vibrionaceae was the most abundant family, followed by Halomonadaceae, Pseudomonadaceae, and Alteromonadaceae. No conspicuous condition-specific enrichment or depletion was observed among these dominant families based on relative abundance patterns.
Consistent with the family level results, the genus-level profiles were largely shared across Bd statuses (Figure 1, bottom panel). Vibrio exhibited the highest relative abundance in both groups, followed by Halomonas, Pseudomonas, Alishewanella, and Stenotrophomonas. The dominant taxa remained stable across conditions at the phylum, family, and genus levels, and any differences, if present, were restricted to lower-abundance taxa rather than changes in the most prevalent lineages (Figure 1).
Diversity analyses indicated modest variation between Bd-detectable and Bd-non-detectable salamanders; however, these differences were not statistically significant in the pairwise comparisons (Figure 2). Ordination based on community dissimilarities (PCoA) revealed a partial overlap between conditions, with no consistent separation of Bd-detectable and Bd-non-detectable samples in the multivariate space (Figure 2). Collectively, these results provide no evidence that Bd detection is associated with broad shifts in the overall bacterial diversity or community composition in this dataset.
Community-level tests (PERMANOVA via adonis2) were used to evaluate whether Bd detection status was associated with global differences in community composition, complementing the taxon-level biomarker analyses. PERMANOVA revealed no significant differences in community composition among the groups (R² = 0.01, F = 0.32, p = 1.00, based on 9,999 permutations). These values suggest that there is no significant change in the overall bacterial composition between groups. However, specific differential taxa may be detectable by other methods, such as LEfSe or ANCOM-BC.
To identify taxa associated with Bd detection status, we performed biomarker discovery using LEfSe and validated candidate signals with ANCOM-BC. LEfSe detected a set of discriminative taxonomic features for each condition (Figure 3). In Bd-non-detectable (“healthy”) salamanders, LEfSe highlighted enrichment of Proteobacteria (phylum) and several lower-rank features including Solimonadaceae (family), Salinisphaerales (order), Enterobacteraceae (family), and Cryomorphaceae (family), as well as the genera Lelliottia and Elizabethkingia. In Bd-detectable salamanders, LEfSe identified a larger panel of discriminative features (n = 16), including higher-rank clades/taxonomic labels (e.g., CCD24, GOUTA6) and multiple bacterial families and genera. Among these, Burkholderiaceae (family) and the genera Paucibacter, Lautropia, Altererythrobacter, Methylorubrum, Aureimonas, Shinella, Chloronema, and Amnibacterium were detected as condition-associated features (Figure 3).
To corroborate these targeted compositional differences using a method that explicitly accounts for compositionality and biases in sequencing data, we applied the ANCOM-BC at multiple taxonomic ranks (Figure 4). Consistent with the LEfSe results, ANCOM-BC supported differential abundance of several taxa between Bd-non-detectable and Bd-detectable groups. All reported taxa showed p < 0.05 in LEfSe and exceeded the LDA threshold. This indicates both statistical significance and biological relevance.
In Bd-non-detectable salamanders, ANCOM-BC identified Enterobacteraceae, Solimonadaceae, and Cryomorphaceae (families), Salinisphaerales (order), and the genera Lelliottia and Elizabethkingia as differentially abundant features contributing to group separation. In Bd-detectable salamanders, ANCOM-BC highlighted Chloroflexales (order) and families including Microbacteraceae, Roseiflexaceae, CCD24, and Burkholderiaceae, together with multiple genera distinguishing this condition, including Methylobacterium, Shinella, Amnibacterium, Xylophilus, Aureimonas, Paucibacter, Altererythrobacter, Lautropia, and Chloronema (Figure 4).
ANCOM identified the genera Phreatobacter, Melittangium, Deinococcus, Candidatus omnitrophilus, and Enhydrobacter as having high W = 4 statistics. This indicates consistent differences in log-ratios across multiple taxon comparisons between groups. The bacteria enriched in Bd- are Alterococcus, Angustibacter, Bilophila, Candidatus rhabdochlamydia, Cardiobacterium, Fusobacterium, Verrucomicrobium y Gemella. The bacteria enriched in Bd+ are Candidatus anammoximicrobium, Hypnocyclicus, Lachnoclostridium y Sphingopyxis. In addition, bacteria depleted in Bd- are Stella, Pseudorhizobium, Geobacillus y Kouleothrix. In addition, bacteria depleted in Bd+ are Acidobacter, Aridibacter, Flavimaricola, Methylocella and Nitrincola.
ANCOM-BC identified a set of taxa showing statistically supported differential abundance between Bd-detectable (Bd+) and Bd-non-detectable (Bd−) salamanders (Figure 4 and Figures 4 and S3–S4). Across taxonomic ranks, significant features included multiple genera and higher-level clades such as Phreatobacter, Melittangium, Deinococcus, Candidatus omnitrophus, Enhydrobacter, Myroides, Sumerlaea, Solirubrobacter, Coxiella, Dyadobacter, Aquicella, Paucibacter, Lautropia, Roseomonas, Chloronema, Thermomonas, and additional taxa reported by the classifier (e.g., Candidatus ovatusbacter), as well as higher-rank groups including Rhodothermaceae, Morganellaceae, Fimbriimonadaceae, and others.
When stratifying the results by condition, ANCOM-BC indicated that Bd-detectable samples were characterized by the differential abundance of several higher-rank groups, including the order Azospirillales and the families Bacillaceae, Enterococcaceae, and Leptotrichiaceae. At the genus level, taxa differentiating the Bd+ condition included Asticcacaulis, Candidatus anammoximicrobium, Geobacillus, Lachnoclostridium, Pseudorhizobium, Sphingopyxis, and Stella (Figure 4 and Figures 4 and S3–S4).
In contrast, Bd-non-detectable salamanders exhibited differential abundance of several families, including Cardiobacteriaceae, Chromobacteriaceae, Coleofasciculaceae, Fusobacteriaceae, Gemellaceae, Labraceae, Oscillospiraceae, Parachlamydiaceae, Rhodocyclaceae, Thermomicrobiaceae, and Woeseiaceae. Genera associated with the Bd− condition included Alterococcus, Angustibacter, Arsenicitalea, Bilophila, Candidatus rhabdochlamydia, Cardiobacterium, Crenobacter, Fusobacterium, Gemella, Intestimonas, Rurimicrobium, Spirochaeta 2 (as reported), Suttonella, Tabrizicola, Verrucomicrobium, and Williamsia (Figure 4 and Figures 4 and S3–S4).Overall, ANCOM-BC supports the conclusion that Bd detection is associated with specific taxon-level shifts across multiple ranks, consistent with targeted compositional differences rather than broad restructuring of the dominant community membership.
3.1. Network-Level Differences Between Bd− and Bd+ Salamanders
To characterize community organization beyond taxonomic composition, we inferred genus- and ASV-level association networks separately for Bd-non-detectable (Bd−) and Bd-detectable (Bd+) salamanders (Figures S5 and S6). In the Bd− network, the nodes were predominantly assigned to Proteobacteria (42.25%), followed by Bacteroidota (15.86%), and Actinobacteriota (13.48%). Additional phyla contributed smaller fractions, including Chloroflexi (4.90%), Verrucomicrobiota (4.90%), Myxococcota (4.11%), and Acidobacteriota (3.89%). The Bd− network exhibited relatively strong pairwise associations (most retained edges had absolute association strengths in the ~0.8–1.0 range) and a comparatively even distribution of node connectivity, with most nodes showing approximately 20–25 connections (Figure S5). Visually, the Bd− network was organized into approximately five major modules/clusters, each containing a mixture of phyla, suggesting that dominant lineages contribute across multiple modules rather than being confined to a single compartment.
In contrast, the Bd+ network displayed a more segmented modular organization with more than five clusters/modules (Figure S5). Across modules, Proteobacteria remained prominent and appeared to be overrepresented within most clusters. The phylum-level node composition in the Bd+ samples differed moderately from that in the Bd− samples, with Proteobacteria representing 36.05% of the nodes, followed by Bacteroidota (19.52%) and Actinobacteriota (11.13%). Firmicutes increased to 6.21%, while Verrucomicrobiota (4.52%), Acidobacteriota (4.35%), and Myxococcota(4.35%) contributed smaller fractions. Despite these shifts in modular structure and node composition, the overall node connectivity remained in a range similar to that of Bd−, with typical node degrees of approximately 20–25 (Figure S5). Retained associations in Bd+ samples were also strong (edges largely around ~0.9 in absolute strength), indicating that the Bd detection status was associated more with the reorganization of associations and module structure than with a global increase in network density.
3.2. Positive vs. Negative Associations and Shared ASVs
Next, we compared the balance of positive and negative associations between the Bd− and Bd+ networks (Figure S6; Table S4). The two networks differed in the number of ASVs and taxonomic identities of the condition-specific nodes. Notably, only one ASV was shared across both networks (ASV1), taxonomically assigned to Proteobacteria within the family Vibrionaceae, whereas the remaining ASVs were condition-specific (Figure S6; Table S4).
Bd− salamanders exhibited a higher number of positive associations overall, consistent with a larger set of co-occurrence/co-abundance links within the inferred community structure than Bd + salamanders. In contrast, although Bd+ salamanders showed fewer positive edges, the strength of positive associations tended to be higher, suggesting tighter coupling among subsets of taxa within Bd-detectable communities. Negative associations were observed in comparable numbers across conditions, indicating that putative antagonistic/exclusionary relationships were preserved in terms of overall frequency, even as the positive association structure was reorganized (Figure S6; Table S4).
3.3. Negative Associations and Taxa Linked to Vibrionaceae
Across both inferred networks, taxa assigned to Vibrionaceae exhibited the highest number of negative associations with other network components (Figure 5 and Figure 6). This pattern suggests that Vibrionaceae-associated nodes act as major “antagonistic” or mutually exclusive partners in the inferred association structure, although the ecological interpretation of negative edges should be made cautiously (i.e., they may reflect competitive exclusion, niche partitioning, or compositional effects rather than direct inhibition).
In the Bd-non-detectable (Bd−) network, the strongest/most frequent negative associations involving Vibrionaceae co-occurred with a set of condition-specific ASVs, including ASV73, ASV455, ASV745, ASV809, ASV132, and ASV34, taxonomically assigned to the phyla Myxococcota, Fibrobacterota, Patescibacteria, Armatimonadota, Acidobacteriota, and Bacteroidota, respectively (Figure 5 and Figure 6).
In the Bd-detectable (Bd+) network, negative and positive associations involved a broader set of ASVs (Figure S6; Table S4), including ASV1, ASV9, ASV12, ASV36, ASV72, ASV82, ASV84, ASV87, ASV129, ASV175, ASV179, ASV196, ASV206, ASV266, ASV400, ASV705, ASV859, ASV875, ASV966, and ASV1195. These ASVs mapped to multiple families spanning diverse ecological strategies, including Vibrionaceae, Sanguibacteraceae, Streptococcaceae, Weeksellaceae, Methylacidiphilaceae, Bdellovibrionaceae, Solibacteraceae, Phaselicystidaceae, Spirochaetaceae, Vermiphilaceae, Gemmataceae, Desulfovibrionaceae, Nitrospiraceae, Abditibacteriaceae, and Trueperaceae (Figure S6; Table S4). Together, these results indicate that Bd detection is associated with a more taxonomically diverse set of nodes participating in the signed association structure, even though Vibrionaceae remains a central “negative-edge” contributor in both conditions.
3.4. Species-Level Composition and Shared Taxa Across Bd Status
We compared genus-level community composition across the three salamander species, stratified by Bd detection status, to assess shared (“core”) taxa within each condition. Bd-detectable (Bd+) animals shared 68 genera across species (Tables S1-3), including representative taxa such as Vibrio, Pseudomonas, Halomonas, Stenotrophomonas, Pseudoalteromonas, Aeromonas, Lelliottia, Elizabethkingia, and Mycobacterium (Figure 5). Bd-non-detectable (Bd−) animals shared 70 genera across species (Table S1-3), with recurrent members including Vibrio, Pseudomonas, Halomonas, Stenotrophomonas, Delftia, Microbacterium, Roseomonas, Methylobacterium/Methylorubrum, Elizabethkingia, and Martelella (Figure 5). Overall, both conditions displayed a substantial shared community membership across host species, consistent with a common set of taxa recurrently detected on salamander skin, while network-level analyses (above) suggest that Bd detection is associated with changes in how these taxa are connected within the inferred association structure.
To explore the condition-associated differences in the taxa represented within the modular (community) structure of the inferred genus-level networks, we extracted the list of genera present in each condition-specific network (Bd-detectable vs. Bd-non-detectable) and summarized them by salamander genus (Figure 5; Tables S1–S3). Rather than presenting exhaustive inventories, we report below a set of representative genera for each group; complete taxon lists are provided in Supplementary Material (S1 and S2).
3.5. Eurycea
In Eurycea, the Bd-detectable network contained a subset of genera that were not observed in the Bd-nondetectable network. Representative examples of Bd-associated genera included Treponema, Oceanotoga, Wautersiella, Crossiella, Agrococcus, Iodobacter, and Chitinimonas, along with additional low-frequency taxonomic labels reported by the classifier (Tables S1–S3). In contrast, the Bd-non-detectable network included condition-specific taxa from diverse lineages (Supplementary Tables). Notably, a substantial set of genera was shared across both conditions in Eurycea, including widely detected skin-associated members, such as Vibrio, Pseudomonas, Halomonas, Stenotrophomonas, Pseudoalteromonas, Aeromonas, Lelliottia, Elizabethkingia, Mycobacterium, Delftia, and Microbacterium (Tables S1–S3).
3.6. Desmognathus
For Desmognathus, the Bd-detectable network included several anaerobe-associated and environmentally derived genera as representative members, including Peptococcus, Romboutsia, Anaerotruncus, Terrisporobacter, Lachnoclostridium, Truepera, and Rhodococcus, in addition to additional genera spanning multiple phyla (Tables S1–S3). Bd-non-detectable animals showed a distinct set of taxa (Supplementary Tables), while retaining overlap with common skin-associated genera shared across conditions (e.g., Vibrio, Pseudomonas, Halomonas, and Stenotrophomonas), consistent with a stable core membership with condition-specific additions and losses.
3.7. Notophthalmus
In Notophthalmus, both Bd-detectable and Bd-non-detectable networks shared a broad range of recurrent genera. Representative shared taxa included Vibrio, Pseudomonas, Lelliottia, Elizabethkingia, Martelella, Mycobacterium, Enterococcus, Microbacterium, Halomonas, and Stenotrophomonas (Tables S1–S3). In addition, Bd-non-detectable networks contained taxa such as Roseomonas and methylotroph-associated genera (e.g., Methylobacterium/Methylorubrum) as representative members. In contrast, Bd-detectable networks included additional genera spanning diverse ecological strategies (including taxa related to nitrogen cycling and anaerobic metabolism), suggesting a condition-dependent rearrangement of network membership (Supplementary Tables S1–S3).
Across salamander genera, the inferred network membership displayed a consistent set of widely shared skin-associated taxa (e.g., Vibrio, Pseudomonas, Halomonas, Stenotrophomonas, and Pseudoalteromonas), accompanied by condition-specific genera that differed between Bd-detectable and Bd-non-detectable networks. These patterns support the interpretation that Bd detection is associated with selective gains/losses in network membership and potential reorganization of the network modules. Simultaneously, a substantial subset of taxa remained common across conditions.
Complete lists of each salamander genus and Bd status are provided in Tables S1–S3.
Subsequently, we quantified network modularity for the genus-level association networks to evaluate how strongly each community was partitioned into modules (i.e., groups of genera that were more densely connected than the rest of the network). Bd-non-detectable (Bd−) salamanders showed consistently high modularity across the three host species, indicating a pronounced modular organization. Specifically, modularity values for Eurycea bislineata, Desmognathus (genus), and Notophthalmus viridescens were 0.732, 0.742, and 0.814, respectively (Figure 6). The Bd− networks of Eurycea and Desmognathus were highly similar in modularity, whereas Notophthalmus exhibited a more strongly compartmentalized structure.
In Bd-detectable (Bd+) salamanders, the modularity values were more heterogeneous across host species. Desmognathus and Notophthalmus retained substantial modular structure, with modularity values of 0.695 and 0.851, respectively. In contrast, the Bd+ network for Eurycea bislineata yielded a modularity value of 0, consistent with the absence of detectable modular partitioning under the applied network construction and community-detection settings (Figure 6). This outcome can occur when the inferred network is extremely sparse, lacks sufficient connectivity for stable community detection, or collapses into a trivial structure under the thresholding/selection criteria. Therefore, it should be interpreted cautiously as a structural breakdown rather than a precise estimate of “true” modularity.
Comparing Bd+ vs. Bd− within species, modularity decreased in Bd-detectable animals for Eurycea (0.732 → 0) and Desmognathus (0.742 → 0.695), suggesting reduced modular compartmentalization associated with Bd detection in these hosts. In contrast, Notophthalmus viridescens showed a slight increase in modularity from 0.814 (Bd−) to 0.851 (Bd+), corresponding to a change of +0.037 (Figure 6). Taken together, these results indicate that Bd detection is associated with species-dependent effects on network modular organization, with evidence of modularity loss in some hosts and modest strengthening of the modular structure in Notophthalmus.
3.8. Module Membership Differences Across Conditions
To compare community organization at a finer scale, we analyzed the module (community) structure of each inferred genus-level network. The communities were detected using the Louvain algorithm on the unweighted graph. Modules were identified using a community detection algorithm and labeled by color for visualization. For each network, we extracted the list of genera within each module and compared the module membership between Bd-non-detectable (Bd−) and Bd-detectable (Bd+) conditions.
Across species, the module composition differed markedly between conditions. As an initial standardized comparison, we focused on the first module (colored pink) in each network and summarized the overlap using Venn diagrams across the three host species and two Bd conditions (Figure 6 and Figure 7). We repeated the same comparison, restricting the analysis to Bd− salamanders, to evaluate cross-species similarities in module membership under non-detectable conditions (Figure 6 and Figure 7). These analyses indicated a limited overlap in module composition across conditions, consistent with the condition-dependent reorganization of network communities.
To illustrate this pattern in detail, we examined three representative modules (pink, orange, and green) in Desmognathus monticola networks. Comparing the Bd− and Bd+ networks for this species showed that the genera comprising these modules were largely condition-specific, with minimal to no shared nodes between Bd− and Bd+ within the same module color label (Figures S7–S8; Tables S1–S3). Together, these results suggest that Bd detection is associated with substantial re-assortment of taxa among network communities, even when the overall taxonomic profiles appear broadly similar.
3.9. Core Network Analysis Under Stringent Association Thresholds
Because network topology can depend on the association threshold used to retain edges, we evaluated core networks constructed under more stringent criteria that retained only the strongest associations. The core network was determined by filtering the original network using a fixed correlation threshold greater than 0.9. Additionally, nodes with more than 20 edges were selected. These core networks aim to capture subsets of taxa linked by high-strength associations (i.e., a putative “backbone” of the community).
Core networks differed significantly between Bd− and Bd+ salamanders (Figure 8). In Bd− (non-detectable) salamanders, the core network contained stronger associations (approximately 0.9–1.0), a higher edge count (280 connections), and more nodes (65 genera) than Bd + salamanders. The node degrees were relatively homogeneous, indicating a more evenly connected core structure. In contrast, the Bd+ core network was smaller and sparser, with 96 connections and 35 nodes, and edge strengths were generally lower (approximately 0.7–0.8), as reflected by the reduced edge intensity in the visualization. Additionally, the node degree varied more widely in Bd+, indicating a less uniformly connected core and suggesting a greater concentration of connectivity among a smaller subset of taxa (Figure 8).
Module-level comparisons and core network analyses consistently support condition-dependent restructuring of the inferred association architecture, with Bd detection linked to changes in both community partitioning (modules) and the density/strength of the core association backbone.
Edges are displayed with color gradients reflecting association strength (|ρ| ≈ 0.9–1.0): Bd-detectable (Bd+) networks use a blue gradient, and Bd-non-detectable (Bd−) networks use a pink gradient, with darker/thicker edges indicating stronger associations. For visualization clarity, nodes with fewer than three retained connections (degree < 3) were excluded from the plotted graphs.
To compare the taxonomic membership of the core networks, we constructed a Venn diagram using a list of genera retained in each condition-specific core (Bd− vs. Bd+). The two circles represent the genera present in the Bd− and Bd + cores, and the intersection represents the genera shared by both conditions; the numbers indicate the counts of condition-specific and shared genera (Figure 8).
The core network composition showed minimal overlap between the conditions. Only five taxa were shared between the Bd− and Bd+ cores: SH3-11, Blastococcus, Ruminococcus, Candidatus paracaedibacter, and Deefgea (Figure 8). The Bd− core contained a distinct set of genera, including Oligoflexus, Phreatobacter, Crenobacter, Nocardia, Cardiobacterium, Ruminiclostridium, Fusobacterium, Haemophilus, Syntrophobacter, and Rheinheimera (complete list in Table S2). In contrast, the Bd+ core was characterized by a different suite of taxa, including Candidatus anammoximicrobium, Peptococcus, Gemmata, Kineococcus, Gordonibacter, Robinsoniella, Rubrivivax, Anaerotruncus, Achromobacter, and Macellibacteroides (complete list in Table S1). Together, these results indicate that stringent “core” filtering reveals a condition-specific association backbone, with Bd detection linked to a pronounced turnover in core network membership.
We examined whether the distributions of network centrality and topology metrics differed (i) between Bd detection conditions (Bd+ vs. Bd−) and (ii) among salamander hosts with contrasting reported susceptibility profiles to Bd and Bsal. Specifically, we compared centrality measures across species pairs representing tolerant vs. susceptible outcomes (e.g., Desmognathus vs. Notophthalmus) and tolerant vs. tolerant hosts with different Bsal outcomes (e.g., Eurycea vs. Desmognathus), stratifying all comparisons by Bd status.
For the tolerant–susceptible comparison, Bd-detectable (Bd+) networks of Desmognathus and Notophthalmus exhibited significant differences across multiple metrics, indicating that the Bd+ community organization and node roles differ between these hosts (Figure 9). Notably, several of these differences were reduced or absent when the same species were compared under Bd-non-detectable (Bd−) conditions, suggesting that Bd detection amplifies host-specific differences in the network topology (Figure 9). Among the metrics showing the clearest condition dependence were betweenness centrality and clustering coefficient. High-betweenness nodes often occupy “bridge” positions that connect modules and mediate connectivity across networks. In contrast, the clustering coefficient reflects the tendency of nodes to form tightly connected local neighborhoods (triangles), providing a proxy for community cohesion. Together, changes in these metrics are consistent with Bd-associated reorganization of (i) putative connector taxa and (ii) the local modular structure of the community (Figure 9 and Figure 10). We also analyzed and compared the topological properties and robustness of the networks using the same statistical method with a different pair of susceptible versus tolerant salamanders (see Supplementary Figures S9–S14).
When comparing the two Bd-tolerant hosts (Eurycea and Desmognathus), Bd+ networks also showed significant differences in several topological properties (Figure 10), supporting the idea that Bd detection is associated with species-dependent restructuring of network organization, even among tolerant hosts. Across both tolerant and susceptible comparisons, betweenness and clustering patterns were broadly conserved as informative descriptors of topology; however, their distributions depended strongly on Bd status (Bd+ vs. Bd−). For example, the degree (number of connections per node) was similar between species under Bd− conditions, whereas under Bd+ conditions, degree distributions diverged, with Eurycea showing a significant increase in node connectivity (Figure 11, Figure 12 and Figure 13). This shift suggests a Bd-associated change in the overall network connectedness in Eurycea, potentially reflecting tighter coupling among subsets of taxa or the emergence of more densely connected modules under infection-detectable conditions in the host.These analyses indicate that Bd status and host identity jointly shape the architecture of inferred microbial association networks. Bd detection is linked to changes in the roles of putative connector taxa (betweenness) and local community cohesiveness (clustering), and these effects differ across salamander species with distinct susceptibility profiles (Figure 9, Figure 10, Figure 11, Figure 12 and Figure 13).
Finally, we assessed network robustness to evaluate whether Bd detection was associated with increased vulnerability of the inferred skin microbiome association structure. Robustness was quantified in R using NetSwan by measuring the network connectivity loss as nodes were progressively removed. Networks were analyzed by condition (Bd-detectable, Bd+; Bd-non-detectable, Bd−) and host species using genus-level networks inferred separately for each condition and host species. For each network, we simulated node removal under four strategies: (i) random removal(baseline tolerance to non-targeted loss), (ii) degree-based removal (targeted attack on highly connected nodes), (iii) betweenness-based removal (targeted attack on bridge/connector nodes), and (iv) cascade removal, in which the removal of a focal node triggers additional secondary losses by eliminating nodes/edges that become disconnected or otherwise fail as a consequence of the initial perturbation (i.e., cascading failure). Robustness curves were plotted as the fraction of remaining connectivity (y-axis) against the fraction of removed nodes (x-axis), enabling a direct visual comparison across networks and removal strategies (Figure 11, Figure 12 and Figure 13).
Across conditions, robustness curves showed the expected pattern that targeted removals (degree- and betweenness-based) and cascade perturbations produced a substantially faster decline in connectivity than random removal (Figure 11). In these plots, a steeper early slope indicates more rapid fragmentation and, therefore, lower robustness; conversely, a slower decline under random removal indicates higher tolerance to stochastic losses.
For Bd-detectable networks, degree-based and cascade removal produced broadly similar trajectories, with connectivity decreasing sharply after the removal of a relatively small fraction of nodes. In particular, the removal of fewer than ~25% of nodes resulted in a significant reduction in connectivity (approximately three-quarters of connectivity lost), consistent with a strong dependence on a subset of highly connected or structurally critical taxa. As node removal progressed beyond ~50%, the curves approached a near-zero plateau, reflecting a near-complete collapse of network connectivity(Figure 11).
Bd-non-detectable networks displayed qualitatively similar sensitivity to targeted attacks: degree-based and cascade strategies led to rapid fragmentation beginning with the removal of approximately 25% of nodes. In contrast, under random removal, the Bd− network retained connectivity for a longer period, indicating a comparatively higher robustness to non-targeted node loss. Nevertheless, both Bd+ and Bd− networks were highly vulnerable to targeted removal strategies, implying that their inferred association structures depend disproportionately on a limited set of central/connector nodes (Figure 11).
Robustness analyses indicate that while networks tolerate random loss to some extent, they are structurally fragile under targeted attacks, particularly those aimed at high-degree or high-betweenness nodes, and under cascading failure scenarios. These results are consistent with a topology in which a subset of central taxa disproportionately supports global connectivity and provides a quantitative framework to compare vulnerability across Bd conditions and host species (Figure 11, Figure 12 and Figure 13).
3.10. Susceptible vs Tolerant Hosts (Notophthalmus vs Desmognathus)
In the degree-based removal scenario (targeting highly connected nodes), Bd− networks differed significantly between Notophthalmus viridescens (susceptible) and Desmognathus monticola (tolerant), indicating species-dependent sensitivity to the removal of high-degree taxa even in the absence of detected Bd (Figure 12). This between-species difference was also evident in Bd+ networks, suggesting that vulnerability to high-degree node loss is a consistent discriminator across Bd conditions (Figure 12).
In contrast, random removal did not yield significant differences between groups, consistent with the broadly similar tolerance to stochastic node loss across species and Bd conditions (Figure 12). This pattern supports the interpretation that the most pronounced contrasts emerge under targeted perturbations rather than under nontargeted losses.
For cascade removal, connectivity loss differed by species and Bd condition. Within Desmognathus, Bd+ networks exhibited greater connectivity loss than Bd− networks under cascading failures, whereas Notophthalmus showed the opposite pattern, with Bd+ networks displaying greater vulnerability than Bd− (Figure 12). In absolute terms, cascade removal produced substantial fragmentation in both species, with Desmognathus typically showing ~70–75% connectivity loss and Notophthalmus reaching ~75–80% loss under comparable removal fractions (Figure 12).
The most substantial divergence between tolerant and susceptible hosts emerged under betweenness-based removal(targeting bridge/connector nodes). Notophthalmus Bd+ networks collapsed most rapidly, approaching a complete loss of connectivity (~100%), whereas Notophthalmus Bd− networks retained more structure (~75% loss). Incontrast, Desmognathus networks showed a comparatively stable response across Bd conditions, typically losing ~70–75% connectivity in both Bd+ and Bd− cases (Figure 12). Together, these results indicate that Bd detection is associated with a markedly increased vulnerability of the connector-node architecture in susceptible hosts. In contrast, tolerant hosts maintain more consistent robustness profiles across conditions.
Overall, these patterns provide quantitative evidence that susceptible and tolerant hosts differ in network robustness, particularly under the targeted removal of structurally important taxa (degree and betweenness) and cascade failures (Figure 12).
3.11. Tolerant vs Tolerant Hosts (Eurycea vs Desmognathus)
In the comparison between two Bd-tolerant hosts (Eurycea bislineata and Desmognathus monticola), the robustness profiles were broadly similar across removal strategies and Bd conditions, with typical connectivity losses in the ~70–80% range (Figure 13). Most removal methods did not produce significant between-group differences, suggesting that robust responses are more conserved among tolerant hosts than in tolerant–susceptible comparisons. The primary exception was degree-based removal, in which a significant difference was detected, driven by greater connectivity loss in the Desmognathus Bd− networks (Figure 13).
Taken together, robustness analyses indicate that Bd-associated changes in network vulnerability are host-dependent: the tolerant–susceptible contrast reveals pronounced differences, especially for connector-node (betweenness) removal, whereas tolerant–tolerant comparisons show largely overlapping robustness profiles with only limited differences (Figure 12 and Figure 13).
4. Discussion
Chytridiomycosis caused by Batrachochytrium dendrobatidis (Bd), together with disease caused by B. salamandrivorans (Bsal), remains one of the most critical drivers of amphibian population declines and extinctions worldwide. Increasing evidence indicates that the cutaneous microbiome plays an active role during infection, influencing host resistance, tolerance, and immune function through mechanisms that include competition for space and nutrients, the production of antifungal metabolites, and the modulation of host immune responses [52]. Probiotic strategies aimed at augmenting antifungal bacteria have shown partially favorable outcomes in some systems [45,53]; however, the results are inconsistent across host taxa and environmental contexts. In salamanders, field surveys often report a low prevalence of “classic” anti-Bd taxa and, instead, a substantial representation of commensal and opportunistic microorganisms that may be neutral or even facilitate pathogen establishment under certain conditions [44]. This is consistent with the broader view that amphibian immune responses alone may be insufficient to clear chytrid infection and that durable acquired immunity is limited or context dependent [54].
4.1. Community Composition and Diversity: Stability at High Taxonomic Ranks
In this study, salamanders of the genera Eurycea, Notophthalmus, and Desmognathus exhibited broadly similar high-level community profiles, with Proteobacteria, Bacteroidota/Bacteroidetes, Actinobacteriota/Actinobacteria, and Firmicutes among the predominant phyla across conditions. This pattern resembles that reported in previous studies on salamanders (e.g., Salamandra salamandra). This supports the notion that cutaneous communities frequently converge on a set of dominant bacterial lineages shaped by the shared ecological constraints of amphibian skin (hydration, osmotic conditions, antimicrobial peptides, and environmental exposure) [44]. Importantly, we did not detect significant differences in alpha diversity indices or broad community ordination between the Bd-detectable and Bd-non-detectable groups, consistent with studies reporting that Bd infection in salamanders can occur without major shifts in overall diversity or global composition [44]. Together, these results suggest that Bd detection is not necessarily accompanied by community-wide restructuring at a coarse taxonomic resolution and that disease-relevant changes may instead manifest as targeted shifts in specific taxa and/or in the architecture of microbial associations.
4.2. Differential Taxa and the Ecological Meaning of “Biomarkers”
Although dominant taxa were broadly shared between conditions, both LEfSe and ANCOM-BC identified condition-associated taxa (at the family/genus levels and at some database-specific clades). Such taxa should be interpreted as candidates of ecological relevance rather than direct causal agents. Several differentially abundant genera detected here have been reported in amphibian systems in association with lesions, stress, or opportunistic infections (e.g., Elizabethkingia, Klebsiella, and related Enterobacterales), although species-level resolution and functional verification are required before attributing pathogenicity or protective roles [57]. Conversely, taxa such as Pseudomonas and other Proteobacteria can participate in biofilm formation, metabolite production, and wound-associated processes in other amphibian models, potentially contributing to tissue repair or microbial antagonism, depending on the strain context [58]. These observations reinforce a central challenge in microbiome interpretation: many genera contain both beneficial and opportunistic strains, and functional effects are often strain-specific, context-dependent, and mediated by interactions with the broader community and host physiology.
Environmental exposure is also likely to contribute to the abundance of detected taxa. Amphibian skin communities are strongly influenced by habitat microbial pools (water, soil, and leaf litter), and shifts in temperature, humidity, pollutants, and land use can remodel the available microbial reservoirs and thus the community assembly process [59,60,61]. This environmental dependence may explain why microbiome signatures of Bd detection can vary across host species, locations, and between experimental and natural infections [44,55]. The presence of taxa previously associated with skin damage or ulceration, such as Acinetobacter in some amphibian contexts [63], is compatible with the idea that Bd-induced disruption of the stratum corneum could alter colonization opportunities; however, the present dataset cannot determine whether these taxa are drivers, passengers, or markers of altered skin physiology.
4.3. Network Analyses: Reorganization of Associations Despite Similar Composition
A key contribution of this study is the use of microbial association network analysis to move beyond “who is there” toward “how taxa are organized.” Across conditions, the inferred networks displayed modular organization, and the distributions of several centrality measures were broadly similar at the pooled condition level. This suggests that the community maintains comparable global architectural constraints, even when some taxa shift in relative abundance. Nevertheless, multiple lines of evidence indicate condition-dependent reorganization.
- Module membership turnover: Even when focusing on the same nominal module (e.g., the first/pink module across networks), overlap in node membership across Bd− and Bd+ networks was minimal, implying that Bd detection is associated with a reshuffling of taxa among modules. This is consistent with a community in which different taxa can occupy similar ecological “roles” or niches under varying conditions.
- Core network differences: Under stringent thresholds defining “core” associations, Bd− communities exhibited a larger and denser core than Bd+ communities, with limited overlap in core membership (only a small set of shared taxa). This pattern is consistent with Bd detection being associated with the loss (or reduced detectability) of strongly coupled taxa and/or the weakening of high-strength associations among community members.
- Modularity changes were host-dependent: Bd− networks showed high modularity across host taxa, whereas Bd+ networks showed modularity responses that differed by species. The modularity value of zero observed for Bd+ Eurycea warrants cautious interpretation: it may reflect the collapse of the community structure, but it can also arise from methodological factors (e.g., sparse networks after filtering, small sample size, disconnected components, or algorithmic resolution limits). Nonetheless, considering the broader evidence of module membership turnover and core network shrinkage, our results are consistent with the hypothesis that Bd detection can disrupt modular organization in a host-specific manner.
A critical point is that network edges inferred from compositional sequencing data represent associations rather than direct interactions between nodes. Negative edges may reflect competition, niche differentiation, or compositional constraints, whereas positive edges may reflect co-occurrence driven by a shared environment or metabolic coupling. However, consistent differences in module structure and core density across conditions suggest that Bd detection is linked to changes in community coupling and potential functional redundancy.
4.4. Central Taxa, Clustering, and Implications for Tolerance vs Susceptibility
Comparisons of centrality distributions between tolerant and susceptible hosts suggest that Bd detection may amplify differences in the roles of “connector” taxa (high betweenness) and local cohesiveness (clustering coefficient). Nodes with high betweenness often connect modules and can disproportionately influence network connectivity during perturbations. Simultaneously, clustering captures the local neighborhood structure and is commonly interpreted as a proxy for the capacity to form cohesive sub-communities. The observation that specific centrality differences are stronger in Bd+ than in Bd− networks supports the view that infection status can reshape the taxa that act as bridges and how tightly local neighborhoods are organized. Importantly, these patterns appear more pronounced in tolerant–susceptible contrasts than in tolerant–tolerant comparisons, suggesting that tolerance may be associated with a more stable network organization across conditions. In contrast, susceptibility may coincide with larger infection-associated shifts in the roles of nodes.
4.5. Robustness: Vulnerability Under Targeted Attacks and Ecological Interpretation
Robustness analyses indicated that both Bd− and Bd+ networks were relatively tolerant to random node loss but were vulnerable to targeted removal strategies (degree-, betweenness-based, and cascade failures), consistent with dependence on a subset of highly connected or bridging taxa. In tolerant hosts, robustness profiles were generally more consistent across Bd conditions, whereas in susceptible hosts, they showed stronger Bd-associated changes, particularly under bridge-node removal. These findings align with the hypothesis that host tolerance may be related to maintaining a structurally resilient microbial association architecture, potentially buffering functional processes on the skin during pathogen exposure. Ecologically, multiple perturbations can mimic node-loss scenarios, including host antimicrobial peptides, antibiotics, toxic compounds, or competitive displacement among microbes. However, translating robustness curves into ecological causality requires functional validation and time-resolved sampling.
4.6. Limitations and Future Directions
This study has some limitations. First, this study relied on cross-sectional 16S rRNA gene amplicon data, which limited taxonomic resolution and did not directly capture function or strain-level variation. Second, network inference from compositional data is sensitive to preprocessing choices (filtering, normalization, and thresholding) and should be interpreted as hypothesis-generating, rather than definitive interaction maps. Third, Bd detection status (Bd+ vs. Bd−) does not necessarily capture infection intensity, lesion severity, or temporal stage, all of which could influence microbiome dynamics. Finally, host species differ in their ecology and physiology, and environmental microbial pools may confound the effects of these conditions.
Future work should prioritize (i) incorporating Bd load and disease severity metrics, (ii) longitudinal sampling to distinguish cause from consequence, (iii) shotgun metagenomics or targeted culturing to resolve strain-level functional traits, (iv) explicit testing of antifungal activity and community assembly mechanisms, and (v) integrating environmental microbiome baselines. Together, these approaches will clarify whether the observed condition-dependent network reorganizations reflect adaptive restructuring, pathogen-driven disruption, or environmental filtering, and whether particular taxa or interaction motifs can be leveraged for conservation efforts.
5. Conclusions
This study evaluated whether Bd detection is associated with changes in the salamander skin bacteriome using 16S rRNA amplicon data and a complementary complex network framework. Across Eurycea bislineata, Notophthalmus viridescens, and Desmognathus monticola, Bd-detectable (Bd+) and Bd-non-detectable (Bd−) samples showed no significant differences in broad community composition or standard diversity metrics, indicating that wholesale shifts in dominant taxa or overall richness/evenness do not necessarily accompany Bd detection. Simultaneously, differential abundance analyses identified condition-associated taxa consistent with Bd-linked changes that are specific and taxon-resolved rather than global.
Network-based analyses revealed that Bd detection is associated with the reorganization of the microbial association architecture. Module membership exhibited limited overlap between Bd+ and Bd− networks, and stringent “core” networks differed strongly in density and composition, with only minimal shared memberships. Modularity patterns further suggested host-dependent responses, including a marked loss of detectable modular structure in Bd+ Eurycea, whereas other hosts retained strong compartmentalization. Comparisons of centrality and robustness supported the idea that host susceptibility profiles are reflected in network topology, with tolerant–susceptible contrasts showing larger differences under targeted perturbation scenarios than tolerant–tolerant comparisons.
Bd-related microbiome signatures in salamanders may be subtle at the level of bulk composition but are detectable in the structure of microbial network associations and core connectivity. By integrating differential abundance with network modularity, centrality, and robustness, this study provides a reproducible analytical template for identifying structural biomarkers of dysbiosis and resilience in amphibian skin. This perspective can inform future conservation strategies by prioritizing not only “which taxa are present,” but also how microbial communities are organized, which may ultimately shape stability, tolerance, and responsiveness to microbiome-based interventions.
Supplementary Materials
The following supporting information can be downloaded at the website of this paper posted on Preprints.org. File: Relative_abundances_Figures_S1_S2.pdf. Figure S1. Family-level relative abundance profiles by sample and Bd detection status. Stacked bar plots show the relative abundance of bacterial families for each individual sample, grouped by condition (Bd-detectable, Bd+; Bd-non-detectable, Bd−). Colors correspond to different families, with taxon names indicated in the legend. Figure S2. Phylum-level relative abundance profiles by sample and Bd detection status. Stacked bar plots show the relative abundance of bacterial phyla for each individual sample, grouped by condition (Bd+ vs Bd−). Colors correspond to different phyla, with taxon names indicated in the legend. File: ANCOM-BC_Complete_Figures_S3_S4.pdf. Figure S3. ANCOM-BC differential abundance results at the order and family levels. Lollipop plots summarize taxa identified by ANCOM-BC as differentially abundant between Bd-detectable (Bd+) and Bd-non-detectable (Bd−) salamanders. Points represent taxa and are positioned by the ANCOM-BC W statistic (x-axis), which reflects the strength of differential abundance. Larger W values indicate stronger evidence for differences between conditions; only taxa meeting the study’s significance criteria are shown. Figure S4. ANCOM-BC differential abundance results at the order and genus levels. Lollipop plots show taxa identified by ANCOM-BC as differentially abundant between Bd+ and Bd− salamanders at the order and genus ranks. Points are plotted by the ANCOM-BC W statistic (x-axis), where higher values indicate stronger evidence for differential abundance between conditions; only taxa meeting the study’s significance criteria are displayed. File: Complete_biological_networks_genus_level_Figure_S5.pdf. Figure S5. Genus-level network inference by Bd detection status. Association networks inferred from salamander skin bacterial communities are shown separately for Bd-detectable (Bd+) and Bd-non-detectable (Bd−) groups. Nodes represent bacterial genera and edges represent retained associations after applying the selected filtering/thresholding criteria. Networks are visualized using two layouts (Yifan Hu and Fruchterman–Reingold) to highlight global structure and local clustering patterns. Edge color intensity (blue gradient) encodes association strength (correlation threshold), with darker edges indicating stronger retained associations. File: Positive_and_Negative_correlation_Networks_Figure_S6.pdf. Figure S6. Signed ASV-level association networks by Bd detection status. Networks inferred from ASV abundance profiles are shown separately for Bd-detectable (Bd+) and Bd-non-detectable (Bd−) salamanders. Nodes represent ASVs and edges represent retained associations. Edge color indicates the sign of the association: positive (green) and negative(red), reflecting co-occurrence versus inverse abundance patterns under the selected inference and filtering criteria. File: Bacterial_list_names_phylum_level_complete_networks_positive.csv. Table S1. Taxonomic and network attributes of nodes in the Bd-detectable (Bd+) network. The table lists all bacterial taxa (nodes) retained in the full inferred network for Bd+ salamanders, together with their visualization color assignment and module (community) membership (modularity class) as determined by the community-detection algorithm. File: Bacterial_list_names_phylum_level_complete_networks_negative.csv. Table S2. (Bd−) network. The table lists all bacterial taxa (nodes) retained in the full inferred network for Bd− salamanders, together with their visualization color assignment and module (community) membership (modularity class) as determined by the community-detection algorithm. File: Bacterial_list_names_modules.csv. Table S3. Module-level taxon membership for condition-specific networks. This table lists the bacterial taxa (nodes) assigned to each detected module (community) within the inferred networks for each condition (Bd+ and Bd−). Taxon names are grouped by module and accompanied by the corresponding module color label used in network visualizations. These module membership lists were used to generate the module-based Venn diagrams shown in the main text. File: ASV_table_names_correlation_networks.csv. Table S4. ASV membership in signed association networks by Bd detection status. This table lists the ASVs retained in the signed association networks for Bd-detectable (Bd+) and Bd-non-detectable (Bd−) groups, together with their taxonomic assignments. The table enables identification of which taxa (via ASV IDs) are present in each network and supports cross-network comparisons of shared and condition-specific ASVs. File: Desmognathus_comparison_module_2_green.pdf. Figure S7. Venn diagram comparison of genus membership for the green module across conditions. The Venn diagram shows the bacterial genera (nodes) assigned to the module labeled green in the inferred networks, comparing Bd-detectable (Bd+) and Bd-non-detectable (Bd−) groups. Taxa are partitioned into condition-specific and shared sets, highlighting overlap (if any) between networks for the same module label under different Bd conditions. File: Desmognathus_comparison_module_3_orange.pdf. Figure S8. Venn diagram comparison of genus membership for the orange module across conditions. The Venn diagram shows the bacterial genera (nodes) assigned to the module labeled orange in the inferred networks, comparing Bd-detectable (Bd+) and Bd-non-detectable (Bd−) groups. Taxa are separated into condition-specific and shared sets, allowing evaluation of overlap in module membership between networks with the same module label under different Bd conditions. File: Topology_and_Robustness_comparisons_of_Eurycea_Notophthalmus_and_Eurycea_Desmognathus_S9-S14.pdf. Figure S9. Topology comparisons of Notophthalmus and Eurycea (Bd-). The One-way ANOVA and Tukey's post-hoc test were used to make comparisons of the values obtained from the topological properties. Figure S10. Topology comparisons of Notophthalmus and Eurycea (Bd+). The One-way ANOVA and Tukey's post- hoc test were used to make comparisons of the values obtained from the topological properties. Figure S11. Topology comparisons of Desmognathus and Eurycea (Bd-). The One-way ANOVA and Tukey's post hoc test were used to make comparisons of the values obtained from the topological properties. Figure S12. Topology comparisons of Desmognathus and Eurycea (Bd+). The One-way ANOVA and Tukey's post hoc test were used to make comparisons of the values obtained from the topological properties. Figure S13. Robustness comparisons of Notophthalmus and Eurycea (Bd- and Bd+). The One-way ANOVA and Tukey's post hoc test were used to make comparisons of the values obtained from the robustness properties. Figure S14. Robustness comparisons of Desmognathus and Eurycea (Bd- and Bd+). The One-way ANOVA and Tukey's post hoc test were used to make comparisons of the values obtained from the robustness properties. Supporting information: Additional supporting information can be found online in the Supporting Information section.
Author Contributions
Ramírez-Villarreal Jimena: writing – original draft, investigation, conceptualization, visualization, methodology. Álvarez-Martínez, Roberto: conceptualization, funding acquisition, writing – review and editing, project administration, supervision.
Funding
This work was supported by the scholarship from Consejo Nacional de Humanidades, Ciencias y Tecnologías (CONAHCyT) currently, Secretaría de Ciencia, Humanidades, Tecnología e Innovación (SECIHTI) [1003112].
Ethics statement
The authors declare that they have no conflicts of interest to report.
Data availability statement
Salamander skin microbiome and association with Mucosome (https://www.ncbi.nlm.nih.gov/sra/?term=PRJNA659464). ID BIOPROJECT PRJNA659464. Processed Data https://github.com/VillarrealJ24/Art_III.
Acknowledgments
R-Villarreal Jimena is a doctoral student from the Program of Doctorado en Ciencias Biológicas, Universidad Autónoma de Querétaro (UAQ), and has received a scholarship from Consejo Nacional de Humanidades, Ciencias y Tecnologías (CONAHCyT) currently, Secretaría de Ciencia, Humanidades, Tecnología e Innovación (SECIHTI) [1003112].
Conflicts of Interest
The authors declare no conflicts of interest.
References
- Crudele, L.; Gadaleta, R. M.; Cariello, M.; Moschetta, A. Gut microbiota in the pathogenesis and therapeutic approaches of diabetes. EBioMedicine 2023, 97, 104821. [Google Scholar] [CrossRef]
- Ting, N. L.-N.; Lau, H. C.-H.; Yu, J. Cancer pharmacomicrobiomics: Targeting microbiota to optimize cancer therapy outcomes. Gut 2022, 71(7), 1412–1425. [Google Scholar] [CrossRef]
- Kuznetzova, O. Ju.; Gorshenina, A. P.; Nesterov, O. V.; Maximovskaya, L. N. Complex treatment of recurrent herpetic stomatitis with dysbiosis. Stomatologiya 2017, 96(5), 31. [Google Scholar] [CrossRef] [PubMed]
- Vanhoefer, U.; Harstrick, A.; Achterrath, A.; Cao, W.; Seeber, S.; Rustum, S.Y.M. Irinotecan in the treatment of colorectal cancer: Clinical overview. Journal of Clinical Oncology: Official Journal of the American Society of Clinical Oncology 2001, 19(5), 1501–1518. [Google Scholar] [CrossRef] [PubMed]
- Torres-Carrillo, N.; Martínez-López, E.; Torres-Carrillo, N. M.; López-Quintero, A.; Moreno-Ortiz, J. M.; González-Mercado, A.; Gutiérrez-Hurtado, I. A. Pharmacomicrobiomics and Drug–Infection Interactions: The Impact of Commensal, Symbiotic and Pathogenic Microorganisms on a Host Response to Drug Therapy. International Journal of Molecular Sciences 2023, 24(23), 17100. [Google Scholar] [CrossRef]
- Brown, L. C.; Bobo, W. V.; Gall, C. A.; Müller, D. J.; Bousman, C. A. Pharmacomicrobiomics of Antidepressants in Depression: A Systematic Review. Journal of Personalized Medicine 2023, 13(7), 1086. [Google Scholar] [CrossRef] [PubMed]
- Menozzi, E.; Schapira, A. H. V. The Gut Microbiota in Parkinson Disease: Interactions with Drugs and Potential for Therapeutic Applications. CNS Drugs 2024, 38(5), 315–331. [Google Scholar] [CrossRef]
- Kueneman, J. G.; Parfrey, L. W.; Woodhams, D. C.; Archer, H. M.; Knight, R.; McKenzie, V. J. The amphibian skin-associated microbiome across species, space and life history stages. Molecular Ecology 2014, 23(6), 1238–1250. [Google Scholar] [CrossRef]
- Martínez-Ugalde, E.; Ávila-Akerberg, V.; González Martínez, T. M.; Vázquez Trejo, M.; Zavala Hernández, D.; Anaya-Morales, S. L.; Rebollar, E. A. The skin microbiota of the axolotl Ambystoma altamirani is highly influenced by metamorphosis and seasonality but not by pathogen infection. Animal Microbiome 2022, 4(1), 63. [Google Scholar] [CrossRef]
- Wuerthner, V. P.; Hua, J.; Hernández-Gómez, O. Life stage and proximity to roads shape the skin microbiota of eastern newts (Notophthalmus viridescens). Environmental Microbiology 2022, 24(9), 3954–3965. [Google Scholar] [CrossRef]
- Wan, B.; Chen, G.; Poon, E. S. K.; Fung, H. S.; Lau, A.; Sin, S. Y. W. Environmental factors and host sex influence the skin microbiota structure of Hong Kong newt (Paramesotriton hongkongensis) in a coldspot of chytridiomycosis in subtropical East Asia. Integrative Zoology 2024. [Google Scholar] [CrossRef]
- Dwaraka, V. B.; Voss, S. R. Towards comparative analyses of salamander limb regeneration. Journal of Experimental Zoology Part B: Molecular and Developmental Evolution 2021, 336(2), 129–144. [Google Scholar] [CrossRef]
- Demircan, T.; Gül, S.; Taşçı, E. A. Can Microbiome Modulate Regenerative Capacity? A Comparative Microbiome Study Reveals a Dominant Presence of Flavobacteriaceae in Blastema Tissue During Axolotl Limb Regeneration. OMICS: A Journal of Integrative Biology 2024, 28(6), 291–302. [Google Scholar] [CrossRef]
- Hunt, D. E.; Ward, C. S. A network-based approach to disturbance transmission through microbial interactions. Frontiers in Microbiology 2015, 6. [Google Scholar] [CrossRef]
- Analysis of biological networks; Junker, B. H., Schreiber, F., Eds.; Wiley-Interscience, 2008. [Google Scholar]
- Oldham, S.; Fulcher, B.; Parkes, L.; Arnatkevic Iūtė, A.; Suo, C.; Fornito, A. Consistency and differences between centrality measures across distinct classes of networks. PloS One 2019, 14(7), e0220061. [Google Scholar] [CrossRef]
- Lou, Y.; Wu, R.; Li, J.; Wang, L.; Tang, C.-B.; Chen, G. Classification-based prediction of network connectivity robustness. Neural Networks: The Official Journal of the International Neural Network Society 2023, 157, 136–146. [Google Scholar] [CrossRef]
- Saint-Antoine, M. M.; Singh, A. Network inference in systems biology: Recent developments, challenges, and applications. Current Opinion in Biotechnology 2020, 63, 89–98. [Google Scholar] [CrossRef] [PubMed]
- Fisher, M. C.; Garner, T. W. J.; Walker, S. F. Global Emergence of Batrachochytrium dendrobatidis and Amphibian Chytridiomycosis in Space, Time, and Host. Annual Review of Microbiology 2009, 63(1), 291–310. [Google Scholar] [CrossRef]
- Martel, A.; Spitzen-van Der Sluijs, A.; Blooi, M.; Bert, W.; Ducatelle, R.; Fisher, M. C.; Woeltjes, A.; Bosman, W.; Chiers, K.; Bossuyt, F.; Pasmans, F. Batrachochytrium salamandrivorans sp. Nov. Causes lethal chytridiomycosis in amphibians. Proceedings of the National Academy of Sciences 2013, 110(38), 15325–15329. [Google Scholar] [CrossRef] [PubMed]
- Olson, D. H.; Ronnenberg, K. L.; Glidden, C. K.; Christiansen, K. R.; Blaustein, A. R. Global Patterns of the Fungal Pathogen Batrachochytrium dendrobatidis Support Conservation Urgency. Frontiers in Veterinary Science 2021, 8, 685877. [Google Scholar] [CrossRef] [PubMed]
- Tornabene, B. J.; Hossack, B. R.; Crespi, E. J.; Breuner, C. W. Evaluating corticosterone as a biomarker for amphibians exposed to increased salinity and ambient corticosterone. Conservation Physiology 2021, 9(1), coab049. [Google Scholar] [CrossRef] [PubMed]
- Rollins-Smith, L. A.; Le Sage, E. H. Heat stress and amphibian immunity in a time of climate change. Philosophical Transactions of the Royal Society B: Biological Sciences 2023, 378(1882), 20220132. [Google Scholar] [CrossRef] [PubMed]
- Belasen, A. M.; Riolo, M. A.; Bletz, M. C.; Lyra, M. L.; Toledo, L. F.; James, T. Y. Geography, Host Genetics, and Cross-Domain Microbial Networks Structure the Skin Microbiota of Fragmented Brazilian Atlantic Forest Frog Populations. Ecology and Evolution 2021, 11(14), 9293–9307. [Google Scholar] [CrossRef]
- Neely, W. J.; Martins, R. A.; Mendonça Da Silva, C. M.; Ferreira Da Silva, T.; Fleck, L. E.; Whetstone, R. D.; Woodhams, D. C.; Cook, W. H.; Prist, P. R.; Valiati, V. H.; Greenspan, S. E.; Tozetti, A. M.; Earley, R. L.; Becker, C. G. Linking microbiome and stress hormone responses in wild tropical treefrogs across continuous and fragmented forests. Communications Biology 2023, 6(1), 1261. [Google Scholar] [CrossRef]
- Schilliger, L.; Paillusseau, C.; François, C.; Bonwitt, J. Major Emerging Fungal Diseases of Reptiles and Amphibians. Pathogens 2023, 12(3), 429. [Google Scholar] [CrossRef] [PubMed]
- Xie, G. Y.; Olson, D. H.; Blaustein, A. R. Projecting the Global Distribution of the Emerging Amphibian Fungal Pathogen, Batrachochytrium dendrobatidis, Based on IPCC Climate Futures. PLOS ONE 2016, 11(8), e0160746. [Google Scholar] [CrossRef]
- Nnadi, N. E.; Carter, D. A. Climate change and the emergence of fungal pathogens. PLOS Pathogens 2021, 17(4), e1009503. [Google Scholar] [CrossRef]
- Muletz-Wolz, C. R.; Fleischer, R. C.; Lips, K. R. Fungal disease and temperature alter skin microbiome structure in an experimental salamander system. Molecular Ecology 2019, 28(11), 2917–2931. [Google Scholar] [CrossRef]
- Woodhams, D. C.; Alford, R. A.; Antwis, R. E.; Archer, H.; Becker, M. H.; Belden, L. K.; Bell, S. C.; Bletz, M.; Daskin, J. H.; Davis, L. R.; Flechas, S. V.; Lauer, A.; Gonzalez, A.; Harris, R. N.; Holden, W. M.; Hughey, M. C.; Ibáñez, R.; Knight, R.; Kueneman, J.; McKenzie, V. Antifungal isolates database of amphibian skin-associated bacteria and functions against emerging fungal pathogens: Ecological Archives E096-059. Ecology 2015, 96(2), 595–595. [Google Scholar] [CrossRef]
- Piovia-Scott, J.; Rejmanek, D.; Woodhams, D. C.; Worth, S. J.; Kenny, H.; McKenzie, V.; Lawler, S. P.; Foley, J. E. Greater Species Richness of Bacterial Skin Symbionts Better Suppresses the Amphibian Fungal Pathogen Batrachochytrium Dendrobatidis. Microbial Ecology 2017, 74(1), 217–226. [Google Scholar] [CrossRef]
- Woodhams, D. C.; Rollins-Smith, L. A.; Reinert, L. K.; Lam, B. A.; Harris, R. N.; Briggs, C. J.; Vredenburg, V. T.; Patel, B. T.; Caprioli, R. M.; Chaurand, P.; Hunziker, P.; Bigler, L. Probiotics Modulate a Novel Amphibian Skin Defense Peptide That Is Antifungal and Facilitates Growth of Antifungal Bacteria. Microbial Ecology 2020, 79(1), 192–202. [Google Scholar] [CrossRef]
- Bates, K. A.; Sommer, U.; Hopkins, K. P.; Shelton, J. M. G.; Wierzbicki, C.; Sergeant, C.; Tapley, B.; Michaels, C. J.; Schmeller, D. S.; Loyau, A.; Bosch, J.; Viant, M. R.; Harrison, X. A.; Garner, T. W. J.; Fisher, M. C. Microbiome function predicts amphibian chytridiomycosis disease dynamics. Microbiome 2022, 10(1), 44. [Google Scholar] [CrossRef]
- Chen, M. Y.; Alexiev, A.; McKenzie, V. J. Bacterial Biofilm Thickness and Fungal Inhibitory Bacterial Richness Both Prevent Establishment of the Amphibian Fungal Pathogen Batrachochytrium dendrobatidis. Applied and Environmental Microbiology 2022, 88(5), e01604-21. [Google Scholar] [CrossRef]
- MacAlpine, J.; Robbins, N.; Cowen, L. E. Bacterial-fungal interactions and their impact on microbial pathogenesis. Molecular Ecology 2023, 32(10), 2565–2581. [Google Scholar] [CrossRef]
- Kinnula, H.; Mappes, J.; Sundberg, L.-R. Coinfection outcome in an opportunistic pathogen depends on the inter-strain interactions. BMC Evolutionary Biology 2017, 17(1), 77. [Google Scholar] [CrossRef] [PubMed]
- Fast, D.; Kostiuk, B.; Foley, E.; Pukatzki, S. Commensal-Pathogen Competition Impacts Host Viability. 2018. [Google Scholar] [CrossRef] [PubMed]
- Santus, W.; Devlin, J. R.; Behnsen, J. Crossing Kingdoms: How the Mycobiota and Fungal-Bacterial Interactions Impact Host Health and Disease. Infection and Immunity 2021, 89(4), e00648-20. [Google Scholar] [CrossRef]
- Holmes, M. L.; Shine, R.; Waddle, A. W. Spontaneous reoccurrence of Batrachochytrium dendrobatidis infections in Australian green tree frogs (Litoria caerulea) following successful heat therapy: Case report. Veterinary Research Communications 2024, 48(5), 3229–3237. [Google Scholar] [CrossRef] [PubMed]
- Gibson, J. F.; Pidwill, G. R.; Carnell, O. T.; Surewaard, B. G. J.; Shamarina, D.; Sutton, J. A. F.; Jeffery, C.; Derré-Bobillot, A.; Archambaud, C.; Siggins, M. K.; Pollitt, E. J. G.; Johnston, S. A.; Serror, P.; Sriskandan, S.; Renshaw, S. A.; Foster, S. J. Commensal bacteria augment Staphylococcus aureus infection by inactivation of phagocyte-derived reactive oxygen species. PLoS Pathogens 2021, 17(9), e1009880. [Google Scholar] [CrossRef]
- Hardman, R. H.; Reinert, L. K.; Irwin, K. J.; Oziminski, K.; Rollins-Smith, L.; Miller, D. L. Disease state associated with chronic toe lesions in hellbenders may alter anti-chytrid skin defenses. Scientific Reports 2023, 13(1). [Google Scholar] [CrossRef]
- Hu, H.-L.; Chen, J.-M.; Chen, J.-Y.; Seah, R. W. X.; Ding, G.-H. Microbial Diversity of the Chinese Tiger Frog (Hoplobatrachus rugulosus) on Healthy versus Ulcerated Skin. Animals 2022, 12(10), 1241. [Google Scholar] [CrossRef]
- Li, Z.; Wang, G.; Zhang, K.; Gong, W.; Yu, E.; Tian, J.; Xie, J.; Yu, D. Epizootic ulcerative syndrome causes cutaneous dysbacteriosis in hybrid snakehead (Channa maculata♀ × Channa argus♂). PeerJ 2019, 7, e6674. [Google Scholar] [CrossRef]
- Bletz, M. C.; Kelly, M.; Sabino-Pinto, J.; Bales, E.; Van Praet, S.; Bert, W.; Boyen, F.; Vences, M.; Steinfartz, S.; Pasmans, F.; Martel, A. Disruption of skin microbiota contributes to salamander disease. Proceedings of the Royal Society B: Biological Sciences 2018, 285(1885), 20180758. [Google Scholar] [CrossRef]
- Harris, R.; Lauer, A.; Simon, M.; Banning, J.; Alford, R. Addition of antifungal skin bacteria to salamanders ameliorates the effects of chytridiomycosis. Diseases of Aquatic Organisms 2009, 83, 11–16. [Google Scholar] [CrossRef]
- Becker, M. H.; Brucker, R. M.; Schwantes, C. R.; Harris, R. N.; Minbiole, K. P. C. The Bacterially Produced Metabolite Violacein Is Associated with Survival of Amphibians Infected with a Lethal Fungus. Applied and Environmental Microbiology 2009, 75(21), 6635–6638. [Google Scholar] [CrossRef]
- Agate, L.; Beam, D.; Bucci, C.; Dukashin, Y.; Jo’Beh, R.; O’Brien, K.; Jude, B. A. The Search for Violacein-Producing Microbes to Combat Batrachochytrium dendrobatidis: A Collaborative Research Project between Secondary School and College Research Students. Journal of Microbiology & Biology Education 2016, 17(1), 70–73. [Google Scholar] [CrossRef]
- Gass, J.; Voyles, J. When Defenses Fail: Atelopus zeteki Skin Secretions Increase Growth of the Pathogen Batrachochytrium dendrobatidis. Integrative and Comparative Biology 2022, 62(6), 1595–1605. [Google Scholar] [CrossRef] [PubMed]
- Jiménez, R. R.; Carfagno, A.; Linhoff, L.; Gratwicke, B.; Woodhams, D. C.; Chafran, L. S.; Bletz, M. C.; Bishop, B.; Muletz-Wolz, C. R. Inhibitory Bacterial Diversity and Mucosome Function Differentiate Susceptibility of Appalachian Salamanders to Chytrid Fungal Infection. Applied and Environmental Microbiology 2022, 88(8), e01818-21. [Google Scholar] [CrossRef]
- Van Rooij, P.; Martel, A.; Haesebrouck, F.; Pasmans, F. Amphibian chytridiomycosis: A review with focus on fungus-host interactions. Veterinary Research 2015, 46(1), 137. [Google Scholar] [CrossRef] [PubMed]
- Corduneanu, A.; Wu-Chuang, A.; Maitre, A.; Obregon, D.; Sándor, A. D.; Cabezas-Cruz, A. Structural differences in the gut microbiome of bats using terrestrial vs. Aquatic feeding resources. BMC Microbiology 2023, 23(1), 93. [Google Scholar] [CrossRef] [PubMed]
- Woodhams, D. C.; LaBumbard, B. C.; Barnhart, K. L.; Becker, M. H.; Bletz, M. C.; Escobar, L. A.; Flechas, S. V.; Forman, M. E.; Iannetta, A. A.; Joyce, M. D.; Rabemananjara, F.; Gratwicke, B.; Vences, M.; Minbiole, K. P. C. Prodigiosin, Violacein, and Volatile Organic Compounds Produced by Widespread Cutaneous Bacteria of Amphibians Can Inhibit Two Batrachochytrium Fungal Pathogens. Microbial Ecology 2018, 75(4), 1049–1062. [Google Scholar] [CrossRef] [PubMed]
- Myers, J. M.; Ramsey, J. P.; Blackman, A. L.; Nichols, A. E.; Minbiole, K. P. C.; Harris, R. N. Synergistic inhibition of the lethal fungal pathogen Batrachochytrium dendrobatidis: The combined effect of symbiotic bacterial metabolites and antimicrobial peptides of the frog Rana muscosa. Journal of Chemical Ecology 2012, 38(8), 958–965. [Google Scholar] [CrossRef]
- Stegen, G.; Pasmans, F.; Schmidt, B. R.; Rouffaer, L. O.; Van Praet, S.; Schaub, M.; Canessa, S.; Laudelout, A.; Kinet, T.; Adriaensen, C.; Haesebrouck, F.; Bert, W.; Bossuyt, F.; Martel, A. Drivers of salamander extirpation mediated by Batrachochytrium salamandrivorans. Nature 2017, 544(7650), 353–356. [Google Scholar] [CrossRef]
- Mulla, L.; Hernández-Gómez, O. Wildfires disturb the natural skin microbiota of terrestrial salamanders. Environmental Microbiology 2023, 25(11), 2203–2215. [Google Scholar] [CrossRef] [PubMed]
- Cordeiro, I. F.; Lemes, C. G. de C.; Sanchez, A. B.; da Silva, A. K.; de Paula, C. H.; de Matos, R. C.; Ribeiro, D. F.; de Matos, J. P.; Garcia, C. C. M.; Beirão, M.; Becker, C. G.; Pires, M. R. S.; Moreira, L. M. Amphibian tolerance to arsenic: Microbiome-mediated insights. Scientific Reports 2024, 14(1), 10193. [Google Scholar] [CrossRef]
- Li, S.; Wang, X.; Lu, Y.; Wang, J.; Yu, D.; Zhou, Z.; Wei, J.; Liu, L.; Liu, J.; Liu, F.; Su, Y.; Xu, H. Co-infections of Klebsiella pneumoniae and Elizabethkingia miricola in black-spotted frogs (Pelophylax nigromaculatus). Microbial Pathogenesis 2023, 180, 106150. [Google Scholar] [CrossRef]
- Chapman, P. A.; Hudson, D.; Morgan, X. C.; Beck, C. W. The role of family and environment in determining the skin bacterial communities of captive aquatic frogs, Xenopus laevis. FEMS Microbiology Ecology 2024, 100(11), fiae131. [Google Scholar] [CrossRef]
- Zhu, W.; Zhao, C.; Feng, J.; Chang, J.; Zhu, W.; Chang, L.; Liu, J.; Xie, F.; Li, C.; Jiang, J.; Zhao, T. Effects of Habitat River Microbiome on the Symbiotic Microbiota and Multi-Organ Gene Expression of Captive-Bred Chinese Giant Salamander. Frontiers in Microbiology 2022, 13, 884880. [Google Scholar] [CrossRef]
- Zhang, H.; Ma, H.; Deng, J.; Zhao, H.; Fang, C.; Zhang, J.; Wang, Q.; Zhang, H.; Jiang, W.; Kong, F. Seasonality influences skin bacterial community structure and anti-Bd function in two anuran species. Frontiers in Microbiology 2024, 15, 1463563. [Google Scholar] [CrossRef] [PubMed]
- Chew, A.; West, M.; Berger, L.; Brannelly, L. A. The impacts of water quality on the amphibian chytrid fungal pathogen: A systematic review. Environmental Microbiology Reports 2024, 16(3), e13274. [Google Scholar] [CrossRef]
- Mutnale, M. C.; Reddy, G. S.; Vasudevan, K. Bacterial Community in the Skin Microbiome of Frogs in a Coldspot of Chytridiomycosis Infection. Microbial Ecology 2021, 82(2), 554–558. [Google Scholar] [CrossRef]
- Hu, H.-L.; Chen, J.-M.; Chen, J.-Y.; Seah, R. W. X.; Ding, G.-H. Microbial Diversity of the Chinese Tiger Frog (Hoplobatrachus rugulosus) on Healthy versus Ulcerated Skin. Animals: An Open Access Journal from MDPI 2022, 12(10), 1241. [Google Scholar] [CrossRef]
- Portillo, A.; Santibáñez, P.; Palomar, A. M.; Santibáñez, S.; Oteo, J. A. ‘Candidatus Neoehrlichia mikurensis’ in Europe. New Microbes and New Infections 2018, 22, 30–36. [Google Scholar] [CrossRef] [PubMed]
- Wang, N.; Yu, H.-J.; Han, X.-Y.; Li, C.; Ye, R.-Z.; Du, L.-F.; Liu, Y.-T.; Zhang, M.-Z.; Shi, X.-Y.; Zhu, D.-Y.; Shi, W.; Jia, N.; Jiang, J.-F.; Sun, Y.; Zhao, L.; Cui, X.-M.; Cao, W.-C. Genomic characterization of an emerging Rickettsia barbariae isolated from tick eggs in northwestern China. Emerging Microbes & Infections 2024, 13(1), 2396870. [Google Scholar] [CrossRef] [PubMed]
- Hartnell, R. E.; Stockley, L.; Keay, W.; Rosec, J.-P.; Hervio-Heath, D.; Van Den Berg, H.; Leoni, F.; Ottaviani, D.; Henigman, U.; Denayer, S.; Serbruyns, B.; Georgsson, F.; Krumova-Valcheva, G.; Gyurova, E.; Blanco, C.; Copin, S.; Strauch, E.; Wieczorek, K.; Lopatek, M.; Baker-Austin, C. A pan-European ring trial to validate an International Standard for detection of Vibrio cholerae, Vibrio parahaemolyticus and Vibrio vulnificus in seafoods. International Journal of Food Microbiology 2019, 288, 58–65. [Google Scholar] [CrossRef] [PubMed]
- Davoodi, S.; Foley, E. Host-Microbe-Pathogen Interactions: A Review of Vibrio cholerae Pathogenesis in Drosophila. Frontiers in Immunology 2020, 10, 3128. [Google Scholar] [CrossRef]
- Baker-Austin, C.; Oliver, J. D. Vibrio vulnificus: New insights into a deadly opportunistic pathogen. Environmental Microbiology 2018, 20(2), 423–430. [Google Scholar] [CrossRef]
- Aghnatios, R.; Drancourt, M. Gemmata Species: Planctomycetes of Medical Interest. Future Microbiology 2016, 11(5), 659–667. [Google Scholar] [CrossRef]
- Tett, A.; Pasolli, E.; Masetti, G.; Ercolini, D.; Segata, N. diversity, niches and interactions with the human host. Nature Reviews Microbiology 2021, 19(9), 585–599. [Google Scholar] [CrossRef]
- Carniel, E. The high-pathogenicity island: An iron-uptake island. Microbes and Infection 2001, 3(7), 561–569. [Google Scholar] [CrossRef]
- Zhang, H.; Ma, H.; Deng, J.; Zhao, H.; Fang, C.; Zhang, J.; Wang, Q.; Zhang, H.; Jiang, W.; Kong, F. Seasonality influences skin bacterial community structure and anti-Bd function in two anuran species. Frontiers in Microbiology 2024, 15, 1463563. [Google Scholar] [CrossRef] [PubMed]
- Zhang, M.; Cui, S.; Mao, B.; Zhang, Q.; Zhao, J.; Zhang, H.; Tang, X.; Chen, W. Ellagic acid and intestinal microflora metabolite urolithin A: A review on its sources, metabolic distribution, health benefits, and biotransformation. Critical Reviews in Food Science and Nutrition 2023, 63(24), 6900–6922. [Google Scholar] [CrossRef] [PubMed]
- Venturelli, O. S.; Carr, A. C.; Fisher, G.; Hsu, R. H.; Lau, R.; Bowen, B. P.; Hromada, S.; Northen, T.; Arkin, A. P. Deciphering microbial interactions in synthetic human gut microbiome communities. Molecular Systems Biology 2018, 14(6), e8157. [Google Scholar] [CrossRef] [PubMed]
- Faust, K.; Raes, J. Microbial interactions: From networks to models. Nature Reviews Microbiology 2012, 10(8), 538–550. [Google Scholar] [CrossRef]
- Louca, S.; Polz, M. F.; Mazel, F.; Albright, M. B. N.; Huber, J. A.; O’Connor, M. I.; Ackermann, M.; Hahn, A. S.; Srivastava, D. S.; Crowe, S. A.; Doebeli, M.; Parfrey, L. W. Function and functional redundancy in microbial systems. Nature Ecology & Evolution 2018, 2(6), 936–943. [Google Scholar] [CrossRef]
Figure 1.
Skin bacteriome relative abundance profiles by Bd status. Stacked bar plots show relative abundances at the (A) phylum, (B) family, and (C) genus levels for Bd-detectable (Bd+) and Bd-non-detectable (Bd−) salamanders. Dominant taxa were broadly similar between conditions across taxonomic ranks. At the phylum level, Proteobacteria and Actinobacteriota were most prevalent. At the family level, Vibrionaceae, Halomonadaceae, and Pseudomonadaceae dominated. At the genus level, Vibrio, Halomonas, Pseudomonas, Alishewanella, and Stenotrophomonas were most abundant. Full per-sample bar plots at the phylum and family levels are provided in Figures S1–S2.
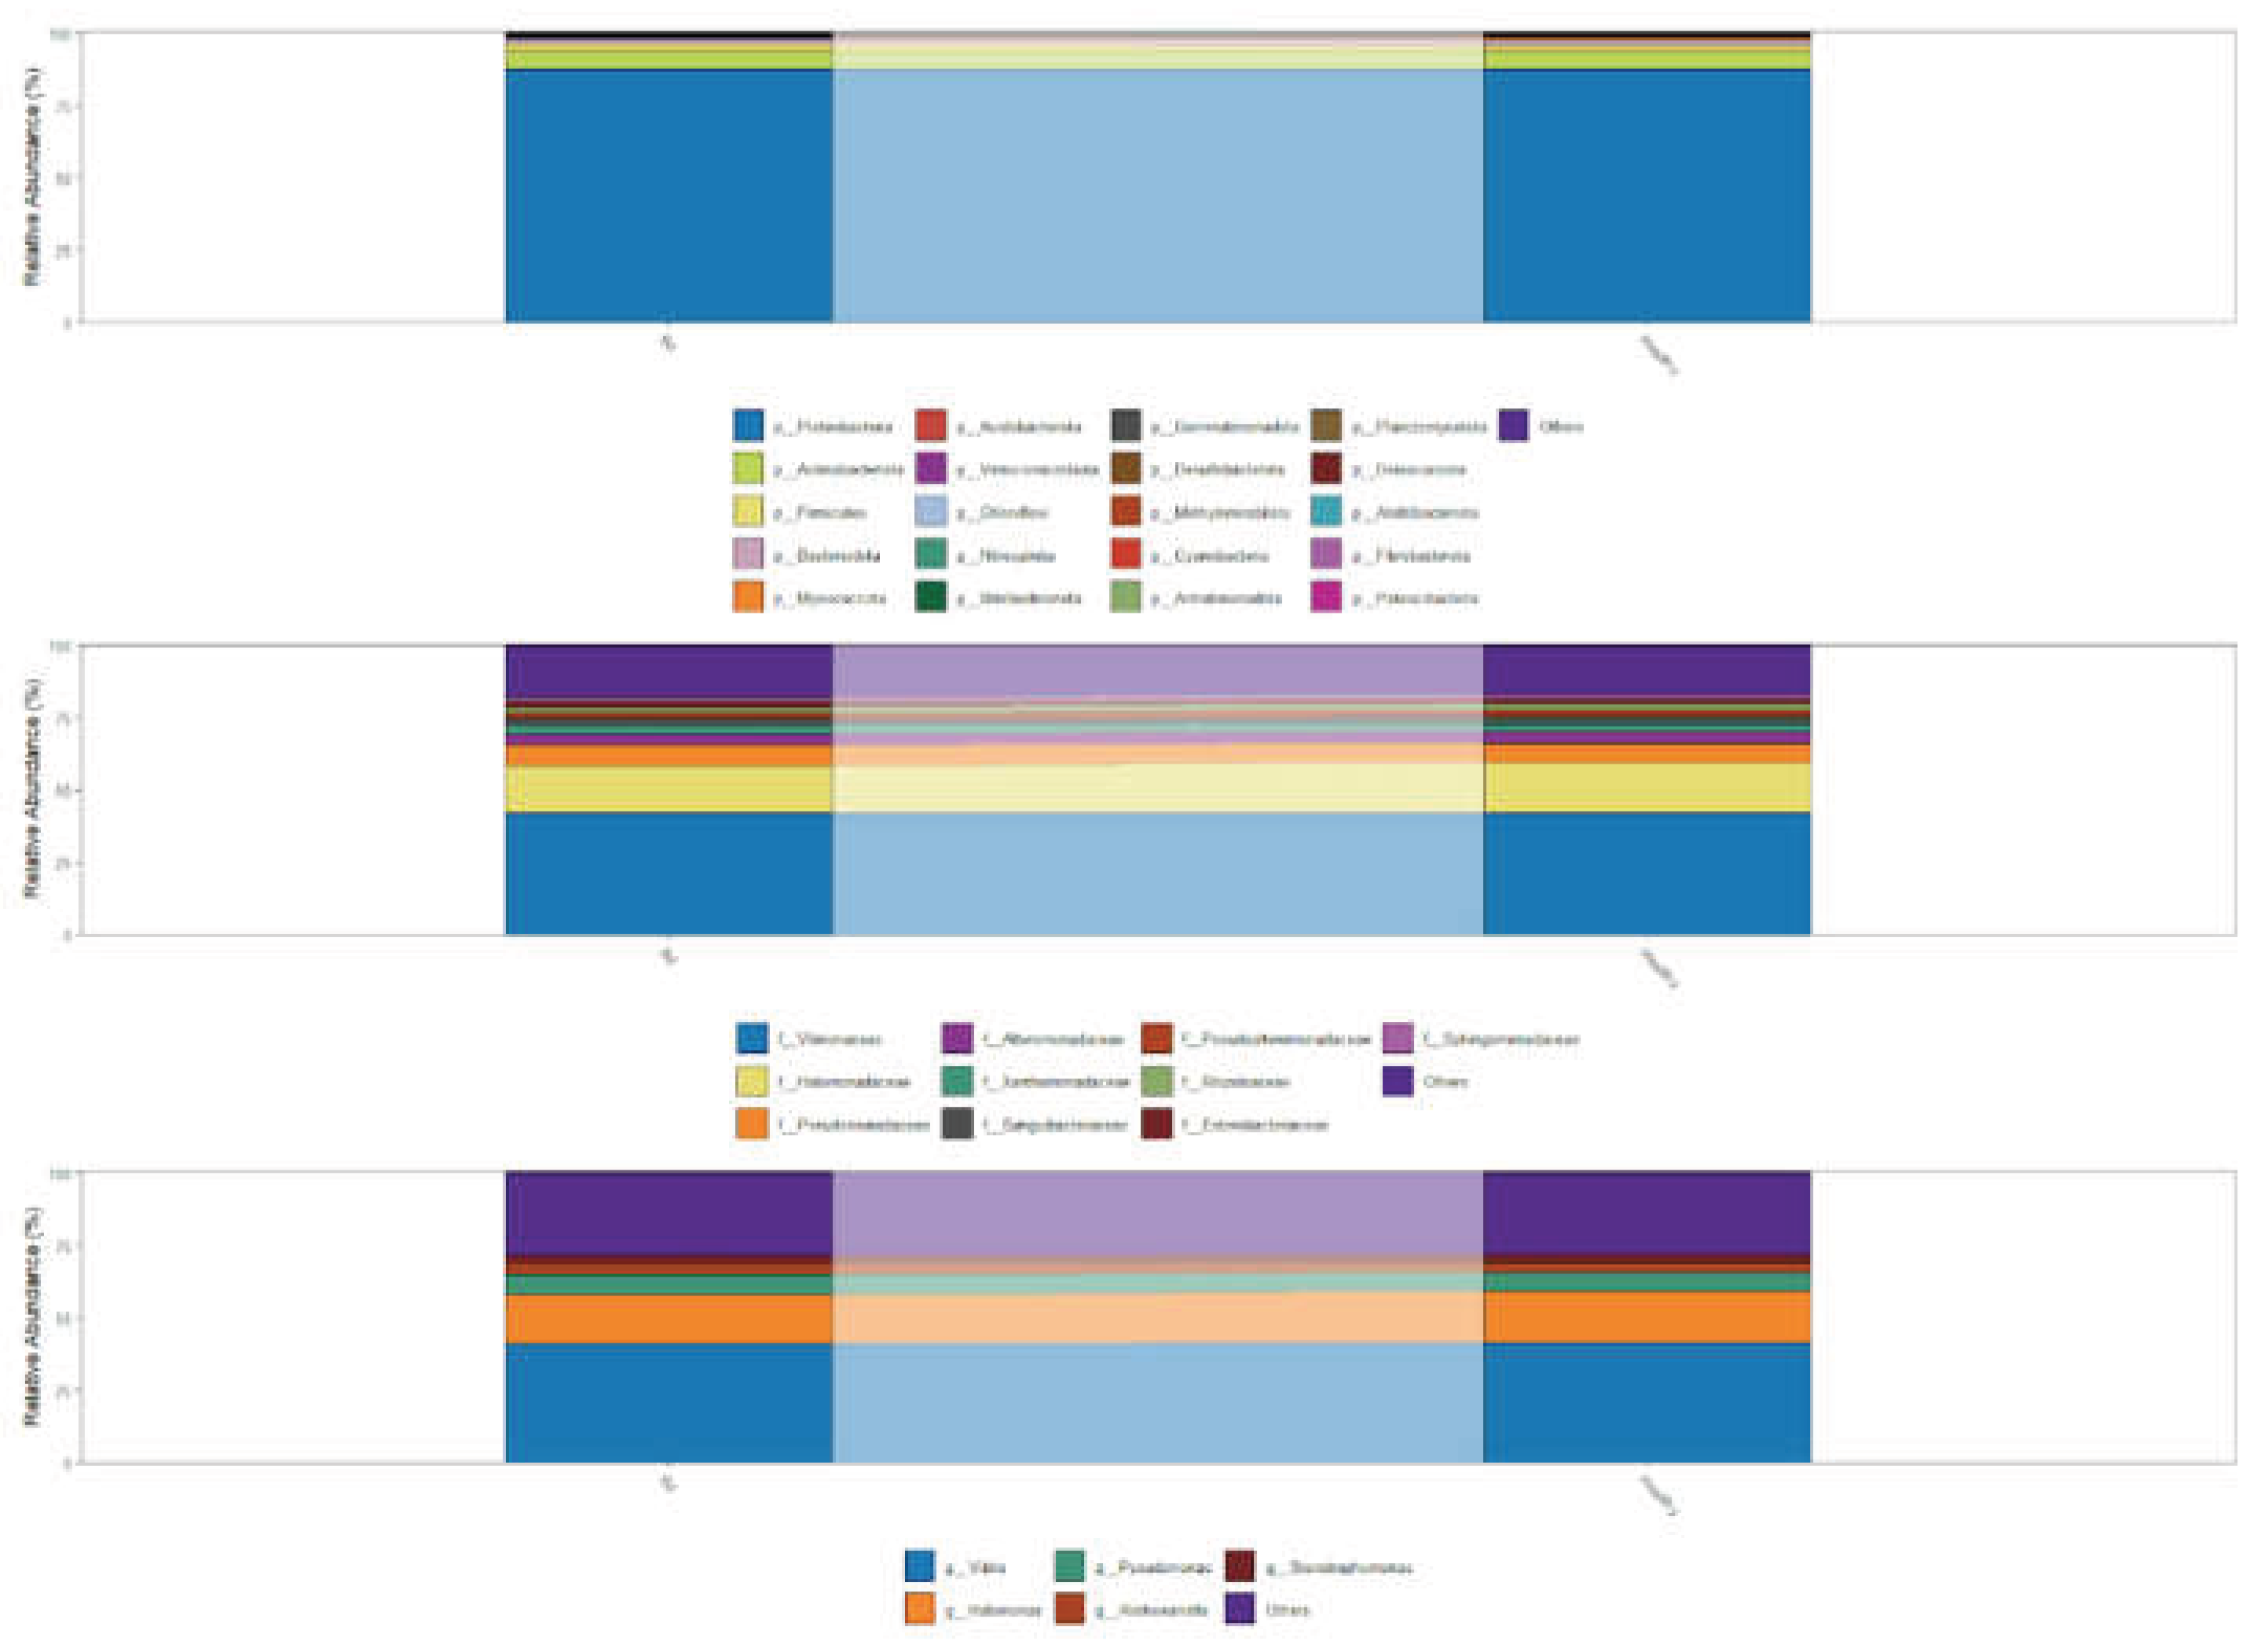
Figure 2.
Alpha diversity and community ordination by Bd detection status. Alpha diversity is shown for Bd-detectable (Bd+) and Bd-non-detectable (Bd−) salamanders using observed richness, Chao1, ACE, Shannon, Simpson, and Pielou’s evenness indices. Although summary distributions differed modestly between conditions, pairwise comparisons were not significant (Wilcoxon rank-sum test; p > 0.05 for all indices). The PCoA plot (based on Bray–Curtis dissimilarities) shows the ordination of samples by bacterial community composition; point size reflects observed richness (number of detected taxa) and point transparency reflects Shannon diversity. Bar plots summarize group-level patterns in ordination dispersion/variability, Shannon diversity, and observed richness for Bd+ and Bd− conditions.
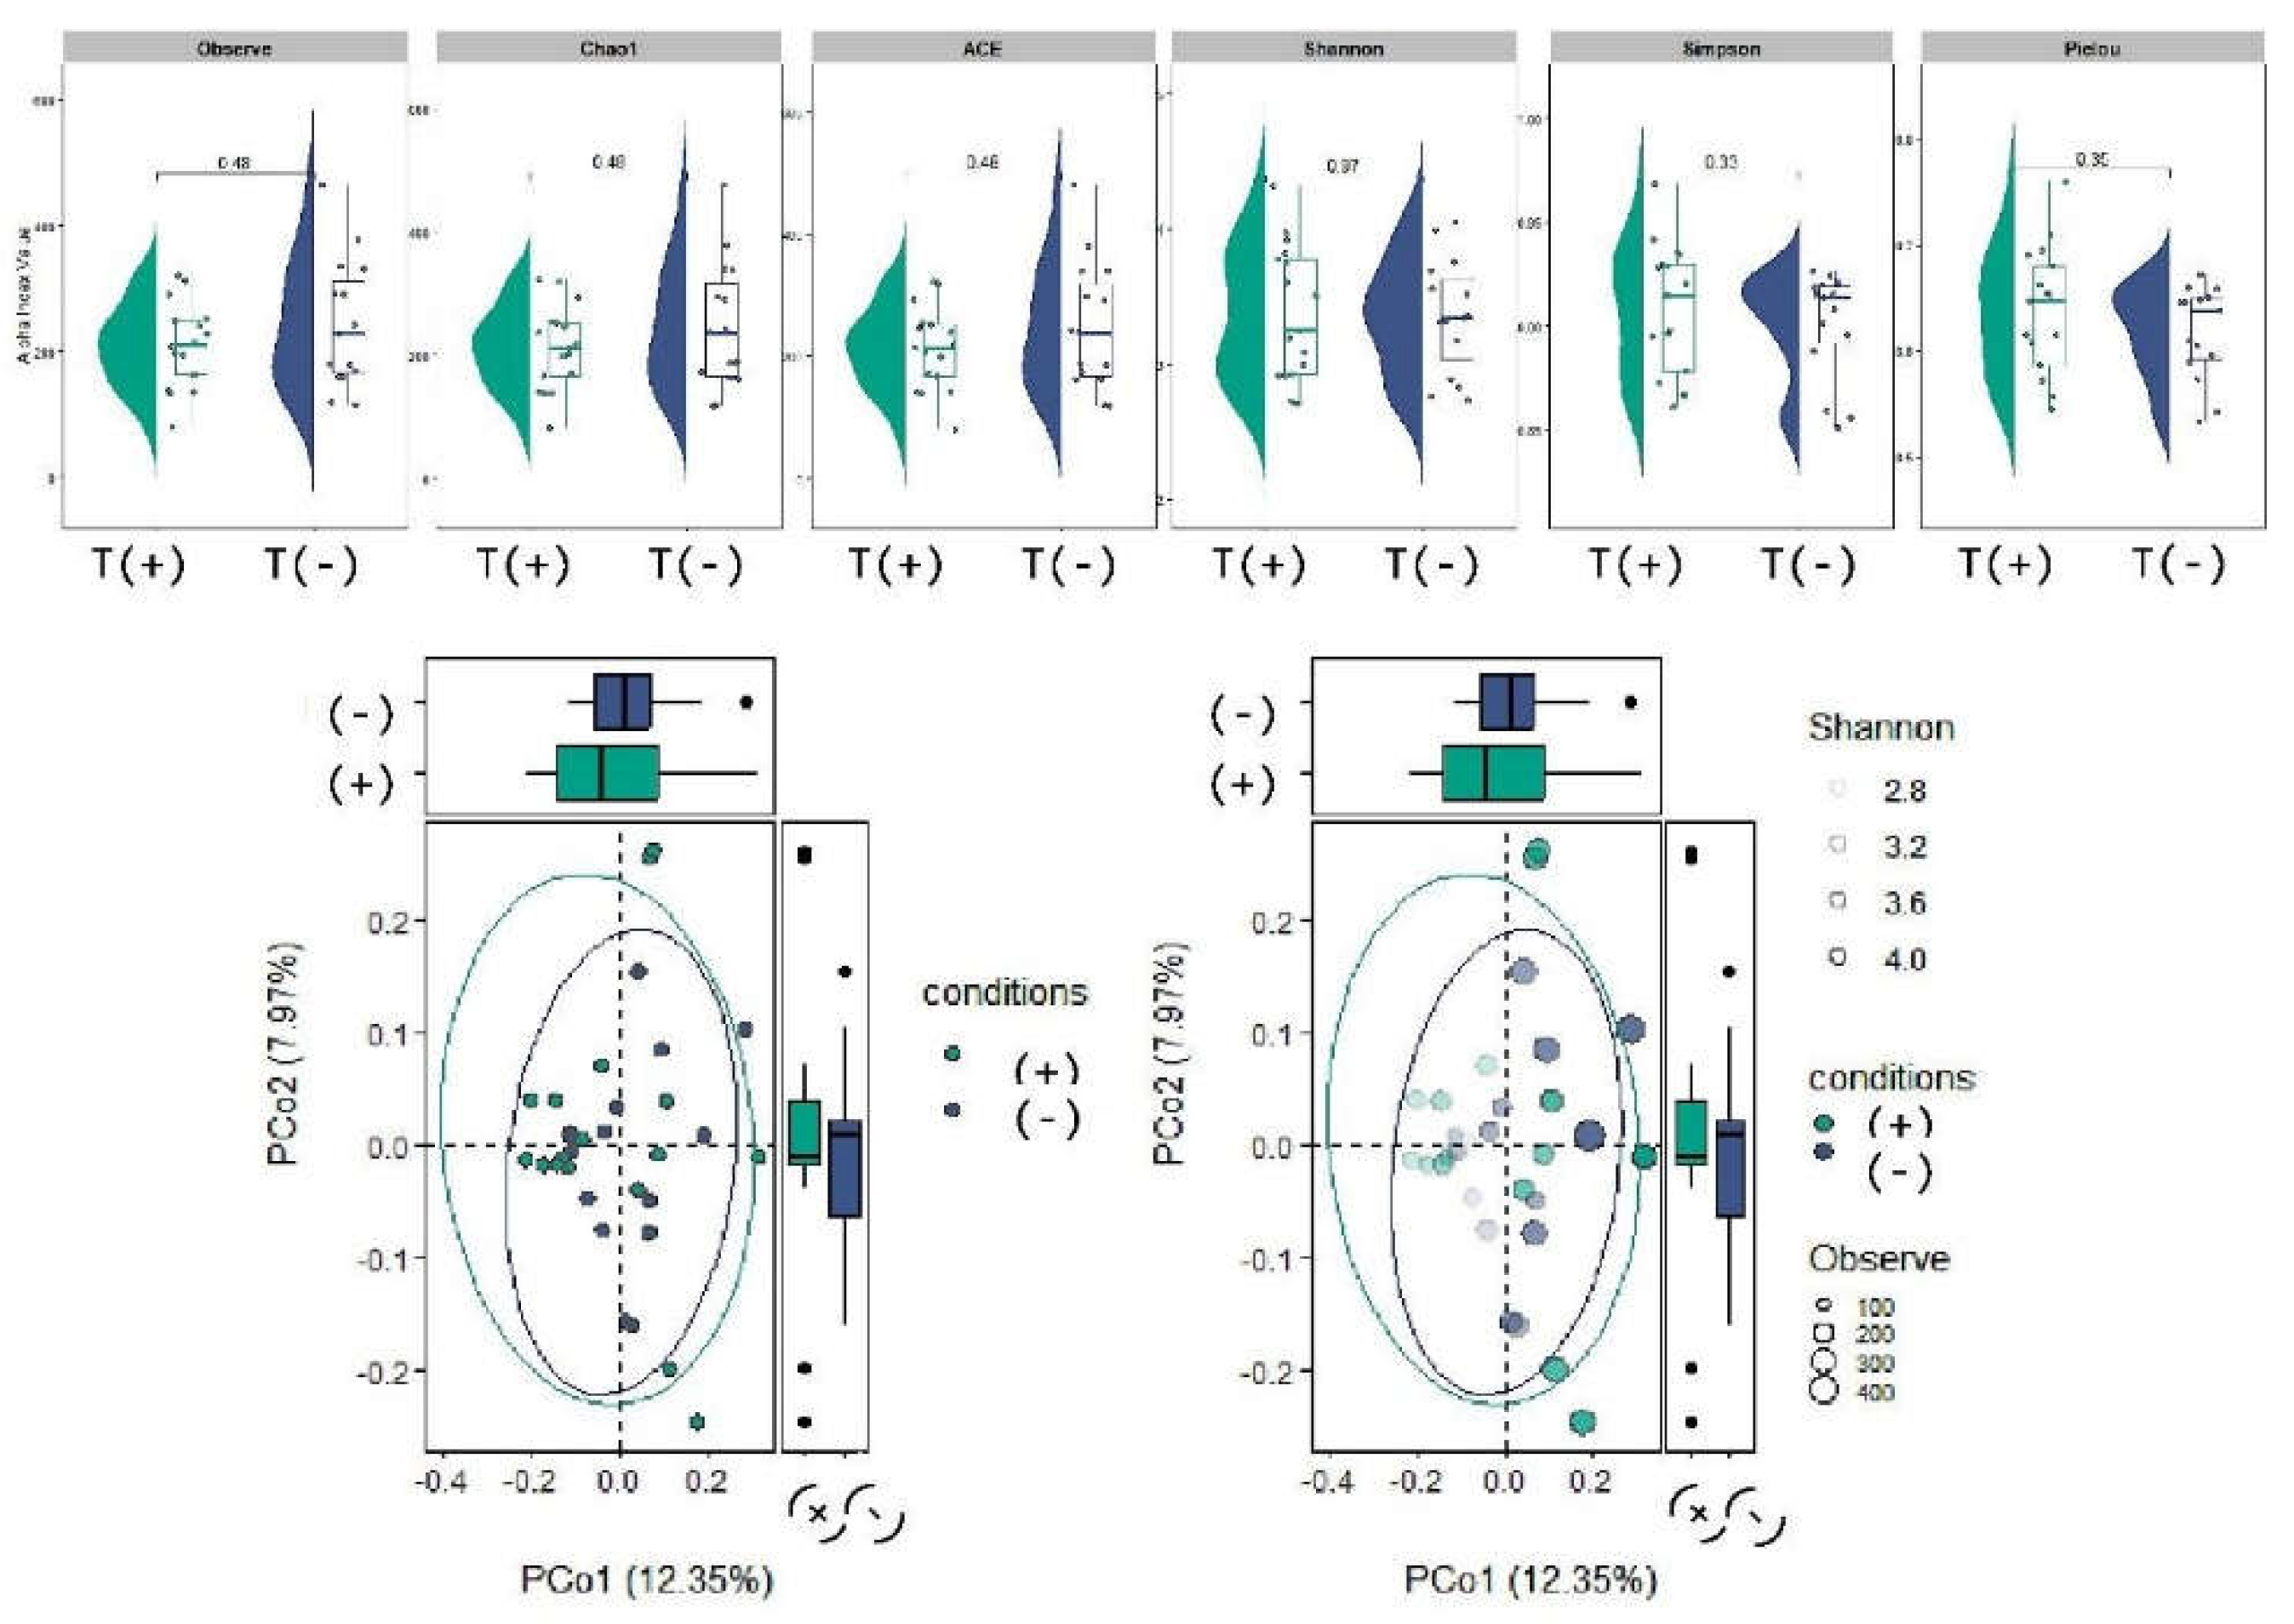
Figure 3.
LEfSe biomarker discovery by Bd detection status. The bar plot shows Linear Discriminant Analysis (LDA) scores for taxa identified by LEfSe as differentially abundant between Bd-detectable (Bd+) and Bd-non-detectable (Bd−) salamanders. Taxa enriched in Bd+ samples are shown in orange, whereas taxa enriched in Bd− (healthy) samples are shown in blue. The accompanying LEfSe cladogram summarizes the same discriminative features across the taxonomic hierarchy, with branches colored by the condition in which each clade is enriched (Bd+: purple; Bd−/healthy: beige). Taxonomic ranks (family or genus) reflect the finest resolution supported by the reference database and taxonomic assignment.
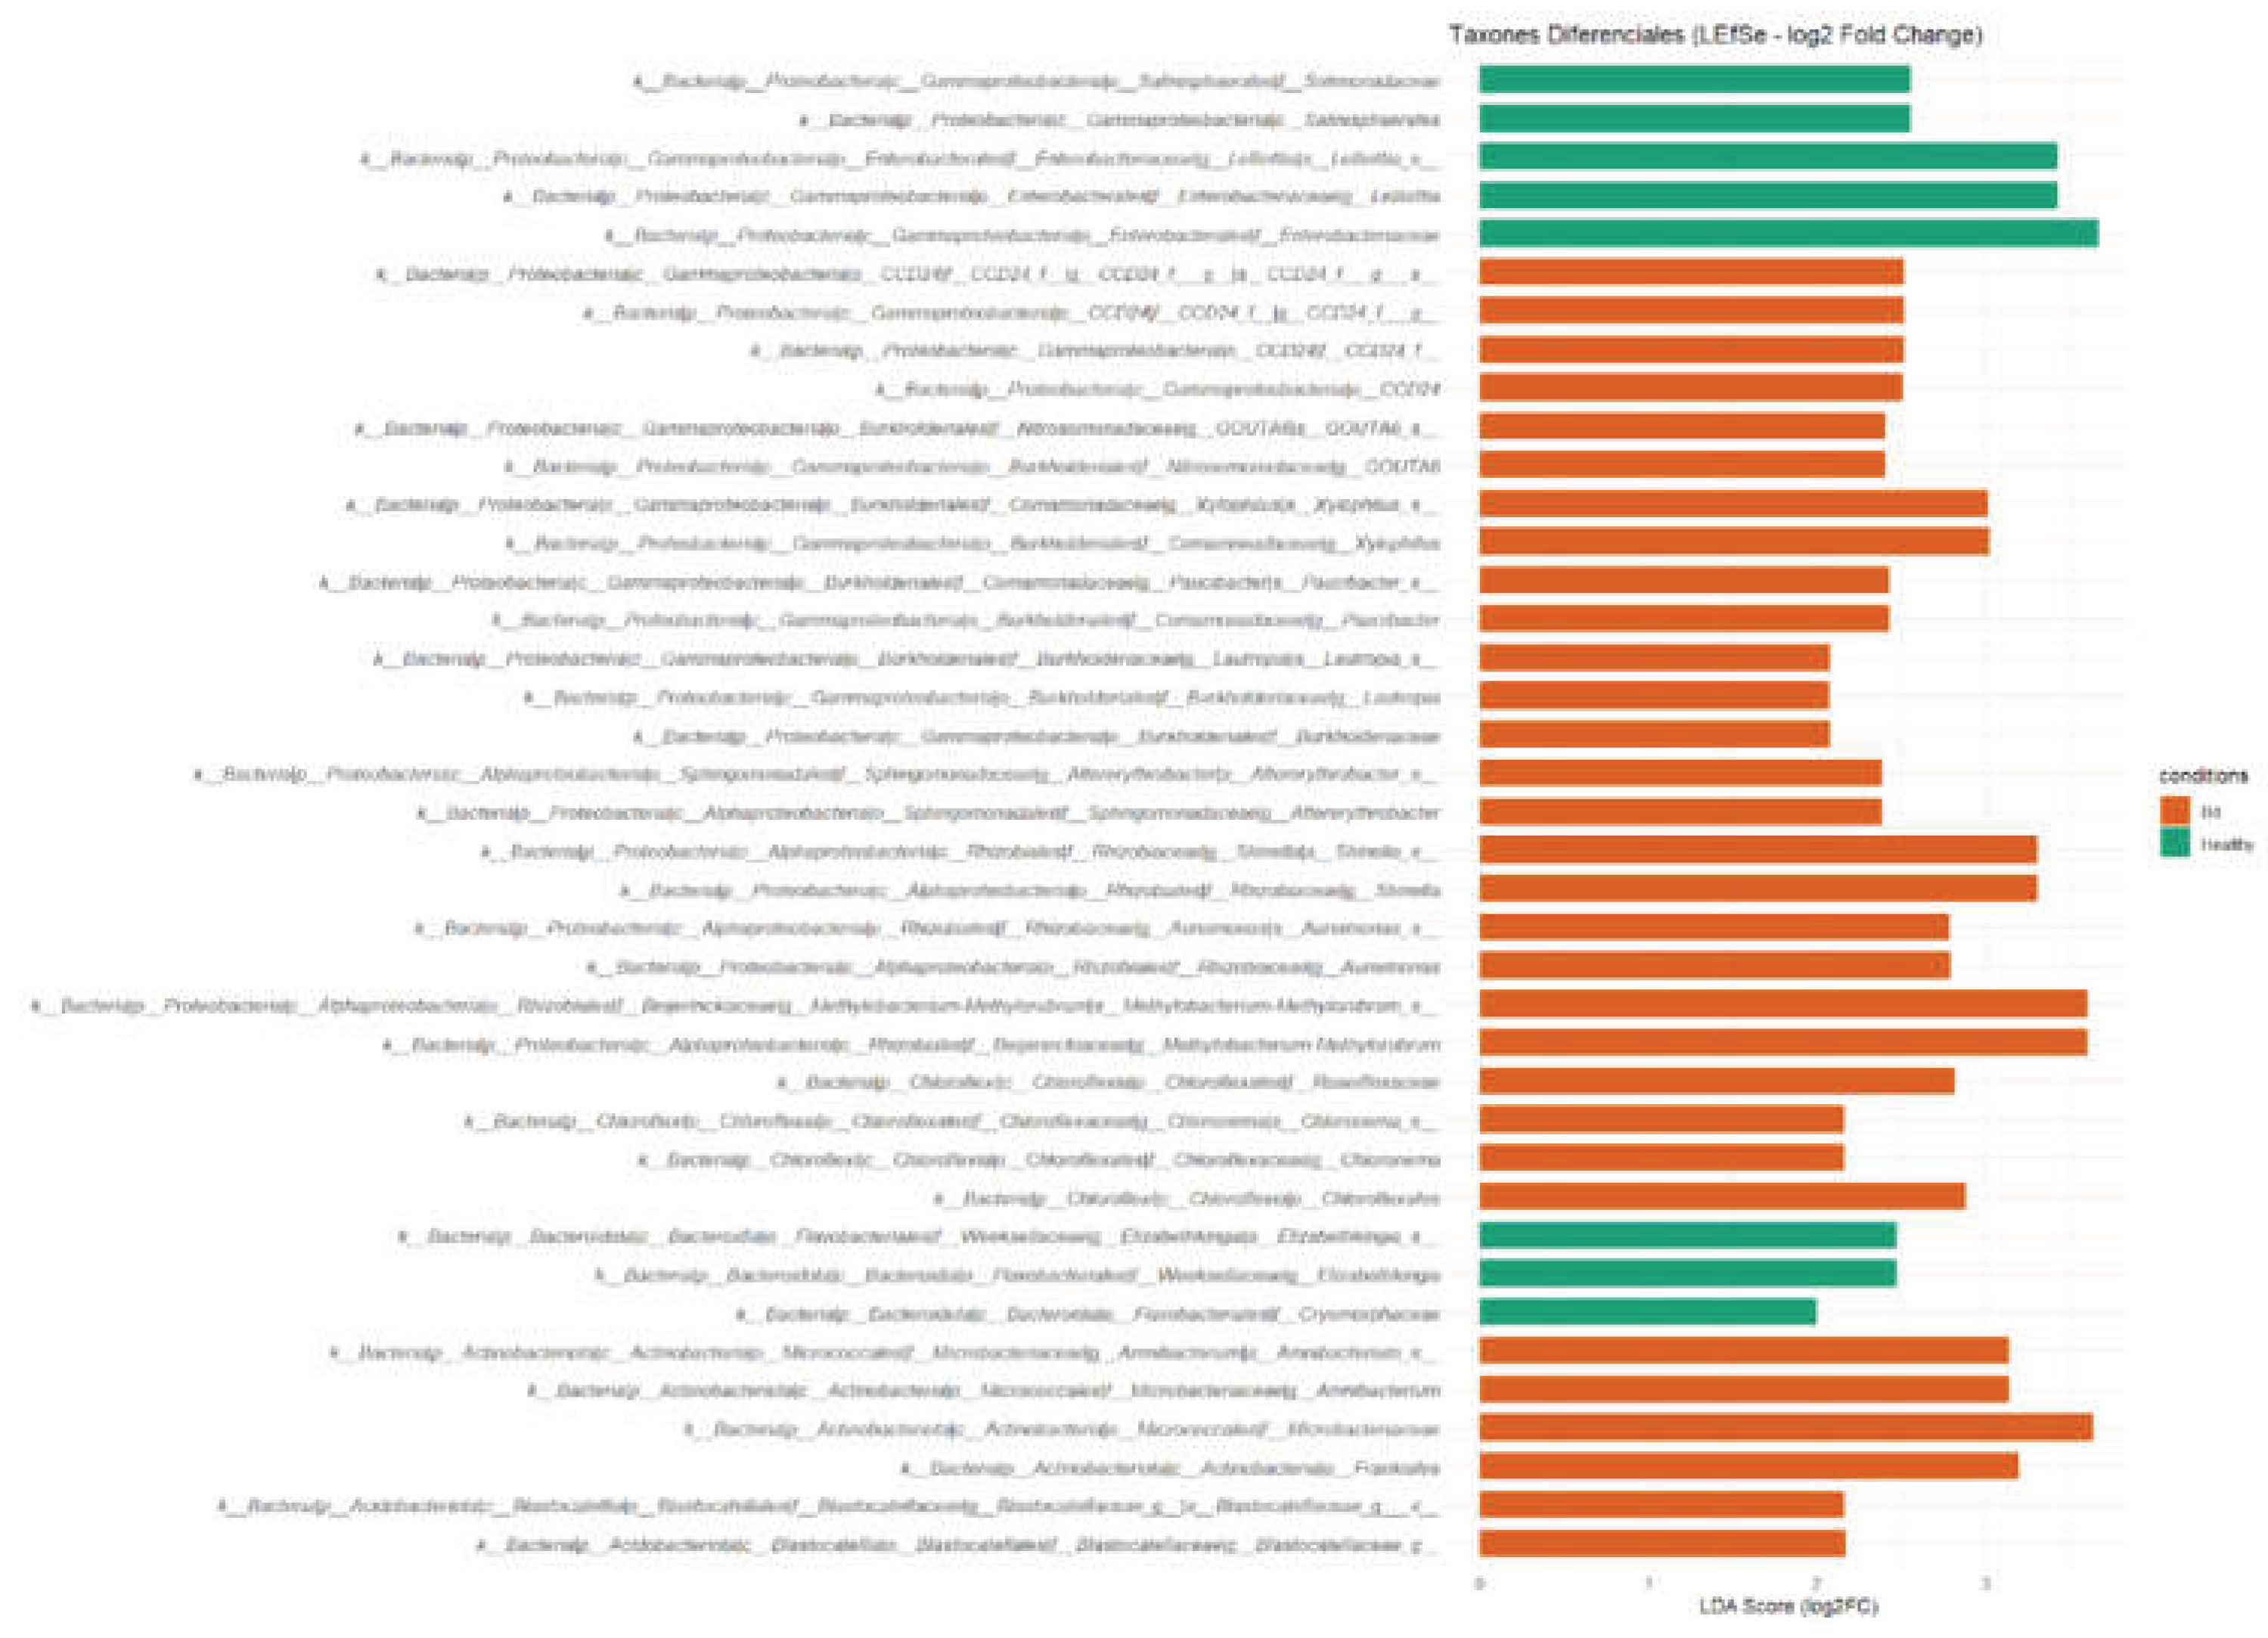
Figure 4.
Differential abundance results from ANCOM-BC. ANCOM-BC results are summarized as relative abundance profiles for taxa identified as differentially abundant between Bd-detectable (Bd+) and Bd-non-detectable (Bd−) salamanders. (B) Family-level relative abundances, with Bd− samples shown in grey and Bd+ samples shown in blue. (C) Genus-level relative abundances, using the same color scheme (Bd−: grey; Bd+: blue).
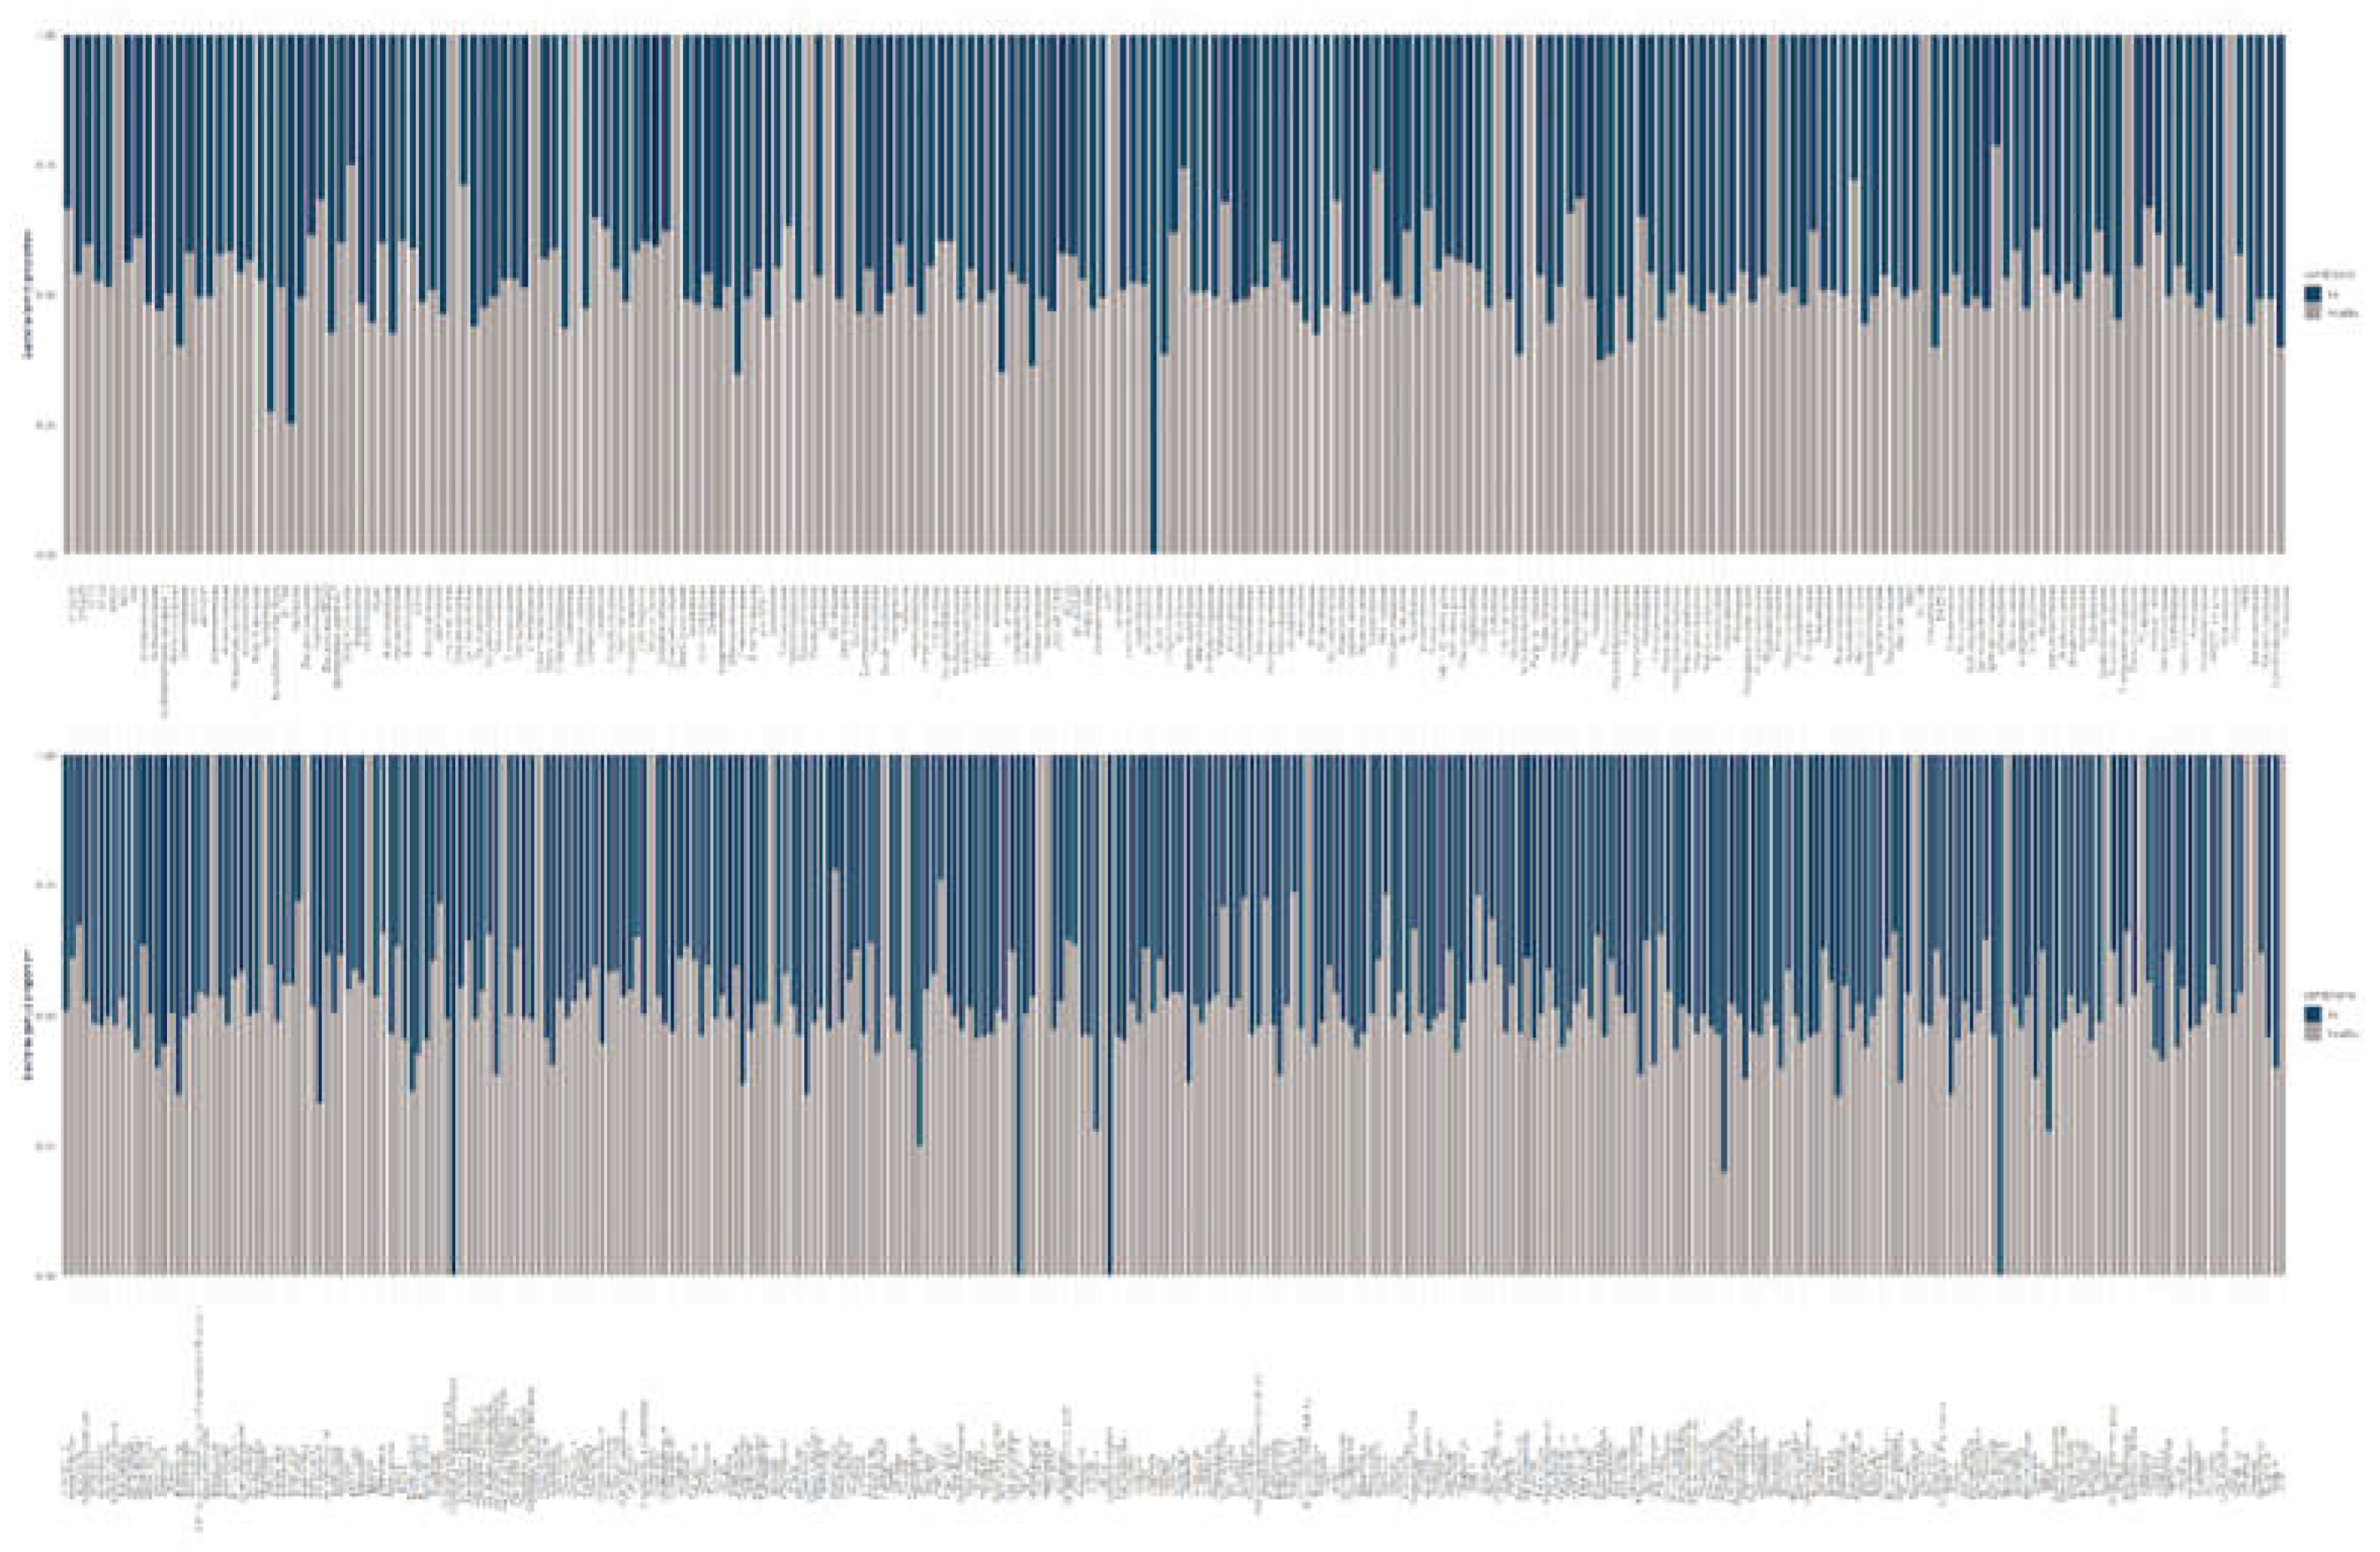
Figure 5.
Shared and condition-specific bacterial genera across salamander species. Venn diagrams summarize genus-level bacterial composition by Bd detection status for each salamander species. Groups are labeled using species prefixes (E_ = Eurycea, N_ = Notophthalmus, D_ = Desmognathus) combined with condition suffixes (_Bd− = Bd-non-detectable; _Bd+ = Bd-detectable). Blue circles indicate taxa detected in Bd− samples, and red circles indicate taxa detected in Bd+ samples. Numbers within each region represent the number of genera unique to a given group or shared between groups; intersection values denote genera detected in both conditions for the corresponding species.
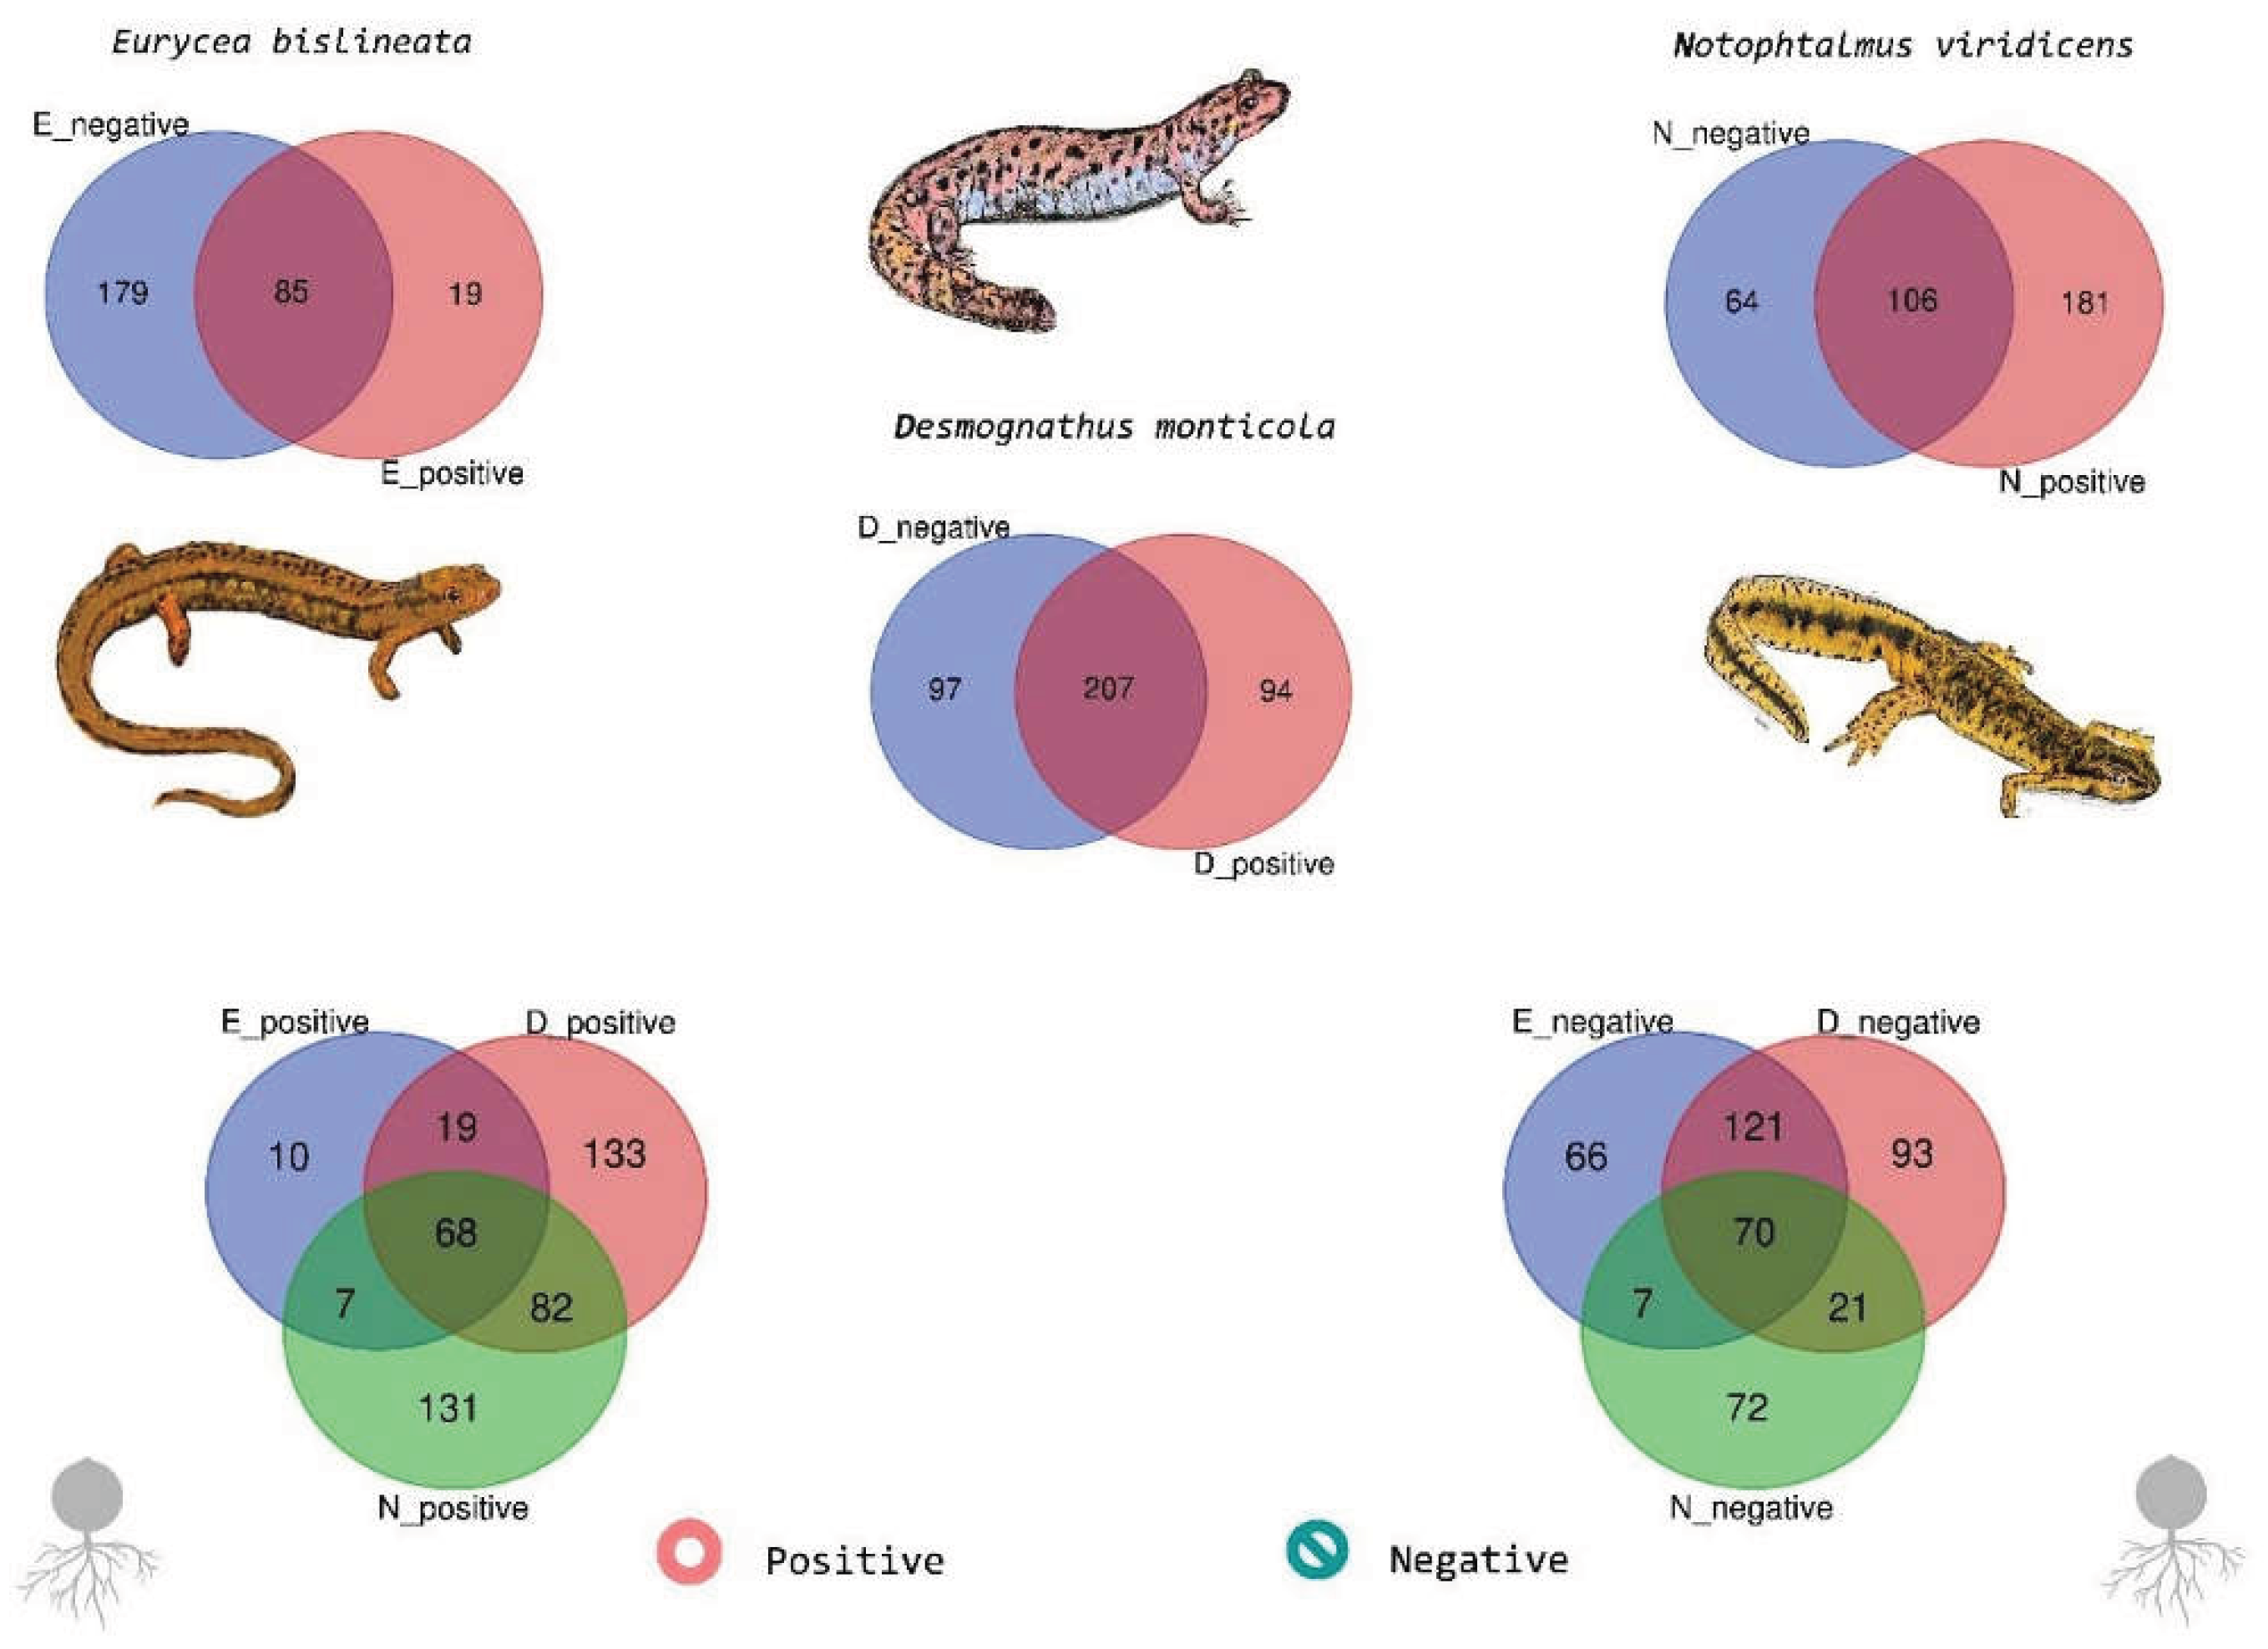
Figure 6.
Genus-level association networks and modularity by species and Bd detection status. Networks are shown for Eurycea bislineata (E), Desmognathus monticola (D), and Notophthalmus viridescens (N) under Bd-non-detectable (Bd−; top row) and Bd-detectable (Bd+; bottom row) conditions. The table at left reports the modularity value computed for each network. Edges represent significant Spearman rank associations between genera retained after network filtering. Node size is proportional to degree (number of connections; approximately 20–55 in the displayed networks). Edge colors are assigned for visualization purposes only. Nodes with at least one retained connection (degree ≥ 1) are displayed.
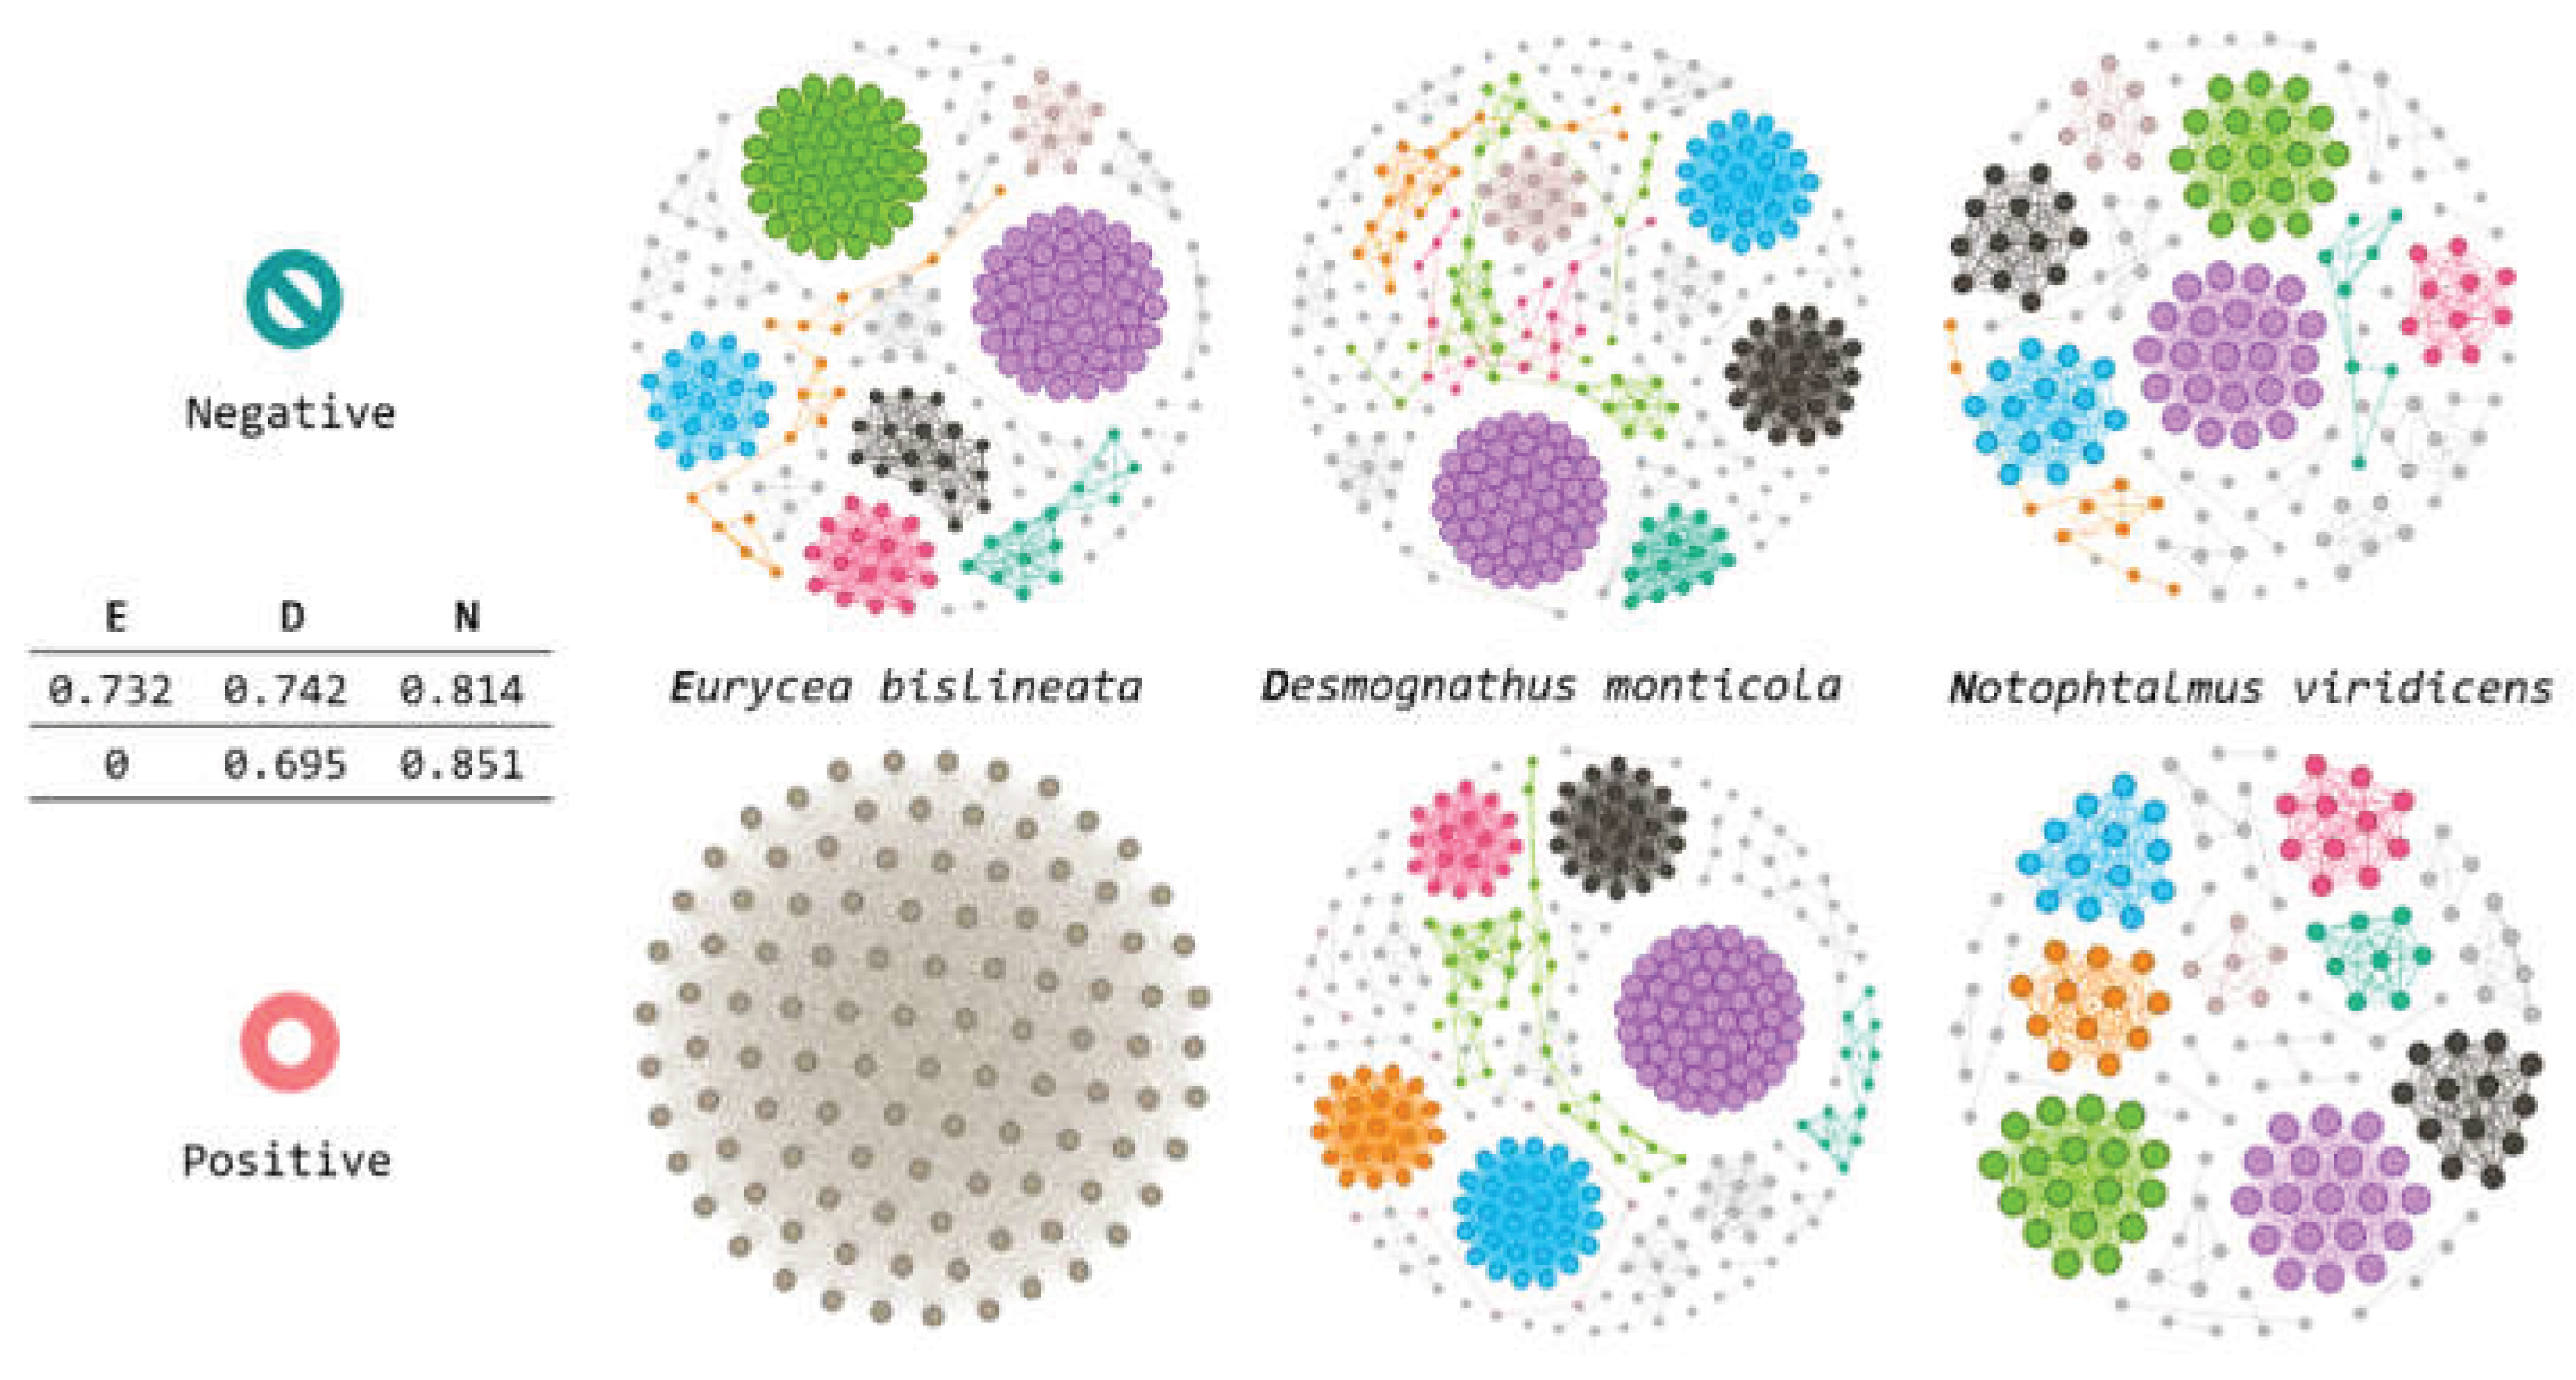
Figure 7.
Comparison of first-module membership across species and Bd conditions. Venn diagrams summarize overlap in genus membership for the first detected module (pink module; see Figure 8) across all inferred networks, comparing Bd-detectable (Bd+) and Bd-non-detectable (Bd−) conditions within the three salamander species. Labels indicate species and condition using prefixes E_ (Eurycea), D_ (Desmognathus), and N_ (Notophthalmus), followed by the condition suffix (Bd+ or Bd−). Numbers denote the count of genera unique to each group or shared across groups. Overlap among groups was minimal, with most shared intersections equal to zero.
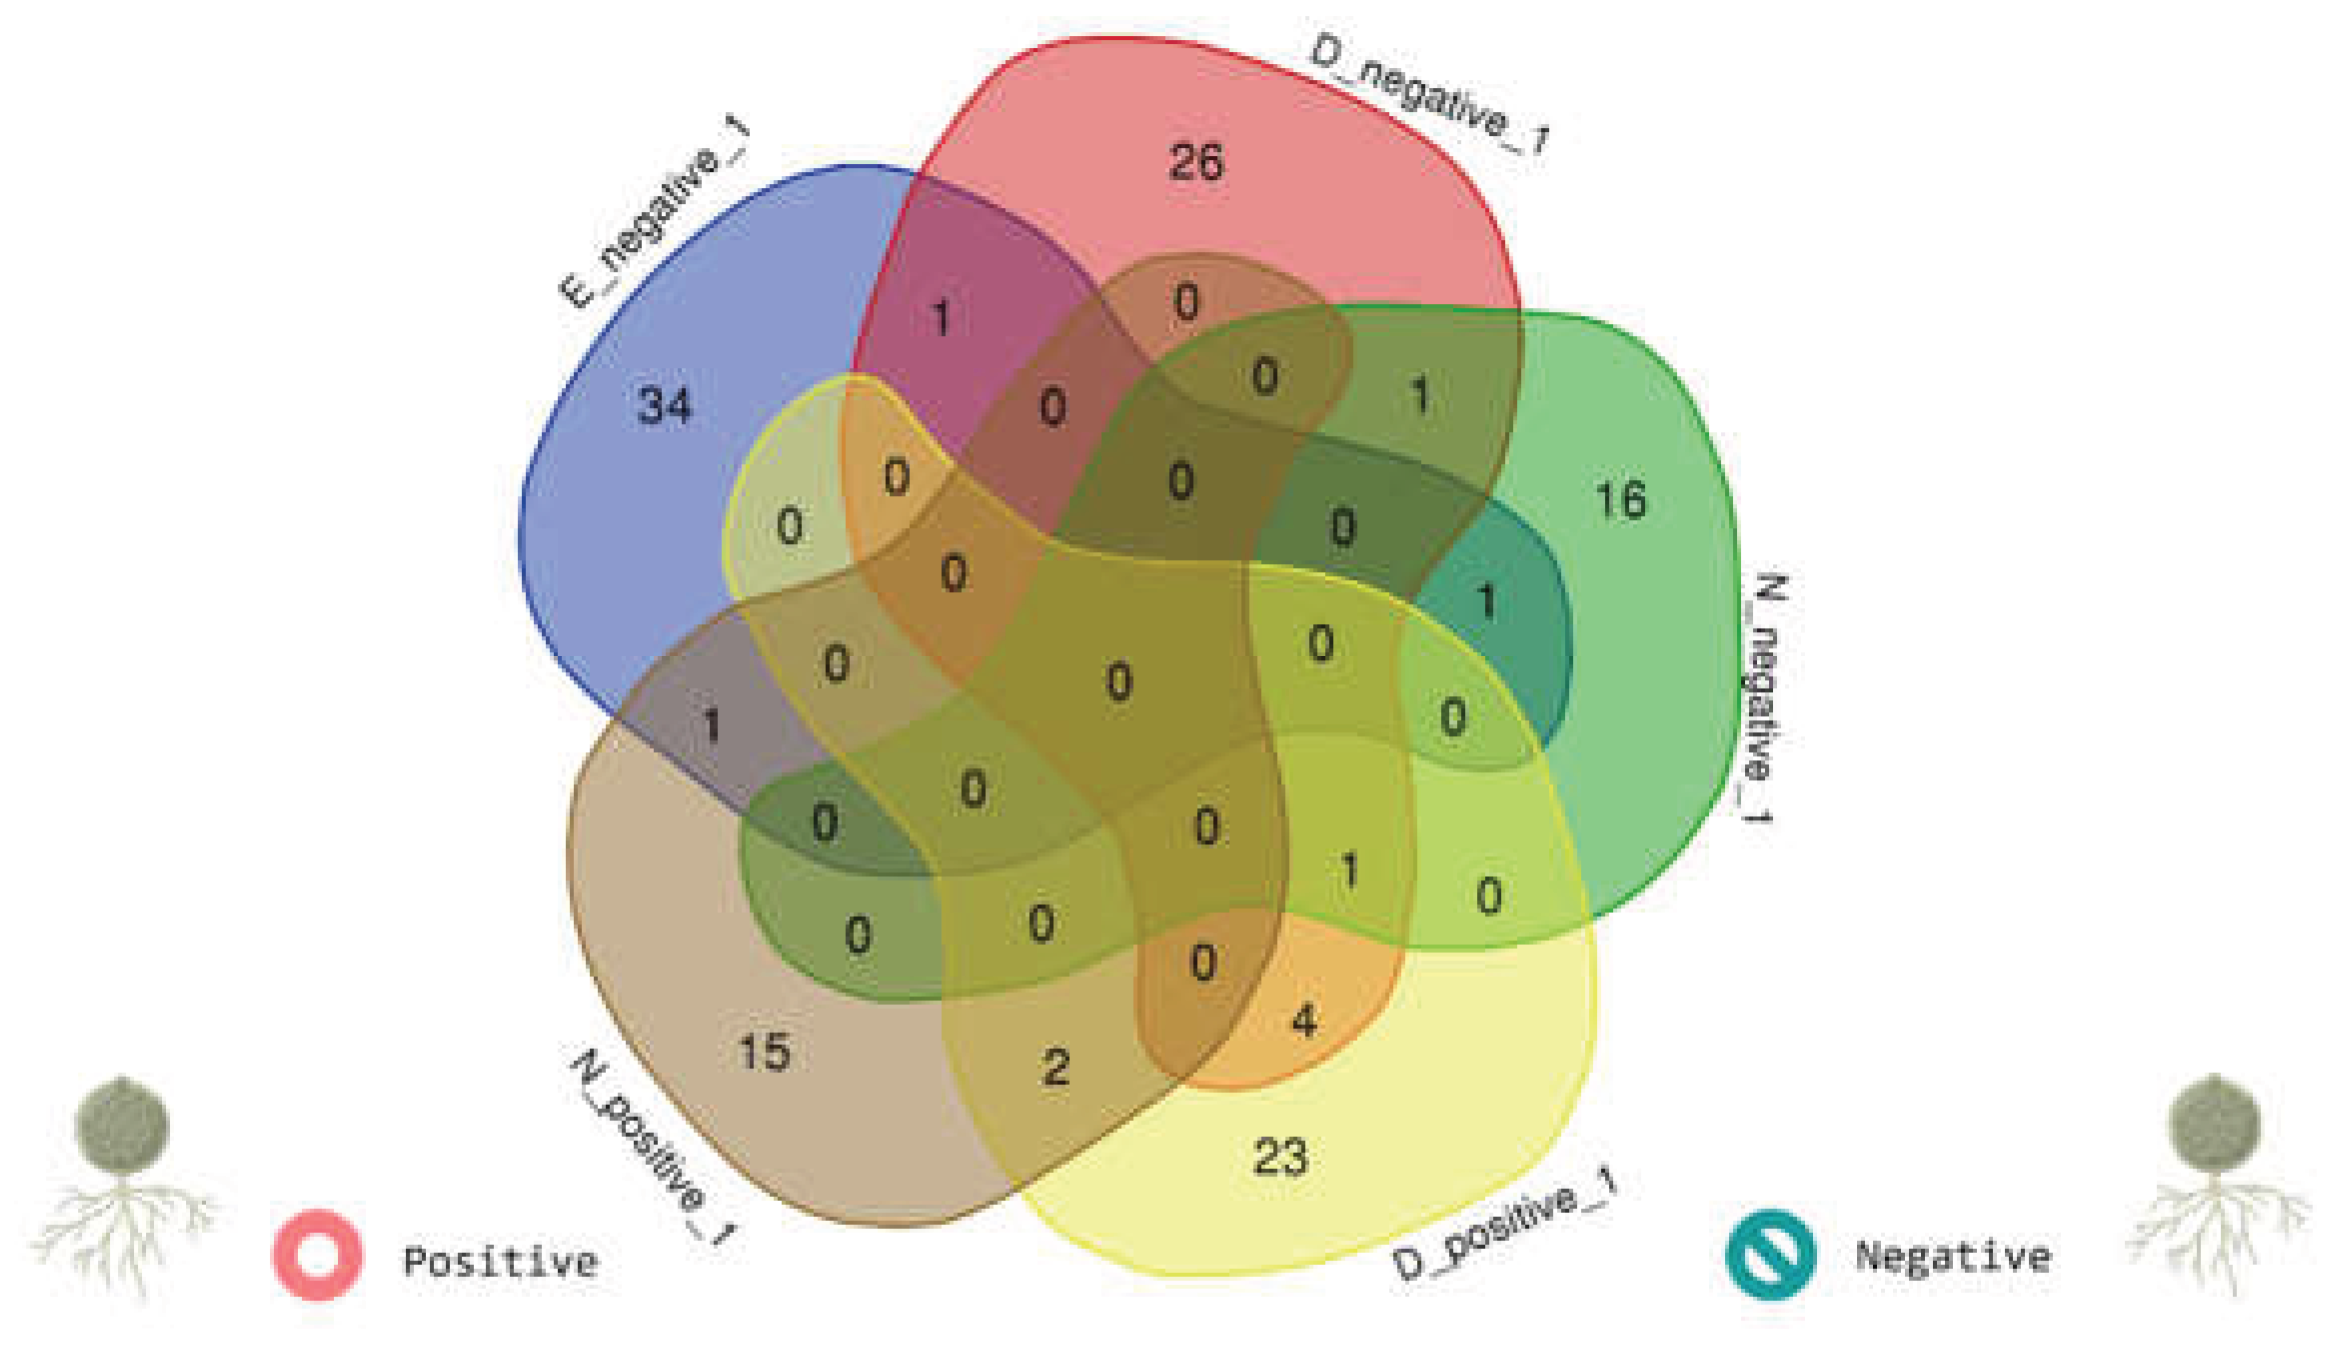
Figure 8.
Core association networks by Bd detection status and comparison of core composition. Core genus-level networks were inferred separately for Bd-non-detectable (Bd−) and Bd-detectable (Bd+) salamanders after pooling samples across host species. Nodes represent bacterial genera, and node size is proportional to degree (number of retained connections; approximately 20–55 in the displayed networks). Edges represent high-strength associations estimated using Spearman rank correlations and retained under a stringent filtering criterion to define the “core” network (i.e., only the strongest edges were kept). The resulting networks highlight condition-dependent differences in core network density and taxonomic membership.
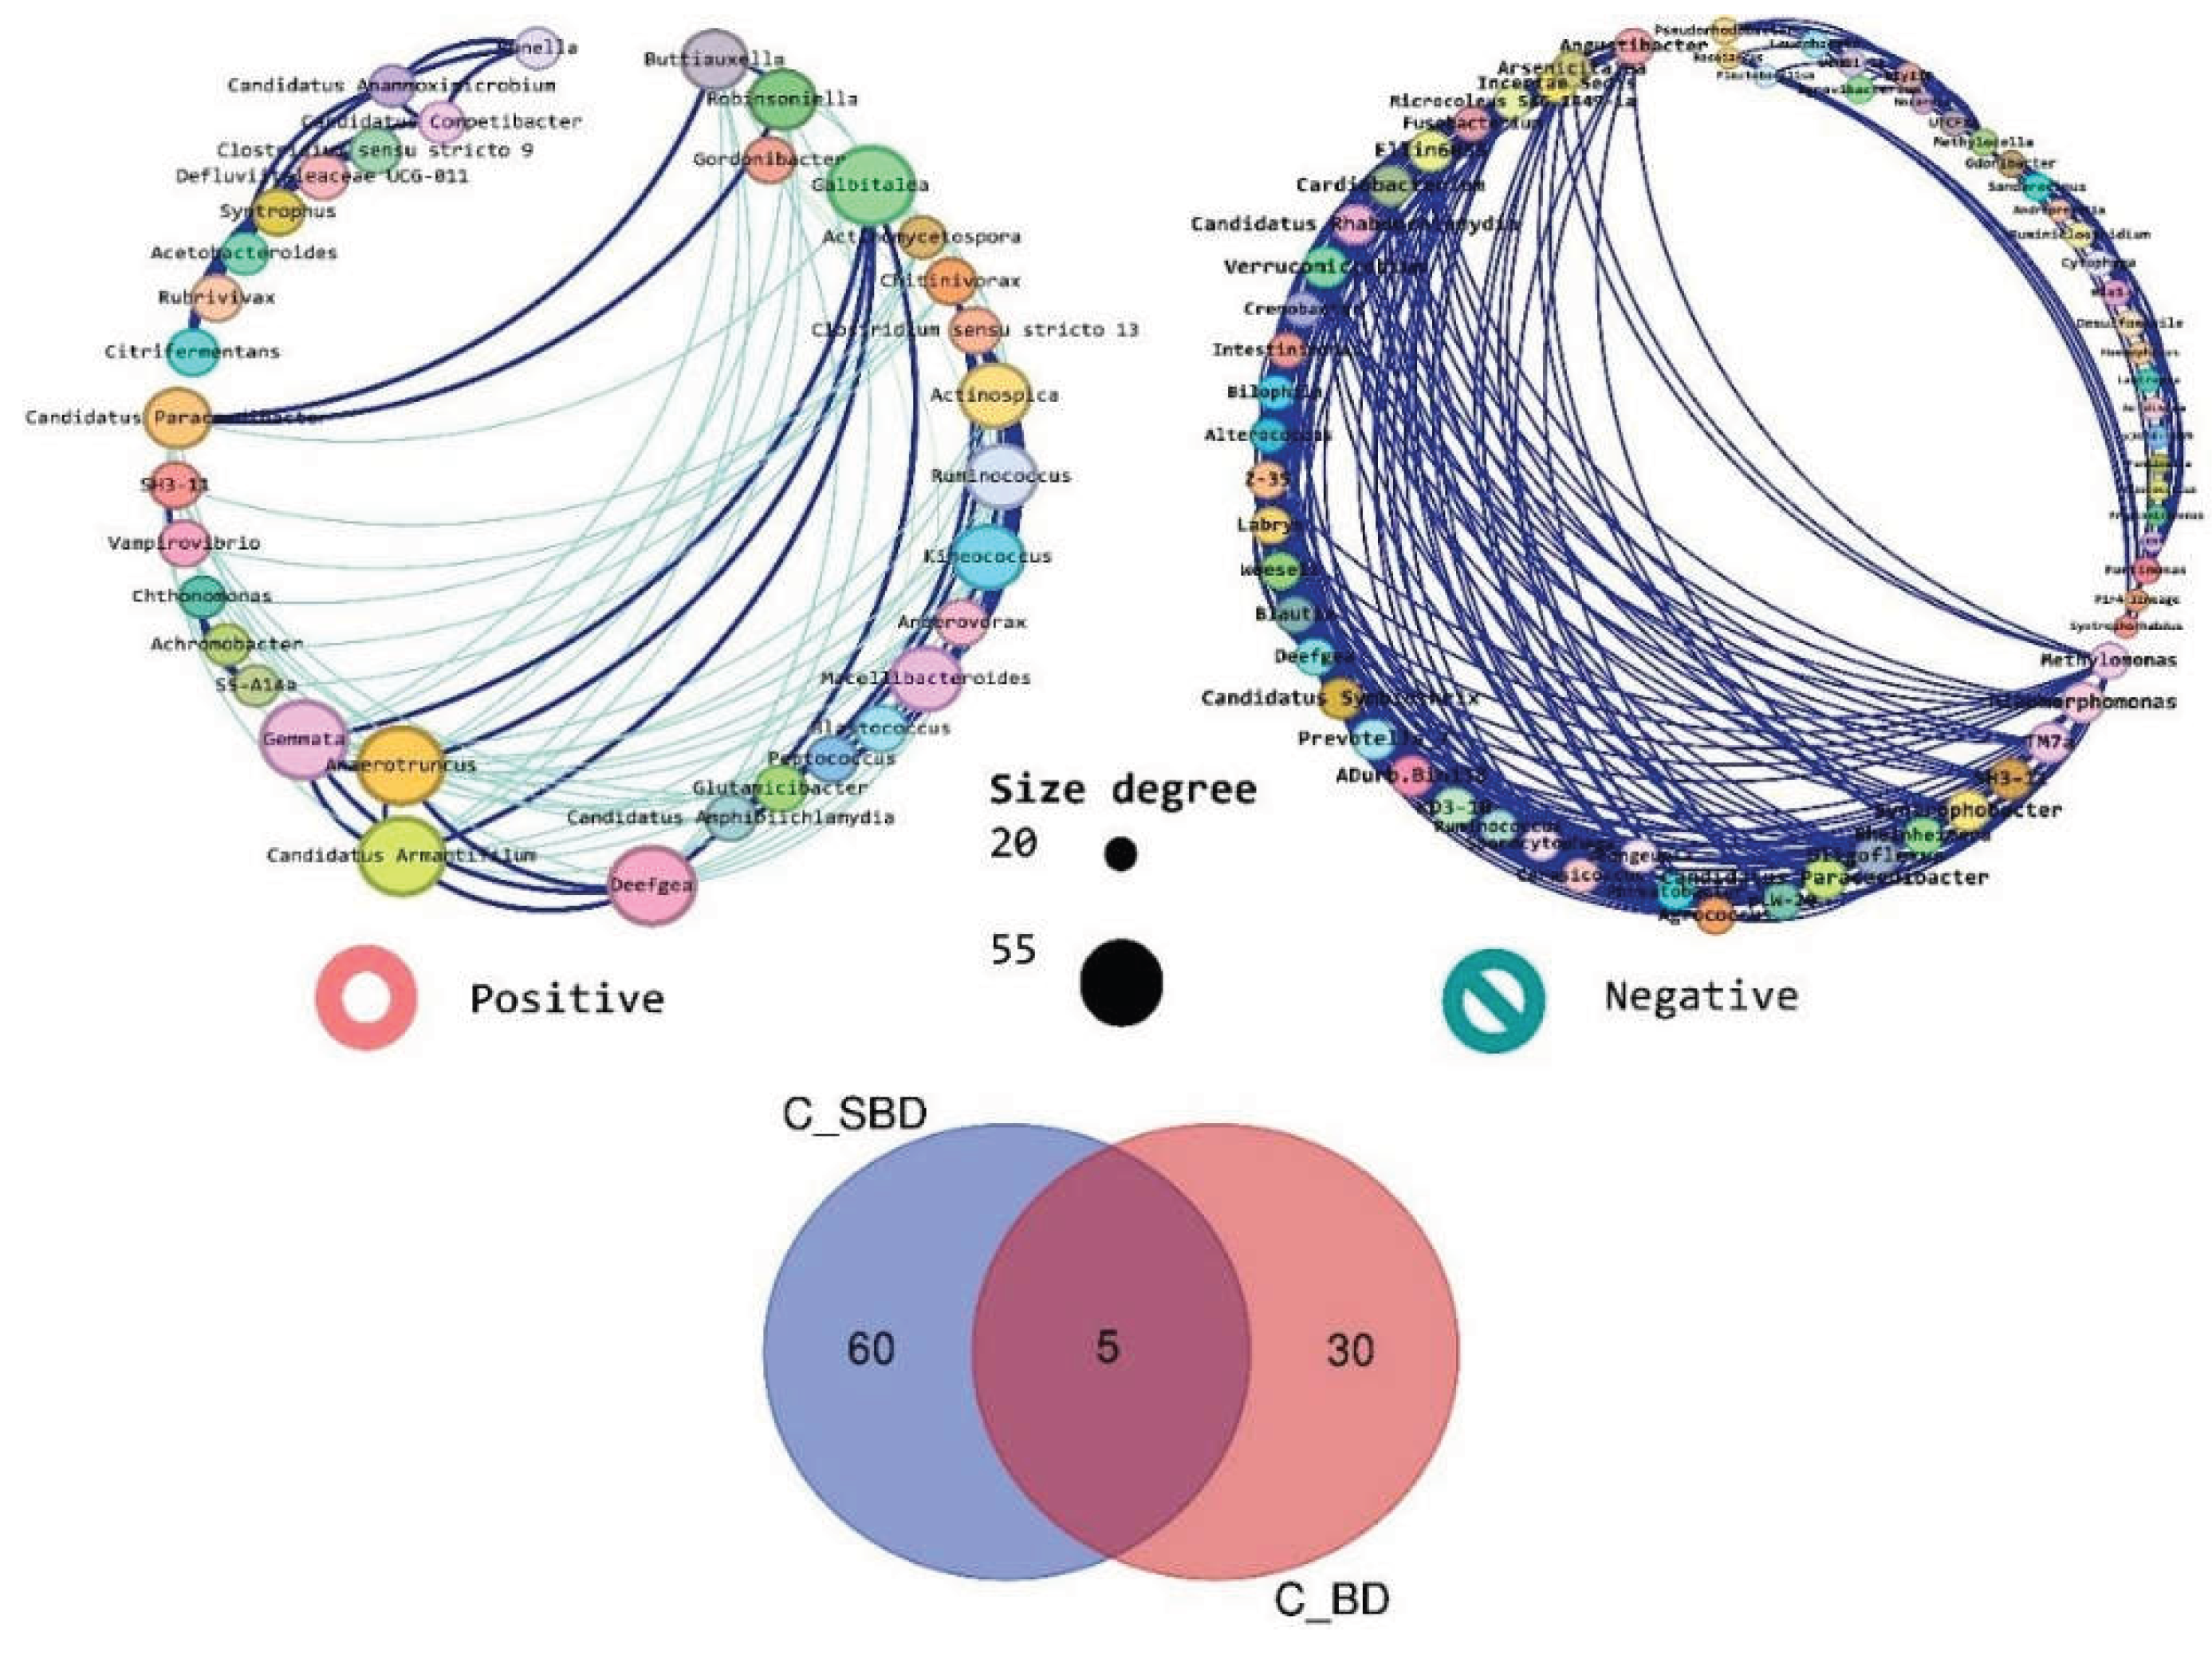
Figure 9.
Comparison of network centrality metrics between tolerant and susceptible salamanders. Centrality measures were calculated for the genus-level association networks and compared between a Bd-tolerant host (Desmognathus monticola) and a Bd-susceptible host (Notophthalmus viridescens), stratified by Bd detection status. Pairwise comparisons are shown for Bd-detectable (Bd+) networks (Desmognathus Bd+ vs Notophthalmus Bd+; pink vs grey) and for Bd-non-detectable (Bd−) networks (Desmognathus Bd− vs Notophthalmus Bd−; yellow vs grey). Asterisks denote statistically significant differences. Centrality metrics were compared using one-way ANOVA followed by Tukey’s post hoc test.
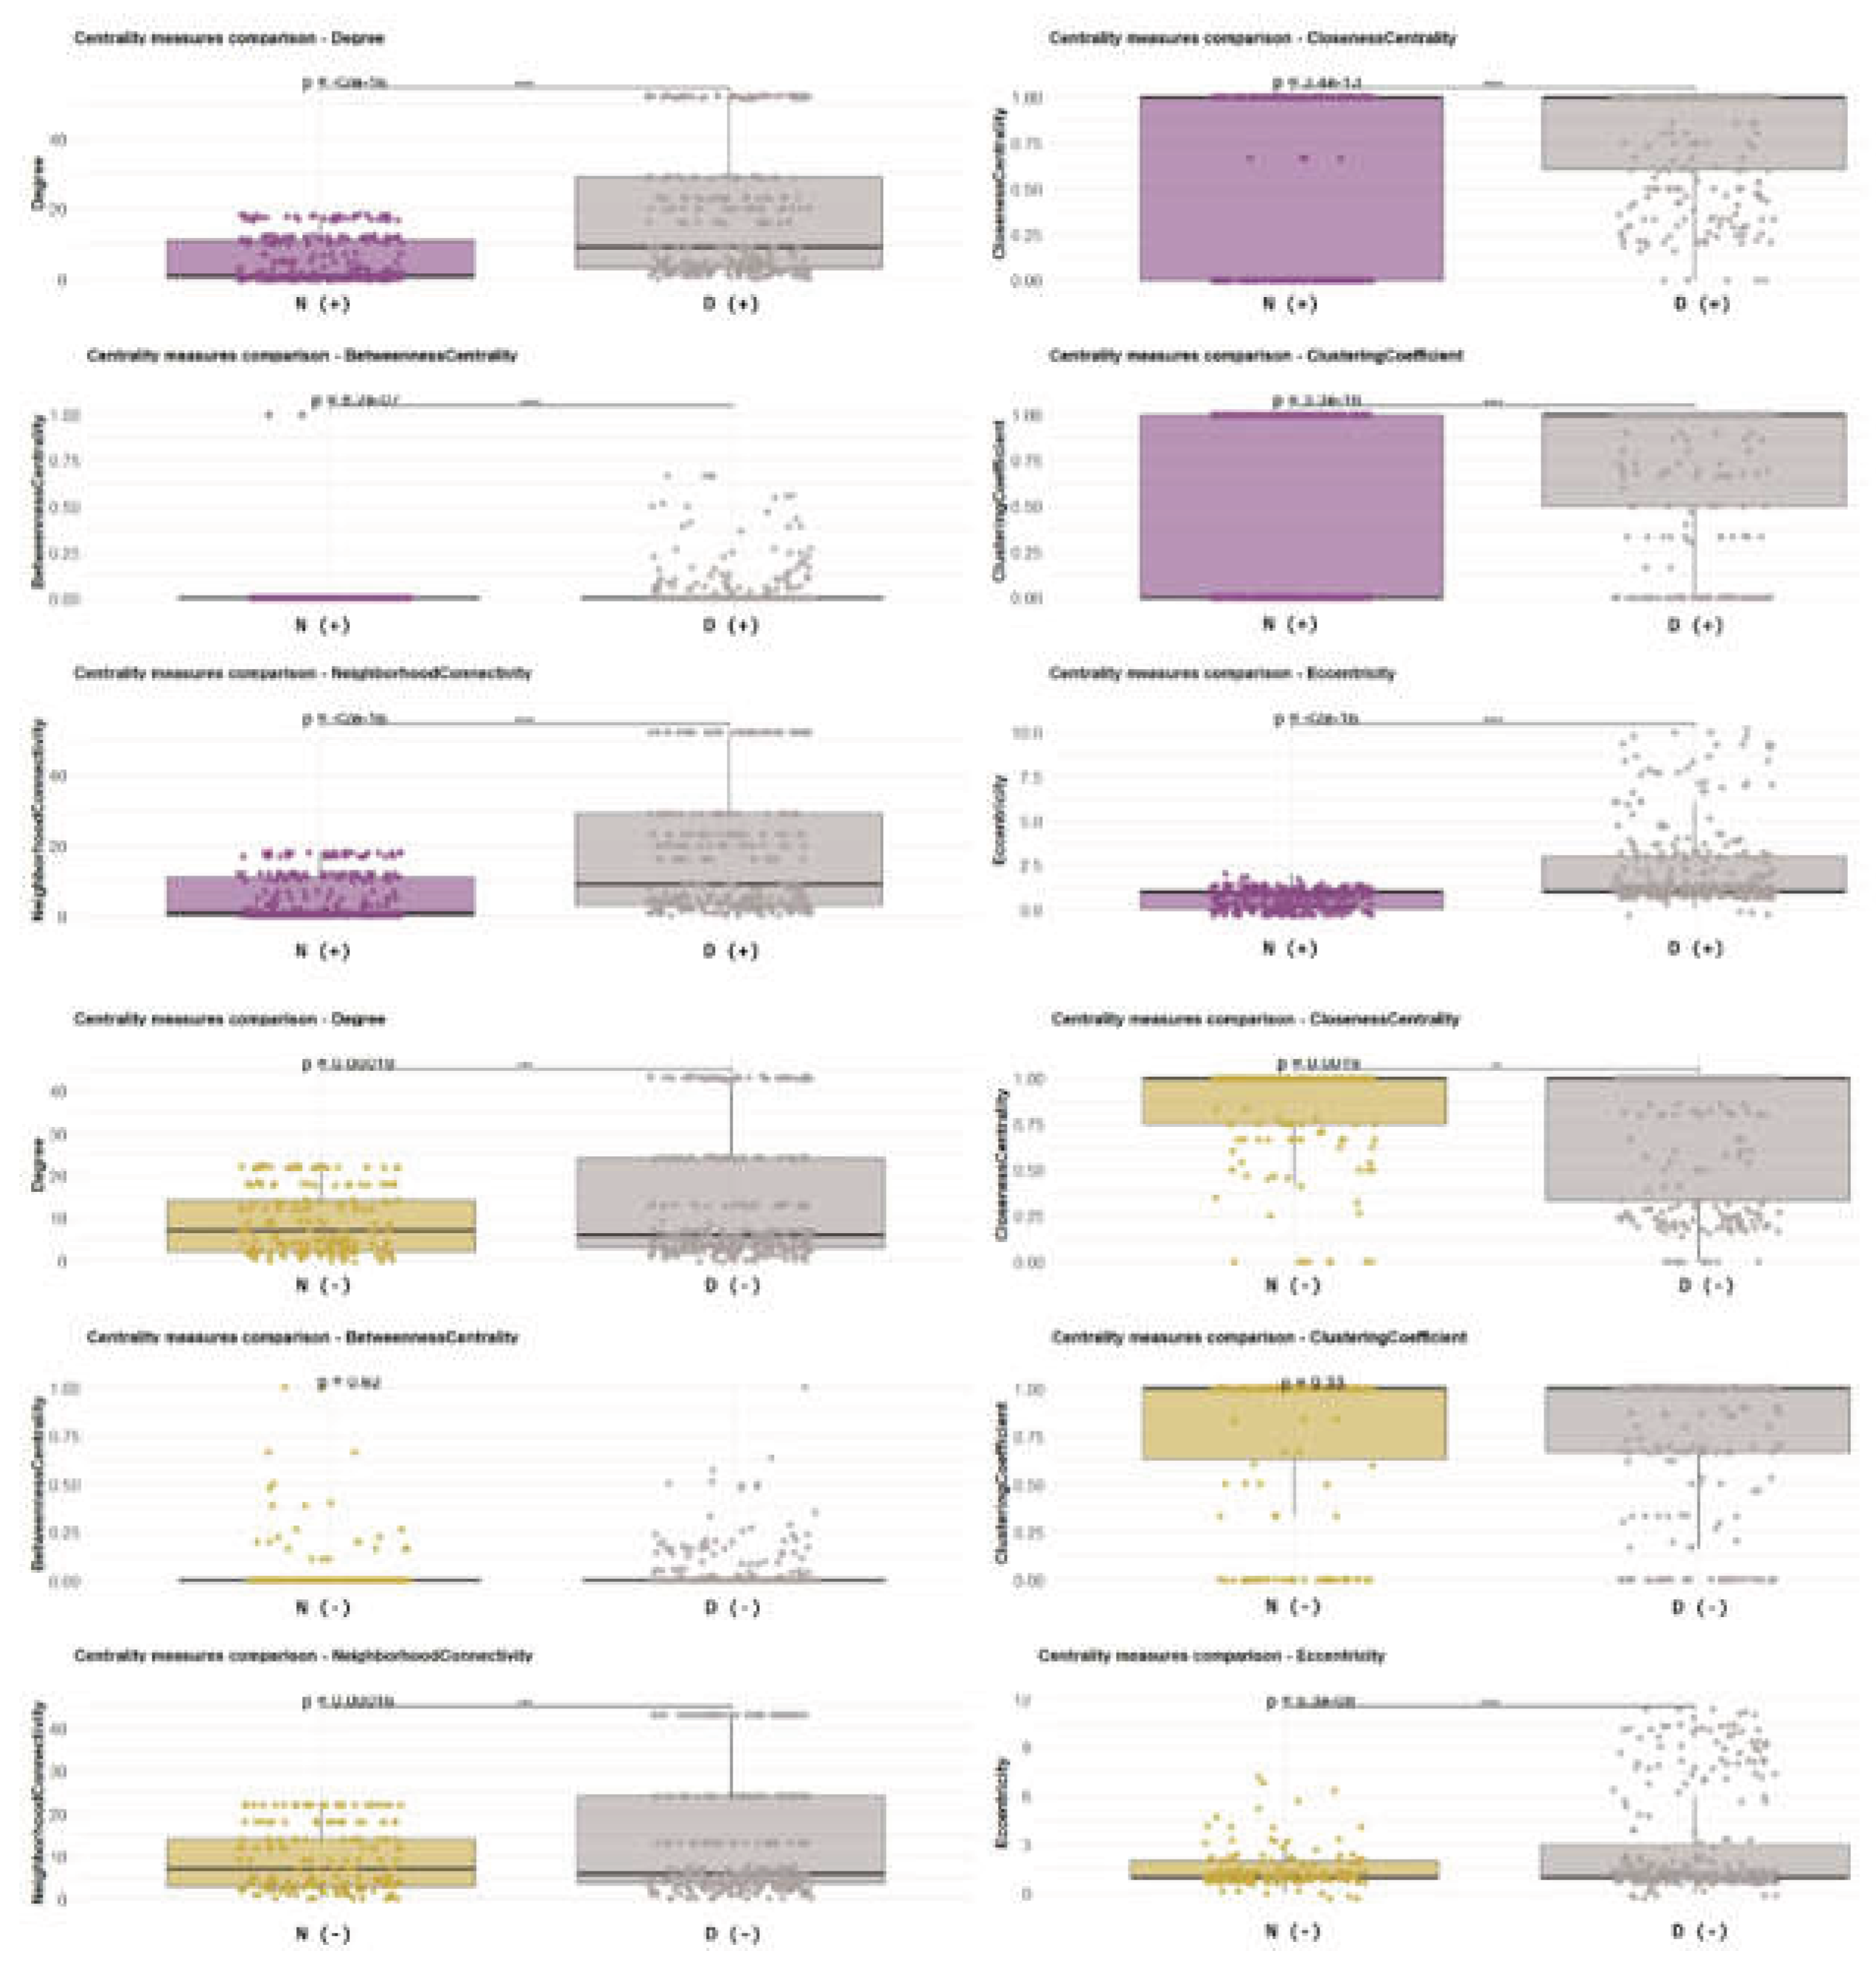
Figure 10.
Comparison of network centrality metrics between Bd-tolerant salamanders with different Bsal outcomes. Genus-level network centrality measures were compared between two host taxa that are reported to be Bd-tolerant but differ in Bsal susceptibility: Eurycea bislineata (Bd-tolerant, Bsal-susceptible) and Desmognathus monticola (tolerant to both Bd and Bsal). Comparisons are shown separately for Bd-detectable (Bd+) networks (Eurycea Bd+ vs Desmognathus Bd+; sky blue vs grey) and Bd-non-detectable (Bd−) networks (Eurycea Bd− vs Desmognathus Bd−; dark blue vs grey). Asterisks denote statistically significant differences. Centrality metrics were evaluated using one-way ANOVA followed by Tukey’s post hoc test.
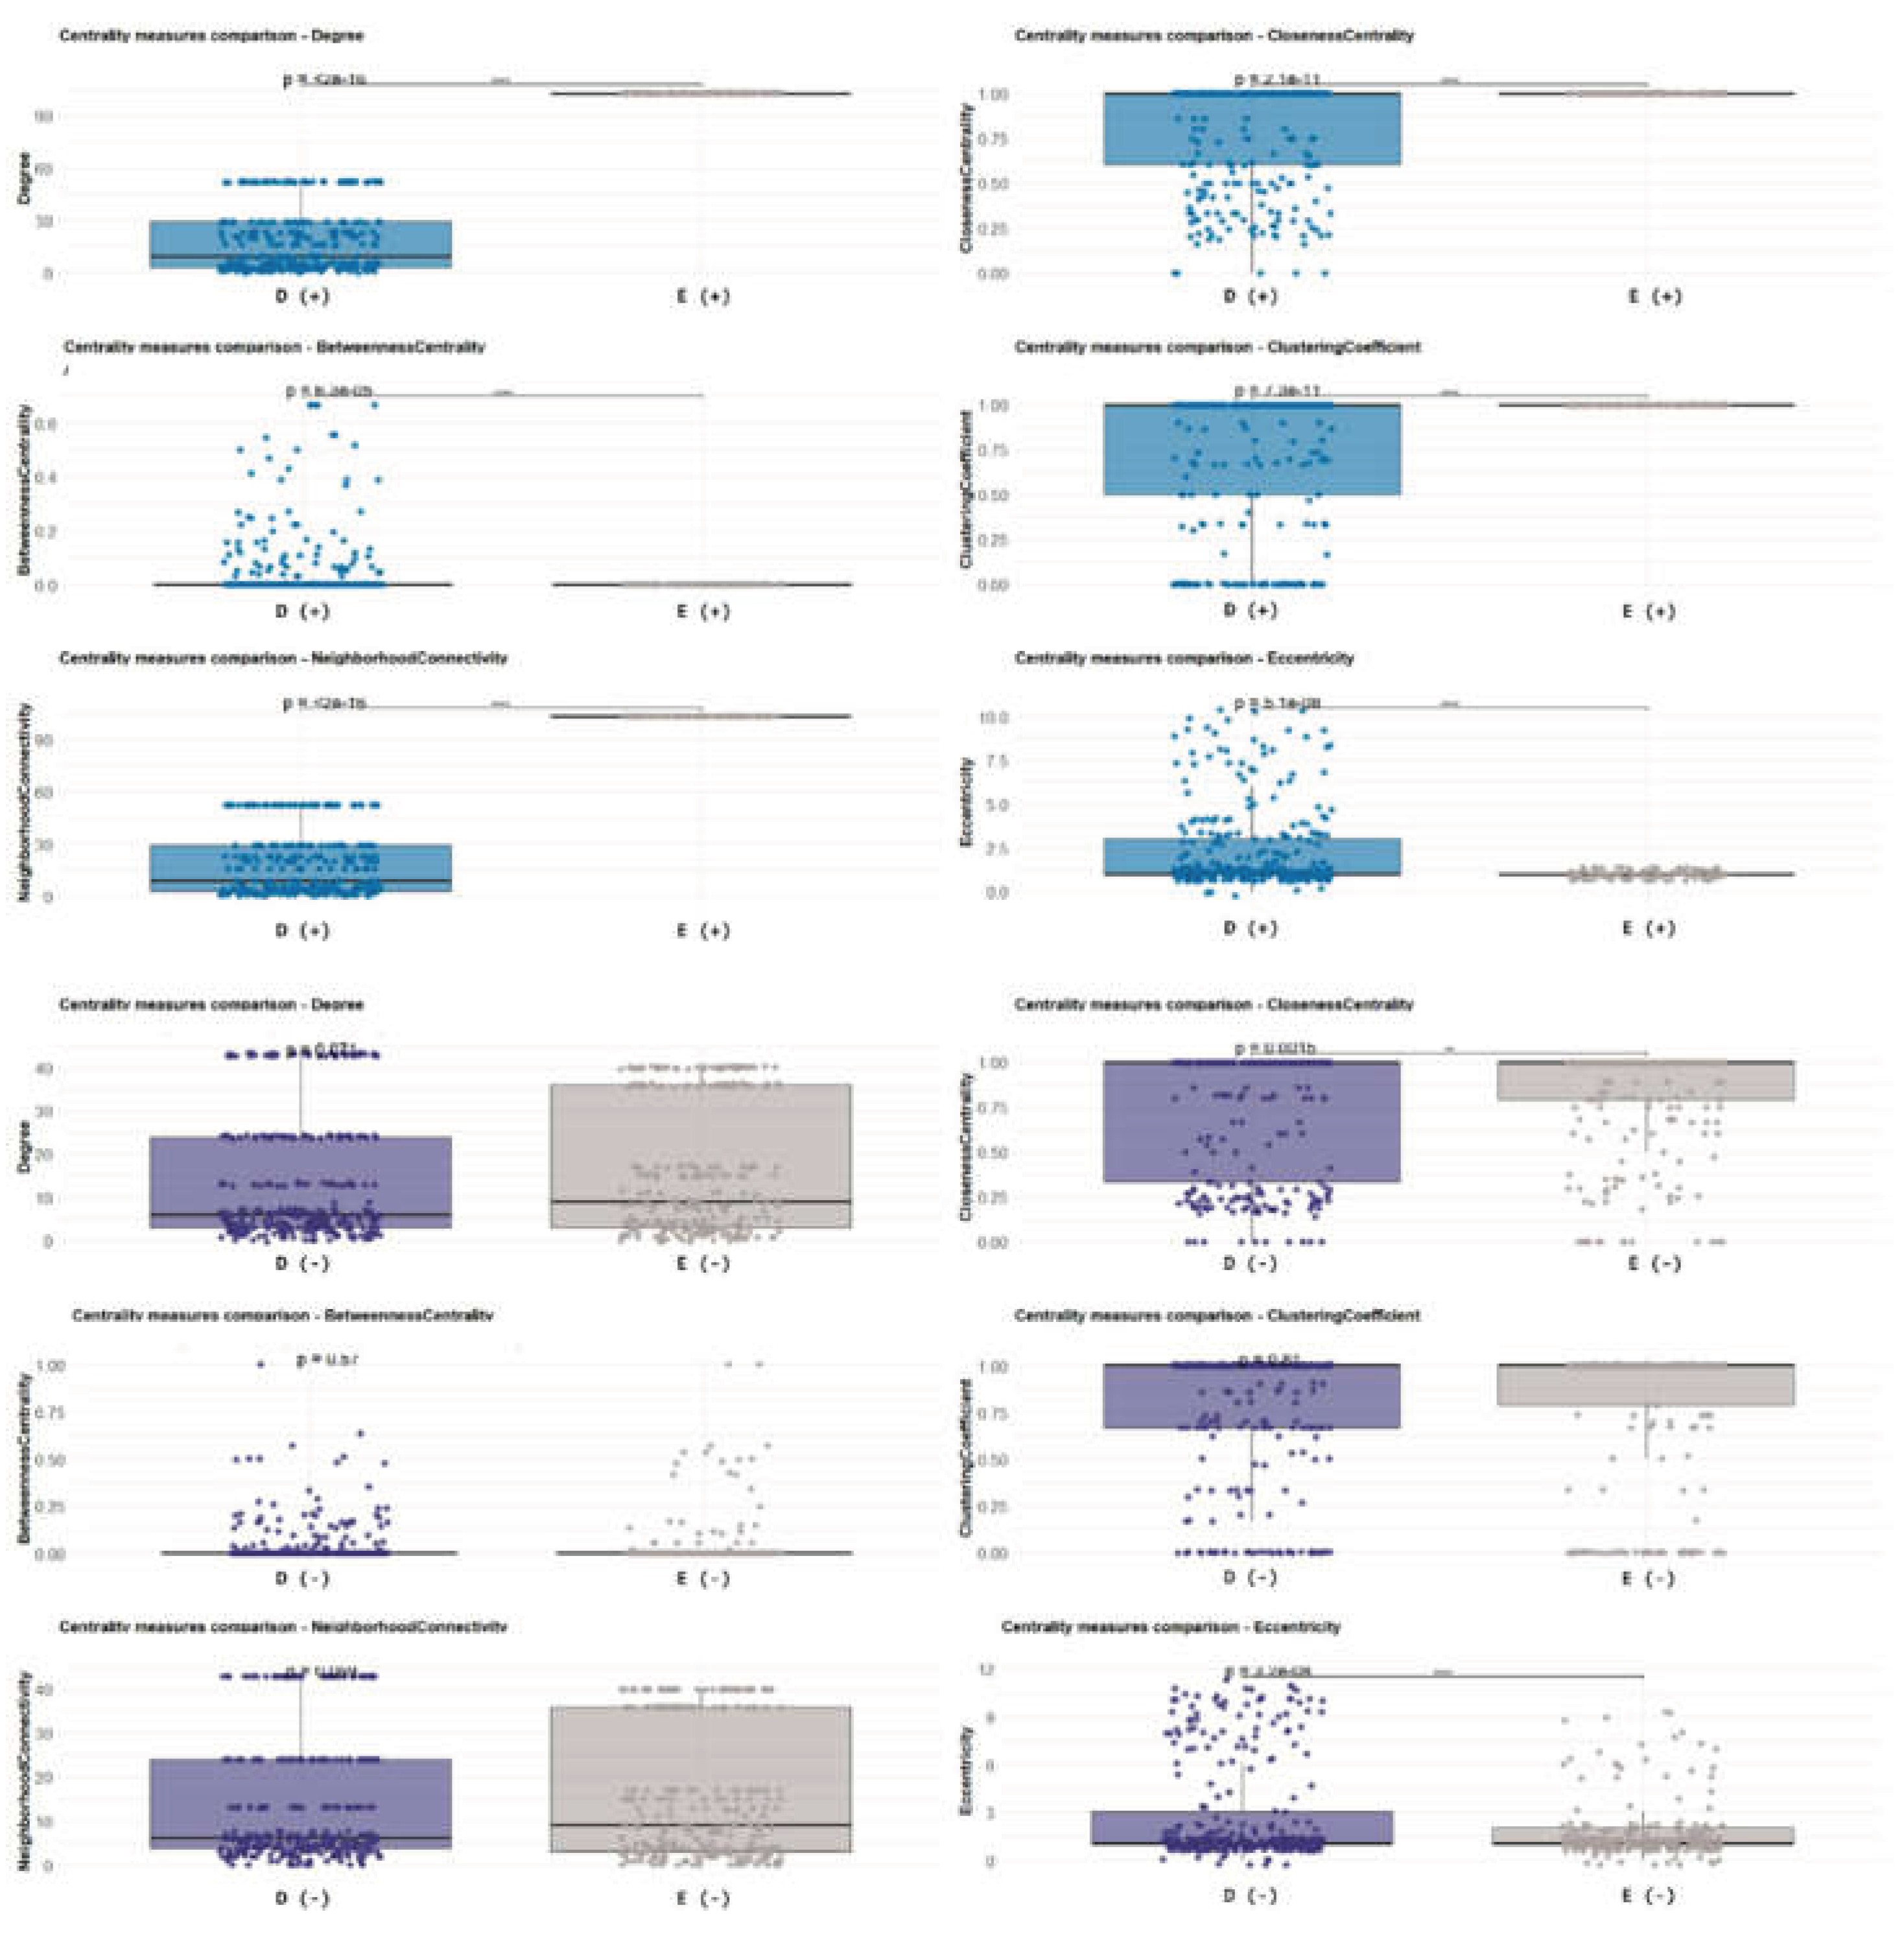
Figure 11.
Robustness analysis of genus-level networks by Bd detection status. Robustness curves are shown for the genus-level association networks inferred after pooling all samples within each condition: Bd-non-detectable (Bd−) and Bd-detectable (Bd+). The y-axis indicates the remaining network connectivity (robustness metric), and the x-axis indicates the fraction of nodes removed. Four node-removal strategies were evaluated: betweenness-based (green), cascade removal (yellow), degree-based (orange), and random removal (red).
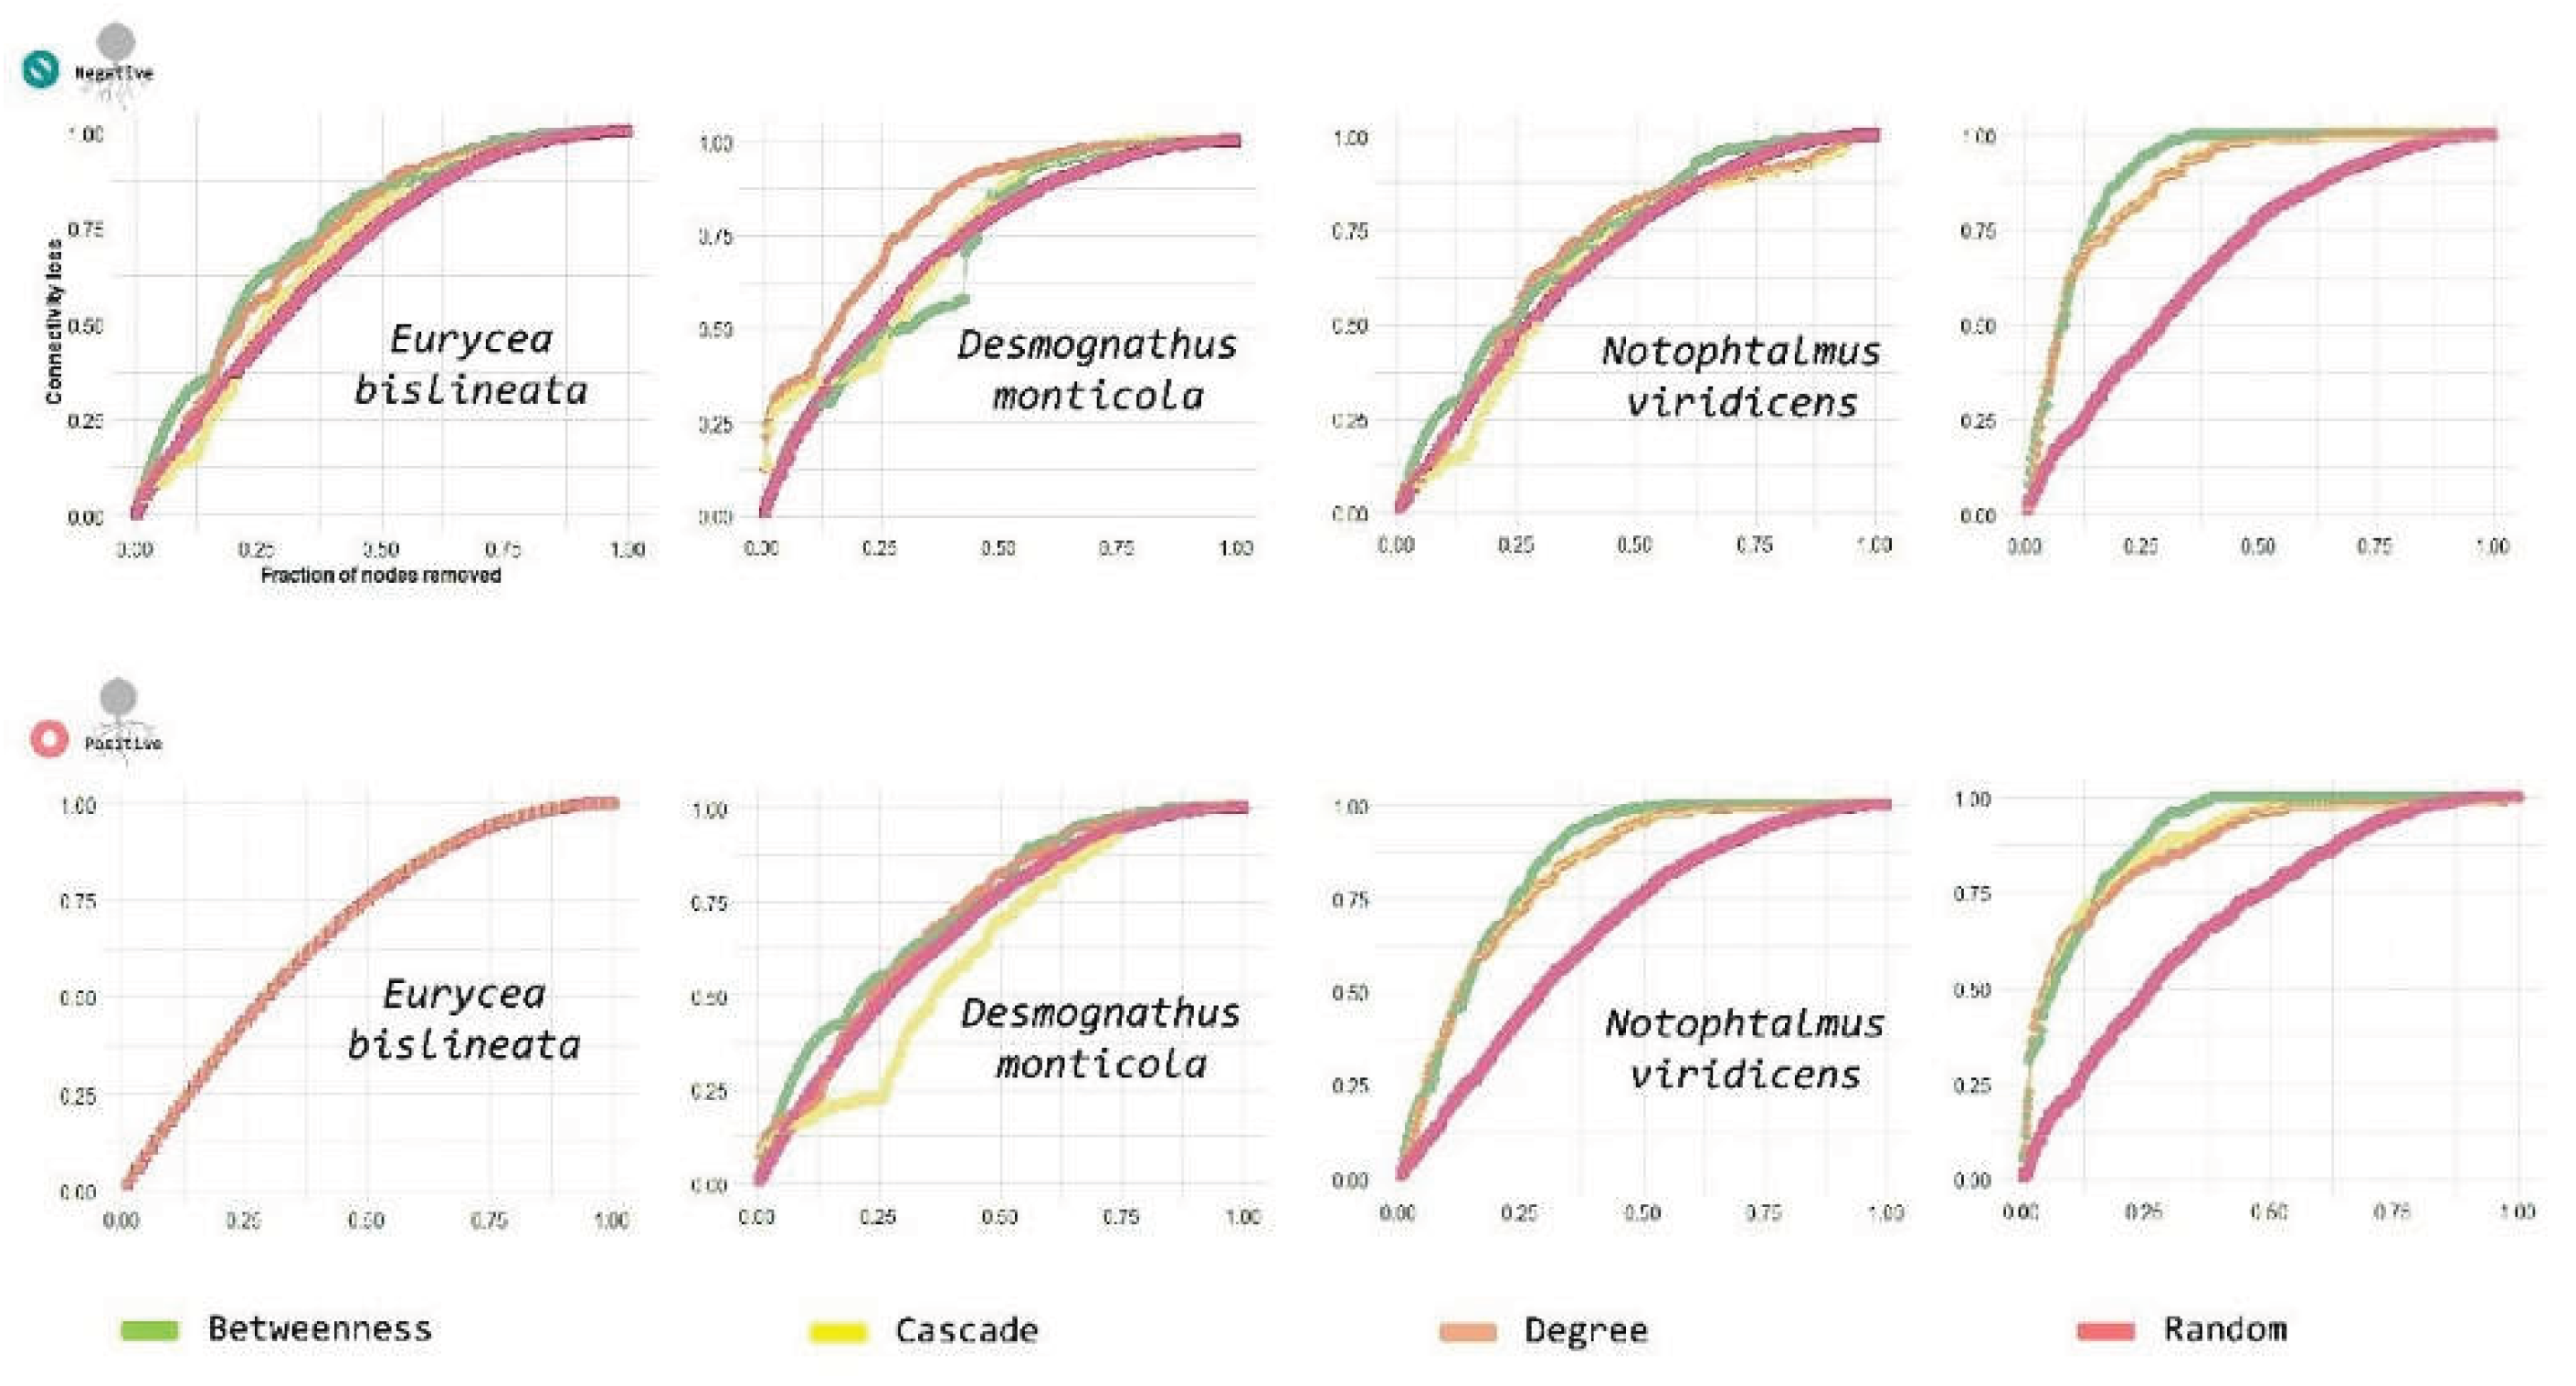
Figure 12.
Network robustness comparison between Bd-susceptible and Bd-tolerant salamanders. Robustness (loss of connectivity under node removal) is compared between a Bd-susceptible host (Notophthalmus viridescens) and a Bd-tolerant host (Desmognathus monticola), stratified by Bd detection status. Comparisons are shown separately for Bd-detectable (Bd+) networks (Notophthalmus Bd+ vs Desmognathus Bd+) and Bd-non-detectable (Bd−) networks (Notophthalmus Bd− vs Desmognathus Bd−). Asterisks denote statistically significant differences between groups. Group comparisons were performed using one-way ANOVA followed by Tukey’s post hoc test.
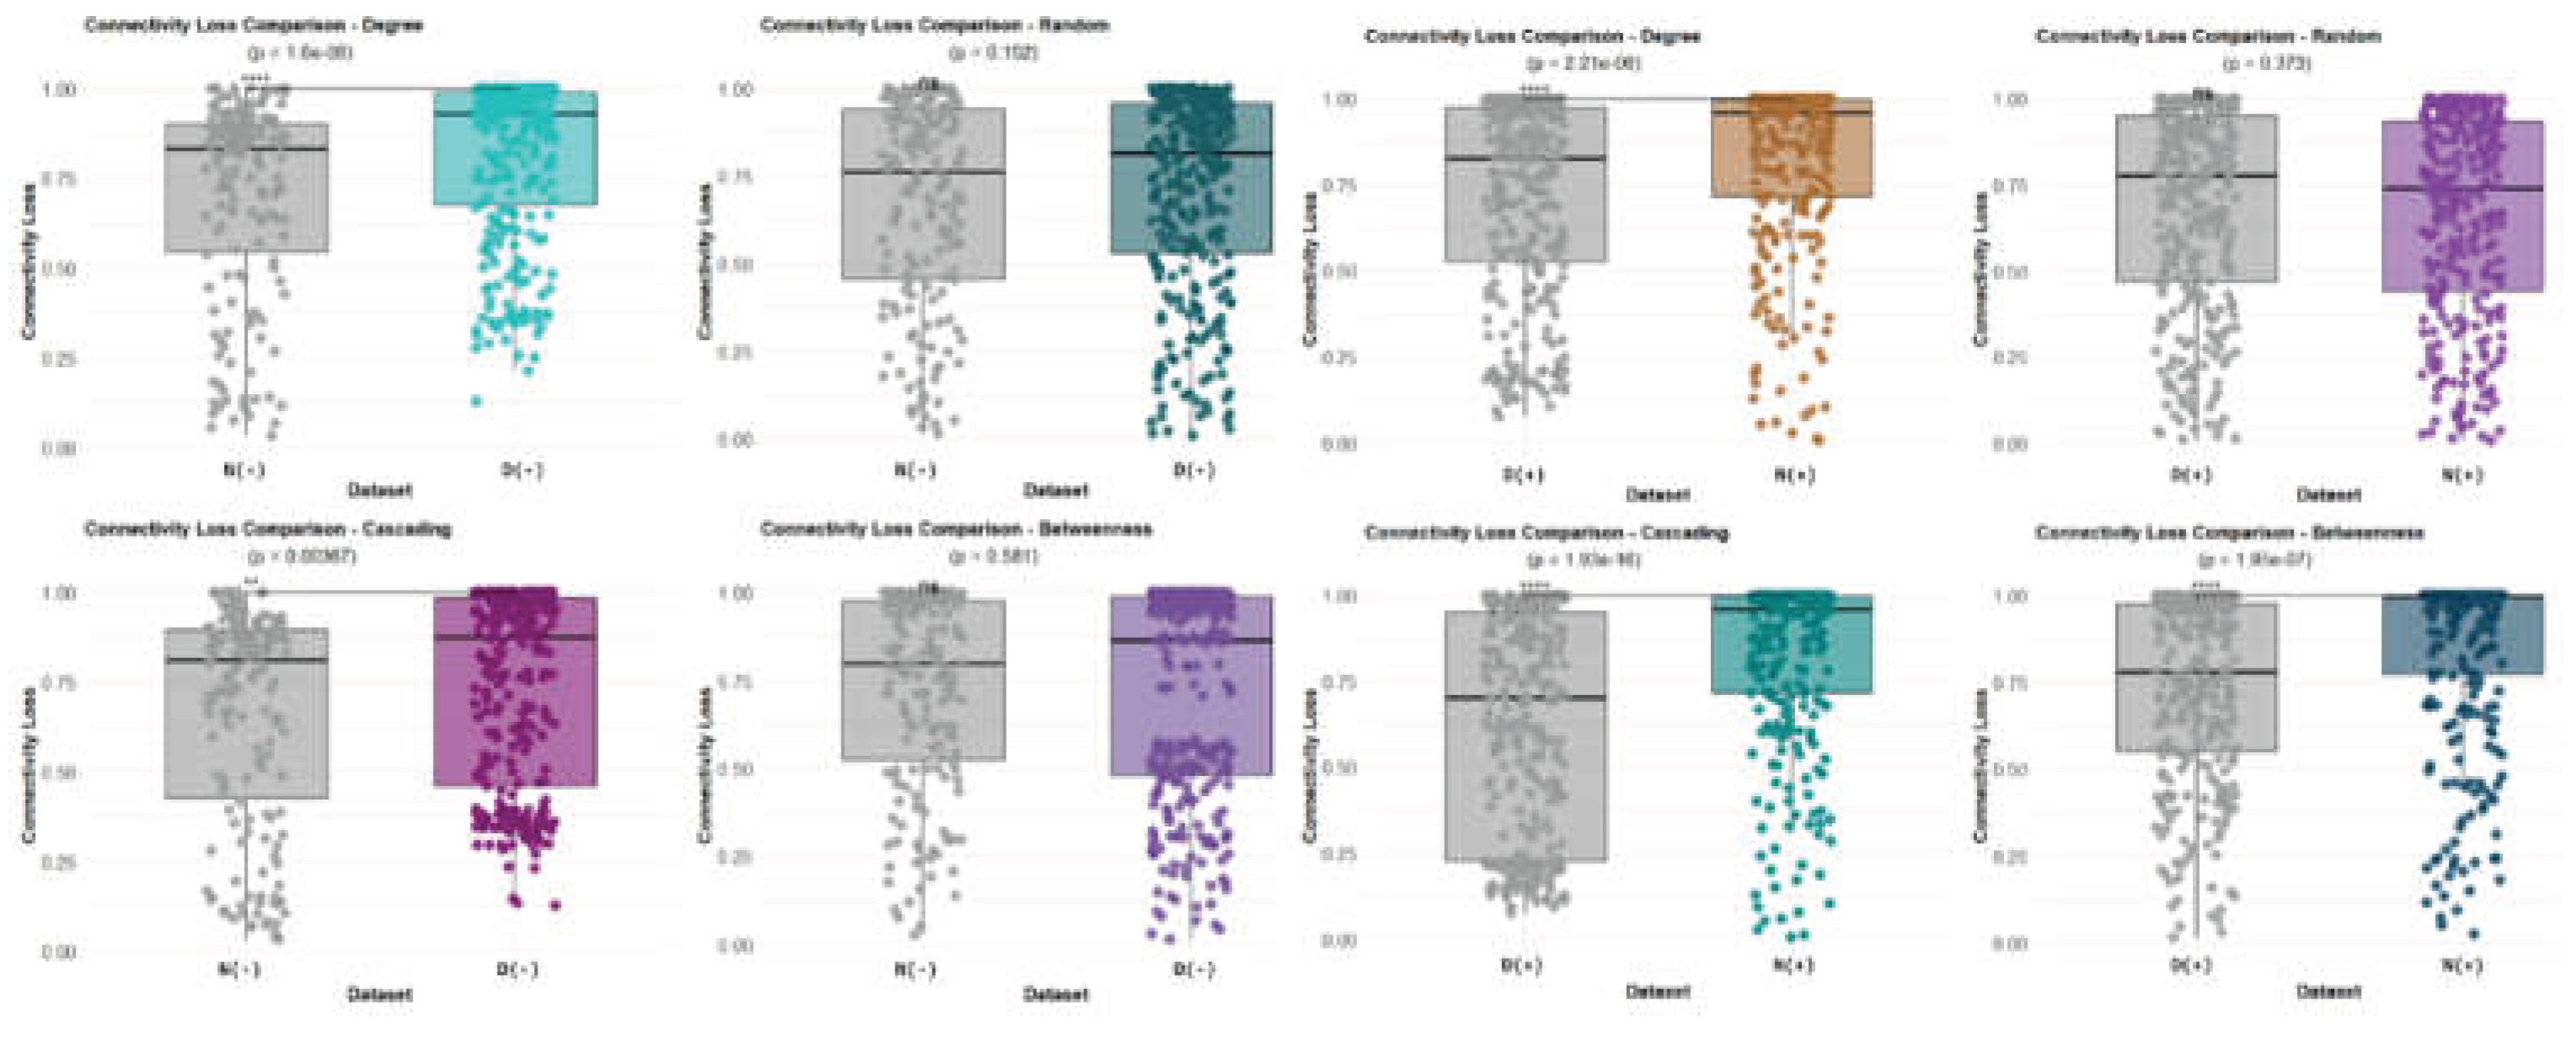
Figure 13.
Network robustness comparison between Bd-tolerant salamanders with different Bsal outcomes. Robustness (loss of connectivity under node removal) is compared between two hosts reported to be Bd-tolerant: Eurycea bislineata (Bd-tolerant, Bsal-susceptible) and Desmognathus monticola (tolerant to both Bd and Bsal), stratified by Bd detection status. Comparisons are shown separately for Bd-detectable (Bd+) networks (Eurycea Bd+ vs DesmognathusBd+) and Bd-non-detectable (Bd−) networks (Eurycea Bd− vs Desmognathus Bd−). Asterisks denote statistically significant differences between groups. Group comparisons were performed using one-way ANOVA followed by Tukey’s post hoc test.
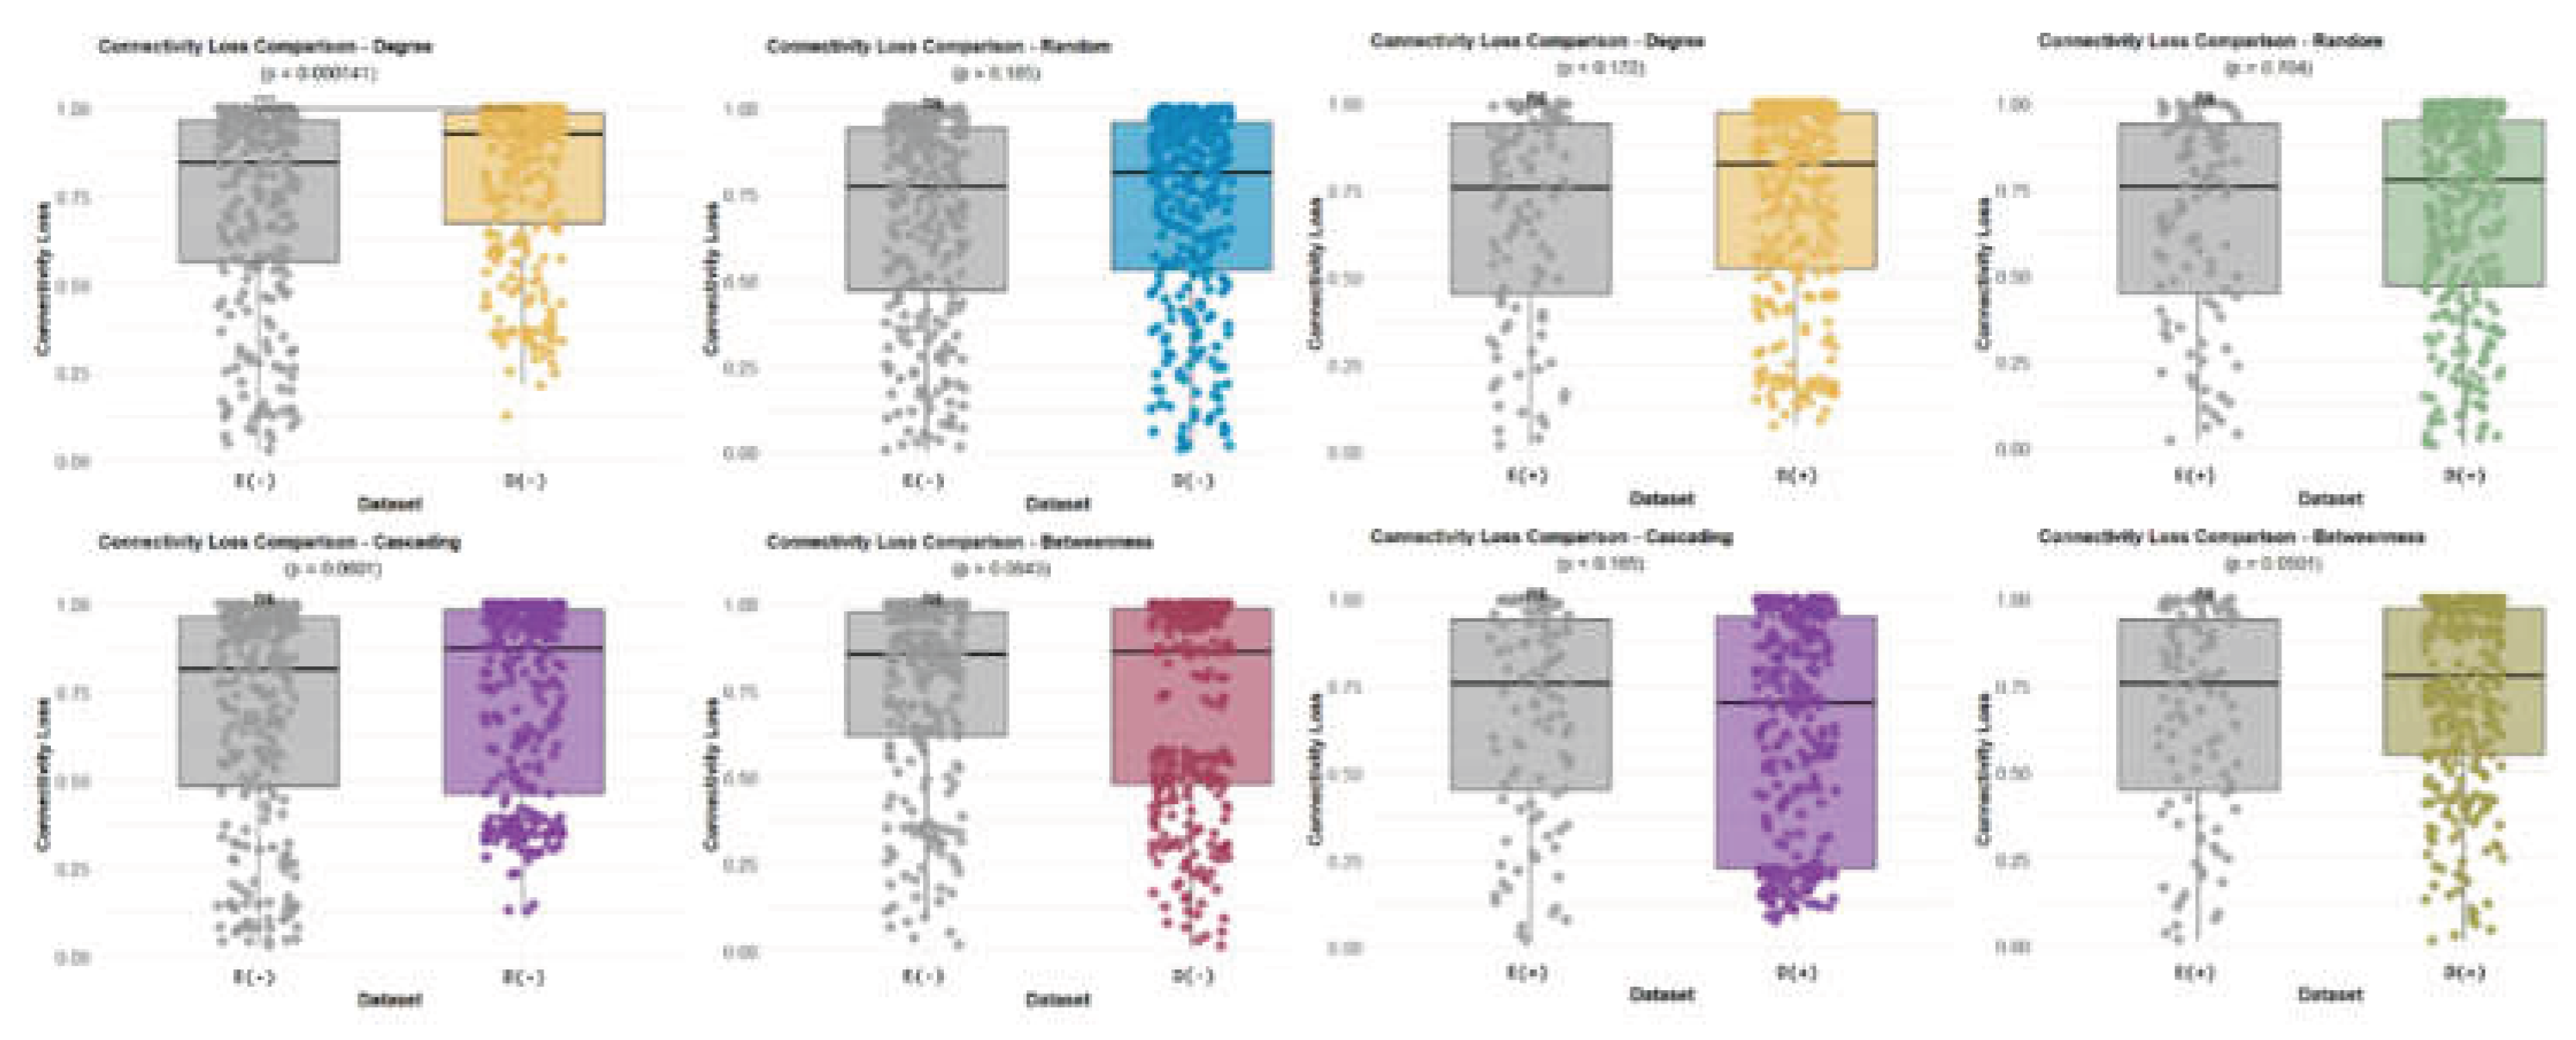
Disclaimer/Publisher’s Note: The statements, opinions and data contained in all publications are solely those of the individual author(s) and contributor(s) and not of MDPI and/or the editor(s). MDPI and/or the editor(s) disclaim responsibility for any injury to people or property resulting from any ideas, methods, instructions or products referred to in the content. |
© 2026 by the authors. Licensee MDPI, Basel, Switzerland. This article is an open access article distributed under the terms and conditions of the Creative Commons Attribution (CC BY) license (http://creativecommons.org/licenses/by/4.0/).
Copyright: This open access article is published under a Creative Commons CC BY 4.0 license, which permit the free download, distribution, and reuse, provided that the author and preprint are cited in any reuse.


