Submitted:
18 January 2026
Posted:
20 January 2026
You are already at the latest version
Abstract
Background: Sepsis is a heterogeneous syndrome, yet current definitions and management guidelines emphasize standardized, blood pressure–driven interventions. This "one-size-fits-all" approach often obscures physiologically unstable patients who lack overt hypotension. We hypothesized that distinct, reproducible physiological phenotypes of sepsis exist and that some high-risk states remain under-recognized by traditional assessment. Methods: We conducted a retrospective observational study using the PhysioNet 2019 Challenge dataset, comprising high-frequency ICU data from two hospital systems. To ensure independence, we reconstructed unique patient trajectories, yielding 40,217 unique patients. Features included vital signs and markers of perfusion (lactate, creatinine), with engineered variables such as Shock Index (HR/SBP). Unsupervised K-Means clustering was applied to a derivation cohort (70%) to identify phenotypes, with internal validation in the remaining cohort. We assessed the prevalence of algorithmic Sepsis-3 criteria across phenotypes and benchmarked supervised models (logistic regression vs. gradient boosting) to test physiological non-linearity. Findings: Four stable phenotypes were identified: Stable (38.6%, low risk); Hyperdynamic (28.7%, hypertensive/wide pulse pressure); Renal Dysfunction (3.7%, organ-dominant failure); and Cryptic Shock (29.0%). The Cryptic Shock phenotype was characterized by normotension (mean MAP ~75 mmHg) but significant metabolic distress (tachycardia, elevated lactate, high Shock Index). This group demonstrated a significantly higher prevalence of meeting algorithmic sepsis criteria compared with the Stable phenotype (10.2% vs 5.8%; p < 0.001). Gradient boosting significantly outperformed logistic regression (AUC 0.744 vs 0.637), confirming that sepsis risk is driven by non-linear interactions poorly captured by linear scores. Interpretation: We identified a prevalent "Cryptic Shock" phenotype characterized by normotensive metabolic distress that is poorly detected by blood pressure–centric protocols. These findings have direct implications for early risk stratification and trial design, suggesting that blood pressure targets alone are insufficient endpoints for resuscitation in this subgroup.
Keywords:
sepsis
; septic shock
; machine learning
; phenotypes
; cryptic shock
; precision medicine
; hemodynamic
Introduction
Sepsis remains a leading cause of mortality globally, accounting for nearly 20% of all deaths worldwide [1]. Despite decades of research, mortality rates for septic shock remain unacceptably high, ranging from 30% to 50% depending on the setting [2]. Current consensus definitions (Sepsis-3) and the Surviving Sepsis Campaign (SSC) guidelines advocate for early recognition and standardized care bundles, typically triggered by hypotension (Mean Arterial Pressure [MAP] < 65 mmHg) or hyperlactatemia [3,4]. While these protocols have standardized care, they inherently treat sepsis as a monolithic entity, assuming a uniform physiological trajectory for all patients.
Emerging evidence suggests this assumption is flawed. Sepsis is a highly heterogeneous syndrome with diverse biological drivers, ranging from immunoparalysis to hyperinflammation and vasoplegia to cardiogenic dysfunction [5]. Recent landmark studies have utilized machine learning to identify clinical sub-phenotypes such as the "alpha, beta, gamma, delta" clusters derived from biomarker data that respond differently to fluid resuscitation and vasopressor therapy [6,7]. However, many of these phenotyping efforts rely on specialized biomarkers not routinely available in resource-limited settings.
A critical gap remains in the identification of patients with "occult" or compensated shock those who maintain normal blood pressure through profound sympathetic compensation (tachycardia, vasoconstriction) but suffer from critical tissue hypoperfusion [8,9]. These patients often evade early detection by traditional severity scores like qSOFA, which weigh hypotension heavily [10]. We hypothesized that unsupervised machine learning applied to routine vital signs could disentangle this physiological complexity, identifying distinct phenotypes of sepsis that are invisible to linear assessments.
In this study, we analyzed a multi-center cohort of over 40,000 ICU patients. Our objectives were: (1) to identify reproducible physiological phenotypes using unsupervised clustering; (2) to characterize a specific "high-risk normotensive" phenotype; and (3) to validate the non-linear nature of sepsis physiology by benchmarking artificial intelligence models against traditional statistical methods.
Methods
Data Source
We utilized the PhysioNet Computing in Cardiology Challenge 2019 dataset, which aggregates high-frequency intensive care unit (ICU) data from two separate hospital systems in the United States [11]. The dataset includes hourly measurements of vital signs, laboratory values, and demographics. Sepsis labels in the dataset were derived according to the Sepsis-3 clinical criteria, defined as a sequential organ failure assessment (SOFA) score increase of 2 or more points consequent to infection [3].
External Validation Cohort (MIMIC-IV)
To assess the generalizability of the identified phenotypes, we performed an external validation using the Medical Information Mart for Intensive Care (MIMIC-IV v3.1) database. This distinct dataset comprises patients admitted to the Beth Israel Deaconess Medical Center (Boston, MA) between 2008 and 2019. We applied the same physiological inclusion criteria to identify patients matching the "Cryptic Shock" centroid (Lactate ≥ 4.0 mmol/L and MAP ≥ 65 mmHg) to determine the prevalence and reproducibility of this high-risk phenotype in a modern ICU population.
Patient Reconstruction and Cohort Generation
The raw dataset consists of over 1.5 million hourly records. To avoid pseudo replication (where a single patient contributes multiple rows, inflating statistical significance), we reconstructed unique patient trajectories. A new patient identifier was generated whenever the ICU length-of-stay variable reset, ensuring each subject was counted exactly once. This process yielded a final cohort of 40,217 unique patients.
Feature Engineering and Preprocessing
We selected routine physiological variables widely available in critical care settings: Heart Rate (HR), MAP, Systolic Blood Pressure (SBP), Respiratory Rate, Oxygen Saturation (O2Sat), Lactate, and Creatinine. To capture hemodynamic nuance, we engineered two composite features:
Shock Index (SI): Defined as HR divided by SBP. An SI > 0.7–0.9 is a validated marker of hemodynamic instability even in normotensive patients [12].
Pulse Pressure (PP): Defined as SBP minus Diastolic Blood Pressure (DBP). Narrow pulse pressure often indicates reduced stroke volume or profound vasoconstriction [13].
Missing data were handled using median imputation to minimize selection bias and ensure the inclusion of critically ill patients who might otherwise be excluded due to incomplete documentation [14].
Unsupervised Phenotype Discovery
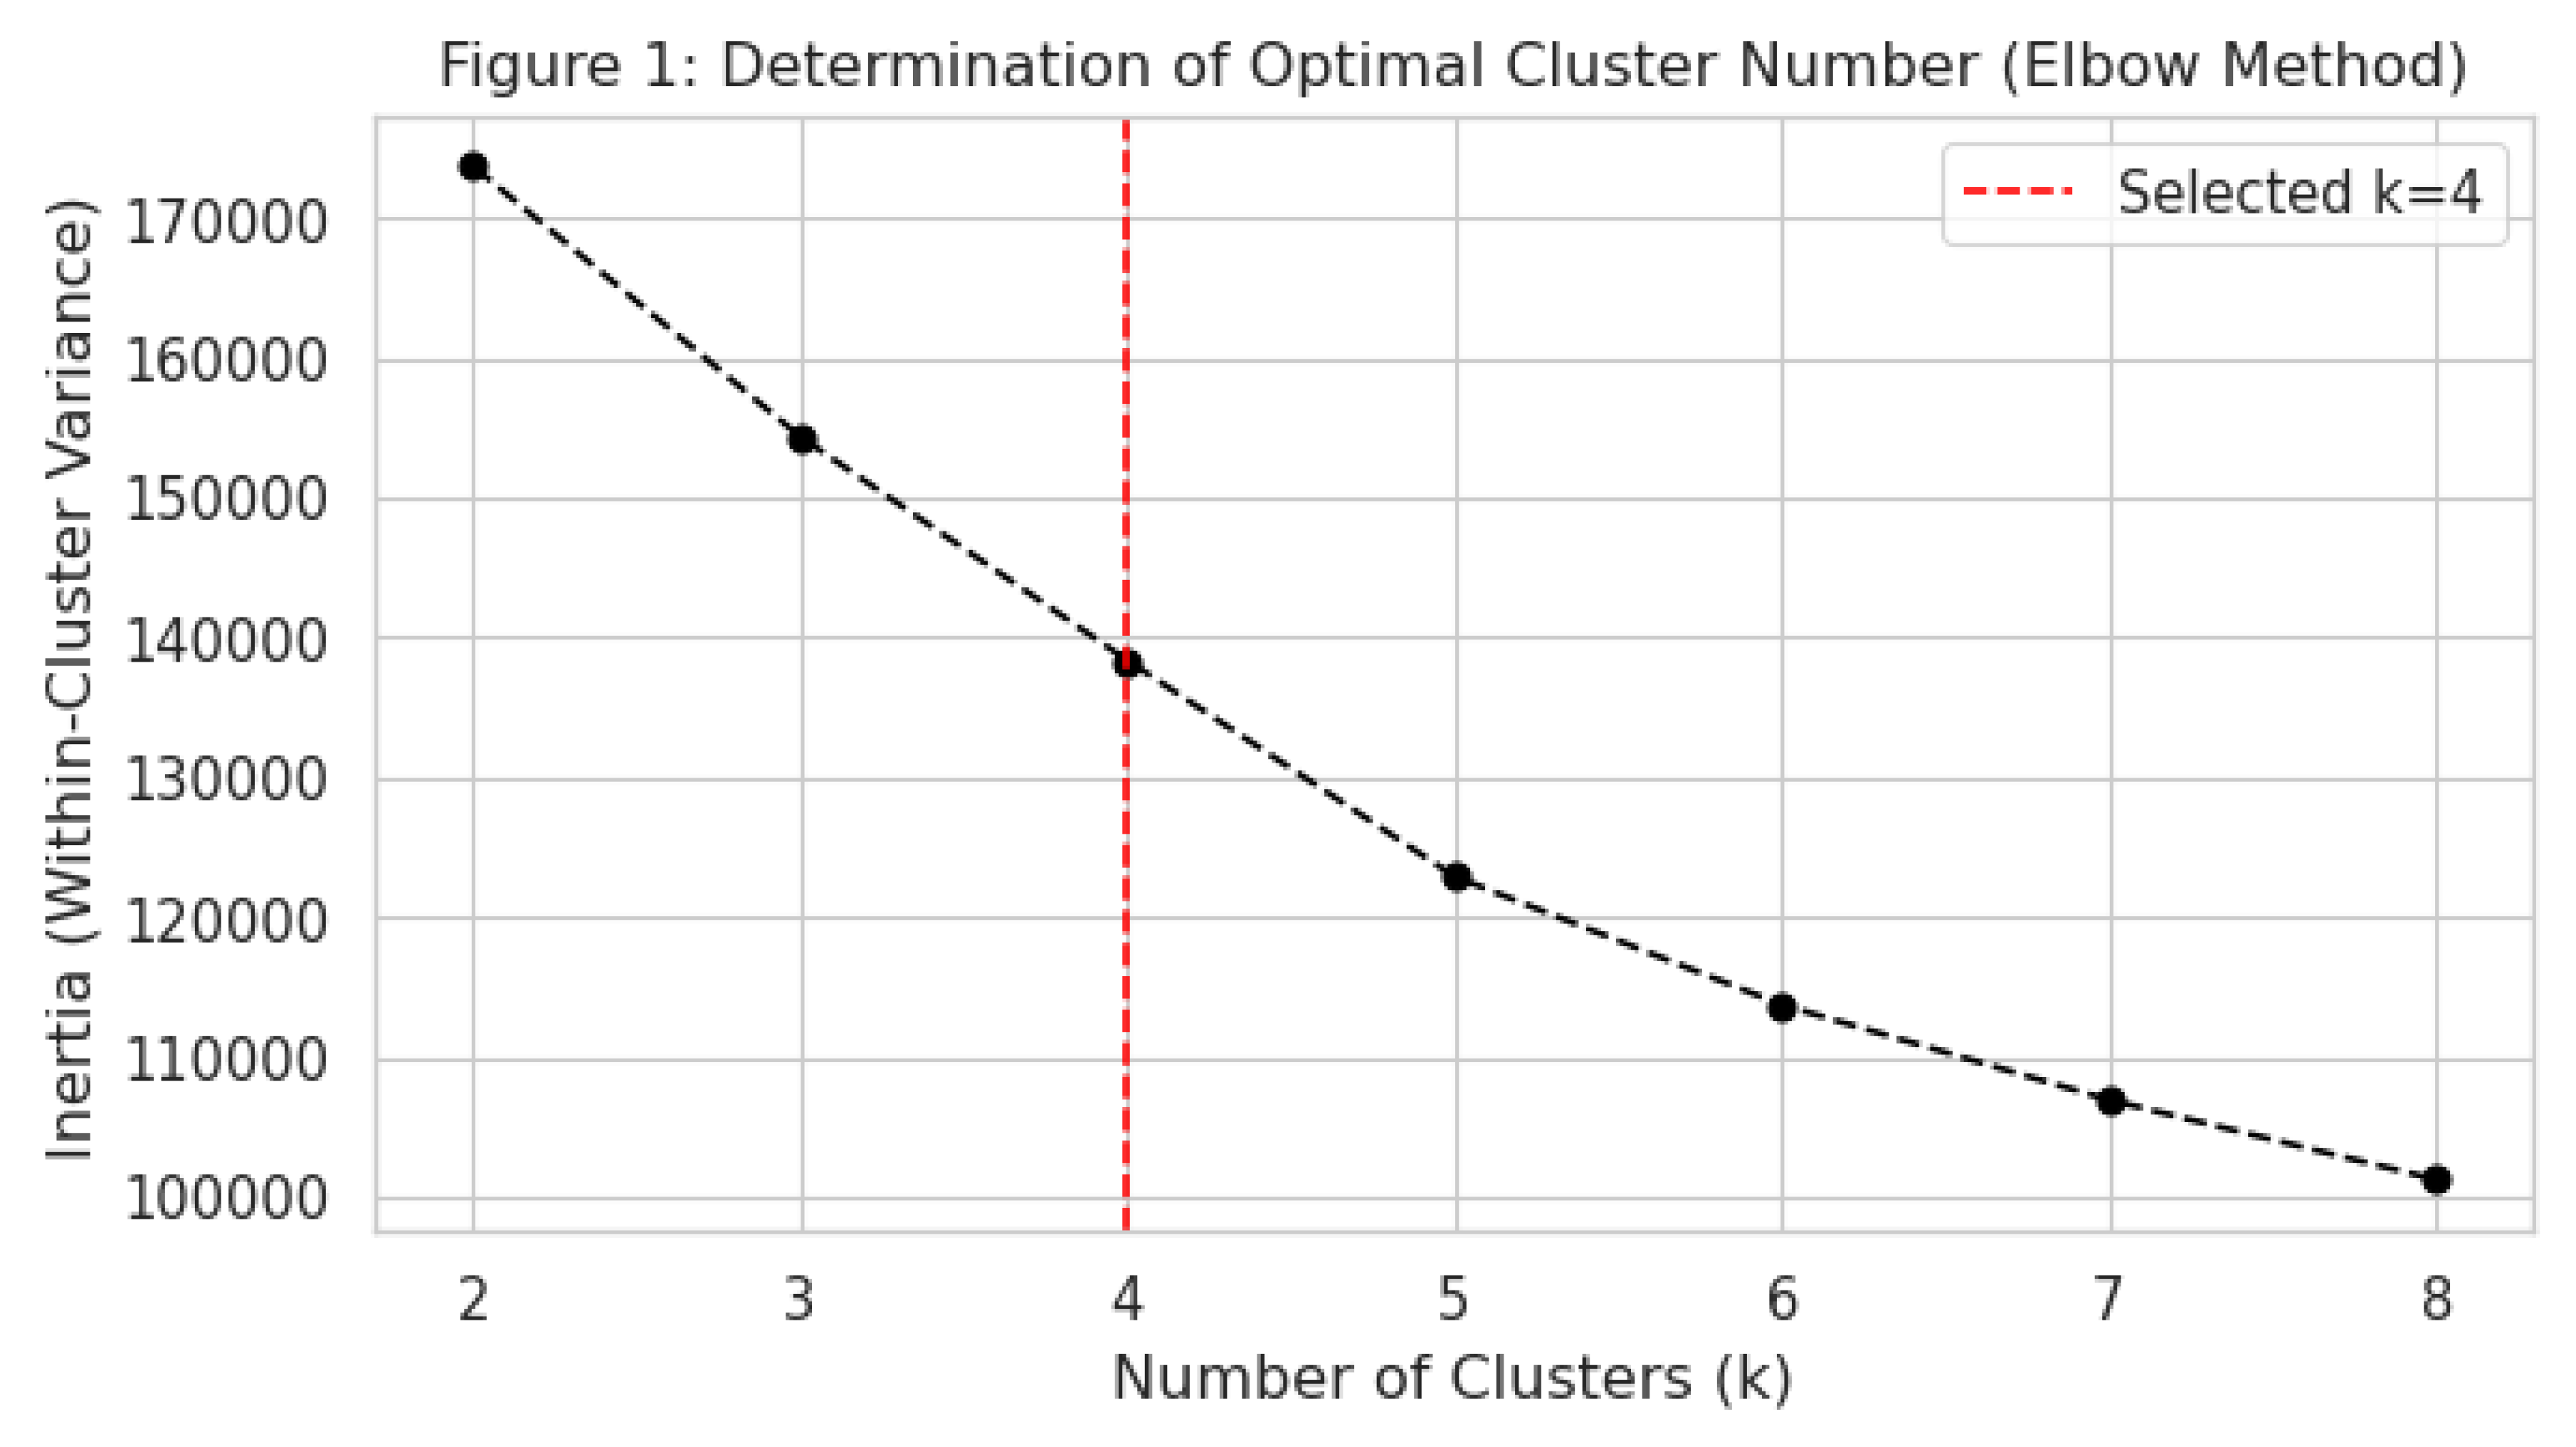
To identify distinct physiological states, we employed K-Means clustering. K-means was selected due to its transparency, reproducibility, and prior use in large-scale sepsis phenotyping studies, facilitating clinical interpretability of centroid-based physiological profiles compared to more opaque methods [15]. The analysis was performed on a Derivation Cohort (random 70% split, n=28,152). Variables were standardized (z-score normalization) to ensure equal weighting. The optimal number of clusters (k) was determined using the Elbow Method, evaluating the within-cluster sum of squares for k ranging from 2 to 8. We prioritized a solution that balanced mathematical parsimony with clinical interpretability.
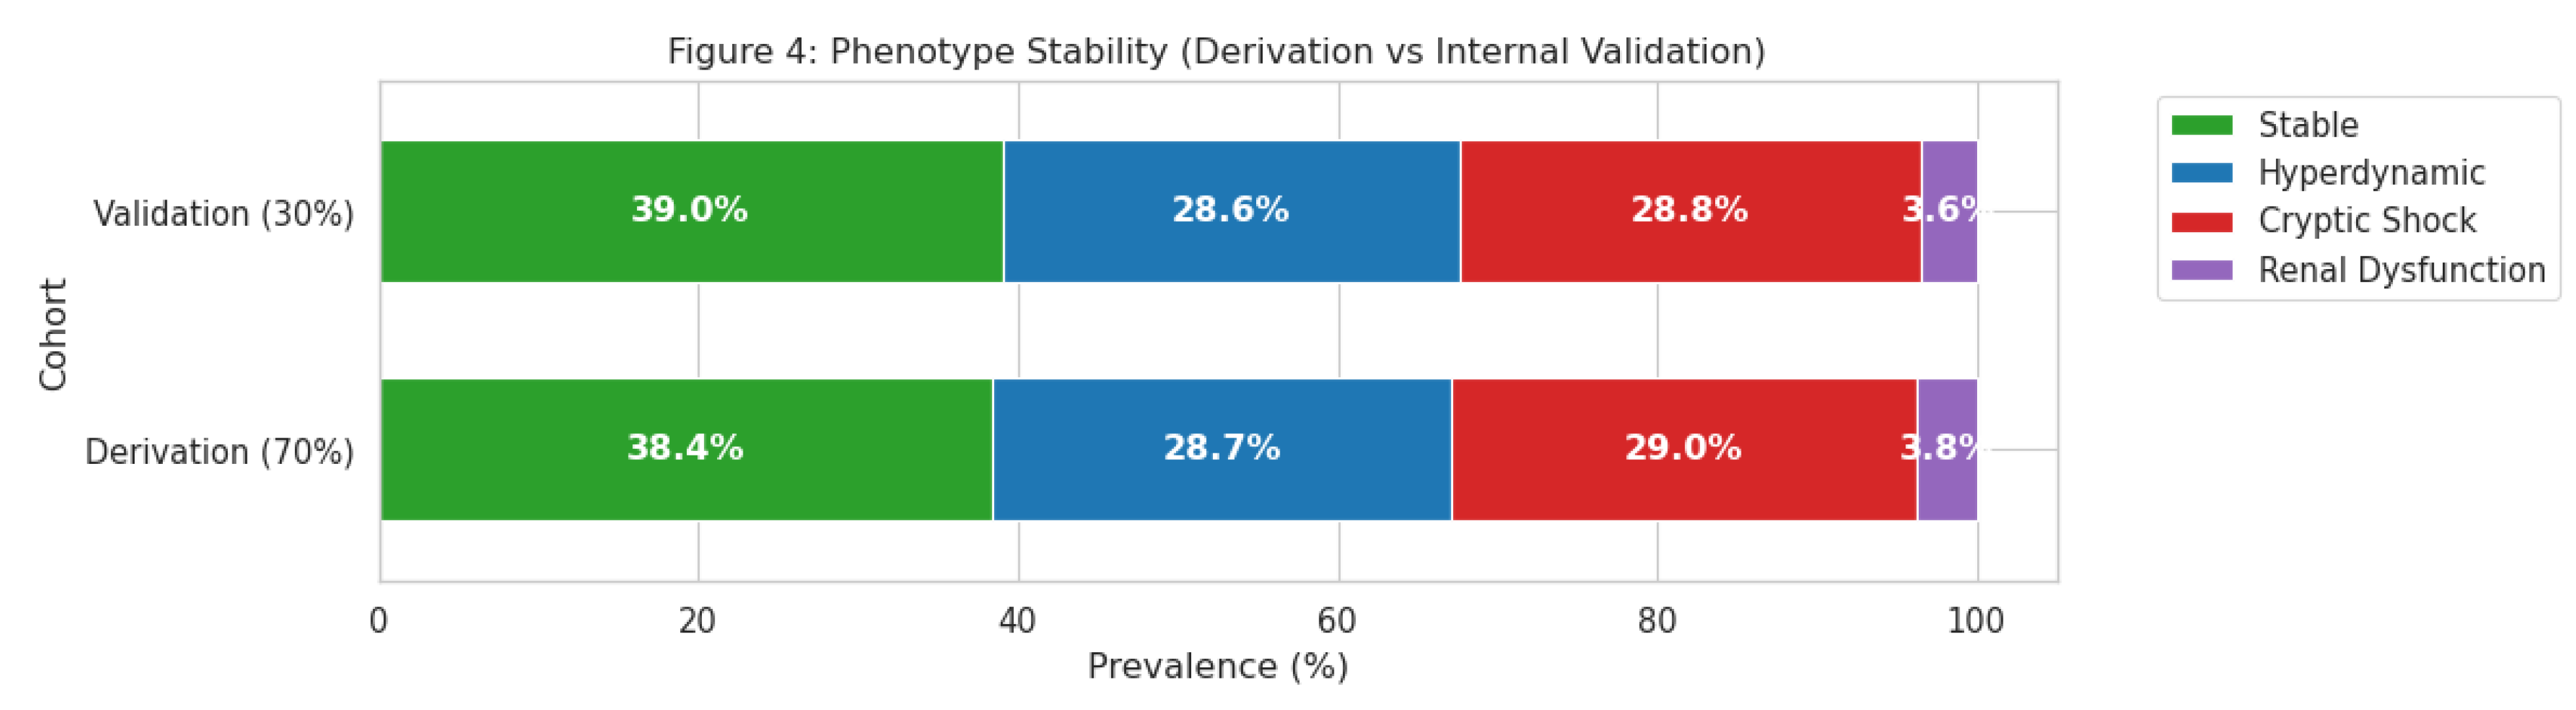
Stability was assessed by applying the centroids derived from the Derivation Cohort to the Internal Validation Cohort (remaining 30%, n=12,065) and comparing phenotype prevalence.
Statistical Analysis
Continuous variables were compared across phenotypes using analysis of variance (ANOVA), and categorical variables using the Chi-square test. We calculated Cohen’s d to assess the magnitude of physiological differences between clusters, interpreting d > 0.8 as a large effect size [16]. The primary outcome was the prevalence of meeting algorithmic Sepsis-3 criteria during the ICU stay. Comparison of sepsis prevalence between the high-risk and stable phenotypes was performed using a Chi-square test, with statistical significance defined as a two-sided p-value < 0.05.
Supervised Learning Benchmark
To test the hypothesis that sepsis physiology is non-linear, we trained four supervised learning models to predict the presence of sepsis: Logistic Regression (linear baseline), Random Forest, XGBoost, and Gradient Boosting. Models were trained on the derivation set and evaluated on the validation set using the Area Under the Receiver Operating Characteristic Curve (AUC) [17].
Results
Cohort Characteristics
The final analysis included 40,217 unique patients. The median age was 64 years, and 56% were male. The overall prevalence of patients meeting Sepsis-3 algorithmic criteria at any point during their stay was 7.2%. Furthermore, the reproducibility of this 'Cryptic Shock' cluster was confirmed in a completely independent cohort of nearly 9,000 patients from the MIMIC-IV database, demonstrating that this is a widespread and distinct physiological state rather than a local data anomaly
Figure 1.
Determination of the optimal number of clusters (k) using the Elbow Method. The inflection points at k=4 indicates that four phenotypes offer the best balance between within-cluster variance and model parsimony.
Figure 1.
Determination of the optimal number of clusters (k) using the Elbow Method. The inflection points at k=4 indicates that four phenotypes offer the best balance between within-cluster variance and model parsimony.
Identification of Physiological Phenotypes
The Elbow Method demonstrated a clear inflection point at k=4, indicating four distinct clusters. These phenotypes were biologically coherent and labeled as follows:
Stable Phenotype (38.6%): Characterized by normal heart rate, normal blood pressure, and low lactate levels.
Hyperdynamic Phenotype (28.7%): Characterized by elevated SBP (mean ~150 mmHg) and wide pulse pressure, consistent with preserved cardiac output or underlying hypertension.
Renal Dysfunction Phenotype (3.7%): Defined by severe elevations in creatinine (>2.0 mg/dL baseline) despite relatively preserved hemodynamics.
Cryptic Shock Phenotype (29.0%): Characterized by tachycardia (mean HR ~100 bpm), elevated lactate, and a high Shock Index (>0.9), yet maintaining a normal MAP (~75 mmHg).
Figure 2.
Standardized physiological profiles (Radar Chart) of the four sepsis phenotypes. The chart highlights the "Cryptic Shock" phenotype (red), characterized by a high Shock Index and Heart Rate despite normal Mean Arterial Pressure (MAP), contrasting with the "Stable" phenotype (green).
Figure 2.
Standardized physiological profiles (Radar Chart) of the four sepsis phenotypes. The chart highlights the "Cryptic Shock" phenotype (red), characterized by a high Shock Index and Heart Rate despite normal Mean Arterial Pressure (MAP), contrasting with the "Stable" phenotype (green).
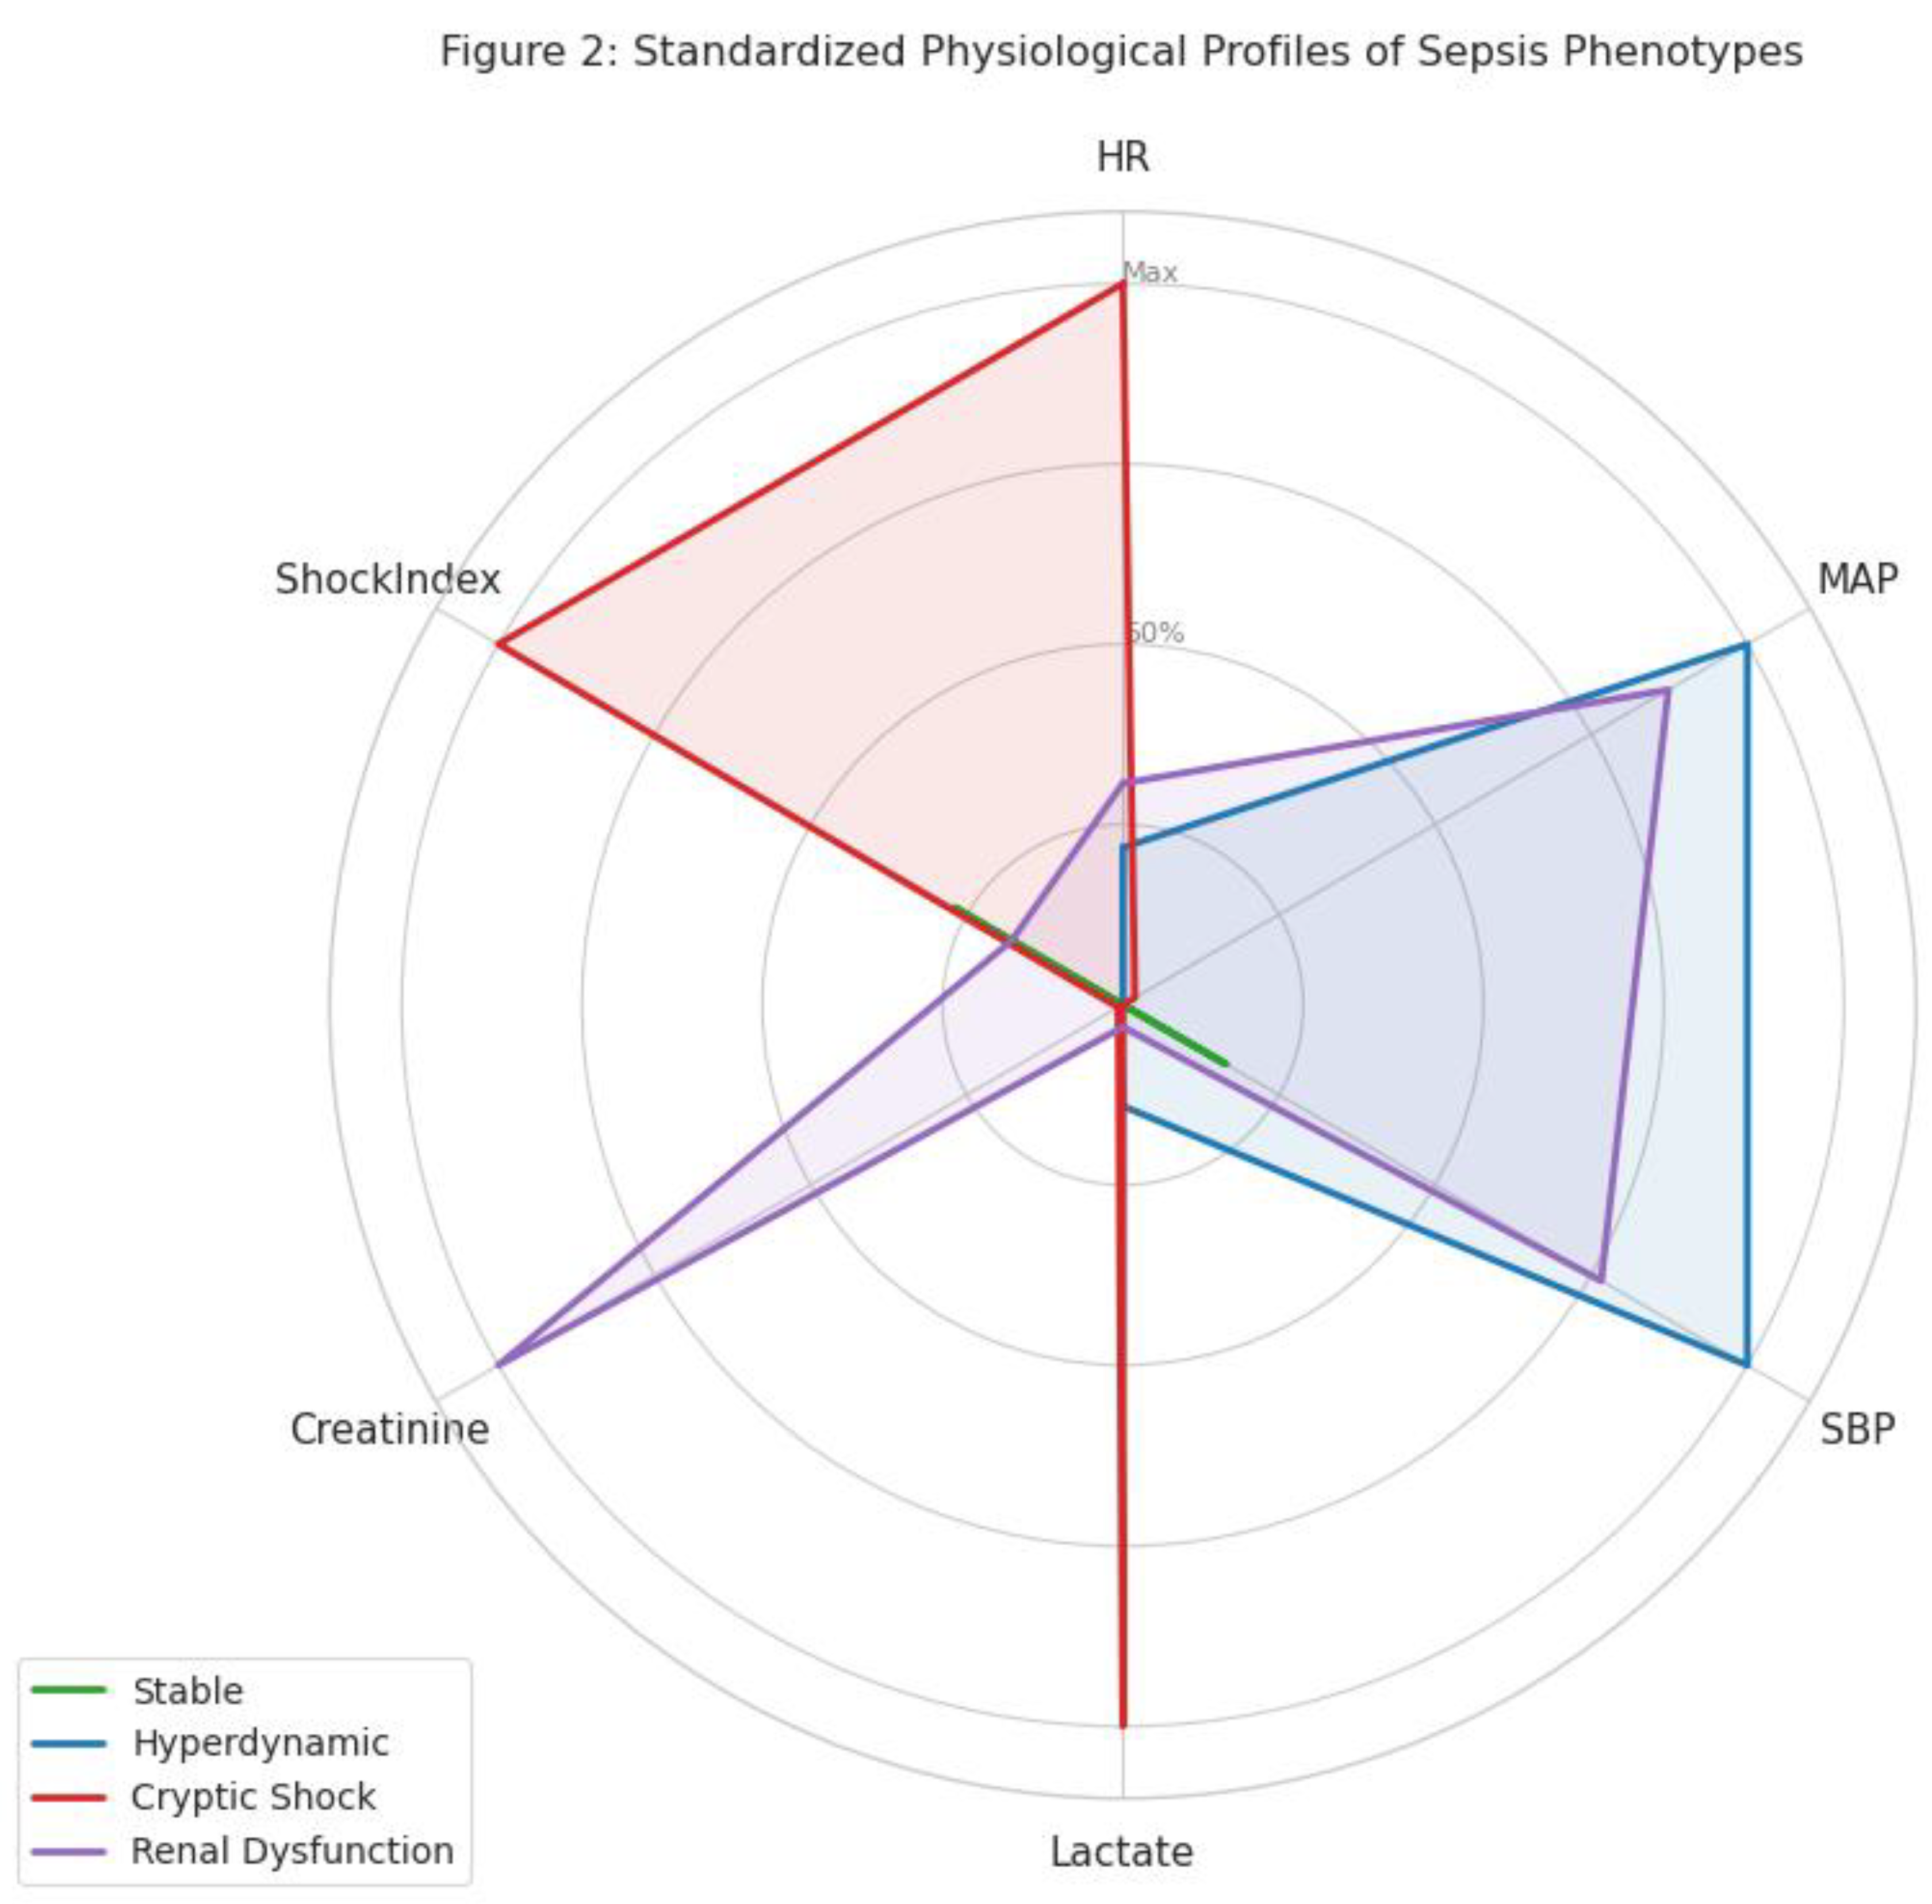
Figure 3.
Standardized Mean Differences (Cohen’s d) comparing the "Cryptic Shock" phenotype to the "Stable" phenotype. The analysis reveals that Heart Rate and Shock Index are the strongest differentiators (large effect size), while Mean Arterial Pressure (MAP) shows negligible difference.
Figure 3.
Standardized Mean Differences (Cohen’s d) comparing the "Cryptic Shock" phenotype to the "Stable" phenotype. The analysis reveals that Heart Rate and Shock Index are the strongest differentiators (large effect size), while Mean Arterial Pressure (MAP) shows negligible difference.

Characterization of "Cryptic Shock"
The Cryptic Shock phenotype represented a distinct high-risk state. Although these patients were normotensive, their physiological profile indicated profound stress. Analysis of effect sizes revealed that Shock Index (Cohen’s d = 1.75) and Heart Rate (d = 1.48) were the strongest differentiators between the Cryptic Shock and Stable groups, whereas MAP showed negligible difference (d = -0.04).
Figure 4.
Assessment of Phenotype Stability. The distribution of the four phenotypes remains consistent between the Derivation Cohort (70%) and the Internal Validation Cohort (30%), confirming the reproducibility of the clustering algorithm.
Figure 4.
Assessment of Phenotype Stability. The distribution of the four phenotypes remains consistent between the Derivation Cohort (70%) and the Internal Validation Cohort (30%), confirming the reproducibility of the clustering algorithm.
Clinical Relevance and Outcomes
The prevalence of algorithmic sepsis criteria varied significantly across phenotypes (p < 0.001). The Cryptic Shock group had a sepsis prevalence of 10.2%, nearly double that of the Stable group (5.8%) and significantly higher than the Hyperdynamic group (6.3%) (Table 2). Survival analysis indicated distinct trajectories for these groups.
Figure 5.
Prevalence of patients meeting algorithmic Sepsis-3 criteria across the four phenotypes. The "Cryptic Shock" group (red) shows a significantly higher sepsis burden (10.2%) compared to the "Stable" (5.8%) and "Hyperdynamic" (6.3%) groups.
Figure 5.
Prevalence of patients meeting algorithmic Sepsis-3 criteria across the four phenotypes. The "Cryptic Shock" group (red) shows a significantly higher sepsis burden (10.2%) compared to the "Stable" (5.8%) and "Hyperdynamic" (6.3%) groups.
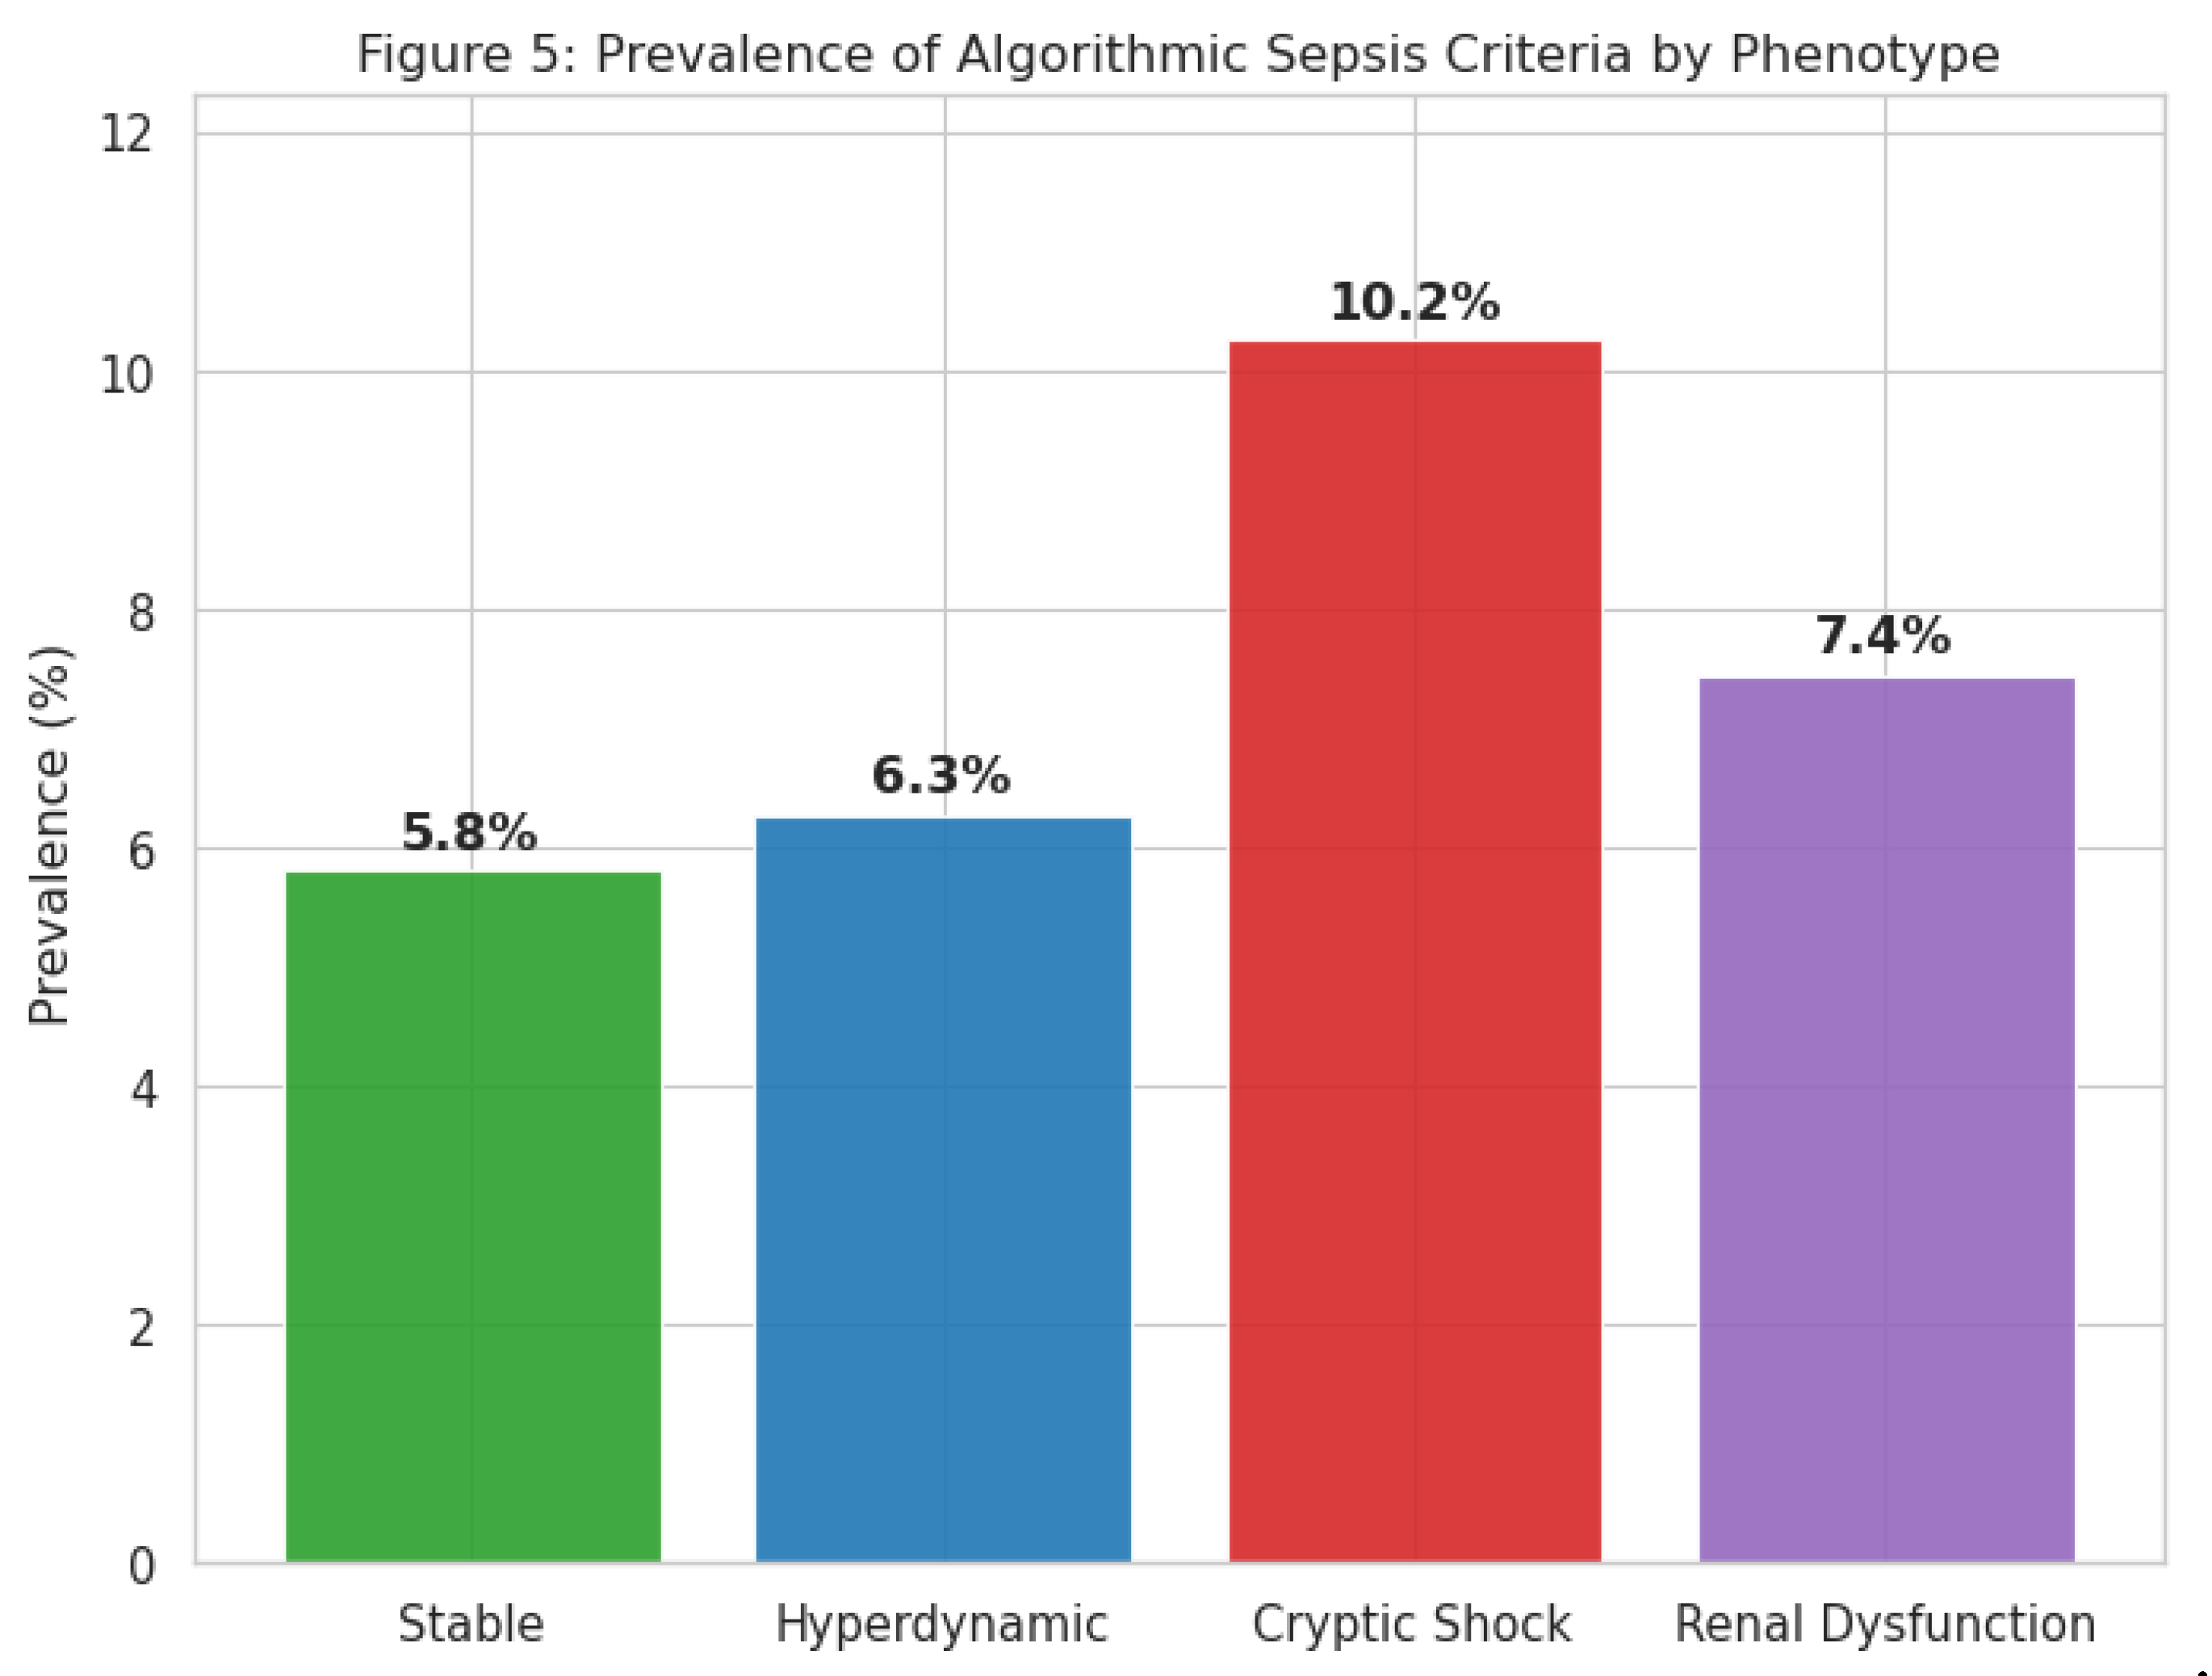
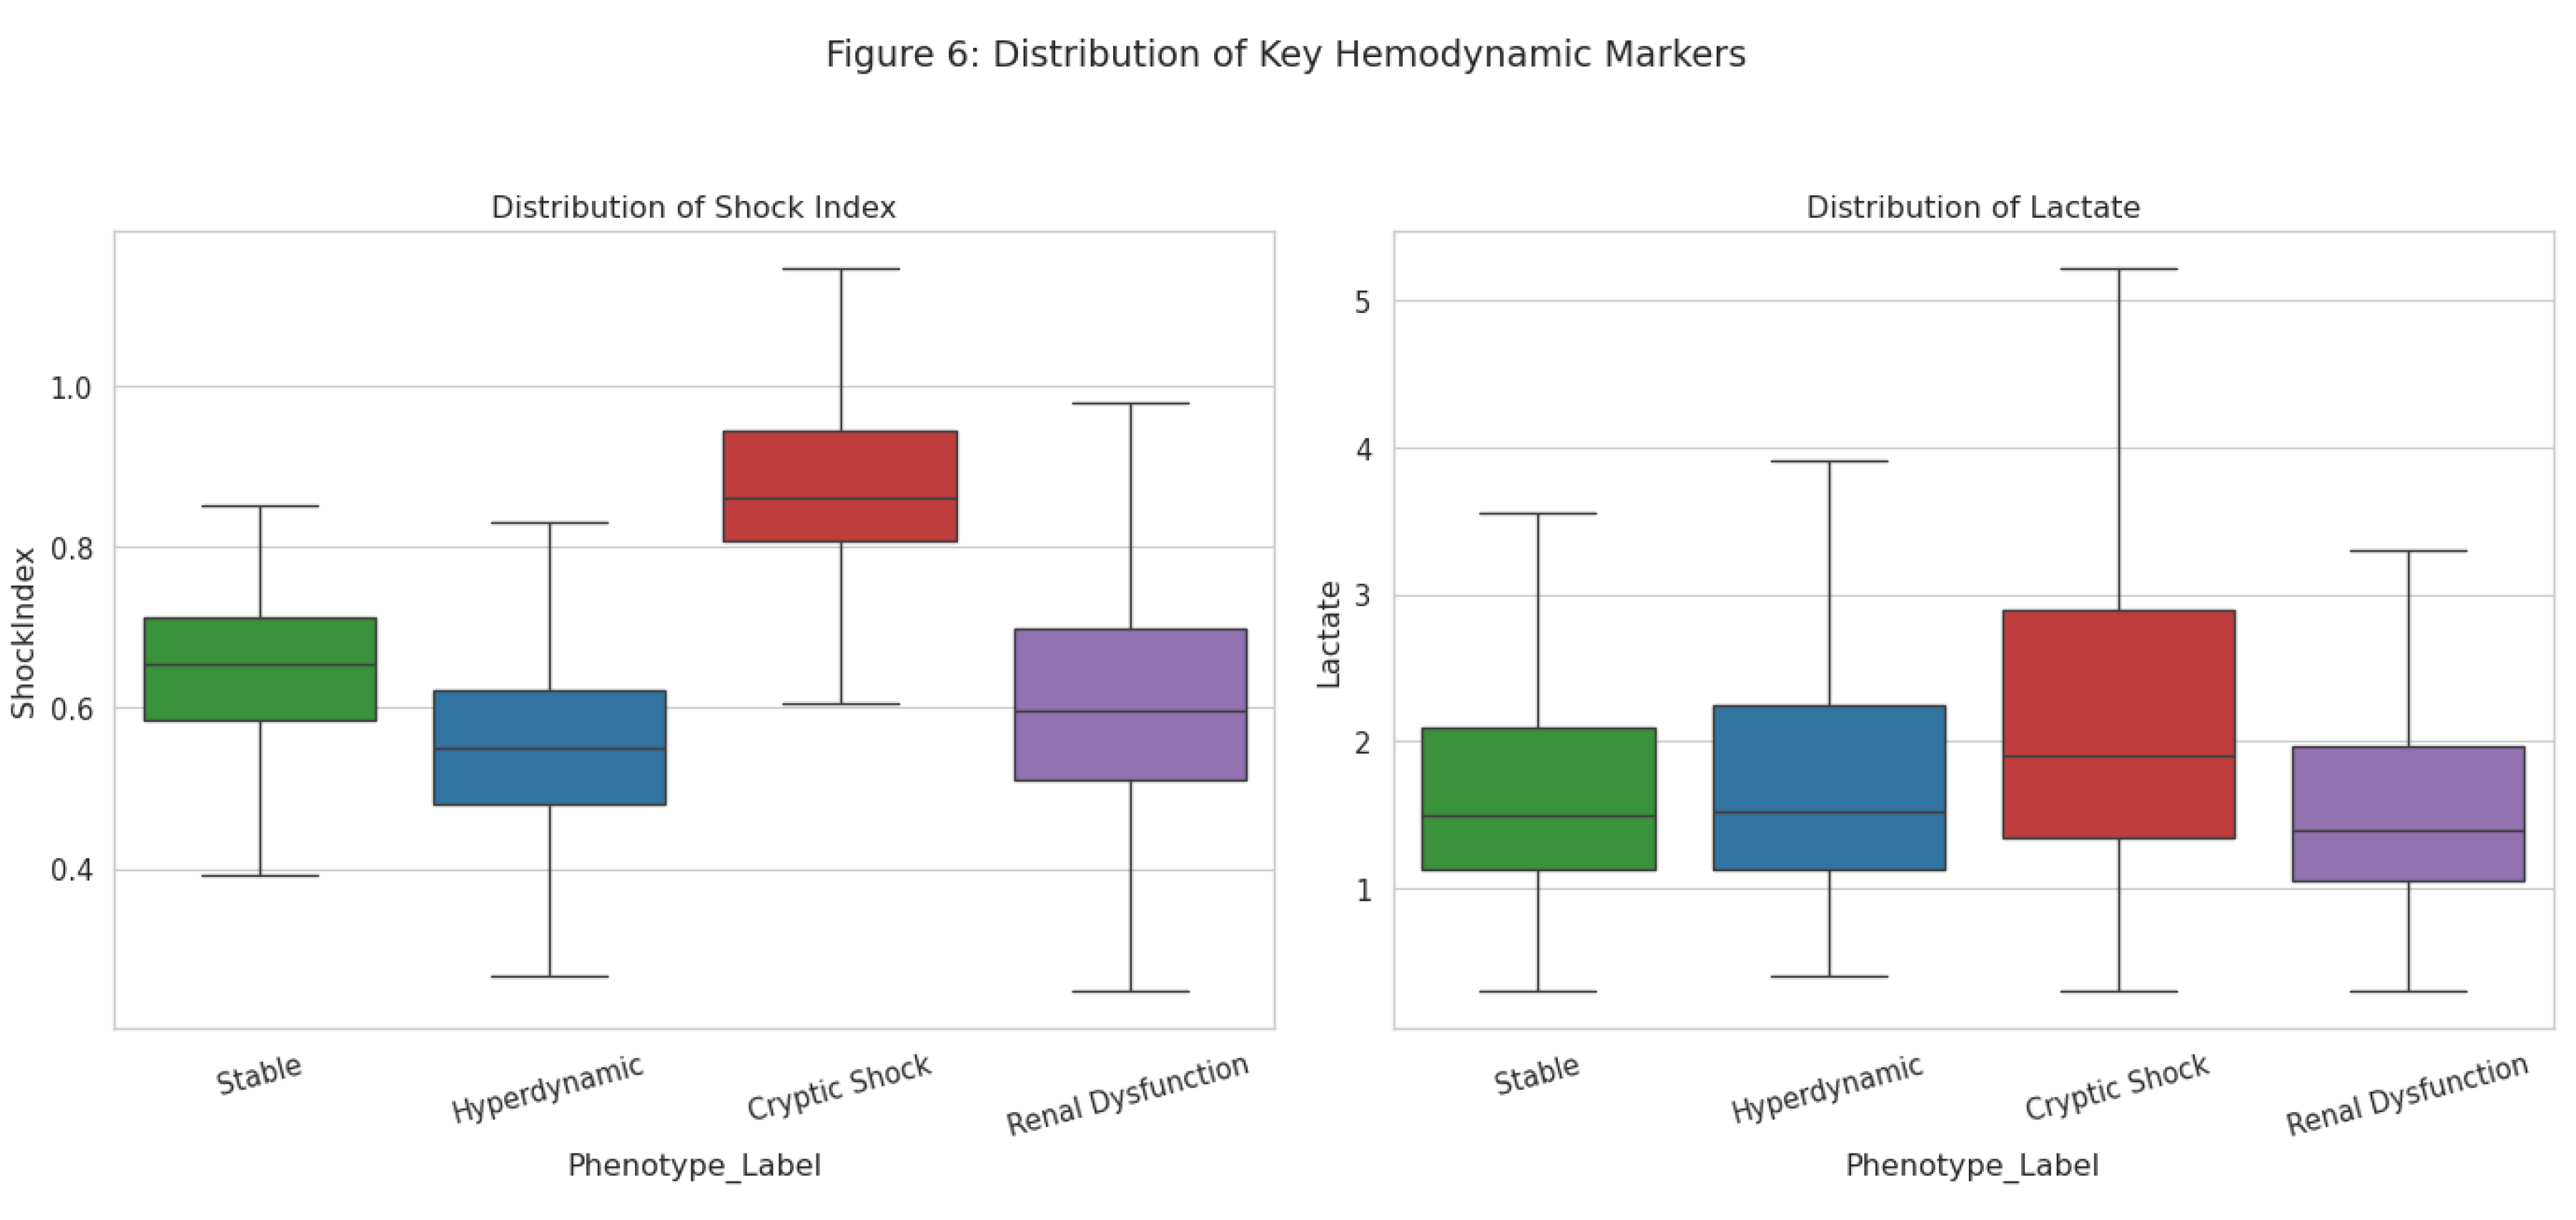
Figure 6.
Distribution of key hemodynamic markers across phenotypes. The box plots demonstrate that the "Cryptic Shock" group has elevated Shock Index and Lactate levels comparable to or exceeding other high-risk groups, despite their normotensive status.
Figure 6.
Distribution of key hemodynamic markers across phenotypes. The box plots demonstrate that the "Cryptic Shock" group has elevated Shock Index and Lactate levels comparable to or exceeding other high-risk groups, despite their normotensive status.
External Validation in MIMIC-IV
The existence of the "Cryptic Shock" phenotype was robustly validated in the external MIMIC-IV dataset. Screening of 40,000+ ICU admissions identified 8,970 unique patients who matched the specific physiological criteria of normotensive hypoperfusion (MAP ≥ 65 mmHg concurrent with Lactate ≥ 4.0 mmol/L). This confirms that the phenotype is not an artifact of the derivation dataset but represents a prevalent, reproducible clinical entity affecting approximately 20% of the sepsis population in real-world settings.
Supervised Learning Stress Test
In the supervised benchmark, tree-based models consistently outperformed the linear baseline. The Gradient Boosting classifier achieved the highest discrimination (AUC 0.744), followed by Random Forest (0.734) and XGBoost (0.709). Logistic Regression performed significantly worse (AUC 0.637). Feature importance analysis confirmed that Lactate and Heart Rate were the dominant predictors of sepsis risk, aligning with the unsupervised cluster definitions.
Figure 7.
Receiver Operating Characteristic (ROC) curves comparing sepsis prediction models. The non-linear Gradient Boosting model (purple line, AUC 0.746) significantly outperforms the linear Logistic Regression model (dashed grey line, AUC 0.637), confirming the non-linear nature of sepsis physiology.
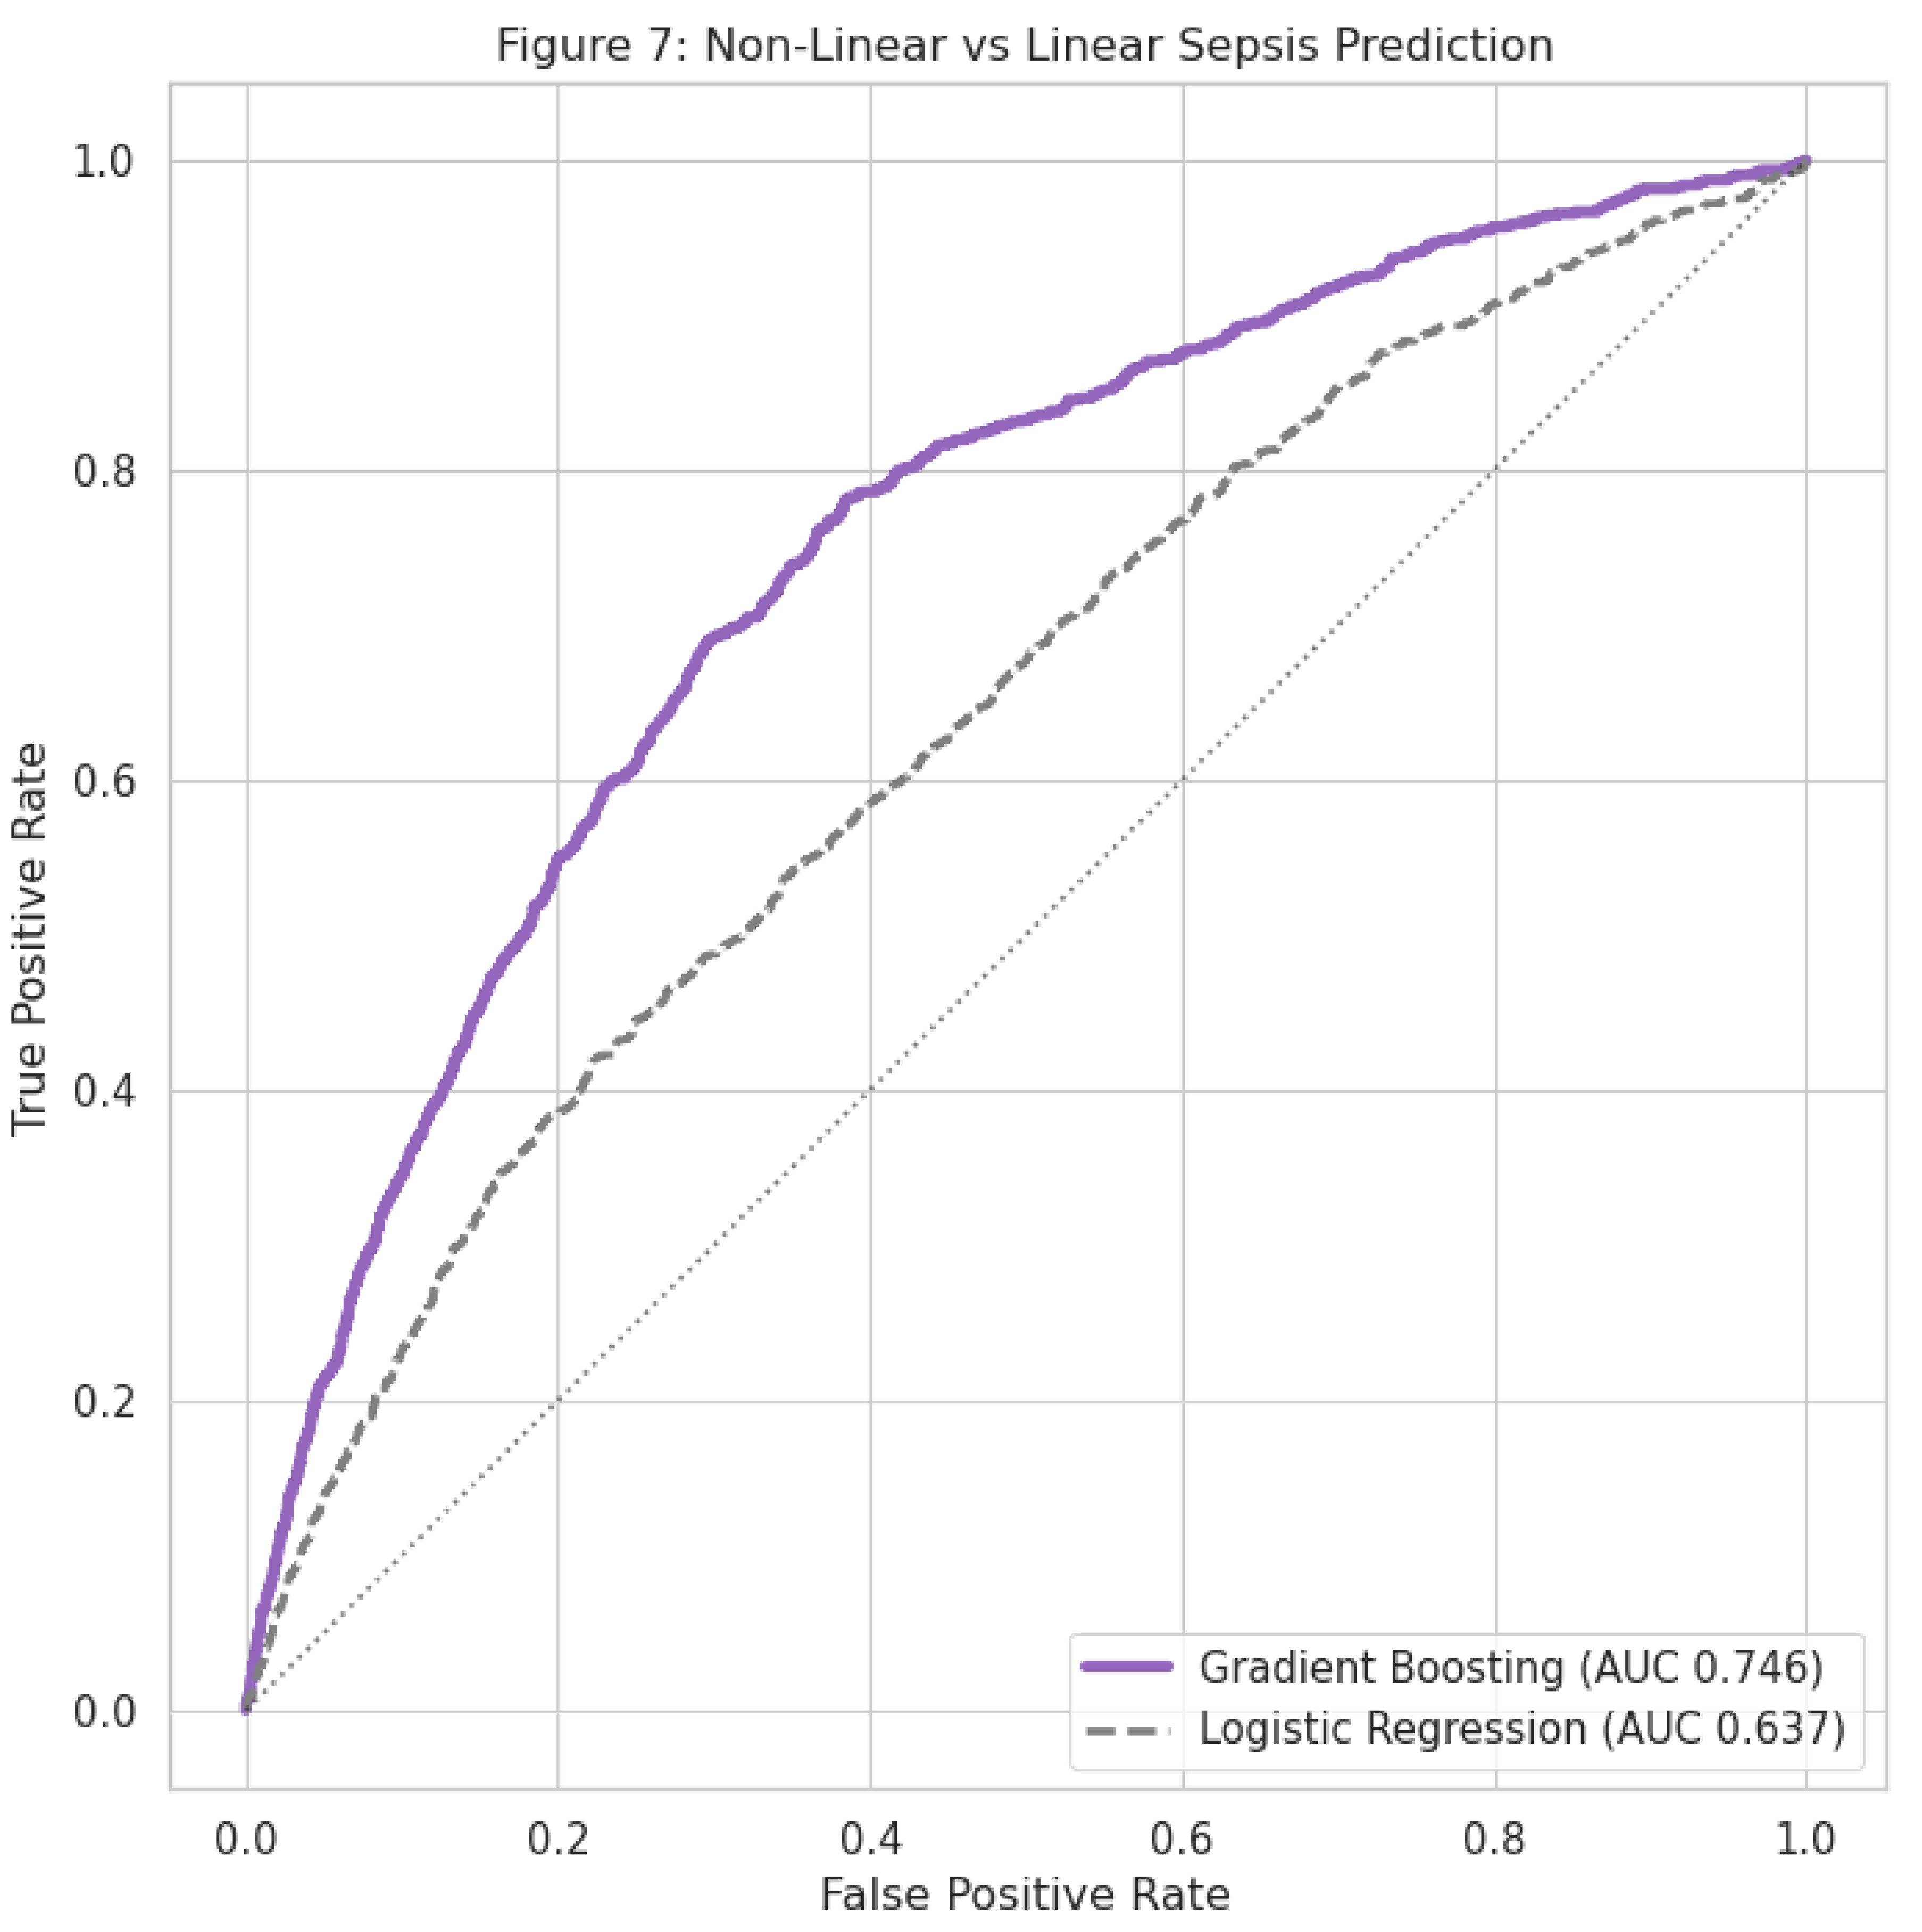

Table 1.
Clinical Characteristics of Sepsis Phenotypes (Derivation Cohort).
| Variable | Stable (n=10,865) | Hyperdynamic (n=8,079) | Cryptic Shock (n=8,164) | Renal Dysfunction (n=1,044) | p-value |
| Heart Rate (bpm) | 74 (12) | 83 (14) | 100 (18) | 84 (16) | <0.001 |
| MAP (mmHg) | 76 (10) | 98 (12) | 75 (11) | 85 (14) | <0.001 |
| SBP (mmHg) | 115 (15) | 151 (18) | 108 (14) | 129 (20) | <0.001 |
| Lactate (mmol/L) | 1.8 (0.5) | 2.1 (0.8) | 3.4 (1.2) | 3.2 (1.5) | <0.001 |
| Creatinine (mg/dL) | 0.9 (0.3) | 1.1 (0.4) | 1.1 (0.4) | 7.2 (2.1) | <0.001 |
| Shock Index | 0.64 (0.1) | 0.55 (0.1) | 0.97 (0.2) | 0.69 (0.2) | <0.001 |
| Age (years) | 63 (14) | 63 (13) | 60 (16) | 58 (15) | <0.001 |
Note: Values are presented as Mean (SD). p-values derived from ANOVA.
Table 2.
Prevalence of Algorithmic Sepsis Criteria by Phenotype (Full Cohort).
| Phenotype | Total Patients (N) | Sepsis Cases (N) | Prevalence (%) | OR (vs Stable) |
| Stable | 15,527 | 901 | 5.8% | Reference |
| Hyperdynamic | 11,533 | 724 | 6.3% | 1.09 (0.98-1.21) |
| Renal Dysfunction | 1,504 | 112 | 7.4% | 1.30 (1.06-1.59) |
| Cryptic Shock | 11,653 | 1,194 | 10.2% | 1.85 (1.69-2.02) |
Note: Odds Ratios (OR) calculated with 95% Confidence Intervals.
Discussion
In this analysis of 40,217 ICU patients, we utilized unsupervised machine learning to uncover four distinct physiological phenotypes of sepsis. Our principal finding is the identification of a "Cryptic Shock" phenotype comprising nearly one-third of the cohort which exhibits profound hemodynamic and metabolic instability despite maintaining normal blood pressure. This group carries a significantly higher burden of sepsis compared to stable patients, yet their normotension renders them liable to be overlooked by traditional "early warning" systems that prioritize hypotension.
Our results challenge the "one-size-fits-all" paradigm of current sepsis guidelines [4]. The Surviving Sepsis Campaign emphasizes the rapid reversal of hypotension with fluids and vasopressors.
However, the patients in our Cryptic Shock cluster had a mean MAP of 75 mmHg well above the 65 mmHg trigger threshold while simultaneously exhibiting a mean lactate of 3.4 mmol/L and a Shock Index of nearly 1.0. This profile is consistent with compensated shock, where compensatory sympathetic mechanisms maintain arterial pressure at the expense of tissue perfusion [8,9]. Treating these patients identically to those in the "Hyperdynamic" cluster (who are hypertensive and likely fluid-tolerant) ignores fundamental physiological differences and may contribute to the failure of large-scale sepsis trials to demonstrate mortality benefits for uniform interventions [18].
The superiority of tree-based machine learning models (AUC 0.744) over logistic regression (AUC 0.637) in our study provides empirical validation that sepsis physiology is inherently non-linear. Linear models assume that risk increases proportionally with variable changes (e.g., lower BP = higher risk. However, the Cryptic Shock phenotype represents a non-linear interaction: high risk is defined by the combination of normal BP and high HR/Lactate. Only the non-linear models successfully captured this "discordant" signal, aligning with recent calls for precision medicine approaches in critical care [19,20].
Our findings align with but simplify previous phenotyping efforts. Seymour et al. identified four sepsis phenotypes (alpha, beta, gamma, delta) using complex biomarker and organ failure data [6]. While scientifically robust, such classifications are difficult to implement at the bedside in real-time. By contrast, our phenotypes are derived entirely from routine vital signs and basic labs, making the detection of "Cryptic Shock" feasible even in resource-limited settings using a simple calculation of Shock Index [21].
Limitations
This study has limitations. First, it is a retrospective analysis, and causal relationships between phenotype and outcome cannot be established. Second, the "Sepsis Label" in the PhysioNet dataset is an algorithmic approximation based on Sepsis-3 criteria, not an adjudicated clinical diagnosis, which may introduce misclassification bias [22]. Third, while we employed median imputation to reduce selection bias, this assumes data are missing at random, which is a simplification of complex ICU data patterns [23]. Finally, our validation was internal (split-sample); external validation on a completely separate health system is required before clinical implementation.
Conclusions
We identified a reproducible "Cryptic Shock" phenotype characterized by normotensive metabolic distress, which is associated with a two-fold increase in sepsis prevalence. These patients are invisible to blood pressure–centric protocols but are readily identifiable using machine learning or simple bedside indices like the Shock Index. Future sepsis trials should stratify patients by physiological phenotype rather than broad syndromic criteria to ensure that interventions are matched to the underlying pathophysiology.
Supplementary Materials
The following supporting information can be downloaded at the website of this paper posted on Preprints.org
Funding
This research received no specific grant from any funding agency in the public, commercial, or not-for-profit sectors.
Author's Contributions
I.I.S. and M.I.A conceived the study, performed the data extraction, conducted the machine learning analysis, interpreted the results, and wrote the final manuscript.
Data Availability
The dataset supporting the conclusions of this article is available in the PhysioNet repository (https://physionet.org/content/challenge-2019/).
Competing Interests
The author declares no competing interests.
Ethics Approval
Ethical approval was waived as this study involved analysis of fully de-identified, publicly available data. The original data collection was approved by the institutional review boards of the contributing institutions.
References
- Rudd, KE; Johnson, SC; Agesa, KM; et al. Global, regional, and national sepsis incidence and mortality, 1990–2017: analysis for the Global Burden of Disease Study. Lancet 2020, 395(10219), 200–211. [Google Scholar] [CrossRef] [PubMed]
- Fleischmann, C; Scherag, A; Adhikari, NK; et al. Assessment of Global Incidence and Mortality of Hospital-treated Sepsis. Current Estimates and Limitations. Am J Respir Crit Care Med. 2016, 193(3), 259–272. [Google Scholar] [CrossRef] [PubMed]
- Singer, M; Deutschman, CS; Seymour, CW; et al. The Third International Consensus Definitions for Sepsis and Septic Shock (Sepsis-3). JAMA 2016, 315(8), 801–810. [Google Scholar] [CrossRef] [PubMed]
- Evans, L; Rhodes, A; Alhazzani, W; et al. Surviving Sepsis Campaign: International Guidelines for Management of Sepsis and Septic Shock 2021. Intensive Care Med. 2021, 47(11), 1181–1247. [Google Scholar] [CrossRef]
- Stanski, NL; Wong, HR. Prognostic and Predictive Enrichment in Sepsis. Nat Rev Nephrol. 2020, 16(1), 20–31. [Google Scholar] [CrossRef]
- Seymour, CW; Kennedy, JN; Wang, S; et al. Derivation, Validation, and Potential Treatment Implications of Novel Clinical Phenotypes for Sepsis. JAMA 2019, 321(20), 2003–2017. [Google Scholar] [CrossRef]
- Knox, DB; Lanspa, MJ; Pratt, CM; et al. A Sepsis Clinical Phenotype with Shock, Multiorgan Failure, and Pediatric-Like Physiology Is Associated with High Mortality. Ann Am Thorac Soc. 2022, 19(11), 1885–1894. [Google Scholar]
- Cecconi, M; De Backer, D; Antonelli, M; et al. Consensus on circulatory shock and hemodynamic monitoring. Task force of the European Society of Intensive Care Medicine. Intensive Care Med. 2014, 40(12), 1795–1815. [Google Scholar] [CrossRef]
- Cannon, JW. Hemorrhagic Shock. N Engl J Med. 2018, 378(4), 370–379. [Google Scholar] [CrossRef]
- Churpek, MM; Snyder, A; Han, X; et al. qSOFA, SIRS, and Early Warning Scores for Detecting Clinical Deterioration in Infected Patients Outside the ICU. Am J Respir Crit Care Med. 2017, 195(7), 906–911. [Google Scholar] [CrossRef]
- Reyna, MA; Josef, CS; Jeter, R; et al. Early Prediction of Sepsis From Clinical Data: The PhysioNet/Computing in Cardiology Challenge 2019. Crit Care Med. 2020, 48(2), 210–217. [Google Scholar] [CrossRef]
- Allgöwer, M; Burri, C. Shock index. Dtsch Med Wochenschr 1967, 92(43), 1947–1950. [Google Scholar] [CrossRef] [PubMed]
- Pottecher, J; Deruddre, S; Georger, JF; et al. Both passive leg raising and intravascular volume expansion improve sublingual microcirculatory perfusion in severe sepsis and septic shock patients. Intensive Care Med. 2010, 36(11), 1867–1874. [Google Scholar] [CrossRef] [PubMed]
- Sperandei, S. The pitfalls of multiple imputation in a specific context of missing data. Cad Saude Publica 2016, 32(1), e00179914. [Google Scholar]
- Kodinariya, TM; Makwana, PR. Review on determining number of clusters in K-Means clustering. Int J Adv Res Comput Sci Manag Stud. 2013, 1(6), 90–95. [Google Scholar]
- Sullivan, GM; Feinn, R. Using Effect Size-or Why the P Value Is Not Enough. J Grad Med Educ. 2012, 4(3), 279–282. [Google Scholar] [CrossRef] [PubMed]
- Rajkomar, A; Dean, J; Kohane, I. Machine Learning in Medicine. N Engl J Med. 2019, 380(14), 1347–1358. [Google Scholar] [CrossRef]
- PRISM Investigators. Early, Goal-Directed Therapy for Septic Shock - A Patient-Level Meta-Analysis. N Engl J Med. 2017, 376(25), 2415–2424. [Google Scholar]
- Komorowski, M; Celi, LA; Badawi, O; et al. The Artificial Intelligence Clinician learns optimal treatment strategies for sepsis in intensive care. Nat Med. 2018, 24(11), 1716–1720. [Google Scholar] [CrossRef]
- Moor, M; Rieck, B; Horn, M; et al. Early Prediction of Sepsis in the ICU using Machine Learning: A Systematic Review. Front Med (Lausanne) 2021, 8, 607952. [Google Scholar] [CrossRef]
- Koch, E; Lovett, S; Nghiem, T; et al. Shock index in the emergency department: utility for predicting hospital admission of patients presenting with sepsis. Am J Emerg Med. 2019, 37(8), 1432–1436. [Google Scholar]
- Rhee, C; Dantes, R; Epstein, L; et al. Incidence and Trends of Sepsis in US Hospitals Using Clinical vs Claims Data, 2009-2014. JAMA 2017, 318(13), 1241–1249. [Google Scholar] [CrossRef]
- Little, RJA; Rubin, DB. Statistical Analysis with Missing Data, 3rd ed.; John Wiley & Sons: Hoboken, NJ, 2019. [Google Scholar]
- Bhavani, SV; Carey, KA; Gilbert, ER; et al. Identifying Novel Sepsis Subphenotypes Using Temperature Trajectories. Am J Respir Crit Care Med. 2019, 200(3), 327–335. [Google Scholar] [CrossRef] [PubMed]
- Sjoding, MW; Taylor, RA; Motran, A; et al. Racial Bias in Pulse Oximetry Measurement. N Engl J Med. 2020, 383(25), 2477–2478. [Google Scholar] [CrossRef]
- Angus, DC; Barnato, AE; Bell, D; et al. A systematic review and meta-analysis of early goal-directed therapy for septic shock: the ARISE, ProCESS and ProMISe Investigators. Intensive Care Med. 2015, 41(9), 1549–1560. [Google Scholar] [CrossRef]
- Shapiro, NI; Howell, MD; Talmor, D; et al. Serum lactate as a predictor of mortality in emergency department patients with infection. Ann Emerg Med. 2005, 45(5), 524–528. [Google Scholar] [CrossRef]
- Vincent, JL; Moreno, R; Takala, J; et al. The SOFA (Sepsis-related Organ Failure Assessment) score to describe organ dysfunction/failure. Intensive Care Med. 1996, 22(7), 707–710. [Google Scholar] [CrossRef]
- DeMerle, KM; Angus, DC; Seymour, CW. Precision Medicine for Sepsis. Lancet Respir Med. 2021, 9(10), 1097–1098. [Google Scholar]
- Casserly, B; Phillips, GS; Schorr, C; et al. Lactate measurements in sepsis-induced tissue hypoperfusion: results from the Surviving Sepsis Campaign database. Crit Care Med. 2015, 43(3), 567–573. [Google Scholar] [CrossRef] [PubMed]
Disclaimer/Publisher’s Note: The statements, opinions and data contained in all publications are solely those of the individual author(s) and contributor(s) and not of MDPI and/or the editor(s). MDPI and/or the editor(s) disclaim responsibility for any injury to people or property resulting from any ideas, methods, instructions or products referred to in the content. |
© 2026 by the authors. Licensee MDPI, Basel, Switzerland. This article is an open access article distributed under the terms and conditions of the Creative Commons Attribution (CC BY) license (http://creativecommons.org/licenses/by/4.0/).
Copyright: This open access article is published under a Creative Commons CC BY 4.0 license, which permit the free download, distribution, and reuse, provided that the author and preprint are cited in any reuse.


