
Submitted:
18 January 2026
Posted:
19 January 2026
You are already at the latest version
Abstract
Naturally Occurring Retirement Communities Supportive Service Programs (NORC-SSPs) are one of the most popular models of aging in place. This study explored the built environment, social integration, and socio-demographic factors of older people living in NORCs in New York and their association with their health and well-being. The mixed-methods research included qualitative (interviews with NORC directors and res-idents) and quantitative (151 resident surveys and an architectural assessment) data on 26 housing developments in New York. The findings show that socialization and exercise increase NORC residents’ health and quality of life. The study also revealed that older people living in public housing have different needs than those in cooperative housing, namely, a worse perception of their health and poorer physical condition of their dwell-ings. Therefore, the focus of the services offered by NORC programs should vary according to housing type. Future research should address interventions to improve NORC residents’ physical environments.
Keywords:
older adults
; affordable housing
; aging-in-place
; mixed-methods
; health
1. Introduction
The world population is aging at an unprecedented rate. In Europe and North America, almost 19 percent of the population aged 65 and over is projected to reach one in every four persons in 2050 [1]. At the same time, urbanization is another global trend [2,3].
Additionally, research shows that most older adults prefer to remain in their homes rather than enter institutional care [4,5,6], which underscores the relevance of researching the residential environment surrounding those aging in place, since they spend most of their time at home and in their closer neighborhood [7,8,9].
Several initiatives have been developed to allow older people to age in place in cities by providing health and social services within their communities. An example could be Cohousing, which consists of private domestic spaces combined with a series of shared spaces and services managed collectively and in a participatory way [10], or Villages, where older adults remain in their homes and pay to be members of an organization that delivers services [11].
Among them, one of the most popular models is Naturally Occurring Retirement Communities Supportive Service Programs (NORC-SSPs). NORCs originated in 1986 in New York City when the UJA-Federation established the Penn South Program for Seniors (Vladeck, 2004). Penn South is a moderate-income cooperative from the 1960s with 2,820 apartments in the Chelsea neighborhood of Manhattan (Bloom & Lasner, 2016). As of January 2026, about 60 NORCs operated in four of New York City’s five boroughs, funded by its Department of Aging [12] or the New York State Office for the Aging [13]. These NORCs are primarily located in urban affordable multifamily housing developments serving low- and moderate-income older adults from various housing tenures [14]: cooperatives, public housing, and subsidized rental.
There are two types of NORCs: classic NORCs, or “vertical”, are usually located in urban high-rise housing complexes, while “horizontal” or Neighborhood NORCs (NNORCs) are mostly made up of suburban and rural low-rise housing [13]. Initially, the research focused on the former to determine how well this high-rise urban typology serves residents aging in place. However, during the data collection, the authors considered it valuable to include suburban NNORCs to explore how they compare to urban NORCs.
Research shows an association between the built environment of age-integrated urban multifamily housing and its older residents’ well-being [15,16,17]. For example, Prosper [18] established 19 safety and convenience features related to the built environment of multifamily housing developments, which positively affected older people’s well-being; while Clarke & Gallagher [19] found that a number of accessibility features were correlated with better mobility. On the contrary, other authors found associations between certain built environment features and poorer health outcomes, such as inadequate housing maintenance or environmental problems [20]. It is therefore critical to further investigate this relationship.
Since the release of the ‘Global age-friendly cities’ guide [3], which highlights the features of urban physical environments that can support older people’s well-being, many studies have explored age-friendly communities and their association with aging in place [2,9,21,22]. While most scholars [11,23,24] suggest that NORCs’ attention to the social and service environment improves their older residents’ health and quality of life, less attention has been paid to the challenge of adapting NORCs’ built environment [25], given that these complexes were not built specifically for older people. This study contributes by determining whether NORCs, examples of age-friendly communities, help older people age in place. Specifically, it analyzes the association between NORCs’ social and physical environments and residents’ well-being outcomes, offering some of the first insights into this connection.
Although some recent research has explored the built environment of New York’s NORCs and their challenges [18,25,26,27], the case studies focused on only one housing type or did not consider older people’s perspectives. Combining objective and self-rated measures is preferable because it provides a more comprehensive approach [28]. An example is Serrano-Jiménez et al. (2019), who created a method for assessing the most suitable interventions in urban residential multifamily buildings comprising an architectural technical inspection and residents’ psycho-environmental perceptions.
Recognizing differences in the built environment and demographics of cooperative housing and rentals, the analysis also compares well-being outcomes and built environment factors by housing tenure. Therefore, this study aimed to perform a cross-sectional analysis of NORCs in New York, integrating on-site inspections of the physical environment with residents’ psycho-environmental perceptions to assess whether NORCs support aging in place and to identify areas for improvement of NORCs policy and practice.
2. Materials and Methods
2.1. Research Design and Data Collection
This mixed-methods study collected quantitative and qualitative data from two primary sources between May and November 2022: architectural inspections and a survey for NORC residents. On the one hand, site visits were made to a selection of these communities (26 out of the 37 city-financed NORCs, as shown in Table 1). Open spaces were toured, buildings were accessed, and informal conversations with older residents were held to explore their satisfaction with their residential environment. An evaluation tool was adapted from the Architectural and Psycho-environmental Retrofitting Assessment Method (APRAM)’s technical inspection grid, developed by Serrano-Jiménez et al. (2019), and filled in for each visited site (see Supplementary Material 1).
The authors constructed a 34-item survey instrument for NORC residents, drawing primarily from the questionnaires developed by Chao (2016) and Pinckney and Bishop (2017) for their research about NORCs’ physical environment in New York City. Additional questions were incorporated to inquire about education, marital status, number of bedrooms, neighborhood environment, and the residents’ perception of safety and environmental quality based on the reviewed literature [7,18,20,30,31,32], including a home modifications checklist [33]. The remaining items drew from the authors’ professional experience in aging and architecture. The survey comprised 33 close-ended questions and a final open-ended question prompting additional comments or topics not previously discussed. A printable questionnaire was developed, and an online version was created on Google Forms in case it was possible to recruit participants who could not attend the survey session (see Supplementary Material 2).
The survey targeted residents aged 60 and older, aligning with eligibility requirements for NORC services [13]. There was no upper age limit, as participants capable of attending were presumed not to have significant cognitive impairments. A list of operational NORCs in New York City was retrieved from the NYC Department for the Aging’s Services Finder [34]. NORC directors were contacted via e-mail, which was obtained through NORC websites, references, or in-person visits. Eight NORCs were recruited, seven of them located in Manhattan and one in Long Island, despite outreach to NORCs in Brooklyn, the Bronx, and Queens. A total of 151 surveys were collected. Table 2 shows the NORCs where surveys were implemented and the number of surveys conducted at each center.
Survey administration varied: AGS conducted group interviews after scheduled NORC activities or by appointment in five NORCs. In two of these, NORC directors also administered surveys. In two NORCs, interviews were conducted in Spanish. In two others, residents completed surveys independently. In one case, the questionnaire was shared with the NORC director, and staff performed surveys over a month. One response was submitted online. Participation was voluntary and anonymous, with informed consent obtained verbally. The research was approved by the Ethics in Research Committee of the Universitat Politècnica de València with reference number P15_27-12-2021.
AGS also conducted semi-structured interviews with directors from the eight participating NORCs and two others where surveys were not administered, totaling ten interviews. These explored perspectives on the model’s opportunities and challenges. Sample questions included: ‘How well does the NORC work from your perspective?’ and ‘How could NORCs be improved?’ Interviews lasted 10-15 minutes, and notes were taken on key points.
2.2. Data Analysis
Survey data was evaluated using descriptive analysis to provide an overview of the sample. The study then employed multivariate regression analyses to determine which demographic, built environment, and social integration variables were associated with well-being outcomes. Table 3 describes the variables used in the regression models and their codification. Data was analyzed using Statgraphics Centurion XIX software. Following previous empirical research [27,35,36], we used two different well-being variables as our dependent variables: self-rated health and quality of life. Several sets of independent variables predicted the two dependent variables using two separate regression models. We used the same independent variables for both models, but added self-rated health as another factor influencing self-rated quality of life. Skewness statistics were calculated for both outcomes in our sample and were smaller than 1; therefore, the variables were left continuous. Missing data was addressed with simple imputation.
Conclusions about the strengths and opportunities of NORC’s built environment were extracted from the assessment of the inspection grids completed for each visited site. At the same time, common themes emerged after analyzing the interviews with the NORC directors. Our mixed-methods research followed a convergent parallel design: quantitative and qualitative data were collected simultaneously. Then, results from all data sources were integrated, and areas of convergence or divergence were discussed.
3. Results
3.1. Architectural Inspection
The analysis of technical inspection grids provided insights into the accessibility and conservation conditions of NORC communities. A prevalent issue in both cooperative and public housing was the presence of scaffolding and construction fences around sidewalks and internal pathways. These elements added a sense of insecurity and hindered directions around the developments, which were already difficult to navigate, reinforcing Chao’s (2016) observations.
Overall, accessibility to buildings was good, with ramps when the access was not step-free, except in very few cases. However, in some public housing sites, ramps were excessively steep and included multiple flights, posing challenges for individuals with limited mobility. In most cases, there were accessible itineraries for walking around the site, even though in some developments, pathways were paved with tarmac and poorly maintained with many irregularities. In hilly neighborhoods, steep slopes hindered older residents’ mobility (Figure 1), making it difficult for them to perform daily activities and socialize, according to a NORC director. A few buildings also required residents to climb steps to reach the elevators.
Lobbies were typically spacious, and entrances featured wide doors with pull/push or sliding mechanisms, especially in cooperative buildings. However, public housing lobbies often lacked adequate natural and artificial lighting. Cooperative buildings tended to have more glazed areas, but those entrances covered by scaffolding were poorly lit. Flooring in many cooperative lobbies was slippery. Although large enough to accommodate many residents, the elevators were outdated and lacked handrails. Door widths generally met U.S. accessibility standards (81 cm).
The state of conservation of the façades varied, ranging from the 1930s to the early 1970s [37]. However, for same-age developments, the façades of cooperative buildings were much better maintained. A few cooperative complexes were having their façades restored when visited. Regarding interiors, the visits showed a notably poorer maintenance at public housing developments.
Even though there were abundant trees within the developments, this was not always the case on the surrounding streets, particularly in more urbanized areas of Brooklyn and Manhattan. Seating areas were common in most developments, usually in the shade and widely used by seniors (Figure 2), with chess tables in some instances. Some neighborhoods also had benches on the sidewalks surrounding the developments. Residents maintained community gardens in many public housing complexes.
In most cases, access to services was good, on-site or within a few blocks. All surveyed developments had community rooms, and many had commercial premises. A bus stop or subway station was always on the same block. Notwithstanding, a frail resident of a public housing development in the Lower East Side stated that the bus that took him to the nearest subway station was not running anymore and that the station was too far for him.
All visited NORC centers were accessible except for two developments. These spaces were generally more spacious and brighter in cooperative buildings (Figure 3 and Figure 4). One NORC had recently renovated its premises with older people’s needs in mind. The NORC that served several developments was located on the last floor of a new building with bright and inviting facilities and an outdoor patio. However, several NORCs had columns in the middle of the activity rooms, rendering these spaces less functional (Figure 4).
3.2. Residents Survey
3.2.1. Descriptive Statistics
Before describing the regression results, we discuss the profile of the 151 NORC residents in our sample. Table 4 provides descriptive statistics on the participants. Crosstab analyses showed significant differences across housing tenure. c2 statistics indicated dependence (p-value < 0.05); therefore, characteristics for these groups were compared (see Supplementary Material 3). Interaction effects were tested in both models for housing tenure but were not significant (p-value = 0.35 and 0.10, respectively) (results available upon request). All participants provided self-reported health data, but two did not disclose their self-rated quality of life, four their age, and eight their income.
Participants were predominantly female, living alone, and older than 73. About a third was married, and all but five were retired, with no participants working full-time. Residents of cooperative housing had higher incomes and education levels than those in rentals. Over half of co-op residents earned more than $50,000 annually and had post-graduate degrees, while most rental residents earned under $20,000 and had not attended college.
The mean self-rated health score for the sample was above average (over 3), with cooperative housing residents scoring notably higher. Residents also reported above-average quality of life, with only one rating it as “poor.” Most respondents reported health changes since moving, with mobility issues being the most common (66.3%, n = 69), followed by vision (39.4%, n = 41) and balance problems (33.7%, n = 35) (full report of health issues available upon request).
The study found strong social integration, with over half of the participants living in their homes for over 15 years. 98% (n = 146) reported that it is somewhat or very important to stay in their homes as they aged, and only two residents expressed no desire to stay. Additionally, most agreed that NORC programs helped them age in place. About half of the residents reported moderate support from NORC programs, with a third stating they were invaluable.
NORC participants preferred to spend their day in their apartment, followed by their neighborhood. They engaged in social and physical activities more than once a week, with social work and recreational services being the most frequently used NORC programs. However, social interactions were impacted by the COVID-19 pandemic, resulting in respondents having visitors, visiting friends, and attending NORC events between once or twice a month and once a week.
NORC participants lived in apartments with an average of 1.30 bedrooms, with cooperative housing residents occupying slightly larger apartments. Respondents reported above-average home architecture. Cooperative residents rated their apartments’ condition and aesthetics higher, but both groups reported similar environmental comfort, likely due to street noise in some areas.
Both groups experienced difficulties performing daily tasks and navigating their apartment, building complex, and neighborhood. Cooperative residents had fewer mobility issues in their apartments and building complex; however, both groups have similar mobility around the neighborhood, which could be expected given that both housing types are located in the same neighborhoods, often adjacent.
About half of the participants (n = 72) identified physical challenges in their apartments, with windows (8.6%, n = 13) and temperature control (5.3%, n = 8) being the most common problems. These two issues seem related, given that five participants who identified controlling temperature as a challenge also had problems opening windows. Several residents from public housing (8.6%, n = 13) reported challenges with elevators. Some participants had difficulty reaching bottom or high cabinets. Approximately 25% had made home modifications, with handrails and grab bars being the most common adjustments (n = 26), followed by non-slip surfaces (n = 5) and increased lighting (n = 3) (full reports of challenging features and modifications available upon request).
Residents generally felt moderately safe in both their building complexes and neighborhoods. Cooperative residents reported higher safety ratings in their buildings (i.e., 4 or 5 ratings) due to security measures, and felt notably safer in their buildings than in surrounding neighborhoods. In contrast, public housing residents reported little difference between perceived safety in their buildings and neighborhoods.
Neighborhood environmental pollution was rated as average by most NORC residents. However, the cooperative group rated it relatively lower than those living in rentals, with about half of the respondents giving it a below-average score. This lower score is due, to some extent, to the fact that a surveyed cooperative development was placed in a very noisy neighborhood; therefore, over half of the respondents rated environmental quality as “poor”. Furthermore, the only residents who rated the neighborhood’s environmental quality as “excellent” were living in the suburban NORC, which is explained by the fact that this group perceives less pollution and noise since these areas are less congested and densely populated than the city.
Open-ended responses revealed that cooperative housing residents frequently complained about street noise, lack of safety, traffic, construction, garbage, and pollution, while others praised the NORC community. For example, the Board President of one of these communities, who had lived there for over 20 years, noted, “This community has benefited greatly from the advice, suggestions, and programs offered by NORC staff”. On the other hand, in public housing, residents mainly complained about maintenance issues, like heating, hot water, refrigerators, or painting. However, a few in the subsidized rental community stated how much they loved their community. One example came from a single woman in her late 60s who described her quality of life as “excellent”: “I have never loved living in any other place than in this community. It’s my favorite place to live” (answers in full available upon request).
3.2.2. Regression Models: Well-Being Outcomes
Our study included two regression models, estimating predictors of self-rated health and self-rated quality of life. Different demographic, socialization, and built environment factors were included as independent variables to determine their influence on residents’ well-being, controlling for the specific NORC attended. Upon conducting diagnostics for highly correlated variables, we identified several sets of independent variables with correlation coefficients above 0.60 (see Supplementary Material 4), which were excluded from the regression analysis to avoid redundancy. Across both models, the most consistent predictor of positive well-being outcomes was social or physical activity frequency, as shown in Table 5. Residents who engaged more frequently in exercise or socialization reported better self-rated health (p < 0.01) and quality of life (p < 0.05).
Model 1 is an OLS regression estimating self-reported health. It found that female NORC residents rated their health nearly a third of a point higher than males. Increased exercise or socialization frequency improved self-reported health by 0.21 points. Better apartment mobility and physical conditions were positively associated with health, while health changes negatively impacted health ratings, with a decline of 0.38 points. Differences across NORCs were also noted, with residents in a cooperative community reporting poorer health, possibly due to neighborhood environmental quality issues. The R-square value for this model indicates that it explains 56% of the variability in self-rated health.
Model 2 is another OLS regression predicting self-rated quality of life. The strongest predictor was self-reported health: each point increase in self-rated health increased quality of life by 0.37 points. Residents who socialized more often, had better mobility, and lived in neighborhoods with better environmental quality also reported higher quality of life, aligning with Choi (2020). Socializing more often increased quality of life by 0.16 points. Surprisingly, age had a positive association with quality of life, likely because older adults, controlling for health, value the ability to age in place. The R-square value for this model was 0.66, indicating it has stronger explanatory power than the first model. Another model was tested without including self-rated health as an explanatory variable, but it was discarded because its R-square value was significantly lower (R2 = 0.58) (results available upon request).
3.3. Interviews with the NORC Directors
Semi-structured interviews revealed several key themes. NORC directors view these programs as beneficial, fostering community spirit. They noted that high-rise buildings aid in service delivery. However, some older residents show mistrust toward service organizations. Additionally, maintenance issues are a common complaint in public housing.
In the studied NNORC, challenges differ from those of urban NORCs. Despite well-maintained housing in a safe, quiet area, many residents have low incomes and cannot afford private care. Subsidized caregivers are scarce due to the area’s remote location and high transportation costs. Additionally, limited public transit restricts access to essential services.
4. Discussion
This study is the first to survey NORC residents from various housing tenures and to perform multivariate correlations of self-reported health and a built environment assessment at different scales, combined with interviews with program directors to incorporate supplemental insights.
Demographic results revealed an older population compared to Chao’s (2016) study, with many more retired residents, likely due to aging in place. This age difference may explain the lower self-reported health rates in our 2022 survey. Residents reported reduced socialization and a greater preference for staying home, possibly associated with ongoing concerns about COVID-19. However, Chao’s participants had lived in their apartments longer, possibly reflecting a growing trend of choosing these communities for retirement.
Fewer residents reported health changes compared to Pinckney and Bishop (2017). While more cited mobility issues, fewer experienced vision problems. Apartment challenging features (i.e., cabinets, windows, temperature) were consistent with earlier studies. Home modifications were also comparable to Chao’s (2016) findings, with grab bars being the most common adjustment, as also noted by Pinckney and Bishop (2017).
Quantitative data revealed that cooperative housing residents had higher education and income levels and better housing conditions, factors not previously assessed in NORCs studies. They also reported greater mobility within their homes and building complexes, likely due to their ability to afford home repairs and improvements. Despite these differences, all participants valued aging in place, which aligned with Pinckney and Bishop’s (2017) but diverged from Chao’s (2016) results. They also agreed that NORCs supported this goal, affirming Chao’s (2016) findings. However, mobility rates were much lower, possibly because of the older population and ongoing construction in many surveyed sites.
Surveys and resident interviews revealed that public housing residents expressed more concerns about safety, a factor not previously quantified but aligning with Chao’s (2016) qualitative findings. This fear is supported by NYPD data [38], which reported that 16% of all shootings in New York happened in public housing developments, even though they only comprised 4% of the city’s population [39]. Additionally, interviews revealed complaints about street noise and neighborhood pollution across income levels, issues not previously explored in NORC research.
Regression analyses indicated that better health correlates with improved quality of life, suggesting enhanced health services in NORCs could benefit residents. Socialization and physical activity also positively influenced well-being, supporting the need for NORC programs to offer various social and exercise opportunities. Our findings align with Zlotnick [27] and Choi (2020), but also emphasize the role of environmental factors in health outcomes.
Gender also influenced residents’ self-reported health, with males reporting lower rates, which confirms Choi’s (2020) findings and highlights the need for targeted health services. Improved neighborhood environmental quality was associated with higher quality of life, as Fernández-Carro et al. (2015) suggested. Measures should accordingly be introduced to reduce noise, pollution, and garbage. Better mobility in apartments and their physical condition also correlated with improved self-rated health, supporting Fernández-Carro et al. (2015)’s findings and underscoring the need for in-home architectural assessments, as Chao (2016) suggested, to adapt the apartments to residents’ limitations, particularly in public housing. However, our quantitative and qualitative findings about the challenges of navigating specific neighborhoods dispute Chao’s (2016) observations about neighborhood accessibility.
Crosstab analyses and interviews confirmed that public housing residents face unique challenges compared to cooperative residents, suggesting that NORC program services should be tailored accordingly. For example, strengthening health services in public housing NORCs could eventually improve residents’ quality of life.
4.1. Strengths and Weaknesses of NORC-SSPs
Our built environment assessment revealed that while many physical features of these affordable housing complexes support aging in place, others pose challenges for older residents, be it slippery floors, lack of handrails, or construction works. Nonetheless, these developments, designed to a high standard for their time [35], have aged mainly well. Architectural scans showed that most buildings offer step-free access, wide elevators, and bright, spacious apartments. Residents also benefit from on-site community rooms for socializing, exercising, and participating in NORC activities, as well as gardens and ample and widely used seating areas. These observations contradict Chao’s (2016) findings about the scarcity of inviting areas.
Quantitative data supports these findings. Despite mobility limitations, older adults attending NORC programs frequently engage in social and physical activities. Surveys showed above-average ratings for health, quality of life, home environment, mobility, and safety. In the surveys and interviews, residents also credited NORC services with helping them age in place considerably. These reasons suggest that NORCs are a successful aging-in-place model and contribute to their residents’ well-being, and the advantages that NORCs entail seem to outweigh possible challenges.
Nevertheless, areas for improvement remain. The architectural scans showed permanent scaffolding in many developments, often without active construction, which should be removed. In public housing, NORC staff should find ways to coordinate with NYCHA to address maintenance issues, one of the main complaints of residents and NORC directors, aligning with Chao’s (2016) findings. Surveys and resident interviews revealed that safety is a major issue in public housing developments, requiring enhanced security measures. Built environment assessments suggest that accessibility improvements could help older residents better navigate and enjoy shared spaces. Additionally, NORC directors emphasized the need to improve program outreach and build trust among residents. Regarding suburban NORCs, enhanced public transportation and more funding for public caregivers are needed.
Overall, findings from both quantitative and qualitative analyses confirm and extend previous research, offering new insights into how NORC’s architecture influences residents’ well-being and providing a quantitative tool to evaluate NORC effectiveness and measure the quality of life for those aging in place, which fills a gap in the literature [2,24,40] and advances research such as Prosper (2004).
4.2. Limitations
All recruited NORCs from New York City were in Manhattan, limiting generalizability to other boroughs. Most respondents came from higher-income cooperative housing, while three-quarters of responses came from public housing, possibly biasing results. Analyzing outcomes by housing tenure may have reduced this bias.
80% of participants were women, suggesting men might be underrepresented but aligning with Chao’s (2016) findings and with demographic data: almost 60 percent of New Yorkers over 65 were women [41], while in public housing, 70% of households with head over 62 were female-led [39].
The sample was not entirely random: residents who did not attend NORC activities or had decreased mobility were excluded from the study, possibly skewing mobility levels. The study did not compare its demographic data with the broader population of people over 60 in these developments, making the sample’s representativeness unclear. Future studies should use more representative sampling methods and include a control group of older people not living in NORCs to properly assess the program’s impact on residents’ well-being.
5. Conclusions
Our cross-sectional study was among the first to examine the built environment, well-being, and social integration of older people residing in NORCs before the end of the COVID-19 pandemic, comparing cooperative and rental communities, while determining the association between environmental factors and health outcomes. Future research should explore design opportunities to improve older residents’ well-being in NORCs and evaluate how this initiative, already successfully tested in other states, could be replicated internationally [23,42,43,44].
Supplementary Materials
The following supporting information can be downloaded at the website of this paper posted on Preprints.org.
Author Contributions
Conceptualization, A.G., A.T. and J.L.; methodology, A.G.; validation, A.T. and J.L.; formal analysis, A.G.; investigation, A.G.; resources, A.G.; writing—original draft preparation, A.G.; writing—review and editing, A.T. and J.L.; visualization, A.G.; supervision, A.T. and J.L.; funding acquisition, A.G. All authors have read and agreed to the published version of the manuscript.
Funding
This research was funded by UNIVERSITAT POLITÈCNICA DE VALÈNCIA, Mobility Grant for PhD students, call 2022. The APC was funded by UNIVERSITAT POLITÈCNICA DE VALÈNCIA.
Institutional Review Board Statement
The study was conducted in accordance with the Declaration of Helsinki, and approved by the Ethics Committee of UNIVERSITAT POLITÈCNICA DE VALÈNCIA (protocol code P15_26-12-2021, approval date: 30 January 2022).
Informed Consent Statement
Informed consent was obtained from all subjects involved in the study.
Data Availability Statement
The data supporting this study’s findings are available from the corresponding author upon reasonable request.
Acknowledgments
The authors are greatly appreciative of the NORC directors and the older adults who participated in this study.
Conflicts of Interest
The authors declare no conflicts of interest. The funders had no role in the design of the study; in the collection, analyses, or interpretation of data; in the writing of the manuscript; or in the decision to publish the results.
References
- United Nations Department of Economic and Social Affairs Population Division. World Population Prospects 2022; 2022.
- Steels, S. Key characteristics of age-friendly cities and communities: A review. Cities 2015, 47, 45–52.
- World Health Organization. Global age-friendly cities: A guide; Geneva, Switzerland, 2007.
- American Association of Retired Persons. Aging in place: A State Survey of Livability Policies and Practices; Washington, DC, USA, 2017.
- Jayantha, W.M.; Qian, Q.K.; Yi, C.O. Applicability of “Aging in Place” in redeveloped public rental housing estates in Hong Kong. Cities 2018, 83, 140–151.
- Vasunilashorn, S.; Steinman, B.A.; Liebig, P.S.; Pynoos, J. Aging in Place: Evolution of a Research Topic Whose Time Has Come. J. Aging Res. 2012, 2012, 1–6.
- Burton, E.J.; Mitchell, L.; Stride, C.B. Good places for ageing in place: Development of objective built environment measures for investigating links with older people’s wellbeing. BMC Public Health 2011, 11, 839.
- Greenfield, E.A.; Oberlink, M.; Scharlach, A.E.; Neal, M.B.; Stafford, P.B. Age-friendly community initiatives: Conceptual issues and key questions. Gerontologist 2015, 55, 191–198.
- Scharlach, A.E.; Lehning, A.J. Ageing-friendly communities and social inclusion in the United States of America. Ageing Soc. 2013, 33, 110–136.
- García Lantarón, H. Vivienda para un envejecimiento activo: El paradigma danés. Universidad Politécnica de Madrid, 2015.
- Greenfield, E.A.; Scharlach, A.; Lehning, A.J.; Davitt, J.K. A conceptual framework for examining the promise of the NORC program and Village models to promote aging in place. J. Aging Stud. 2012, 26, 273–284.
- NYC Department for the Aging. Naturally Occurring Retirement Communities. Available online: https://www.nyc.gov/site/dfta/services/naturally-occurring-retirement-communities.page (accessed on 13 April 2024).
- NYS Office for the Aging. Naturally Occurring Retirement Community (NORC). Available online: https://aging.ny.gov/naturally-occurring-retirement-community-norc (accessed on 13 April 2024).
- Vladeck, F. Good place to grow old: New York’s model for NORC supportive service programs; New York, NY, USA, 2004.
- García Sánchez, A.; Torres Barchino, A. The Influence of the Built Environment on the Quality of Life of Urban Older Adults Aging in Place: A Scoping Review. J. Aging Environ. 2024, 38, 398–424.
- Zhang, F.; Li, D.; Ahrentzen, S.; Feng, H. Exploring the inner relationship among neighborhood environmental factors affecting quality of life of older adults based on SLR–ISM method. J. Hous. Built Environ. 2020, 35, 215–242.
- Herbers, D.J.; Mulder, C.H. Housing and subjective well-being of older adults in Europe. J. Hous. Built Environ. 2017, 32, 533–558.
- Prosper, V. Aging in place in multifamily housing. Cityscape 2004, 7, 81–106.
- Clarke, P.; Gallagher, N.A. Optimizing mobility in later life: The role of the urban built environment for older adults aging in place. J. Urban Heal. 2013, 90, 997–1009.
- Fernández-Carro, C.; Módenes, J.A.J.A.; Spijker, J. Living conditions as predictor of elderly residential satisfaction. A cross-European view by poverty status. Eur. J. Ageing 2015, 12, 187–202.
- Greenfield, E.A. Healthy aging and age-friendly community initiatives. Public Policy Aging Rep. 2015, 25, 43–46.
- Temelová, J.; Slezáková, A. The changing environment and neighbourhood satisfaction in socialist high-rise panel housing estates: The time-comparative perceptions of elderly residents in Prague. Cities 2014, 37, 82–91.
- Guo, K.L.; Castillo, R.J. The U.S. long term care system: development and expansion of naturally occurring retirement communities as an innovative model for aging in place. Ageing Int. 2012, 37, 210–227.
- Vladeck, F.; Altman, A. The Future of the NORC-Supportive Service Program Model. Public Policy Aging Rep. 2015, 25, 20–22.
- Chao, C. Planning for the Unplanned Aging Community. Columbia University, 2016.
- Pinckney, S.D.; Bishop, M.L. Design for the Aging in Place Community: Re-Imagining the Older New York City Apartment Dwelling in Naturally Occurring Retirement Communities. State University of New York, 2017.
- Zlotnick, M. Adapting for the senior population: An Examination of the Naturally Occurring Retirement Community [NORC] A Case Study. State University of New York, 2013.
- Garin, N. et al. Built environment and elderly population health: A comprehensive literature review. Clin. Pract. Epidemiol. Ment. Heal. 2014, 10, 103–115.
- Serrano-Jiménez, A.; Lima, M.L.; Molina-Huelva, M.; Barrios-Padura, Á. Promoting urban regeneration and aging in place: APRAM – An interdisciplinary method to support decision-making in building renovation. Sustain. Cities Soc. 2019, 47, 101505.
- Oswald, F.; Jopp, D.; Rott, C.; Wahl, H.W. Is aging in place a resource for or risk to life satisfaction?. Gerontologist 2011, 51, 238–250.
- Wang, Z.; Shepley, M.M.C. Can aging-in-place be promoted by the built environment near home for physical activity: A case study of non-Hispanic White elderly in Texas. J. Hous. Built Environ. 2018, 33, 749–766.
- Fernández-Mayoralas Fernández, G.; Rojo Pérez, F.; Pozo Rivera, E.P. Residential environment of the elderly people living in Madrid | El entorno residencial de los mayores en Madrid. Estud. Geogr. 2002, 63, 619–654.
- Welti, L.M. et al. Patterns of home environmental modification use and functional health: The women’s health initiative. Journals Gerontol. Ser. A 2020, 75, 2119–2124.
- NYC Department for the Aging. DFTA Senior Services Results Page: NORCs. Available online: https://a125-egovt.nyc.gov/AgingService/ProgramService/searchResult?programType=NORC (accessed on 8 February 2024).
- Choi, Y.J. Age-friendly features in home and community and the self-reported health and functional limitation of older adults: The role of supportive environments. J. Urban Heal. 2020, 97, 471–485.
- Mercader-Moyano, P.; Flores-García, M.; Serrano-Jiménez, A. Housing and neighbourhood diagnosis for ageing in place: Multidimensional Assessment System of the Built Environment (MASBE). Sustain. Cities Soc. 2020, 62,.
- Bloom, N.D.; Lasner, M.G. Affordable housing in New York: the people, places, and policies that transformed a city; Princeton University Press: Princeton, NJ, USA and Oxford, UK, 2016.
- NYPD. City Wide Crime Stats. Available online: https://www.nyc.gov/site/nypd/stats/crime-statistics/citywide-crime-stats.page (accessed on 2 July 2024).
- NYCHA. Resident Data Book Summary 2022; 2022.
- Jian, I.Y.; Mo, K.H.; Ng, E.; Chen, W.; Jim, C.Y.; Woo, J. Age-friendly spatial design for residential neighbourhoods in a compact city: Participatory planning with older adults and stakeholders. Habitat Int. 2025, 161, 103428.
- U.S. Census Bureau. 2018-2022 American Community Survey 5-year Estimates. Available online: https://www.census.gov/acs/www/data/data-tables-and-tools/narrative-profiles/2022/report.php?geotype=place&state=36&place=51000 (accessed on 10 May 2024).
- Greenfield, E.A. An overview of Naturally Occurring Retirement Community Supportive Services Programs in New Jersey; 2011.
- Cohen-Mansfield, J.; Dakheel-Ali, M.; Frank, J.K. The impact of a naturally occurring retirement communities service program in Maryland, USA. Health Promot. Int. 2010, 25, 210–220.
- Enguidanos, S.; Pynoos, J.; Siciliano, M.; Diepenbrock, L.; Alexman, S. Integrating community services within a NORC: The Park La Brea experience. Cityscape A J. Policy Dev. Res. 2010, 12, 29–45.
Figure 1.
Step-free access to a cooperative building in Manhattan on a street with a pronounced slope.
Figure 1.
Step-free access to a cooperative building in Manhattan on a street with a pronounced slope.
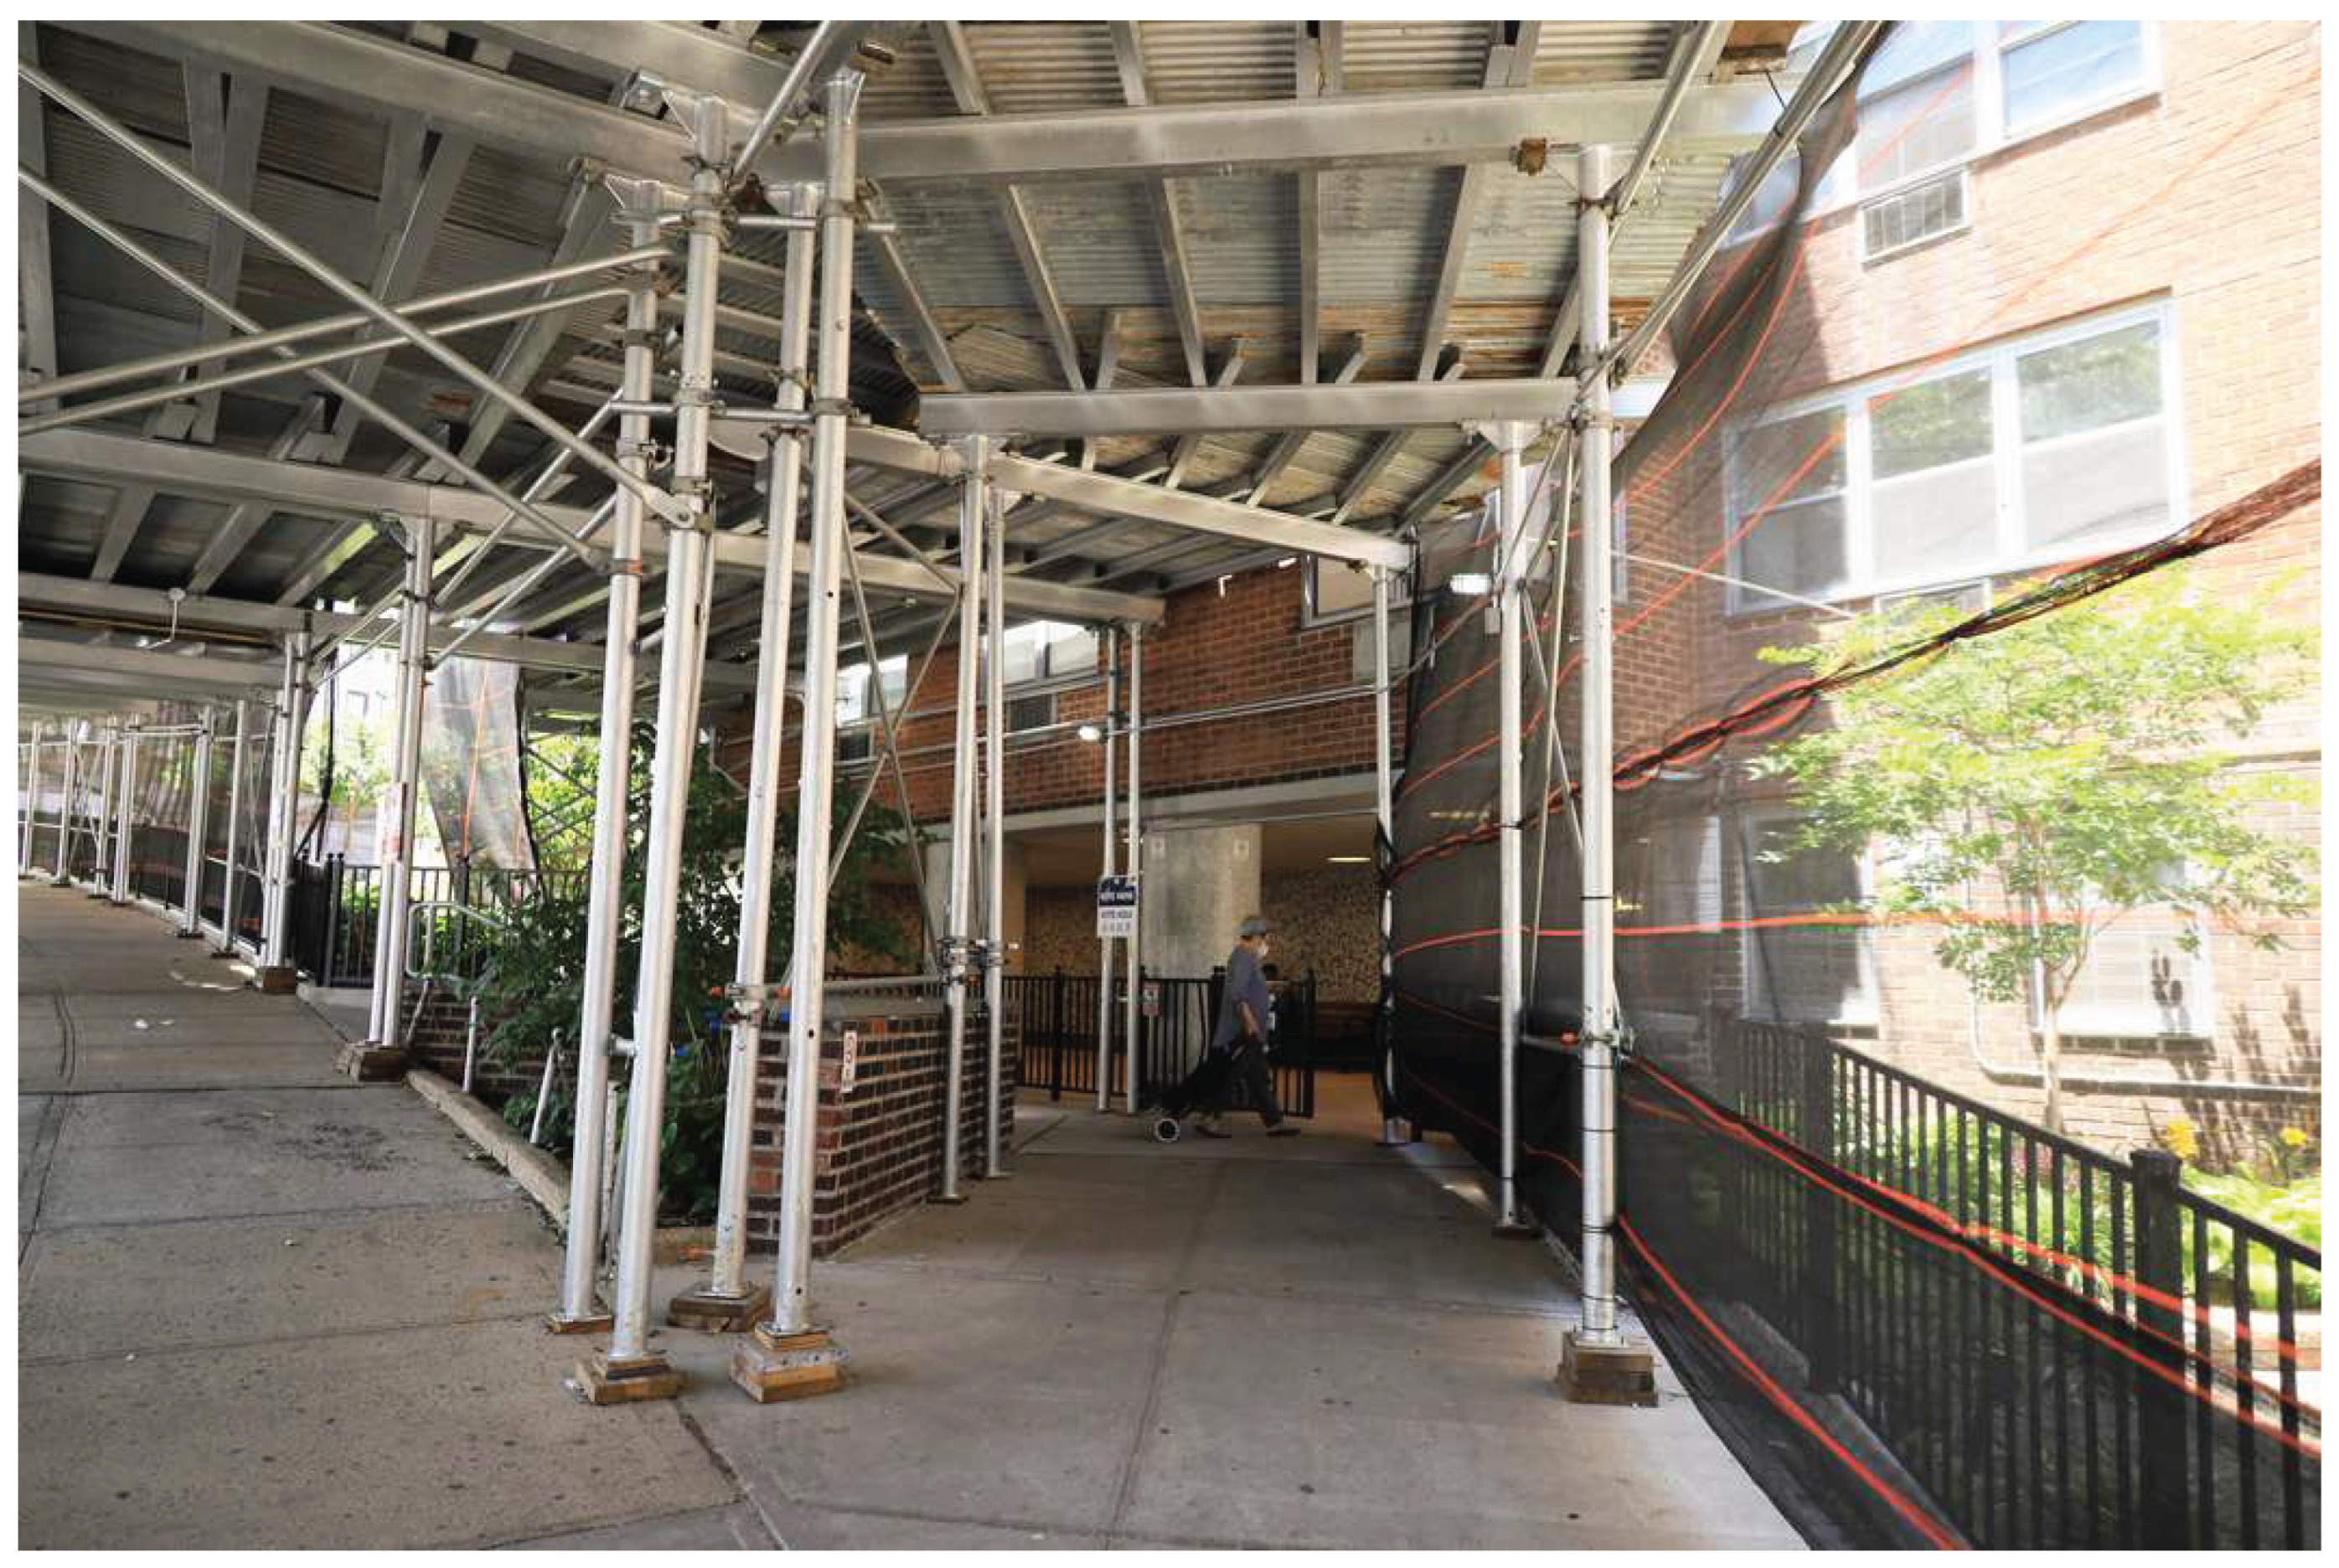
Figure 2.
Older residents at the seating areas of a public housing development in Queens.
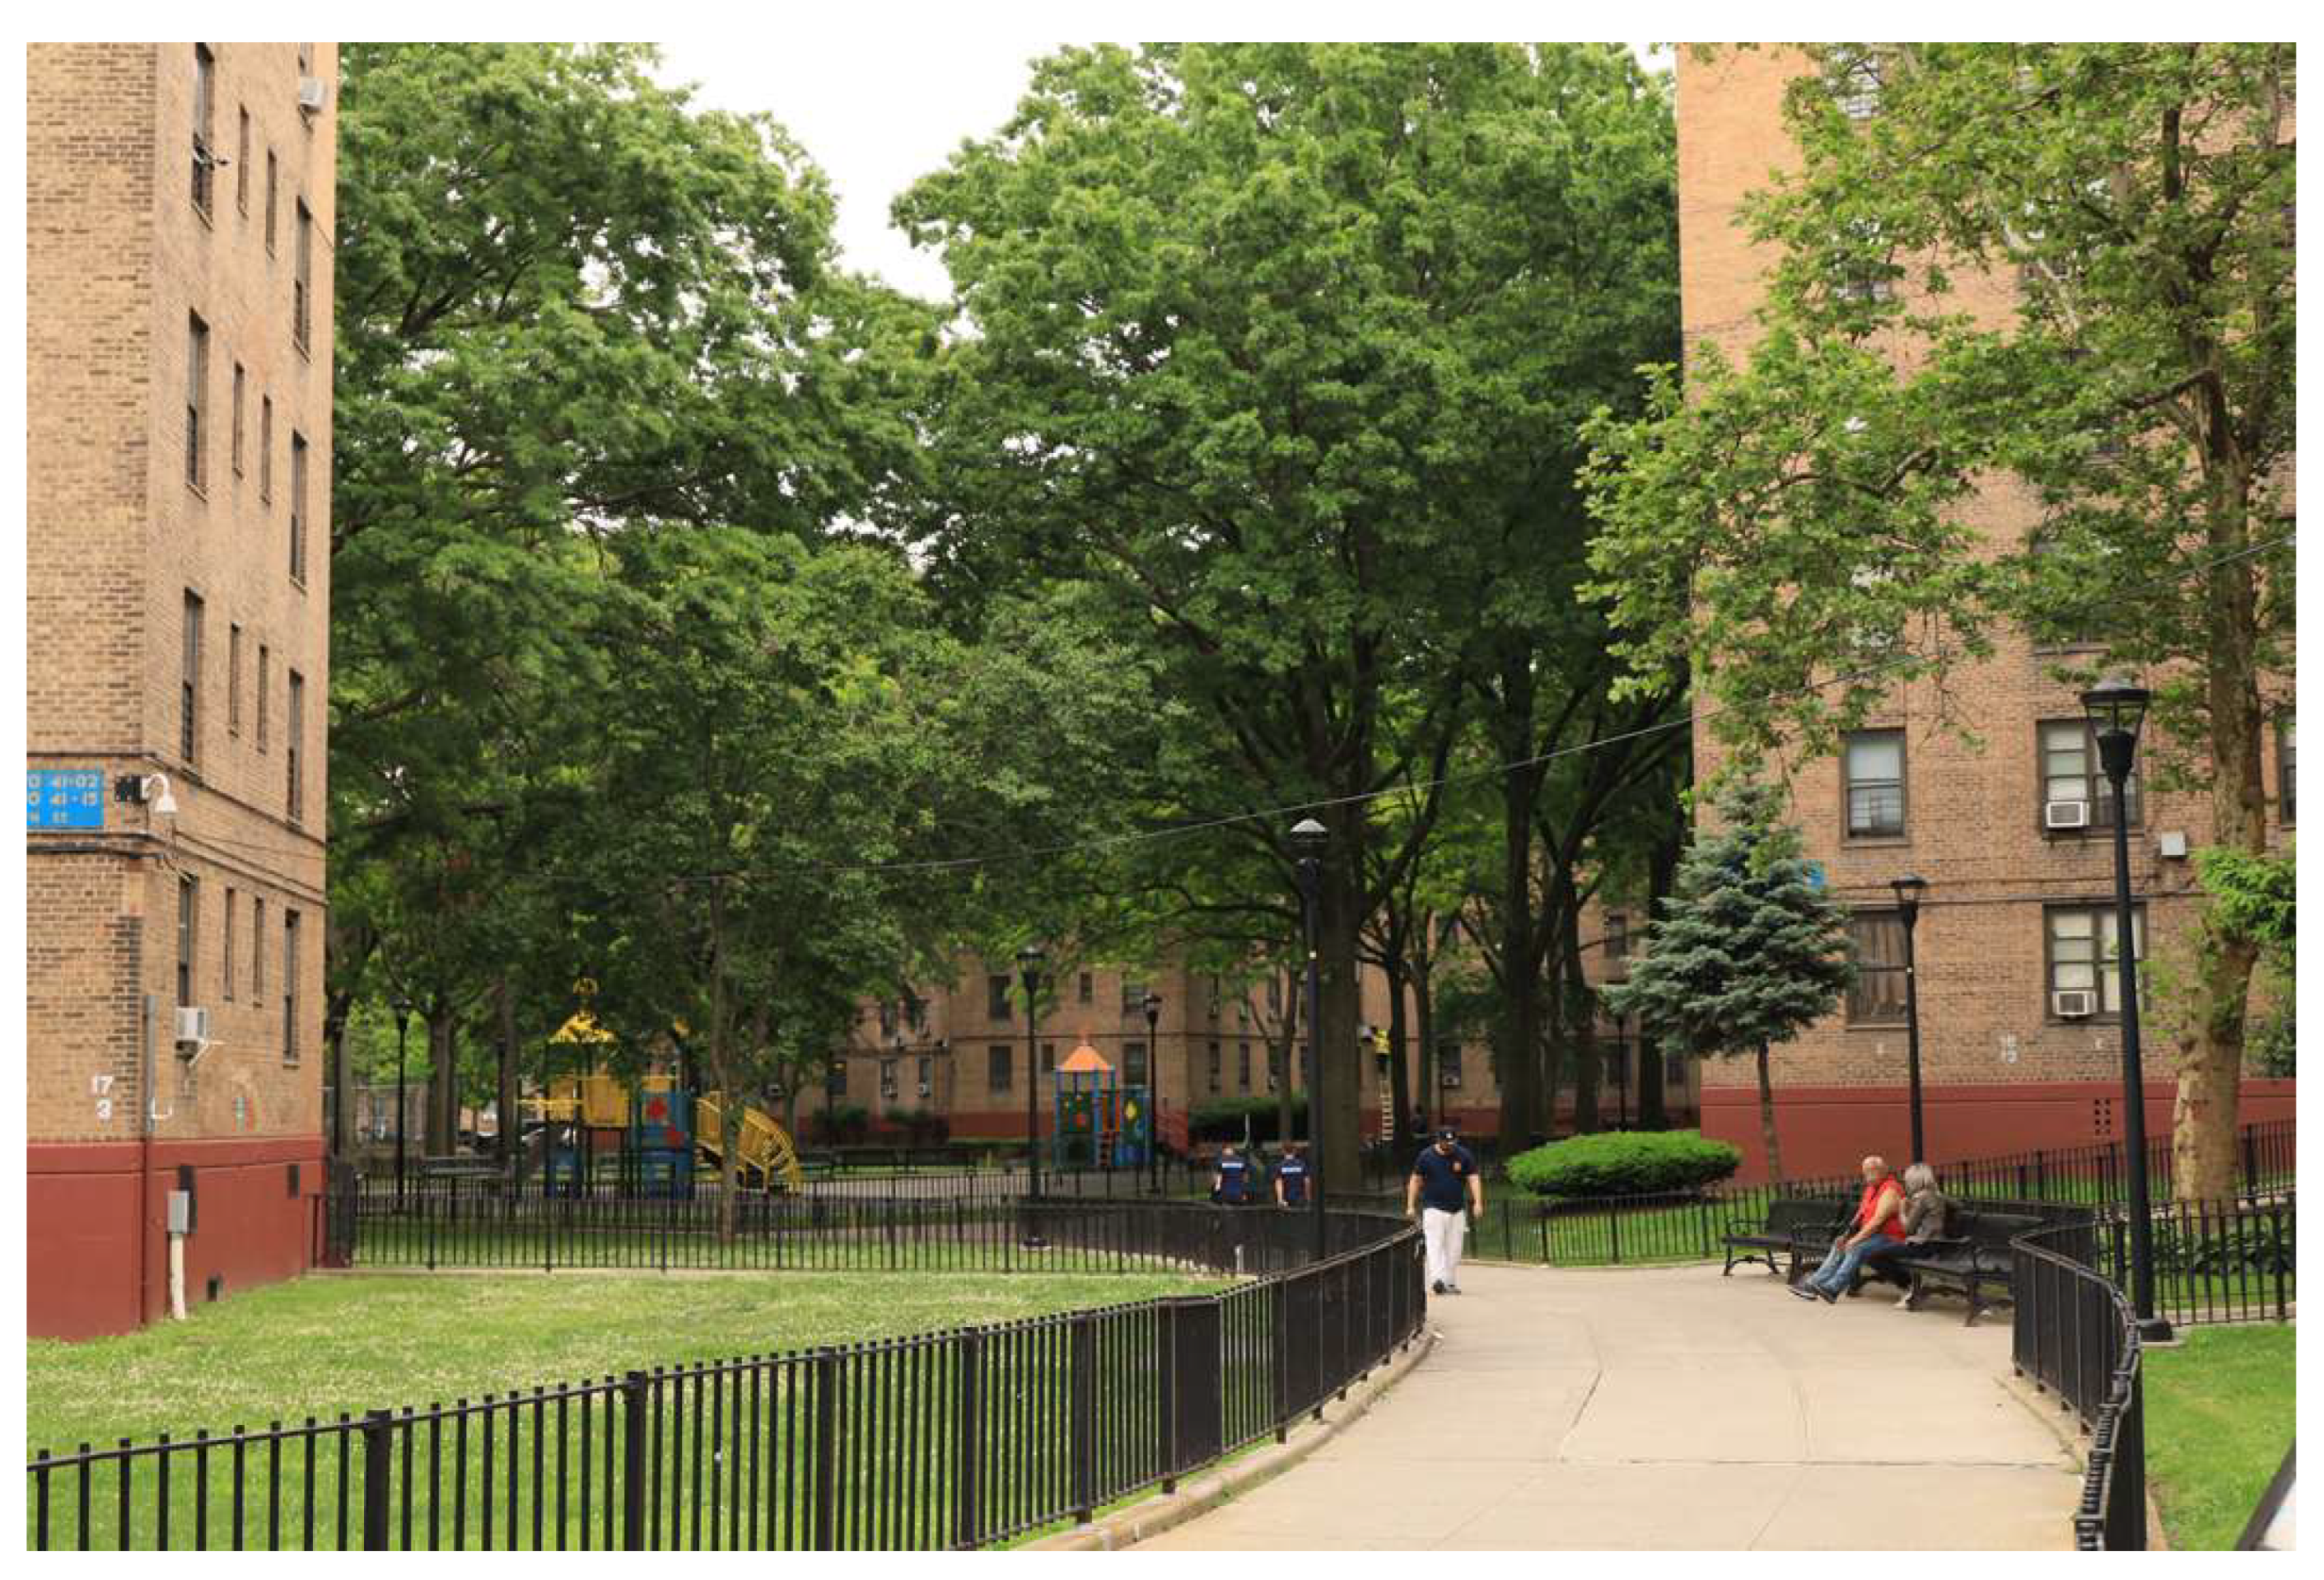
Figure 3.
Community room where NORC activities take place at a public housing development in Manhattan.
Figure 3.
Community room where NORC activities take place at a public housing development in Manhattan.
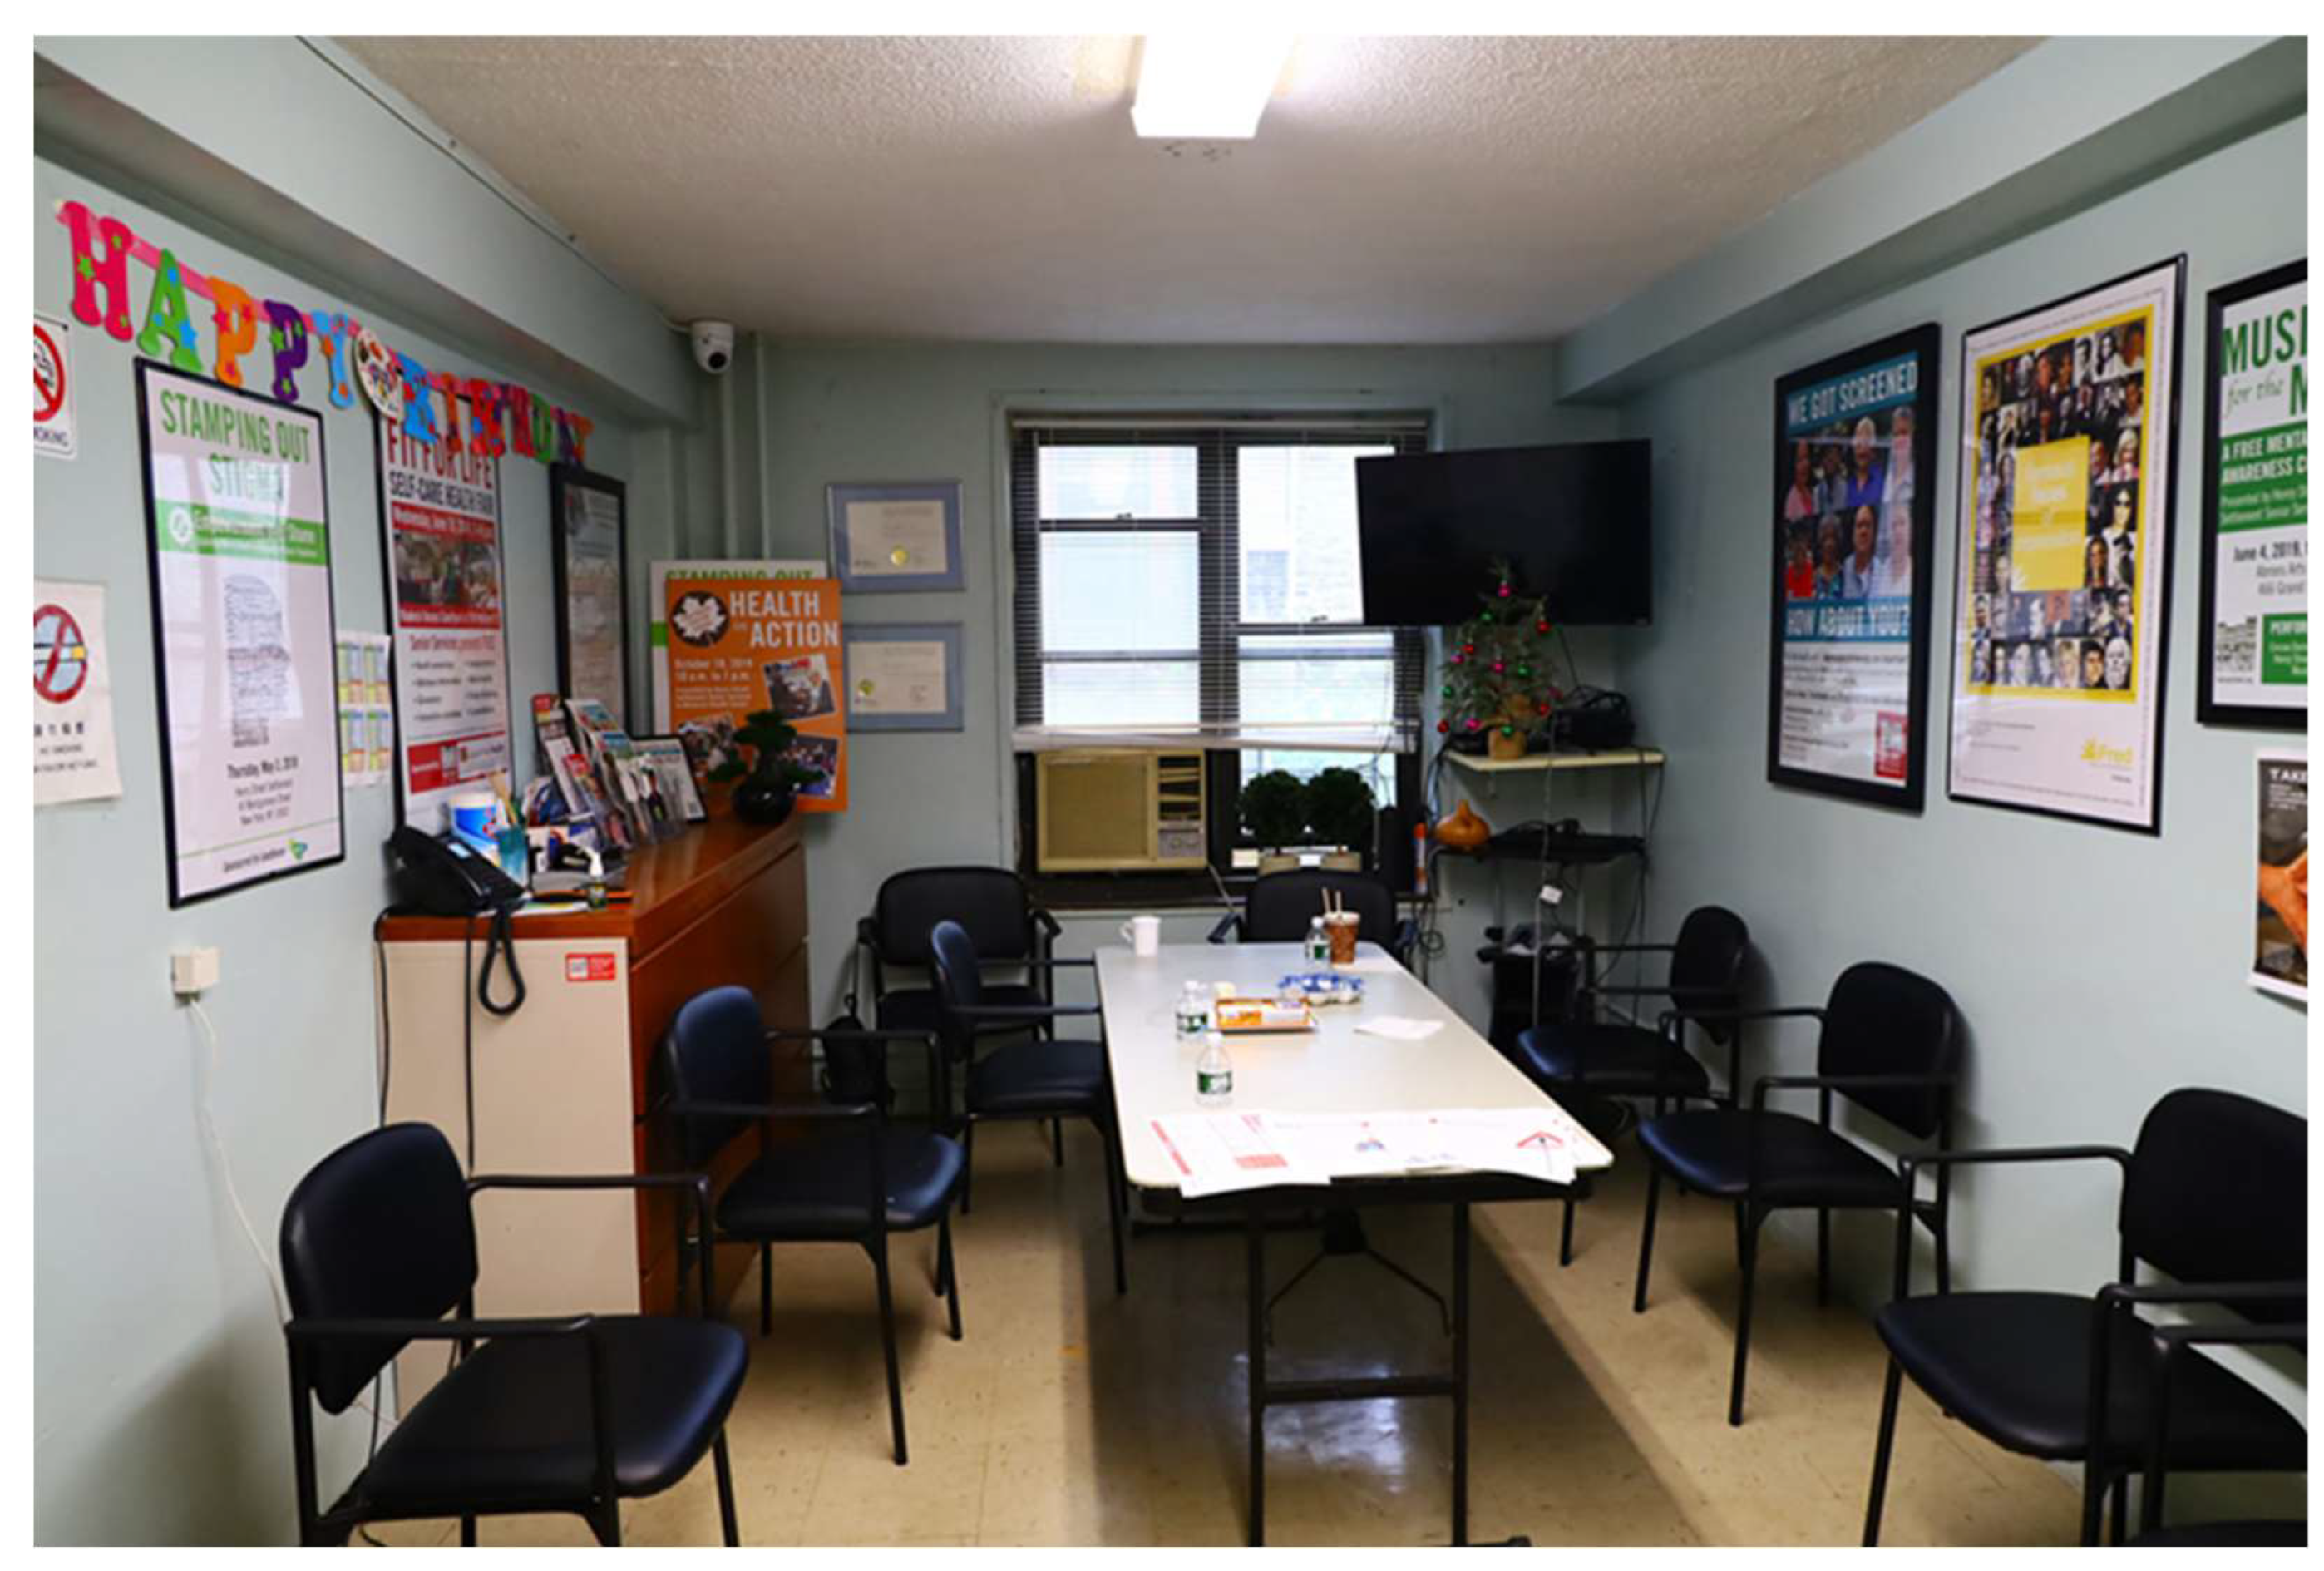
Figure 4.
Community rooms where NORC activities take place at several cooperative buildings in Manhattan.
Figure 4.
Community rooms where NORC activities take place at several cooperative buildings in Manhattan.
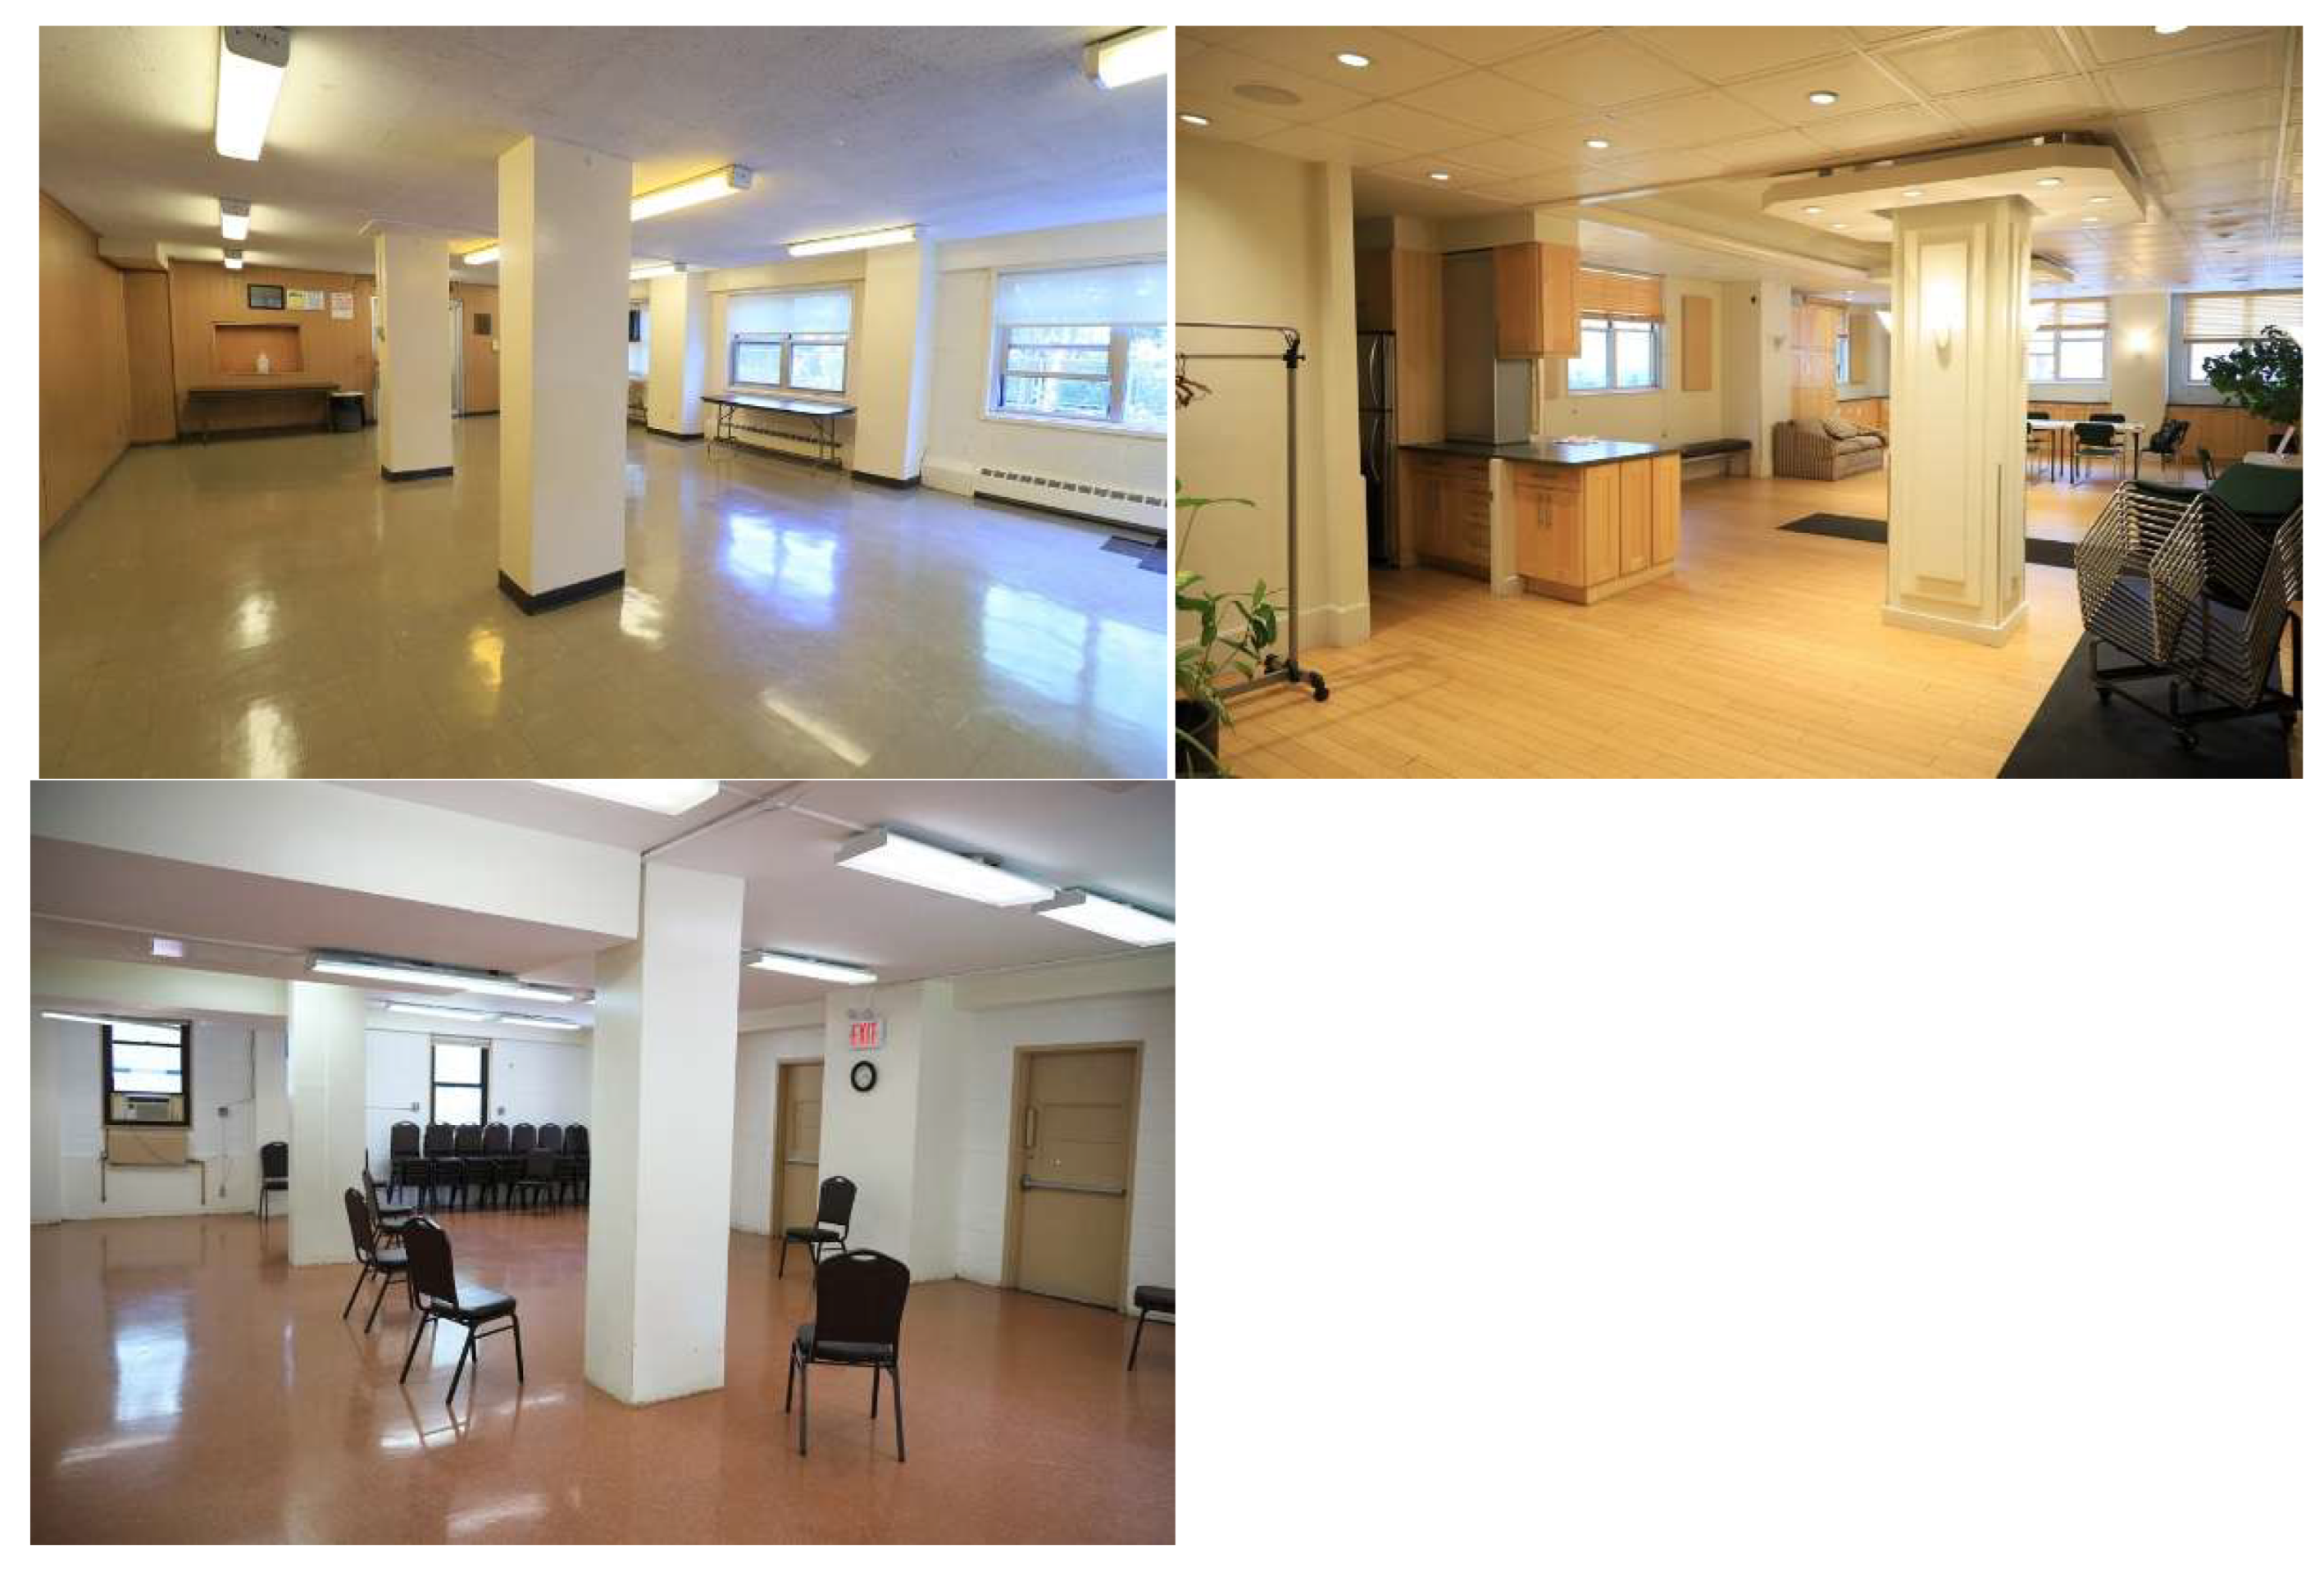

Table 1.
Characteristics of the NORCs where an architectural diagnosis was performed.
| Name | District | Neighborhood | Housing tenure |
|---|---|---|---|
| Educational Alliance Co op Village NORC | Manhattan | Lower East Side | Cooperative housing |
| Hanac Queensview NORC | Queens | Astoria | Cooperative housing |
| Hanac Ravenswood NORC* | Queens | Astoria | Public housing |
| Queensbridge NNORC | Queens | Long Island City | Public housing |
| Jasa Coney Island Active Aging NORC | Brooklyn | Coney Island | Public housing |
| Jasa Trumps United NORC | Brooklyn | Coney Island | Cooperative housing |
| Warbasse Cares NORC | Brooklyn | Coney Island | Cooperative housing |
| Hamilton Madison Knickerbocker NORC | Manhattan | Two Bridges | Subsidized rental |
| Hamilton Madison Alfred Smith Houses NORC | Manhattan | Two Bridges | Public housing |
| Confucious Plaza NORC | Manhattan | Two Bridges | Cooperative housing |
| Isabella Geriatric River Terrace NORC | Manhattan | Washington Heights | Cooperative housing |
| Lincoln Square NORC | Manhattan | Upper West Side | Cooperative and public housing |
| Jasa Bushwick Hyland NORC | Brooklyn | Bushwick | Public housing |
| Lindsay Park NORC | Brooklyn | Williamsburg | Cooperative housing |
| Penn South NORC | Manhattan | Chelsea | Cooperative housing |
| Amalgamated Pk Reservoir NORC | Bronx | Van Cortland Park | Cooperative housing |
| Selfhelp Big Six NORC | Queens | Woodside | Cooperative housing |
| Stanley M. Isaacs Neighborhood Center NORC | Manhattan | Yorkville | Public housing |
* When the site visit was conducted, it was found this community had lost its NORC condition.
Table 2.
Characteristics of the NORCs where surveys were conducted and an architectural diagnosis was performed.
Table 2.
Characteristics of the NORCs where surveys were conducted and an architectural diagnosis was performed.
| Name | District/county | Neighborhood | Housing tenure | No. of surveys |
|---|---|---|---|---|
| Morningside MRHS NORC | Manhattan | Morningside Heights | Cooperative housing | 2 |
| Henry Street Settlement NORC/Vladeck Cares | Manhattan | Lower East Side | Public housing | 37 |
| Lincoln House Outreach NORC | Manhattan | Upper West Side | Cooperative housing | 8 |
| Masaryk Tower NORC | Manhattan | Lower East Side | Cooperative housing | 3 |
| Isabella Geriatric Ft George Vistas NORC | Manhattan | Washington Heights | Cooperative housing | 7 |
| Vision Urbana NORC | Manhattan | Lower East Side | Cooperative housing* | 2 |
| Hands on Huntington NNORC | Suffolk (Long Island) | Huntington | Subsidized rental | 13 |
| Baruch Elders Service Team (B.E.S.T.) NORC | Manhattan | Lower East Side | Public housing | 79 |
| TOTAL | 151 |
* Technically, none of the buildings served by this NORC is a cooperative, but it was considered as such because the interviewees came from other cooperative developments.
Table 3.
Variables used for the regression analyses and coding.
| Variables | Description & Coding |
| Location variables | |
| Bernard M. Baruch Houses | Attends Bernard M. Baruch Houses NORC. Yes = 1, else =0. (Ommitted Category) |
| Hands on Huntington NNORC | Attends Hands on Huntington NNORC. Yes = 1, else =0. |
| Henry Street Settlement NORC | Attends Henry Street Settlement NORC. Yes = 1, else =0. |
| Ft George Vistas | Attends Ft George Vistas NORC. Yes = 1, else =0. |
| Lincoln House Outreach | Attends Lincoln House Outreach NORC. Yes = 1, else =0. |
| Masaryk Tower | Attends Masaryk Tower NORC. Yes = 1, else =0. |
| Morningside MRHS | Attends Morningside MRHS NORC. Yes = 1, else =0. |
| Vision Urbana NORC | Attends Vision Urbana NORC. Yes = 1, else =0. |
| Rental | Type of property. Rental = 1; Public housing =1; Co-op = 0. |
| Urban | Location of the NORC. Manhattan = 1, Greenlawn (Long Island) = 0. |
| Demographic variables | |
| Age | Respondent’s age. 60-65 = 1; 66-72 = 2; 73-80 = 3; 81-85 = 4; 86+ = 5. |
| Female | Respondent’s gender. Female = 1, Male = 0. |
| Education | Respondent’s highest education level. Grade school or less = 1; High school = 2; College = 3; Graduate = 4; Post-graduate = 5. |
| Married | Respondent’s marital status. Married = 1, else = 0. |
| Income | Respondent’s total annual household income. $20,000 or less = 1; $20,000-30,000 = 2; $30,000-40,000 = 3; $40,000-50,000 = 4; $50,000 or more = 5. |
| Household | # of people living in the household. I live alone = 1; 1 person = 2; 2 people = 3; 3 people = 4. |
| Employed | Respondent’s occupation. Employed part-time = 1, else = 0. |
| Health and well-being variables | |
| Self-rated health | Self-reported health ranging from 1–5, with 1 = poor and 5 = excellent. |
| Self-rated quality of life | Self-reported quality of life ranging from 1–5, with 1 = poor and 5 = excellent. |
| Health changes | Has experienced health changes since moving there. Yes = 1, No = 0. |
| Social Integration variables | |
| Lenght of residence | 0-5 years = 1; 6-10 years = 2; 11-15 years = 3; 16-20 years = 4; 20+ years = 5. |
| Visitors | Frequency of having visitors. Never = 1; Once or twice a month = 2; Once a week = 3; A few times a week = 4; Daily = 5. |
| Visit friends | Frequency of visiting friends or relatives. Never = 1; Once or twice a month = 2; Once a week = 3; A few times a week = 4; Daily = 5. |
| Social/physical activity | Frequency of exercising or engaging in social activity. Never = 1; Once or twice a month = 2; Once a week = 3; A few times a week = 4; Daily = 5. |
| NORC attendance | Frequency of attending NORC programs. Never = 1; Once or twice a month = 2; Once a week = 3; A few times a week = 4; Daily = 5. |
| Built environment variables | |
| Bedrooms | # of bedrooms in the apartment ranging from 0-4. |
| Physical Condition (Apartment) | Self-rated physical condition of the apartment ranging from 1–5, with 1 = poor and 5 = excellent. |
| Aesthetics (Apartment) | Self-rated aesthetics of the apartment (design, color, light) ranging from 1-5, with 1 = poor and 5 = excellent. |
| Environmental Comfort (Apartment) |
Self-rated environmental condition (temperature, noise, air quality) ranging from 1-5, with 1 = poor and 5 = excellent. |
| Mobility (Apartment) | Can move around the apartment and perform daily tasks with ease. Ranges from 1-5, with 1 = disagree and 5 = agree. |
| Modifications (Apartment) | Has modified or retrofit apartment. Yes = 1, No = 0. |
| Mobility (Complex) | Can move around the building complex with ease. Ranges from 1–5, with 1 = disagree and 5 = agree. |
| Safety (Complex) | Feels safe at the building complex. Ranges from 1–5, with 1 = disagree and 5 = agree. |
| Mobility (Neighborhood) | Can move around the neighborhood with ease. Ranges from 1–5, with 1 = disagree and 5 = agree. |
| Safety (Neighborhood) | Feels safe at the neighborhood. Ranges from 1–5, with 1 = disagree and 5 = agree. |
| Environmental quality (Neighborhood) |
Self-rated environmental quality at the neighborhood (noise, pollution) ranging from 1–5, with 1 = poor and 5 = excellent. |
Table 4.
Descriptive statistics of the sample (N = 151).
| Variables | Values / Scales | Total |
| Demographic | Mean (SD)/% | |
| NORC Housing tenure |
Bernard M. Baruch Houses Henry Street Settlement NORC Hands on Huntington NNORC Ft George Vistas Lincoln House Outreach Masaryk Tower Morningside MRHS Vision Urbana NORC Co-op |
52.3 24.5 8.6 4.6 5.3 2.0 1.3 1.3 14.6 |
| Rental | 85.4 | |
| Location | Manhattan | 92.1 |
| Greenlawn (Long Island) | 7.9 | |
| Age group | 60-65 | 3.4 |
| 66-72 | 12.9 | |
| 73-80 | 38.1 | |
| 81-85 | 23.1 | |
| 86+ | 22.4 | |
| Gender | Male | 19.7 |
| Female | 80.3 | |
| Education | Grade school or less | 43.9 |
| High school | 35.1 | |
| College | 8.1 | |
| Graduate | 4.7 | |
| Post-graduate | 8.1 | |
| Marital status | Single | 15.6 |
| Married | 34.7 | |
| Divorced | 12.2 | |
| Separated | 4.1 | |
| Widowed | 33.3 | |
| Annual income | <$20,000 | 81.1 |
| $20,000-30,000 | 8.4 | |
| $30,000-40,000 | 2.1 | |
| $40,000-50,000 | 1.4 | |
| >$50,000 | 7.0 | |
| Household composition | Live alone | 58.4 |
| Live with 1 person | 30.9 | |
| Live with 2 people | 9.4 | |
| Live with 3 people | 1.3 | |
| Occupation | Employed part-time | 0.7 |
| Not employed | 0.7 | |
| Student | 2.0 | |
| Retired | 96.6 | |
| Health and well-being | ||
| Self-rated health | [1 = Poor, 5 = Excellent] | 3.25 (0.89) |
| Self-rated quality of life | [1 = Poor, 5 = Excellent] | 3.54 (0.81) |
| Health changes | Yes | 72.8 |
| No | 27.2 | |
| Social integration | ||
| Length of residence | 0-5 | 13.3 |
| 6-10 | 12.7 | |
| 11-15 | 14.7 | |
| 16-20 | 22.0 | |
| 20+ | 37.3 | |
| Importance of aging in place | Not at all | 1.3 |
| Somewhat | 12.8 | |
| Very | 85.2 | |
| Not Sure | 0.7 | |
| Frequency of visitors | [1 = Never, 5 = Daily] | 2.31 (0.97) |
| Frequency of visiting friends/relatives | [1 = Never, 5 = Daily] | 2.09 (1.01) |
| Frequency of exercise or social activity | [1 = Never, 5 = Daily] | 3.17 (1.29) |
| Frequency of NORC attendance | [1 = Never, 5 = Daily] | 2.78 (1.01) |
| How much NORC helps age in place | [1 = Nothing, 5 = Very much] | 4.14 (0.73) |
| Built environment | ||
| Apartment | ||
| Bedrooms | 1.30 (0.69) | |
| Physical condition | [1 = Poor, 5 = Excellent] | 3.52 (1.03) |
| Aesthetics | [1 = Poor, 5 = Excellent] | 3.61 (0.83) |
| Environmental comfort | [1 = Poor, 5 = Excellent] | 3.33 (0.95) |
| Mobility | [1 = Disagree, 5 = Agree] | 3.76 (0.91) |
| Modifications | Yes | 26.5 |
| No | 73.5 | |
| Building complex | ||
| Mobility | [1 = Disagree, 5 = Agree] | 3.70 (1.03) |
| Safety | [1 = Disagree, 5 = Agree] | 3.49 (1.13) |
| Neighborhood | ||
| Mobility | [1 = Disagree, 5 = Agree] | 3.64 (0.90) |
| Safety | [1 = Disagree, 5 = Agree] | 3.21 (1.12) |
| Environmental quality | [1 = Poor, 5 = Excellent] | 3.19 (0.89) |
Table 5.
Results of the regression analyses predicting well-being outcomes.
| Model 1: Self-rated Health | Model 2: Self-rated Quality of Life | |||
| Variable | Coef. | p-value | Coef. | p-value |
| Constant | -0.234 | 0.744 | 0.579 | 0.314 |
| Bernard M. Baruch Houses | (omitted variable) | |||
| Hands on Huntington NNORC | -0.430 | 0.184 | 0.172 | 0.509 |
| Henry Street Settlement NORC | -0.220 | 0.215 | 0.138 | 0.332 |
| Ft George Vistas | -0.773 | 0.066* | 0.830 | 0.016** |
| Lincoln House Outreach | -0.023 | 0.961 | 0.583 | 0.118 |
| Masaryk Tower | -0.227 | 0.676 | 0.181 | 0.677 |
| Morningside MRHS | -0.246 | 0.704 | 0.582 | 0.261 |
| Vision Urbana NORC | -0.089 | 0.883 | 0.503 | 0.296 |
| Age | -0.042 | 0.512 | 0.114 | 0.030** |
| Female | 0.305 | 0.071* | 0.030 | 0.826 |
| Education | 0.085 | 0.262 | -0.083 | 0.177 |
| Married | 0.133 | 0.414 | 0.116 | 0.375 |
| Household | 0.047 | 0.667 | -0.042 | 0.633 |
| Employed | 0.824 | 0.247 | 0.642 | 0.261 |
| Self-rated health | N/A | N/A | 0.370 | 0.000** |
| Health_changes | -0.377 | 0.0091** | 0.039 | 0.741 |
| Length of residence | 0.084 | 0.1083 | -0.039 | 0.361 |
| Visit friends | 0.068 | 0.462 | 0.134 | 0.073* |
| Social/physical activity | 0.210 | 0.002** | 0.162 | 0.004** |
| NORC attendance | 0.014 | 0.844 | -0.012 | 0.838 |
| Bedrooms | -0.087 | 0.437 | -0.084 | 0.347 |
| Physical condition_apartment | 0.178 | 0.043** | 0.004 | 0.954 |
| Environment comfort_apartment | -0.012 | 0.895 | -0.113 | 0.111 |
| Aesthetics_apartment | -0.088 | 0.404 | 0.002 | 0.980 |
| Mobility_apartment | 0.156 | 0.098* | 0.041 | 0.587 |
| Apartment_modifications | -0.192 | 0.245 | 0.072 | 0.586 |
| Mobility_building | 0.138 | 0.147 | 0.136 | 0.079* |
| Safety_building | 0.075 | 0.399 | 0.035 | 0.621 |
| Mobility_neighborhood | 0.133 | 0.147 | -0.034 | 0.646 |
| Environment qual_neighborhood | 0.126 | 0.226 | 0.163 | 0.052* |
| R-square | 0.5569 | 0.6595 | ||
* p<0.1; ** p<0.05.
Disclaimer/Publisher’s Note: The statements, opinions and data contained in all publications are solely those of the individual author(s) and contributor(s) and not of MDPI and/or the editor(s). MDPI and/or the editor(s) disclaim responsibility for any injury to people or property resulting from any ideas, methods, instructions or products referred to in the content. |
© 2026 by the authors. Licensee MDPI, Basel, Switzerland. This article is an open access article distributed under the terms and conditions of the Creative Commons Attribution (CC BY) license (http://creativecommons.org/licenses/by/4.0/).
Copyright: This open access article is published under a Creative Commons CC BY 4.0 license, which permit the free download, distribution, and reuse, provided that the author and preprint are cited in any reuse.


