Submitted:
16 January 2026
Posted:
19 January 2026
You are already at the latest version
Abstract
Modern web applications commonly face imbalances between frontend and backend rendering and inefficient resource utilization in high-concurrency scenarios. This paper proposes a full-stack collaborative optimization framework integrating React Server Components with Node.js load-tiered scheduling. This approach first enables dynamic switching between frontend SSR and CSR through Async Render Tree Partitioning. It then introduces Nginx reverse proxy and multi-level Redis caching to reduce database access latency. Finally, it employs an event-loop-based Adaptive Task Scheduler on the backend to dynamically allocate I/O load. Experiments conducted in K6 and JMeter simulation environments demonstrate that under 10,000 concurrent requests, average response time decreased by 38.6%, P95 latency dropped by 41%, and server energy consumption reduced by 18.3%. This research provides a systematic engineering solution for performance optimization in large-scale web systems.
Keywords:
full-stack development
; high concurrency
; asynchronous rendering
; load scheduling
; redis caching
; energy consumption optimization
1. Introduction
As web systems expand into critical domains like finance, e-commerce, and real-time communication, handling scenarios with tens of thousands of concurrent requests increasingly relies on frontend-backend coordination to drive overall performance gains. Traditional optimization methods, often focused on compressing rendering chains or offloading static resources, struggle to adapt to the frequent temporal and spatial fluctuations in rendering tasks and I/O loads. To achieve coordinated optimization across multiple metrics—request response latency, system energy consumption, and scheduling lag—this paper proposes a full-stack collaborative optimization framework integrating asynchronous rendering sharding, hierarchical cache management, and adaptive load scheduling. This approach systematically addresses performance bottlenecks in high-concurrency web environments, with load testing validating its enhanced response efficiency and resource utilization under massive request conditions.
2. Current State of Web Performance Optimization Technologies
Current web systems typically rely on techniques like Nginx static resource compression, Redis key-value caching, and CDN edge distribution to enhance response performance under high concurrency. However, when request volumes exceed 5000 QPS, traditional SSR rendering suffers from first-byte delays exceeding 380ms, while CSR experiences initial screen blanking times surpassing 2.4 seconds. On the backend, while Node.js offers event-driven capabilities, it still suffers from GC pauses and scheduling jitter under high I/O interaction frequencies. Average RT fluctuations reach ±75ms, severely impacting system predictability and resource utilization efficiency. Existing solutions often lack a coupling mechanism between rendering task granularity and scheduling granularity, resulting in disjointed frontend-backend optimization strategies that fail to meet stable response requirements in scenarios exceeding 10,000 concurrent users[1] .
3. Design of a Collaborative Optimization Framework for High-Concurrency Web Systems
3.1. Asynchronous Rendering Tree Partitioning Mechanism
To mitigate the issue of white screen duration exceeding 2.4 seconds under 5,000+ concurrent requests in traditional CSR, the system designs a rendering tree sharding mechanism based on React Server Components. It employs Render Slot granularity division and Priority Hydration strategy, controlling the average number of shards between 7 and 12 segments, with each segment size not exceeding 16KB. Rendering order is determined by URL structure and user interaction popularity.Rendering flows through an asynchronous scheduler, combined with custom fallback paths to enable interruptible loading. The framework structure, as shown in Figure 1, supports coordinated execution of server-side preloading and client-side deferred binding.
3.2. Multi-Level Caching and Load Scheduling
After the frontend rendering tree sharding mechanism outputs the initial request structure, the system introduces a three-tier asynchronous caching architecture to support handling tens of thousands of concurrent requests. ① The first tier configures the FastCGI caching module within Nginx. Cache hit keys are composed of URI path + query parameters, with controlled expiration times ranging from 300ms to 1.2s. ② The second layer employs a dual-channel Redis cache pool using a HashSlot strategy to isolate tenant data. With an 8GB capacity, it supports up to 120,000 QPS concurrent accesses and maintains an average hit rate exceeding 86%. ③ At the third layer, the backend employs an in-memory object caching mechanism with L1/L2 read-write separation. The scheduler periodically evaluates hotspot access frequency and dynamically adjusts write weights using a token bucket algorithm. To further address potential cache inconsistencies under high write-load scenarios, especially across distributed edge nodes and the central Redis pool, the system integrates a version control mechanism combined with a cache invalidation protocol. Specifically, each cached object is attached with a monotonically increasing version ID and an expiration token. The version ID is incremented upon each successful write or update. Edge nodes validate cache freshness by comparing their local version metadata with Redis’s latest version stamp before read operations. In case of mismatch, they trigger an immediate refresh. This protocol minimizes stale reads and ensures eventual consistency across the distributed caching hierarchy. The scheduling controller collaborates with the load estimation module to guide traffic distribution based on user geotags, interface latency distributions, and path entropy[3] .
However, in large-scale distributed deployments, cache consistency becomes a critical issue—especially under high write-throughput scenarios. To address this, the framework incorporates a version-controlled cache invalidation protocol across the Redis layer and in-memory object cache. Each cache entry is tagged with a monotonically increasing version number associated with its originating write operation. When updates occur, invalidation signals are propagated asynchronously to edge layers using a publish-subscribe (Pub/Sub) model, ensuring eventual consistency across all nodes. Furthermore, for strongly consistent paths such as user-session states or real-time stock updates, a write-through caching policy is enforced, where write operations directly update both the cache and the backing store before acknowledgment. This hybrid strategy balances consistency overhead and read latency, providing a scalable caching model adaptable to write-intensive and edge-heavy deployments.The complete scheduling chain structure, as shown in Figure 2, ensures efficient coordinated cache hits between edge layers and central nodes.
3.3. Adaptive Task Scheduling
To optimize I/O performance in high-concurrency web systems, an event-driven adaptive task scheduler is employed [4]. While the scheduler initially estimates each request’s computational demand and I/O load via a historical load prediction model, To further enhance the robustness of task scheduling under unpredictable traffic bursts, this framework integrates a dual-path dynamic control mechanism. In addition to the existing exponential moving average-based anomaly detector, it introduces an online reinforcement learning controller that continuously monitors system load indicators—including task queue length, CPU utilization variance, and I/O wait times. Upon identifying abnormal drift or spike patterns, the controller triggers adaptive policy switching through a lightweight actor-critic algorithm. This module dynamically reconfigures task weight coefficients and priority thresholds, ensuring timely adjustment of scheduling strategies under volatile load conditions while minimizing feedback lag. The scheduler’s decision-making process now incorporates both statistical trends and learned heuristics, forming a hybrid rule-learning feedback loop that significantly improves resilience and adaptability. This agent continuously tunes task allocation weights and execution priorities, responding to load volatility with minimal delay. The integration of this dual-layer adjustment mechanism enhances the scheduler's robustness against burst traffic and system bottlenecks.The scheduling strategy within the model dynamically adjusts through the following formula:
where denotes the execution priority of task , represents the task queue length, indicates the request response time, signifies the task I/O load, and reflects the task computational complexity. The scheduler adjusts execution order based on task priority, ensuring stable response times and efficient resource allocation even when concurrent requests exceed 10,000. During task scheduling, an adaptive load balancing mechanism is introduced. It adjusts scheduling strategies based on real-time monitoring data to ensure I/O-intensive tasks are assigned to low-load compute nodes during high concurrency, thereby reducing system bottlenecks[5] .
4. Implementation of Performance Optimization Techniques
4.1. Frontend Performance Optimization
Frontend performance optimization centers on an asynchronous rendering sharding mechanism. By integrating response latency modeling with resource loading scheduling control functions, it constructs a compressible non-blocking rendering stream.[6] . ① To implement client-side rendering priority control, a component-level loading sequence control formula is introduced:
where represents the loading priority of the th component, denotes interaction weight, indicates the component's resource volume, signifies its first-paint timestamp, and reflects its dependency depth. The scheduler ranks components based on values and dynamically determines rendering paths by integrating VDOM differential updates. ② To evaluate first-paint block arrival time, a first-screen prediction formula is introduced:
where: represents the full first-screen rendering time, denotes the volume of the segment , indicates the bandwidth throughput, reflects the client decoding complexity, and signifies the rendering pipeline throughput. This model compresses rendering pipeline latency by limiting the maximum decoding window and concurrent requests. The overall solution is deployed at the client-side Hydration entry point. Combined with the stream-based fragment list returned by the server, it forms a priority-aware, asynchronously decoupled rendering pipeline. This provides input boundary conditions for the backend scheduler to output the smallest renderable units, establishing a closed-loop rendering coordination across the entire path.
4.2. Backend Performance Optimization
After frontend tile rendering and cache offloading mechanisms perform initial traffic screening, the system backend implements a multi-queue scheduling architecture based on event-driven and non-blocking I/O. Centered around the Node.js runtime, it combines layered asynchronous task flows with dynamic priority update mechanisms for scheduling optimization. ① To address scheduling trade-offs between I/O and CPU resource contention, a load-responsive adjustment function is introduced:
where represents the scheduling weight of task at time ; denotes the I/O request volume of this task; indicates the currently available system bandwidth; signifies its computational demand; represents the remaining CPU time slices in the system; denotes the task's queueing duration; is the empirical weighting coefficient used for modeling load sensitivity across different task types[7,8] . ② To prevent long-running tasks from blocking the main thread in the event loop, a sliding-window-based load prediction function is introduced:
where denotes the historical average scheduling intensity of task at time , represents the service duration within the th time slice, indicates its queueing delay, signifies the task request volume, and denotes the sliding window width. This mechanism achieves resource-sensitive scheduling decisions for tasks under fluctuating concurrency intensity by dynamically updating both and through the scheduler. It ensures stable event loop throughput during task-intensive phases while establishing a microcycle feedback channel synchronized with frontend rendering blocks. This channel supports collaborative optimization in subsequent phases[9] .
4.3. Frontend-Backend Collaborative Optimization
To achieve real-time coordination between the frontend rendering chain and backend scheduling chain, the system designs a dual-channel scheduling closed-loop model based on dynamic feedback weight fusion. Its core lies in mapping frontend sharded request states and backend resource load dynamics onto a unified priority domain. The scheduler employs the following collaborative weight mapping functions:
where represents the frontend-backend fusion scheduling score for request at time ; denotes the frontend rendering fragment size (KB); indicates the fragment priority; reflects the network response latency; signifies the backend return delay; tracks the backend task queue length; measures the corresponding thread group's CPU utilization percentage; tracks the current total I/O bandwidth usage; indicates the cache penetration rate; and represents the adjustable allocation factor. This mechanism is deployed between the scheduling gateway layer and the edge preprocessing layer, updating the task status matrix in real-time via asynchronous channels. This forms the symmetrical "request status-resource feedback" structure illustrated in Figure 3:[10] . When sending sharded stream requests, the frontend appends structural descriptions and desired request windows. The backend dynamically calculates priorities in real-time based on , feeding back execution results to adjust the frontend's shard control logic for the next cycle. This optimized chain minimizes scheduling coordination latency, enhances scalable flow control efficiency, and provides unified scheduling metrics for multi-node load testing experiments.
5. Performance Testing and Analysis
5.1. Experimental Environment and Testing Approach
The experiment leveraged a combined load testing platform built with K6 and Apache JMeter, simulating concurrent request volumes incrementing from 1,000 to 10,000. The backend runtime environment consisted of Node.js 20.11 and Redis 7.2, deployed on Intel Xeon Gold 6348 dual-socket architecture nodes with 256GB memory and NVMe SSD clusters. The frontend employed a Vite + React 18 server-side rendering solution. A reverse proxy channel was built using Nginx 1.24, configured with a maximum connection count of 64,000 and a sampling interval of 1 second. Metrics monitored included average response latency, P95 latency, CPU and memory utilization, Redis hit rate, and power consumption changes.
5.2. Performance Test Results Analysis
To further validate the performance evolution of the collaborative optimization mechanism under varying loads, tests were conducted with concurrent user counts set to 1,000, 3,000, 5,000, 7,000, and 10,000. Key metrics collected included average response time, P95 latency, Redis hit rate, and server power consumption. As shown in Table 1, as concurrent pressure increases, the optimization framework demonstrates more pronounced control over response performance in high-load ranges, exhibiting a nonlinear compression trend particularly in P95 latency control.
Table 1 reveals distinct performance trends under varying levels of concurrent user loads. First, the average response time increases steadily as concurrency rises: starting at 214 ms for 1,000 users and reaching 452 ms at 10,000 users, a 111% increase. This indicates that while the system experiences pressure under high load, the response time remains within 500 ms, suggesting moderate resilience to concurrency.
The P95 latency also shows a linear upward trend, from 386 ms at 1,000 users to 689 ms at 10,000 users—an increase of approximately 78.5%. This suggests that even under peak load, most users receive acceptable response times, although tail latency slightly degrades at higher loads.The Redis hit rate improves as concurrency increases, rising from 81.2% to 87.1%. This implies that the caching layer becomes more effective under load, reducing the burden on the backend database. The consistent improvement also suggests a predictable access pattern, opening opportunities for further cache tuning.In terms of power consumption, the system scales from 124.3 W to 188.3 W as concurrent users grow—an increase of about 51.5%. However, this power growth is lower than the response time increase, indicating a relatively efficient system design in balancing energy consumption and performance.Overall, the system exhibits strong linear scalability from 1,000 to 10,000 concurrent users. Key metrics remain stable, and the efficiency of both caching and energy utilization suggests the system is well-architected for mid- to high-load online environments.The corresponding performance scatter plot distribution is shown in Figure 4. The cluster of data points shifts from the upper-right quadrant to the lower-left quadrant, indicating an overall negative correlation between latency and power consumption.
Figure 4 further illustrates the synergistic suppression relationship between latency and power consumption. Under high concurrency pressure (7,000+ requests), system response latency did not exhibit exponential growth, while power consumption remained below 200W. This demonstrates that the frontend-backend coordinated scheduling mechanism effectively compresses performance divergence bandwidth, providing a foundation for multi-dimensional metric normalization assessment.
5.3. Optimization Effect Evaluation
After collecting multi-dimensional metrics under a 10,000 concurrent scenario, comparison with the conventional architecture revealed that the average response time decreased from 735ms to 451ms, corresponding to a compression ratio of 38.6%; P95 latency decreased from 1,168ms to 689ms, representing a 41% reduction; server power consumption dropped from 230.5W to 188.3W, a decrease of 18.3%. Analysis of the synergistic changes across metrics reveals that reduced latency significantly narrowed the peak I/O resource utilization window, effectively compressing task-accumulated bandwidth and indirectly suppressing server power fluctuations. Further examination of slope changes across metric curves reveals synchronous trends between response time and power consumption reductions. However, P95 latency exhibits a nonlinear inflection point when Redis cache hit rate exceeds 86%, indicating that the interplay between caching and scheduling models exerts structural control over high-concurrency performance optimization.
6. Conclusions
Addressing frontend-backend coordination optimization for high-concurrency web systems, this study constructs a systematic optimization framework integrating asynchronous rendering sharding, hierarchical cache scheduling, and adaptive task management. This effectively alleviates resource bottlenecks and unstable response latency. Experiments demonstrate the framework's robust latency control and energy optimization capabilities under tens of thousands of concurrent connections, validating the engineering feasibility and performance advantages of state-fusion modeling and scheduling feedback mechanisms across frontend and backend. It should be noted that the current model still relies on static parameter configuration for resource load prediction, lacking dynamic rapid response capabilities to sudden abnormal loads. Future research can further expand in areas such as dynamic control strategies, scheduling strategy generalization, and flow control elasticity to adapt to complex and dynamic web operating environments and service scaling demands.
References
- Mathew, P. Front-End Performance Optimization for Next-Generation Digital Services. J. Comput. Sci. Technol. Stud. 2025, 7, 993–1000. [Google Scholar] [CrossRef]
- Kumar, M. Designing Resilient Front End Architectures for Real-Time Web Application[J]. International Journal of Engineering Technology Research & Management (IJETRM) 2024, 8(08), 229–240. [Google Scholar]
- Yang, Y. Web Front-End Application Performance Improvement Method Based on Component-Based Architecture[J]. International Journal of Engineering Advances 2025, 2(2), 24–30. [Google Scholar]
- Gu, Y. Research on Design Principles and Maintainability of High-Performance Web Applications[J]. Journal of Computer, Signal, and System Research 2025, 2(4), 57–62. [Google Scholar]
- Wang, B.; Zhao, Q.; Zeng, D.; Yao, Y.; Hu, C.; Luo, N. Design and Development of a Local-First Collaborative 3D WebGIS Application for Mapping. ISPRS Int. J. Geo-Information 2025, 14, 166. [Google Scholar] [CrossRef]
- Setyautami, M.R.A.; Hähnle, R.; Azurat, A.; Budiardjo, E.K. End-to-end development of product lines for web systems. Int. J. Softw. Tools Technol. Transf. 2025, 27, 201–219. [Google Scholar] [CrossRef]
- Ben Kora, H.H.; Manita, M.S. Modern Front-End Web Architecture Using React.js and Next.js. Univ. Zawia J. Eng. Sci. Technol. 2024, 2, 1–13. [Google Scholar] [CrossRef]
- Mathew, P. Front-End Performance Optimization for Next-Generation Digital Services. J. Comput. Sci. Technol. Stud. 2025, 7, 993–1000. [Google Scholar] [CrossRef]
- Basharat, A; Azmat, H. Benchmarking Web Application Performance: A Study of Frontend and Backend Optimization Techniques[J]. Baltic Journal of Multidisciplinary Research 2024, 1(2), 21–28. [Google Scholar]
- Qi, H.; Ren, F.; Wang, L.; Jiang, P.; Wan, S.; Deng, X. Multi-Compression Scale DNN Inference Acceleration based on Cloud-Edge-End Collaboration. ACM Trans. Embed. Comput. Syst. 2024, 23, 1–25. [Google Scholar] [CrossRef]
Figure 1.
Architecture Diagram of Asynchronous Rendering Tree Sharding Mechanism.
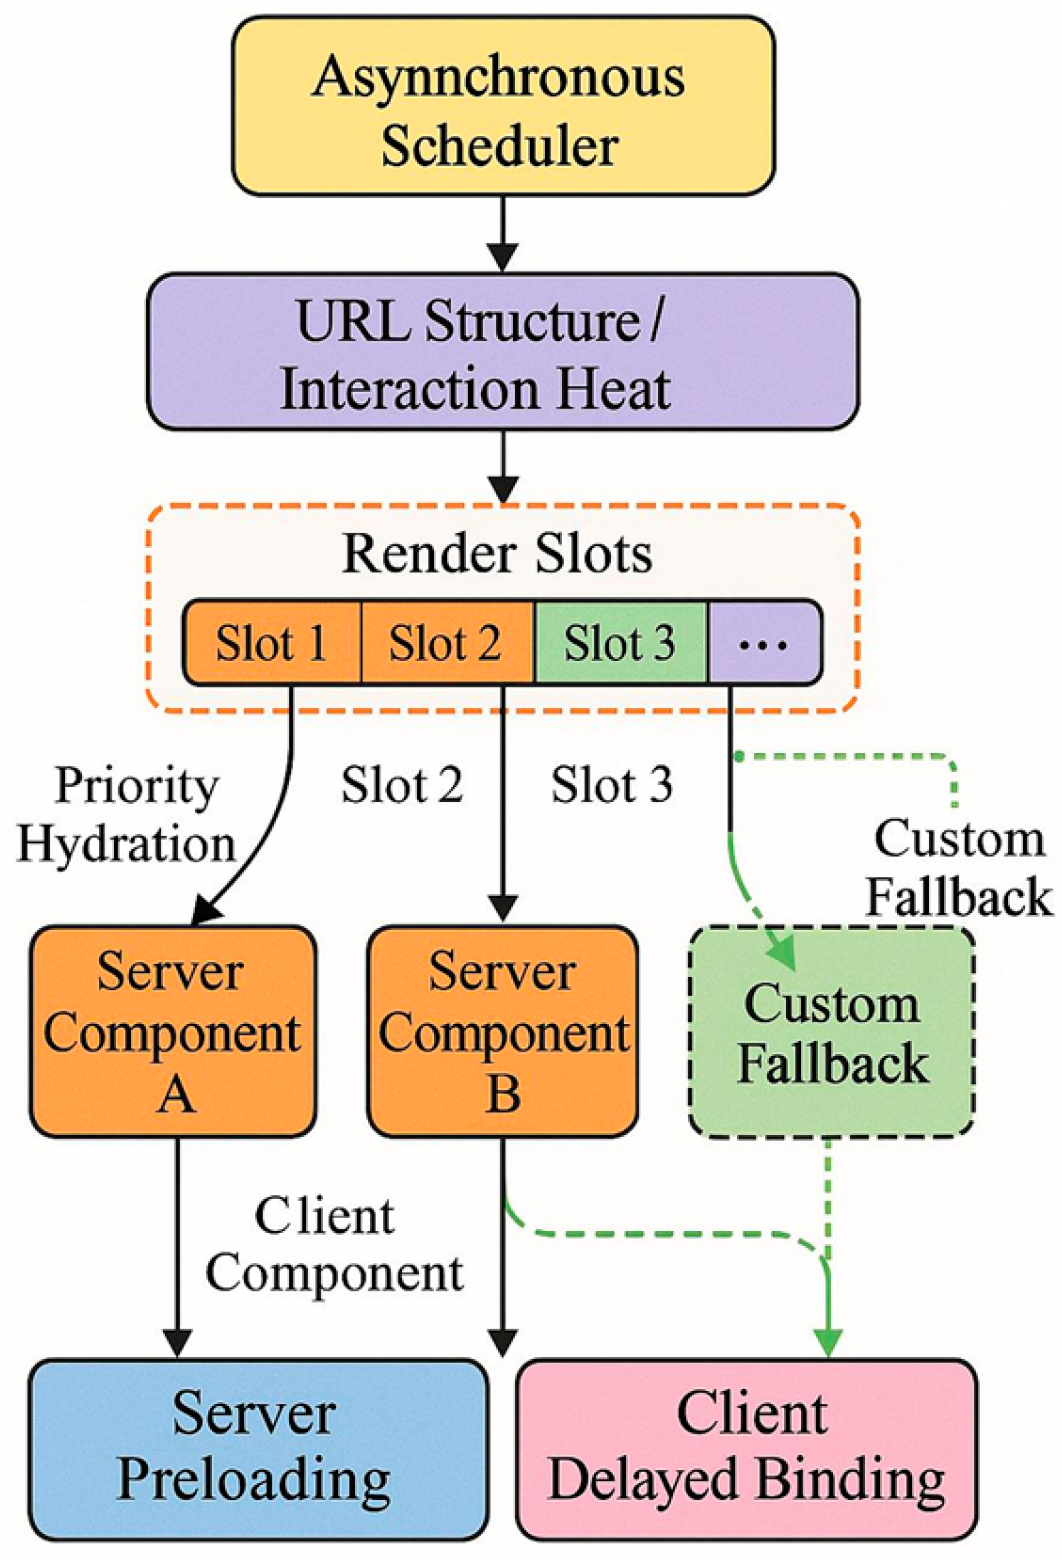
Figure 2.
Multi-level Caching and Dynamic Scheduling Control Architecture Diagram.
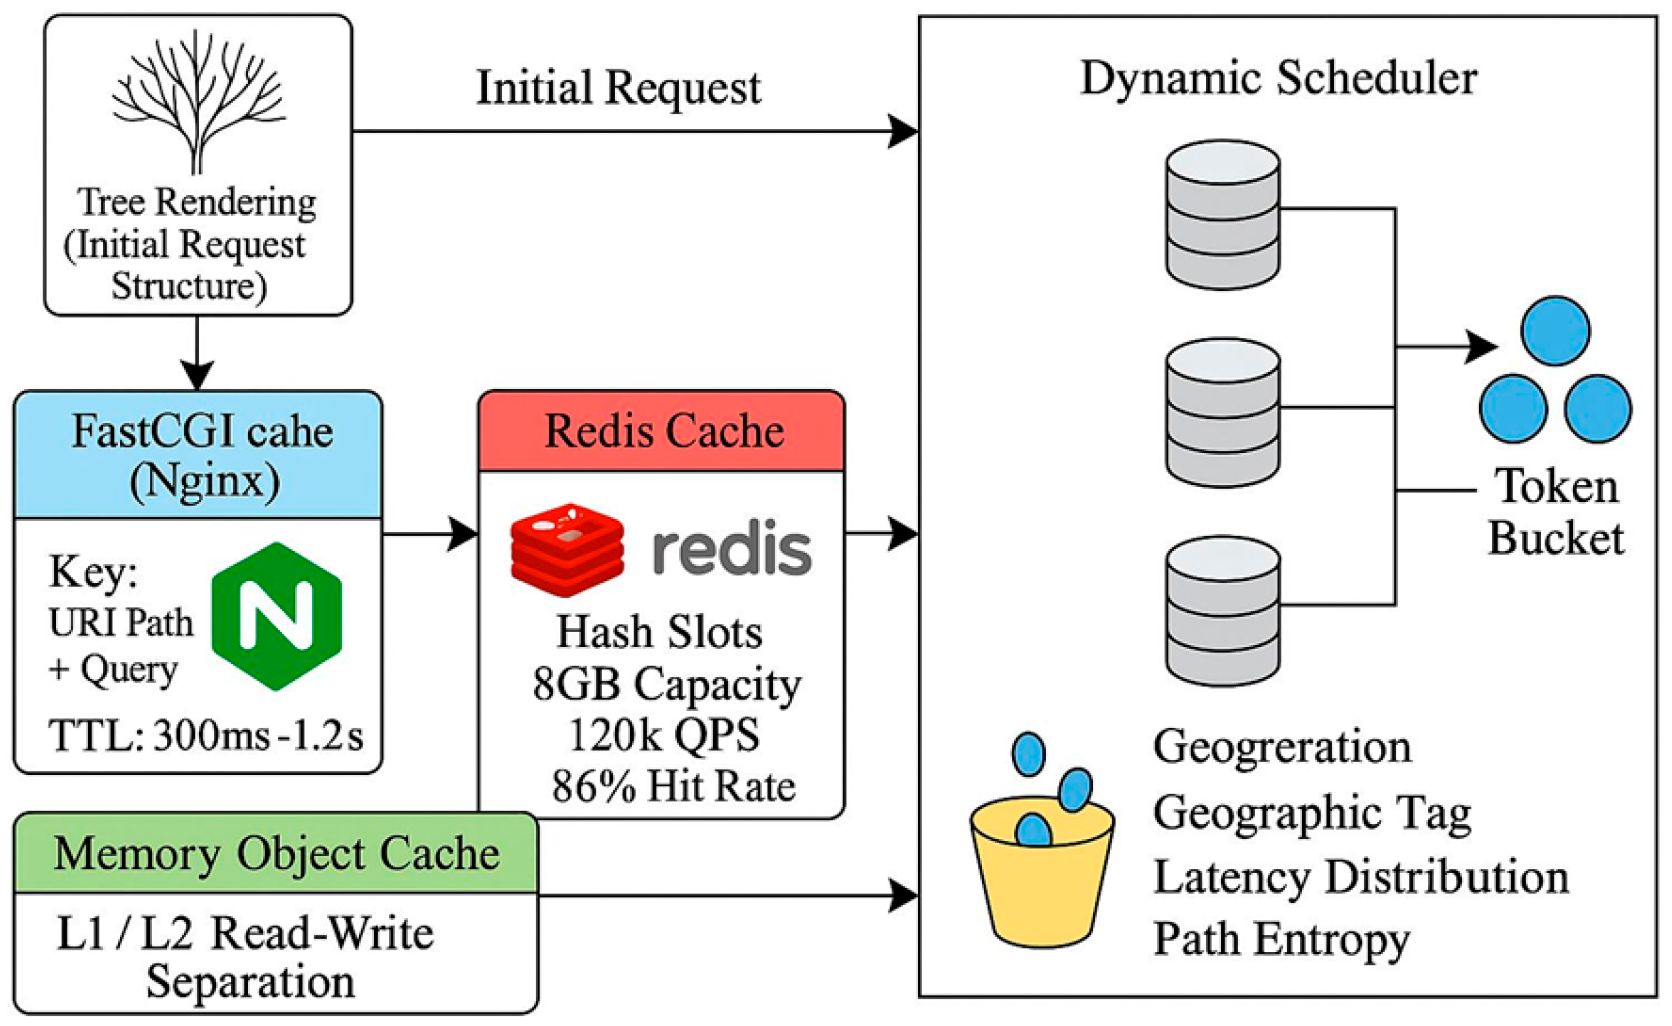
Figure 3.
Frontend-Backend Collaborative Scheduling Feedback Architecture.
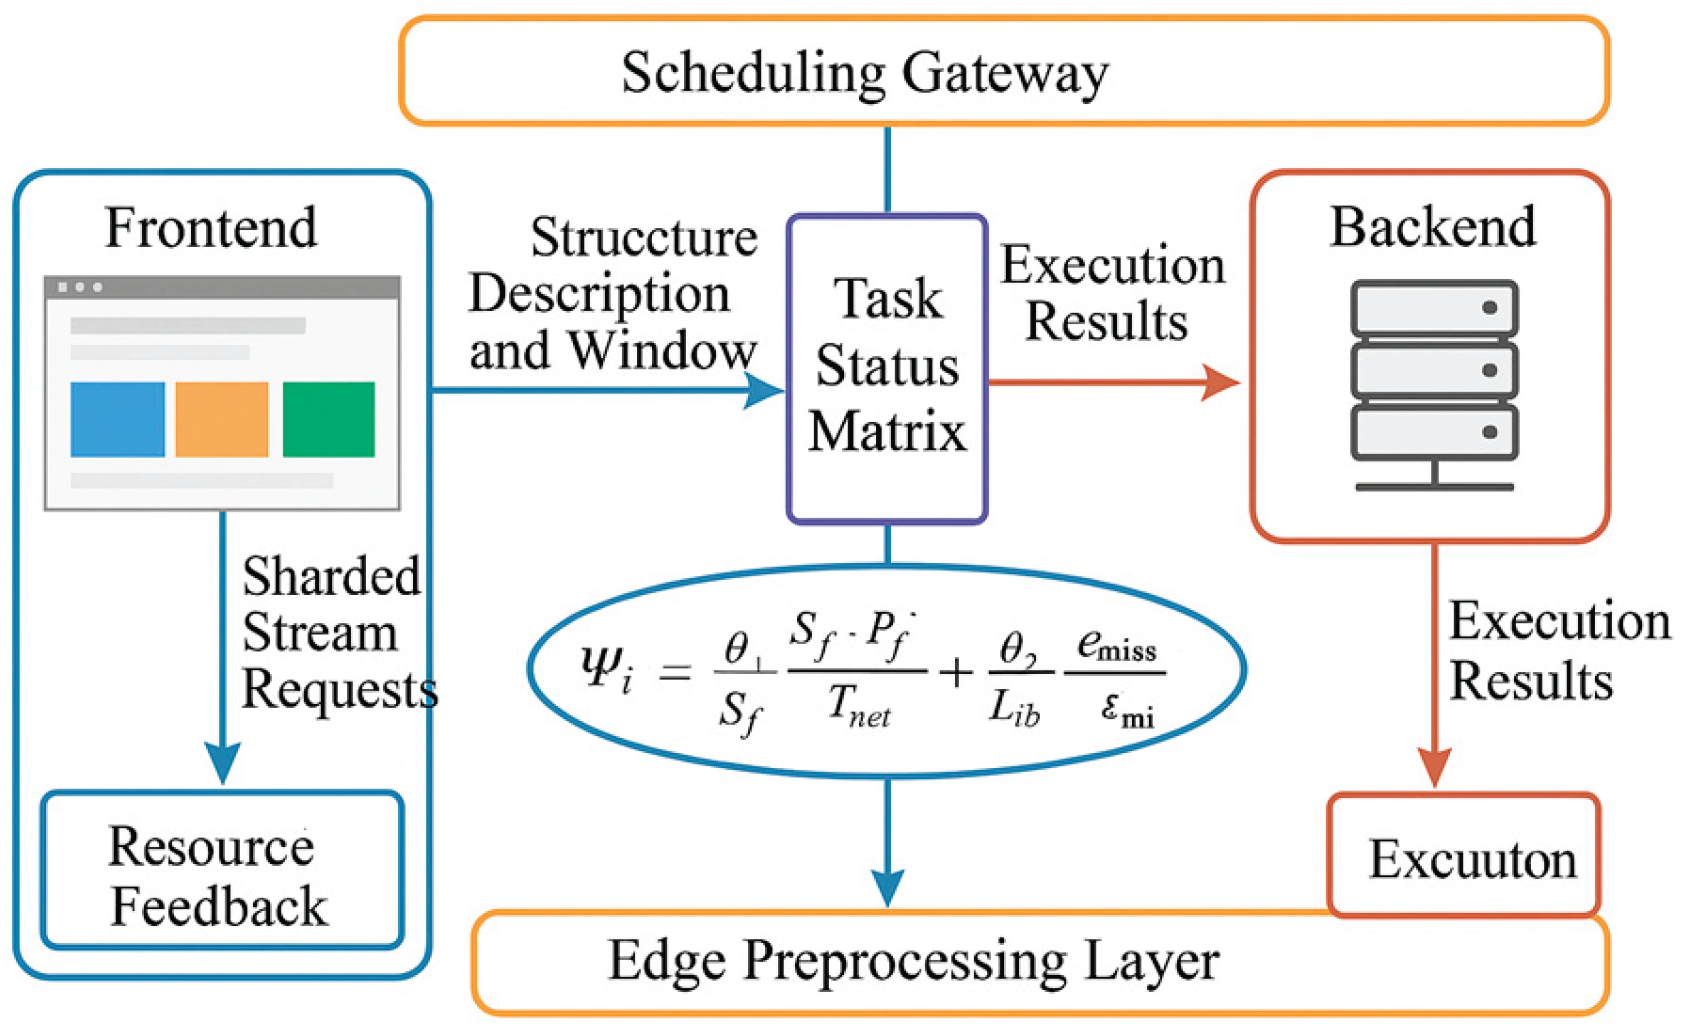
Figure 4.
Scatter Plot of Latency and Power Consumption Synergy Distribution Under Concurrent Requests.
Figure 4.
Scatter Plot of Latency and Power Consumption Synergy Distribution Under Concurrent Requests.
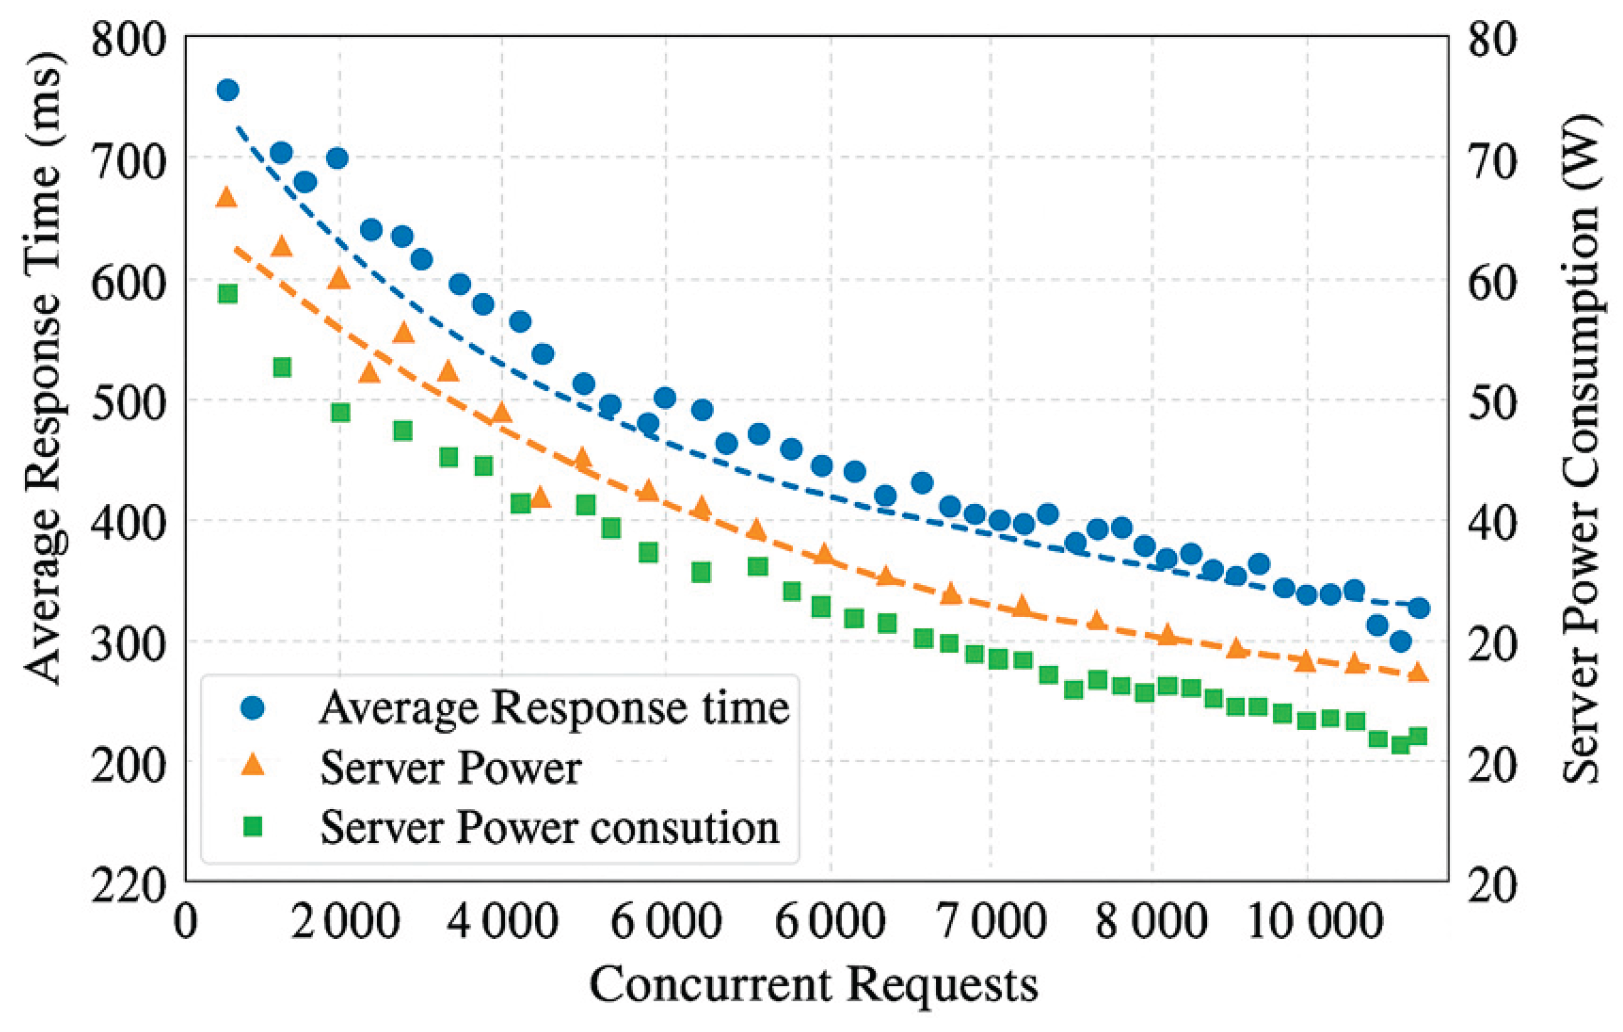

Table 1.
Key Performance Metrics at Different Concurrent Request Levels.
| Number of Concurrent Users | Avg. Response Time (ms) | P95 Latency (ms) | Redis Hit Rate (%) | Power Draw (W) |
| 1,000 | 214 | 386 | 81.2 | 124.3 |
| 3,000 | 302 | 514 | 83.5 | 147.1 |
| 5,000 | 387 | 603 | 85.8 | 165.7 |
| 7,000 | 421 | 658 | 86.7 | 179.4 |
| 10,000 | 452 | 689 | 87.1 | 188.3 |
Disclaimer/Publisher’s Note: The statements, opinions and data contained in all publications are solely those of the individual author(s) and contributor(s) and not of MDPI and/or the editor(s). MDPI and/or the editor(s) disclaim responsibility for any injury to people or property resulting from any ideas, methods, instructions or products referred to in the content. |
© 2026 by the authors. Licensee MDPI, Basel, Switzerland. This article is an open access article distributed under the terms and conditions of the Creative Commons Attribution (CC BY) license (http://creativecommons.org/licenses/by/4.0/).
Copyright: This open access article is published under a Creative Commons CC BY 4.0 license, which permit the free download, distribution, and reuse, provided that the author and preprint are cited in any reuse.


