
Submitted:
16 January 2026
Posted:
16 January 2026
You are already at the latest version
Abstract
This work addresses the qualification of photovoltaic micromodules intended for energy-harvesting applications in Internet of Things systems and proposes a novel qualification method based on highresolution electronic signature masks obtained through Time-Domain Reflectometry. The method applies frequency-to-time conversion of measured S11 parameters acquired using a Vector Network Analyzer under laboratory conditions. Accelerated reliability testing is employed as a sample preparation stage to validate the proposed qualification approach and to contextualize micromodules within a framework beyond existing regulatory standards, which currently exclude PV devices below 5 Wp. The qualification method based on pass/fail TDR signature masks demonstrated in this study has the potential to become a powerful tool for quality inspection of photovoltaic micromodules by assessing deterioration over time. The research introduces TDR technology—traditionally associated with high-frequency telecommunications—into the photovoltaic contex for research and development, manufacturing inspection, and certification purposes.
Keywords:
photovoltaic micromodules
; energy harvesting
; time-domain reflectometry (TDR)
; electronic signature mask
; S-parameters
; vector network analyzer (VNA)
; reliability testing
; IoT systems
; pass/fail qualification
; accelerated degradation
1. Introduction
Despite the maturity of qualification and inspection methodologies for conventional photovoltaic modules, PV micromodules remain outside the scope of current regulatory frameworks. Brazilian standards governing photovoltaic qualification, such as INMETRO Regulation No. 140, apply exclusively to devices with rated power above . Consequently, there is a regulatory and scientific gap concerning performance, reliability, and environmental behaviour of low-power photovoltaic components, particularly in Internet of Things (IoT) applications [1,2,3,4]. This gap becomes critical given that micromodules are increasingly deployed as energy harvesting sources in environments characterised by severe power constraints, intermittent illumination, and stringent miniaturisation requirements. To address this scenario, this work proposes an innovative qualification methodology for crystalline silicon photovoltaic micromodules based on Time-Domain Reflectometry (TDR) as a high-resolution electrical characterisation tool [5,6,7]. The methodology consists of extracting the electrical signature of micromodules using the reflected parameter obtained from vector network analysers (VNAs), and employing this signature to detect structural alterations, internal defects, and degradation effects associated with natural or accelerated ageing mechanisms.
The proposed strategy relies on establishing reference electronic signatures for devices classified as healthy, enabling the construction of pass/fail electronic masks. These masks act as tolerance windows to monitor statistically significant variations in the TDR response of tested devices. It is assumed that any relevant structural, electrical, or material modification — arising from latent defects, microcracks, corrosion, delamination, or environmental stress — will induce detectable changes in the measured reflection signature. Furthermore, accelerated ageing tests including salt mist exposure, damp heat cycling and thermal cycling were conducted to induce multiple degradation mechanisms in the samples. These controlled stress experiments enable the evaluation of how the electronic signature evolves under environmental loading and allow correlating specific degradation modes to distinctive patterns observed in the TDR measurements. Finally, this work presents the TDR mask methodology as a precise, reliable, and innovative tool for the qualification of photovoltaic micromodules within laboratory environments.
2. Time-Domain Reflectometry Using VNA Scattering Parameters: Theory and Methodology
Time-Domain Reflectometry (TDR) is a measurement technique originally developed for detecting impedance discontinuities along transmission lines in telecommunications. When transferred to photovoltaic micromodules, TDR provides a purely structural electrical characterization, enabling early detection of damage and degradation mechanisms that manifest as impedance perturbations [8,9,10].
Although TDR is conceptually a time-domain method, modern implementations rely on frequency-domain data acquired by Vector Network Analyzers (VNAs) [11,12,13,14,15,16]. Therefore, the reflectometry waveform must be numerically reconstructed from the measured scattering parameter .
2.1. Acquisition of Frequency-Domain Data
A Vector Network Analyzer measures the complex scattering parameters of a device under test (DUT), relating incident and reflected waves at port i according to (1),
Where quantifies the fraction of the injected energy reflected back to the source. The measurement is performed at discrete, uniformly spaced frequencies as (2),
Uniform spacing is a fundamental prerequisite for inverse Fourier transformation. When the DC term is not measured, it is extrapolated as (3),
2.2. Transformation to Time Domain
TDR reconstruction follows directly from the inverse Fourier transform [11], expressed in continuous form as (4),
Where represents the reflection in the time domain.
In discrete form, due to sampling at N frequencies, the inverse discrete Fourier transform (IDFT) is used (5) and with the associated temporal grid as (6),
Where ensures efficient FFT computation.
To obtain a real-valued waveform, the Hermitian spectrum is formed by concatenating the measured positive-frequency branch (7) with the complex-conjugate mirrored negative branch (8), yielding the composite spectrum (9),
Spectral leakage—ringing due to finite acquisition bandwidth—is mitigated by windowing by (10),
Where may be rectangular, Hann, Hamming, Blackman or Kaiser [16]. In this work, rectangular windowing is adopted so as not to broaden features in the reconstructed impedance profile.
2.3. Impedance Reconstruction and Interpretation
Reflectometry traces are expressed in terms of the instantaneous reflection coefficient as show in (11), from which the distributed impedance profile is obtained through (12). In practice, the real component is used (13) is used as the basis for comparison,
Multiple reflections and localized impedance shifts correspond to temporal peaks and valleys, each mapped to a physical feature of the micromodule (busbar, cell fragments, interconnects).
Finite-width excitation pulses used by VNAs broaden reflections, where spatial resolution obeys (14),
With being the propagation velocity and the effective pulse width. Thus, shorter effective pulses (higher ) resolve finer defects.
2.4. Statistical Definition of the Qualification Mask
To reduce high-frequency oscillations, Savitzky–Golay smoothing is applied (15),
And variability is quantified by the pointwise percentage error (17),
Based on this distribution, a pass/fail mask is constructed by applying tolerance bounds as (18),
Each tested micromodule is evaluated by the fraction of points violating the mask (19),
This integrated TDR methodology transforms conventional VNA reflection measurements into a spatial impedance fingerprint, enabling systematic comparison across samples. Deviations from a reference signature—quantified through statistical masking—serve as a rapid metric of degradation, supporting qualification of micromodule integrity.
3. Preparation of Micromodule Samples
3.1. Identification of Photovoltaic Micromodules
Commercial samples of photovoltaic (PV) micromodules specifically designed for energy-harvesting applications were manufactured and distributed into two distinct families (A and B). The physical dimensions of the devices are shown in Figure 1, while Table 1 summarize the total sample population considered in the experiments. Both families are composed of bifacial Passivated Emitter and Rear Cell (PERC) technology, commonly employed in compact photovoltaic micromodules. Micromodules intended for energy-harvesting applications differ structurally from conventional photovoltaic modules. These differences include the absence of bypass diodes, the adoption of a single-busbar configuration, the lack of MC4 connectors, and the use of reduced-size fragmented solar cells. Despite these differences, the lamination process of the micromodules follows the same principles applied to traditional PV modules and consists of tempered glass, EVA encapsulant layers, and a polymeric backsheet.
3.2. Sample Selection and Control Strategy
Validation of the qualification methodology based on TDR electronic signatures requires the definition of a reference sample set. For each family (A and B), three healthy samples were selected, which exhibited electrical and optoelectronic conformity with the parameters specified by the manufacturer. These samples constitute the control group and are used to construct the TDR mask.
For each family, the remaining modules were classified as test samples and subjected to accelerated degradation tests, including salt mist [17,18,19], thermal cycling [20,21,22,23,24], and damp heat [25,26,27,28]. The applied tests were additionally categorized by severity levels from 1 to 4. The objective is to induce representative failure mechanisms consistent with real-world PV module degradation. The TDR signatures of the degraded samples are later compared with the mask constructed from healthy units, enabling the assessment of method sensitivity and discrimination capability.
3.3. Sample Coding Scheme
To ensure traceability and standardization, a coding system based on the elements described in (22) was adopted,
Where , , with C = Control and M = Test, and . After the aging tests, all samples—degraded or not—were reanalyzed using the pre-established TDR mask. The goal is to investigate whether the electronic signature exhibits systematic variations capable of indicating the onset or progression of electrical or structural degradation in the micromodule.
3.4. Degradation Testing of PV Micromodules
To assess the robustness and reliability of the PV micromodules, the full sample population—except those classified as control—was subjected to accelerated degradation tests in environmental chambers Thermotron, Vötsch, and ABMTM salt mist chamber. The applied stress protocols included: (i) salt mist [17,18,19]; (ii) thermal cycling [20,21,29]; and (iii) damp heat [25,27,28], each implemented across distinct severity levels. The objective of these tests is to induce, in a controlled manner, representative degradation mechanisms typically observed in field conditions, particularly relevant to the tropicalization of electronic products, thereby enabling subsequent comparison between healthy and degraded samples. It is emphasized that, throughout the entire testing period, the samples remained unpowered, ensuring that the observed failures were exclusively attributable to the applied environmental stresses.
3.5. Accelerated Stress Test Arrangement
Figure 2 illustrates the experimental infrastructure employed for the accelerated degradation tests applied to the PV micromodules and Table 2 summarizes the methodologies applied and their corresponding severity levels.
Electroluminescence imaging inspection techniques were used to quantify the structural degradation of the samples [30,31,32]. Approximately 50% of the population exhibited measurable degradation with direct impact on energy generation performance. These degraded samples will form the validation basis for the TDR mask method, enabling evaluation of its ability to reliably distinguish degraded micromodules from those considered healthy.
4. Qualification of PV Micromodules via TDR Masking
The proposed qualification method is based on the detection of structural and electrical degradation in photovoltaic (PV) micromodules using the electronic signature obtained through Time-Domain Reflectometry (TDR). The method is grounded on the hypothesis that each micromodule exhibits a unique electromagnetic behavior determined by its internal geometry, materials, and manufacturing process. Therefore, variations introduced by defects or degradation mechanisms modify the electronic signature measured in the time domain.
The primary objectives of the method can be summarized as follows: (I) Establish a unique and reproducible electronic signature for each structural pattern of PV micromodules, (II) Detect and quantify degradation-induced anomalies by comparing healthy samples with samples subjected to reliability tests
4.1. Test Fixture for TDR Pulse Injection
To ensure reproducible conditions, optical isolation, and proper TDR pulse coupling into the micromodules, a dedicated measurement fixture was developed. This fixture ensures: minimization of coupling losses, a stable and repeatable reference plane, shielding from ambient light, and geometric repeatability across measurements. Figure 3 shows the manufactured fixture along with cross-sectional and top-view schematics.
4.2. Return-Loss Measurement Setup for PV Micromodules
The return-loss experiment was conducted using the classical configuration for RF characterization of passive devices. The test fixture was connected to a VNA (model ENA 5071C), with a termination at the DUT far end to ensure symmetric and stable measurement conditions. A 85052D mechanical calibration kit, calibrated RF coaxial cable (SMA male–female), ESD wrist strap, and a linear sweep from 500 kHz to 20 GHz with 2001 points were used. Figure 4 shows the laboratory setup.
All 24 samples were measured to obtain , which is the fundamental dataset for reconstructing the TDR electronic signatures.
4.3. Interpretation of the Electronic Signature
The time-domain electronic signature contains multiple reflections originating from both the DUT and the test fixture. Therefore, it is essential to identify and segment unwanted contributions to ensure that only internal discontinuities within the micromodule are analyzed. Figure 5 illustrates the separation between reflections from the measurement system and reflections inherent to the DUT. Due to spatial heterogeneity in dielectric permittivity among the measurement components, time–distance conversion is not employed as an absolute metric; instead, the analysis is carried out directly in the time domain.
4.4. Mask Construction and Percent Error Analysis
To validate the TDR method, a test mask was defined based on the mean electronic signature of the control samples. Figure 6 show the masks for Families A and B, along with the pointwise percentage error relative to the mean signature.
The mask incorporates an acceptable percentage deviation threshold, accounting for device stability, solder uniformity, electrical polarization symmetry, and intrinsic manufacturing variation. Limits of of the average value were adopted as a design rule.
4.5. Experimental Validation of the TDR Mask
With the mask established, automatic qualification was carried out comparing healthy micromodules with degraded micromodules from the reliability tests. Figure 7 and Figure 8 show the final results for Families A and B.
The method exhibited a tolerance of , demonstrating robustness against fixture instability and small variations in electrical contact.
5. Discussion of the Results
After validating the qualification method based on the TDR mask, a detailed analysis of the rejected samples was carried out with the objective of identifying peak/trough divergences, temporal displacements, and alterations in the electronic signature responsible for the observed degradation. Figure 9 and Figure 10 consolidate the graphical comparison between the degraded samples and the reference patterns from Families A and B.
Table 3 summarizes the degradation effects caused by the accelerated reliability tests observed in each rejected sample.
In general, the samples that presented dead zones had suppression of the first valley as their main characteristic, while the samples that presented moisture penetration in the central busbar showed phase shift due to pulse propagation delay as their main characteristic. However, other defects such as electrode cracks due to microcracks, sparse dark blotches, and reduction in overall light intensity did not present distinct and clear results, behaving randomly in relation to their impact on the TDR electronic signature.
6. Conclusions
This work presented and experimentally validated a qualification methodology for photovoltaic micromodules based on high-resolution electronic signatures generated through Time-Domain Reflectometry (TDR). The method addresses the current absence of qualification standards for low-power photovoltaic devices by enabling rapid, illumination-independent detection of structural and electrical degradation.
Using VNA-based acquisition and Fourier reconstruction, combined with a dedicated coupling test fixture, the approach delivered repeatable TDR signatures from which statistical pass/fail masks were derived. Results showed that degraded micromodules systematically violated these masks, confirming the effectiveness and sensitivity of the method.
A key limitation, however, remains: while the TDR mask clearly indicates that degradation has occurred, it cannot distinguish the underlying failure mechanism. Identifying root causes—such as corrosion, moisture ingress, delamination, or metallization defects—still requires complementary diagnostic tools.
In summary, the proposed TDR-mask methodology provides a fast, robust path to qualify miniaturized photovoltaic devices, offering a reliable binary assessment (healthy vs. degraded) and representing a valuable step toward future standardization for energy-harvesting and IoT micromodules.
Acknowledgments
A.M.C.Silveira, V.V.Peruzzi are with Division of Projects, Analysis and Qualification of Electronic Circuits and K.O.Vieira are with Assembly, Packaging and Systems Integration Division both from Renato Archer Information Technology Center, Campinas, SP; L.C.Kretly are with Communications Department and L.T.Manera is with Department of Electronics and Biomedical Engineering both from School of Electrical and Computer Engineering (UNICAMP), Campinas, SP (email: allan.silveira@cti.gov.br). This work was partially supported by the Research Project Unicamp-Funcamp-BYD Energy Brazil under contract nº 84406-22 and PADIS (Brazilian Program for the Technological Development of the Semiconductor Industry) of MCTI, Brazil. In national collaboration between the Renato Archer Information Technology Center and the Faculty of Electrical and Computer Engineering, through SEI process no. 01241.000289/2025-53. Also thanks to CNPq (National Council for Scientific and Technological Development) for granting of scholarship to the author with the process number 445074/2020-5. The authors would like to thank LSERF for their support. The authors also thanks LESF-MV for providing the photovoltaic micromodule samples.
References
- Rincón-Mora, G.A.; Vogt, J. Self-powered wireless sensor nodes: Among other things, a load management feat. Power Management Des. Line 2007.
- Sarker, M.R.; Riaz, A.; Lipu, M.H.; Saad, M.H.M.; Ahmad, M.N.; Kadir, R.A.; Olazagoitia, J.L. Micro energy harvesting for IoT platform: Review analysis toward future research opportunities. Heliyon 2024, 10. [CrossRef]
- Tsenempis, I.; Filios, G.; Katsidimas, I.; Nikoletseas, S. Energy harvesting and smart management platform for low power IoT systems. In Proceedings of the 2019 15th International Conference on Distributed Computing in Sensor Systems (DCOSS). IEEE, 2019, pp. 339–346.
- Yue, X.; Kauer, M.; Bellanger, M.; Beard, O.; Brownlow, M.; Gibson, D.; Clark, C.; MacGregor, C.; Song, S. Development of an indoor photovoltaic energy harvesting module for autonomous sensors in building air quality applications. IEEE Internet of Things Journal 2017, 4, 2092–2103. [CrossRef]
- Ramo, S.; Whinnery, J.R.; Van Duzer, T. Fields and waves in communication electronics; John Wiley & Sons, 1994.
- Note, T.A. TDR Impedance Measurements: A Foundation for Signal Integrity, 2004.
- Packard, H. Time Domain Reflectometry Theory (Application Note 1304-2), 1998.
- Silveira, A.; Barbin, S.; Kretly, L. Using TDR-Time Domain Reflectometry Measurements to Compare Ribbon Busbar versus Wire Busbar Connections in Polycrystalline Solar Cells: The Signature Approach. In Proceedings of the 2018 IEEE-APS Topical Conference on Antennas and Propagation in Wireless Communications (APWC). IEEE, 2018, pp. 1–3.
- Silveira, A.; Neves, M.; Garcia, R.; Alvarez, H.; Villalva, M.; Marques, F.; Kretly, L. Characterization of solar cell busbar grid for different technologies by time domain reflectometry simulation: Transmission line approach. In Proceedings of the 2023 IEEE 50th Photovoltaic Specialists Conference (PVSC). IEEE, 2023, pp. 1–5.
- da Silveira, A.M.; Brasil, G.T.; de Melo, W.R.; Peruzzi, V.V.; Finco, S.; Manera, L.T. Characterization of Specific Contact Resistivity in Commercial Bifacial Solar Cell Contact Electrodes: TLM Measurement Approach. In Proceedings of the 2025 39th Symposium on Microelectronics Technology and Devices (SBMicro). IEEE, 2025, Vol. 1, pp. 1–4.
- Brigham, E.O. The fast Fourier transform and its applications; Prentice-Hall, Inc., 1988.
- Pozar, D.M. Microwave engineering: theory and techniques; John wiley & sons, 2021.
- Frerking, M. Digital signal processing in communications systems; Springer Science & Business Media, 2013.
- Pfaff, B. Analysis of integrated and cointegrated time series with R; Springer Science & Business Media, 2008.
- Oppenheim, A.V. Discrete-time signal processing; Pearson Education India, 1999.
- Harris, F.J. On the use of windows for harmonic analysis with the discrete Fourier transform. Proceedings of the IEEE 2005, 66, 51–83. [CrossRef]
- Rana, Z.; Zamora, P.P.; Soliz, A.; Soler, D.; Reyes Cruz, V.E.; Cobos-Murcia, J.A.; Galleguillos Madrid, F.M. Solar Panel Corrosion: A Review. International Journal of Molecular Sciences 2025, 26, 5960. [CrossRef]
- Mohamed, B.; Zambou, S.; Zekeng, S.S. Influence of moisture on the operation of a mono-crystalline based silicon photovoltaic cell: A numerical study using SCAPS 1 D. arXiv preprint arXiv:1712.08117 2017. [CrossRef]
- Neves, M.R.; Silveira, A.; Alvarez, H.S.; Garcia, R.M.; Marques, F.C.; Villalva, M.G. Effects of Salt Spray on c-Si Photovoltaic Modules in the Brazilian Region. In Proceedings of the 2023 IEEE 50th Photovoltaic Specialists Conference (PVSC). IEEE, 2023, pp. 1–6.
- Chen, X.; Karin, T.; Jain, A. Analyzing the impact of design factors on solar module thermomechanical durability using interpretable machine learning techniques. Applied Energy 2025, 377, 124462. [CrossRef]
- Aoki, Y.; Okamoto, M.; Masuda, A.; Doi, T. Module performance degradation with rapid thermal-cycling. Proceedings of Renewable Energy 2010.
- Pandey, S.; Kumar, S.; Mhatre, R.; Singh, T. Analysis of performance degradation of PV modules. Available online: https://www. powermag. com/analysis-of-performance-degradation-of-pv-modules/(accessed on 30.09. 2024) 2023.
- Aghaei, M.; Fairbrother, A.; Gok, A.; Ahmad, S.; Kazim, S.; Lobato, K.; Oreski, G.; Reinders, A.; Schmitz, J.; Theelen, M.; et al. Review of degradation and failure phenomena in photovoltaic modules. Renewable and Sustainable Energy Reviews 2022, 159, 112160. [CrossRef]
- Rahman, T.; Mansur, A.A.; Hossain Lipu, M.S.; Rahman, M.S.; Ashique, R.H.; Houran, M.A.; Elavarasan, R.M.; Hossain, E. Investigation of degradation of solar photovoltaics: A review of aging factors, impacts, and future directions toward sustainable energy management. Energies 2023, 16, 3706. [CrossRef]
- Irikawa, J.; Hashimoto, H.; Kanno, H.; Taguchi, M. Correlation between damp-heat test and field operation for electrode corrosion in photovoltaic modules. Solar Energy Materials and Solar Cells 2025, 284, 113375. [CrossRef]
- Karin, T.; Jones, C.B.; Jain, A. Photovoltaic climate zones: The global distribution of climate stressors affecting photovoltaic degradation. In Proceedings of the Proc. 36th Eur. Photovolt. Sol. Energy Conf. Exhib.(EUPVSEC) pp, 2020, pp. 825–834.
- Park, H.; So, W.; Kim, W.K. Performance evaluation of photovoltaic modules by combined damp heat and temperature cycle test. Energies 2021, 14, 3328. [CrossRef]
- Deibel, C.; Dyakonov, V.; Parisi, J. Spectroscopy of electronic defect states in Cu (In, Ga)(S, Se) 2-basedheterojunctions and Schottky diodes under damp-heat exposure. Europhysics Letters 2004, 66, 399. [CrossRef]
- Park, S.; Han, C. Analysis of EL images on Si solar module under thermal cycling. Journal of Mechanical Science and Technology 2022, 36, 3429–3436. [CrossRef]
- Fuyuki, T.; Kondo, H.; Yamazaki, T.; Takahashi, Y.; Uraoka, Y. Photographic surveying of minority carrier diffusion length in polycrystalline silicon solar cells by electroluminescence. Applied Physics Letters 2005, 86. [CrossRef]
- Hofierka, J.; Kaňuk, J. Assessment of photovoltaic potential in urban areas using open-source solar radiation tools. Renewable energy 2009, 34, 2206–2214. [CrossRef]
- Trupke, T.; Pink, E.; Bardos, R.; Abbott, M. Spatially resolved series resistance of silicon solar cells obtained from luminescence imaging. Applied Physics Letters 2007, 90. [CrossRef]
Figure 1.
a) Physical dimensions of the micromodules (according to datasheet); b) perspective view; c) rear view; d) EL image of a healthy Family A unit; e) EL image of a healthy Family B unit.
Figure 1.
a) Physical dimensions of the micromodules (according to datasheet); b) perspective view; c) rear view; d) EL image of a healthy Family A unit; e) EL image of a healthy Family B unit.
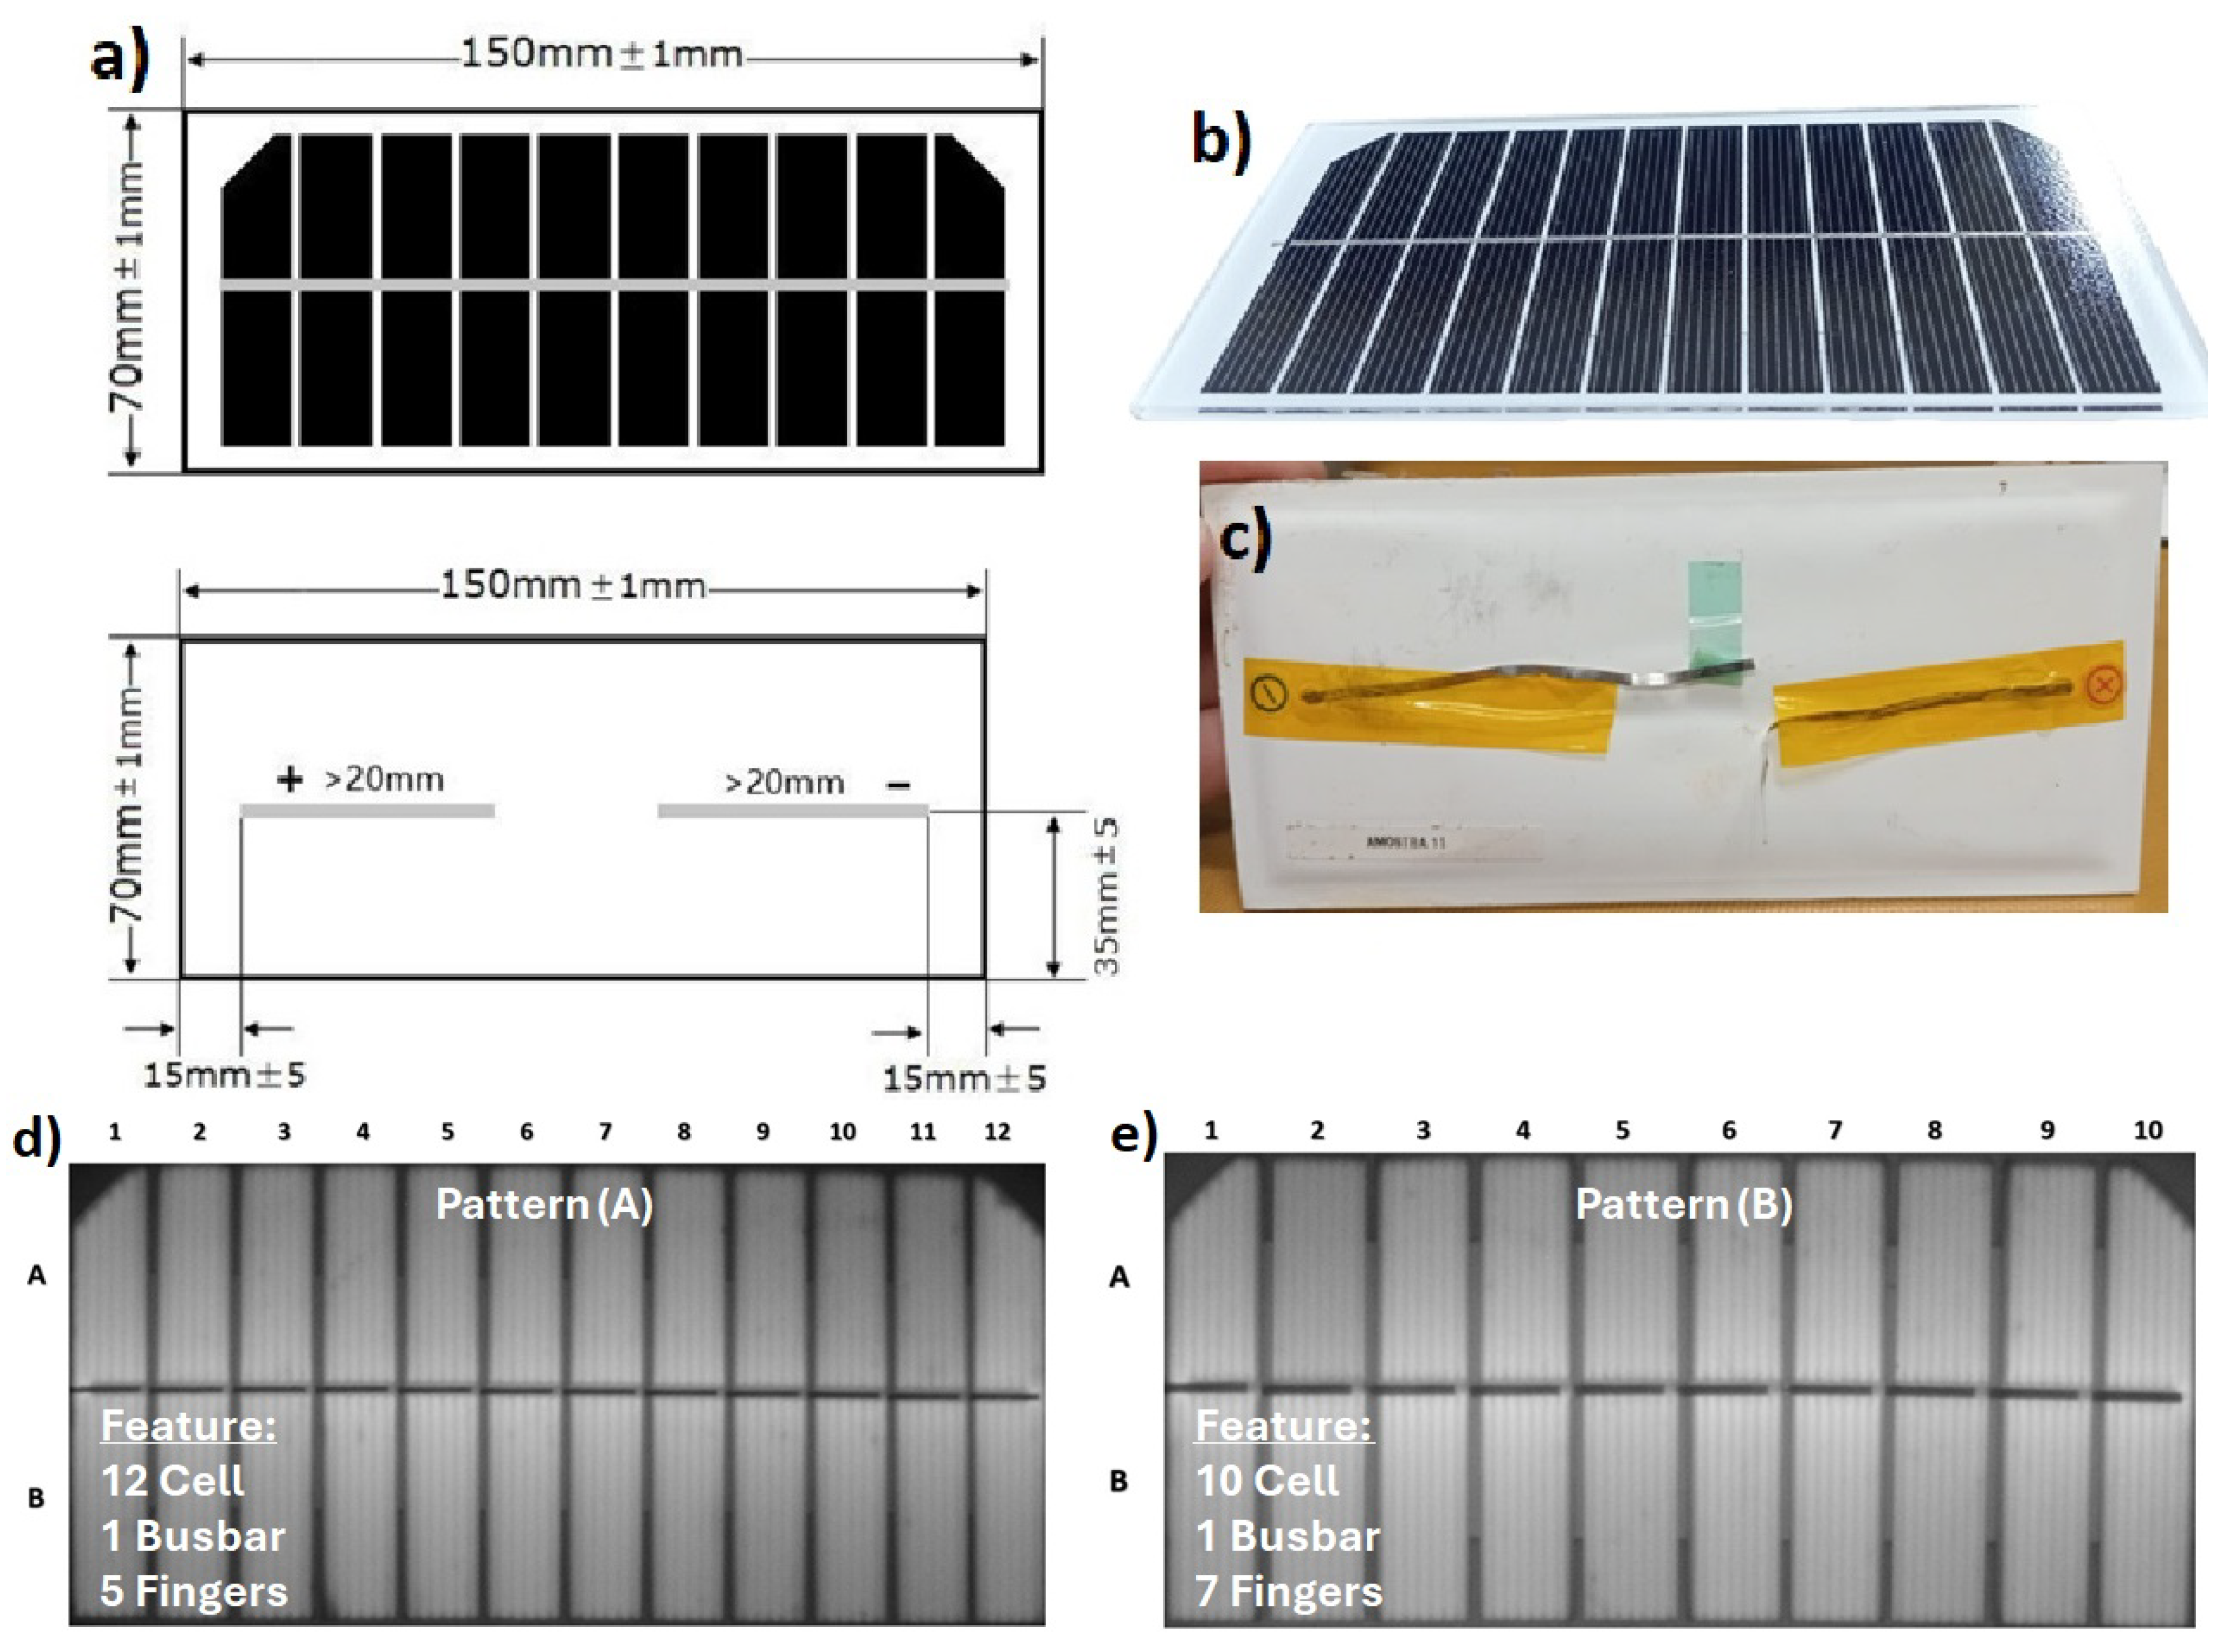
Figure 2.
a) Climatic chamber for damp-heat testing; b) Climatic chamber for thermal cycling; c) Salt spray chamber.
Figure 2.
a) Climatic chamber for damp-heat testing; b) Climatic chamber for thermal cycling; c) Salt spray chamber.
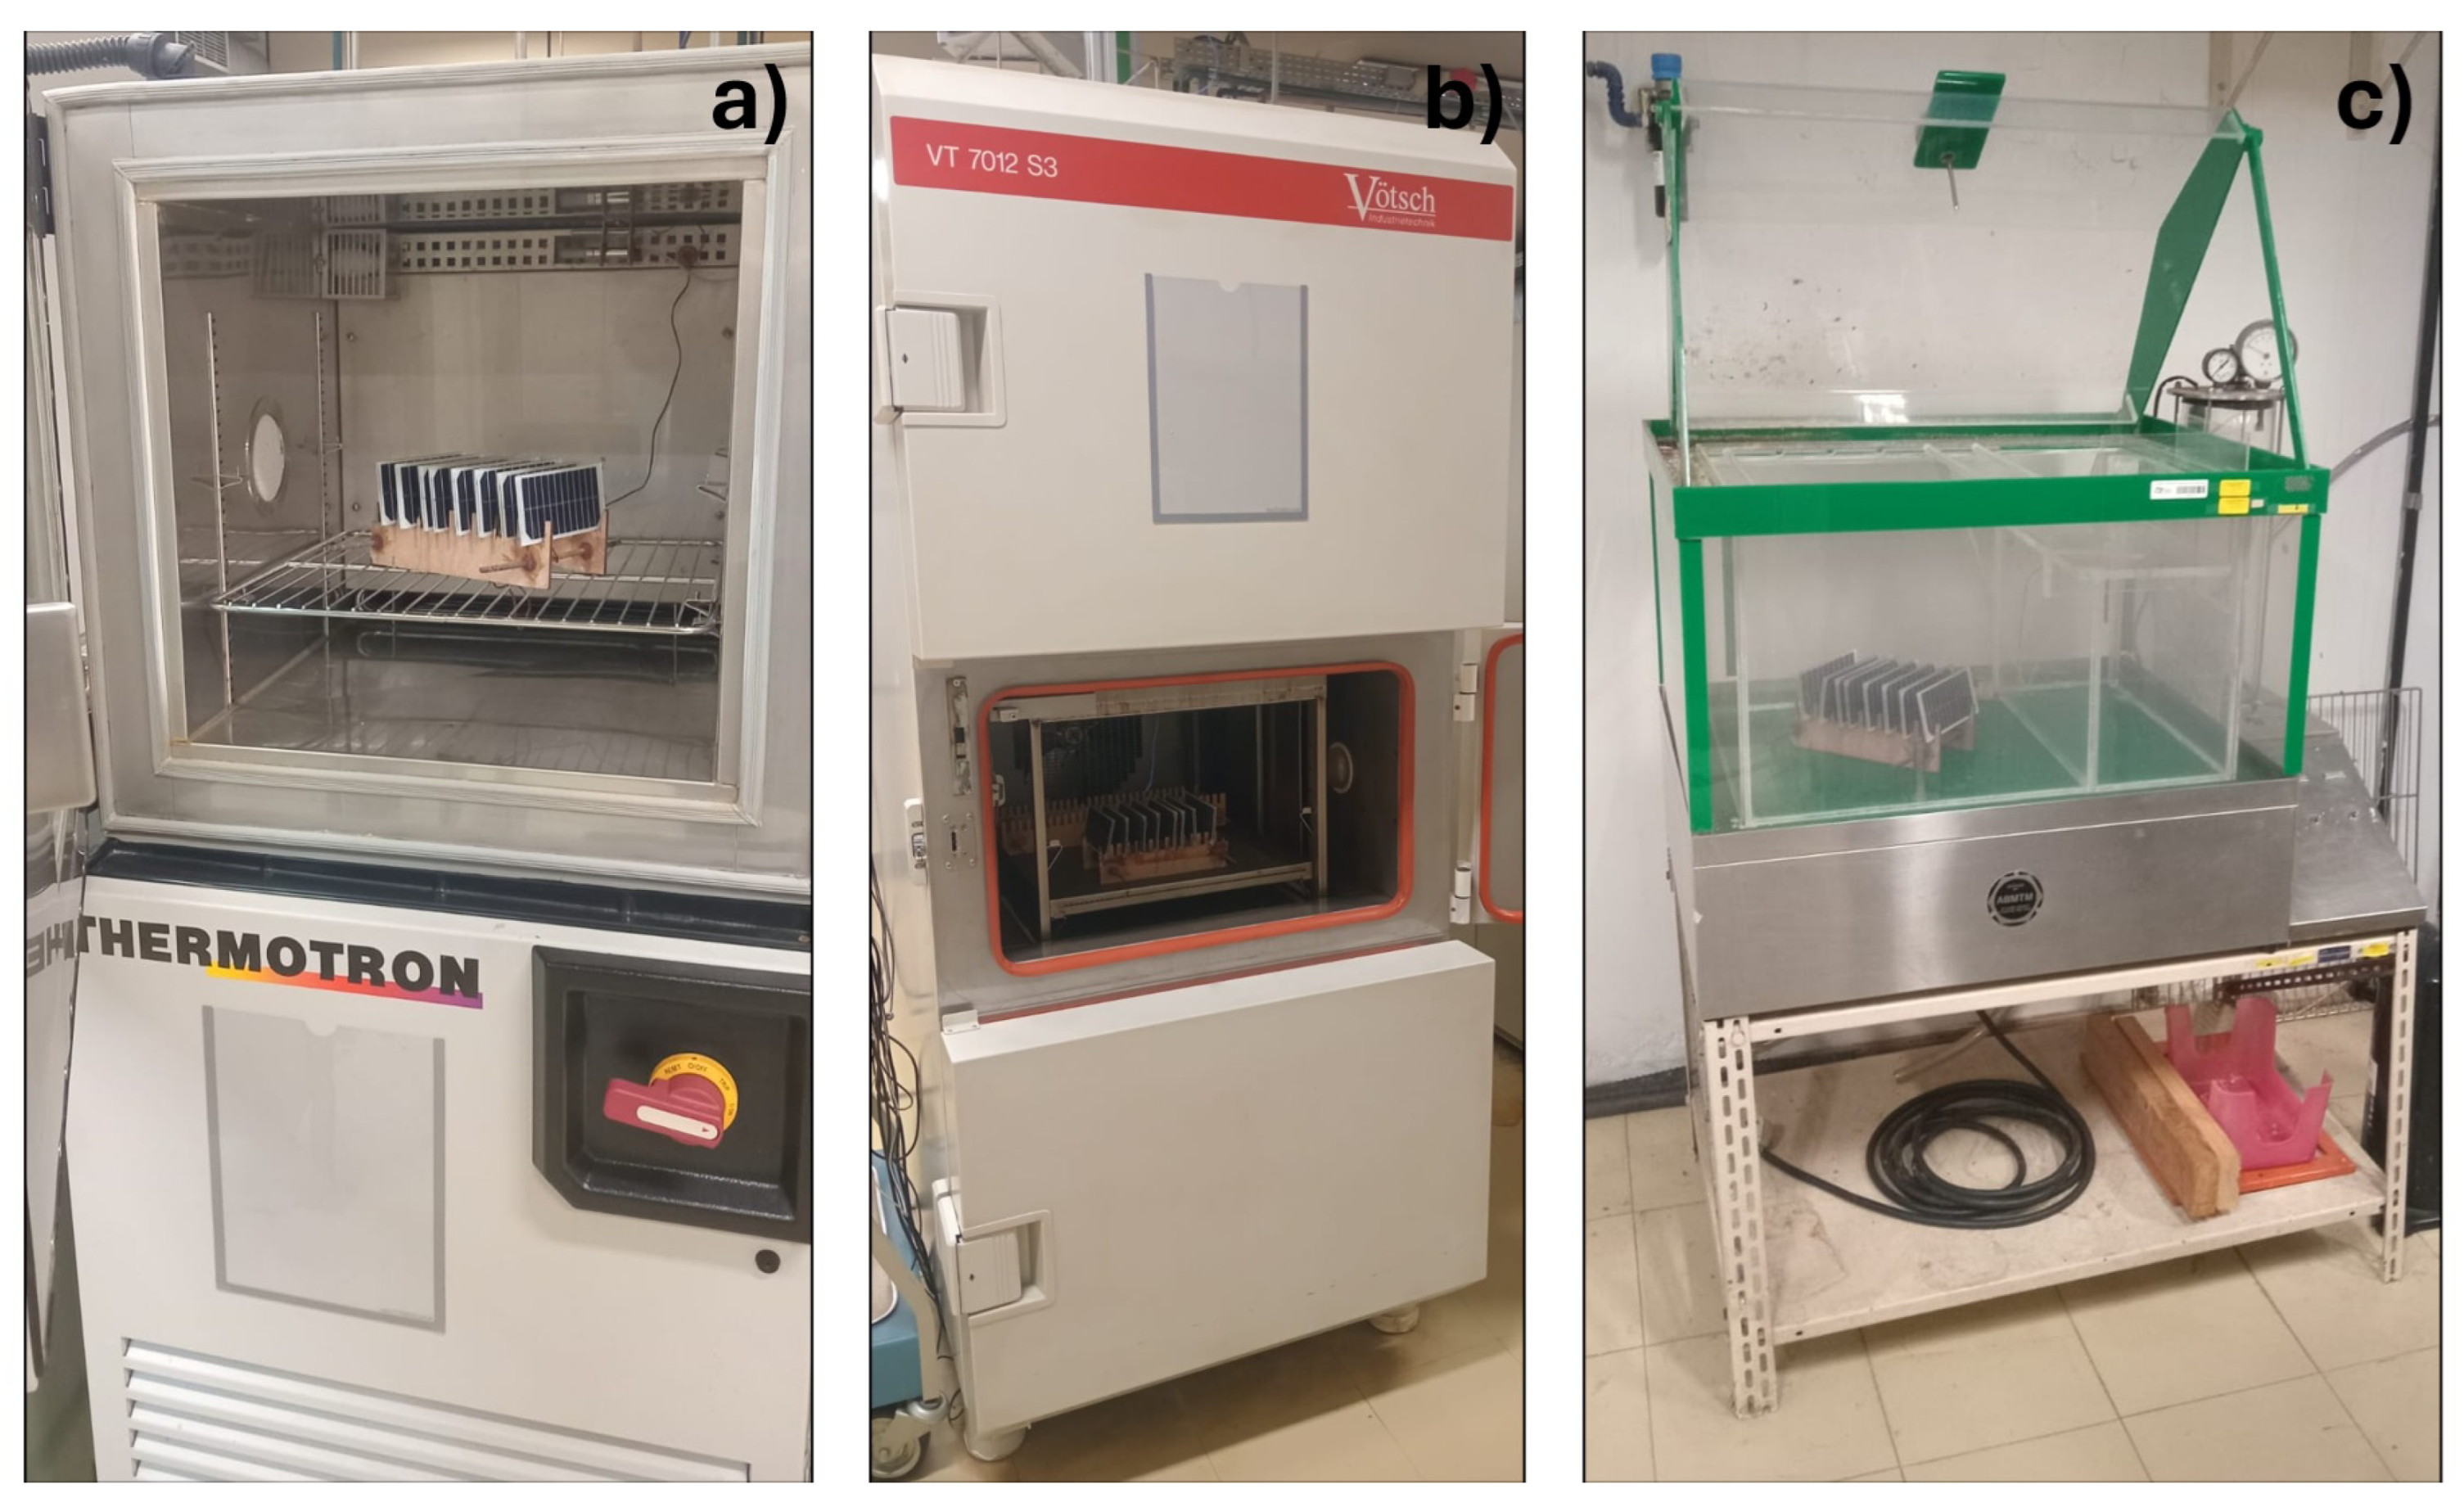
Figure 3.
Custom test fixture developed for TDR pulse coupling into PV micromodules a) Front view without the DUT, b) perspective view, c) Front view with the DUT d) Cross-section of the test setup schematic.
Figure 3.
Custom test fixture developed for TDR pulse coupling into PV micromodules a) Front view without the DUT, b) perspective view, c) Front view with the DUT d) Cross-section of the test setup schematic.
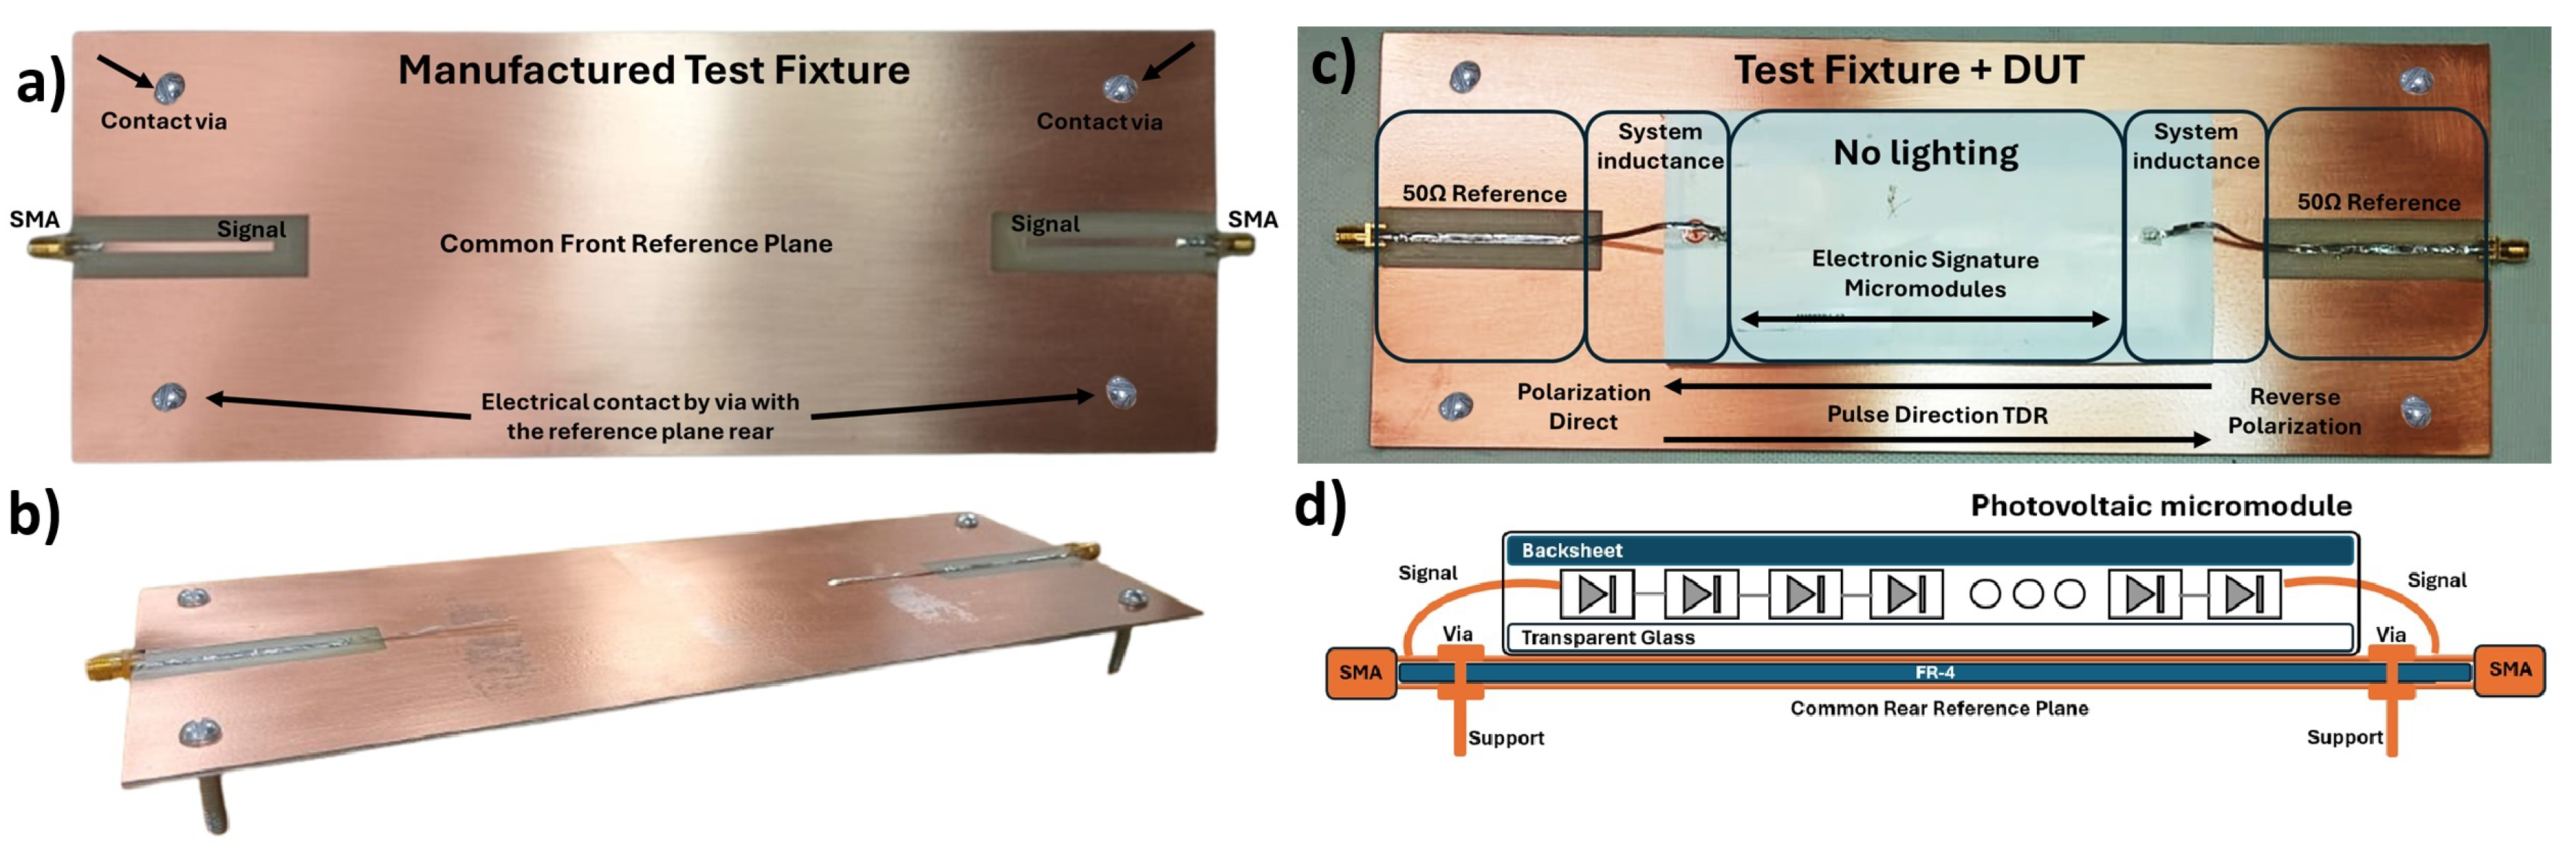
Figure 4.
a) Complete setup for return-loss testing with TDR pulse coupling b) schematic of the TDR measure c) sample zoom.
Figure 4.
a) Complete setup for return-loss testing with TDR pulse coupling b) schematic of the TDR measure c) sample zoom.
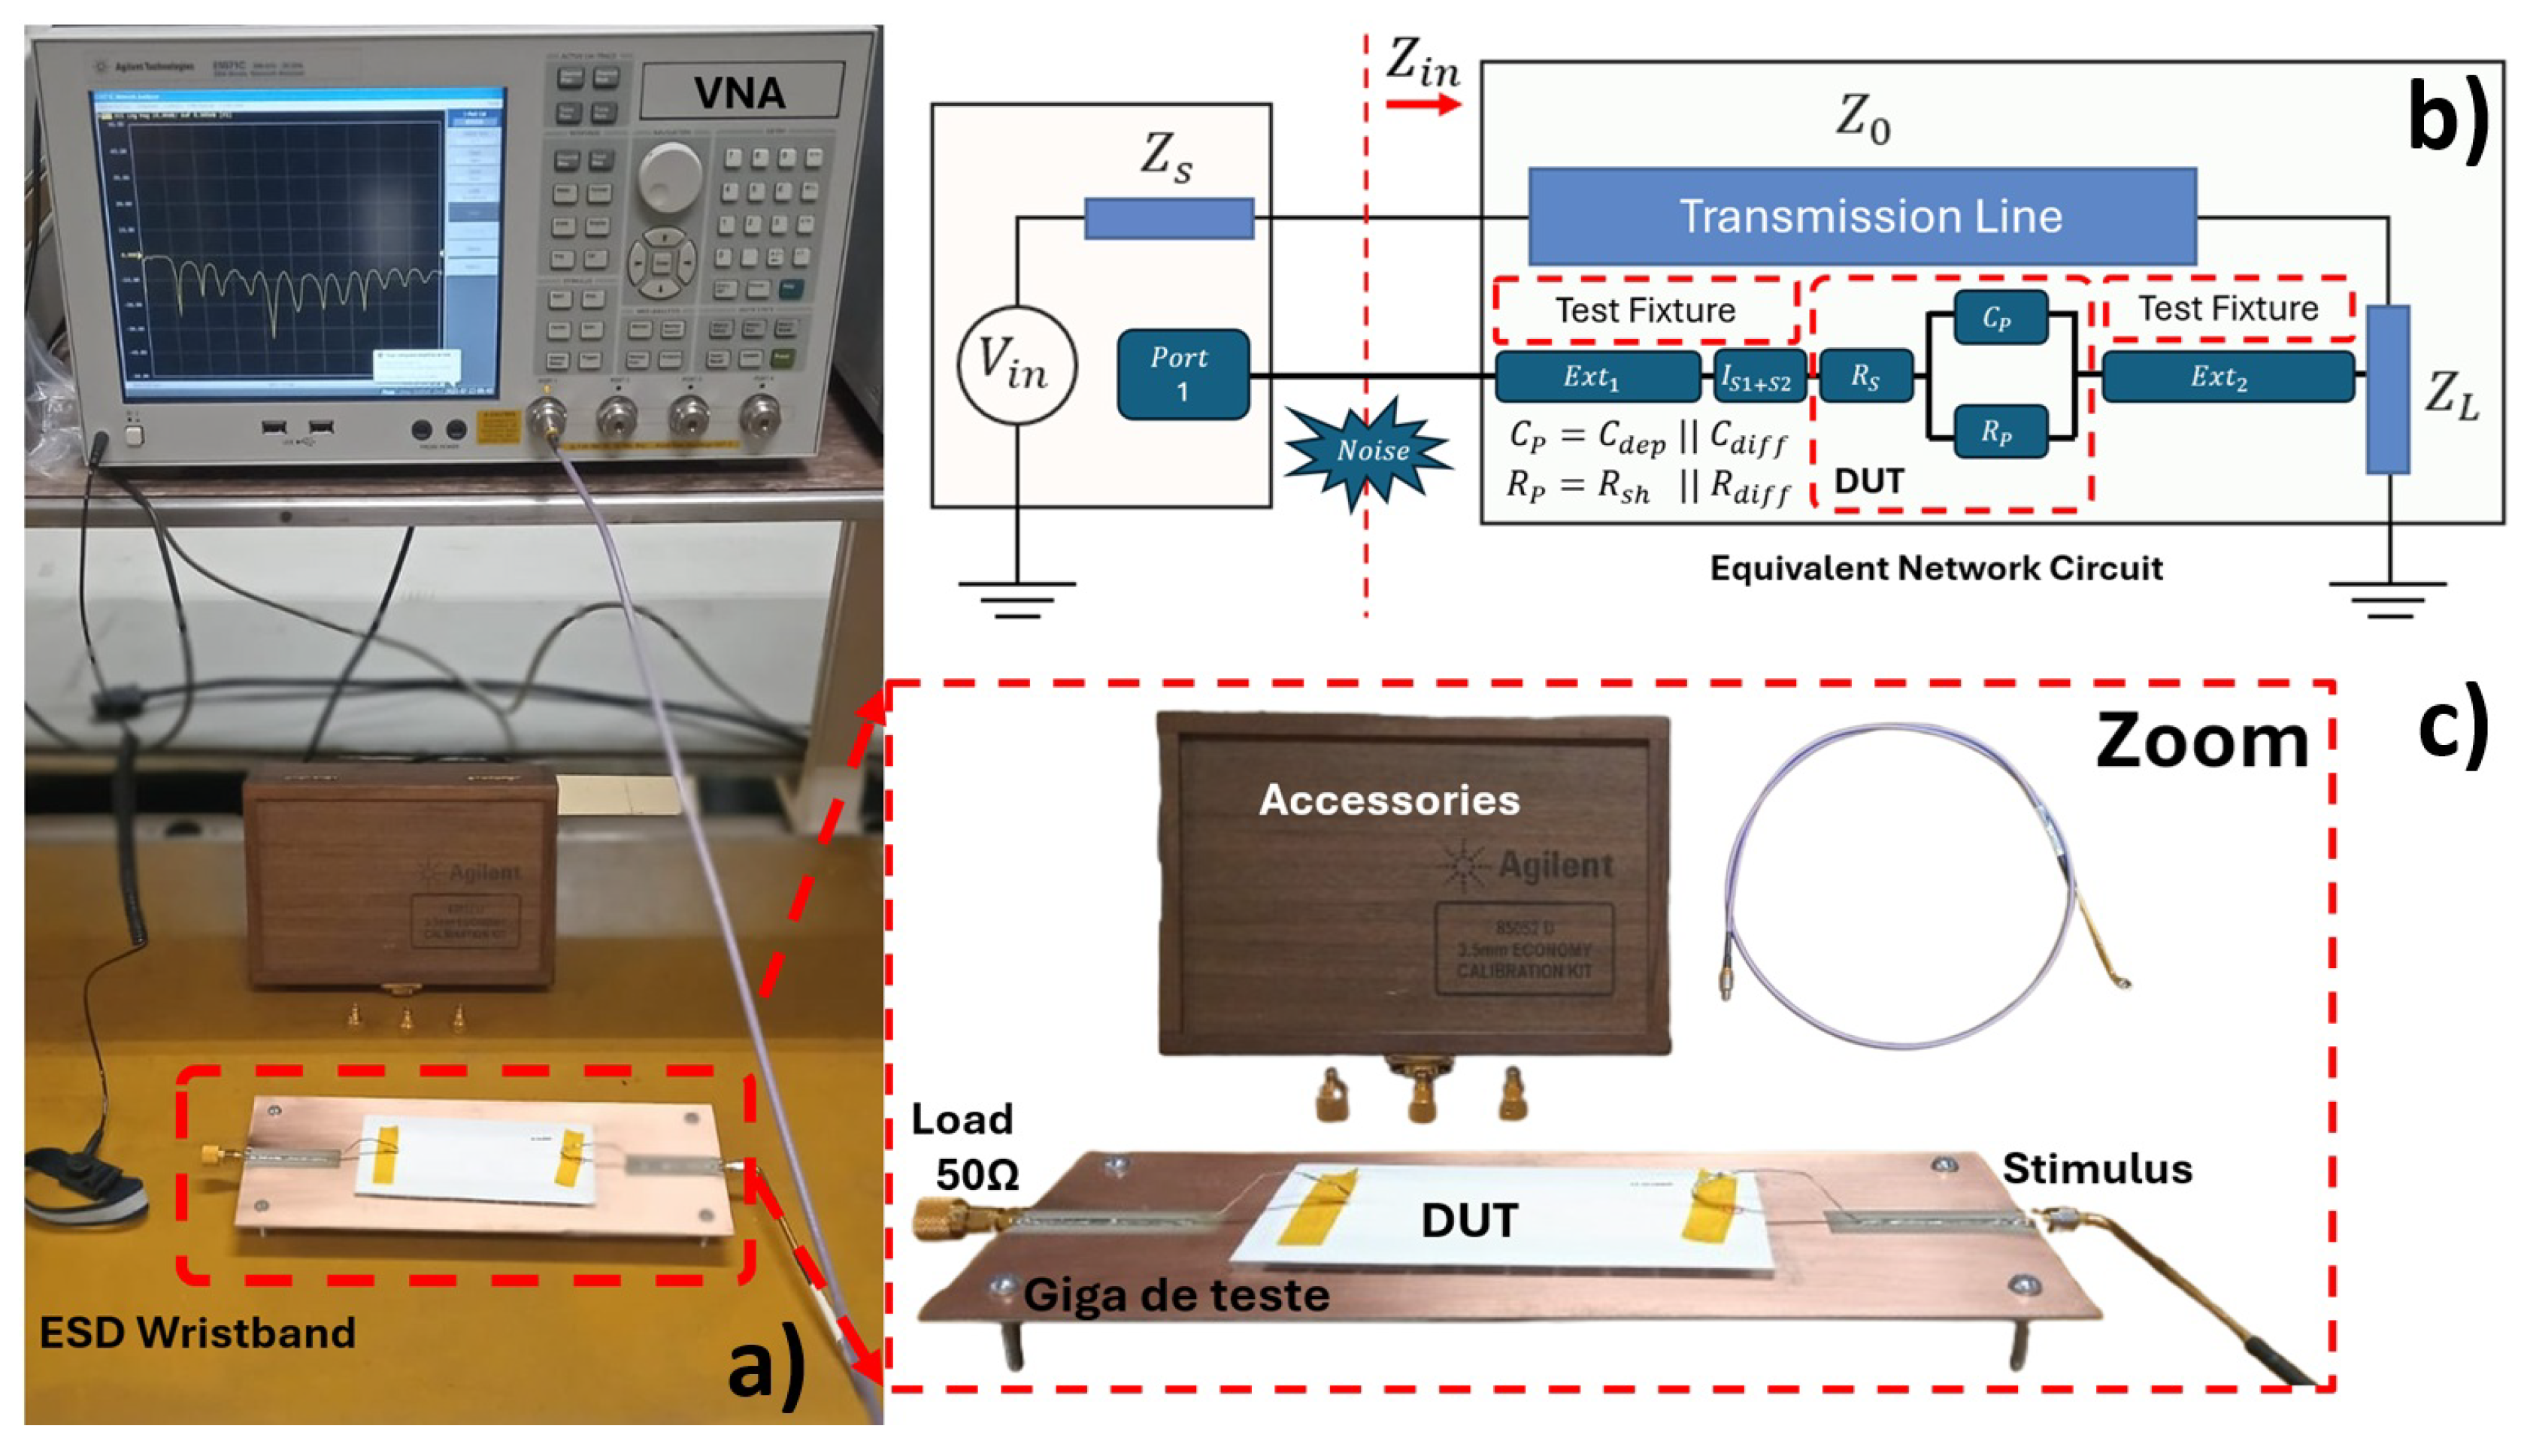
Figure 5.
a) Separation of reflective contributions from the test system and the DUT electronic signature b) Comparison of electronic signature standards A and B.
Figure 5.
a) Separation of reflective contributions from the test system and the DUT electronic signature b) Comparison of electronic signature standards A and B.
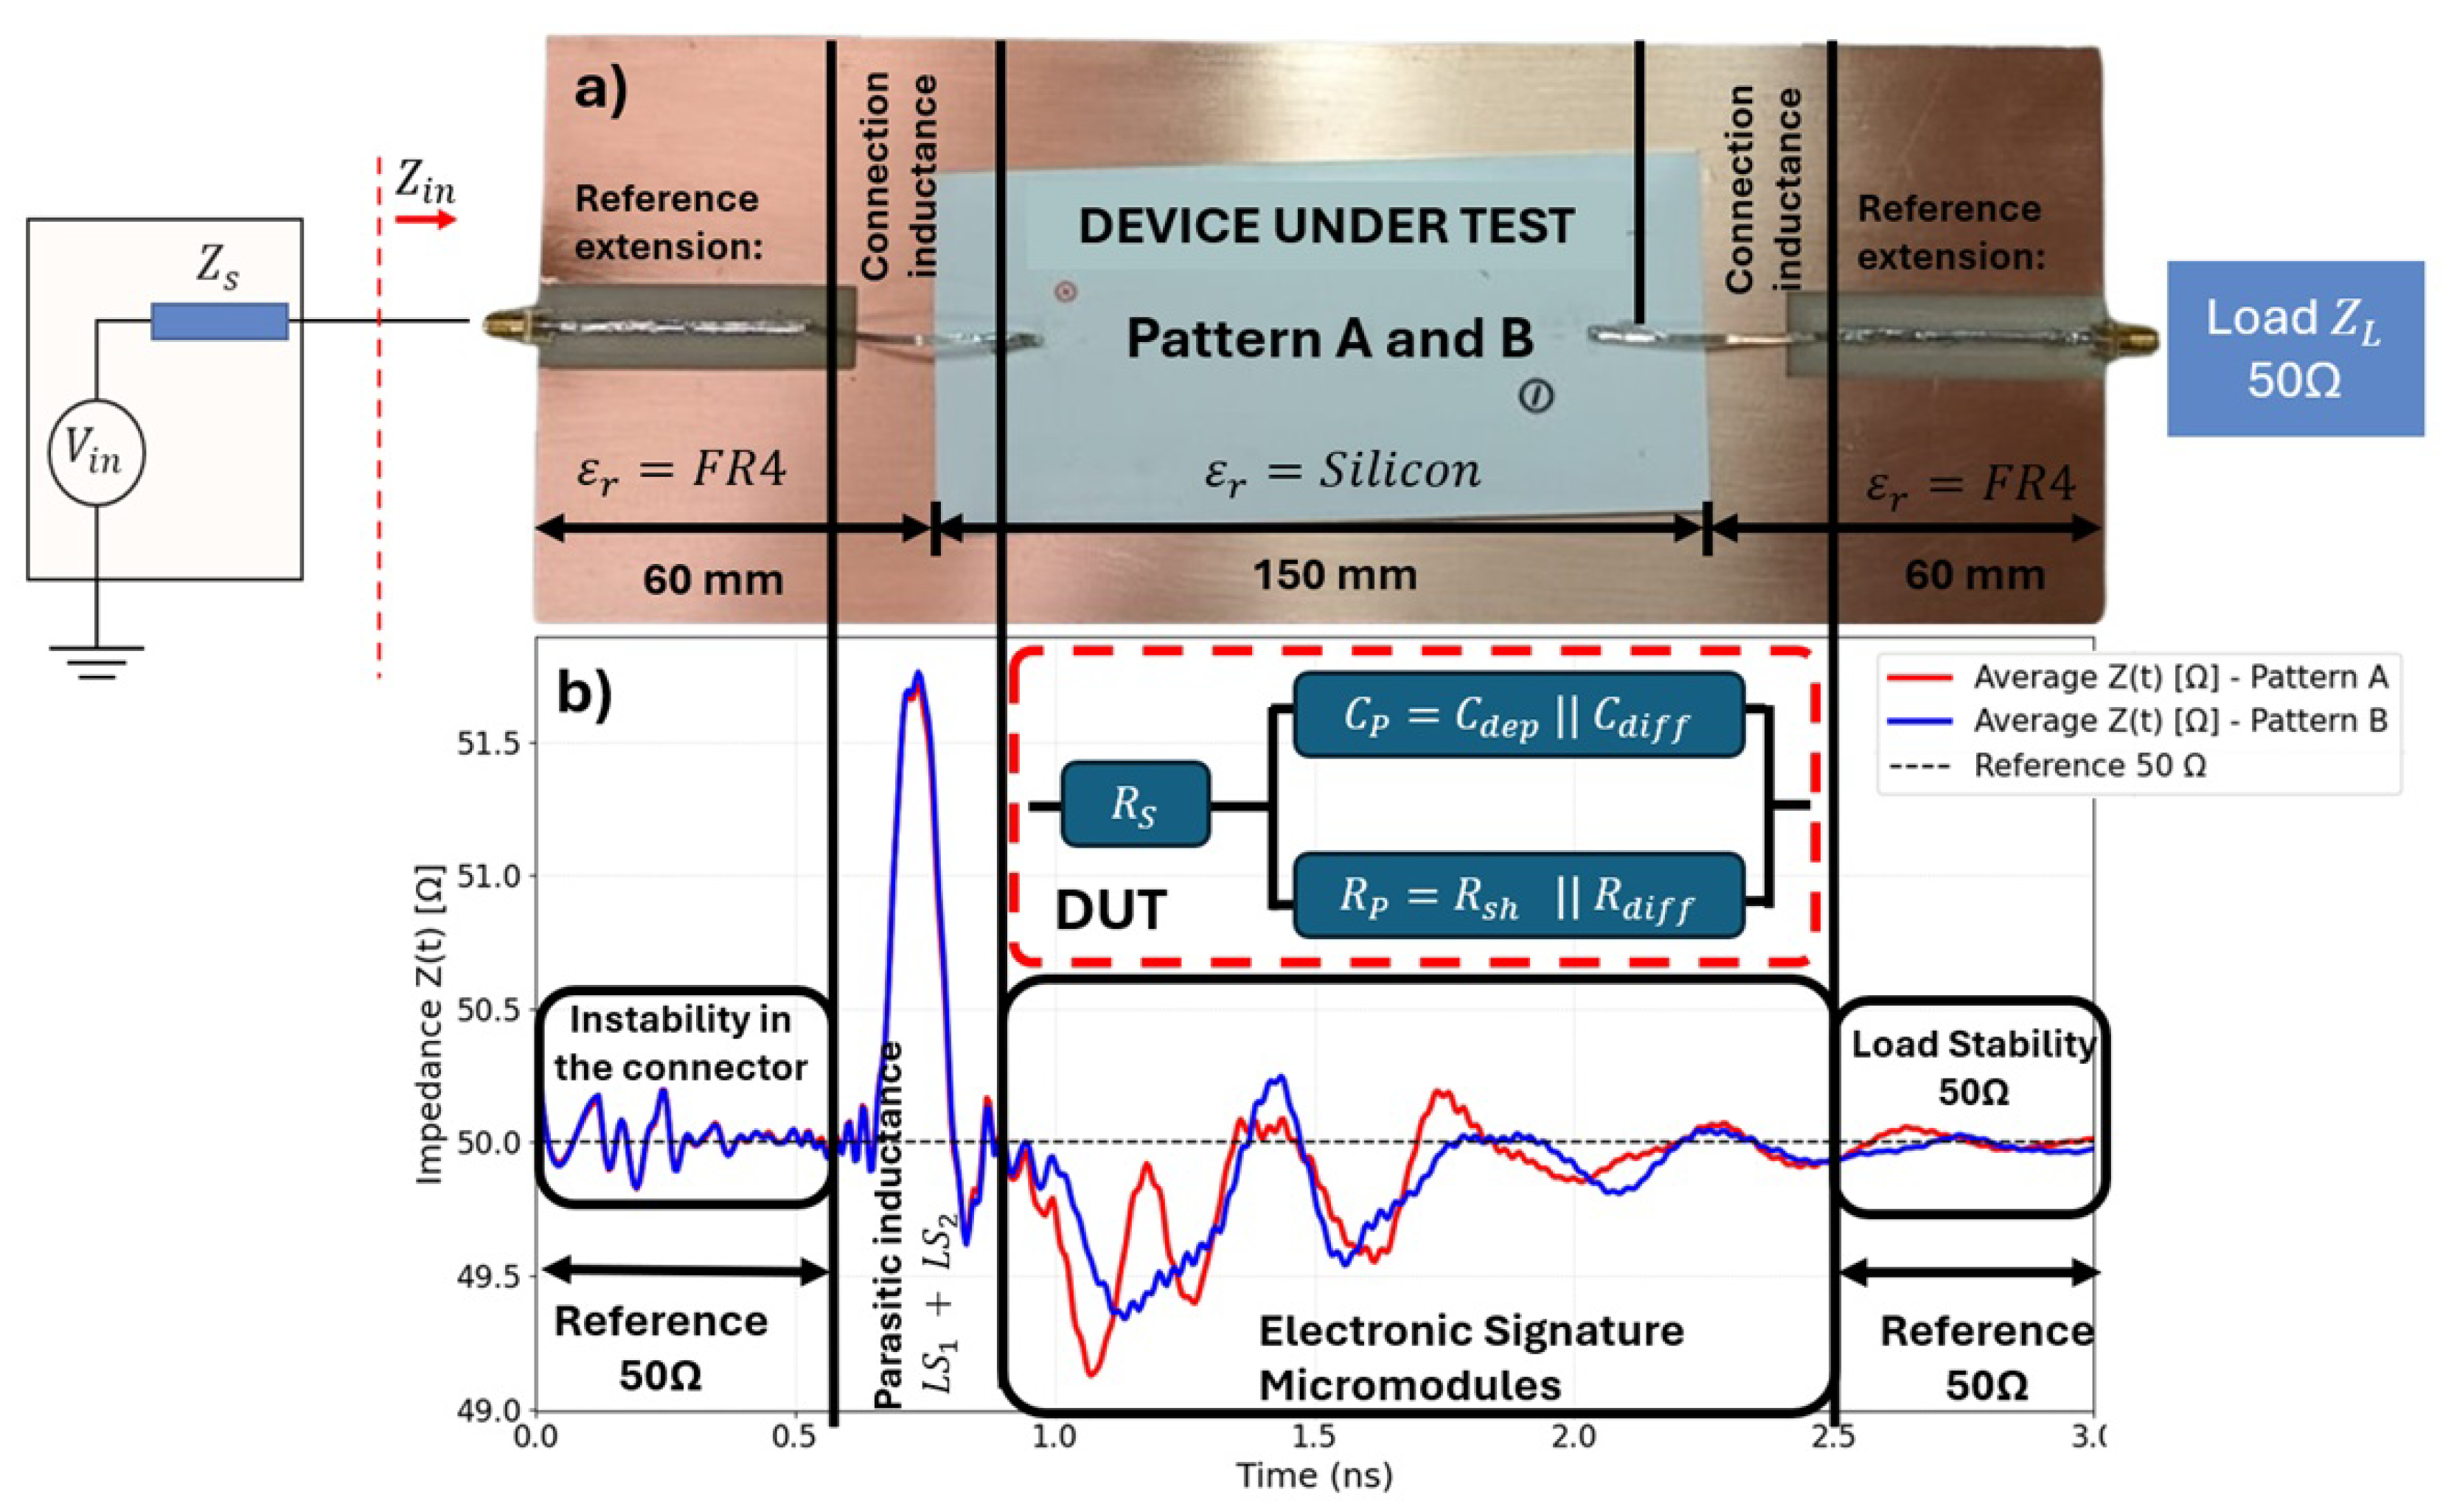
Figure 6.
a) TDR mask for Family A; b) percentage error analysis of the Family A, c) TDR mask for Family B; d) percentage error analysis of the Family B.
Figure 6.
a) TDR mask for Family A; b) percentage error analysis of the Family A, c) TDR mask for Family B; d) percentage error analysis of the Family B.
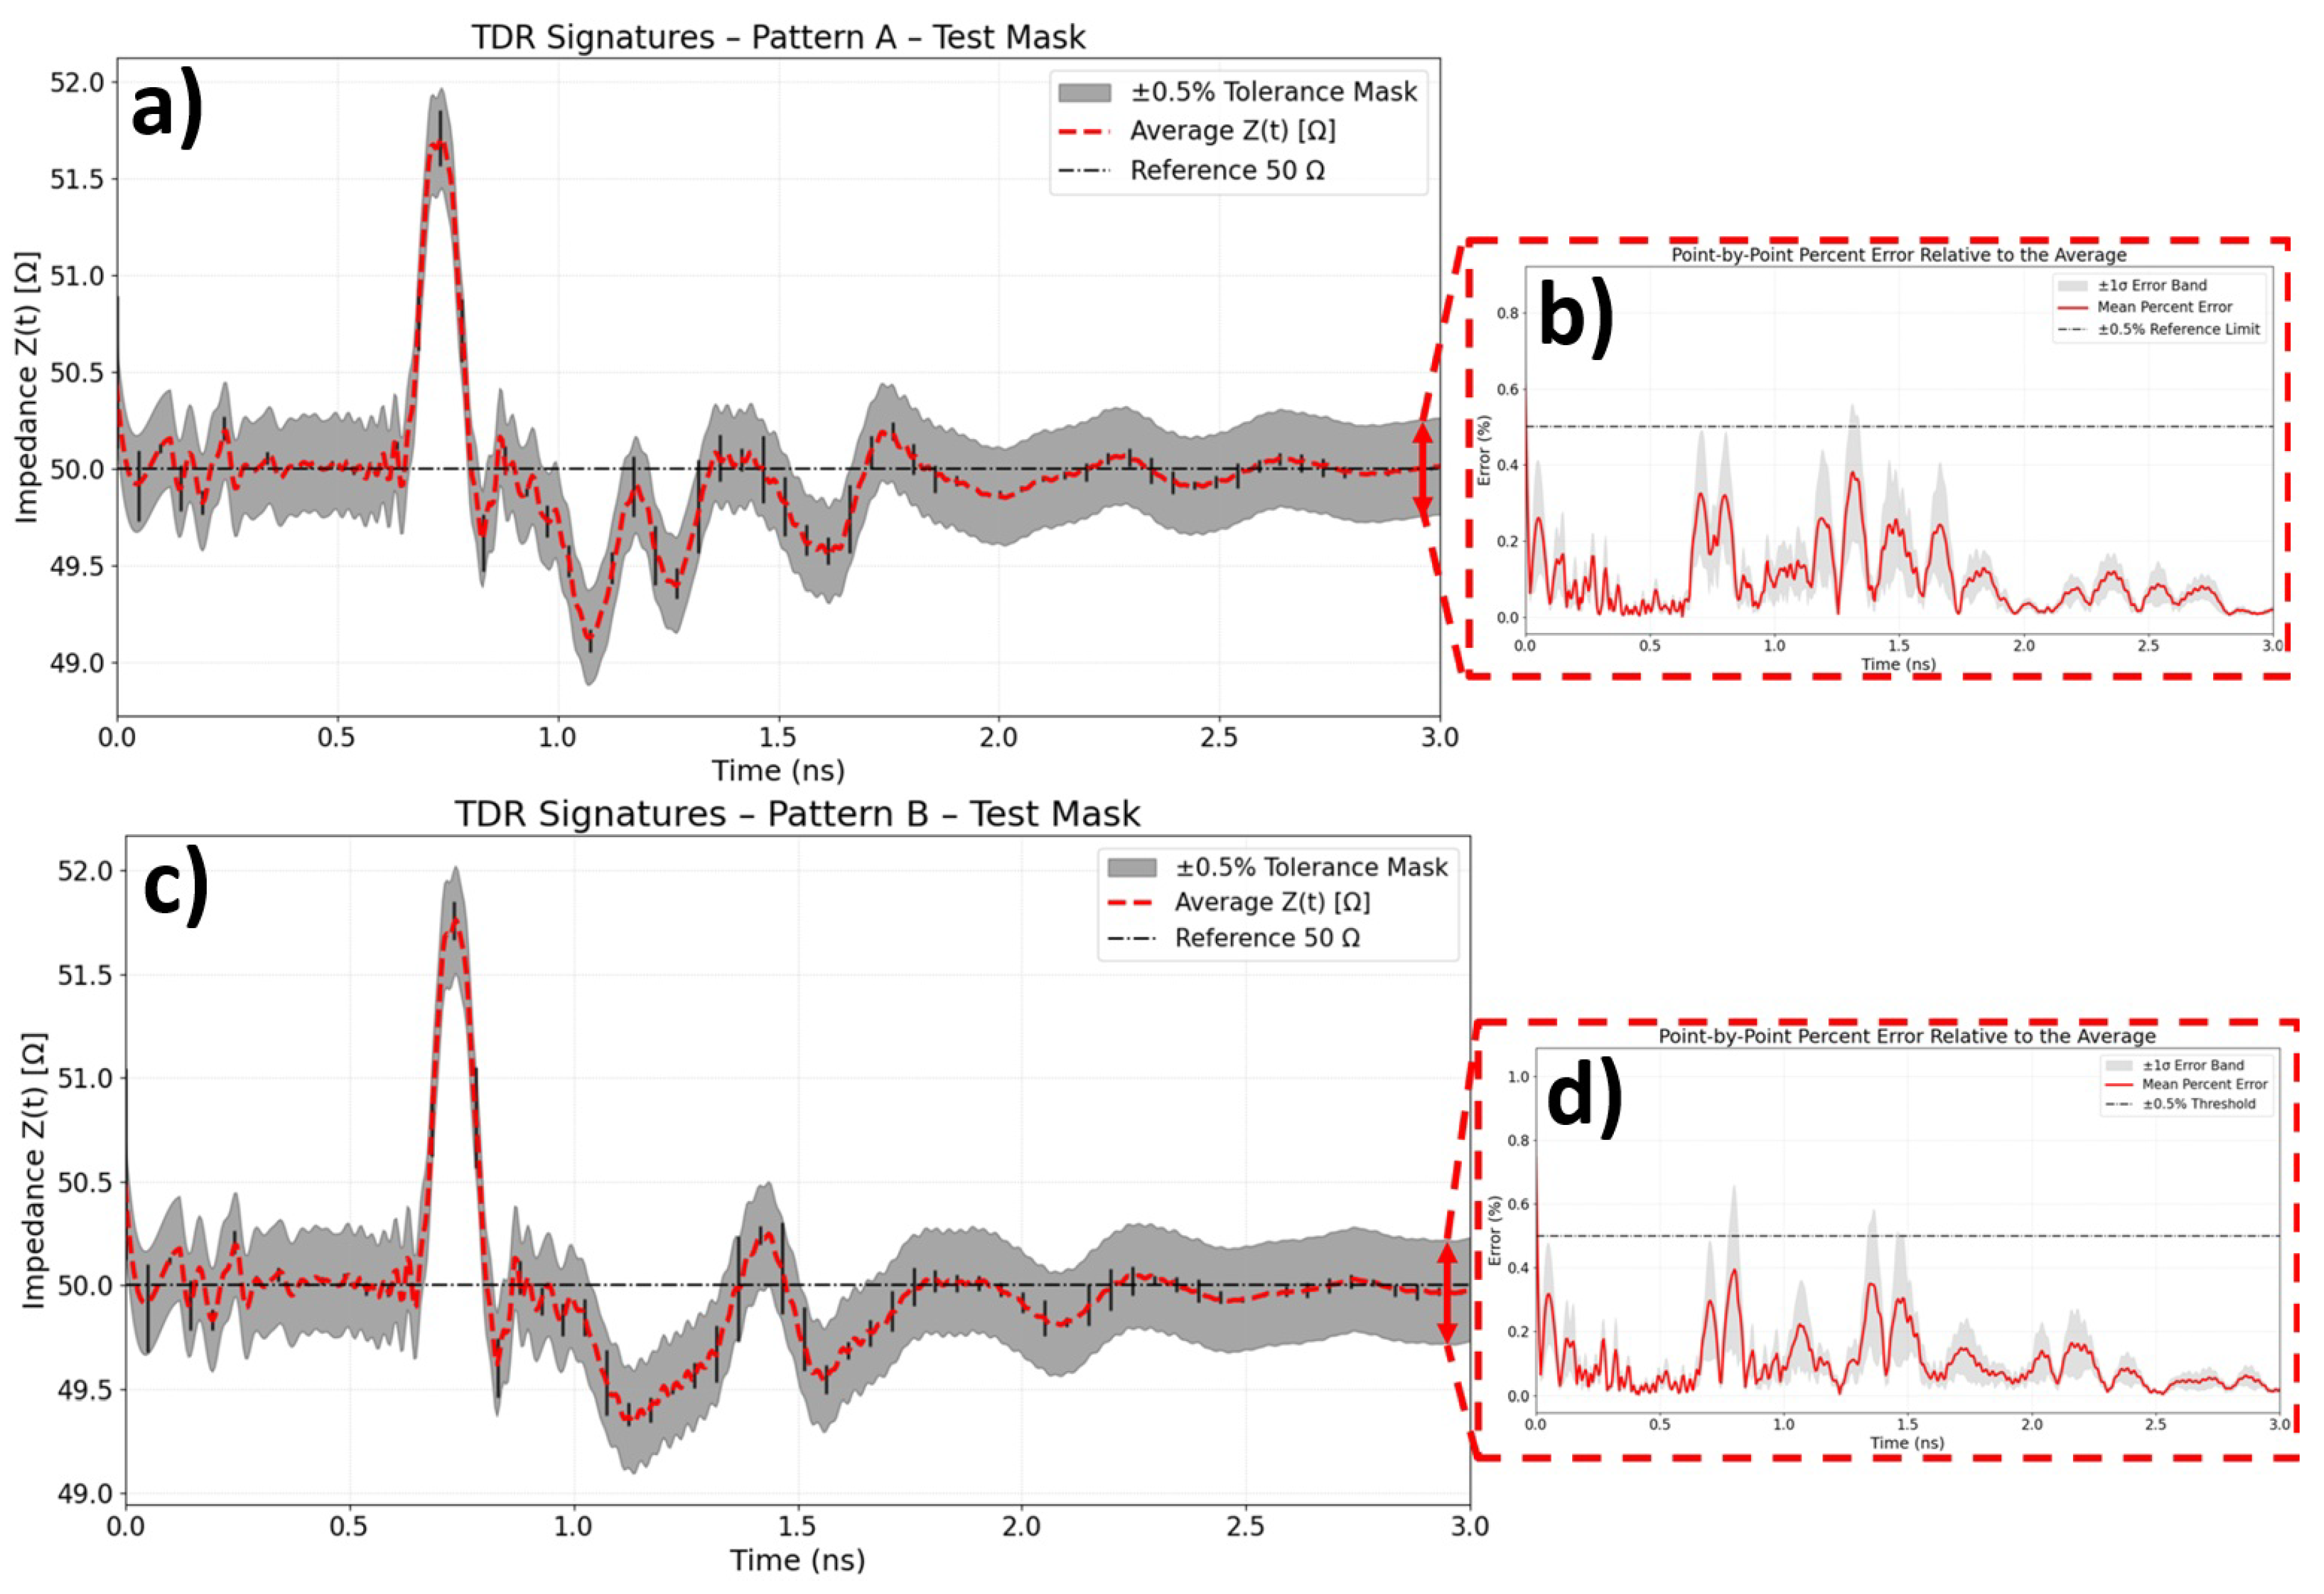
Figure 7.
Validation of the TDR mask method for Family A: a) passing samples; b) failing samples.
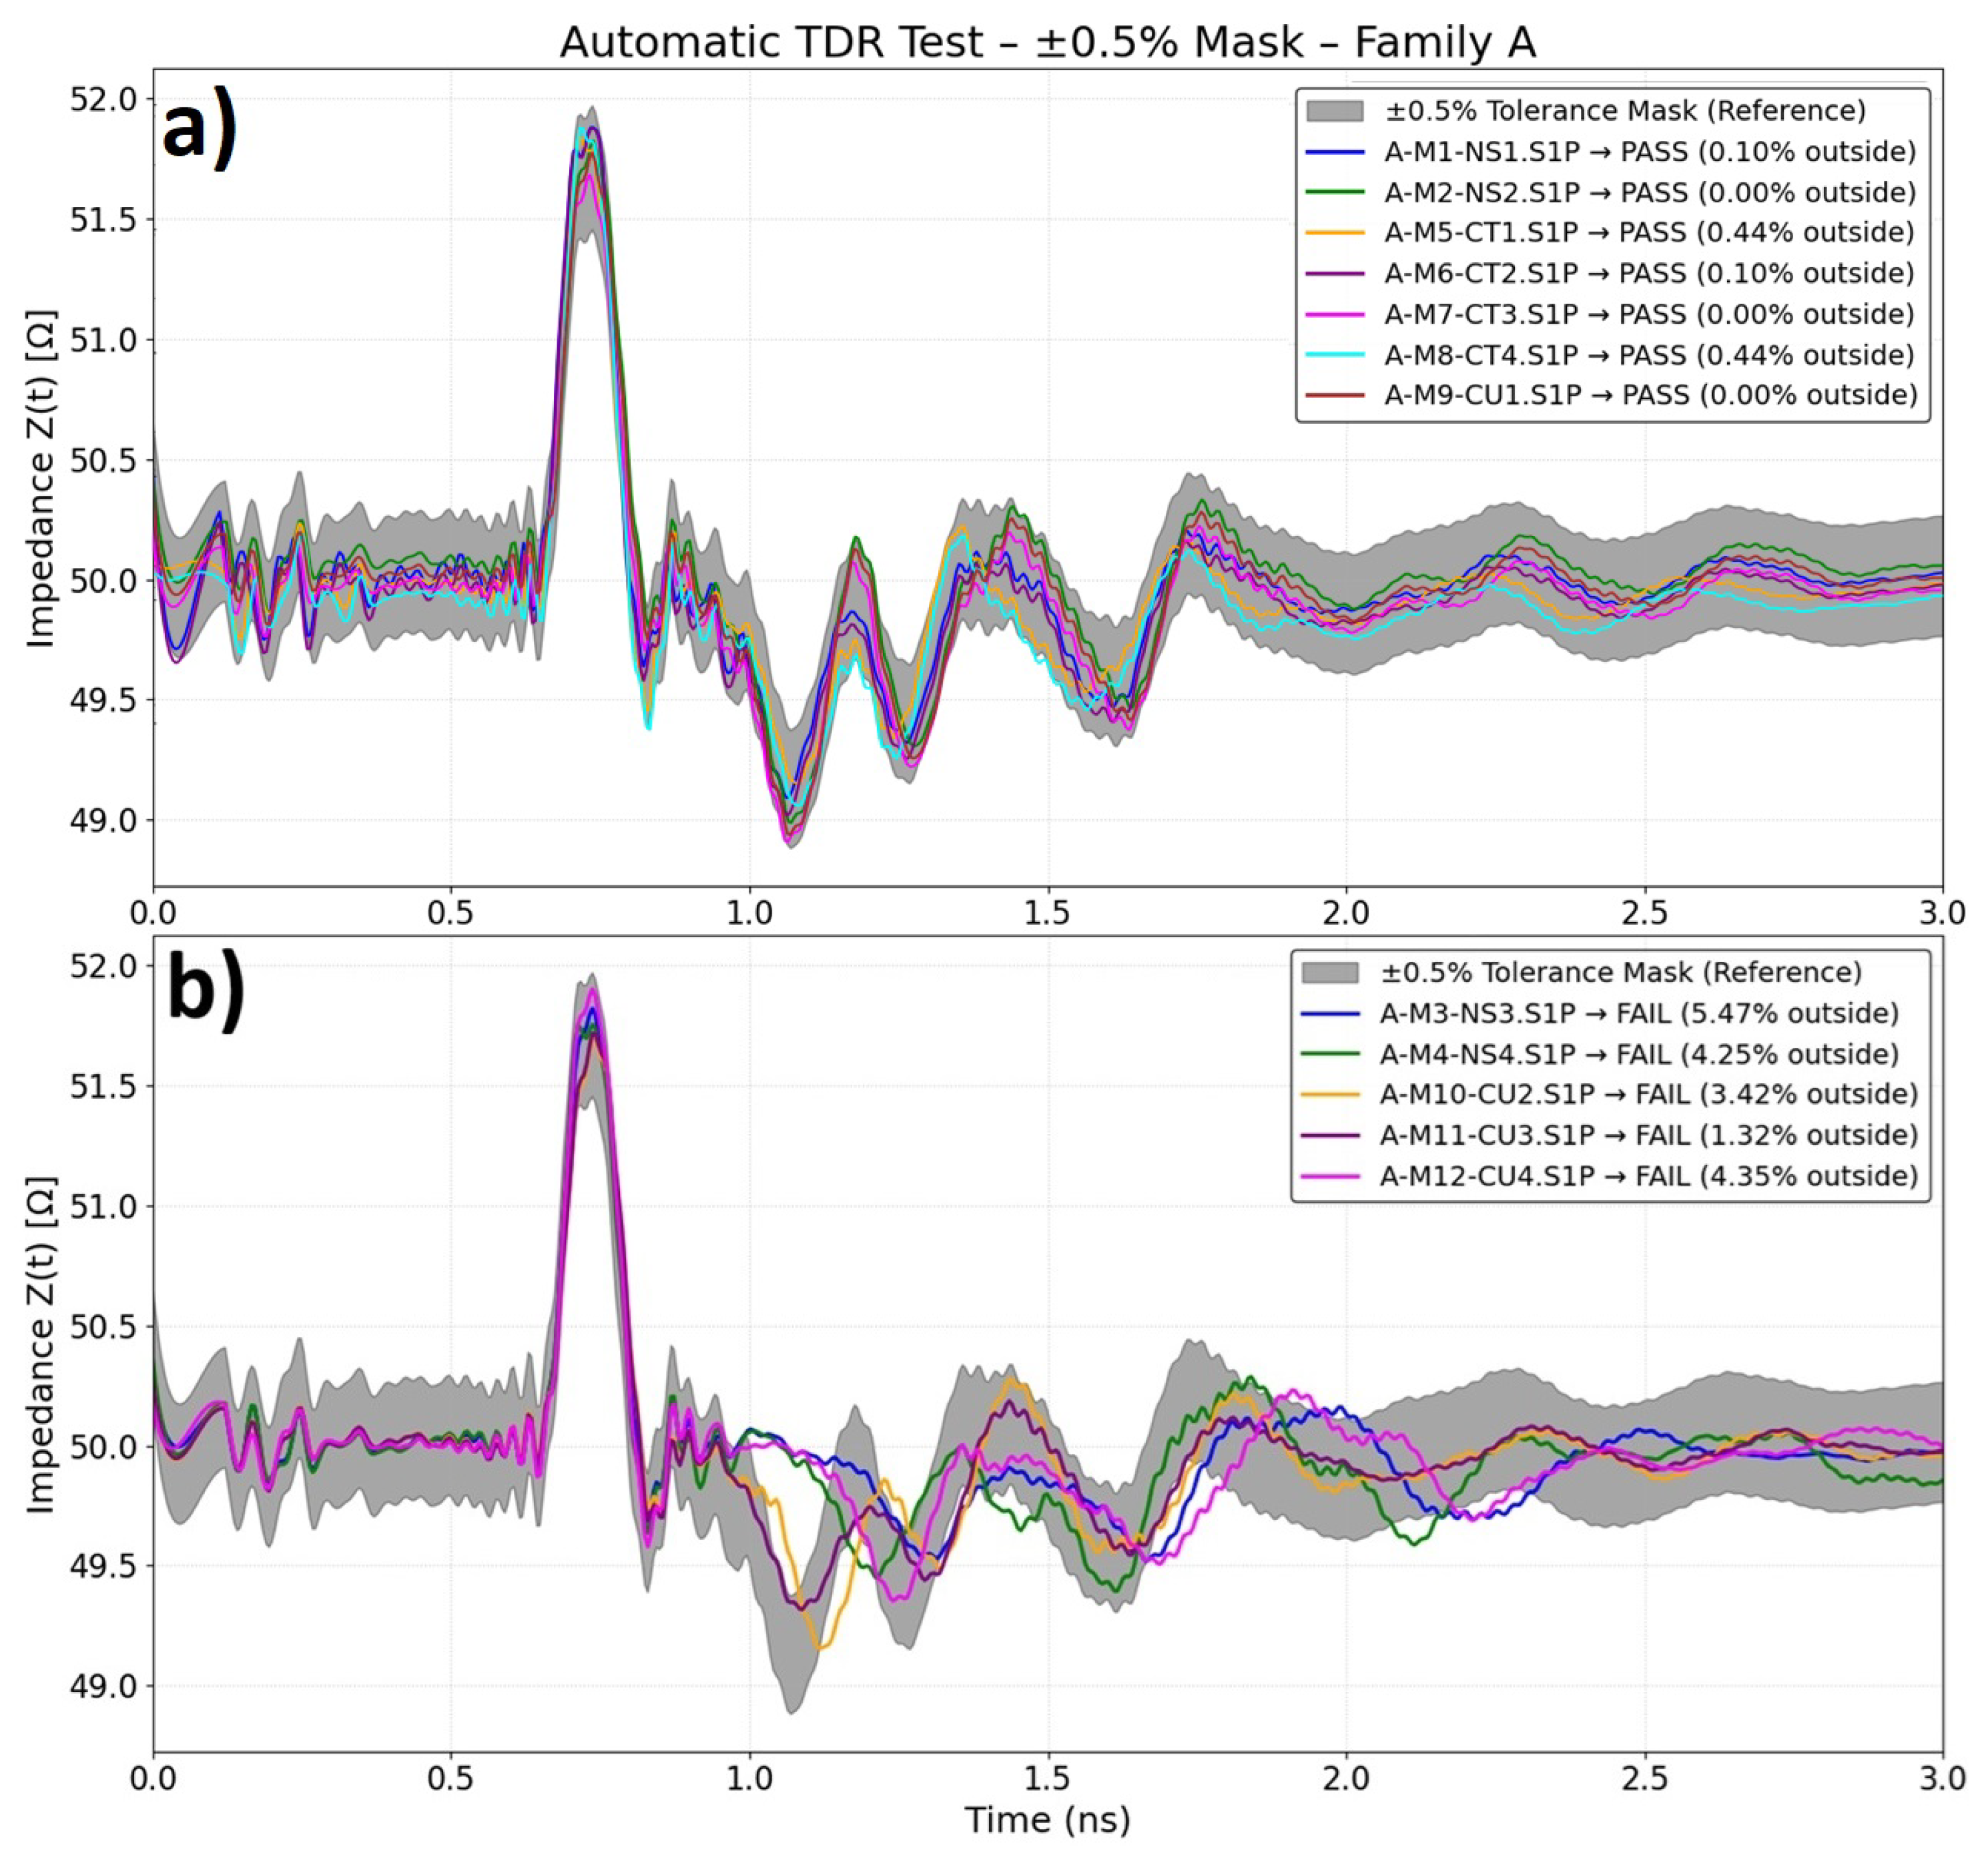
Figure 8.
Validation of the TDR mask method for Family B: a) passing samples; b) failing samples.
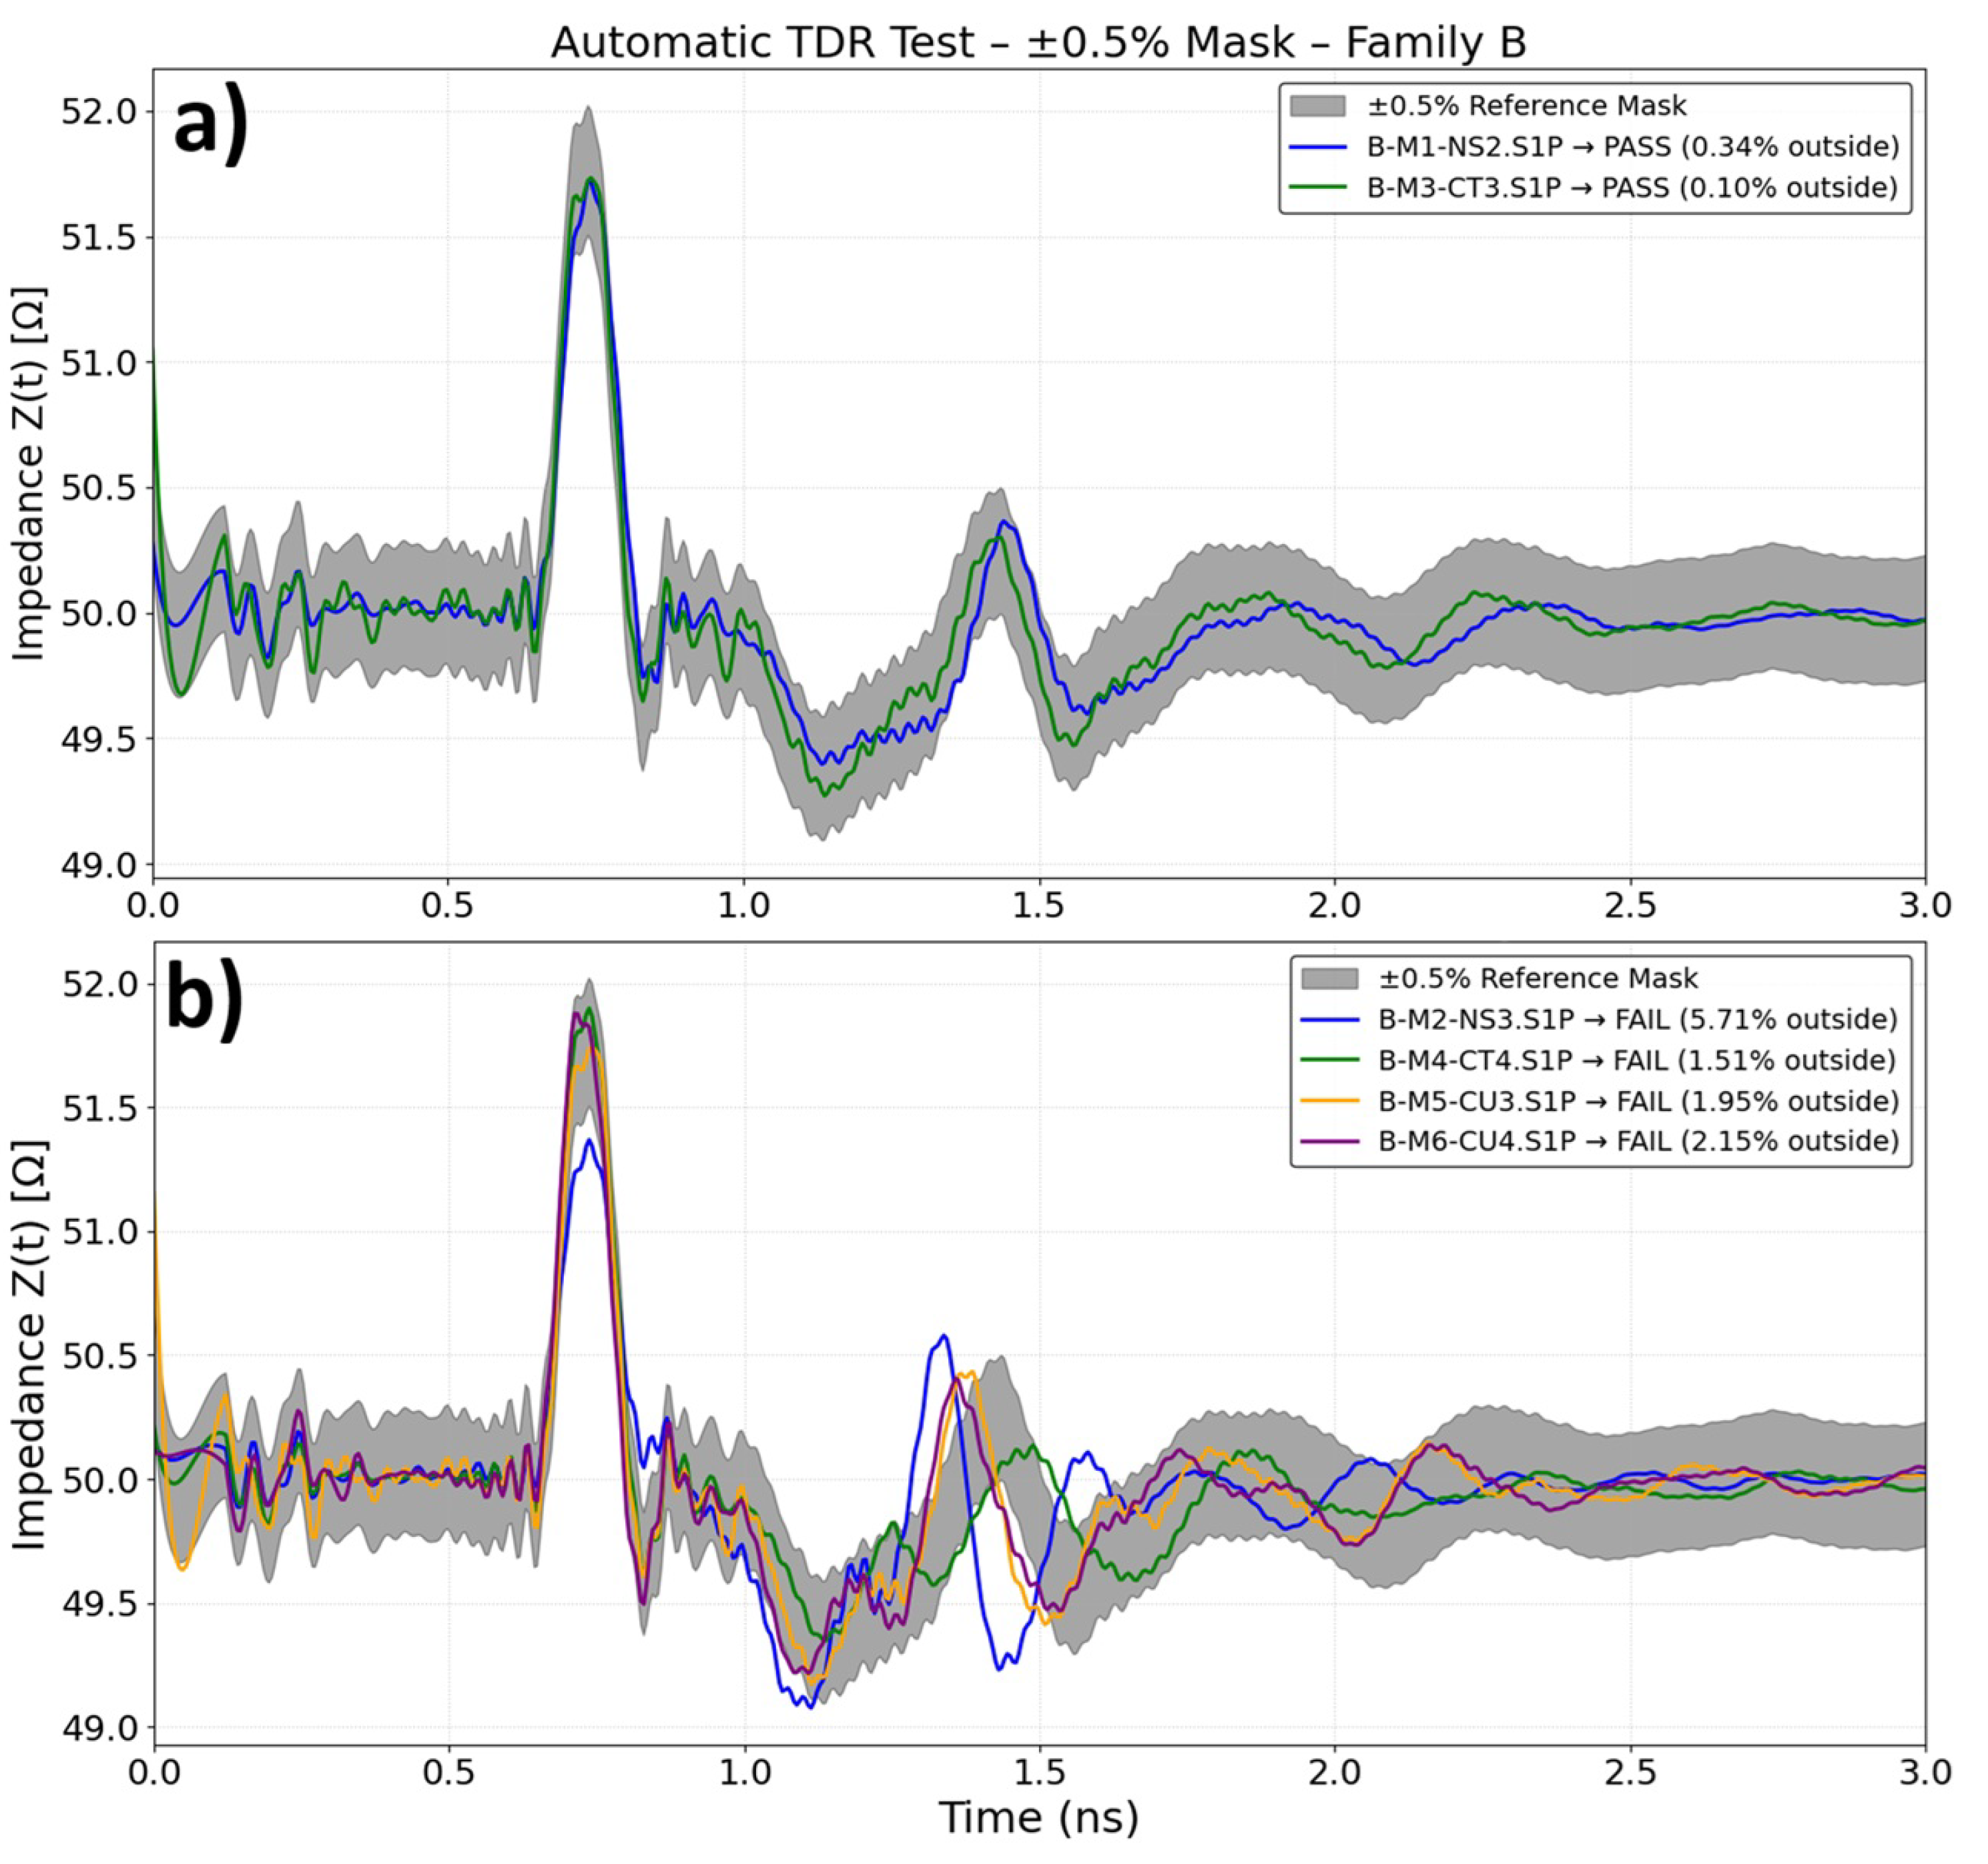
Figure 9.
Parameterization of the electronic signature of Reference Standard B with the test sample: a) B-M2-NS3, b) B-M4-CT4, c) B-M5-CU3, d) B-M6-CU4.
Figure 9.
Parameterization of the electronic signature of Reference Standard B with the test sample: a) B-M2-NS3, b) B-M4-CT4, c) B-M5-CU3, d) B-M6-CU4.
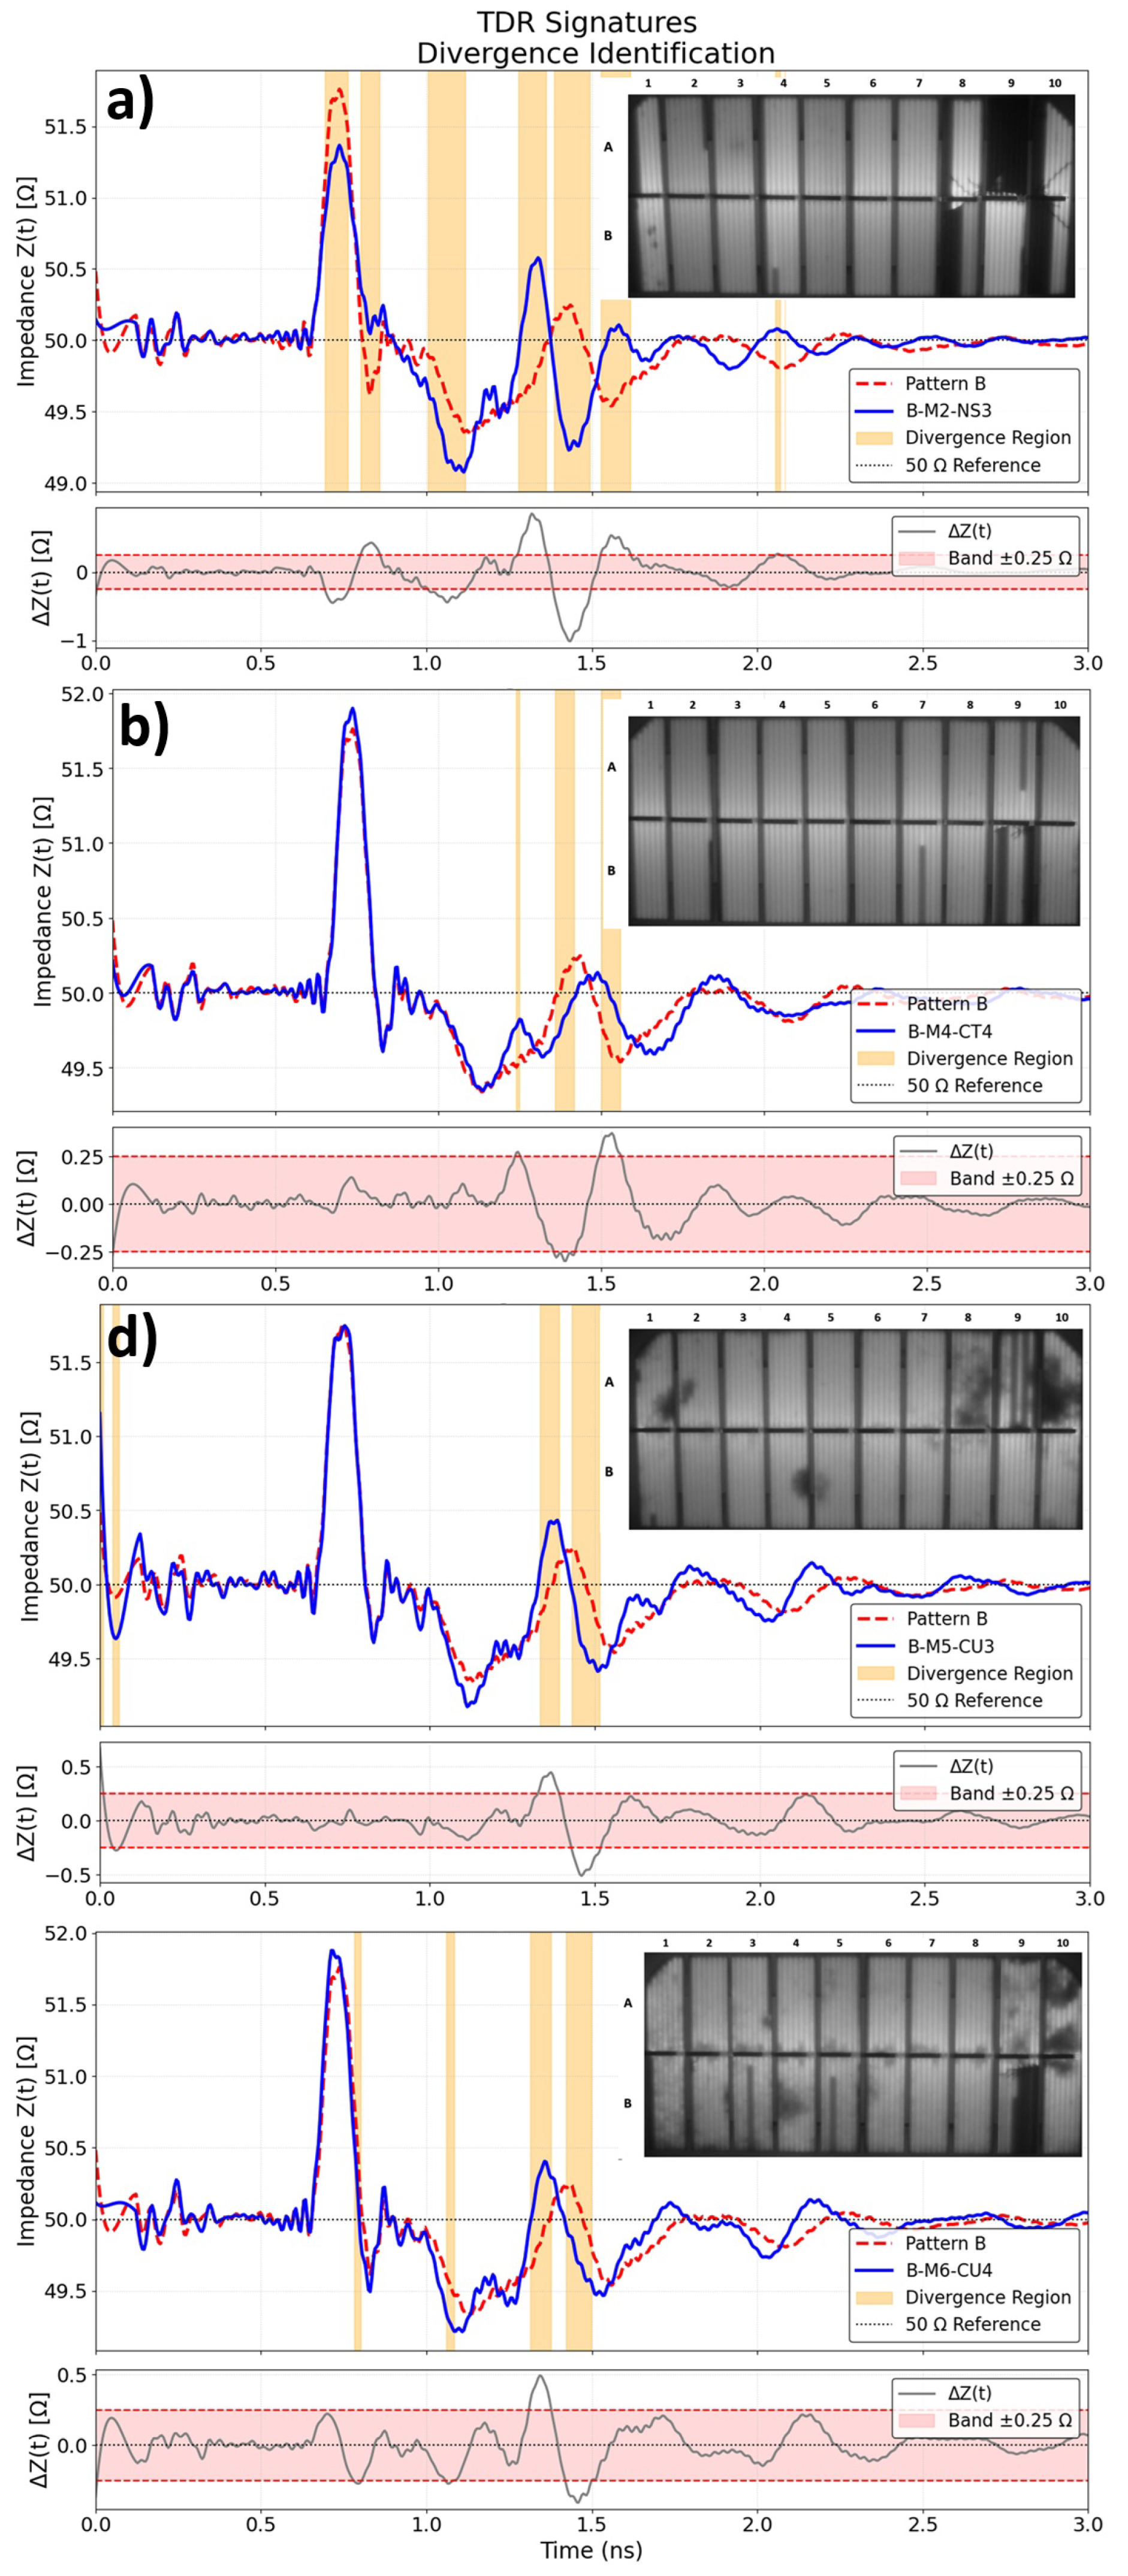
Figure 10.
Parameterization of the electronic signature of Reference Standard A with the test sample: a) A-M3-NS3, b) A-M4-NS4, c) A-M10-CU2, d) A-M11-CU3, e) A-M12-CU4.
Figure 10.
Parameterization of the electronic signature of Reference Standard A with the test sample: a) A-M3-NS3, b) A-M4-NS4, c) A-M10-CU2, d) A-M11-CU3, e) A-M12-CU4.
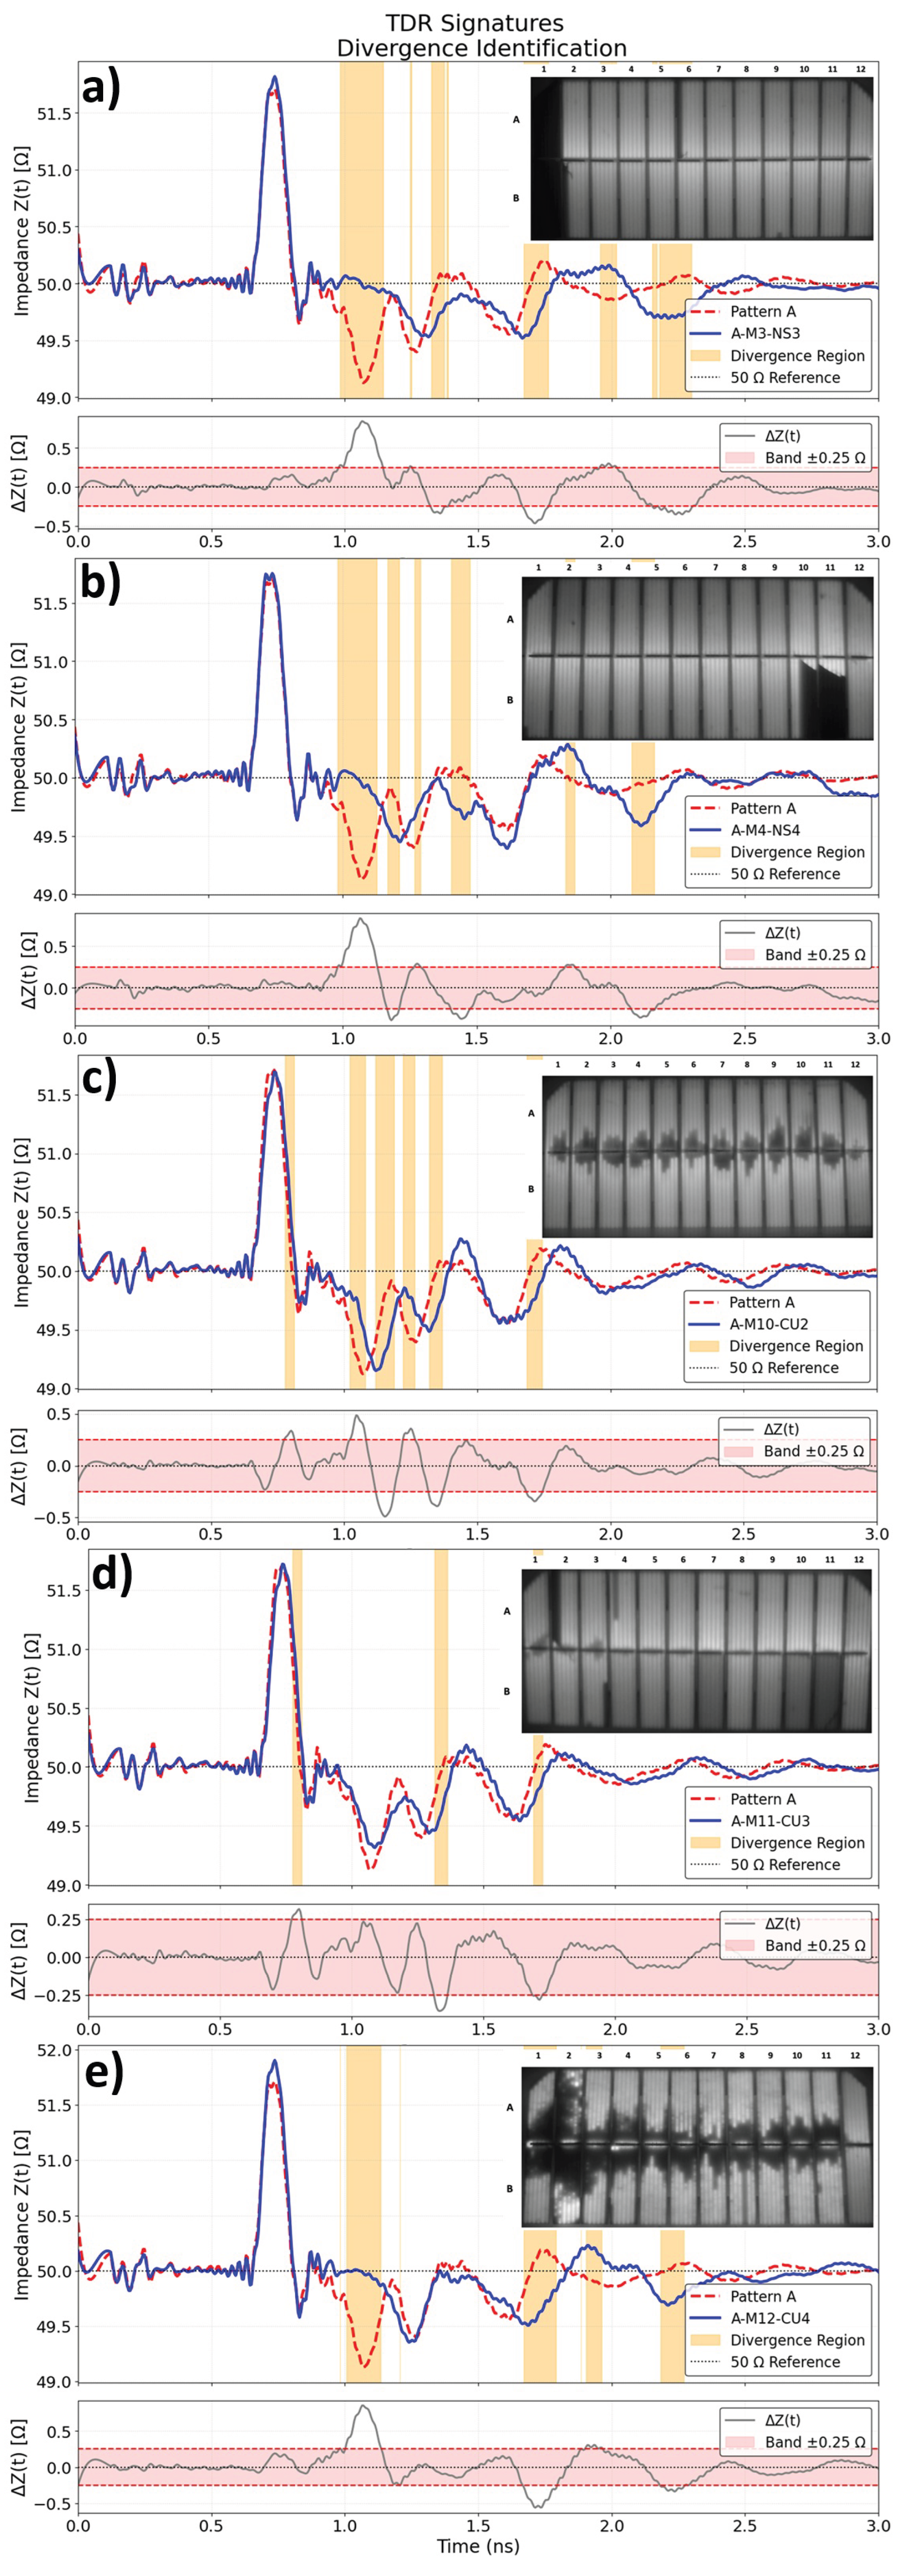

Table 1.
Sample population assigned to TDR-based qualification.
| Family | Cells | Busbars | Total | Control | Test |
|---|---|---|---|---|---|
| A | 12 | 1 | 15 | 3 | 12 |
| B | 10 | 1 | 9 | 3 | 6 |
Table 2.
Accelerated stress methodologies and severity levels applied to the test samples.
| Test | Method | Severity |
|---|---|---|
| Type | Conditions | Level |
| Salt Mist | 35°C – 24h | 1 |
| Salt Mist | 35°C – 96h | 2 |
| Salt Mist | 35°C – 240h | 3 |
| Salt Mist | 35°C – 480h | 4 |
| Thermal Cycling | -40°C/85°C – 200 cycles | 1 |
| Thermal Cycling | -40°C/85°C – 400 cycles | 2 |
| Thermal Cycling | -40°C/85°C – 600 cycles | 3 |
| Thermal Cycling | -40°C/85°C – 800 cycles | 4 |
| Damp Heat | 85°C/85%RH – 24h | 1 |
| Damp Heat | 85°C/85%RH – 96h | 2 |
| Damp Heat | 85°C/85%RH – 240h | 3 |
| Damp Heat | 85°C/85%RH – 480h | 4 |
Table 3.
Summary of variations observed in rejected samples by test category.
| Sample | Observations on TDR Electronic Signature |
|---|---|
| A-M3-NS3 | The sample showed a dead zone in cell 1 in parts A and B and also a finger break in cell A6. This degradation was detected in the TDR electronic signature, with divergences in the yellow color of the graph, the valley near 1 ns being suppressed, and subsequently a phase shift due to delay in pulse propagation relation to the electronic signature of pattern A. |
| A-M4-NS4 | The sample showed a dead zone in Cells 10 and 11 in part B. This degradation was detected in the TDR electronic signature, with divergences in the yellow color of the graph, suppression of the valley near 1 ns, and signal divergences after the first valley at times of 1.4 ns and 2.2 ns in relation to the electronic signature of pattern A. |
| A-M10-CU2 | The sample shows darkening caused by moisture penetration around the central busbar, pronounced in all cells, and this degradation was detected in the TDR electronic signature by a phase shift from beginning to end relative to the reference electronic signature of pattern A, evidencing a delay in pulse propagation. |
| A-M11-CU3 | The sample shows a slight darkening caused by moisture penetration around the central busbar of cells 1 to 4, a decrease in light intensity in cells B11 and B7, and also finger breakage in cells A2, A4, and B3. These defects were detected in the TDR electronic signature by a slight phase shift from beginning to end in relation to the reference electronic signature of pattern A, evidencing a delay in pulse propagation, along with reduced valleys and peaks, between 1.0ns and 1.5ns. |
| A-M12-CU4 | The sample showed high moisture penetration propagating from the central bus to the cell extremities, causing dead zones with greater intensity in cell 2, part A-B. This degradation was detected in the TDR electronic signature, with the suppression of the valley near 1 ns and subsequently an intense phase shift due to a delay in pulse propagation relative to the electronic signature of pattern A. |
| B-M2-NS3 | The sample showed dead zones in cells 9A, 8A-B, and 10B with visible triclosing in this region of the micromodule. This degradation was detected by the TDR electronic signature in the divergence observed in the time window from 1.25 to 1.75 ns and a phase shift due to acceleration in the pulse speed, in addition to valleys and peaks with greater amplitude. |
| B-M5-CU3 | The sample showed dark blurring in cells A8, A10, A1-2, and B4-5, as well as finger breakage in cell A9. Degradation was detected in the TDR electronic signature by peak thinning between 1.4 and 1.5 ns, followed by a slight phase shift due to accelerated pulse propagation compared to the B pattern signature. |
| B-M6-CU4 | The sample showed dark blotches in cell 10A and a dead zone in cell 9B, finger breakage in cells 5B and 3B, and a reduction in the overall light intensity of the micromodule. This degradation was detected by the TDR signature due to a slight phase shift caused by pulse acceleration. |
| B-M4-CT4 | The sample showed electrode breakage caused by microcracks in cells 9A, 9B, 7B, 2A, and 2B. The degradation was detected by the TDR signature by a slight phase shift due to propagation delay in the pulse, in addition to the appearance of a small peak at 1.3 ns. |
Disclaimer/Publisher’s Note: The statements, opinions and data contained in all publications are solely those of the individual author(s) and contributor(s) and not of MDPI and/or the editor(s). MDPI and/or the editor(s) disclaim responsibility for any injury to people or property resulting from any ideas, methods, instructions or products referred to in the content. |
© 2026 by the authors. Licensee MDPI, Basel, Switzerland. This article is an open access article distributed under the terms and conditions of the Creative Commons Attribution (CC BY) license (http://creativecommons.org/licenses/by/4.0/).
Copyright: This open access article is published under a Creative Commons CC BY 4.0 license, which permit the free download, distribution, and reuse, provided that the author and preprint are cited in any reuse.


