
Submitted:
01 July 2025
Posted:
03 July 2025
You are already at the latest version
Abstract
Accurate photovoltaic (PV) panel characterization under real environmental conditions is critical for optimizing renewable energy systems. However, commercial I-V curve tracers are often expensive, inflexible, and unsuitable for rapid field deployment. This paper presents a low-cost, Arduino-based data acquisition (DAQ) system capable of real-time I-V curve tracing using automated resistive load switching in a single microcontroller. The system integrates current and voltage measurements with a relay-controlled resistor bank, enabling sequential load variation without manual intervention. A total of 23 unique resistor combinations were programmed, providing fast and granular coverage of the PV panel’s operating range. Experimental validation was conducted on a commercial PV panel under natural sunlight conditions. The system total data acquisition time was 45 seconds and achieved high agreement with a single-diode PV model, with a mean absolute percentage error (MAPE) of 4.40% under standard conditions (manufacturer’s data). When re-optimized with field-acquired data, the model’s accuracy improved significantly, reducing the MAPE from 18.23% to 7.06% under variable irradiance. This open-source solution provides a cost-effective, portable, and scalable alternative to commercial tracers, with potential for integration into IoT-enabled PV monitoring platforms. Its design supports research, education, and deployment in low-resource environments where accessible renewable energy diagnostics are essential.
Keywords:
data acquisition systems
; I-V curve tracer
; low cost
; photovoltaic systems
; real-time systems
; renewable energy
; resistive load control
1. Introduction
Recent evelopments in sustainable energy supply can be directly related to the energy transition to renewable sources, since these are not only relatively clean sources, but can also be used in a decentralized manner [1]. In recent years, clean energy technologies have gained ground, causing a decrease in the demand for fossil fuels such as coal, natural gas, and oil. Projections suggest that this trend will continue, with fossil fuel demand declining by an average of 3 exajoules (EJ) per year until 2050. The peak demand is expected to occur around 2030 [2].
For a higher transition from fossil fuels to renewable sources, this process should be affordable. Addressing the initial expenses associated with clean energy technologies will be crucial in promoting their adoption, particularly among households with lower incomes [2].
To optimize the performance of renewable energy generators, such as photovoltaic panels, it is essential to gather detailed information on how they operate under various conditions. This allows real-time data collection over extended periods, with easy storage and accessibility [3,4].
While measuring voltage and current effectively provides information about the power of photovoltaic panels (PV), fully characterizing these devices requires varying the load they are subjected to. By doing so, the characteristic curves of the panel can be obtained. However, due to rapidly changing and unpredictable field conditions, reproducing the characteristics of individual or groups of PV panels becomes challenging. To address this issue, it is necessary to rapidly vary the load (resistance) across the entire range [5].
Manufacturers of photovoltaic panels typically provide current-voltage (I-V) curves measured under laboratory conditions. However, these conditions may not accurately represent real operational environments, where temperature and irradiance variations affect the I-V characteristics and, consequently, the module’s power output. To properly characterize these devices, measurement systems known as I-V curve tracers are used. These systems perform a voltage sweep on the PV module while simultaneously measuring the output current delivered to a connected load [6].
Commercial I-V curve tracers are available on the market, as referenced in [7,8], offering reliable measurements ensured by the manufacturer. However, they also present some disadvantages, such as high cost, limited flexibility for modifications, and control software that is not designed for automated experimental measurement campaigns [6].
To address these limitations, low-cost data acquisition systems (DAQs) present an accessible alternative for obtaining operational data from electric generators without relying on proprietary software [9]. Among these, the ArduinoTM platform, which consists of a series of microcontroller boards, provides a versatile tool for developing DAQs using open-source code. With dedicated libraries and drivers, ArduinoTM allows users to program and interact with each device directly via a standard USB connection, eliminating the need for additional hardware [10].
Numerous research papers highlight the utilization of ArduinoTM for equipment control and data acquisition systems. Notable examples include using Arduino to control load cells [11], applications in automobile dynamics [12], nuclear and particle physics [10], fault detection in fused deposition modeling [13], and water flow measurement [14].
When it comes to photovoltaic panels, ArduinoTM has been used as a data acquisition system in several works [15,16,17,18], where it has been used mainly for panel voltage and current readings. When compared with a mathematical model of photovoltaic cells, an ArduinoTM-based DAQ proved to be very close to the values obtained from modeling [16,18].
Table 1 lists several studies in the literature that have developed I-V curve tracers using different measurement and load control approaches. As shown, I-V measurement techniques range from current and voltage sensors coupled to microcontrollers (e.g., Arduino, Raspberry Pi, and PIC) to more sophisticated equipment such as oscilloscopes, National Instruments (NI) data acquisition systems, and digital multimeters. Regarding load control, various methods have been employed, including MOSFETs, charge controllers, capacitive loads, and programmable electronic loads. While Arduino-based systems have been frequently used for I-V measurement, they are typically combined with separate load control mechanisms. As shown, few systems provide full integration of voltage and current measurement with automated resistive load switching using a single microcontroller. For example, in [16], a resistive load is used alongside an Arduino for I-V measurement, but the resistance is manually adjusted.
The novelty of this work lies in the development of a low-cost, standalone Arduino-based DAQ system that integrates measurement, load variation, and data storage. Using a relay-controlled resistor bank and programmed switching logic, the system provides real-time I-V characterization without manual adjustments or external software dependencies. It offers a scalable and reproducible tool suitable for academic, research, and field applications in renewable energy monitoring.
This work presents a low-cost, Arduino-based I-V curve tracer with automated resistive load switching, designed to provide fast, real-time PV panel characterization under field conditions. The proposed system integrates load control and data acquisition in a single platform, eliminating the need for manual adjustments and enabling rapid I-V curve generation. Experimental validation was conducted using a commercial PV module under natural solar conditions, with results compared to a single-diode model for performance evaluation and parameter optimization.
The system’s open-source design, low component cost, and modular architecture make it suitable for deployment in educational labs, field diagnostics, and research in developing regions. Furthermore, the platform can be extended with wireless communication (e.g., ESP32) for future integration into smart PV monitoring and Internet-of-Things (IoT) applications.
2. Materials and Methods
This section describes all the materials used and experimental procedures adopted for the construction, calibration, and testing of the data acquisition system.
The proposed data acquisition system (DAQ) enables real-time I-V curve tracing of photovoltaic panels by integrating voltage and current sensing with automated resistive load switching. The system is built around an Arduino Mega 2560 microcontroller, chosen for its high number of I/O pins and compatibility with open-source libraries.
The experimental tests were conducted in the Porous Media and Energy Efficiency Laboratory (LabMPEE), affiliated with the Graduate Program (Master’s) in Mechanical Engineering (PPGEM) of the Academic Department of Mechanical Engineering (DAMEC) at the Federal Technological University of Parana (UTFPR), Brazil, Ponta Grossa Campus.
2.1. DAQ Essential Parts
To obtain voltage, current and power curves for electrical generators, it is necessary to apply different loads to the generator. To this end, to acquire voltage and current values for a photovoltaic panel and, consequently, its characteristic curves and power values, a resistor association and switching system was developed to apply variable resistive loads to the photovoltaic panel. The system sketch can be seen in Figure 1a, while the final assembly can be seen in Figure 1b. All the sketches presented were made using Fritzing software.
The complete system can be separated into 7 main components: a resistor bank, a 5V, 10A relay module with 8 channels, an ArduinoTM Mega 2560 board, an ACS712 5A current sensor, a voltage divider, a 5V supply and a computer for data storage. To facilitate connections, the resistor bank was assembled using terminal blocks for banana pin connections, and the resistors were placed on an aluminum plate, using thermal paste on their contacts to increase thermal exchange.
Figure 2 details the connections between the resistors and the relay module channels. Each relay module has three connection pins: common (COM), normally closed (NC), and normally open (NO). Each resistor was connected to the NC pin of the relay module channels, as well as to each other. To establish a parallel association between the resistors, the COM pins of each relay module channel were interconnected. When the channel is activated, the connection between the COM and NC pins is established, while when the channel is deactivated, this connection is broken and it is the COM-NO connection that becomes energized.
Eight 100W power resistors with an aluminum shell were utilized, featuring resistances ranging from 100.47 to 1.15 (Res1 = 100.47; Res2 = 47.96; Res3 = 14.84; Res4 = 7.80; Res5 = 4.83; Res6 = 4.14; Res7 = 3.50 ; and Res8 = 1.15). Therefore, in a scenario where channels 1 and 7 are active, the equivalent resistance provided by the system would be approximately 3.38 . The resistors were connected to the positive terminal of the photovoltaic panel, while the COM pins were linked to the negative terminal.
A 5V power supply was utilized to energize the relay module, thereby preventing excessive power consumption from the load provided by the ArduinoTM controller. A universal USB 5V cell phone charger was employed to provide power, with the positive terminal connected to the JD-VCC pin and the negative terminal connected to the GND pin.
A voltage divider was used to increase the maximum voltage reading value performed by the ArduinoTM controller, as the controller can only read voltages from 0V to 5V, which is done at the analog inputs of the board, with a precision of 10 bits. Another alternative could be using a commercial voltage reader up to 25V.
The divider consists of five resistors with a resistance of 100k each. They are arranged into two groups: the first group has three resistors connected in parallel, and the second group has two resistors connected in series. These two groups are then connected in series with each other. In this configuration, the voltage measured across the first group (the parallel one) corresponds to one-seventh of the input voltage. Therefore, the measured voltage must be multiplied by seven, allowing the ArduinoTM to read voltages up to seven times higher than its maximum input range.
For current measurements, an ACS712 5A current sensor was used. The sensor was powered by the ArduinoTM controller via the VCC-5V connection and grounded via the GND-GND connection. The OUT pin, which provides the current reading of the system, was connected to an analog pin of the controller. The sensor was connected in series with the negative pole of the photovoltaic panel and the voltage divider, enabling the measurement of the current supplied by the panel.
2.2. Logics and Operation of the System
The system’s operating principle involves the switching of resistive loads to which the voltage from the photovoltaic panel is applied, allowing for the acquisition of its characteristic curve. The switching of resistive loads was achieved using an 8-channel relay module and 8 resistors with 100W power ratings each. Each resistor was individually connected to each channel of the relay module so that when all eight channels were active, all resistors would be associated in parallel. Since the channels can be switched on or off individually, there are two possible states for each resistor, resulting in a total of 28 possible combinations/resistances, which means 256 distinct resistors association.
Thus, through programming in ArduinoTM, it was possible to vary the equivalent resistance of the resistor association (resistive load) by activating different channels of the relay module at each moment in time, enabling the acquisition of voltage and current values from the photovoltaic panel applied to different resistive loads. To facilitate data acquisition, an LCD shield with a keypad was added to the ArduinoTM module.
Each relay was associated with an index of a binary vector of eight size. For each combination among the 256 possibilities, the combination index was converted into binary, consisting of zeros and ones. The binary value was then inserted into the vector, so that when a value equal to 1 is in a certain position of the vector, the relay associated with that position would be active, considering the resistor connected to that relay in obtaining the equivalent resistive load. Figure 3a illustrates the case for the combination with index 10. Converting the number 10 to binary gives 00001010. If you place this result in a vector associated with the relays, you can see that relays 2 and 4 would be active, as shown by the red light on the relays in Figure 3b. This combination results in a parallel association between resistors Res2 = 47.96; and Res4 = 7.80, giving an equivalent resistive load of 6.7.
Each reading from the system provides voltage [V], current [A], and power [W] data from the electric generator. A total of 23 distinct resistance values were selected, derived from different combinations of resistors. These combinations were defined using an 8-bit binary sequence, where each digit (0 or 1) represents whether a specific resistor is switched off or on, respectively. Figure 4 presents the steps for automatically generating the resistive loads and performing voltage and current measurements.
2.3. System Calibration
To calibrate the voltage measurements, a MinipaTM ET-2042E digital multimeter was connected in parallel with a commercial photovoltaic panel, which was also connected to the data acquisition system. From the readings of the two devices, the data was regressed to obtain the calibration curve, as can be seen in Figure 5a. For the current sensor, the multimeter was connected in series with the photovoltaic panel, which was also connected to the data acquisition system. After one data reading cycle, the current values obtained by the acquisition system were regressed against the current values obtained by the multimeter, as can be seen in Figure 5b.
As can be seen from Figure 5a,b, both regressions were linear in nature with an R2 determination coefficient close to 1, which indicates a strong correlation among the data analyzed. Since the calibration was carried out using the comparative method, the uncertainty of the data acquisition system was the same as that of the digital multimeter, which was A for the current, and V for the voltage.
2.4. Experimental Setup
The experimental tests of the data acquisition system were conducted using a commercial Resun™ RSM060P photovoltaic panel (Table 2). The panel was installed on the external metal mezzanine of LabSOLAR’s solar patio, tilted from the horizontal,matching the latitude of Ponta Grossa, PR ( South), and oriented toward geographic north. The panel remained fully exposed to natural environmental conditions, without any modifications or interventions to alter irradiance, wind, or ambient temperature. This ensured that the measurements reflected real operational conditions, with solar irradiance varying naturally throughout the day.
Solar irradiance (G) was measured using a Kipp & ZonenTM CMP3 pyranometer, positioned with the same inclination and orientation as the photovoltaic panel. Additionally, five type-K thermocouples (Omega EngineeringTM) were placed on the back of the PV panel to monitor its temperature. Figure 6 illustrates the setup, showing the positioning of the photovoltaic panel and the pyranometer.
The output of the PV panel was connected to the developed DAQ and measurements of the I-V curve, solar irradiance, and temperature were taken at different times throughout the day to analyze how the PV panel responds to varying operational conditions, such as solar irradiance and operating temperature (Top), which is the average temperature of the PV panel.
2.5. Experimental Uncertainty
Table 3 shows the uncertainty values considered for each experimental variable described here. For the pyranometer and multimeter, the uncertainty presented in the technical data sheets supplied by the manufacturers was considered. For thermocouples and the resistive load data acquisition system, the uncertainty was considered to be the same as that of the instruments used in their calibration, carried out using the comparative method.
3. PV Panel Modeling
Modeling a photovoltaic (PV) panel presents challenges due to its non-linear behavior. Usually, the single and double diode models can be used for this task. Among these, the single diode model strikes an effective balance between complexity and accuracy, with simpler implementation and fewer parameters involved, making it a favorable choice for modeling PV panels in many applications [16,36].
The electrical equivalent circuit of the single diode model is shown in Figure 7. It consists of a diode (D1), which accounts for the non-linearity of the PV panel, a photocurrent source (), a series resistance () representing internal losses, and a shunt resistance () modeling leakage currents. Under uniform operating conditions, the voltage () and current () of the PV cells follow the relationship described in Equation (1), in which n is the diode ideality factor, is Boltzmann’s constant ( J/K), is the number of cells, and are the photocurrent and saturation current of the diode, T is the cell temperature in K, and q is the electron charge ( C) [36,37].
The terms , , and can be modeled mathematically by (2) to (4), respectively, in which G is the solar irradiance (in W/m2), is the band-gap energy with eV for silicon, is the temperature coefficient of short circuit current, and and are the photocurrent and shunt resistance at standard test conditions (1000 W/m2 and 298.15 K) [36].
Examining (1) to (4), five key parameters must be identified to accurately model the I-V curve of the PV panel: , , n, , and . These parameters were determined using the differential evolution optimization algorithm. Equations 1 to 4, along with the data from Table 3, were implemented in a Python environment, where the optimization algorithm was used to fit the parameters to an I-V curve provided by the manufacturer under standard test conditions. The optimized values obtained were A, , , A, and .
Figure 8 compares the manufacturer’s data at standard conditions with the optimized model, showing good agreement between data for the current (I) and output power (P), with a mean average percentage error (MAPE) of 4.40% for the current (I) values.
With the optimization of these five parameters, (1) to (4) can be implemented along with the data from Table 3. The experimental measurements obtained with the proposed data acquisition system (DAQ) can be compared with the results obtained from the single diode model.
4. Results
The data from the photovoltaic panel, obtained using the resistive load data acquisition system, is shown in Table 4. The first measurement was taken with all relay module channels turned off, meaning the photovoltaic panel was in an open-circuit condition. Subsequent measurements were taken using different resistor combinations from the resistor bank. The entire data acquisition process takes 45 seconds and successfully automated the switching of the load applied to the PV panel.
The data shown in Table 4 illustrates the importance of using a system to apply loads to electric generators, since the power generated varies according to the load applied and it is necessary to obtain the device’s maximum power value to determine its efficiency. Another advantage of the system is that the time of each acquisition is recorded, allowing the efficiency of the device to be calculated correctly from the solar irradiance value collected at the same time as the maximum power acquisition.
It is important to note that of the 256 possible associations, only 23 were selected to reduce the measurement time. If all 256 possibilities were carried out, it is estimated that the data collection time would go from 45 seconds to approximately 501 seconds.
Furthermore, as can be seen in As in Figure 9a, depending on the conditions to which the generator is subjected-in this case, a photovoltaic panel subjected to different solar irradiance values (G) and operational temperatures (Top)-the maximum power value can be obtained with different resistive loads. It can also be observed that the range of resistive load values applied to the photovoltaic panel was sufficient to achieve the maximum power value even under varying solar irradiance conditions.
The data acquisition system was also able to observe the characteristic curve of the photovoltaic panel under the incidence of different average levels of solar irradiance, as can be seen in Figure 9b. Even though these results were not obtained under controlled temperature and solar irradiance conditions, the behavior shown is very similar to what is expected for these devices, in which higher solar irradiance values tend to increase the voltage and current values of the photovoltaic panel, with the most significant increase being in the current, which consequently increases its power.
Figure 9b also shows the comparison between the DAQ and model data for the I-V curves and output power for each G and Top condition. It can be seen that, in general, the model was able to predict the same behavior for the I-V and output power curves, however with some difference in absolute values with the measurements from the DAQ.
Figure 10a,b illustrate the importance of acquiring data quickly. When operating the device under ambient conditions, it is exposed to variations in solar irradiance. Figure 10a shows the panel’s characteristic curve obtained from an acquisition made with constant solar irradiance, while Figure 10b shows the acquisition with variations in solar irradiance. If the acquisition is done slowly, the likelihood of the panel being exposed to different G conditions is greater, making it more difficult to characterize the device.
Figure 11a,b show the MAPE between the DAQ and model data for the I-V and output power curves, reaching values below 20%, but higher than the MAPE obtained during the optimization of the standard conditions parameters.
This may occur because the values of temperature and solar irradiance may not be constant along the whole PV panel, as Table 5 shows. To be able to compare the model with the experimental data, average temperature and irradiance values were used, so this high MAPE between the DAQ and model data may occur due the fact that in the optimization process, the experimental data used as reference was obtained at constant operational temperature and solar irradiance, conditions that are not feasible in a real operation.
This issue resulted in an overestimation of the output power and energy efficiency () by the model, especially for lower values of G (relative difference of approx. 27% for G = 246.33 W/m2), as Table 6 shows. Using the experimental results obtained with the DAQ to optimize the model parameters can reduce this average difference in the model results.
Using the experimental results for , the optimized values obtained were , , , , and .
Figure 12a,b show the results of using these new optimized parameters. The MAPE of the I-V curves and output power curves reduced from 18.23 and 18.54% to 7.06 and 7.22%, respectively, and the relative difference between the panel efficiency reduced from around 27% to around 15%.
These results show the importance of the development and use of a data acquisition system that can perform a voltage sweep on the PV module to obtain the I-V curves in real condition operations. These valuable data can be used both to compare different operational conditions or to obtain real time data to optimize PV panel models.
5. Conclusions
This study introduces a low-cost, ArduinoTM-based data acquisition (DAQ) system that overcomes key limitations of existing methods by integrating automated resistive load control and rapid data acquisition in a single setup. Unlike traditional systems that require manual adjustments, this system can automatically vary the resistive load and acquire real-time data, which is crucial for accurate PV panel characterization, especially in field conditions where environmental factors such as solar irradiance and temperature can fluctuate. The data acquisition time of 45 seconds minimizes the impact of these variables.
The single-diode model provided good results under standard conditions (manufacturer’s data - MAPE of 4.40% for current values). However, discrepancies arose under real operational conditions, particularly at lower solar irradiance levels (with a relative difference of about 27% at G = 246.33W/m2). This highlights the importance of real-time experimental data for optimizing PV models, as standard laboratory conditions may not reflect actual field performance. When experimental data were used to optimize the model, the accuracy improved, reducing the MAPE for I-V curves and output power from 18.23% and 18.54% to 7.06% and 7.22%, respectively.
The proposed system offers a cost-effective and flexible alternative to commercial I-V curve tracers, making it especially valuable for educational institutions, small-scale renewable energy projects, and researchers in developing countries. Its open-source hardware and software design ensures that it can be easily replicated and adapted to meet various experimental needs, further enhancing its accessibility.
Future research could explore machine learning algorithms or advanced optimization techniques to further improve model parameters. While the current system is designed for single-panel characterization, future versions could support multiple panels or be integrated with other renewable energy systems like wind turbines or hybrid systems.
Furthemore the proposed DAQ system, originally implemented on an ArduinoTM board, can be easily adapted to incorporate wireless communication capabilities by replacing the ArduinoTM with an ESP32. The ESP32 is fully compatible with the ArduinoTM IDE and comes with integrated Wi-Fi and Bluetooth, which would enable real-time cloud monitoring and remote data transmission. This modification would require only the addition of communication-specific code, thereby enhancing the system’s versatility without significant changes to the existing hardware design. Such an approach aligns with recent advancements in PV monitoring solutions, as demonstrated by [34].
Author Contributions
Conceptualization, P.M., L.F., R.S. and T.A.; methodology, P.M., L.F. and R.S; software, P.M., L.F., E.T. and R.S; validation, P.M. and E.T.; formal analysis, P.M. E.T., S.S., H.S., R.S. and T.A.; investigation, P.M. and R.S.; resources, R.S. and T.A.; data curation, P.M., L.F., E.T. and R.S.; writing—original draft preparation, P.M.; writing—review and editing, S.S., H.S., R.S. and T.A.; visualization, P.M., S.S., H.S., R.S. and T.A.; supervision, S.S., H.S., R.S. and T.A.; project administration, R.S. and T.A.; funding acquisition, R.S. and T.A. All authors have read and agreed to the published version of the manuscript.
Funding
This study was financed in part by the Coordenação de Aperfeiçoamento de Pessoal de Nível Superior – Brasil (CAPES) – Finance Code 001.
Institutional Review Board Statement
Not applicable.
Informed Consent Statement
Not applicable.
Data Availability Statement
The original contributions presented in this study are included in the article. Further inquiries can be directed to the corresponding author.
Acknowledgments
The authors acknowledge the Capes, the CNPq, the PROPPG/UTFPR, the DIRPPG/UTFPR, the PPGEM/UTFPR (Campus Ponta Grossa), the DAMEC/UTFPR (Campus Ponta Grossa), and the DAFIS/ UTFPR (Campus Ponta Grossa).
Conflicts of Interest
The authors declare no conflicts of interest.
Abbreviations
The following abbreviations are used in this manuscript:
| MAPE | Mean absolute percentage error |
| GND | Ground |
| DAQ | Data acquisition |
| COM | Common pin (relay) |
| NC | Normally closed (relay contact) |
| NO | Normally open (relay contact) |
| Res | Resistor |
| IoT | Internet-of-Things |
References
- Hentschel, M.; Ketter, W.; Collins, J. Renewable energy cooperatives: Facilitating the energy transition at the Port of Rotterdam. Energy policy 2018, 121, 61–69. [Google Scholar] [CrossRef]
- OECD. World Energy Outlook 2023; 2023; p. 353. [CrossRef]
- Rezk, H.; Tyukhov, I.; Al-Dhaifallah, M.; Tikhonov, A. Performance of data acquisition system for monitoring PV system parameters. Measurement 2017, 104, 204–211. [Google Scholar] [CrossRef]
- Reyes-Ramírez, I.; Fonseca-Campos, J.; Mata-Machuca, J.L. Measurement of the current-voltage curve of photovoltaic cells based on a DAQ and Python. Renewable Energy and Power Quality Journal 2018, 16, 94–98. [Google Scholar] [CrossRef]
- Kuai, Y.; Yuvarajan, S. An electronic load for testing photovoltaic panels. Journal of Power Sources 2006, 154, 308–313. [Google Scholar] [CrossRef]
- González, I.; Portalo, J.M.; Calderón, A.J. Configurable IoT open-source hardware and software IV curve tracer for photovoltaic generators. Sensors 2021, 21, 7650. [Google Scholar] [CrossRef]
- Keysight Technologies. B1505A Power Device Analyzer / Curve Tracer, 2025. Acessed: 15 mar. 2025.
- HT Instruments. I-V500w: 1500V 15A I-V Curve Tracer compatible with htanalysis, 2025. Acessado em: 15 mar. 2025.
- Jucá, S.C.; Carvalho, P.C.; Brito, F.T. A low cost concept for data acquisition systems applied to decentralized renewable energy plants. Sensors 2011, 11, 743–756. [Google Scholar] [CrossRef]
- Köhli, M.; Weimar, J.; Schmidt, S.; Schmidt, F.P.; Lambertz, A.; Weber, L.; Kaminski, J.; Schmidt, U. Arduino-Based Readout Electronics for Nuclear and Particle Physics. Sensors 2024, 24, 2935. [Google Scholar] [CrossRef]
- Machado, P.L.O.; Fachini, L.V.G.; Machado, V.O.O.; Szmoski, R.M.; Alves, T.A. Load cells calibration with a low cost data acquisition system. Revista Brasileira de Física Tecnológica Aplicada 2019, 6. [Google Scholar] [CrossRef]
- González, A.; Olazagoitia, J.L.; Vinolas, J. A low-cost data acquisition system for automobile dynamics applications. Sensors 2018, 18, 366. [Google Scholar] [CrossRef]
- Kumar, S.; Kolekar, T.; Patil, S.; Bongale, A.; Kotecha, K.; Zaguia, A.; Prakash, C. A low-cost multi-sensor data acquisition system for fault detection in fused deposition modelling. Sensors 2022, 22, 517. [Google Scholar] [CrossRef]
- Maharmi, B.; Widyastomo, B.; Palaha, F. Water Flow Measurement-Based Data Acquisition Using Arduino Microcontroller and PLX-DAQ Software. Jurnal Ilmiah Teknik Elektro Komputer dan Informatika 2022, 8, 107–118. [Google Scholar] [CrossRef]
- Sugiartha, N.; Sugina, I.M.; Putra, I.D.G.A.T.; Indraswara, M.A.; Suryani, L.I.D. Development of an arduino-based data acquisition device for monitoring solar PV system parameters. In Proceedings of the International Conference on Science and Technology (ICST 2018). Atlantis Press; 2018; pp. 995–999. [Google Scholar] [CrossRef]
- Pachauri, R.K.; Mahela, O.P.; Khan, B.; Kumar, A.; Agarwal, S.; Alhelou, H.H.; Bai, J. Development of arduino assisted data acquisition system for solar photovoltaic array characterization under partial shading conditions. Computers & Electrical Engineering 2021, 92, 107175. [Google Scholar] [CrossRef]
- Mahzan, N.N.; Omar, A.; Rimon, L.; Noor, S.M.; Rosselan, M. Design and development of an arduino based data logger for photovoltaic monitoring system. Int. J. Simul. Syst. Sci. Technol 2017, 17, 15–1. [Google Scholar] [CrossRef]
- El Hammoumi, A.; Motahhir, S.; Chalh, A.; El Ghzizal, A.; Derouich, A. Low-cost virtual instrumentation of PV panel characteristics using Excel and Arduino in comparison with traditional instrumentation. Renewables: wind, water, and solar 2018, 5, 1–16. [Google Scholar] [CrossRef]
- Belmili, H.; Cheikh, S.M.A.; Haddadi, M.; Larbes, C. Design and development of a data acquisition system for photovoltaic modules characterization. Renewable Energy 2010, 35, 1484–1492. [Google Scholar] [CrossRef]
- Papageorgas, P.; Piromalis, D.; Valavanis, T.; Kambasis, S.; Iliopoulou, T.; Vokas, G. A low-cost and fast PV IV curve tracer based on an open source platform with M2M communication capabilities for preventive monitoring. Energy Procedia 2015, 74, 423–438. [Google Scholar] [CrossRef]
- Montes-Romero, J.; Piliougine, M.; Muñoz, J.V.; Fernández, E.F.; De la Casa, J. Photovoltaic device performance evaluation using an open-hardware system and standard calibrated laboratory instruments. Energies 2017, 10, 1869. [Google Scholar] [CrossRef]
- Willoughby, A.A.; Osinowo, M.O. Development of an electronic load IV curve tracer to investigate the impact of Harmattan aerosol loading on PV module pern2tkformance in southwest Nigeria. Solar Energy 2018, 166, 171–180. [Google Scholar] [CrossRef]
- Amiry, H.; Benhmida, M.; Bendaoud, R.; Hajjaj, C.; Bounouar, S.; Yadir, S.; Raïs, K.; Sidki, M. Design and implementation of a photovoltaic IV curve tracer: Solar modules characterization under real operating conditions. Energy Conversion and Management 2018, 169, 206–216. [Google Scholar] [CrossRef]
- Chen, Z.; Lin, W.; Wu, L.; Long, C.; Lin, P.; Cheng, S. A capacitor based fast IV characteristics tester for photovoltaic arrays. Energy Procedia 2018, 145, 381–387. [Google Scholar] [CrossRef]
- Vega, A.; Valiño, V.; Conde, E.; Ramos, A.; Reina, P. Double sweep tracer for IV curves characterization and continuous monitoring of photovoltaic facilities. Solar Energy 2019, 190, 622–629. [Google Scholar] [CrossRef]
- Ortega, E.; Aranguren, G.; Jimeno, J.C. New monitoring method to characterize individual modules in large photovoltaic systems. Solar Energy 2019, 193, 906–914. [Google Scholar] [CrossRef]
- Mokhtar, M.; Ahmad, S.; Sepeai, S.; Daud, N.M.; Zaid, S.H. Inexpensive current-voltage system with electronically-controlled resistance under xenon arc light for solar cell efficiency measurements. Jurnal Kejuruteraan 2019, 31, 335–340. [Google Scholar] [CrossRef]
- Chen, Z.; Lin, Y.; Wu, L.; Cheng, S.; Lin, P. Development of a capacitor charging based quick IV curve tracer with automatic parameter extraction for photovoltaic arrays. Energy Conversion and Management 2020, 226, 113521. [Google Scholar] [CrossRef]
- Sarikh, S.; Raoufi, M.; Bennouna, A.; Benlarabi, A.; Ikken, B. Implementation of a plug and play IV curve tracer dedicated to characterization and diagnosis of PV modules under real operating conditions. Energy Conversion and Management 2020, 209, 112613. [Google Scholar] [CrossRef]
- Shapsough, S.; Takrouri, M.; Dhaouadi, R.; Zualkernan, I. An IoT-based remote IV tracing system for analysis of city-wide solar power facilities. Sustainable cities and society 2020, 57, 102041. [Google Scholar] [CrossRef]
- Cáceres, M.; Firman, A.; Montes-Romero, J.; González Mayans, A.R.; Vera, L.H.; F. Fernández, E.; de la Casa Higueras, J. Low-cost I–V tracer for PV modules under real operating conditions. Energies 2020, 13, 4320. [CrossRef]
- Morales-Aragonés, J.I.; Gallardo-Saavedra, S.; Alonso-Gómez, V.; Sánchez-Pacheco, F.J.; González, M.A.; Martínez, O.; Munoz-Garcia, M.A.; Alonso-García, M.d.C.; Hernández-Callejo, L. Low-cost electronics for online iv tracing at photovoltaic module level: Development of two strategies and comparison between them. Electronics 2021, 10, 671. [Google Scholar] [CrossRef]
- Suresh, A.N.; Naveen, B.; Dusarlapudi, K. Design and Implementation of Cost-Effective PV String IV and PV curve tracer by using IGBT as a Power Electronic Load. In Proceedings of the 2024 6th International Conference on Energy, Power and Environment (ICEPE). IEEE; 2024; pp. 1–7. [Google Scholar] [CrossRef]
- De Riso, M.; Matacena, I.; Guerriero, P.; Daliento, S. A Wireless Self-Powered IV Curve Tracer for On-Line Characterization of Individual PV Panels. IEEE Transactions on Industrial Electronics 2024, 71, 11508–11518. [Google Scholar] [CrossRef]
- Rivai, A.; Erixno, O.; Rahim, N.; Elias, M.; Jamaludin, J.; Ramadhani, F. A Multi-String Photovoltaic Current-Voltage (IV) Curve Tracer. In Proceedings of the Journal of Physics: Conference Series. IOP Publishing, 2025, Vol. 2942, p. 012001. [CrossRef]
- Alombah, N.H.; Harrison, A.; Kamel, S.; Fotsin, H.B.; Aurangzeb, M. Development of an efficient and rapid computational solar photovoltaic emulator utilizing an explicit PV model. Solar Energy 2024, 271, 112426. [Google Scholar] [CrossRef]
- Khan, M.A.; Khan, M.A.; Ali, H.; Ashraf, B.; Khan, S.; Baig, D.E.Z.; Wadood, A.; Khurshaid, T. Output power prediction of a photovoltaic module through artificial neural network. IEEE Access 2022, 10, 116160–116166. [Google Scholar] [CrossRef]
Figure 1.
Data acquisition system: (a) Sketch; (b) Final assembly.
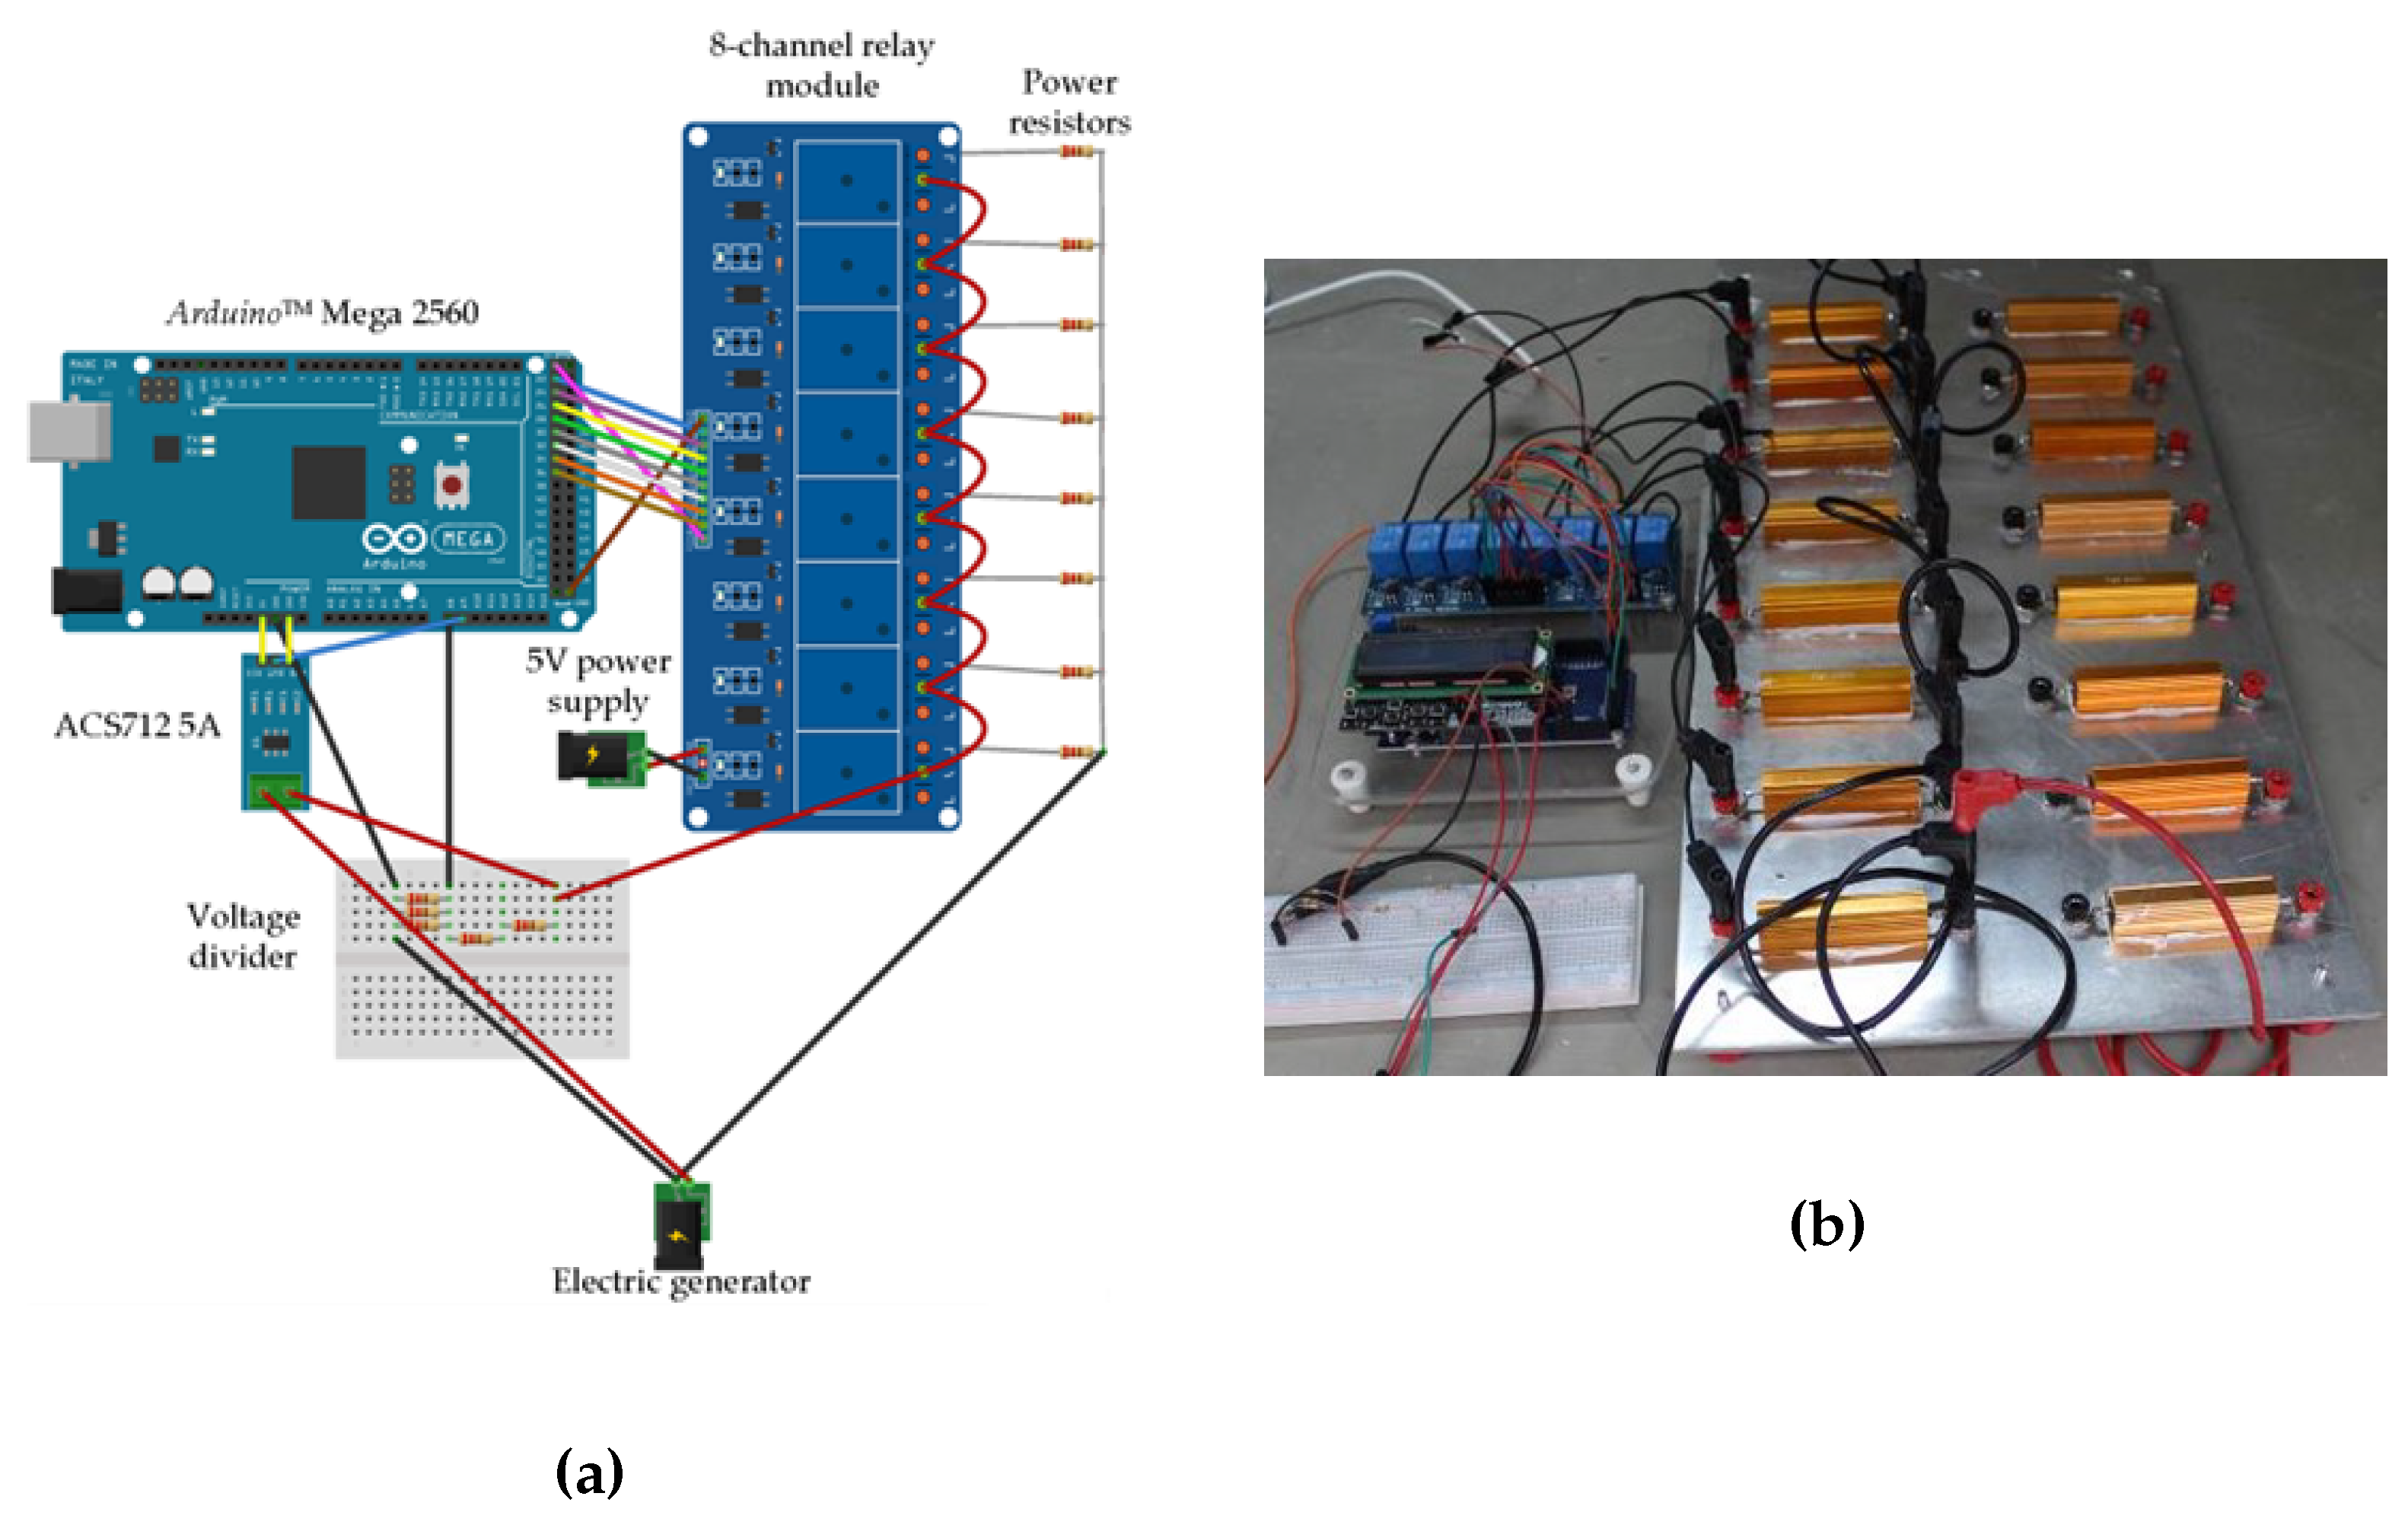
Figure 2.
Connections between the power resistors.
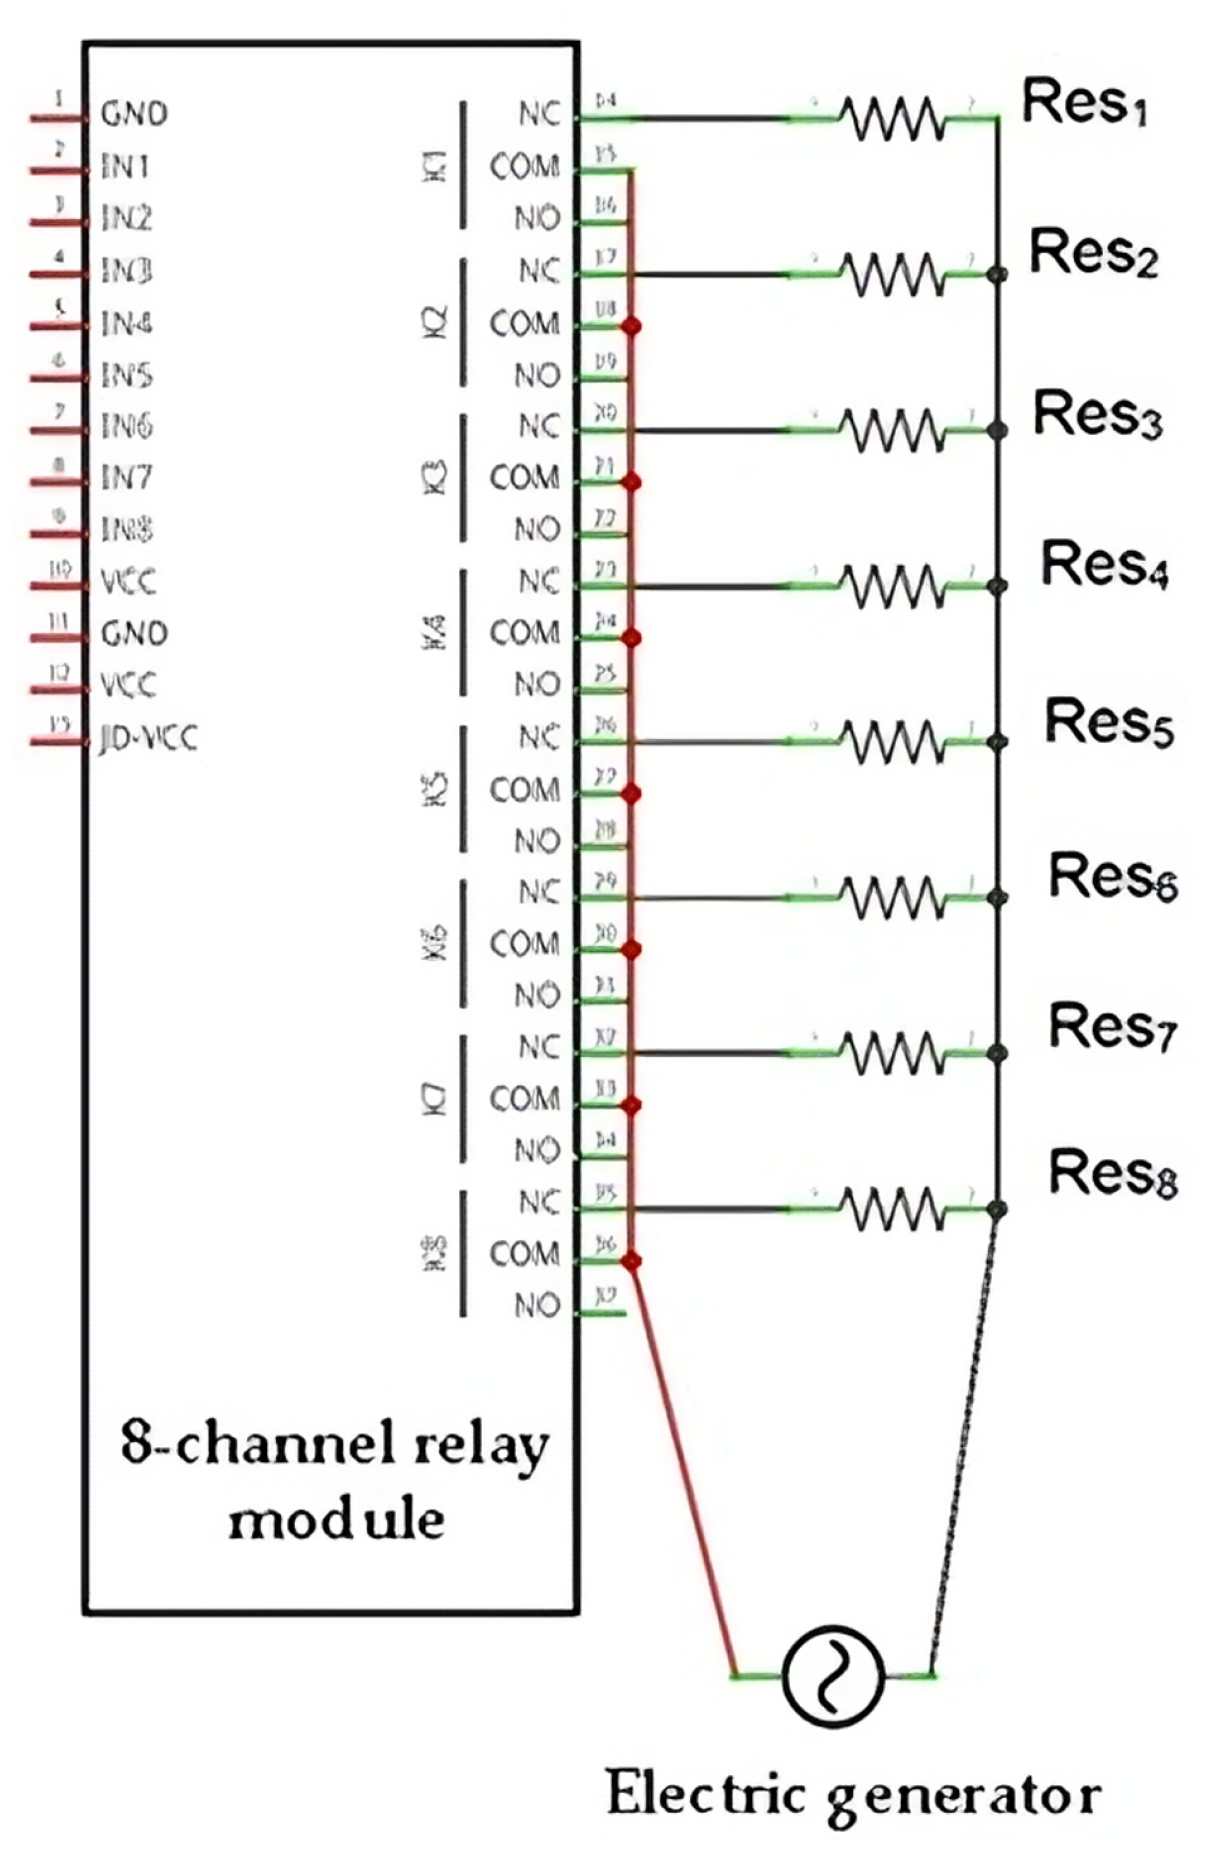
Figure 3.
Relay activation: (a) Relay-binary; (b) Relay activation.
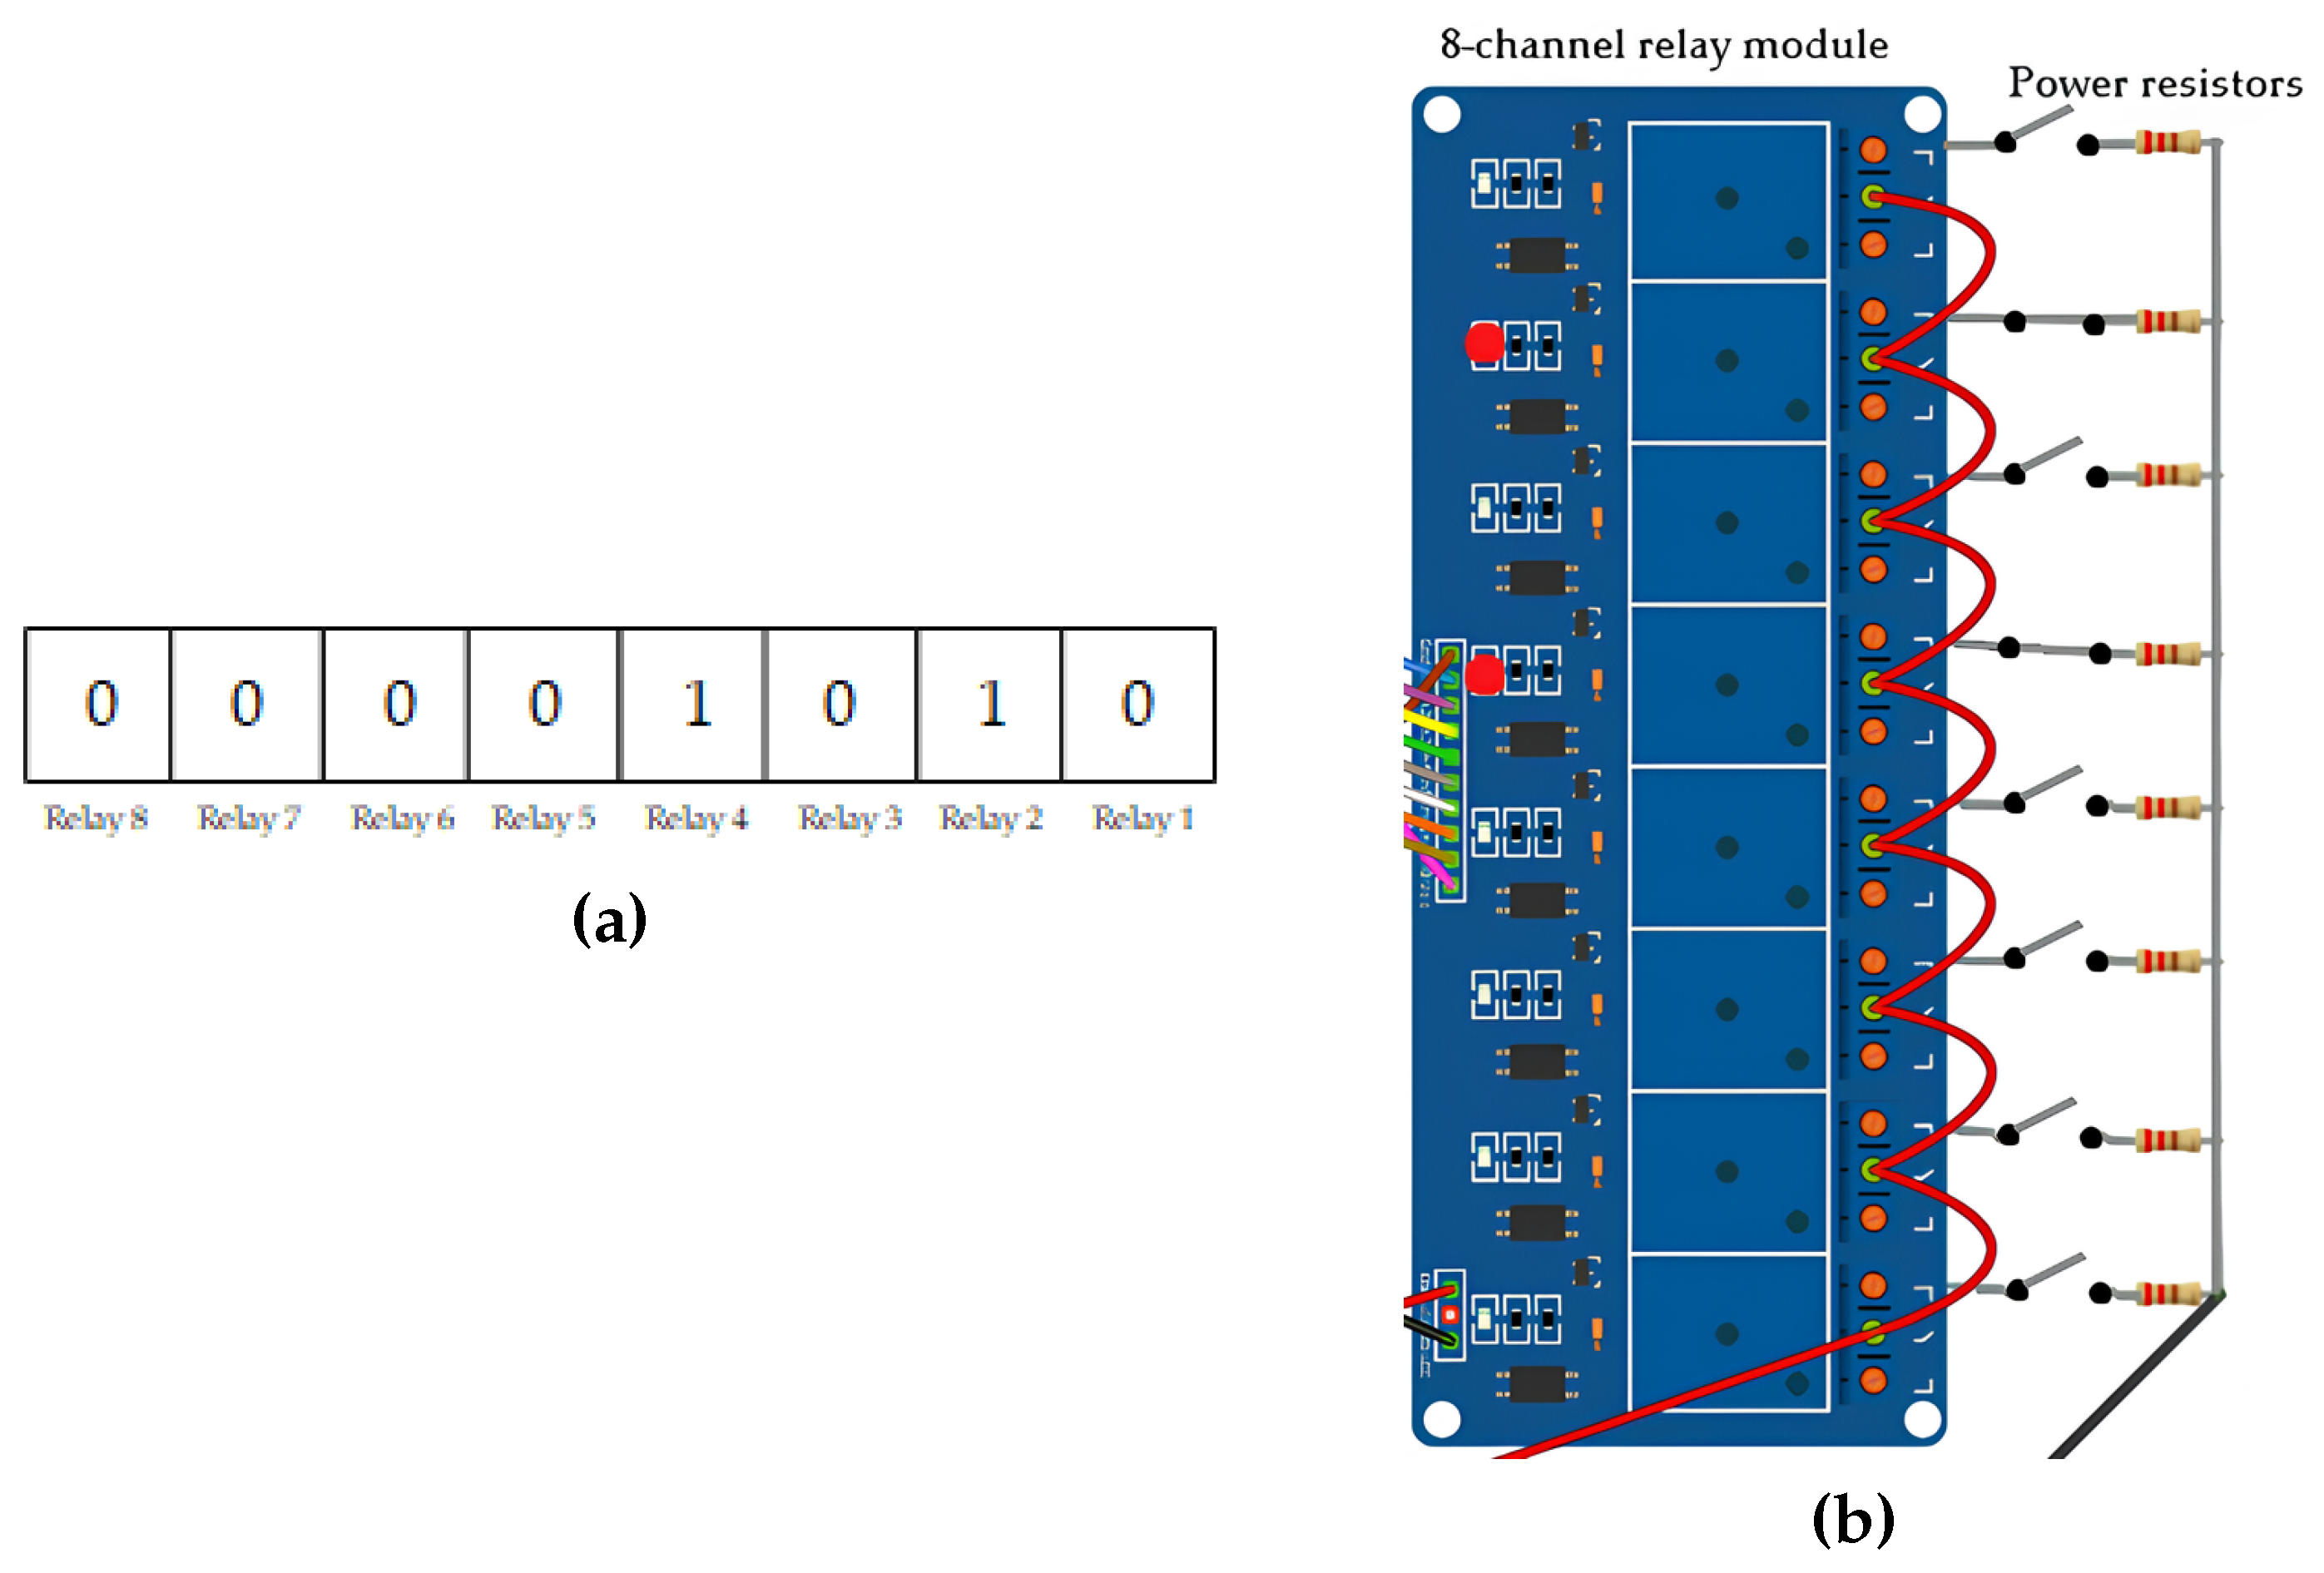
Figure 4.
Flowchart of operation.
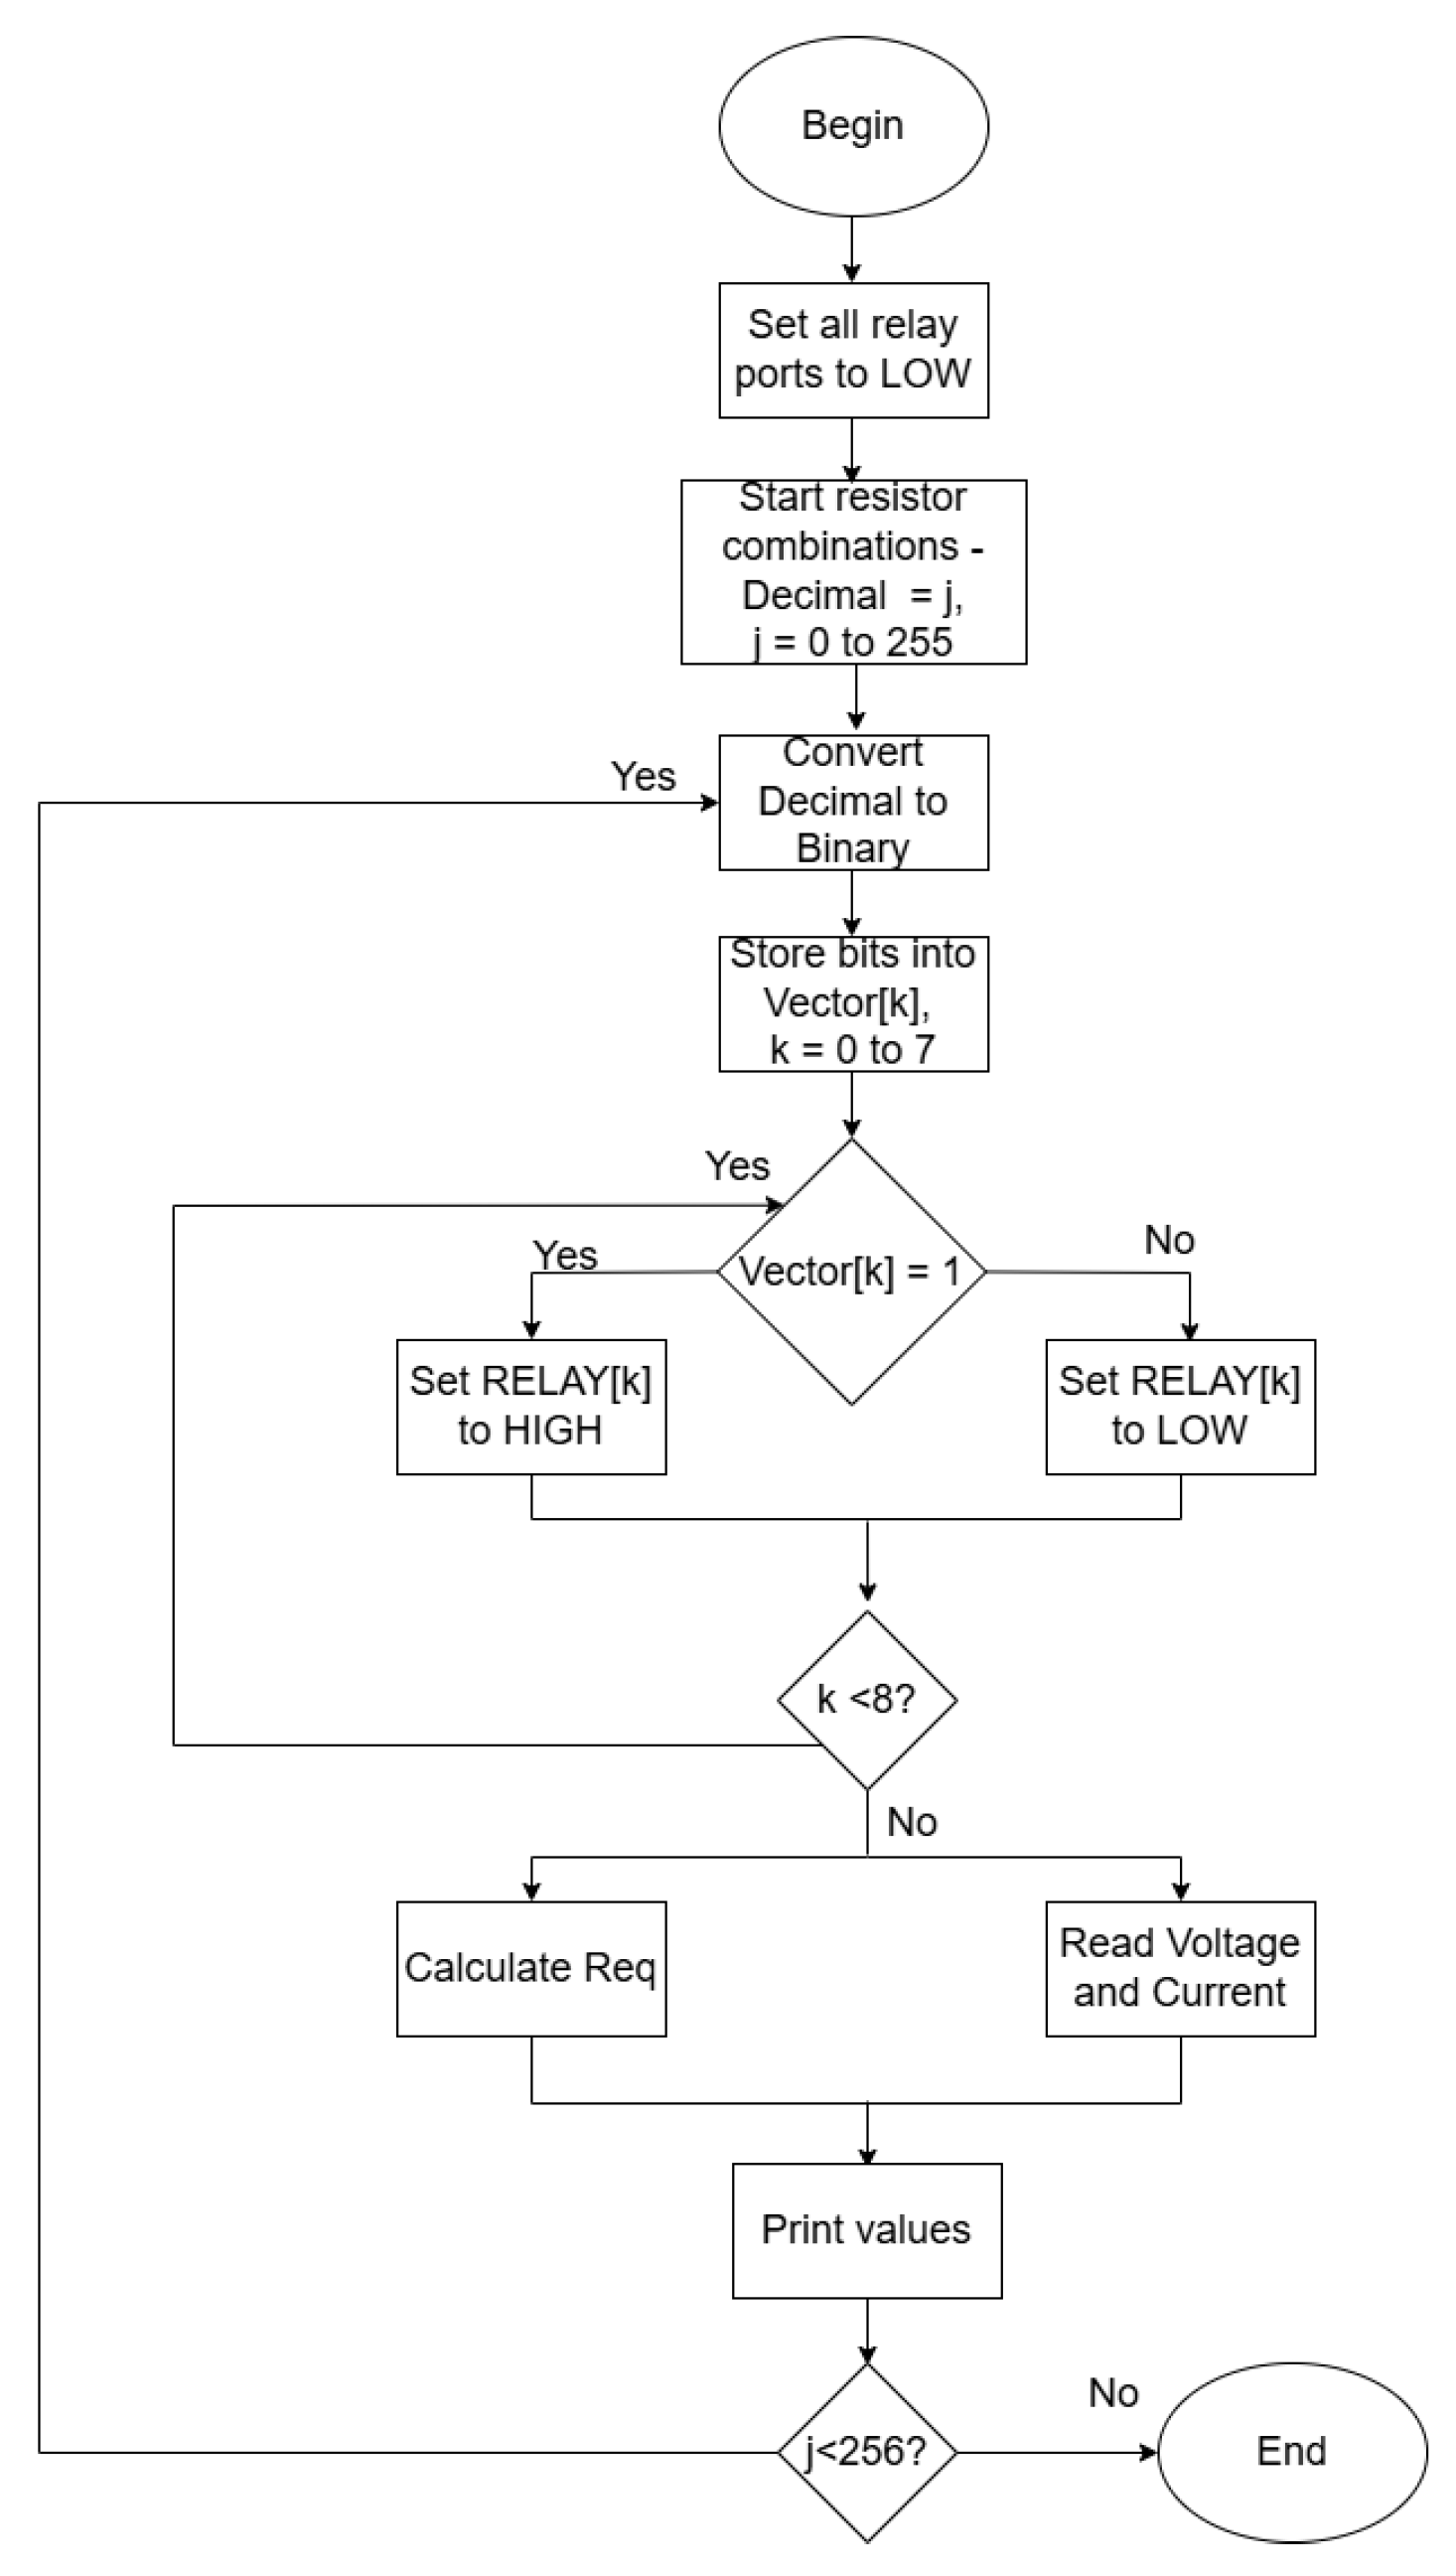
Figure 5.
Calibration: (a) Voltage; (b) Current.
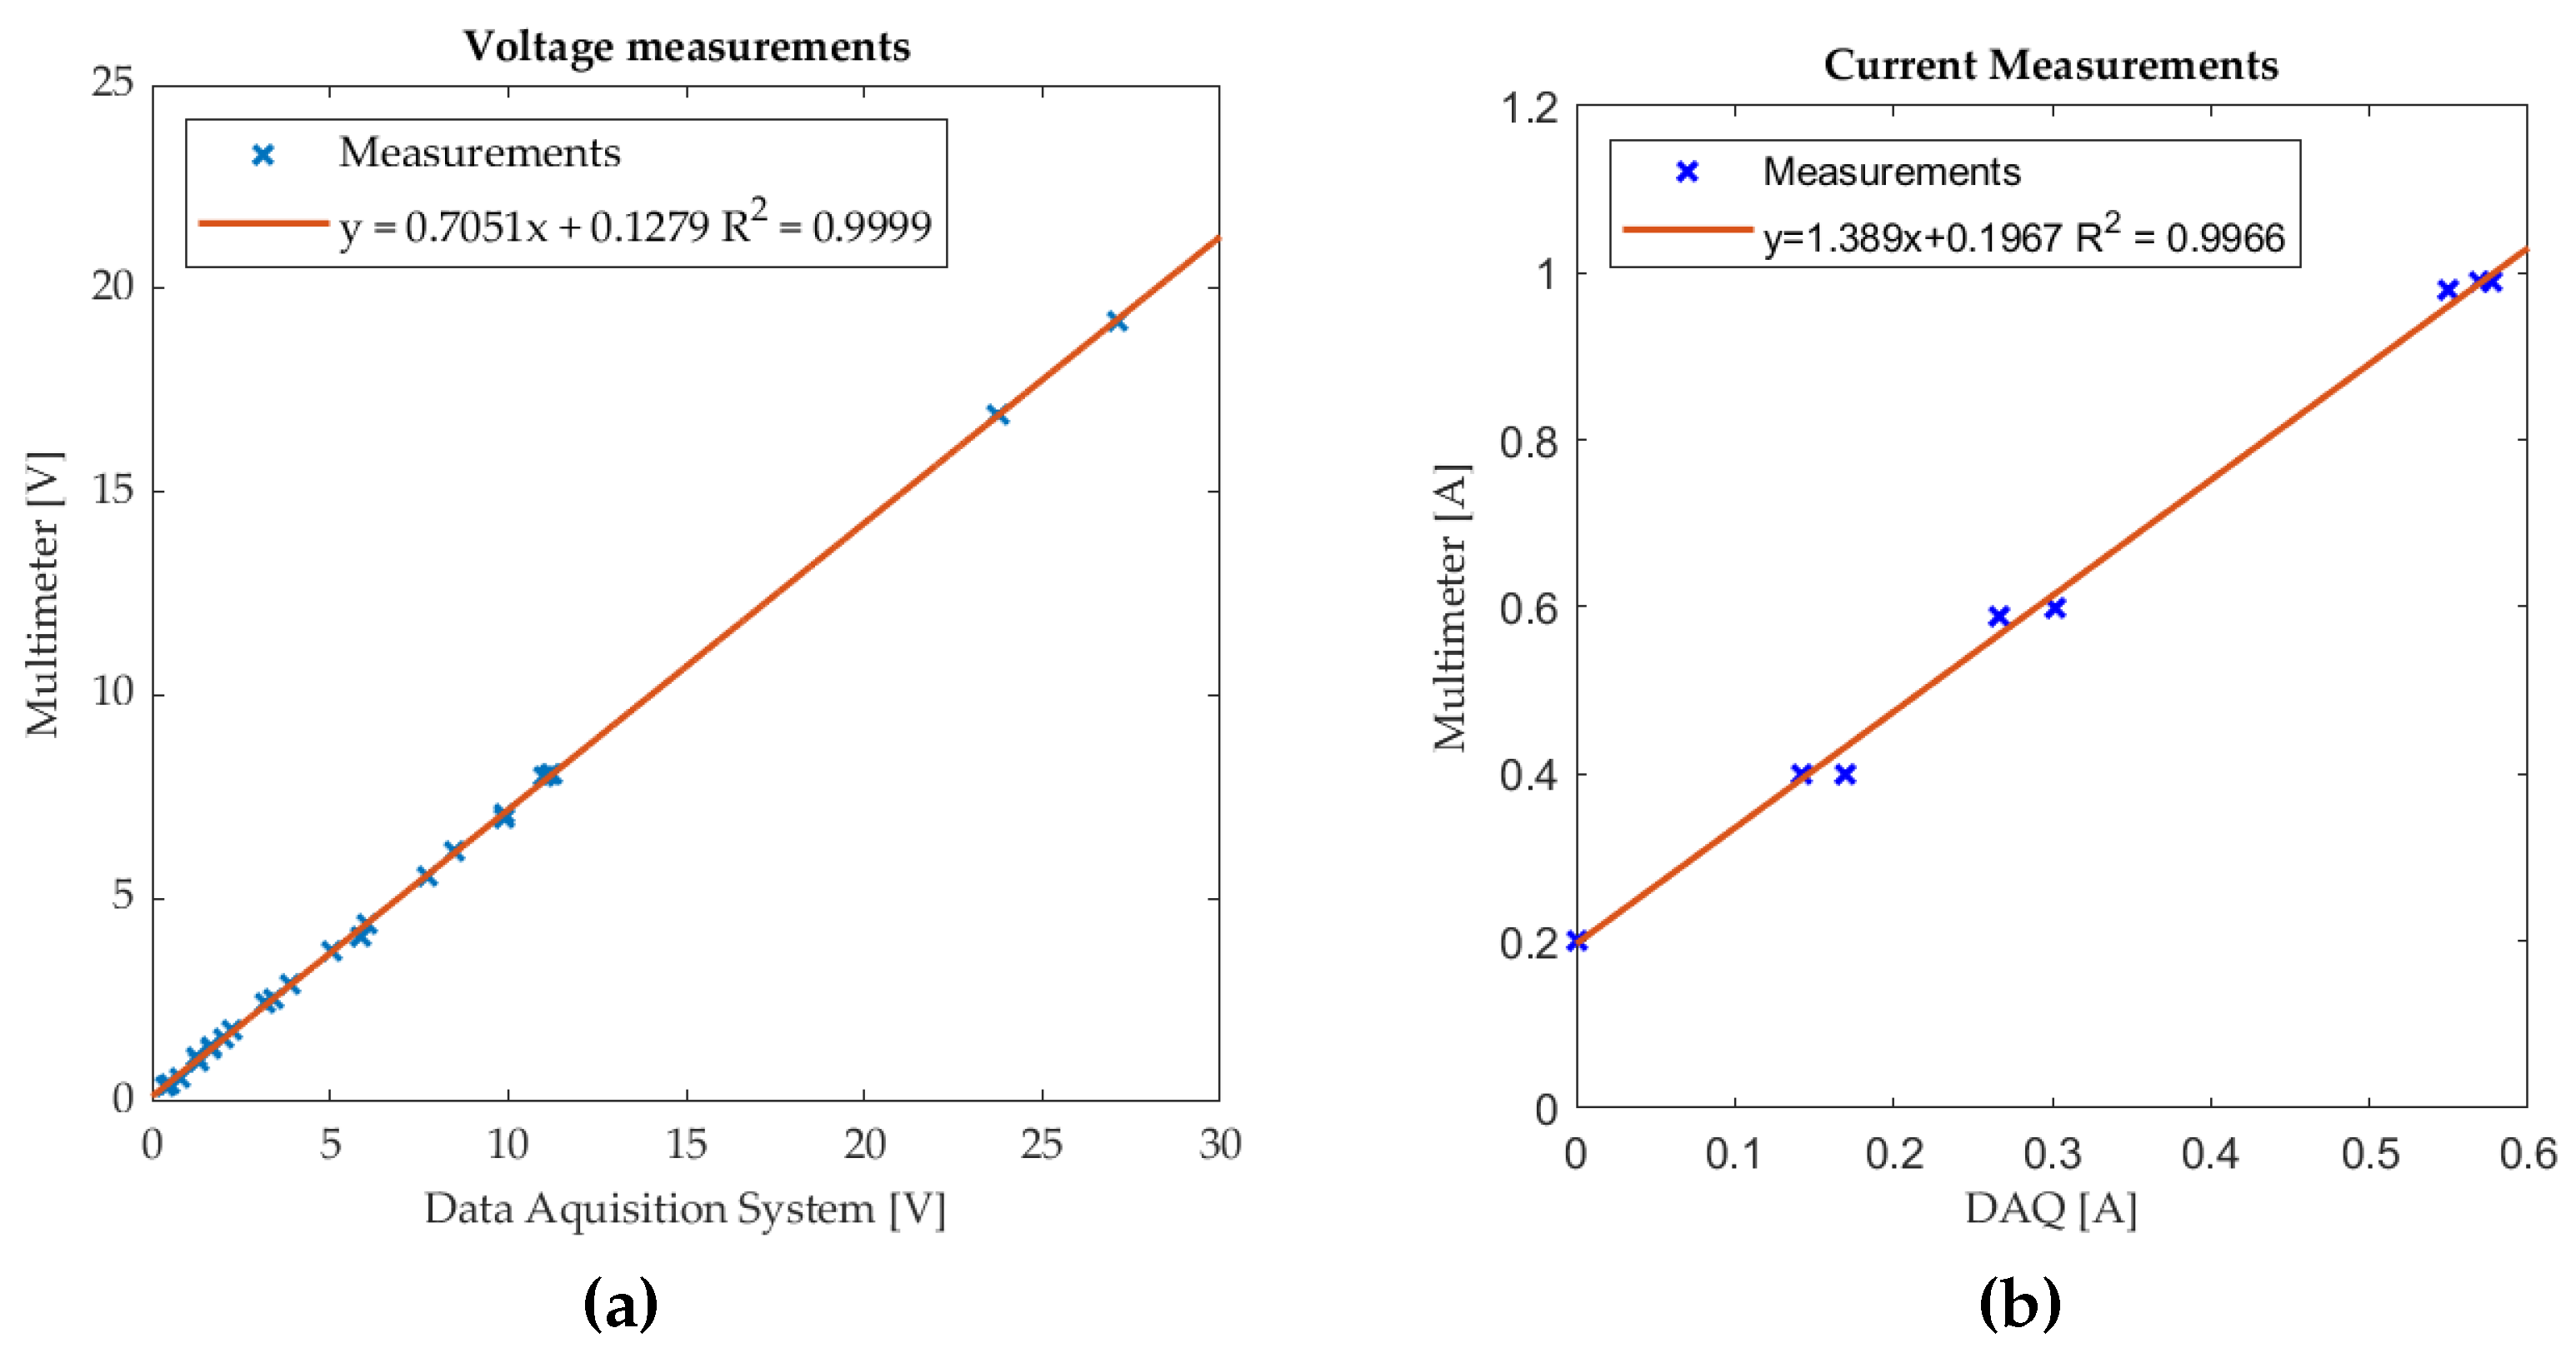
Figure 6.
Experimental setup.
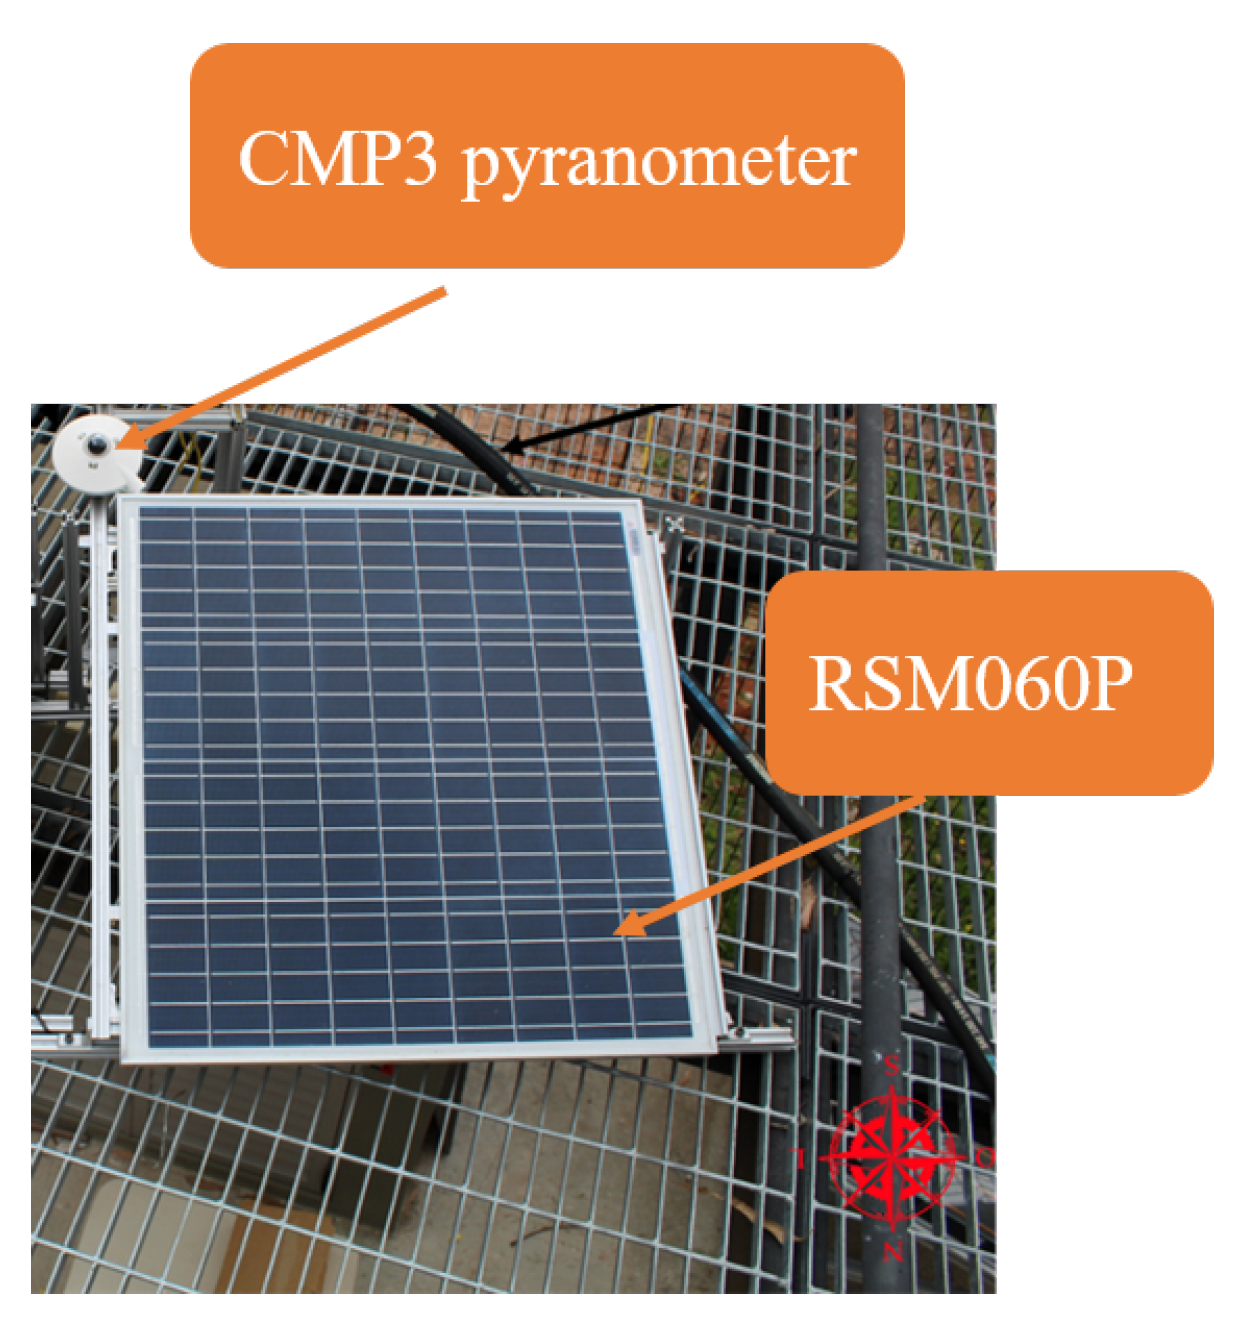
Figure 7.
Equivalent circuit of the single diode model.
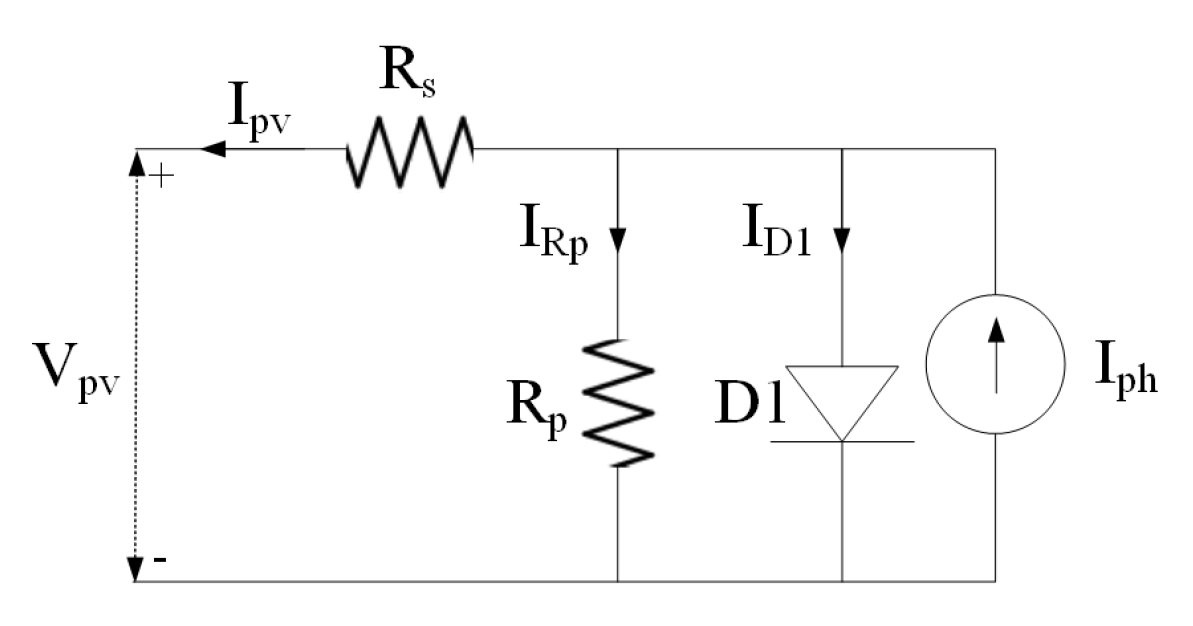
Figure 8.
Standard I-V curve vs single diode model.
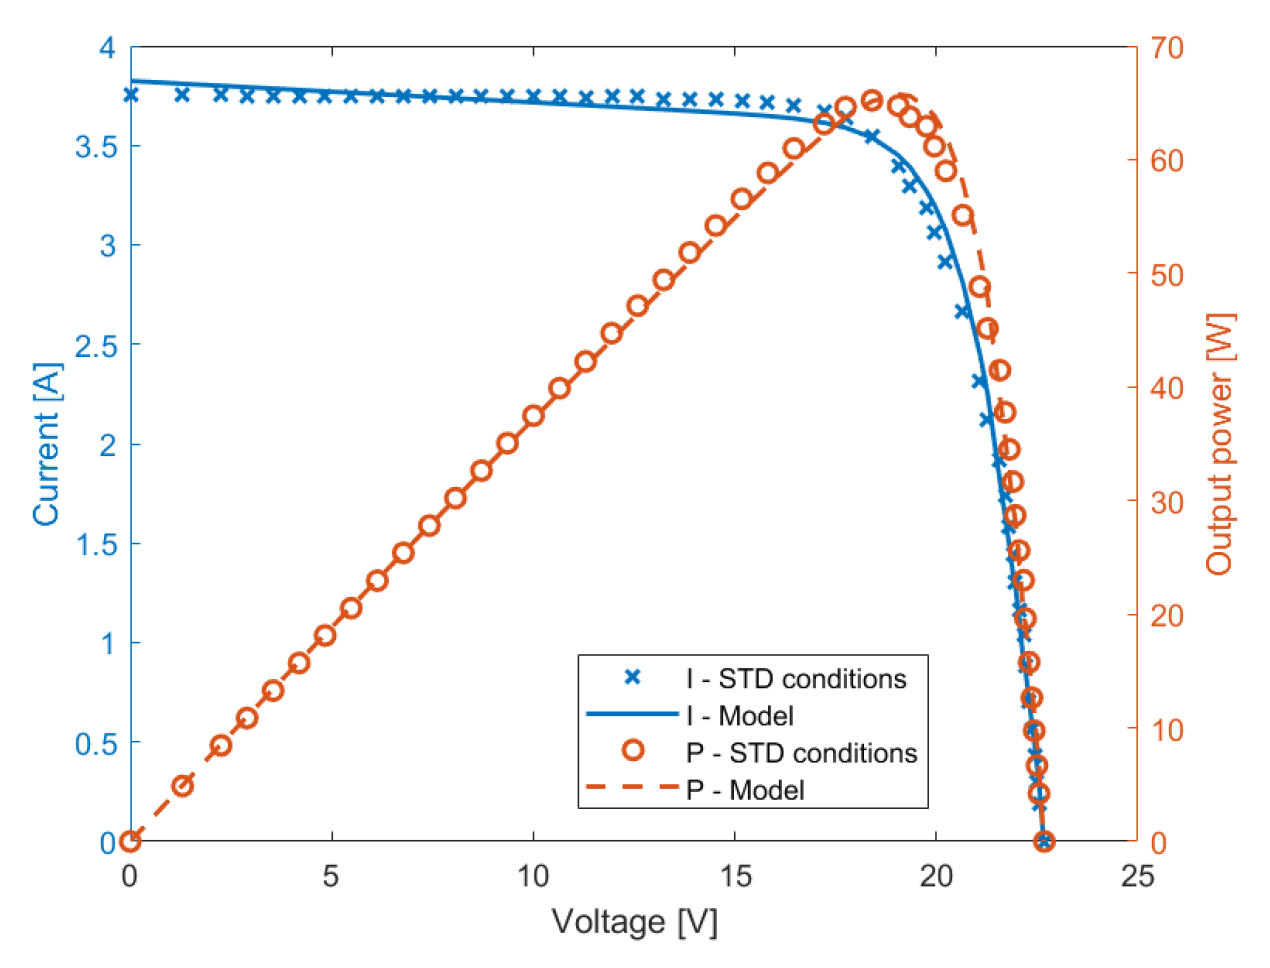
Figure 9.
Measurements results (a) Output power; (b) I-V curves.
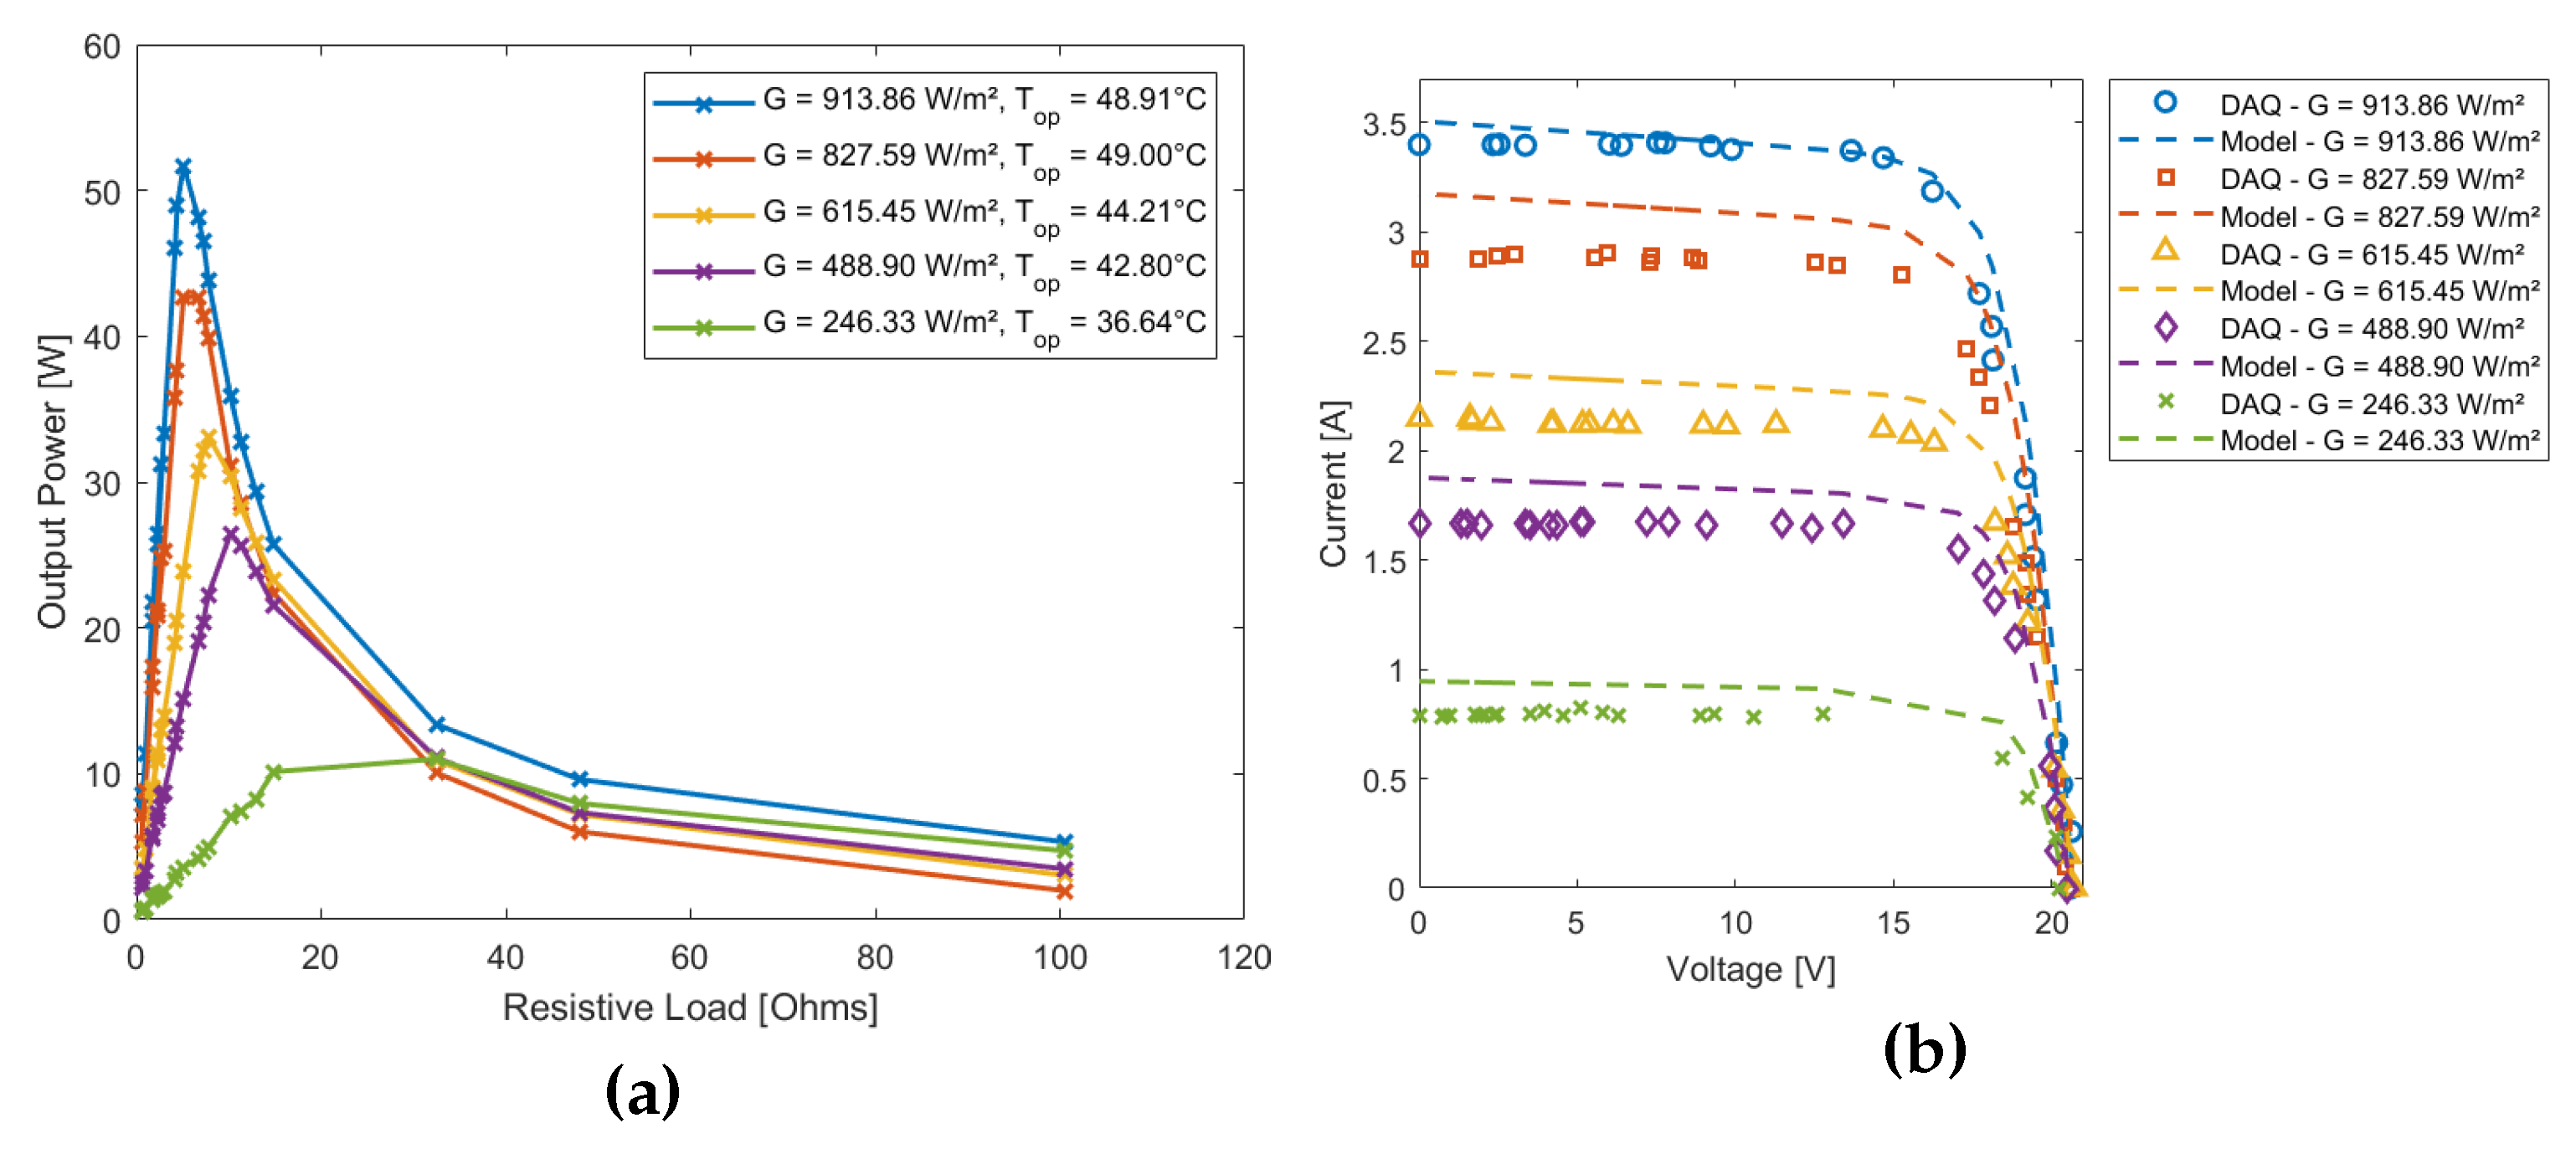
Figure 10.
Panel characteristic curve: (a) Constant solar irradiance, Top = 48.69°C; (b) Variable solar irradiance, Top = 49.66°C.
Figure 10.
Panel characteristic curve: (a) Constant solar irradiance, Top = 48.69°C; (b) Variable solar irradiance, Top = 49.66°C.
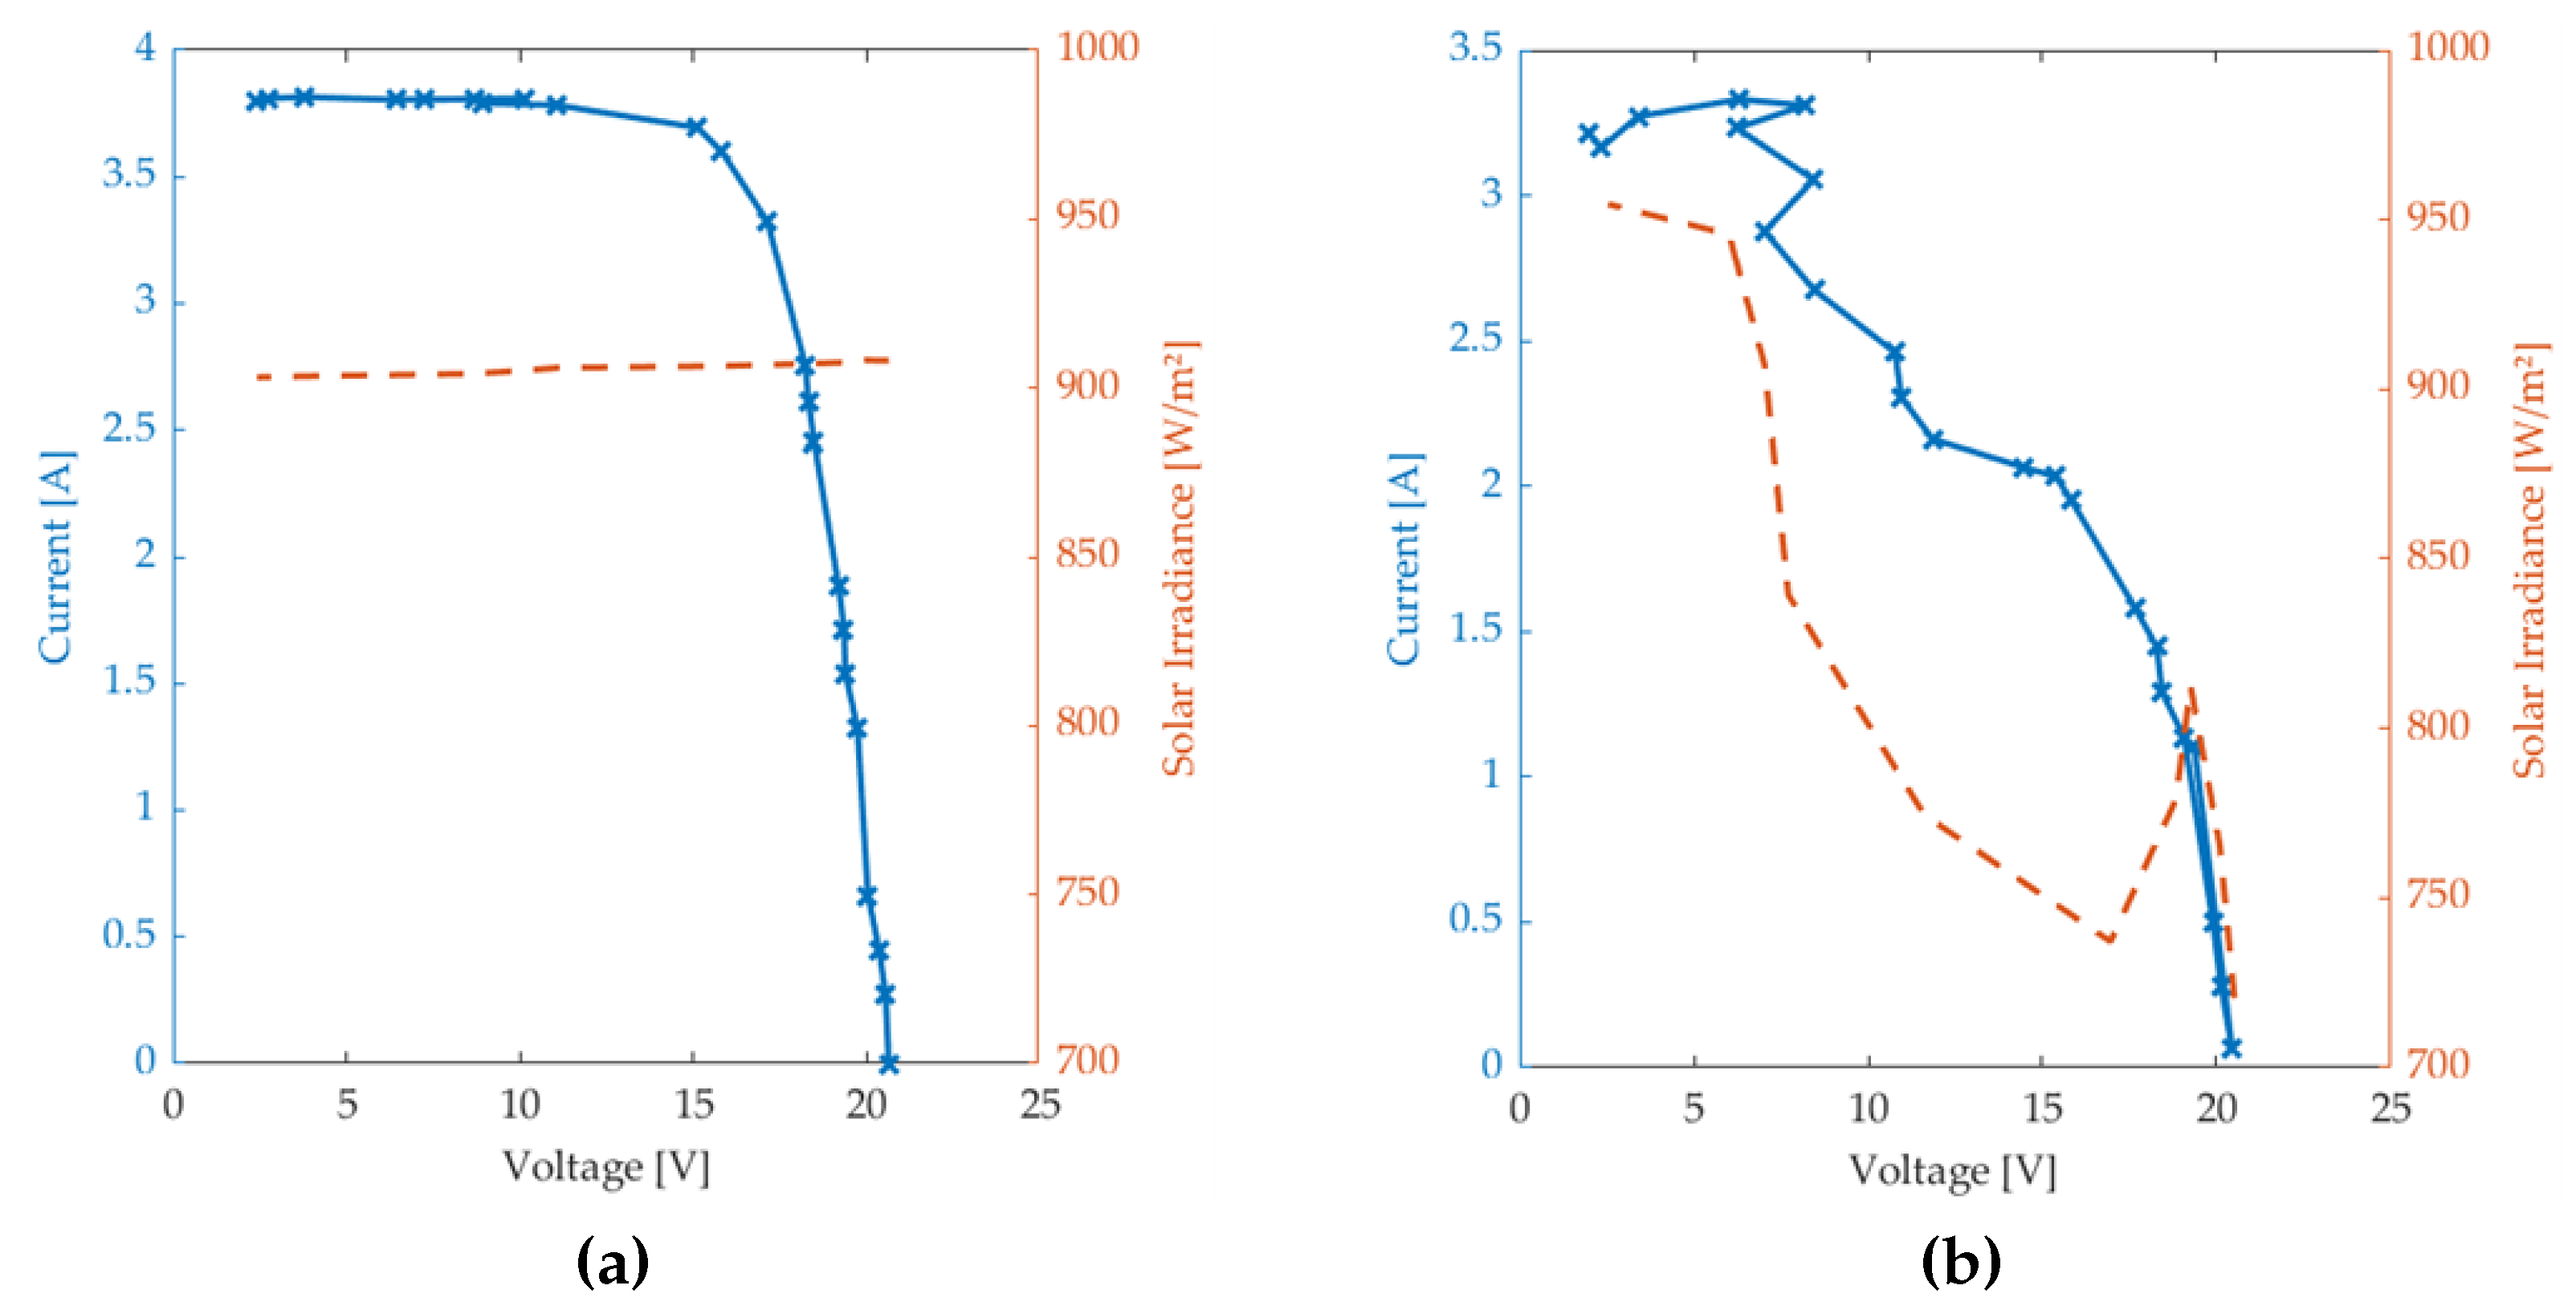
Figure 11.
Model results: (a) I-V curves; (b) Output power.
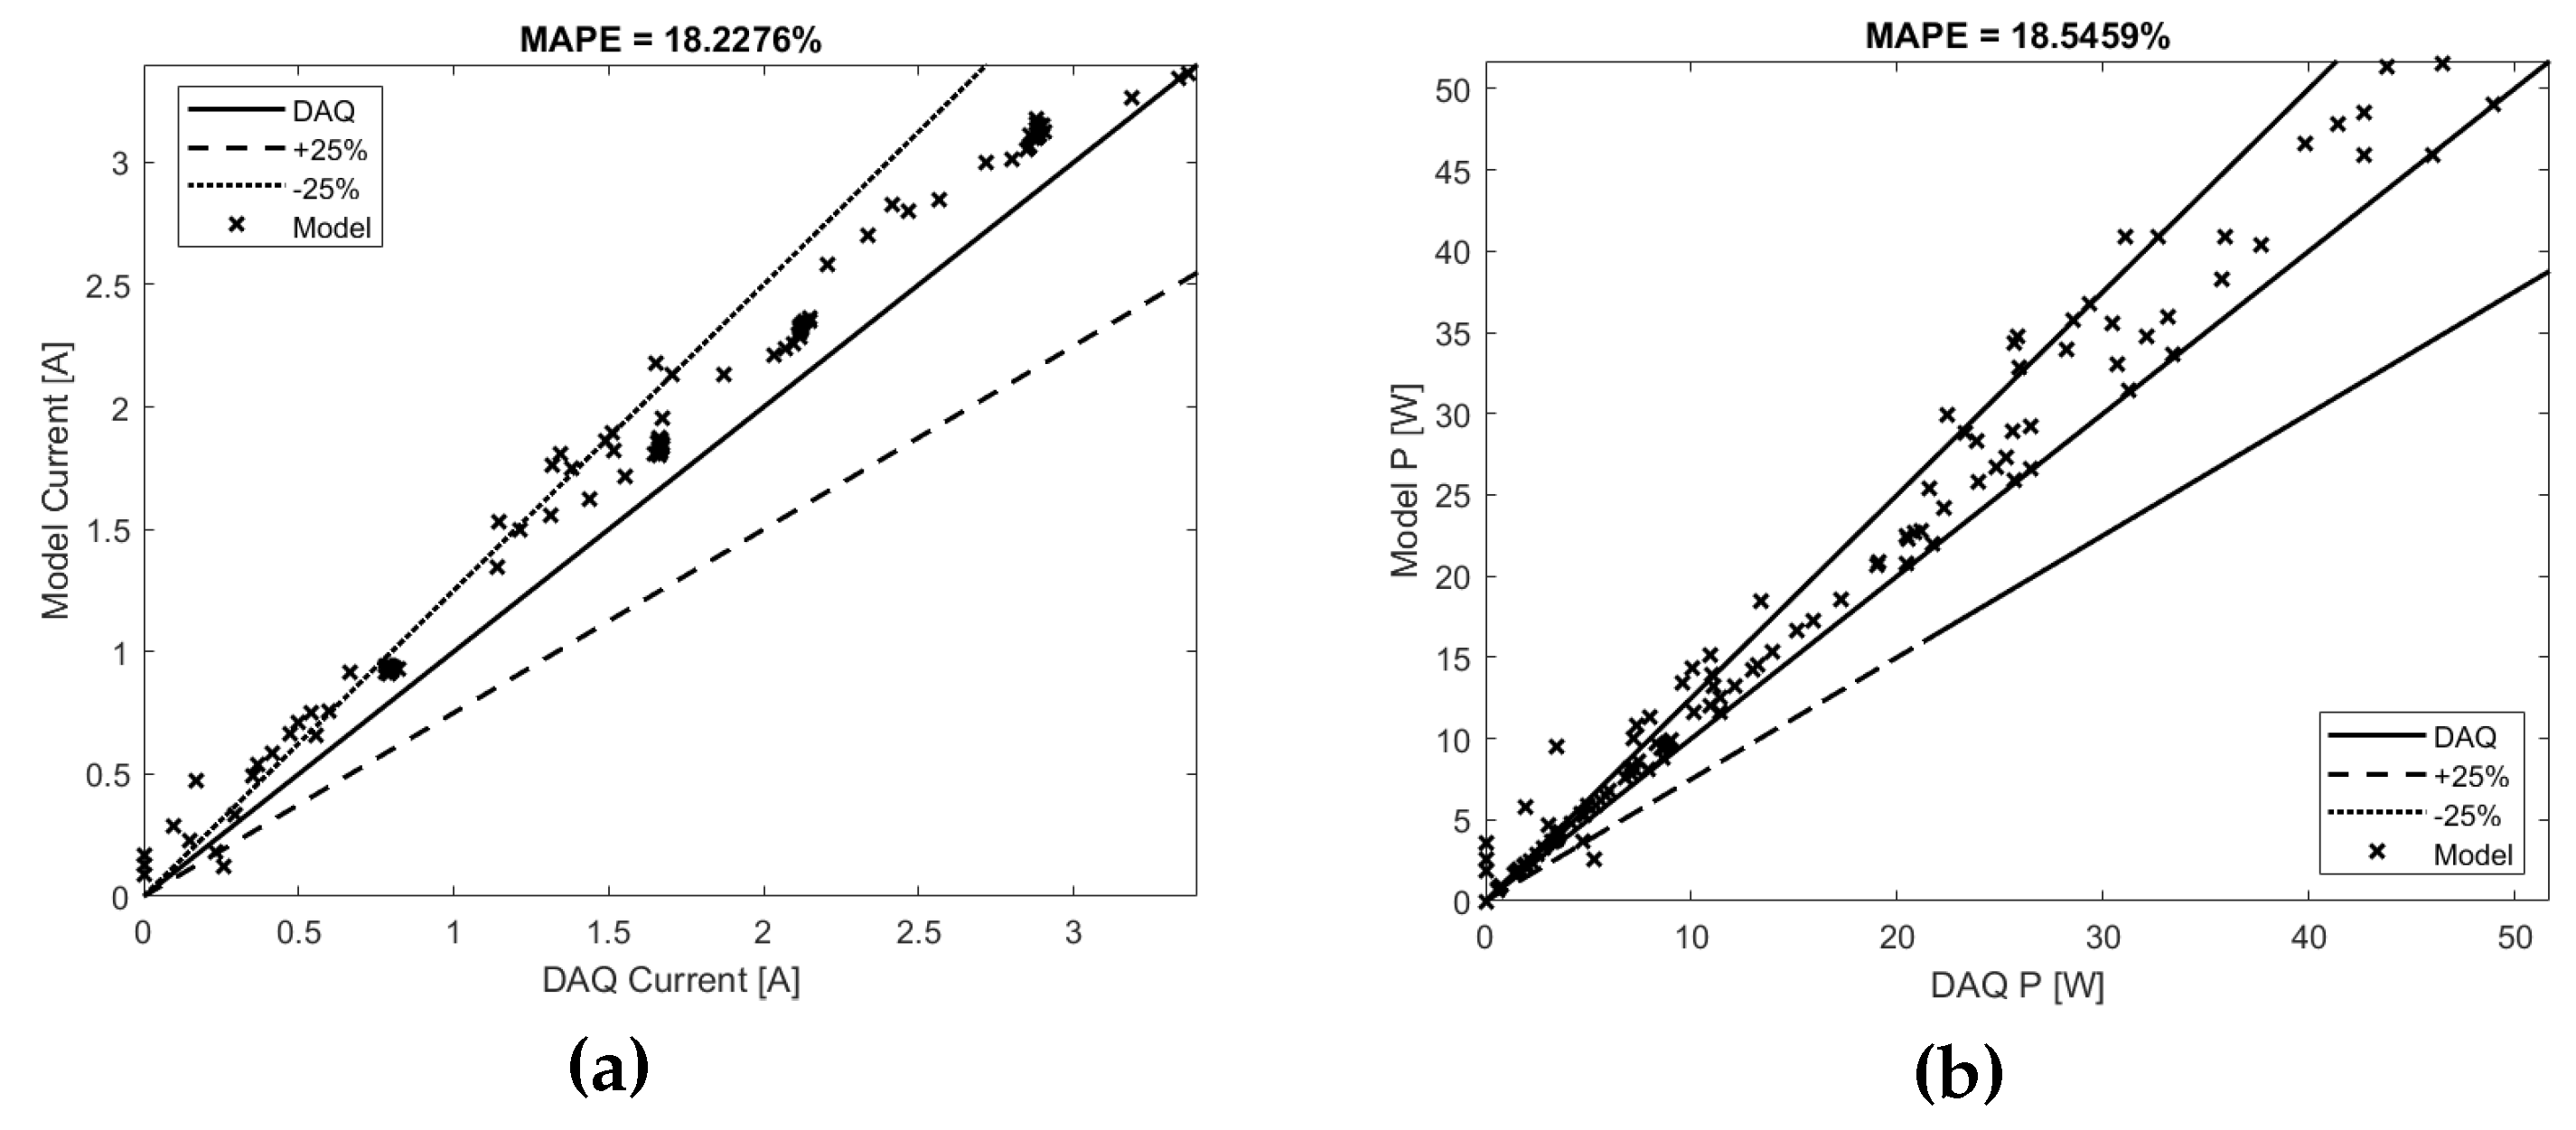
Figure 12.
Model results with new optimized parameters (a) I-V curves; (b) MAPE.
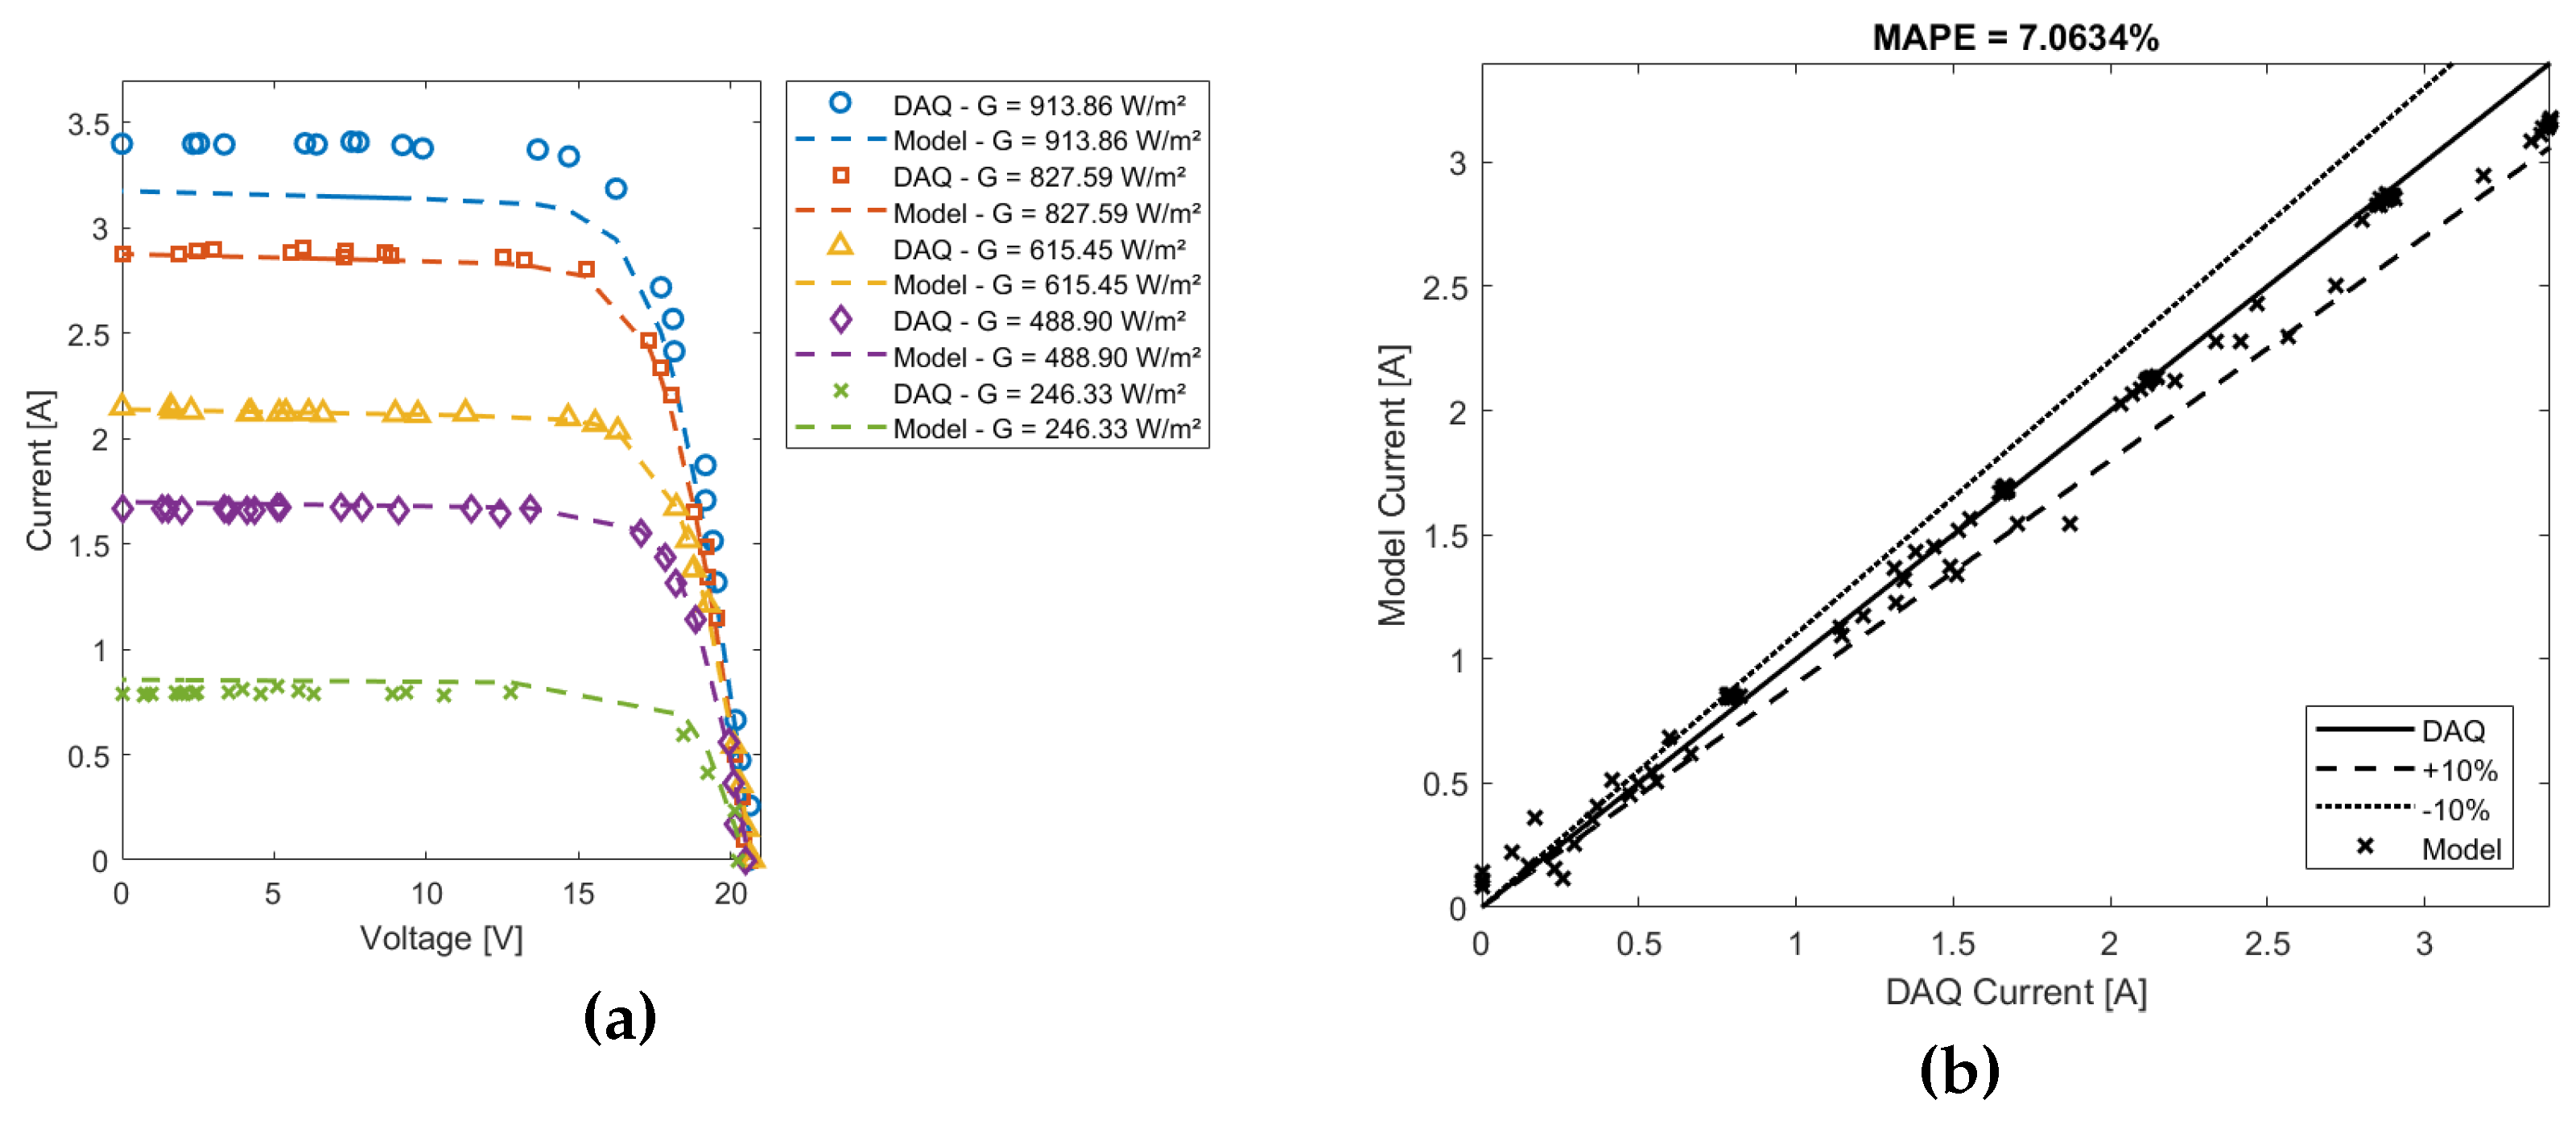

Table 1.
Custom I-V Tracers in Literature
| Reference | I-V Measurement | Load | Light Source | Language |
| [5] | Oscilloscope | MOSFET | Unspecified | Unspecified |
| [19] | Current and voltage sensors | MOSFET | Solar irradiance | Visual BASIC 6.0 |
| [20] | ADC and microcontroller | MOSFET | Solar irradiance | Unspecified |
| [3] | NI USB-6009 | MPPT charge controller | Solar irradiance | LABVIEW |
| [17] | Current and voltage sensors + ArduinoTM | Charge controller | Solar irradiance | ArduinoTM |
| [21] | Digital multimeters | Capacitive load | Solar irradiance | ArduinoTM |
| [22] | ArduinoTM | MOSFET | Solar irradiance | ArduinoTM |
| [15] | Current and voltage sensors + ArduinoTM | DC load | Solar irradiance | ArduinoTM |
| [23] | Current and voltage sensors + ArduinoTM | MOSFET | Solar irradiance | ArduinoTM |
| [4] | NI-6009 | Resistive load | Tungsten light source | Python |
| [24] | Current and voltage sensors + DSP | Capacitive load | Solar irradiance | Unspecified |
| [25] | PIC18F46K80 microprocessor | MOSFET | Solar irradiance | Unspecified |
| [26] | PIC microcontroller | Capacitive load | Solar irradiance | Unspecified |
| [27] | Electronic load | Electronic load | Xenon lamps | LABVIEW |
| [28] | Current and voltage sensors | Capacitive load | Solar irradiance | Matlab |
| [29] | Current and voltage sensors + Raspberry Pi | MOSFET | Solar irradiance | Python |
| [30] | Yoctowatt + RPi | Capacitive load | Solar irradiance | Unspecified |
| [31] | Microcontroller | Capacitive load | Solar irradiance | LABVIEW |
| [6] | Current and voltage sensors + RPi | Programmable electronic load | Solar irradiance | Python |
| [16] | Current and voltage sensors + ArduinoTM | Resistive load | Solar irradiance | ArduinoTM |
| [32] | Current sensor + microcontroller | MOSFET | Solar irradiance | Unspecified |
| [33] | Current and voltage sensors + microcontroller | MOSFET + IGBT | Solar irradiance | Matlab |
| [34] | Current and voltage sensors + microcontroller | Active load | Solar irradiance | Unspecified |
| [35] | Current and voltage sensors + microcontroller | Capacitive load | Solar irradiance | Visual Studio |
| Current Study | Current sensor + voltage divider + ArduinoTM | Automatic Relay-switched resistor bank | Solar irradiance | ArduinoTM |
Table 2.
Specifications of the Resun™ RSM060P photovoltaic panel.
| Parameter | Value | Unit |
|---|---|---|
| Output power | W | |
| Efficiency | 12.92 | % |
| Maximum Power Voltage | 18.54 | V |
| Maximum Power Current | 3.36 | A |
| Open Circuit Voltage | 22.68 | V |
| Short Circuit Current () | 3.75 | A |
| Nominal Operating Cell Temperature | °C | |
| Temperature Coefficient for Maximum Power | -0.39 | %/°C |
| Operational Temperature | -40 to 85 | °C |
| Number of cells | 36 | - |
| Temperature Coefficient for | 0.05 | %/°C |
Table 3.
Experimental uncertainties.
| Parameter | Instrument | Uncertainty |
|---|---|---|
| Current | Digital multimeter | A |
| Current | Data acquisition system | A |
| Solar Irradiance | Pyranometer | W/m2 |
| Voltage | Digital multimeter | V |
| Voltage | Data acquisition system | V |
| Temperature | Type K thermocouple | C |
Table 4.
Results from the data acquisition system.
| Time | Index | Resistive Load [] | Voltage [V] | Current [A] | Power [W] |
|---|---|---|---|---|---|
| 14:02:06 | 0 | ∞ | 20.6 | 0.0 | 0.0 |
| 14:02:08 | 1 | 100.4 | 20.5 | 0.3 | 5.6 |
| 14:02:10 | 2 | 48.0 | 20.4 | 0.4 | 9.1 |
| 14:02:12 | 3 | 32.5 | 20.0 | 0.7 | 13.3 |
| 14:02:14 | 4 | 14.8 | 19.7 | 1.3 | 26.1 |
| 14:02:16 | 5 | 12.9 | 19.4 | 1.5 | 29.8 |
| 14:02:18 | 6 | 11.3 | 19.3 | 1.7 | 33.2 |
| 14:02:20 | 7 | 10.2 | 19.2 | 1.9 | 36.2 |
| 14:02:22 | 8 | 7.8 | 18.5 | 2.4 | 45.4 |
| 14:02:24 | 9 | 7.2 | 18.3 | 2.6 | 47.9 |
| 14:02:26 | 10 | 6.7 | 18.2 | 2.8 | 50.2 |
| 14:02:28 | 12 | 5.1 | 17.1 | 3.3 | 56.9 |
| 14:02:30 | 15 | 4.4 | 15.8 | 3.6 | 56.9 |
| 14:02:32 | 19 | 4.2 | 15.1 | 3.7 | 55.9 |
| 14:02:34 | 24 | 3.0 | 11.1 | 3.8 | 41.9 |
| 14:02:36 | 31 | 2.3 | 8.9 | 3.8 | 33.8 |
| 14:02:38 | 41 | 2.6 | 10.2 | 3.8 | 38.7 |
| 14:02:41 | 55 | 1.8 | 7.2 | 3.8 | 27.6 |
| 14:02:43 | 74 | 2.3 | 8.7 | 3.8 | 33.1 |
| 14:02:45 | 100 | 1.7 | 6.4 | 3.8 | 24.5 |
| 14:02:47 | 136 | 1.0 | 3.8 | 3.8 | 14.5 |
| 14:02:49 | 185 | 0.7 | 2.8 | 3.8 | 10.6 |
| 14:02:51 | 252 | 0.6 | 2.4 | 3.8 | 9.2 |
Table 5.
Temperature and solar irradiance measurements.
| G [W/m2] | [W/m2] | T1 [°C] | T2 [°C] | T3 [°C] | T4 [°C] | T5 [°C] | [°C] |
|---|---|---|---|---|---|---|---|
| 914.26 | 1.11 | 48.73 | 46.16 | 46.05 | 52.02 | 53.08 | 2.84 |
| 914.08 | 49.41 | 47.48 | 46.52 | 52.40 | 53.40 | 2.76 | |
| 914.27 | 49.49 | 47.64 | 46.81 | 52.52 | 53.35 | 2.73 | |
| 914.68 | 48.27 | 46.23 | 46.23 | 52.18 | 53.01 | 2.55 | |
| 915.55 | 47.14 | 45.87 | 45.66 | 51.75 | 52.64 | 2.47 | |
| 914.88 | 46.96 | 45.68 | 45.50 | 51.65 | 52.57 | 2.44 | |
| 914.26 | 47.57 | 46.13 | 45.58 | 51.53 | 52.70 | 2.43 | |
| 913.44 | 47.56 | 46.41 | 45.64 | 50.82 | 52.43 | 2.41 | |
| 912.82 | 47.40 | 46.08 | 45.41 | 50.47 | 52.30 | 2.46 | |
| 912.20 | 47.60 | 46.28 | 45.83 | 50.45 | 52.39 | 2.40 | |
| 912.07 | 47.47 | 46.49 | 45.98 | 50.91 | 52.40 | 2.42 |
Table 6.
Maximum output power and efficiency.
| G [W/m2] | Top [°C] | Pmax,DAQ [W] | Pmax,model [W] | ||
|---|---|---|---|---|---|
| 913.86 | 48.91 | 51.70 | 53.05 | 13.19 | 13.54 |
| 827.59 | 49.00 | 42.72 | 48.53 | 12.04 | 13.67 |
| 615.45 | 44.21 | 33.13 | 35.98 | 12.55 | 13.63 |
| 488.90 | 42.80 | 26.45 | 29.18 | 12.62 | 13.92 |
| 246.33 | 36.64 | 11.01 | 13.98 | 10.42 | 13.23 |
Disclaimer/Publisher’s Note: The statements, opinions and data contained in all publications are solely those of the individual author(s) and contributor(s) and not of MDPI and/or the editor(s). MDPI and/or the editor(s) disclaim responsibility for any injury to people or property resulting from any ideas, methods, instructions or products referred to in the content. |
© 2025 by the authors. Licensee MDPI, Basel, Switzerland. This article is an open access article distributed under the terms and conditions of the Creative Commons Attribution (CC BY) license (http://creativecommons.org/licenses/by/4.0/).
Copyright: This open access article is published under a Creative Commons CC BY 4.0 license, which permit the free download, distribution, and reuse, provided that the author and preprint are cited in any reuse.


