
Submitted:
15 January 2026
Posted:
16 January 2026
You are already at the latest version
Abstract
Background: Artificial intelligence (AI) shows promising results in lymphoma detection, prediction, and classification. However, translating these findings into practice requires a rigorous assessment of potential biases, clinical utility, and further validation of research models. Objective: The goal of this study was to summarize existing studies on artifi- cial intelligence models for the histopathological detection of lymphoma. Design: This study adhered to the PRISMA Extension for Scoping Reviews (PRISMA-ScR) guidelines. A systematic search was conducted across three major databases (Scopus, PubMed, Web of Science) for English-language articles and reviews published between 2016 and 2025. Seven precise search queries were applied to identify relevant publications, accounting for variations in study modality, algorithmic architectures, and disease-specific terminology. Results: The search identified 615 records, of which 36 articles met the inclusion criteria. These studies presented 36 AI models, comprising 30 diagnostic and 6 prognostic applica- tions, with Convolutional Neural Networks (CNNs) being the predominant architecture. Regarding data sources, 83% (30/36) of datasets utilized Hematoxylin and Eosin (H&E) stained images, while the remainder relied on diverse modalities, including IHC stained slides, bone marrow smears, and other tissue preparations. Studies predominantly utilized retrospective, private cohorts with sample sizes typically ranging from 50 to 400 patients; only a minority leveraged open-access repositories (e.g., Kaggle, TCGA). The primary appli- cation was slide-level multi-class classification, distinguishing between specific lymphoma subtypes and non-neoplastic controls. Beyond diagnosis, a subset of studies explored advanced prognostic tasks, such as predicting chemotherapy response and disease progres- sion (e.g., in CLL), as well as automated biomarker quantification (c-MYC, BCL2, PD-L1). Reported diagnostic performance was generally high, with accuracy ranging from 60% to 100% (clustering around 90%) and AUC values spanning 0.70 to 0.99 (predominantly >0.90). Conclusions: While AI models demonstrate high diagnostic accuracy, their translation into practice is limited by unstandardized protocols, morphological complexity, and the "black box" nature of algorithms. Critical issues regarding data provenance, image noise, and lack of representativeness raise risks of systematic bias, hence the need for rigorous validation in diverse clinical environments.
Keywords:
hematopathology
; artificial intelligence
; lymphoma
; histopathology
; diagnostics
1. Introduction to Lymphomas and Their Diagnostic Process
Our previous review, published recently in Electronics [1] was devoted to analysing methods of artificial intelligence used in the histopathological diagnostics of leukemias. This time we decided to devote a similar work to lymphomas - a very heterogenous group of haematological neoplasms. While leukemias are neoplasms originating from intermediate stages of lines of haematopoiesis (myeloid, lymphoid), lymphomas originate from mature forms or from developmental forms of lymphoid line - lymphocytes T & lymphocytes B. These cells are called lymphatic cells and within the body they reside mainly in lymphnodes, spleen, thymus and bone marrow. An example of such a lymphoma can be primary cerebral lymphoma, frequently occuring in immunocompromised patients suffering from AIDS [2]. The symptomatology of lymphomas can differ depending on the location of disease, but often involves swelling of lymphnodes (unspecific, can occur also in e.g. infections). The so-called B-symptomes (fever, night sweats, and weight loss) are often present, yet they are highly unspecific and can also occur in numerous other neoplastic diseases. Because of the unspecific clinical presentation the diagnosis of lymphoma is often delayed and can take a long time before it is established.
There are in total over 50 entities that can be classified as lymphomas [3]. Historically, they have been classified into Hodgkin lymphoma and a very heterogenous group of non-Hodgkin lymphomas (NHL). While this classification is still used, it lost much on relevance when WHO introduced new classification that bases on the original subgroup of cells from which a lymphoma stems. Thus, we can speak of T-cell lymphomas and B-cell lymphomas. We can also divide lymphomas according to their clinical course - some of lymphomas are progressing very slowly and for a long time they don’t yield any clinical symptoms; these lymphomas are called indolent. Other lymphomas can progress very aggresively and quickly lead to the patients’ death. The diversity of lymphomas makes their classification quite difficult. The line of division between leukemias and lymphomas is not always clear, sometimes being a matter of convention only; some nosological units are classified into both subgroups of haematological malignancies, one of them being the SLL/CLL. These two terms are essentially the same neoplastic disease deriving from small B-cell lymphocytes, and the only difference is the localisation - when the disease is occuring mainly in bone marrow it is counted as leukemia and when it occurs in lymphnodes it is classified as lymphoma; in order to add to confusion one has to note that this type of lymphoma can also transform into another, more malignant type (a phenomenon called Richter transformation) [4]. Lymphomas can originate in almost every organ of the body, since lymphatic tissue is almost omnipresent. The staging also differs from other tumours - lymphomas are not routinely staged using the TNM Classification, but rather the AnnArbor scale, which takes into account the location of diseased lymphnodes, and the presence of absence of systemic symptoms. xplicit enumeration of lymphomas is outside the scope of this work, interested readers can find relevant information in appropriate publications [5]. The aforementioned facts serve to illustrate the heterogeneity and the convolution of lymphomas which have direct consequences on the effectivity and complexity of their diagnosis.
The diagnosis of lymphomas relies on histopathology in as much as the one of leukemias, yet there are significant differences in the diagnostic process. In order to diagnose lymphoma it is not enough to find malignant cells under the microscope, one also needs to examine the architecture of affected tissue. Thus, cytopathology is not very helpful and does not suffice to make a diagnosis of lymphoma. The standard method is an excision biopsy of affected lymph node. Lymphnode is then analysed using histological methods. In order to differentiate between lymphoma type ancillary techniques are used, including immunohistochemistry staining (different cells will stain differently, thus giving clues as to lymphoma origins). Flow cytometry, and genetic analyses are also used to secure the diagnosis. The majority of those ancillary methods fall outside the scope of our review - in our work we take into account only those models that work on histopathology slides (stained with routine stains, or with immunohistochemical ones). There are many possibilities for AI to help with the analysis of such histological slides, and this scoping review is intended to enumerate some of best performing models.
The methods used for digital image analysis basing on deep learning are almost as ubiquitous as the lymphomas. There are many models published in scientific literature, but not all of them have already been registered and used in a daily routine of clinical praxis. As for today, there are only 6 entries on the FDA list of approved AI-based solutions in the domain of pathology, none of these entries dealing with the problematics of lymphoma pathology. The description of the methods has already been done in our previous review.
2. Bibliometric Analysis
This scoping review was conducted and reported in accordance with the PRISMA Extension for Scoping Reviews (PRISMA-ScR) guidelines. No review protocol was registered for this scoping review, as protocol registration is not mandatory for scoping reviews, unlike systematic reviews which require PROSPERO registration.
2.1. Methodology:
The bibliometric analysis conducted within the framework of this review comprised a systematic search of three major scientific publication databases (Scopus, PubMed, Web of Science) to identify publications addressing the application of artificial intelligence in histopathological diagnosis of lymphomas. The search encompassed the period 2016–2025 and was restricted to English-language publications of the Article and Review types. The application of seven precisely formulated search queries enabled the identification of methodologically relevant publications, accounting for variations in study modality, algorithmic architectures, and disease-specific pathological terminology. Detailed inclusion and exclusion criteria, search strategy, and selection procedures are described in the subsequent subsections.
2.2. Queries:
Seven diversified search queries were formulated in Advanced Search mode, differentiated by modality (WSI vs. cytology), task type (diagnostics/classification vs. segmentation), keywords related to lymphomas (e.g., lymphoma, DLBCL, Hodgkin, MCL, FL), network architectures/models (CNN/ViT/transformers), as well as strictly pathological terminology (H&E, IHC, digital pathology). Each query was syntactically adapted to the specific requirements of the respective publication database.

Table 1.
Queries.
| id | Database | Query | Search Date | Number of records |
|---|---|---|---|---|
| Q1 | Scopus, PubMed, Web of Science | (("artificial intelligence" OR "machine learning" OR "deep learning" OR AI) AND ("histopatholog*" OR "digital pathology" OR "whole slide imag*" OR WSI OR "microscopic image*" OR cytolog* OR "lymph node biopsy") AND (lymphoma OR "Hodgkin lymphoma" OR "non-Hodgkin lymphoma" OR DLBCL OR "diffuse large B-cell lymphoma" OR "follicular lymphoma" OR "mantle cell lymphoma" OR "marginal zone lymphoma" OR "Burkitt lymphoma" OR "peripheral T-cell lymphoma" OR "anaplastic large cell lymphoma") AND (diagnos* OR classif* OR "diagnostic support" OR "computer-aided diagnos*")) AND NOT TITLE-ABS-KEY(radiology OR radiomic* OR CT OR "computed tomography" OR MRI OR PET OR ultrasound OR "flow cytometr*" OR genomic* OR sequencing OR "gene expression" OR leukemia OR myeloma) | Scopus: 13 July 2025; PubMed: 9 October 2025; Web of Science: 26 October 2025 | Scopus: 175; PubMed: 59; Web of Science: 82 |
| Q2 | Scopus, PubMed, Web of Science | TITLE-ABS-KEY(("deep learning" OR "machine learning" OR "artificial intelligence") AND (subtyp* OR "cell-of-origin" OR COO OR "double-hit" OR "triple-hit" OR "EBV-positive" OR "grade 3B") AND (DLBCL OR "diffuse large B-cell lymphoma" OR "follicular lymphoma" OR "mantle cell lymphoma" OR "Hodgkin lymphoma" OR "classical Hodgkin lymphoma" OR "nodular lymphocyte-predominant Hodgkin lymphoma" OR "T-cell lymphoma" OR "anaplastic large cell lymphoma") AND ("histopatholog*" OR "digital pathology" OR "whole slide imag*" OR WSI OR "H&E" OR "haematoxylin and eosin" OR "immunohistochemistry" OR IHC) AND (classif* OR differentiat* OR "risk stratification")) AND NOT TITLE-ABS-KEY(radiology OR CT OR MRI OR PET OR "flow cytometr*" OR genomic* OR sequencing OR leukemia OR myeloma) | Scopus: 13 July 2025; PubMed: 9 October 2025; Web of Science: 26 October 2025 | Scopus:24; PubMed: 11; Web of Science: 18 |
| O3 | Scopus, PubMed, Web of Science | TITLE-ABS-KEY(("convolutional neural network" OR CNN OR "vision transformer" OR ViT OR "multiple instance learning" OR MIL OR "graph neural network" OR GNN) AND ("whole slide imag*" OR WSI OR histopatholog* OR "digital pathology") AND (segmentation OR "cell detection" OR "nuclei segmentation" OR "instance-level" OR "weakly supervised" OR attention OR patch OR tile) AND (lymphoma OR DLBCL OR "follicular lymphoma" OR "Hodgkin" OR "mantle cell lymphoma" OR "T-cell lymphoma")) AND NOT TITLE-ABS-KEY(radiology OR CT OR MRI OR PET OR "flow cytometr*" OR genomic* OR leukemia OR myeloma) | Scopus: 13 July 2025; PubMed: 9 October 2025; Web of Science: 26 October 2025 | Scopus:44; PubMed: 8; Web of Science: 17 |
| Q4 | Scopus, PubMed, Web of Science | TITLE-ABS-KEY(("artificial intelligence" OR "machine learning" OR "deep learning") AND lymphoma AND ("digital pathology" OR histopatholog* OR "whole slide imag*") AND ("systematic review" OR "scoping review" OR "meta-analysis" OR bibliometric OR "state of the art")) AND NOT TITLE-ABS-KEY(radiology OR CT OR MRI OR PET OR "flow cytometr*" OR genomic* OR leukemia OR myeloma) | Scopus: 13 July 2025; PubMed: 9 October 2025; Web of Science: 26 October 2025 | Scopus:17; PubMed: 5; Web of Science: 9 |
| Q5 | Scopus, PubMed, Web of Science | TITLE-ABS-KEY(("machine learning" OR "deep learning" OR "artificial intelligence") AND (IHC OR "immunohistochemistry" OR "H&E" OR "haematoxylin and eosin" OR "multiplex immunofluorescence" OR "tissue microarray" OR TMA) AND (feature* OR morphometric OR "texture" OR "nuclei" OR "cell segmentation" OR "tumor microenvironment" OR TME OR "germinal center") AND (lymphoma OR DLBCL OR "follicular lymphoma" OR "Hodgkin lymphoma" OR "mantle cell lymphoma") AND (diagnos* OR classif*)) AND NOT TITLE-ABS-KEY(radiology OR CT OR MRI OR PET OR "flow cytometr*" OR genomic* OR sequencing OR leukemia OR myeloma) | Scopus: 13 July 2025; PubMed: 9 October 2025; Web of Science: 26 October 2025 | Scopus:50; PubMed: 17; Web of Science: 25 |
| Q6 | Scopus, PubMed, Web of Science | TITLE-ABS-KEY(("artificial intelligence" OR "machine learning" OR "deep learning") AND (lymphoma) AND ("histopathology" OR "digital pathology" OR "whole slide imag*" OR WSI OR cytolog*)) | Scopus: 13 July 2025; PubMed: 9 October 2025; Web of Science: 26 October 2025 | Scopus:241; PubMed: 77; Web of Science: 98 |
| Q7 | Scopus, PubMed, Web of Science | TITLE-ABS-KEY(("artificial intelligence" OR "machine learning" OR "deep learning") AND (DLBCL OR "diffuse large B-cell lymphoma" OR "follicular lymphoma" OR "Hodgkin lymphoma" OR "mantle cell lymphoma") AND ("histopathology" OR "whole slide imag*" OR WSI OR IHC OR "H&E")) | Scopus: 13 July 2025; PubMed: 9 October 2025; Web of Science: 26 October 2025 | Scopus:71; PubMed: 36; Web of Science: 45 |
2.3. Screening Protocol:
Records retrieved from all databases were combined into a unified dataset. Title and abstract screening was conducted independently by two reviewers using standardized forms based on pre-defined inclusion/exclusion criteria. Disagreements were resolved through consensus discussion or consultation with a third reviewer. A two-stage screening approach was employed:
- 1.
- initial automated filtering based on clearly ineligible publication types, languages, and time frame;
- 2.
- manual review of titles and abstracts against detailed eligibility criteria.
Full-text articles flagged as potentially eligible were retained for data extraction phase.
2.4. Inclusion/Exclusion Criteria
Table 2.
Inclusion/Exclusion Criteria.
| Category | Inclusion | Exclusion |
|---|---|---|
| Data type | Images (WSI, H&E, IHC, cytology) | Non-imaging data (omics, RNA-seq, flow cytometry) |
| Language | English (optionally Polish) | Other languages |
| Publication type | Articles, Reviews | Other (editorials, books, conference abstracts, preprints) |
| Population | Human samples | Animal models, in vitro samples |
| Time frame | 2016–2025 | Publications before 2016 |
| Algorithm type | Deep learning, machine learning, CNN, ViT, transformers, MIL | Purely statistical approaches without deep learning componen |
2.5. Deduplication:
The combined search returned 612 records. After title and abstract screening (314 records retained) and systematic deduplication by DOI and title matching, 182 unique publications were included in the final dataset.
2.6. Data Extraction and Charting:
Data extracted from 182 publications included: publication metadata (authors, year, journal, country, affiliation), citation counts, and keywords. Bibliometric indicators were synthesized to examine temporal trends, geographical distribution, institutional productivity, and thematic profiles. Results were visualized through charts showing publications/citations per year, country contributions, leading affiliations, and top 15 keywords.
2.7. Results
The bibliometric analysis identified 182 publications meeting the inclusion criteria, confirming a dynamic and expanding research landscape in the application of artificial intelligence to lymphoma histopathology. The following sections present the key findings across temporal, thematic, and editorial dimensions.
Temporal Trends in Publication Output Figure 1 illustrates the publication dynamics across the study period (2016-2025). The data reveal a pronounced upward trajectory, particularly from 2022 onwards, indicating accelerating research activity in recent years. The 2024-2025 period shows sustained publication volume, suggesting that AI applications in lymphoma diagnostics remain an active and evolving area of investigation. This temporal pattern reflects both the maturation of deep learning methodologies and growing clinical interest in computational pathology solutions.
The 182 included publications were distributed across diverse publication outlets, reflecting the interdisciplinary nature of the field. Figure 2 presents the top 10 journals by publication count. Diagnostics and Frontiers in Oncology emerged as the leading venues with 9 publications each, followed by Cancers with 8 publications. Other prominent outlets include Computers in Biology and Medicine, IEEE Journal of Biomedical and Health Informatics, and Journal of Pathology Informatics, each contributing 4 publications. This distribution underscores the multidisciplinary appeal of the topic, spanning clinical pathology, biomedical informatics, oncology, and computer science domains.
Thematic Profile and Methodological Focus Figure 3 displays the 10 most frequently occurring keywords across the included publications. Deep Learning” emerged as the dominant keyword (56 occurrences), followed by Lymphoma” (36 occurrences) and Machine Learning” and Artificial Intelligence” (both 35 occurrences). Other prominent keywords include Digital Pathology” (17 occurrences), Convolutional Neural Network” (11 occurrences), and Diffuse Large B-Cell Lymphoma” (10 occurrences). The prevalence of these terms confirms the central role of neural network-based approaches and highlights the focus on specific lymphoma subtypes. Keywords such as Histopathology”, Immunohistochemistry”, and Classification” further reinforce the morphological and diagnostic orientation of the research corpus.
2.8. Limitations
This bibliometric analysis, although conducted in accordance with PRISMA-ScR guidelines, is subject to several important methodological limitations that should be considered when interpreting the results.
First, the scope of databases was restricted to three major indexing sources (Scopus, PubMed, Web of Science), which may have resulted in the omission of significant publications indexed exclusively in other databases (e.g., IEEE Xplore, Google Scholar) or available in preprint repositories (arXiv, bioRxiv). Differences in journal coverage across databases and variations in indexing policies may introduce systematic selection bias, particularly with respect to publications from non-English-speaking countries or open-access journals with limited reach.
Second, language restrictions (English-language publications only) may have led to underrepresentation of research activity in regions where local-language publishing is preferred, such as China, Japan, and Germany. Given the significant contribution of Asian research institutions to the advancement of AI in pathology, this limitation may affect the geographical representativeness of the results.
Third, the search strategy, despite employing seven precisely formulated queries adapted to the specifics of each database, was characterized by high specificity at the potential cost of reduced sensitivity. Publications employing non-standard terminology, alternative acronyms (e.g., "virtual slides" instead of "WSI"), or emerging methodologies (e.g., foundation models, self-supervised learning) may have been overlooked. The intentional exclusion of publications addressing radiology, flow cytometry, and omics analyses, although justified by the scope of the review, narrows the perspective to morphological image-based diagnostics exclusively.
Fourth, the deduplication and screening process, based on automated title matching and manual abstract review, introduces an element of subjectivity, although screening was conducted independently by two reviewers. The absence of full-text assessment for all potentially qualifying publications may have resulted in both false-positive and false-negative inclusions. Additionally, publications with unclear or very brief abstracts may have been misclassified.
Fifth, bibliometric metrics (citation counts, institutional productivity, journal distribution) reflect only research visibility and activity, not methodological quality, result reliability, or potential clinical impact. Citation counts recorded at the time of data extraction are dynamic and subject to significant changes over time. No assessment of risk of bias for individual studies was conducted, which is typical for bibliometric reviews but represents a limitation in the context of evaluating evidence quality.
Finally, the time frame (2016–2025) may not fully capture the most recent methodological trends, particularly if 2025 publications were incompletely indexed at the time of data extraction. Moreover, the rapid development of AI technologies, including the emergence of foundation models and multimodal architectures in recent years, may not be fully reflected in the publication corpus.
2.9. Conclusions
This bibliometric analysis identified 182 publications meeting the defined inclusion criteria, documenting a dynamic increase in research activity in the field of artificial intelligence applications in histopathological diagnosis of lymphomas. The results confirm a marked intensification of publications beginning in 2022, correlating with the maturation of deep learning architectures and growing clinical interest in digital pathology solutions.
Analysis of journal distribution reveals the interdisciplinary nature of the research, encompassing both clinical journals (Diagnostics, Frontiers in Oncology, Cancers) and biomedical and informatics-focused publications (IEEE Journal of Biomedical and Health Informatics, Journal of Pathology Informatics, Computers in Biology and Medicine). The presence of publications across leading journals from diverse domains confirms the acceptance of AI methods as a legitimate diagnostic tool in hematopatology.
The keyword profile unequivocally indicates the dominance of deep learning approaches, with particular emphasis on convolutional neural networks (CNNs) and classification tasks. The frequent occurrence of terms related to digital pathology (Digital Pathology, Histopathology, Immunohistochemistry) confirms the morphological orientation of the research, while the presence of specific lymphoma subtype designations (e.g., DLBCL) indicates the clinical specialization of the publications.
The bibliometric findings underscore the field’s transition from an exploratory phase (proof-of-concept) toward consolidation, as evidenced by the growing number of validation-focused publications and the increasing emphasis on diagnostic accuracy. The research landscape demonstrates robust interdisciplinary engagement and sustained institutional commitment to advancing AI-assisted lymphoma diagnostics. This comprehensive mapping of the publication landscape provides a foundation for identifying gaps in knowledge, recognizing leading research centers, and understanding the temporal and thematic evolution of AI applications in histopathology. These bibliometric insights will be further contextualized in the discussion section through detailed analysis of methodological approaches, emerging trends, and future research priorities in the field.
3. Image Processing Methods Used for Histopathological Diagnostics of Lymphomas
Based on the bibliometric analysis, 36 publications were identified as relevant to the use of artificial intelligence (AI) in lymphoma diagnostics. These studies represent different approaches to AI-based diagnostic support and were selected for detailed review. To provide a clear overview of current research directions and methodological differences, the applied models are summarized in Table 3. For each study, six categories of information are highlighted: the material used for diagnosis, the performed diagnosis defined by the detected classes, the use of the model, the dataset used for model training, and the obtained results. In most publications, the model is used for lymphoma diagnosis through classification. The performance of such models is evaluated using accuracy ACC, expressed by formula (1), which is an intuitive metric that indicates the percentage of correct decisions made by the model.
Model accuracy, denoted as , is calculated based on the confusion matrix, which divides the model’s results into four groups:
- True Positive (TP) — the model predicted true and it actually is true,
- True Negative (TN) — the model predicted false and it actually is false,
- False Positive (FP) — the model predicted true but it is false,
- False Negative (FN) — the model predicted false but it is true.
The confusion matrix is used to compute various performance metrics. One of these metrics is the true positive rate (TPR) known as sensitivity expressed by formula (2). It measures the proportion of actual positive cases that are correctly identified by the model. This metric is particularly important in medical applications, as it is preferable to refer a healthy individual for additional testing than to miss a sick one.
Another important metric derived from the confusion matrix is the false positive rate (FPR) expressed by formula (3). In medical applications, it represents the proportion of healthy cases incorrectly classified as sick by the model.
Specificity (SPC) is another metric derived from the confusion matrix. It measures the proportion of true negative cases correctly identified by the model, reflecting its ability to avoid false positives. In medical applications, high specificity ensures that healthy individuals are not subjected to unnecessary additional tests.
Classification models predict classes as probabilities in range from 0 to 1, with standard decision threshold of 0.5. Lowering this threshold below increases sensitivity (TPR), thereby reducing the risk of missed cases, but also rise FPR, causing a higher number of false alarms. In other hand, raising the threshold above reduces FPR but decreases TPR, results in fewer false alarms, at the cost of missing some positive cases.
The relationship between TPR and FPR across all possible decision thresholds is described by the Receiver Operating Characteristic (ROC) curve, where TPR is plotted on the Y-axis, while the FPR is shown on the X-axis. Each point on the curve corresponds to a different decision threshold. An ideal classifier passes through the upper-left corner (0,1), whereas a random model follows the diagonal. The diagnostic value of the ROC curve is quantified by the area under the ROC curve (AUC) ranges from 0.5, which corresponds to a random classifier following the diagonal, to 1.0, which indicates a perfect model.
The majority of models presented in Table 3 report performance using ACC and AUC, as shown in the Results column. These models detect lymphomas by classifying them into detailed classes, which are listed in the Diagnose column. A total of 26 classes are identified. In most cases, classification is performed using three selected classes. However, there are also publications presenting classifications with a larger number of classes, up to eight. Among the reviewed publications, seventeen classes appear only once, and only four classes appear more than three times. These four most frequently detected classes are diffuse large B-cell lymphoma (DLBCL) used in 13 publications with ACC up to 97% and AUC up to 96.9% [6,7,8,9,10,11,12,13,14,15,16,17,18], follicular lymphoma (FL) used in 11 publications with ACC and AUC up to 100% [8,11,19,20,21,22,23,24,25,26,27], lymphocytic leukemia (CLL) used in 9 publications with ACC and AUC up to 100% [15,18,19,20,22,25,26,27,28], and mantle cell lymphoma (MCL) detected in 7 publications with ACC and AUC up to 100% [11,20,21,22,25,26,27].
In the analyzed publications, classical artificial intelligence models with ACC and AUC up to 100% were applied [18,20,24,28,29,30,31,32,33] in particular Decision Tree (DT) [20,31], Random Forest (RF) [18,20], Support Vector Machine (SVM) [32], and Bayesian Neural Network (BNN) [24] models were identified.
In most publications, convolutional neural network (CNN) architectures were used. In four publications custom solutions were proposed with reported ACC up to 97% and AUC up to 96.9% [6,7,8,31]. On the other hand, 20 publications present models based on well-known and validated CNN architectures for image processing [9,11,12,14,15,19,22,23,25,26,27,32,33,34,35,36,37,38,39,40]. Among them, 11 models use the ResNet architecture with reported ACC and AUC up to 100% [9,11,14,19,23,27,32,34,35,36,37]. EfficientNet was used in four models with ACC up to 95.56% and AUC up to 87% [15,35,36,38]. The MobileNet, YOLO, VGG16, and DenseNet architectures are each used twice with reported ACC and AUC up to 100% [12,19,25,26,32,39,40,12]. GoogLeNet, AlexNet, U-Net, and SqueezeNet are each used once, with ACC reported by the authors as reaching up to 99.87% [22,26,33,35].
The Attention mechanism, originally known from the Transformer architecture for natural language processing, was also used for lymphoma detection in 4 models achieved ACC and AUC up to 96% [9,12,14,34]. There are also three models using Vision Transformer (ViT), with reported effectiveness reaching ACC up to 99.87% and AUC of 85.6% [13,17,22].
Table 3.
Overview of existing AI models in lymphoma diagnostics.
| Ref. | Material | Diagnose | Use of the Model | Dataset | AI architecture / method | Results |
|---|---|---|---|---|---|---|
| [34] | skin biopsies | MF, BIDs | Slide-level classification | private dataset of 924 H&E-stained whole-slide images from skin biopsies: 233 patients with early-stage MF and 353 patients with benign inflammatory dermatoses | clustering-constrained attention multiple instance learning (CLAM), ResNet50, CTransPath, UNI | ACC: CLAM-ResNet50: 0.918, CLAM-CTransPath: 0.921, CLAM-UNI: 0.971 |
| [19] | Bone Marrow | LCT, FL, CLL | Slide-level classification | dataset of 71 patients comprising whole-slide images (WSI) of H&E-stained bone marrow biopsies: 21 patients with follicular lymphoma (FL) and 50 patients with chronic lymphocytic leukemia (CLL) | Convolutional Neural Network (CNN),ResNet-50, MobileNet | AUC: CNN(Ratio Pred)-(FL): 0.881, CNN(End-to-End)-(FL): 0.923, CNN(Ratio Pred)-(CLL): 0.780, CNN(End-to-End)-(CLL): 0.823 |
| [6] | Hematoxylin and Eosin (H&E) stained whole-slide images of lymph nodes | BLN, DLBCL, BL, SLL | Classification into 4 diagnostic categories | Whole-slide images obtained from two public sources: (1) Virtual Pathology at the University of Leeds (355,966 WSIs, 114.92 TB), and (2) Virtual Slide Box from the University of Iowa (>1,000 WSIs). From these, 128 cases (32 per class) were selected. | Convolutional Neural Network (CNN) implemented in Python using TensorFlow and Keras. | ACC:CNN-(Image by Image):0.95, CNN(set-by-set classification using majority voting, 3/5 agreement):1 |
| [35] | Hematoxylin and Eosin (H&E) stained whole-slide images of lymphoid tissue (lymph node and tonsil) | BL | Slide-level classification | 160 patients total: 90 BL and 70 control (tonsillectomy or reactive lymphoid samples). | Multiple-Instance Learning (MIL),ResNet50, EfficientNet, and GoogLeNet (Inception-v1) | AUC:ResNet50: 0.90, ResNet50+Att: 0.91, GoogLeNet: 0.93, GoogLeNet+Att: 0.94, EfficientNet: 0.95, EfficientNet+Att: 0.96ACC:ResNet50: 0.78, ResNet50+Att: 0.79, GoogLeNet: 0.81, GoogLeNet+Att: 0.83, EfficientNet: 0.83, EfficientNet+Att: 0.84 |
| [7] | Hematoxylin and Eosin (H&E) stained whole-slide images of lymph node biopsies | BL or DLBCL | Differential diagnosis (BL vs DLBCL) | A total of 10,818 images from BL (n = 34) and DLBCL (n = 36) cases were used to either train or apply different CNNs | Convolutional Neural Network (CNN) in Python3 using Tensorflow | ACC: N3-100:0.876, N4:0.94 AUC:N3-100: DLBCL 0.89 / BL 0.88 N4: DLBCL 0.92 / BL 0.92 |
| [8] | Hematoxylin and eosin (H&E) slides of a lesion area | DLBCL, FL, RLH | Slide level classification into three diagnostic categories | samples of 388 sections composed of 259 DLBCLs, 89 FLs, and 40 RLs, which were nodal and extranodal lesions. All sections were diagnosed at Kurume University from 2010 to 2017. | Deep convolutional neural network (CNN) | ACC:0,970 AUC:DLBCL:0.969 , FL: 1.00 , RLH:0.950 |
| [33] | The H&E-stained slides | +-MYC rearrangement | Slide level classification | internal set of routinely stained H&E glass slides and MYC fluorescence in situ hybridization (FISH) test results of 245 patients that were diagnosed with DLBCL in 11 hospitals in the Netherlands | deep learning neural network (U-Net),Random Forest (RF) classification. | ACC:0.93,Sensitivity:0.90 (internal) 0.95 (external) Specificity: 0.52 (internal) 0.53 (external) |
| [20] | Slides of lymph nodes stained with H&E | MCL, FL and CLL | Slide level classification into three diagnostic categories | Public dataset from studies conducted by researchers from National Cancer Institute and National Institute on Aging, in the United States. A total of 30 histological slides of lymph nodes stained with H&E | polynomial (PL),random forest (RF), decision tree (DT) and support vector machine developed using Matlab Language with the help of the WEKA platform 3.6.6 for classifying the features. Machine learning algorithms ( J48 module,SMO module) | ACC:up to 1.00 AUC: 0.906 (CLL–MCL),0.891 (CLL–FL),0.859 (FL–MCL) |
| [9] | Hematoxylin-and-eosin (H&E)-stained tissue slide | DLBCL, AITL, CHL | Slide level classification into three diagnostic categories | From over 80 different institutions database of malignant lymphomas comprises N = 262 clinical cases, which include three subtypes: 67,97, and 98 cases of AITL, DLBCL, and CHL, respectively. | MIL-based CNN with an attention mechanism, utilizing ResNet-50 as a feature extractor | ACC:0.698 (typical), 0.640 (atypical)Macro-F1:0.680 (typical), 0.618 (atypical) |
| [21] | Digital histopathological images derived from Hematoxylin and Eosin (H&E) stained tissue biopsies | CLL, FL, MCL | Slide level classification into three diagnostic categories | 1082 data points where 80% of the data (708) are utilized for training and 20% (374) are used for testing. | Deep learning algorithm with the Bi-LSTM, DBN and RBFN | ACC:0.948Hit Rate:0.900NPV:0.956 |
| [36] | The H&E-stained slides | MALT or Not MALT | Slide level classification | Total of 350 slides, including 106 slides of gastric MALT lymphoma and 244 slides of tumor-free lymphoid tissue. | Multi-model fusion, ResNet50, EfficientNet B0, EfficientNet V2 | ACC: ResNet50: 0.9147 EfficientNet B0: 0.7248 EfficientNet V2: 0.8760 fusion: 0.9496 |
| [22] | Whole slide images from bipsies treated with H&E and examined on Liquid Based Cytology (LBC) slides | CLL, FL, MCL | Slide level classification into three diagnostic categories | Dataset from the Kaggle multicancer dataset, comprising 15,000 WSIs, uniformly distributed across three lymphoma categories: FL, CLL and MCL. Each category contributed 5,000 images. | Model HCTN-LC with SqueezeNet and ViT as the architectural backbones | ACC:0.9987,Sensitivity:0.9987,Specifity:0.9993 |
| [10] | H&E-stained formalin-fixed paraffin-embedded tissue sections | DLBCL or not DLBCL | Slide level classification | Pathologic images from three hospitals featuring 1005 images from Hospital A, 3123 from Hospital B, and 402 from Hospital C | GOTDP-MP-CNNs (Globally Optimized Transfer Deep-Learning Platform with Multiple Pretrained CNNs) | ACC:Hospital A:1.0000,Hospital B:0.9971,Hospital C:1.0000 |
| [38] | H&E-stained images | NL, MALT lymphoma, GCB-DLBCL, non-GCB-DLBCL | Patch level classification | Data from 160 patients, comprising 25 normal lymph nodes (NL), 26 MALT lymphoma, 31 GCB, and 78 non-GCB cases purchased from Biomax tissue microarrays (TMAs) | EfficientNet (pretrained on ImageNet), which outperformed 5 other CNNs (AlexNet, VGG16, ResNet18, SqueezeNet, GoogleNet) | ACC: 0.702AUC: 0.870 |
| [23] | H&E histological images | FL, RLH | Patch level classification | Large series of 221 cases, including 177 follicular lymphoma. The series included 1,004,509 follicular lymphoma and 490,506 reactive lymphoid tissue image-patches and 44 reactive lymphoid tissue | Convolutional neural network (CNN) based on ResNet architecture | ACC:0.998, Precision:0.998, Specificity:0.997F1-score: 0.999 |
| [31] | H&E-stained whole slide images | MEITL vs ITCL-NOS | Case-level classification | Total of 40 histopathological whole-slide images (WSIs) from 40 surgically resected PITL cases | Hybrid Model: HTC-RCNN (for nuclear segmentation) + XGBoost (for classification) | Segmentation AP (HTC-RCNN): 0.881 Classification AUC (XGBoost): 0.966 Classification AUC (End-to-end CNN): 0.820 |
| [11] | H&E-stained tissue microarray cores | Agg BCL, DLBCL, FL, CHL, MCL, MZL, NKTCL, TCL | TMA core-level classification | Dataset of 670 cases from Guatemala spanning,8 lymphoma subtypes | LymphoML (LightGBM), SHapley Additive exPlanation (SHAP) analysis | ACC: 0.643 |
| [32] | H&E-stained histopathological images of malignant lymphomas | CLL, FL, MCL | Classification of three malignant lymphoma types | Dataset 1: 15,000 images (5,000 per class). Dataset 2: 374 images (113 CLL, 139 FL, 122 MCL). Train/test split 80/20 | System 1: DenseNet-121/ResNet-50 + PCA + SVM. System 2: ResNet-50 + hand-crafted features (GLCM, FCH, DWT, LBP) + FFNN with 756-feature vectors | Dataset 1: ResNet-50 FFNN: ACC: 99.5%, Specificity: 100%, Sensitivity: 99.33%, AUC: 99.86%. Dataset 2: ResNet-50 FFNN: ACC: 100%, Specificity: 100%, Sensitivity: 100%, AUC: 100% |
| [12] | H&E-stained histopathological images | DLBCL vs Non-DLBCL | Automated diagnosis and classification of DLBCL | 1,000 images total (500 DLBCL, 500 Non-DLBCL). Training: 700 images, Validation: 300 images. From lymph nodes only | DDLM-CAM. Two-channel architecture: DenseNet-201 (198 layers) + Attention Map Feature Transformer (AMFT) | ACC: 96%, Recall: 94.67%, Precision: 97.26%, Specificity: 97.33% |
| [13] | IHC-stained whole-slide images of DLBCL | DLBCL (GCB and ABC subtypes) with PD-L1 expression assessment | Automated quantification of PD-L1 expression and tumor proportion | Primary: 220 patients (88 surgical specimens, 132 fine needle biopsies), 4,101 tissue regions, 146,439 cells annotated. External validation: 61 patients. | ViT-tiny for ROI segmentation, AuxCNN for cell detection, NuClick for cell segmentation. Custom PD-L1 digital quantification rule for DLBCL based on cell morphology and area filtering. | Primary (surgical specimens): ICC Human vs Machine 0.96 (95% CI 0.94-0.97). Fine needle biopsies: ICC 0.96 (95% CI 0.95-0.97). Validation cohort: ICC 0.96 (0.95-0.98) for surgical and 0.98 (95% CI 0.95-0.99) for fine needle biopsies |
| [14] | IHC c-MYC and BCL2 stained tissue microarray cores | DLBCL with c-MYC and BCL2 positivity assessment | Automated quantification of proportion of c-MYC and BCL2 positive tumor cells from TMAs and WSIs | Training: 378 TMA cores from 173 patients (DLBCL-Morph dataset, Stanford). Validation: 52 WSIs (c-MYC), 56 WSIs (BCL2); 51 patients for double-expressor analysis. | AB-MIL (Attention-based Multiple Instance Learning) with ResNet50 pre-trained on ImageNet for feature extraction. | TMAs - c-MYC: Pearson r 0.843 (95% CI 0.797-0.907), Sensitivity 0.743, Specificity 0.963. BCL2: Pearson r 0.919, Sensitivity 0.938, Specificity 0.951. WSIs - c-MYC: Pearson r 0.883, Sensitivity 0.857-0.706, Specificity 0.991-0.930. BCL2: Pearson r 0.765, Sensitivity 0.856, Specificity 0.690. Double-expressor - WSI: Sensitivity 0.890, Specificity 0.598-1.000 |
| [24] | H&E-stained WSI of lymph nodes | Follicular lymphoma (FL) vs follicular hyperplasia (FH) | Automated differential diagnosis FL vs FH with uncertainty estimation | 378 lymph nodes (197 FL, 181 FH); 320,000 patches; train/val/test: 50/25/25% | Bayesian Neural Network (BNN) with patch-based analysis, multiple resolutions, dropout variance for uncertainty, trained at 8 pyramid levels | Patch accuracy: 91%. Slide AUC: 0.92–0.99 (best: lowest resolution). 100% FL detection at 20% false alarm |
| [37] | H&E-stained frozen whole-slide images of CNS tumors | Primary CNS lymphoma vs glioma (PCNSL) and non-PCNSL | Intraoperative discrimination of PCNSL vs glioma/non-PCNSL | Internal: 432 patients (79 PCNSL, 353 glioma); External 1: 300 (49 PCNSL, 251 glioma); External 2: 386 (22 PCNSL, 364 glioma) | LGNet ensemble (5 ResNet-50), tile-based averaging, patient/slide-level AUC, dropout for uncertainty estimation | External test: AUROC 0.965-0.972 (PCNSL vs glioma), AUROC 0.981-0.993 (PCNSL vs non-PCNSL); Sensitivity up to 95.5%, specificity up to 91.2% |
| [25] | H&E-stained images, IICBU lymphoma dataset | CLL, FL, MCL | Automated classification of lymphoma subtype | 374 images, split into 336 patches per image | Multispace reconstructed images (gradient, GLCM, LBP channels); VGG-16 pretrained, LSTM layer for feature selection, softmax classifier | Patch-level: ACC 98.94%, SEN 96.66–96.85%, SPE 99.12–99.38% (per class) |
| [26] | H&E-stained WSI | FL, CLL, MCL | Multi-class classification of major lymphoma subtypes | 15,000 WSI (5,000 per class, Kaggle), 80/20 train/test split | Hybrid: MobileNet, VGG16, AlexNet (features extracted, fused); handcrafted features (color, wavelet, texture, shape); ACO for selection; XGBoost and DT classifiers | Best: MobileNet-VGG16 + handcrafted + XGBoost: ACC 99.8%, AUC 99.43%, Sens 99.7%, Spec 99.8%, Prec 99.77% |
| [39] | OCT2 immunostained slides | NLPHL (treatment response prediction) | Prediction of chemotherapy response | 53 pediatric patients (14,579 LP cells annotated) | YOLOv4-tiny for cell detection, spatial statistics analysis | Mean AP: 95.24%. LP cell density: p=0.0049; LP cells/cluster: p=0.0012 (good vs poor responders) |
| [15] | H&E-stained tissue microarrays of lymph node specimens | SLL/CLL and DLBCL | Slide level classification | 629 patients (129 SLL/CLL, 119 DLBCL, 381 controls). 84,139 image patches. Train/val/test: 60/20/20 | EfficientNet B3 CNN with Adam optimizer | BACC: 95.56% (with quality control). DLBCL: 100% sensitivity/specificity |
| [40] | FFPE biopsy specimens of Hodgkin lymphoma stained with picrosirius red and MMP9 | Hodgkin lymphoma prognosis (qPET-positive vs qPET-negative) | Classification of collagen fiber staining patterns for prognostic prediction | 83 cases total (30 for training, 53 for testing). Training set: 7,134 tiles (picrosirius red), 5,788 tiles (MMP9). Test set: 953,068 tiles (picrosirius red), 409,406 tiles (MMP9) | YOLOv4 with transfer learning (pre-trained MS-COCO weights) | AUC: 0.79 (CI: 67.3-91.2). qPET-positive: 18% weakly stained fibers, qPET-negative: 10-14% (p=0.0185). Mean Average Precision: 73.4% (picrosirius red), 87.6% (MMP9) |
| [16] | H&E-stained biopsy slides from lymph nodes and extranodal tissues | DHL/THL (MYC with BCL2 and/or BCL6 rearrangements) vs non-DH DLBCL | Slide level classification for detection of DHL/THL cases | 57 biopsies total (32 training: 5 DHL, 27 non-DH; 25 validation: 10 DHL/THL, 15 non-DH). | pre-trained foundation model on TCGA data and Imagene internal database followed by fine-tuning with Multiple Instance Learning (MIL). Adam optimizer | Sensitivity: 100%, Specificity: 86.7%, Accuracy: 92%, AUC: 0.95 |
| [17] | H&E-stained tissue slides | DLBCL, R-CHOP response prediction | Prediction of immunochemotherapy response | 251 WSIs from 216 patients (training and validation sets comprising 80%(200 patients) and a test set consisting of the remaining 51 patients) | Self-supervised learning (DINO ViT-S8) with MIL and TabNet for clinical data integration | AUROC: 0.856 (multi-modal), 0.744 (pathology-only); Sensitivity: 90.2%, Specificity: 70.0% |
| [18] | H&E-stained lymph node biopsy slides | CLL, aCLL, RT-DLBCL | Classification of CLL disease progression | 125 patients (69 CLL, 44 aCLL, 80 RT); 193 slides total, 465 ROIs selected. | Hover-Net (pre-trained on PanNuke) for nuclear segmentation, Random Forest classifier with 4 morphologic and architectural biomarkers | ACC: 82.4% (all 4 biomarkers), AUC: 0.935 (95% CI: 0.797-0.952) |
| [29] | H&E-stained tissue slides of follicular lymphoma | CB vs non-CB cell classification | Automated centroblast classification for FL grading | 500 HPF images from 17 patients; 213 CB and 234 non-CB cell images. Train/test split 80/20. | COB (Classification using Orthogonal Bases) with SVD and CLEM (Classification based on Laplacian Eigenmaps) with nonlinear dimensionality reduction | COB: 99.22 ± 0.75% accuracy, 100% precision/recall. CLEM: 99.07 ± 1.53% accuracy, 100% precision/recall |
| [28] | H&E-stained lymph node biopsy slides | CLL, aCLL, RT (Richter transformation) | Classification of CLL disease progression | 135 patients; 193 slides (69 CLL, 44 aCLL, 80 RT); 465 ROIs total. Train/test split 1:1 | Hover-Net nuclear segmentation (pre-trained on PanNuke), Spectral clustering for unsupervised cell phenotyping, XGBoost classifier with 6 cellular features (cell ratios and densities) | Accuracy: 92.5%, AUC: 0.978; Mean accuracy (100 repeated splits): 90.2%, AUC: 0.973 |
| [27] | H&E-stained lymphoma pathological images | CLL, FL, MCL | Classification of three lymphoma types | 374 images (CLL, FL, MCL). Train/validation/test split: 6:2:2. | ResNet-50 with residual blocks, batch normalization, ReLU activation, cross-entropy loss. | ACC: 98.63% (ResNet-50). Compared to BP (96%) and GA-BP (97.7%). Paired T-test: p < 0.05 (statistically significant) |
| [41] | H&E-stained histopathological images | 7 lymphoma subtypes (HK-Classical, HK-NLP, NHK-Burkitt, NHK-Follicular, NHK-Mantel, NHK-LargeB-Cell, NHK-TCell) | Classification of rare and aggressive lymphoma subtypes | 323 RGB images, ∼46 images per class. 5-fold cross-validation, 80/20 train/test split | ResNet50 with transfer learning, 50 layers, batch normalization, global average pooling, Softmax classifier | Accuracy: 91.6%, Macro-Precision: 92%, Macro-Recall: 91.9%, Macro-F1: 91.9%, Kappa: 0.915 |
| [30] | H&E-stained whole-slide images of PCNSL | PCNSL prognosis prediction | Prognostic prediction of OS and PFS, treatment response, primary resistance | 114 patients (68 training, 46 validation); 132 WSIs total. 50 non-overlapping patches per patient. | CellProfiler 4.2.6 for automated feature extraction (802 quantitative features). LASSO-Cox regression model with tenfold cross-validation for Path-score generation. Six ML classifiers (Logistic, KNN, RF, SVM, XGBoost, DT) | Path-score (8-feature): Training cohort OS AUC 0.785 (1-yr), 0.869 (2-yr), 0.973 (3-yr); Validation cohort AUC 0.649 (1-yr), 0.679 (2-yr), 0.733 (3-yr). Nomogram: Training AUC 0.862 (1-yr), 0.932 (2-yr), 0.927 (3-yr); Validation AUC 0.802 (1-yr), 0.768 (2-yr), 0.938 (3-yr) |
4. Discussion
This scoping review presents a systematic effort to map the rapidly evolving landscape of artificial intelligence applications in lymphoma histopathology diagnostics, spanning tasks from classification of rare subtypes and prediction of genetic rearrangements to objective prognostic modelling and quantitative assessment of immunohistochemical biomarkers [13,14,17,30,33]. The main emphasis of the discussion is placed on a critical appraisal of the nature and quality of existing models and on identifying key translational gaps that still hinder widespread deployment of these advanced systems in routine hematopathology practice [42].
4.1. Characterization of AI Task Types in Hematopathology
Analysis of the assembled evidence supports three major pillars underpinning contemporary AI tasks in hematopathology: morphological classification, advanced discrimination of overlapping entities (difficult differentials), quantitative–predictive tasks. A foundational class of tasks is lymphoma subtype classification on routinely stained H&E whole-slide images [15,26,32]. These models have progressed from simple binary classifiers to multiclass systems capable of recognizing key entities such as diffuse large B-cell lymphoma (DLBCL), follicular lymphoma (FL), mantle cell lymphoma (MCL), and chronic lymphocytic leukemia/small lymphocytic lymphoma (CLL/SLL) [15,26,32].
Particular clinical value is attributed to models designed for ”difficult differentials”, where morphology is highly non-specific. Examples include discrimination of Burkitt lymphoma (BL) from DLBCL [7], therapeutically critical, as well as FL versus benign reactive follicular hyperplasia (FH) [23,24]. At the same time, concerns remain regarding generalizability across sites, as performance can be highly sensitive to inter-institutional technical heterogeneity (e.g., staining and scanning variation), with substantial degradation outside the training domain [24].
A separate, rapidly developing subgroup comprises disease-progression assessment models, particularly in indolent lymphomas such as CLL, where AI may help objectify recognition of large-cell (Richter) transformation and accelerated-phase CLL (aCLL), which are known to be subject to marked interobserver variability in routine microscopy [19,28].
4.2. Network Architectures and Learning Paradigms
Technological trajectory The technological evolution of AI models in hematopathology traces a clear trajectory from relatively simple morphometric classifiers toward advanced systems that integrate multiple data modalities.
Early and still common approaches are based on classical AI models such as Decision Tree (DT) [20,31], Random Forest (RF) [18,20] and Support Vector Machine (SVM) [32]. However, the most common approaches are based on classical convolutional neural network (CNN) architectures, such as ResNet, EfficientNet, GoogLeNet, MobileNet, and DenseNet [27]. Nevertheless, classical CNNs frequently face the ”black-box” limitation and a constrained ability to model global architectural dependencies across the entire lymph node [22].
The specific characteristics of lymphoma histopathology, such as often diffuse infiltration, subtle microenvironmental changes, and high tissue heterogeneity, have driven a shift toward the Multiple Instance Learning (MIL) paradigm [14]. MIL frameworks, including the Clustering-constrained Attention Multiple Instance Learning (CLAM) algorithm, are well suited to WSI analysis because they aggregate information across thousands of patches using only slide-level labels, avoiding the need for dense pixel-level manual annotation.
Attention mechanisms enable the network to focus on diagnostically salient regions while reducing the importance of artefacts and irrelevant background, which is critical when detecting rare cellular populations or events such as Richter transformation [28]. A major step towards global histopathology understanding and an extension of attention mechanisms in image analysis is the introduction of Vision Transformers (ViT) and CNN–ViT hybrid models [22]. Although this is a relatively new approach, models such as HCTN-LC [22] are already emerging, combining a lightweight SqueezeNet with a ViT branch, aim to capture spatial dependencies that are difficult to represent with classical convolutions alone. On the other hand, using smaller variants such as ViT-Tiny has also been reported as effective for precise ROI segmentation in immunohistochemistry, supporting more objective assessment of markers such as PD-L1 [13].
One of the most promising trends beyond the constraints of small annotated datasets is the rise of self-supervised learning and foundation models [35]. Using paradigms such as DINO with ViT backbones (e.g., DINO-ViT / DINO ViT-S) trained on large collections of unlabeled slides enables extraction of more generalizable morphological representations. These representations can serve as a robust basis for transfer learning across institutions, mitigating the impact of technical heterogeneity [16].
4.3. Training Data and Their Sources
A key determinant of the translational success of AI models in hematopathology is the quality, scale, and provenance of the training data. An analysis of the reviewed literature reveals a pronounced dichotomy between small, meticulously curated clinical cohorts and large-scale, yet often more weakly characterized, public datasets.
On the one hand, there are very small, single-centre series using as few as 30 – 40 WSIs or only several dozen clinical cases, which is typical for rare entities or proof-of-concept studies [20,31]. On the other hand, systems trained on resources such as Kaggle may operate on datasets on the order of 15,000 images, while the most advanced analyses of lymph node architecture process even millions of patches [22,23].
The type of biological material analyzed is similarly heterogeneous, forcing models to contend with distinct artefact profiles:
- 1.
- Lymph node biopsies and TMA: These remain the standard, often in the form of tissue microarrays (TMAs), which reduce search variance but constrain architectural context [43].
- 2.
- Bone marrow: Used mainly for assessing large-cell transformation, where single-cell segmentation in densely cellular substrates is critical [19].
- 3.
- Skin biopsies: Models dedicated to cutaneous T-cell lymphomas (MF) must distinguish neoplastic infiltrates from benign dermatoses [34].
- 4.
- Frozen sections: Intraoperative assessment (e.g., in PCNSL) is affected by specific freezing artefacts, which models such as LGNet can effectively disregard [37].
- 5.
- LBC cytology: Liquid-based cytology enables analysis of isolated cells, which simplifies segmentation but sacrifices tissue-architecture information [26].
Public datasets, such as NCI/NIA, Kaggle, Leeds/Iowa virtual pathology resources, or commercial TMA products (e.g., BioMax), have played a fundamental role in enabling study reproducibility [38]. Crucially, these resources allow objective comparisons of different network architectures, as illustrated by studies benchmarking EfficientNet against classical CNN baselines [44]
Overreliance on private, institution-specific datasets introduces the risk of ”institutional overfitting”. Models trained on such datasets may achieve excellent internal performance that deteriorates sharply on external data [24]. Key technical confounders include scanner characteristics, such as sensor and compression differences, and variability in staining protocols, particularly in hematoxylin and eosin intensity [10]. In addition, selection bias may occur, resulting in private datasets overrepresent “textbook” while underrepresenting borderline cases and artefacts, thereby artificially simplifying the classification problem [16].
4.4. Interpretation of Performance Metrics
Interpreting AI model performance metrics in hematopathology requires moving beyond a superficial reading of high numerical values, which often conceal material methodological risks. In the reviewed literature, it is striking how frequently studies report near-perfect results, such as ACC or AUC close to 1.0. Particularly for tasks with relatively low morphological complexity or for carefully curated, small datasets [22,32]. Such results may be affected by ”optimism bias” driven by limited sample representativeness. In a systematic review covering several dozen models, this was identified as a high risk of bias in participant selection and statistical analysis domains [42].
Although metrics such as AUC and ACC are standard in machine learning, lymphoma diagnostics increasingly benefits from measures that are more natural to pathology practice and better reflect tool utility in precision medicine:
- 1.
- Intraclass correlation coefficient (ICC): For PD-L1 expression assessment in DLBCL, ACC alone is insufficient due to tissue heterogeneity; therefore, reporting ICC is essential, with AI algorithms achieving ICC = 0.96, exceeding inter-pathologist agreement (0.94) [13].
- 2.
- Pearson correlation: In quantitative scoring of c-MYC and BCL2, AI outputs achieve correlations with the gold standard of 0.843 and 0.919, respectively, enabling more objective identification of the double-expressor phenotype than is achievable with binary classifiers [14].
The key test of model robustness is not performance on an internal test set, but external validation, which exposes AI sensitivity to technical variation. Li et al. show that a model achieving 100% accuracy in one institution, when transferred to another site, loses nearly 10% precision (dropping to 90.5%) solely due to a lack of harmonization in image geometry and acquisition parameters [10]. Even more sceptical conclusions emerge from studies of Bayesian Neural Networks (BNN): despite ideal internal validation (AUC = 1.0), external performance dropped markedly (AUC 0.63–0.69), which Syrykh et al. attribute to high sensitivity to pre-processing protocols [24].
Both clinical experience and the literature point to a fundamental lack of standardization that prevents straightforward, head-to-head ranking of models. Studies vary in:
- 1.
- 2.
- 3.
Accordingly, inferences at the discussion level must be formulated with caution: high ACC/AUC should be treated more as evidence that biologically meaningful signal is present in the image than as a certificate of clinical readiness of the tool [42].
4.5. Models for IHC and Prognostic Markers
AI systems appear most readily implementable in lymphoma histopathology when used to automate IHC biomarker assessment, including PD-L1, c-MYC, and BCL2. In routine practice, scoring of these markers is subjective and shows interobserver variability that can affect treatment decisions [13,14]. AI can reduce this variability by providing quantitative, standardized measurements that support precision medicine [13].
Yan et al. demonstrated this approach for PD-L1 in DLBCL using more than 146,000 individual cells from 5,101 tissue regions, enabling rule-based filtering of non-tumour cells such as macrophages, an important issue when neoplastic and reactive populations may share antigen expression [13]. Importantly, the models were trained and evaluated using clinically accepted decision thresholds (e.g., 5% or 50% TPS), which makes outputs directly interpretable for clinicians [13].
Evidence also suggests robustness across sample preparations. AI achieved higher agreement with pathologists on FNA biopsies than on large surgical specimens, plausibly due to lower image noise in smaller samples [13]. Tavolara et al. further showed that models trained on standardized standardized tissue microarrays (TMA) can be transferred to WSI analysis for c-MYC/BCL2, addressing staining and architectural heterogeneity and outperforming pathologists in g progression-free 486 survival (PFS) risk stratification among double-expressor patients [14].
4.6. The Gap Between Research Findings and Approved Solutions
Despite the breadth of published research, a clear gap remains between scientific output and real-world clinical implementation, as reflected in regulatory registers. At present, the list of FDA-cleared AI solutions in pathology includes only six entries, none of which directly address lymphoma histopathology[1]. This disparity can be explained by several translational barriers.
A central limitation is the lack of prospective clinical evidence. Nearly all reviewed AI models were evaluated retrospectively, which does not capture the variability of routine workflows [1,42]. Retrospective validation fails to account for real-world factors such as differences in specimen preparation or scanning artefacts; therefore, prospective studies with hard clinical endpoints remain an urgent requirement for regulatory acceptance [1,42].
Limited generalizability is further driven by pipeline variation and insufficient standardization across the diagnostic process, from scanner parameters and staining protocols to harmonized quality metrics [38]. Technical variance introduced during slide preparation can markedly reduce inter-institutional performance, leading to site-tailored rather than universally deployable models [10]. These models are highly sensitive to pre-processing, where even minor deviations in hematoxylin intensity may trigger misclassification [24].
Another barrier is the inherent subjectivity of pathologists themselves, which propagates into training-label quality. In challenging lymphoma differential diagnosis settings, interobserver variability may range from 15% to as high as 40% [1]. For quantification of markers such as c-MYC or BCL2, the subjective nature of scoring introduces label noise, complicating the definition of what constitutes a “correct” classification in borderline cases [14,29]. Without harmonized endpoint definitions, rigorous comparison of different AI systems remains difficult [42].
Finally, technological maturity should be separated from clinical-regulatory maturity: high laboratory performance (e.g., AUC > 0.95) does not imply readiness for deployment [42]. Moving toward consolidation requires transparent reporting of participant recruitment and adherence to guidelines for trustworthy medical AI [42]. Accordingly, the field appears to be transitioning from proof-of-concept toward clinical validation, which is necessary for AI to become a routine tool supporting lymphoma diagnostics [13].
4.7. Specific Limitations of AI Models in Lymphoma Histopathology
Despite promising metrics reported under controlled experimental conditions, the assembled evidence highlights limitations that still hinder translation into routine hematopathology practice. These constraints mainly arise from the morphological complexity and incomplete diagnostic context with limited interpretability, compounded by persistent risks of bias and poor generalization.
4.7.1. Morphological Complexity
A fundamental barrier is the extreme morphological complexity of lymphomas, with overlapping cytologic features between benign and malignant entities, which is most apparent in difficult differentials such as FL versus FH [24]. While models perform well in “typical” cases, performance drops in the diagnostic grey zone, where subtle architectural changes or technical artefacts (e.g., crush artefact, fixation-related errors) lead to misclassification [24,31]. In entities such as monomorphic epitheliotropic intestinal T-cell lymphoma (MEITL), discordance between immunophenotype and atypical nuclear morphology further increases the risk of overinterpretation by current systems [31].
4.7.2. Incomplete Capture of Diagnostic Context
Another key limitation is that many models isolate morphology from the broader clinicopathological context: they rely on a single stain (H&E or a specific IHC marker), although final diagnosis integrates immunophenotypic panels, molecular testing (e.g. FISH), and clinical data [14]. Although integrating histology with clinical variables (e.g. TabNet) can improve prediction of immunochemotherapy response, multimodal approaches are still not the default [17]. From the clinician’s perspective, limited transparency of the decision process remains a major barrier to trust [28]; only a minority of studies apply XAI (e.g. SHAP, Grad-CAM, occlusion sensitivity) in a way that allows verification that models attend to biologically meaningful features rather than noise [11,23]. This need is particularly acute for tasks such as predicting CLL transformation to Richter transformation (RT) or identifying DHL/THL, where nuclear morphology provides key cues that AI should be able to justify [16,28].
4.7.3. Bias Risk and Limited Generalization
Finally, there remains a material risk of data-selection bias and limited generalization: training data often come from specialized centres [42], may underrepresent certain regions or ethnic groups [1,11,35], and may not match real-world specimen types such as FNA or trephine biopsies where artefacts and noise are more frequent [13,35]. Accordingly, rigorous reporting of participant recruitment and statistical transparency remains necessary to close the gap between technological performance and clinical trustworthiness [42].
4.8. Limitations of the Review
In line with the scoping review protocol, this work did not conduct a rigorous, study-by-study methodological quality appraisal with respect to risk of bias. This limits the ability to make evidence-strength claims beyond mapping the landscape, especially given that reporting in medical AI is often insufficient for confident critical appraisal [42].
A further limitation is reliance on performance metrics (ACC, AUC) as reported directly by study authors [42]. Because primary studies frequently provide incomplete methodological detail (e.g., recruitment procedures or whether predictor assessment was blinded to outcomes), synthesis may be affected by uncertainty about how reported results were obtained and how comparable they are across studies [42].
Methodological heterogeneity across the reviewed studies prevents construction of a reliable model ranking. Differences in diagnostic class definitions, validation protocols, and frequent lack of publicly available source code limit reproducibility and impede direct comparisons [23,42]. In addition, confounding from scanner- and slide-preparation-related technical variance, often not adequately mitigated via normalization, restricts how confidently conclusions can be generalized across clinical environments [10,24,34].
Finally, by intentionally restricting the scope of the review to H&E and IHC histopathology images, the full multimodal diagnostic pathway for lymphoma is not assessed. This limits the ability to comment on integrated decision-support systems combining morphology with immunophenotyping, flow cytometry, genomics, radiomics, or other -omics data [17,30,42].
4.9. Perspectives and Actionable Future Research Directions
The current evidence base suggests that AI in hematopathology remains saturated with proof-of-concept–level studies, and future work should therefore prioritize rigorous clinical and operational validation. Future progress can be framed around four directions, with some themes (e.g., prospective validation and generalizability) already emphasized earlier in this discussion.
4.9.1. Shift Toward Prospective, Multi-Centre Studies
A core challenge remains the “generalizability gap” driven by technical inter-laboratory variance. Li et al. clearly demonstrated that a model achieving 100% accuracy in one hospital can lose 10% precision in another if variability arising from staining protocols and scanner parameters is not addressed[10]. Accordingly, prospective studies embedded in real-world pathology workflows are urgently needed to quantify the impact of real-time artefacts (e.g., crush artefact, air bubbles) on prediction stability [35,42]. Only such validation can determine whether AI models genuinely shorten time-to-diagnosis and reduce the need for costly external consultations .
4.9.2. Public Benchmarks and Standardization
Model-to-model comparison is currently hampered by the scarcity of publicly available, high-quality datasets (with source code accessible in only ~22% of publications) [42]. There is a clear need for large public benchmarks targeting clinically contentious tasks:
- 1.
- FL vs FH: This task is associated with ~25% interobserver variability, making it an ideal testing ground for AI [29].
- 2.
- BL vs DLBCL: Models must demonstrate robustness to rare morphological variants [7].
- 3.
- DHL/THL detection: AI as a triage tool prior to costly FISH testing could yield measurable economic benefits [16].
4.9.3. Foundation Models and Multimodal Integration
Emerging paradigms such as foundation models and self-supervised learning may reduce dependence on small labeled datasets [17,34]. However, the central goal for precision hematopathology remains multimodal integration: Lee et al. showed that combining H&E-derived features with clinical and molecular variables (e.g., via TabNet) can increase AUC from 0.744 to 0.856 for predicting R-CHOP response [17]. Future systems should therefore focus on synthesizing morphology, immunophenotype, and genetics to better support therapy personalization.
4.9.4. Redefining Success: From Metrics to Utility
Author Contributions
Conceptualization, M.C.; methodology, G.R., A.Ż., P.K., M.C.; software, P.K., P.T., A.S.; validation, M.C., P.K.; formal analysis, M.C., P.K., P.T., G.R., A.Z., A.S., M.W.; investigation, M.C., P.K., P.T., G.R., A.Z., A.S., M.W.; resources, M.C., P.K., P.T., G.R., A.Z., A.S., M.W.; data curation, M.C., P.K., P.T., G.R., A.Z., A.S., M.W.; writing—original draft preparation, M.C., P.K., M.W., A.S., P.T., G.R., A.Ż.; writing—review and editing, M.C., P.K., A.S., M.W., P.T., G.R., A.Ż; visualization, P.K., A.S.; supervision, G.R., A.Ż.; project administration, M.C., G.R., P.K.. All authors have read and agreed to the published version of the manuscript.
Funding
This research received no external funding.
Institutional Review Board Statement
Not applicable
Informed Consent Statement
Not applicable
Data Availability Statement
The data presented in this study are available in the Scopus® bibliographic repository (https://www.scopus.com) under institutional subscription. These data were derived from the peer-reviewed articles identified and included in this scoping review; full bibliographic details of all sources are provided in the Reference section of the manuscript. No new primary datasets were generated or analyzed during the current study.
Acknowledgments
Not applicable
Conflicts of Interest
The authors declare no conflicts of interest.
Abbreviations
The following abbreviations are used in this manuscript:
| AI | Artificial Intelligence |
| PRISMA | Preferred Reporting Items for Systematic |
| Reviews and Meta-Analyses | |
| PRISMA-ScR | PRISMA for Scoping Reviews |
| CNNs | Convolutional Neural Networks |
| H&E | Hematoxylin and Eosin |
| TCGA | The Cancer Genome Atlas |
| CLL | Chronic Lymphocytic Leukemia |
| c-MYC | Cellular Myelocytomatosis |
| BCL2 | B-Cell Lymphoma 2 |
| ACC | Model Accuracy |
| AUC | Area Under the Curve |
| CC BY | Creative Commons Attribution |
| AIDS | Acquired Immunodeficiency Syndrome |
| NHL | Non-Hodgkin Lymphomas |
| WHO | World Health Organization |
| TNM | Tumor-Node-Metastasis |
| FDA | Food and Drug Administration |
| PROSPERO | International Prospective Register of |
| Systematic Reviews | |
| WSI | Whole Slide Imaging |
| DLBCL | Diffuse Large B-Cell Lymphoma |
| MCL | Mantle Cell Lymphoma |
| FL | Follicular Lymphoma |
| ViT | Vision Transformer |
| IHC | Immunohistochemistry |
| CT | Computed Tomography |
| MRI | Magnetic Resonance Imaging |
| PET | Positron Emission Tomography |
| COO | Cell of Origin |
| MIL | Multiple Instance Learning |
| GNN | Graph Neural Network |
| TMA | Tissue Microarray |
| TME | Tumor Microenvironment |
| DOI | Digital Object Identifier |
| IEEE | Institute of Electrical and Electronics Engineers |
| TP | True Positive |
| TN | True Negative |
| FP | False Positive |
| FN | False Negative |
| TPR | True Positive Rate |
| FPR | False Positive Rate |
| SPC | Specificity |
| ROC | Receiver Operating Characteristic |
| DT | Decision Tree |
| RF | Random Forest |
| SVM | Support Vector Machine |
| BNN | Bayesian Neural Network |
| LBC | Liquid-Based Cytology |
| IICBU | Image Informatics and Computational Biology Unit (Dataset) |
| OCT2 | Octamer-Binding Transcription Factor 2 |
| FFPE | Formalin-Fixed Paraffin-Embedded |
| MMP9 | Matrix Metallopeptidase 9 |
| PCNSL | Primary Central Nervous System Lymphoma |
| SLL | Small Lymphocytic Lymphoma (the same disease as CLL) |
| BL | Burkitt Lymphoma |
| MZL | Marginal Zone Lymphoma |
| MALT | Mucosa-Associated Lymphoid Tissue Lymphoma |
| Agg BCL | Aggressive B-Cell Lymphoma |
| MF | Mycosis Fungoides |
| AITL | Angioimmunoblastic T-Cell Lymphoma |
| MEITL | Monomorphic Epitheliotropic Intestinal T-Cell Lymphoma |
| ITCL-NOS | Intestinal T-Cell Lymphoma, Not Otherwise Specified |
| NKTCL | Natural Killer/T-Cell Lymphoma |
| TCL | T-Cell Lymphoma |
| CHL | Classical Hodgkin Lymphoma |
| NLPHL | Nodular Lymphocyte-Predominant Hodgkin Lymphoma |
| BLN | Benign Lymph Node |
| RLH | Reactive Lymphoid Hyperplasia |
| FH | Follicular Hyperplasia |
| NL | Normal Lymph Node |
| LCT | Large Cell Transformation |
| GCB | Germinal Center B-Cell-Like |
| ABC | Activated B-Cell-Like |
| PD-L1 | Programmed Death-Ligand 1 |
| DHL | Double Hit Lymphoma |
| THL | Triple Hit Lymphoma |
| OS | Overall Survival |
| PFS | Progression-Free Survival |
| TB | Terabytes |
| FISH | Fluorescence In Situ Hybridization |
| RL | Reactive Lymphoid |
| LP cells | Lymphocyte-Predominant Cells |
| CLAM | Clustering-Constrained Attention Multiple Instance Learning |
| PL | Polynomial |
| SMO | Sequential Minimal Optimization |
| Bi-LSTM | Bidirectional Long Short-Term Memory |
| DBN | Deep Belief Network |
| RBFN | Radial Basis Function Network |
| HCTN-LC | Hierarchical Convolutional Neural Networks |
| for Lymphoma Classification | |
| GOTDP-MP-CNNs | Globally Optimized Transfer Deep-Learning Platform |
| with Multiple Pretrained Convolutional Neural Networks | |
| HTC-RCNN | Hybrid Task Cascade Region-Based |
| Convolutional Neural Network | |
| LightGBM | Light Gradient Boosting Machine |
| SHAP | Shapley Additive Explanations |
| ResNet-50 | Residual Network with 50 Layers |
| FFNN | Feed-Forward Neural Network |
| GLCM | Gray-Level Co-occurrence Matrix |
| LBP | Local Binary Patterns |
| DWT | Discrete Wavelet Transform |
| FCH | Fuzzy Color Histogram |
| DDLM-CAM | Deep Discriminative Learning Model |
| with Calibrated Attention Map | |
| AMFT | Attention Map Feature Transformer |
| ROI | Region of Interest |
| AuxCNN | Auxiliary Convolutional Neural Network |
| AB-MIL | Attention-Based Multiple Instance Learning |
| LSTM | Long Short-Term Memory |
| ACO | Ant Colony Optimization |
| MS-COCO | Microsoft Common Objects in Context |
| COB | Classification Using Orthogonal Bases |
| CLEM | Classification Based on Laplacian Eigenmaps |
| SVD | Singular Value Decomposition |
| ICC | Intraclass Correlation Coefficient |
| CI | Confidence Interval |
| AUROC | Area Under the Receiver Operating Characteristic Curve |
| Mean AP | Mean Average Precision |
| BAAC/BACC | Balanced Average Accuracy |
| aCLL | Accelerated-Phase Chronic Lymphocytic Leukemia |
| FNA | Fine-Needle Aspiration |
| RT | Richter Transformation |
| GRAD-CAM | Gradient-Weighted Class Activation Mapping |
Appendix A
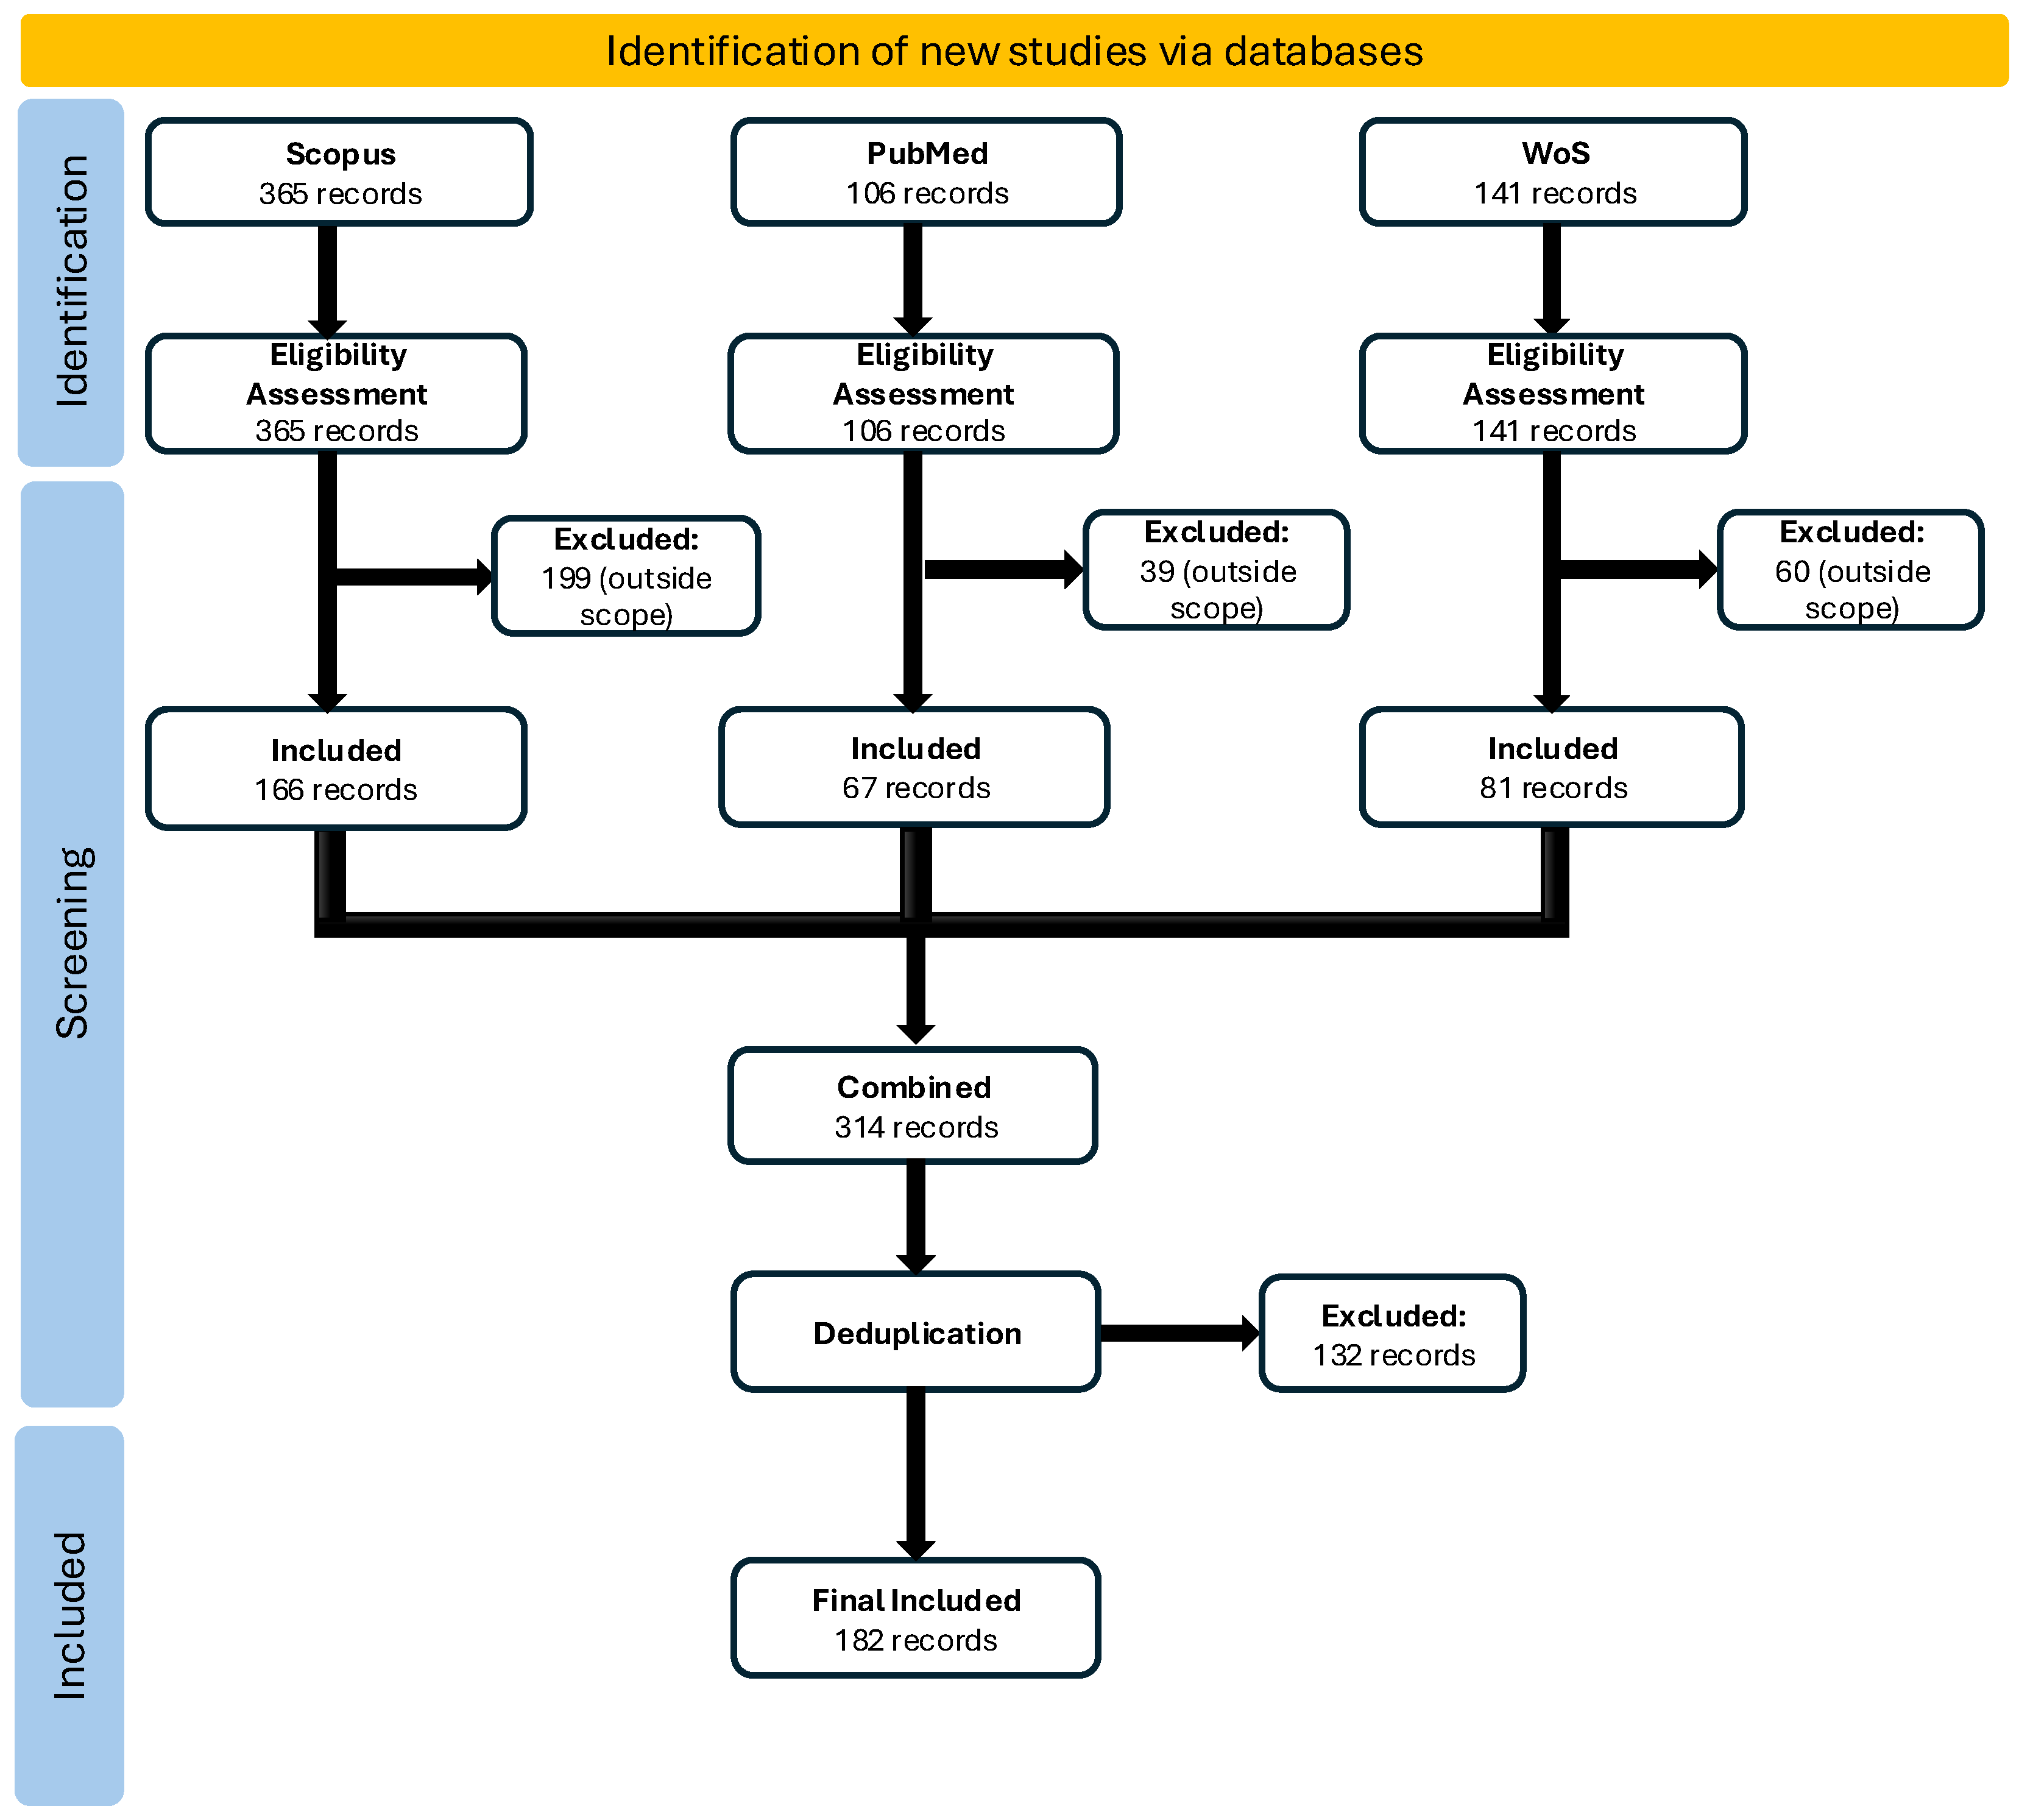
Figure A1.
PRISMA flow diagram.
References
- Czapliński, M.; Redlarski, G.; Kowalski, P.; Tojza, P.M.; Sikorski, A.; Żak, A. An Overview of Existing Applications of Artificial Intelligence in Histopathological Diagnostics of Leukemias: A Scoping Review. Electronics 2025, 14, 4144. [Google Scholar] [CrossRef]
- Karia, S.J.; McArdle, D.J. AIDS-related primary CNS lymphoma; 2017. [Google Scholar] [CrossRef]
- WHO Classification of Tumours Editorial Board. Haematolymphoid tumours;WHO classification of tumours, 5 ed.; International Agency for Research on Cancer: Lyon, 2024; Vol. 11. [Google Scholar]
- Condoluci, A.; Rossi, D. Biology and Treatment of Richter Transformation; 2022. [Google Scholar] [CrossRef]
- Alaggio, R.; Amador, C.; Anagnostopoulos, I.; Attygalle, A.D.; de Oliveira Araujo, I.B.; Berti, E.; Bhagat, G.; Borges, A.M.; Boyer, D.; Calaminici, M.; et al. The 5th edition of the World Health Organization Classification of Haematolymphoid Tumours: Lymphoid Neoplasms; 2022. [Google Scholar] [CrossRef]
- Achi, H.E.; Belousova, T.; Chen, L.; Wahed, A.; Wang, I.; Hu, Z.; Kanaan, Z.; Rios, A.; Nguyen, A.N.D. Automated Diagnosis of Lymphoma with Digital Pathology Images Using Deep Learning. Technical report. 2019. [Google Scholar]
- Mohlman, J.S.; Leventhal, S.D.; Hansen, T.; Kohan, J.; Pascucci, V.; Salama, M.E. Improving Augmented Human Intelligence to Distinguish Burkitt Lymphoma from Diffuse Large B-Cell Lymphoma Cases. American Journal of Clinical Pathology 2020, 153, 743–759. [Google Scholar] [CrossRef] [PubMed]
- Miyoshi, H.; Sato, K.; Kabeya, Y.; Yonezawa, S.; Nakano, H.; Takeuchi, Y.; Ozawa, I.; Higo, S.; Yanagida, E.; Yamada, K.; et al. Deep learning shows the capability of high-level computer-aided diagnosis in malignant lymphoma. Laboratory Investigation 2020, 100, 1300–1310. [Google Scholar] [CrossRef] [PubMed]
- Hashimoto, N.; Ko, K.; Yokota, T.; Kohno, K.; Nakaguro, M.; Nakamura, S.; Takeuchi, I.; Hontani, H. Subtype classification of malignant lymphoma using immunohistochemical staining pattern. International Journal of Computer Assisted Radiology and Surgery 2022, 17, 1379–1389. [Google Scholar] [CrossRef]
- Li, D.; Bledsoe, J.R.; Zeng, Y.; Liu, W.; Hu, Y.; Bi, K.; Liang, A.; Li, S. A deep learning diagnostic platform for diffuse large B-cell lymphoma with high accuracy across multiple hospitals. Nature Communications 2020, 11. [Google Scholar] [CrossRef]
- Shankar, V.; Yang, X.; Krishna, V.; Tan, B.; Silva, O.; Rojansky, R.; Ng, A.; Valvert, F.; Briercheck, E.; Weinstock, D.; et al. LymphoML: An interpretable artificial intelligence-based method identifies morphologic features that correlate with lymphoma subtype. Technical report. 2023. [Google Scholar]
- Basu, S.; Agarwal, R.; Srivastava, V. Deep discriminative learning model with calibrated attention map for the automated diagnosis of diffuse large B-cell lymphoma. Biomedical Signal Processing and Control 2022, 76. [Google Scholar] [CrossRef]
- Yan, F.; Da, Q.; Yi, H.; Deng, S.; Zhu, L.; Zhou, M.; Liu, Y.; Feng, M.; Wang, J.; Wang, X.; et al. Artificial intelligence-based assessment of PD-L1 expression in diffuse large B cell lymphoma. npj Precision Oncology 2024, 8. [Google Scholar] [CrossRef]
- Tavolara, T.E.; Niazi, M.K.K.; Feldman, A.L.; Jaye, D.L.; Flowers, C.; Cooper, L.A.; Gurcan, M.N. Translating prognostic quantification of c-MYC and BCL2 from tissue microarrays to whole slide images in diffuse large B-cell lymphoma using deep learning. Diagnostic Pathology 2024, 19. [Google Scholar] [CrossRef]
- Steinbuss, G.; Kriegsmann, M.; Zgorzelski, C.; Brobeil, A.; Goeppert, B.; Dietrich, S.; Mechtersheimer, G.; Kriegsmann, K. Deep learning for the classification of non-hodgkin lymphoma on histopathological images. Cancers 2021, 13. [Google Scholar] [CrossRef]
- Perry, C.; Greenberg, O.; Haberman, S.; Herskovitz, N.; Gazy, I.; Avinoam, A.; Paz-Yaacov, N.; Hershkovitz, D.; Avivi, I. Image-Based Deep Learning Detection of High-Grade B-Cell Lymphomas Directly from Hematoxylin and Eosin Images. Cancers 2023, 15. [Google Scholar] [CrossRef]
- Lee, J.H.; Song, G.Y.; Lee, J.; Kang, S.R.; Moon, K.M.; Choi, Y.D.; Shen, J.; Noh, M.G.; Yang, D.H. Prediction of immunochemotherapy response for diffuse large B-cell lymphoma using artificial intelligence digital pathology. Journal of Pathology: Clinical Research 2024, 10. [Google Scholar] [CrossRef]
- Hussein, S.E.; Chen, P.; Medeiros, L.J.; Wistuba, I.I.; Jaffray, D.; Wu, J.; Khoury, J.D. Artificial intelligence strategy integrating morphologic and architectural biomarkers provides robust diagnostic accuracy for disease progression in chronic lymphocytic leukemia. Journal of Pathology 2022, 256, 4–14. [Google Scholar] [CrossRef]
- Irshaid, L.; Bleiberg, J.; Weinberger, E.; Garritano, J.; Shallis, R.M.; Patsenker, J.; Lindenbaum, O.; Kluger, Y.; Katz, S.G.; Xu, M.L. Histopathologic and Machine Deep Learning Criteria to Predict Lymphoma Transformation in Bone Marrow Biopsies. Proceedings of the Archives of Pathology and Laboratory Medicine. College of American Pathologists 2022, Vol. 146, 182–193. [Google Scholar] [CrossRef]
- do Nascimento, M.Z.; Martins, A.S.; Tosta, T.A.A.; Neves, L.A. Lymphoma images analysis using morphological and non-morphological descriptors for classification. Computer Methods and Programs in Biomedicine 2018, 163, 65–77. [Google Scholar] [CrossRef]
- UmaMaheswaran, S.K.; Brahmaiah, V.P.; Suresh, C.; Balaji, S.R.; Ahmad, F. Artificial intelligence based malignant lymphoma type prediction using enhanced super resolution image and hybrid feature extraction algorithm. Computers in Biology and Medicine 2025, 193. [Google Scholar] [CrossRef]
- Sikkandar, M.Y.; Sundaram, S.G.; Almeshari, M.N.; Begum, S.S.; Sankari, E.S.; Alduraywish, Y.A.; Obidallah, W.J.; Alotaibi, F.M. A novel hybrid convolutional and transformer network for lymphoma classification. Scientific Reports 2025, 15. [Google Scholar] [CrossRef] [PubMed]
- Carreras, J.; Ikoma, H.; Kikuti, Y.Y.; Nagase, S.; Ito, A.; Orita, M.; Tomita, S.; Tanigaki, Y.; Nakamura, N.; Masugi, Y. Histological Image Classification Between Follicular Lymphoma and Reactive Lymphoid Tissue Using Deep Learning and Explainable Artificial Intelligence (XAI). Cancers 2025, 17. [Google Scholar] [CrossRef]
- Syrykh, C.; Abreu, A.; Amara, N.; Siegfried, A.; Maisongrosse, V.; Frenois, F.X.; Martin, L.; Rossi, C.; Laurent, C.; Brousset, P. Accurate diagnosis of lymphoma on whole-slide histopathology images using deep learning. npj Digital Medicine 2020, 3. [Google Scholar] [CrossRef] [PubMed]
- Zhu, H.; Jiang, H.; Li, S.; Li, H.; Pei, Y. A Novel Multispace Image Reconstruction Method for Pathological Image Classification Based on Structural Information. In BioMed Research International; 2019. [Google Scholar] [CrossRef]
- Hamdi, M.; Senan, E.M.; Jadhav, M.E.; Olayah, F.; Awaji, B.; Alalayah, K.M. Hybrid Models Based on Fusion Features of a CNN and Handcrafted Features for Accurate Histopathological Image Analysis for Diagnosing Malignant Lymphomas. Diagnostics 2023, 13. [Google Scholar] [CrossRef]
- Zhang, X.; Zhang, K.; Jiang, M.; Yang, L. Research on the classification of lymphoma pathological images based on deep residual neural network. In Proceedings of the Technology and Health Care; IOS Press BV, 2021; Vol. 29, pp. S335–S344. [Google Scholar] [CrossRef]
- Chen, P.; Hussein, S.E.; Xing, F.; Aminu, M.; Kannapiran, A.; Hazle, J.D.; Medeiros, L.J.; Wistuba, I.I.; Jaffray, D.; Khoury, J.D.; et al. Chronic Lymphocytic Leukemia Progression Diagnosis with Intrinsic Cellular Patterns via Unsupervised Clustering. Cancers 2022, 14. [Google Scholar] [CrossRef] [PubMed]
- Kornaropoulos, E.N.; Niazi, M.K.K.; Lozanski, G.; Gurcan, M.N. Histopathological image analysis for centroblasts classification through dimensionality reduction approaches. Cytometry Part A 2014, 85, 242–255. [Google Scholar] [CrossRef] [PubMed]
- Duan, L.; He, Y.; Guo, W.; Du, Y.; Yin, S.; Yang, S.; Dong, G.; Li, W.; Chen, F. Machine learning-based pathomics signature of histology slides as a novel prognostic indicator in primary central nervous system lymphoma. Journal of Neuro-Oncology 2024, 168, 283–298. [Google Scholar] [CrossRef] [PubMed]
- Yu, W.H.; Li, C.H.; Wang, R.C.; Yeh, C.Y.; Chuang, S.S. Machine learning based on morphological features enables classification of primary intestinal t-cell lymphomas. Cancers 2021, 13. [Google Scholar] [CrossRef] [PubMed]
- Al-Mekhlafi, Z.G.; Senan, E.M.; Mohammed, B.A.; Alazmi, M.; Alayba, A.M.; Alreshidi, A.; Alshahrani, M. Diagnosis of Histopathological Images to Distinguish Types of Malignant Lymphomas Using Hybrid Techniques Based on Fusion Features. Electronics (Switzerland) 2022, 11. [Google Scholar] [CrossRef]
- Swiderska-Chadaj, Z.; Hebeda, K.M.; van den Brand, M.; Litjens, G. Artificial intelligence to detect MYC translocation in slides of diffuse large B-cell lymphoma. Virchows Archiv 2021, 479, 617–621. [Google Scholar] [CrossRef]
- Doeleman, T.; Brussee, S.; Hondelink, L.M.; Westerbeek, D.W.; Sequeira, A.M.; Valkema, P.A.; Jansen, P.M.; He, J.; Vermeer, M.H.; Quint, K.D.; et al. Deep Learning–Based Classification of Early-Stage Mycosis Fungoides and Benign Inflammatory Dermatoses on H&E-Stained Whole-Slide Images: A Retrospective, Proof-of-Concept Study. Journal of Investigative Dermatology 2025, 145, 1127–1134.e8. [Google Scholar] [CrossRef]
- Nambiar, N.; Rajesh, V.; Nair, A.; Nambiar, S.; Nair, R.; Uthamanthil, R.; Lotodo, T.; Mittal, S.; Kussick, S. An AI based, open access screening tool for early diagnosis of Burkitt lymphoma. Frontiers in Medicine 2024, 11. [Google Scholar] [CrossRef]
- Quan, J.; Ye, J.; Lan, J.; Wang, J.; Hu, Z.; Guo, Z.; Wang, T.; Han, Z.; Wu, Z.; Tan, T.; et al. A deep learning model fusion algorithm for the diagnosis of gastric Mucosa-associated lymphoid tissue lymphoma. Biomedical Signal Processing and Control 2024, 92. [Google Scholar] [CrossRef]
- Zhang, X.; Zhao, Z.; Wang, R.; Chen, H.; Zheng, X.; Liu, L.; Lan, L.; Li, P.; Wu, S.; Cao, Q.; et al. A multicenter proof-of-concept study on deep learning-based intraoperative discrimination of primary central nervous system lymphoma. Nature Communications 2024, 15. [Google Scholar] [CrossRef]
- Yamaguchi, S.; Isokawa, T.; Matsui, N.; Kamiura, N.; Tsuruyama, T. AI system for diagnosing mucosa-associated lymphoid tissue lymphoma and diffuse large B cell lymphoma using ImageNet and hematoxylin and eosin–stained specimens. PNAS Nexus 2025, 4. [Google Scholar] [CrossRef]
- Sereda, S.; Shankar, A.; Weber, L.; Ramsay, A.D.; Hall, G.W.; Hayward, J.; Wallace, W.H.B.; Landman-Parker, J.; Braeuninger, A.; Hasenclever, D.; et al. Digital pathology in pediatric nodular lymphocyte-predominant Hodgkin lymphoma: correlation with treatment response. 2023. [Google Scholar] [CrossRef]
- Motmaen, I.; Sereda, S.; Brobeil, A.; Shankar, A.; Braeuninger, A.; Hasenclever, D.; Gattenlöhner, S. Deep-learning based classification of a tumor marker for prognosis on Hodgkin’s disease. European Journal of Haematology 2023, 111, 722–728. [Google Scholar] [CrossRef]
- Soltane, S.; Alsharif, S.; Eldin, S.M.S. Classification and diagnosis of lymphoma’s histopathological images using transfer learning. Computer Systems Science and Engineering 2021, 40, 629–644. [Google Scholar] [CrossRef]
- Fu, Y.; Huang, Z.; Deng, X.; Xu, L.; Liu, Y.; Zhang, M.; Liu, J.; Huang, B. Artificial Intelligence in Lymphoma Histopathology: Systematic Review. J Med Internet Res 2025, 27, e62851. [Google Scholar] [CrossRef]
- Vrabac, D.; Smit, A.; Rojansky, R.; Natkunam, Y.; Advani, R.; Ng, A.; Fernandez-Pol, S.; Rajpurkar, P. DLBCL-Morph: Morphological features computed using deep learning for an annotated digital DLBCL image set. Scientific Data 2021, 8. [Google Scholar] [CrossRef]
- Hashimoto, N.; Takagi, Y.; Masuda, H.; Miyoshi, H.; Kohno, K.; Nagaishi, M.; Sato, K.; Takeuchi, M.; Furuta, T.; Kawamoto, K.; et al. Case-based similar image retrieval for weakly annotated large histopathological images of malignant lymphoma using deep metric learning. Medical Image Analysis 2023, 85, 102752. [Google Scholar] [CrossRef]
- Chuang, W.Y.; Yu, W.H.; Lee, Y.C.; Zhang, Q.Y.; Chang, H.; Shih, L.Y.; Yeh, C.J.; Lin, S.M.T.; Chang, S.H.; Ueng, S.H.; et al. Deep Learning-Based Nuclear Morphometry Reveals an Independent Prognostic Factor in Mantle Cell Lymphoma. The American Journal of Pathology 2022, 192, 1763–1778. [Google Scholar] [CrossRef]
Figure 1.
Number of publications per year (2016-2025) addressing AI applications in lymphoma histopathology.
Figure 1.
Number of publications per year (2016-2025) addressing AI applications in lymphoma histopathology.
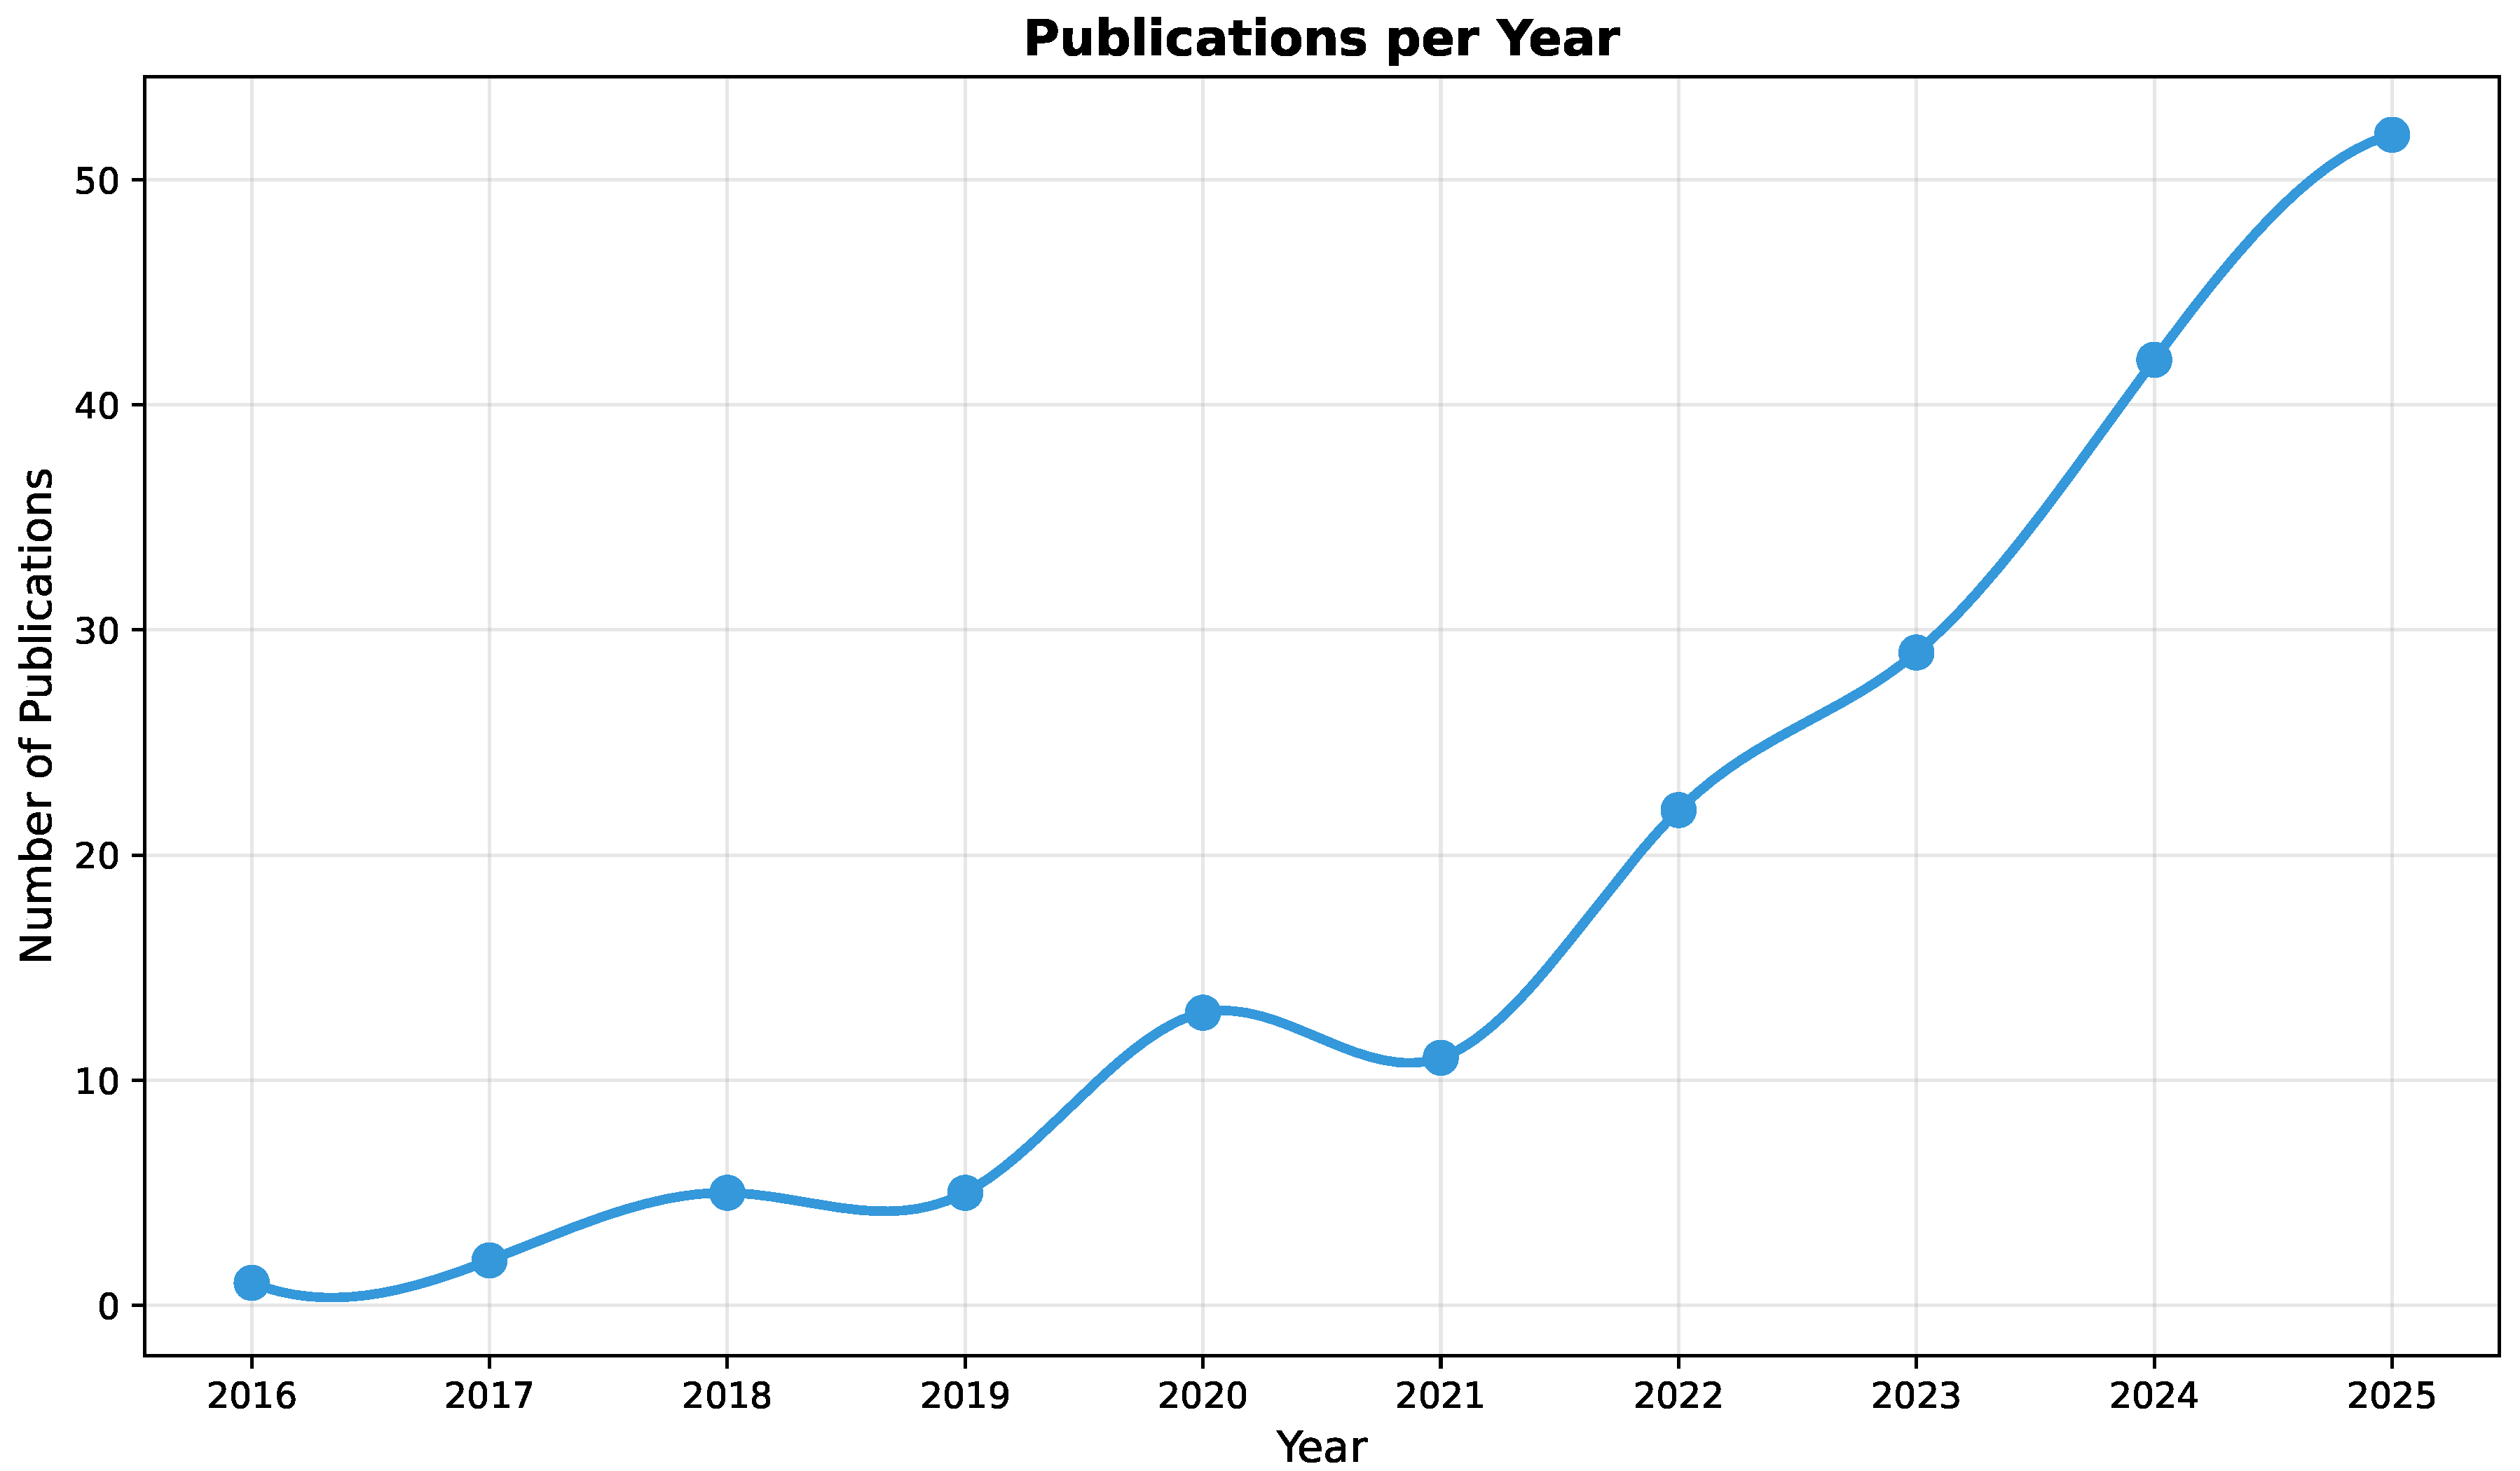
Figure 2.
Top 10 journals/sources by number of publications on AI applications in lymphoma histopathology.
Figure 2.
Top 10 journals/sources by number of publications on AI applications in lymphoma histopathology.
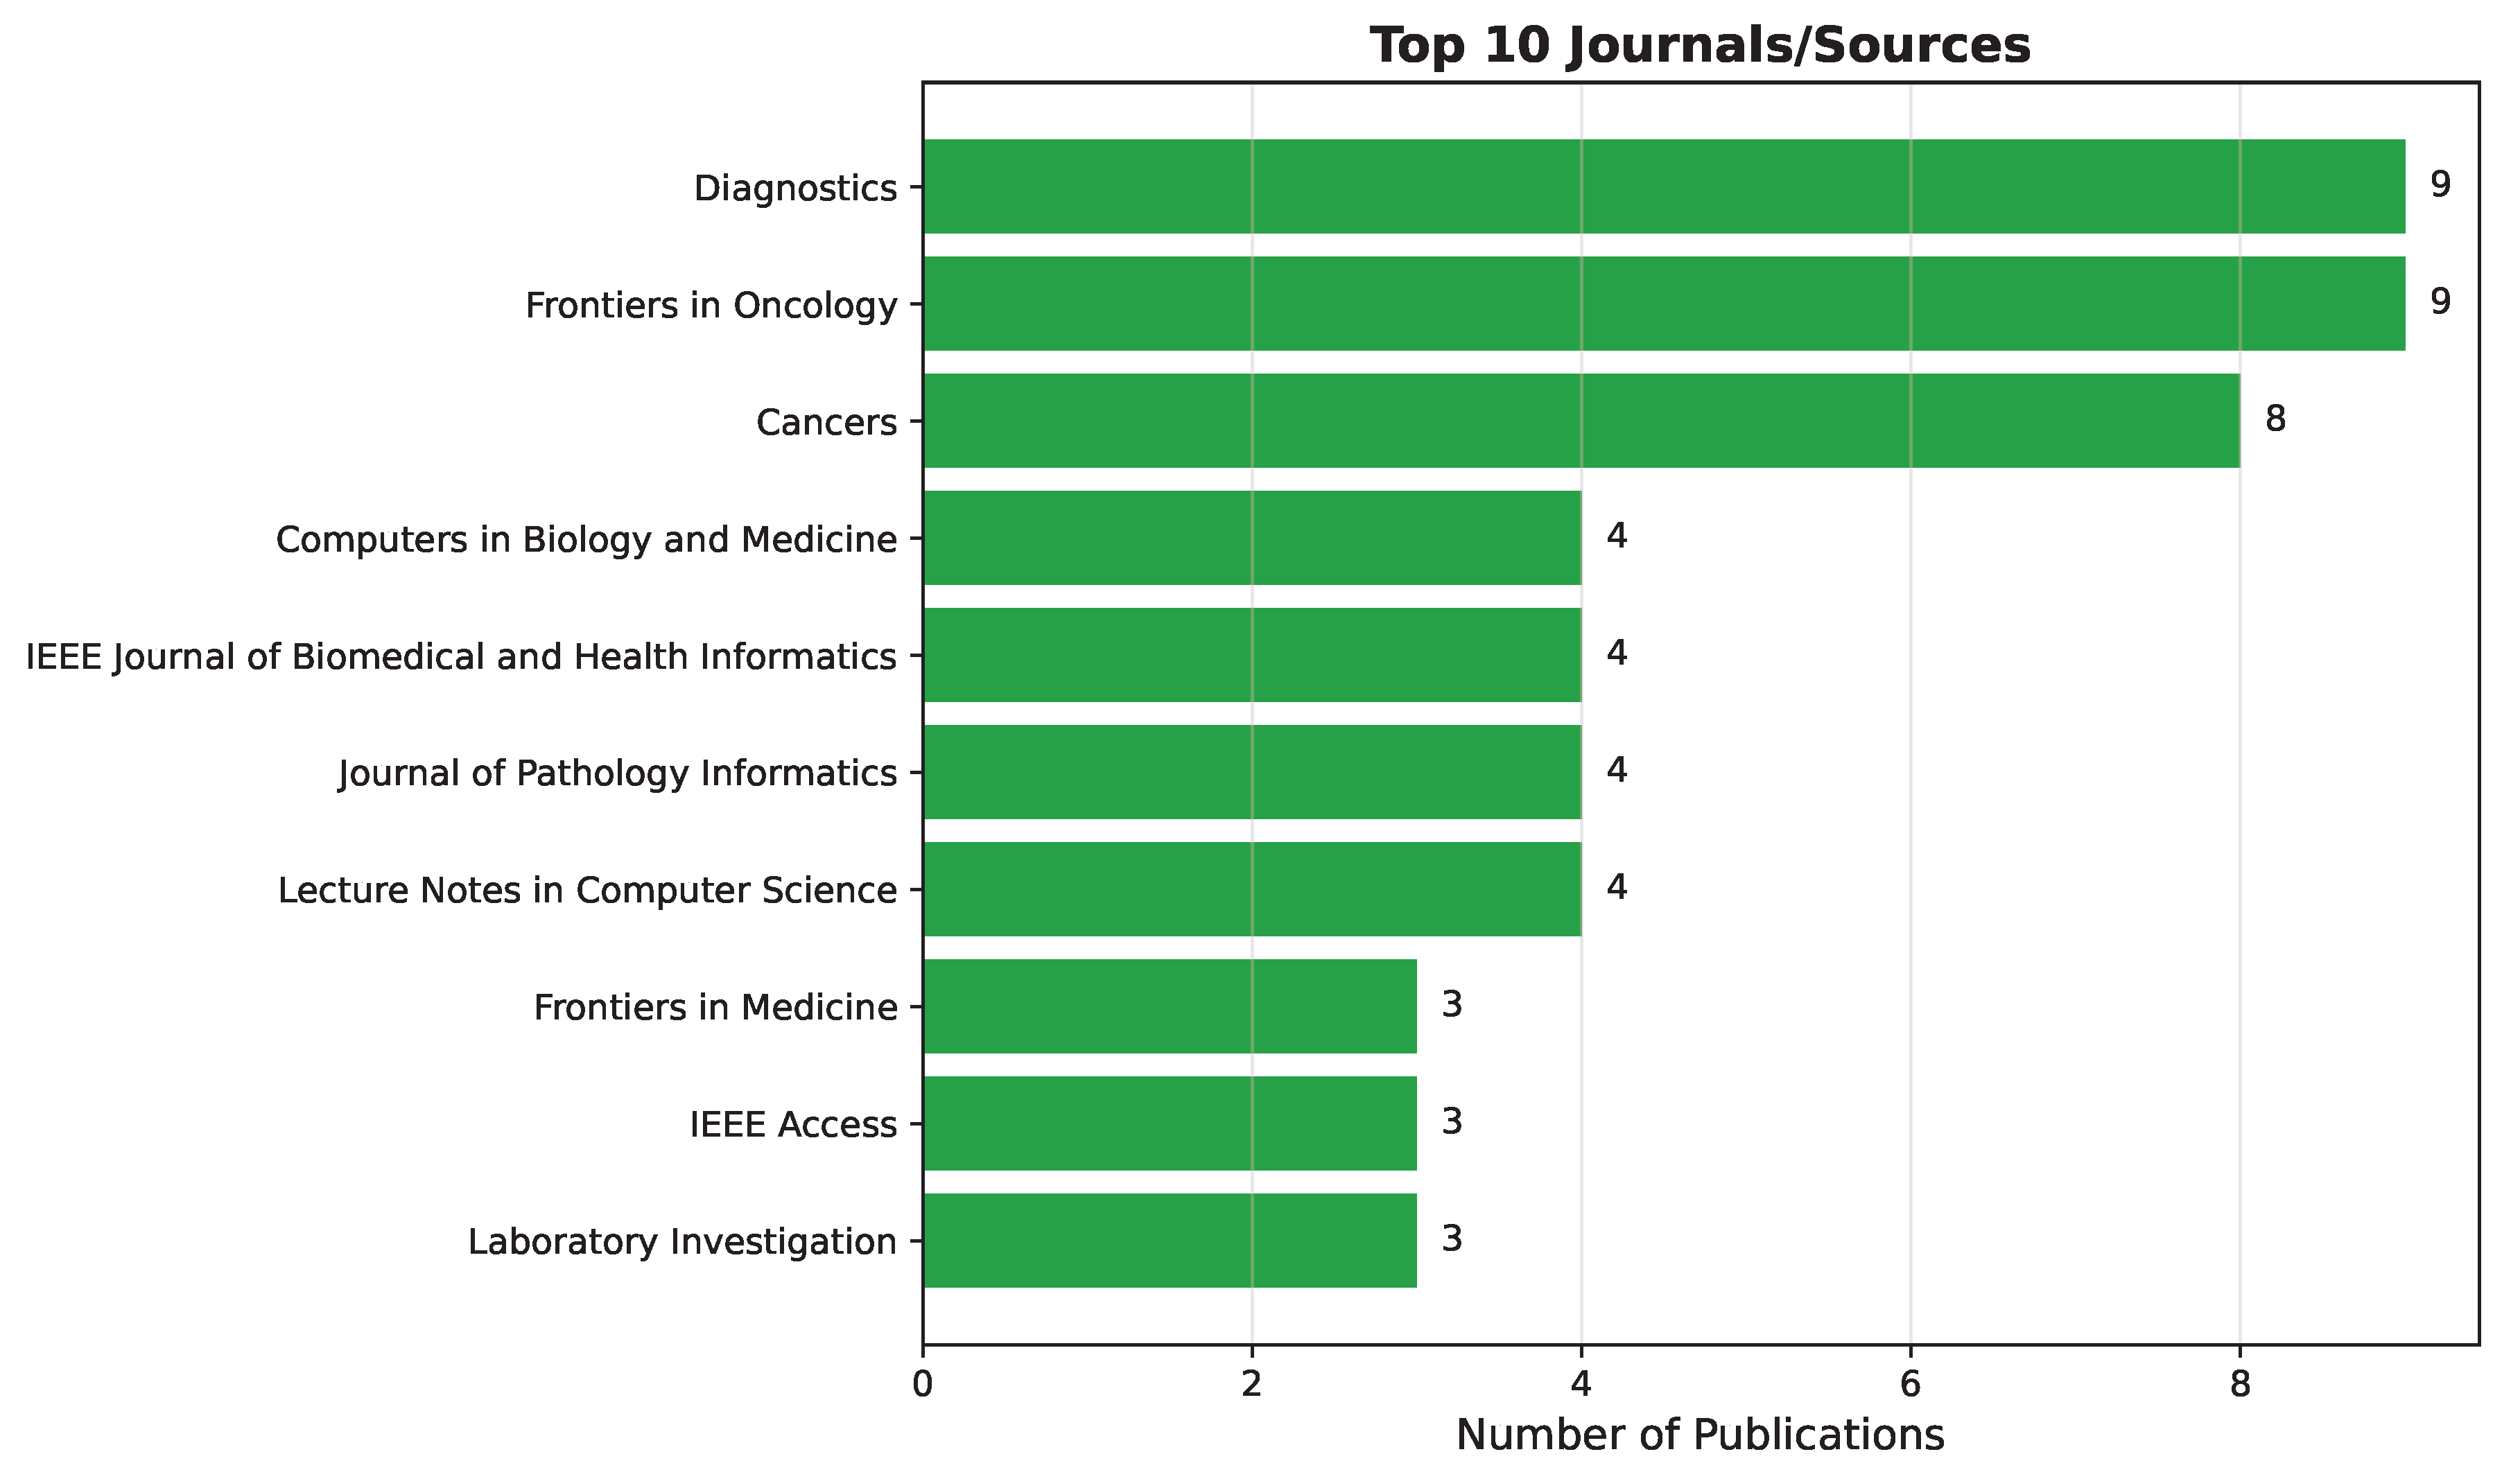
Figure 3.
Top 10 most frequently occurring keywords in publications on AI in lymphoma histopathology.
Figure 3.
Top 10 most frequently occurring keywords in publications on AI in lymphoma histopathology.
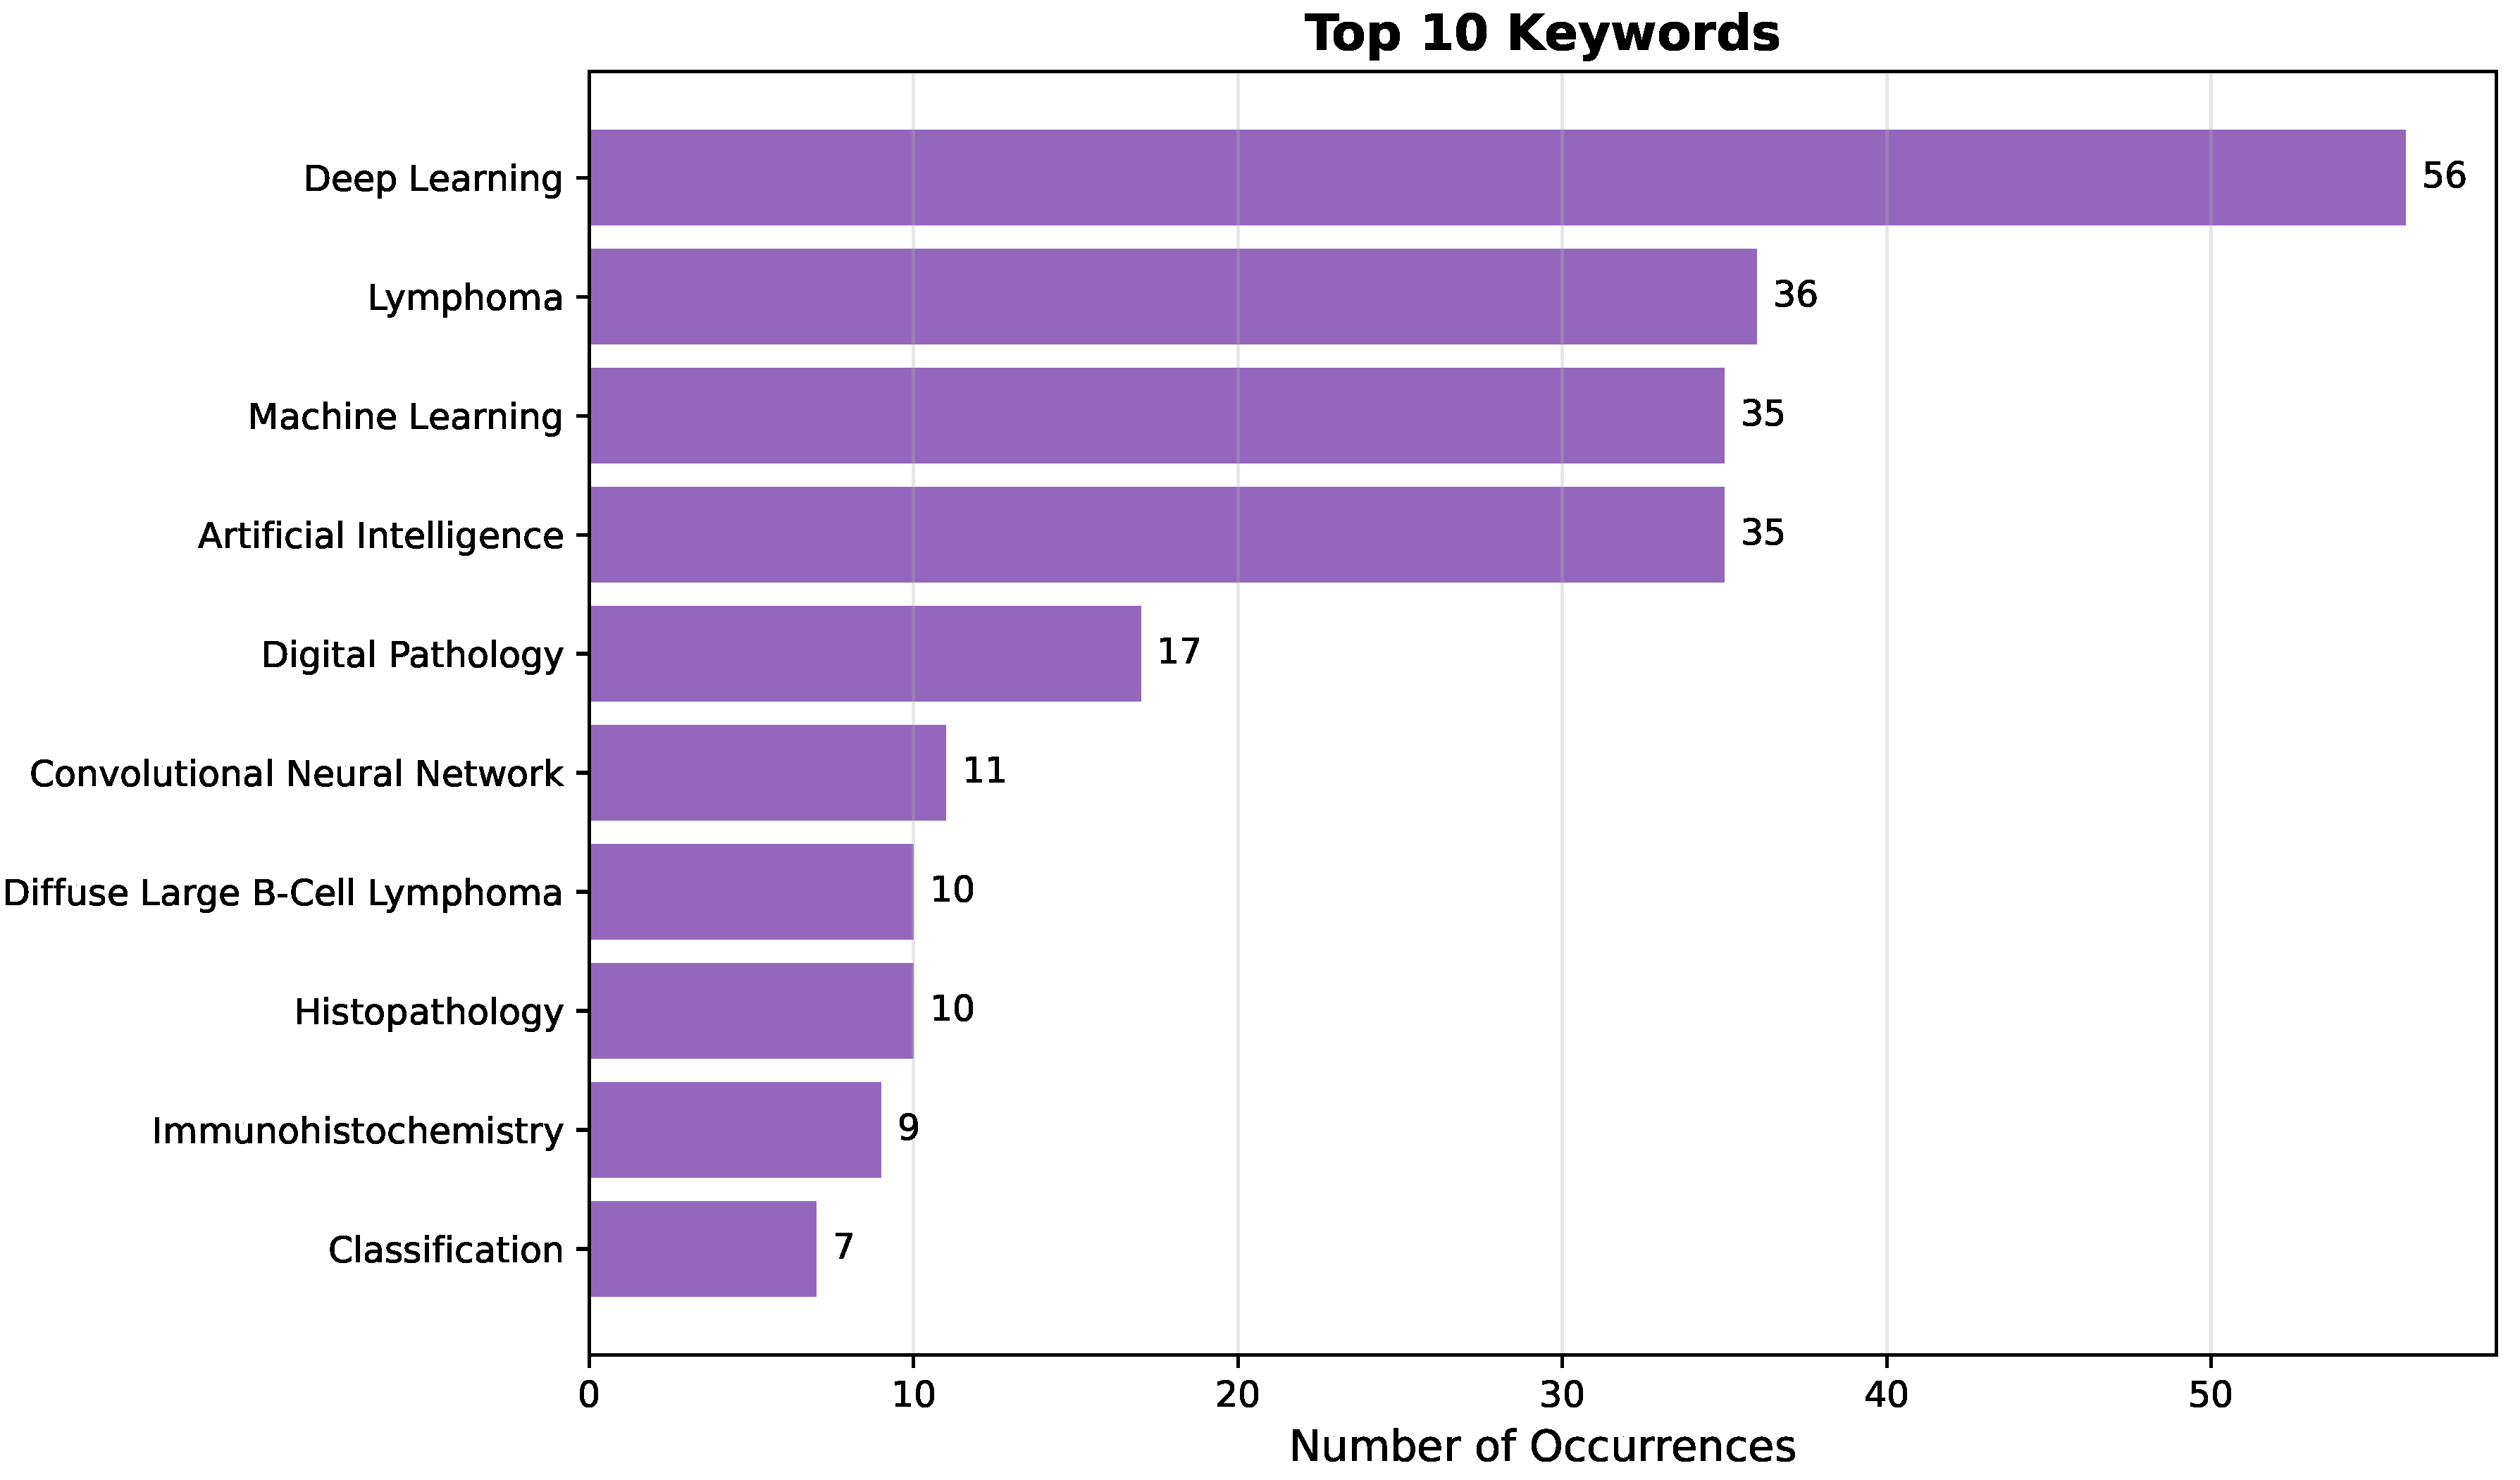
Disclaimer/Publisher’s Note: The statements, opinions and data contained in all publications are solely those of the individual author(s) and contributor(s) and not of MDPI and/or the editor(s). MDPI and/or the editor(s) disclaim responsibility for any injury to people or property resulting from any ideas, methods, instructions or products referred to in the content. |
© 2026 by the authors. Licensee MDPI, Basel, Switzerland. This article is an open access article distributed under the terms and conditions of the Creative Commons Attribution (CC BY) license (http://creativecommons.org/licenses/by/4.0/).
Copyright: This open access article is published under a Creative Commons CC BY 4.0 license, which permit the free download, distribution, and reuse, provided that the author and preprint are cited in any reuse.


