
Submitted:
04 February 2025
Posted:
04 February 2025
You are already at the latest version
Abstract
Acute Myeloid Leukemia (AML) is a complex hematologic malignancy where precise subtype classification is critical for targeted treatment and improved patient outcomes. This study explores the potential of ConvNeXt, an advanced convolutional neural network architecture, for high-resolution peripheral blood smear image classification into AML subtypes. The dataset from a specialized hematopathology center provides a diverse and representative sample, addressing gaps in global leukemia diagnostics. A comprehensive deep learning pipeline was developed, integrating Stochastic Weight Averaging (SWA) for stability, Mixup data augmentation for enhanced generalization, and Grad-CAM for interpretability, ensuring biologically meaningful feature visualization. The ConvNeXt model achieved a state-of-the-art accuracy of 95%, surpassing traditional CNNs (ResNet50, 91%) and transformer-based models (Vision Transformers, 81%), demonstrating its superior feature extraction and classification capabilities. Grad-CAM visualizations provided biologically interpretable heatmaps, enhancing trust in computational predictions and bridging the gap between AI-driven diagnostics and clinical decision-making. Additionally, ablation studies highlighted the contributions of data augmentation, optimizer selection, and hyperparameter tuning, reinforcing the model’s robustness and adaptability. This study advances the role of AI in hematopathology by combining high classification performance, explainability, and scalability, paving the way for equitable and efficient AML diagnostics. Using clinically aligned evaluation metrics (accuracy, F1-score, and ROC-AUC) ensures its practical applicability, establishing a strong foundation for future AI-driven leukemia classification across diverse and underrepresented populations.
Keywords:
ConvNeXt
; CNN
; Grad-CAM
; Histopathological Images
; Multi-Class Classification
; Prostate Cancer
; Sub-Saharan Africa
1. Introduction
Acute Myeloid Leukemia (AML) is a heterogeneous hematologic malignancy characterized by the rapid proliferation of abnormal white blood cells, leading to impaired normal blood cell production [1]. Accurate identification and classification of AML subtypes are crucial for determining appropriate treatment strategies [2], as different subtypes exhibit distinct clinical behaviors and prognoses. Traditionally, AML diagnosis relies on manual examination of peripheral blood smears under a microscope [3]—a time-consuming, subjective process dependent on expert pathologists [4]. With advances in deep learning, there is a growing potential to develop automated and highly accurate systems for AML subtype classification, especially using high-resolution morphological data from peripheral blood smears.
ConvNeXT, developed in 2022 by researchers at Meta AI, represents a leap forward in convolutional neural network (CNN) architecture, particularly for computer vision tasks [5]. It was designed to bridge the gap between traditional CNNs and emerging Transformer-based architectures. It offered a model that maintains the efficiency and interpretability of CNNs while incorporating enhancements that align with the strengths of Transformer models. ConvNeXT integrates modern design principles, such as layer normalization and depthwise convolutions, that enable it to excel in capturing fine-grained details in high-resolution images [5]. This architectural refinement makes ConvNeXT especially suitable for complex visual analysis tasks, such as disease classification in medical imaging. Despite its recent development, ConvNeXT has demonstrated superior performance in benchmark computer vision tasks, often surpassing models like ResNet, ViT, and EfficientNet in accuracy and computational efficiency [5]. However, its application in specialized medical domains, particularly in hematopathology for AML subtype classification, remains largely unexplored. Leveraging ConvNeXT for this study provides a novel approach to AML classification, offering the potential for enhanced accuracy and interpretability that could address the nuanced morphological variations between AML subtypes. By applying ConvNeXT to high-resolution peripheral blood smear images, this study aims to unlock its potential in hematopathology, marking a pioneering step in using this state-of-the-art architecture to aid in AML detection and subtype classification.
This study aims to harness the advanced capabilities of the ConvNeXT model for robust, interpretable, and clinically applicable AML subtype classification. By optimizing ConvNeXT on high-resolution peripheral blood smear images, we seek to elevate its performance in distinguishing between AML subtypes and healthy controls, addressing a critical need for precision in hematopathology diagnostics. Key objectives of this study are:
To adapt and fine-tune ConvNeXT for AML subtype classification, ensuring it captures the nuanced morphological differences in blood smears.
To apply Grad-CAM and related explainability techniques that allow visualization of the specific morphological features ConvNeXT uses for classification.
To rigorously test the model’s performance across variable image quality, ensuring its consistency and dependability for real-world clinical applications.
Through these objectives, this study aims to set a new benchmark in applying deep learning for hematopathology, demonstrating ConvNeXT’s potential to transform AML diagnosis and subtype classification. This work pioneers the use of ConvNeXT in hematopathology and highlights its practical implications for improving diagnostic precision and guiding clinical decision-making in AML treatment.
2. Related Studies
The application of deep learning in hematopathology has shown promise in automating blood cell classification, with early works by Wang et al. [6] and Rehman et al. [7] using Convolutional Neural Networks (CNNs) to distinguish between normal and abnormal cells. However, these models faced challenges with nuanced tasks like AML subtype classification, which is complex due to the disease’s heterogeneous nature. Traditional AML classification relies on expert assessments, but few studies, such as Gerstung et al. [8], have used high-resolution blood smear images, which offer a more accurate diagnostic potential.
Advanced CNN architectures like VGGNet, ResNet, and DenseNet Litjens et al. [9] have been applied in medical imaging but often must capture complex feature hierarchies necessary for high-resolution images. Transformer-inspired models, such as Vision Transformer Azad et al. [10], have emerged as more capable alternatives. ConvNeXT, introduced by Liu et al. [5], integrates features from both ConvNets and transformers, achieving state-of-the-art performance in image classification tasks, including histopathological imaging Zhang et al. [11].
ConvNeXT’s adaptability extends to applications in breast cancer research, where deep learning models have shown promise in distinguishing benign from malignant findings in breast ultrasound (BUS) images. For instance, Yap et al. [12] applied deep learning methods for BUS image classification, demonstrating the efficacy of models like ConvNeXT in handling high-dimensional radiomic features within noisy, high-resolution medical data. Using explainable AI techniques, such as Grad-CAM, Yap et al. provided insights into regions of malignancy focus, highlighting ConvNeXT’s potential for translational applications in hematopathology, where subtle morphological differences and noise are common. This adaptability underscores ConvNeXT’s capacity to handle complex visual distinctions essential for disease classification across various medical imaging contexts.
ConvNeXT has been further utilized in digital pathology to analyze histopathological images for cancer diagnosis and classification [13]. Its hierarchical design is well-suited for capturing intricate tissue structures and morphological features, which are essential in histopathology. This adaptability highlights ConvNeXT’s potential for AML subtype analysis, where similar structural complexities exist at the cellular level, underscoring its utility for tasks involving fine-grained visual differentiation.
Robustness and interpretability are critical in medical imaging applications, and recent studies have used ConvNeXT with explainable AI techniques like Grad-CAM to enhance transparency in model decision-making [14]. This is particularly relevant in hematopathology, where understanding a model’s focus can reinforce clinician confidence and reveal disease-specific features. These explainability techniques align with clinical needs by making model predictions interpretable, enabling hematopathological models to support pathologists in diagnostic decision-making.
Comparative studies between ConvNeXT and transformer-based architectures, including Vision Transformers (ViTs), indicate that ConvNeXT can achieve comparable or superior results across various medical imaging tasks [5]. Its combination of traditional CNN principles with transformer-inspired elements enables effective high-resolution image processing, essential in medical applications like AML classification. These comparisons underscore the versatility of ConvNeXT in capturing detailed morphological features while retaining interpretability, highlighting its suitability for tasks demanding both high accuracy and clinical relevance.
Explainable AI techniques, like Grad-CAM and Integrated Gradients, are increasingly vital for interpreting model predictions and ensuring hematopathological transparency [15]. Azizi et al. [16] emphasize robustness testing, essential to validating model performance across diverse image qualities. Esteva et al. [17] and Elhage et al. [18] demonstrate that integrating clinical data, such as patient demographics, enhances model performance, providing a comprehensive view of AML diagnosis.
While Matek et al. [19] showed promise with CNNs in AML classification, they faced limitations with handling multiple subtypes. The recent availability of larger datasets, like the one from TCIA, presents an opportunity to leverage ConvNeXT for improved subtype classification and generalizability. However, gaps in applying advanced CNNs to AML subtype classification, especially concerning explainability, robustness, and clinical metadata integration, indicate a need for further research.
3. Materials and Methods
3.1. Workflow of the Proposed Approach
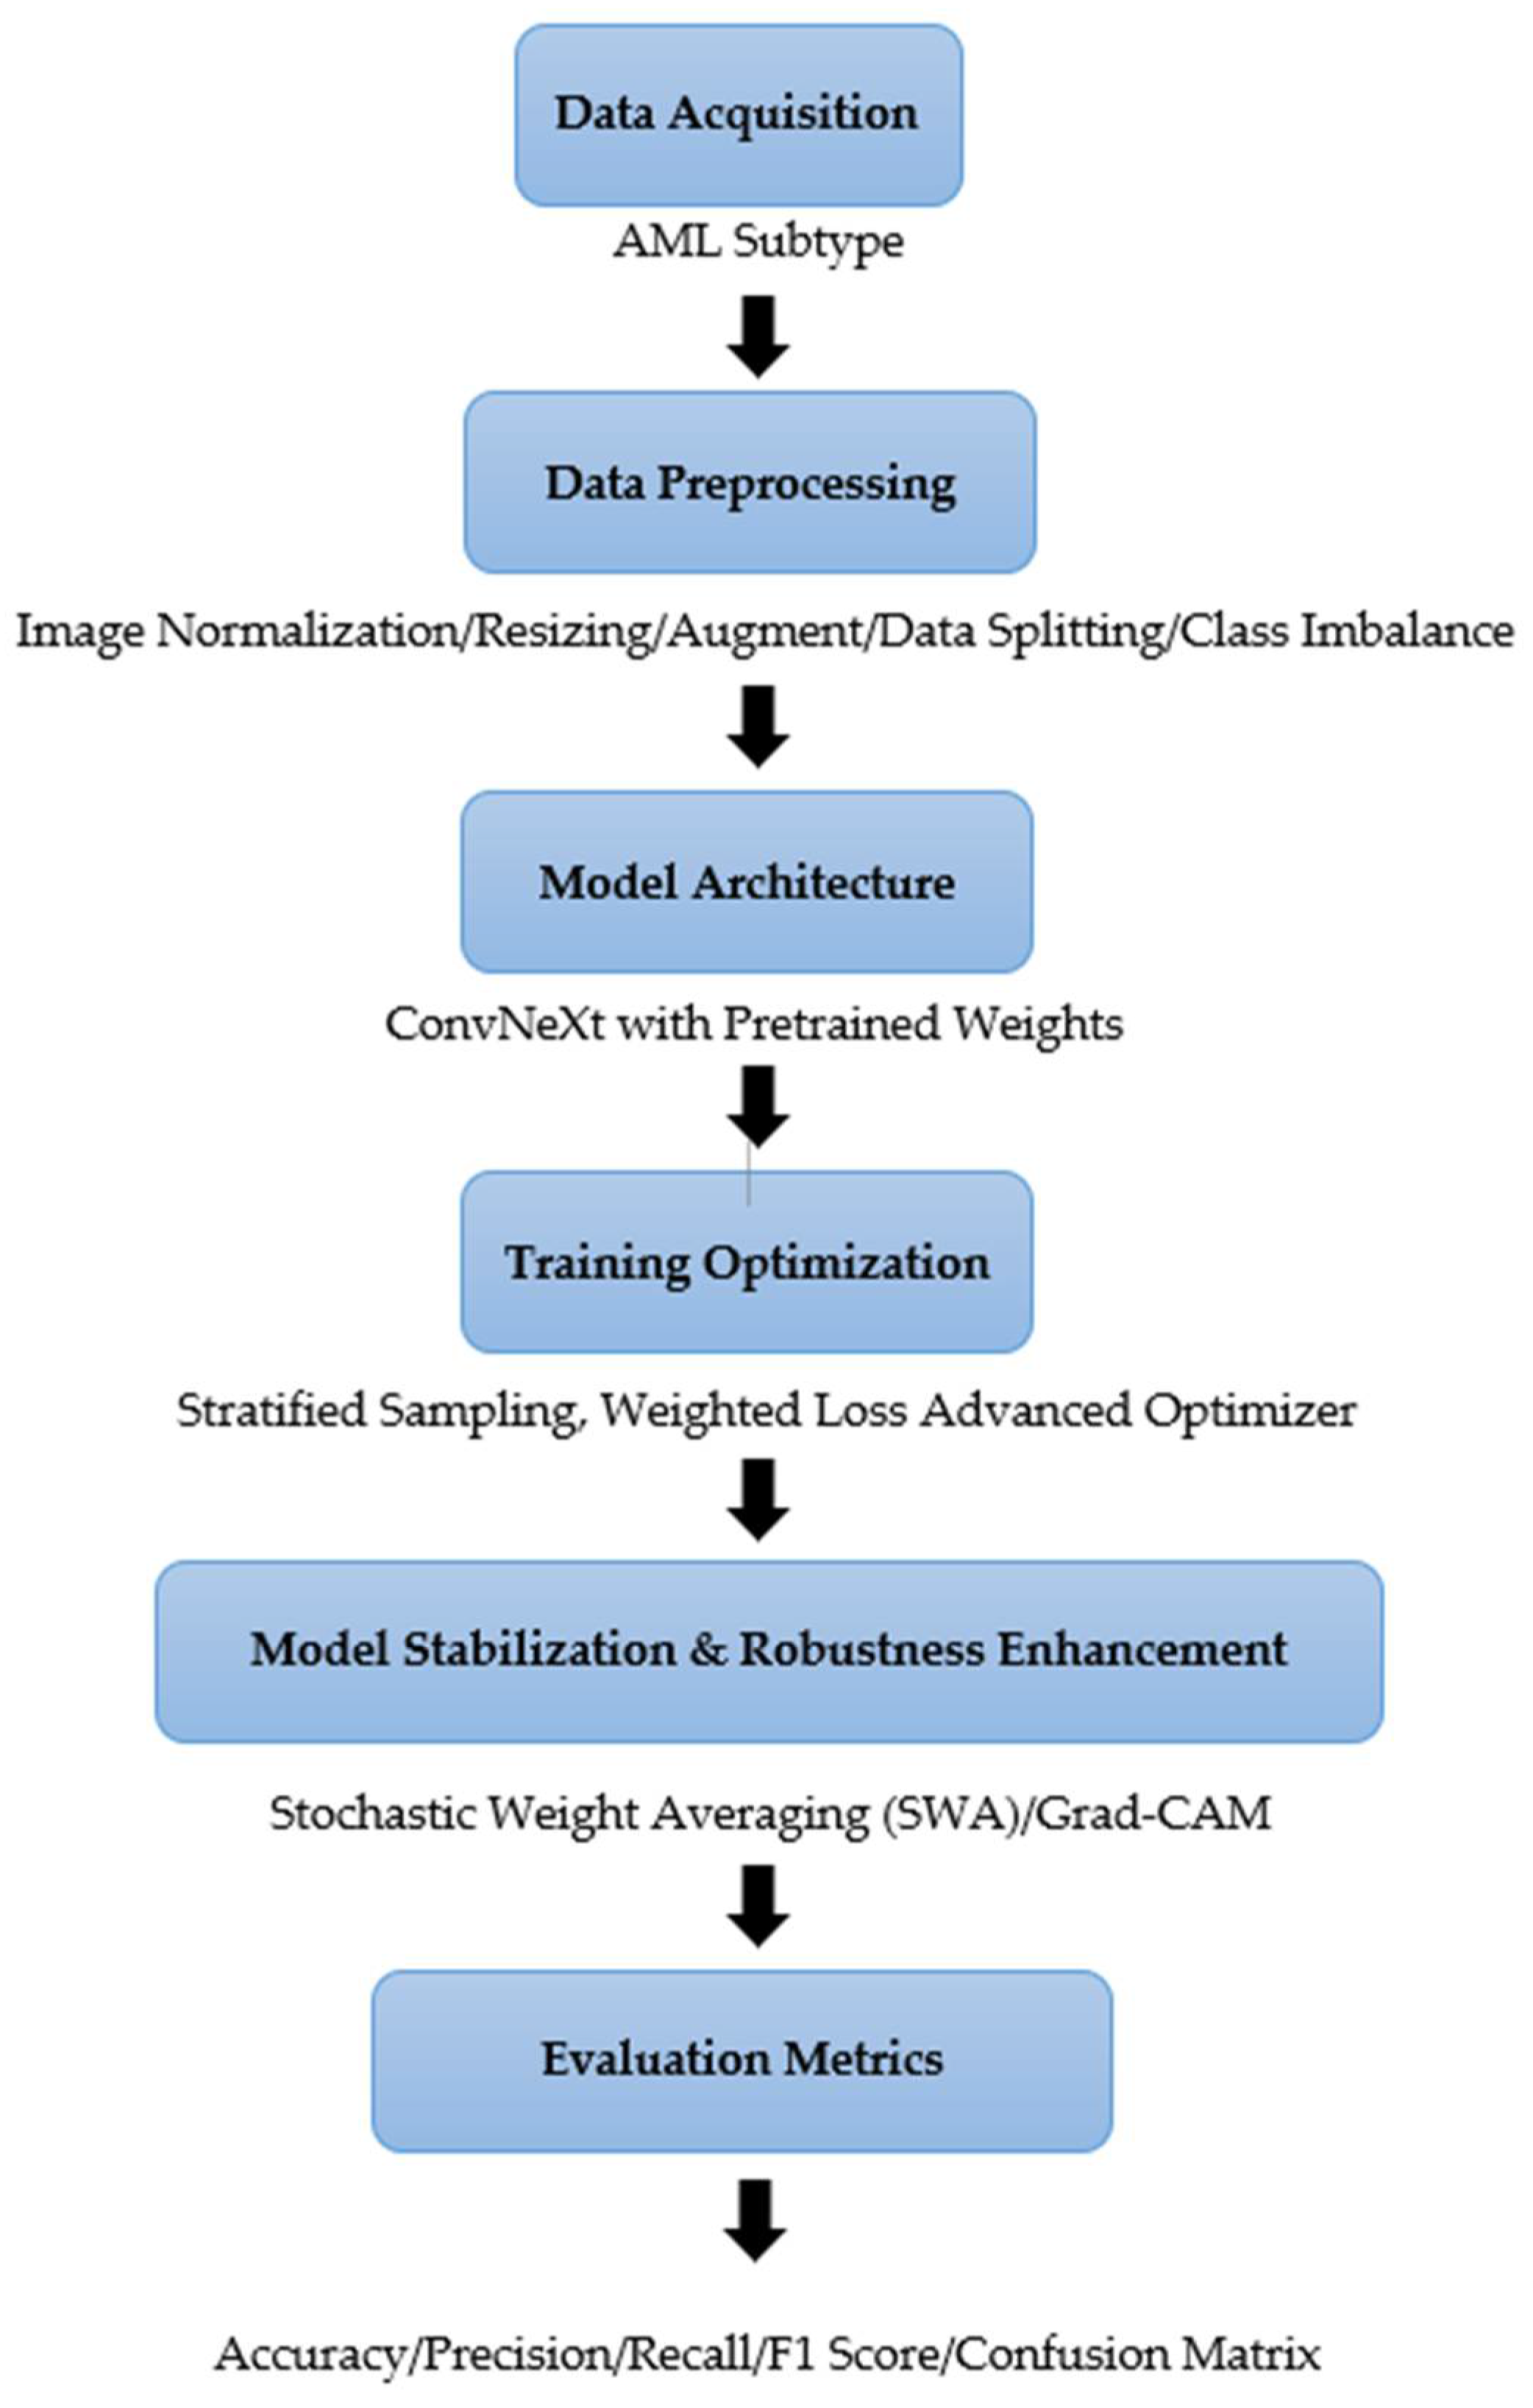
Figure 1 outlines the various steps in conducting our experiments, including obtaining histopathological data, preprocessing the data, designing the model, training and optimizing it, evaluating it, and interpreting it.
Figure 1.
The Workflow of the Proposed Approach.
3.2. Dataset Description
The dataset used for this study is the “AML-Cytomorphology_MLL_Helmholtz” dataset from The Cancer Imaging Archive (TCIA) [20]. This dataset provides a comprehensive collection of high-resolution peripheral blood smear images for 189 patients, including four AML subtypes and healthy controls, as shown in Table 1.
Among the 189 patients, 112 males and 77 females, aged 19 to 86 years, offer a diverse demographic representation. The dataset contains approximately 81,214 TIF images scanned at 10x and 40x magnification, capturing morphological details of 99-500 white blood cells per patient. Only 1000 images from each class were eventually used to complement computational power. This provides a rich set of morphological variations necessary for accurate AML subtype classification.
In addition to the imaging data, accompanying clinical metadata—including patient age, sex, and blood counts—is available in a separate .csv file. This enables future integration of multi-modal data analysis to enhance classification and analysis.

Table 1.
Data Description of the AML Subtypes.
| AML Subtype/Group | Number of Patients | Total Images | Magnification | Average WBC Images per Patient | Key Morphological Features |
| APL with PML: RARA fusion gene | 189 | 11584 | 10x, 40x | 99-500 | Prominent Auer rods |
| AML with NPM1 mutation | 189 | 17710 | 10x, 40x | 99-500 | Granular cytoplasm |
| AML with CBFB: MYH11 fusion (without NPM1 mutation) | 189 | 17214 | 10x, 40x | 99-500 | Abnormal eosinophil precursors |
| AML with RUNX1: RUNX1T1 fusion | 189 | 14403 | 10x, 40x | 99-500 | Fine chromatin |
| Non-Malignant Controls | 189 | 20303 | 10x, 40x | 99-500 | Normal morphology |
APL - Acute Promyelocytic Leukemia, PML - Promyelocytic Leukemia gene, RARA - Retinoic Acid Receptor Alpha gene, NPM1 – Nucleophosmin, CBFB - Core-Binding Factor Beta, MYH - Myosin Heavy Chain, RUNX1 - Runt-Related Transcription Factor 1.
3.3. Data Preprocessing
The images for this study were preprocessed using a series of transformations to standardize the input data, enhance the training process, and improve model generalization [21,22]. Given the high-resolution morphological data from peripheral blood smears, preserving the intricate cellular details that distinguish different AML subtypes was essential. This is fundamental in preparing the high-resolution AML images for ConvNeXT, maximizing the model’s capacity to learn the subtle morphological distinctions between AML subtypes accurately.
3.3.1. Image Normalization and Resizing
All images were resized to a uniform dimension of 224x224 pixels, a standard input size for ConvNeXT, ensuring compatibility with the model’s architecture while maintaining critical morphological features. Normalization was applied by scaling pixel values to a range based on the ImageNet dataset’s mean and standard deviation ([0.485, 0.456, 0.406] for mean and [0.229, 0.224, 0.225] standard deviation). This normalization aligns each image’s pixel intensity distribution, accelerating model convergence by providing consistent input data across the dataset [23]. Normalization was performed using mean and standard deviation values based on the ImageNet dataset.
where:
is the normalized image,
is the original image pixel value,
is the mean pixel intensity,
is the standard deviation of pixel intensities.
This normalization ensures that the input images have a mean of zero and a standard deviation of one, accelerating convergence during model training.
3.3.2. Data Augmentation for Enhanced Generalization
Various data augmentation techniques were applied, given the heterogeneous nature of AML subtypes and the potential for model overfitting due to limited data [24,25]. These augmentations aimed to introduce variability, improving the model’s generalization ability and reducing dependence on specific image patterns. The augmentation methods included:
Random Rotation: Images were rotated randomly within a range of ±20 degrees to account for minor rotations that might occur during slide preparation and imaging. Images were randomly rotated within ±20°, modeled mathematically as:
where
is the rotation matrix.
Color Jittering: Adjustments were applied to brightness, contrast, saturation, and hue to simulate variations in staining intensity and image brightness. This augmentation helps the model become invariant to slight color differences, ensuring it focuses on morphological rather than color featuresAdjustments were made to brightness
, contrast
, and saturation using S:
.
where
controls contrast and
adjusts brightness
Mixup Augmentation: The mixup technique further expanded the dataset’s diversity by creating synthetic images. This technique combines two images and their labels, enhancing the model’s capacity to handle ambiguous cases and preventing overfitting. Two images
and
were combined using:
where
for
.
3.3.3. Quality Control Measures
To ensure dataset integrity and reliable model training, several quality control measures were implemented:
- ∙ Color Consistency: Histogram equalization was applied to mitigate variability in staining intensity, ensuring consistent color representation.
- ∙ Outlier Removal: Images with atypical characteristics (e.g., artifacts or background noise) were flagged and excluded
3.3.4. Class Balancing
Due to the inherent imbalance within the AML subtypes in the dataset, achieving class balancing was essential to reduce potential model bias and improve classification performance across all categories [26]. To address this, we systematically applied augmentation techniques targeting the underrepresented subtypes. These included random rotations to simulate different viewing angles, horizontal and vertical flips to enhance spatial diversity, resized cropping to introduce scale variations, and color jittering to mimic real-world imaging variations in color and brightness. By increasing both the quantity and diversity of samples within the minority classes, these augmentations ensured that each subtype was equally represented in the training dataset. This approach minimized the risk of the model disproportionately favoring any subtype and facilitated balanced learning, enhancing the model’s robustness and generalizability to unseen data. Consequently, this balanced representation contributed to consistent classification performance, ensuring the model could reliably differentiate between all AML subtypes.
3.4. Model Architecture and Implementation
3.4.1. ConvNeXT Architecture Overview
ConvNeXT’s architecture is organized into hierarchical stages, each responsible for processing different levels of spatial detail:
- Stem Block: The model begins with a stem block that reduces the image dimensions while preserving important details. This block employs standard convolutions, down-sampling the input image to produce a compact yet rich representation of the features [27]. For our study, each input image was resized to 224x224 pixels, which fits ConvNeXT’s default input dimensions.
- Hierarchical Stages: ConvNeXT is divided into four stages, where each stage consists of several “ConvNeXT blocks” that apply convolutions and normalization to refine features progressively [5]. Each stage operates at a different spatial resolution, capturing fine-grained and high-level patterns. The stages are:
Stage 1: Extracts low-level features, such as edges and basic shapes.
Stage 2: Detects more complex patterns, focusing on structures within cells.
Stage 3: Identifies higher-order features like clusters and cellular arrangements relevant for distinguishing AML subtypes.
Stage 4: Focuses on global context, combining all previous features for a comprehensive view.
- ConvNeXT Blocks: Each stage consists of ConvNeXT blocks, which replace traditional CNN layers with depthwise convolutions and layer normalization. These blocks allow the model to learn spatial dependencies within local regions, making it effective for high-resolution medical images where local details are crucial for accurate classification.
- Layer Normalization and GELU Activation: Layer normalization is applied throughout the model to stabilize the learning process. Gaussian Error Linear Units (GELU) activation functions provide non-linear transformations, enhancing the model’s ability to learn complex patterns. This combination reduces the risk of vanishing or exploding gradients, making ConvNeXT robust and effective for deep-learning tasks.
The ConvNeXt model was adapted for multi-class classification by replacing the default classifier head with a fully connected layer featuring five output neurons. A softmax activation function was applied to generate class probabilities. Pre-trained weights from ImageNet (IMAGENET1K_V1) were utilized for faster convergence and superior feature extraction, aligning the model with the specific requirements of hemathological analysis.
3.4.2. Classification Head
The final stage of ConvNeXT is followed by a classification head, which consists of a global average pooling layer and fully connected (FC) layers [5]. In our study, the default classification head was modified to accommodate our specific task:
- Global Average Pooling: This layer reduces the spatial dimensions of the feature map, aggregating the most informative aspects of the detected features into a single representation for each feature channel.
- Fully Connected Layer: We replaced the default fully connected layer with one tailored to our classification task. The final layer in the ConvNeXT model was modified to output five neurons corresponding to the four AML subtypes (CBFB-MYH11, RUNX1-RUNX1T1, PML-RARA, MLL-AF9) and healthy controls. This layer uses a softmax activation function to produce a probability distribution over the classes, enabling multi-class classification.
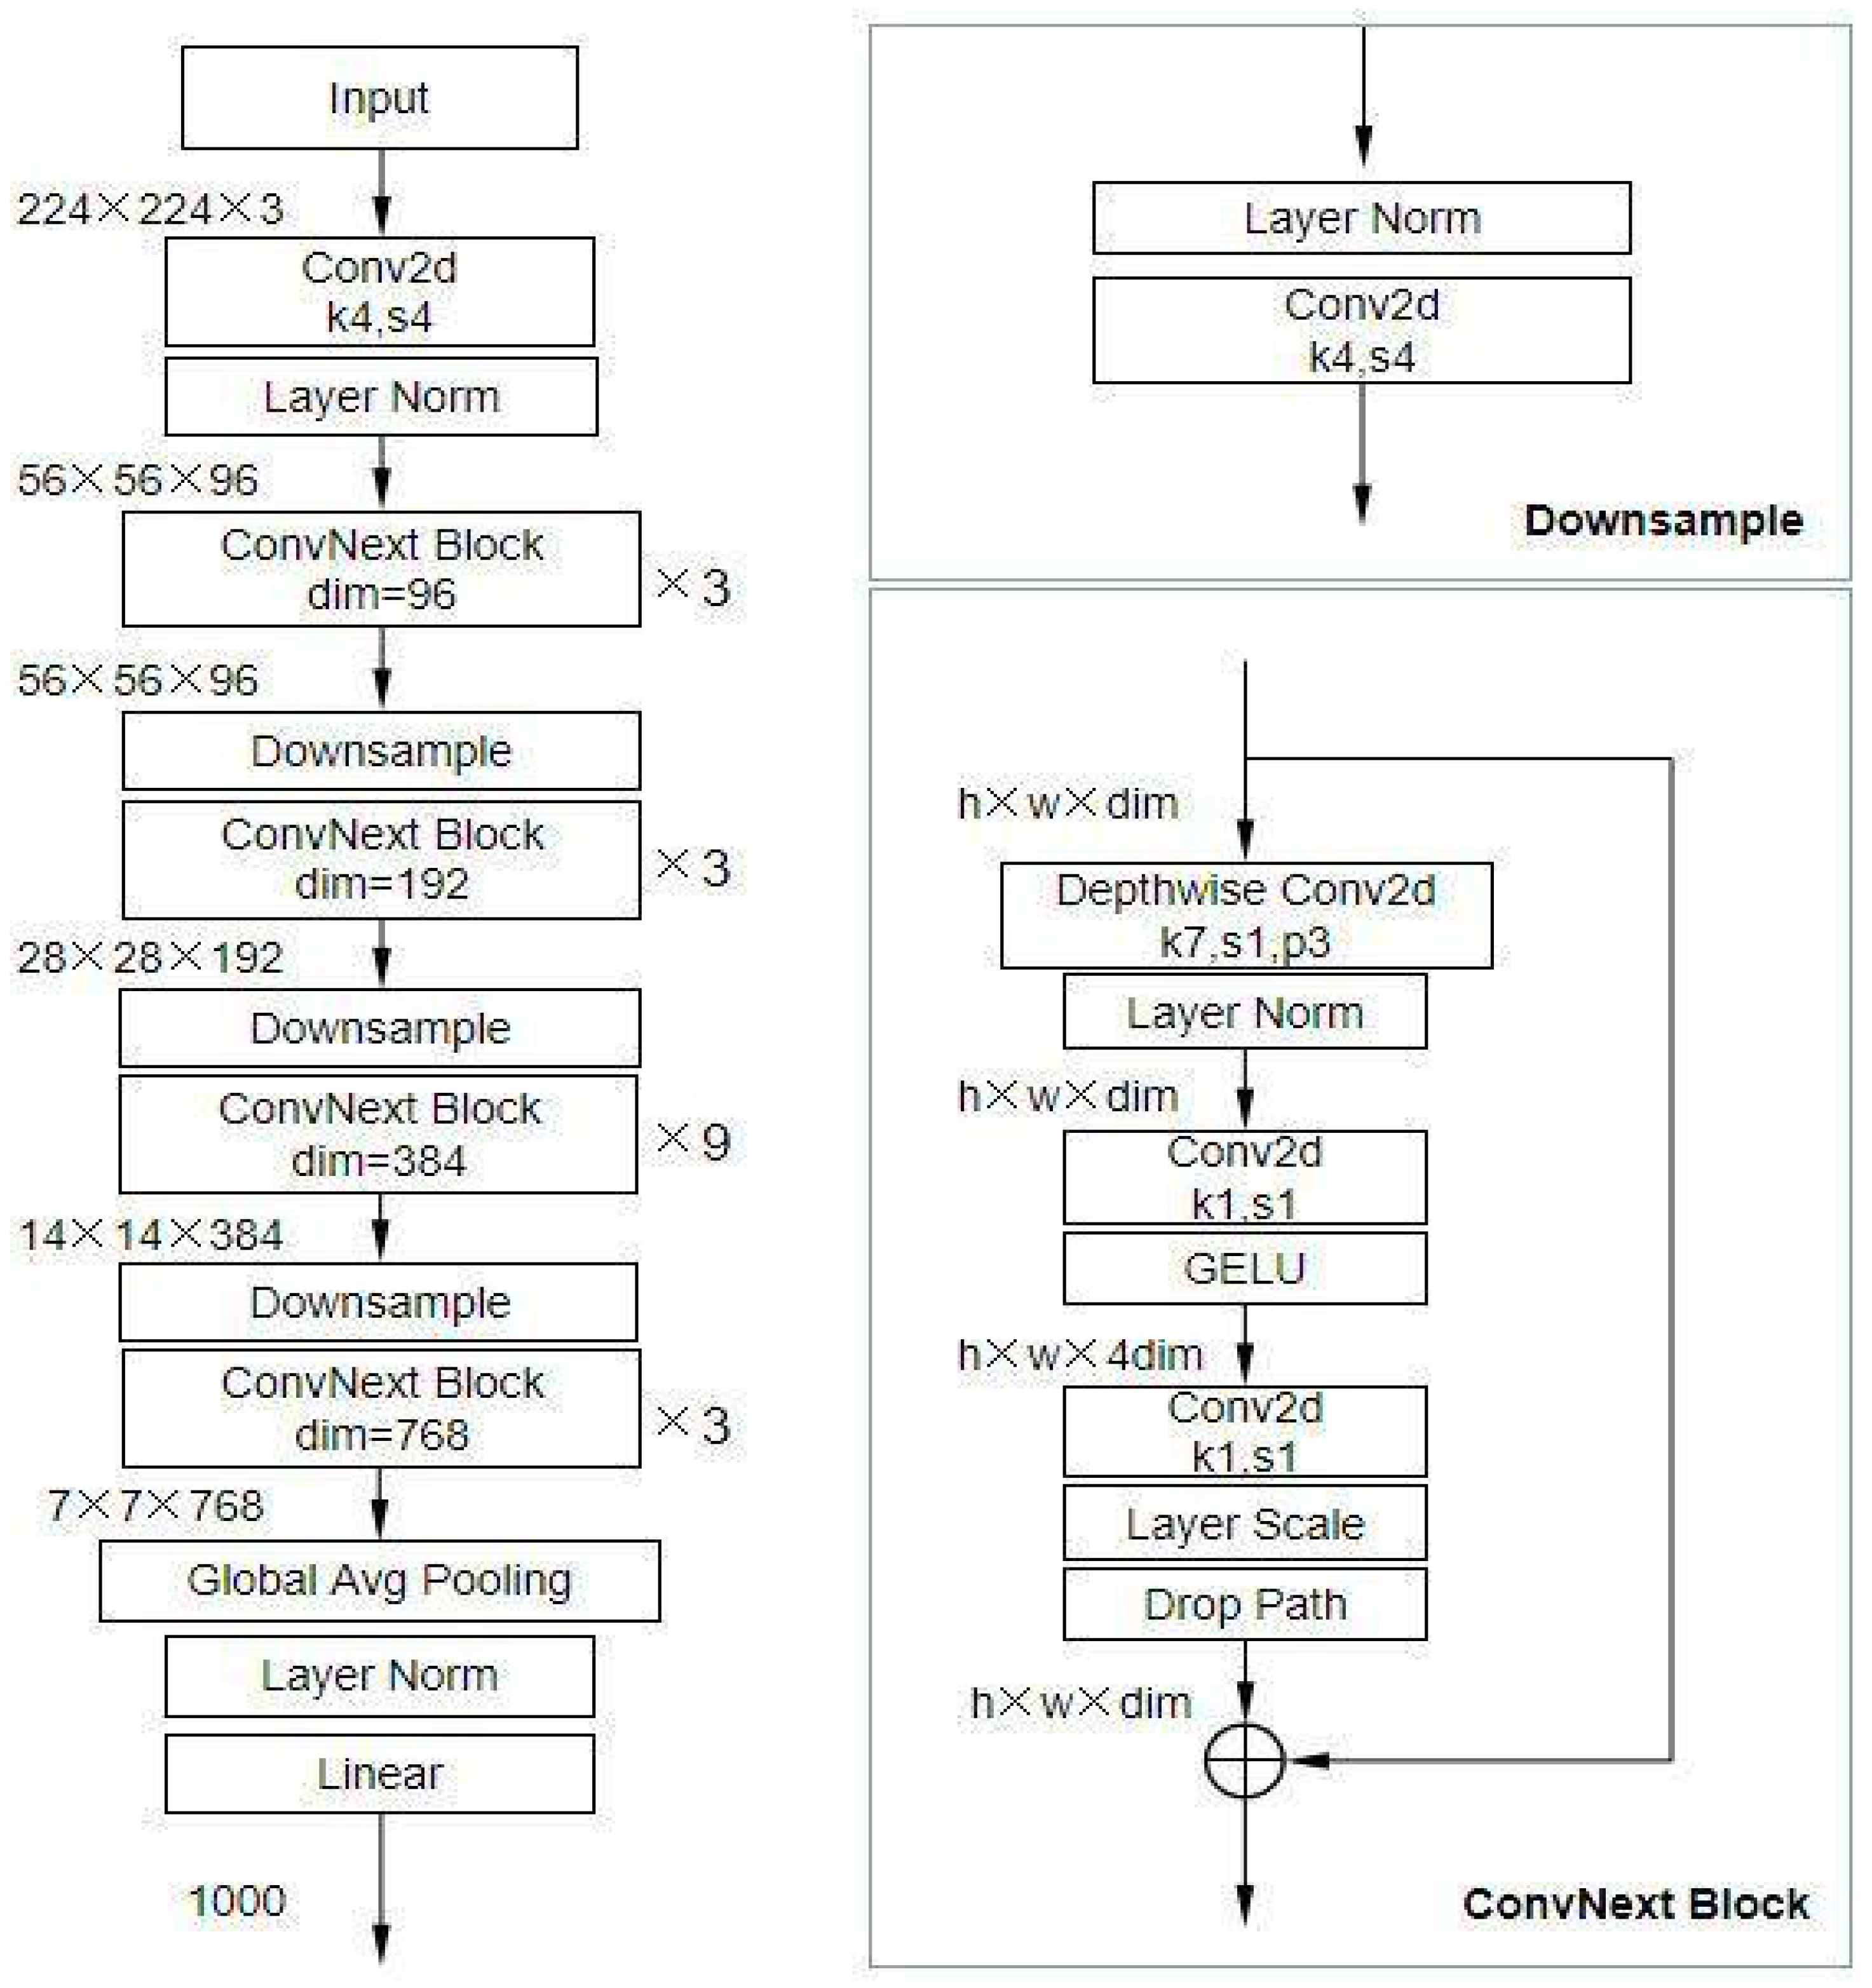
Figure 2 shows the architecture overview of the ConvNeXt model.
Figure 2.
Architecture Overview of ConvNeXT [28].
Figure 2.
Architecture Overview of ConvNeXT [28].
3.4.3. Modifications for Multi-Class Classification
The ConvNeXt model architecture, as adapted for this study, is summarized in Table 2. This architecture builds upon the ConvNeXt-Base variant, leveraging depthwise separable convolutions and large kernel sizes for efficient spatial feature extraction.
Table 2.
ConvNeXt Model Structure for Prostate Cancer Classification.
| Layer Type | Input Size | Output Size | Parameters | Description |
| Input Layer | 384×384×3 | 384×384×3 | 0 | Accepts resized and normalized histopathological images. |
| Stem Convolution Block | 384×384×3 | 192×192×64 | 9,408 | Downsamples input and extracts initial features. |
| ConvNeXt Block 1 (3 layers) | 192×192×64 | 96×96×128 | 0.6M | Extracts spatial features using large kernels. |
| Downsampling Layer 1 | 96×96×128 | 48×48×256 | 33K | Reduces spatial dimensions while increasing feature depth. |
| ConvNeXt Block 2 (6 layers) | 48×48×256 | 24×24×512 | 6.4M | Captures higher-level features with reduced spatial resolution. |
| Downsampling Layer 2 | 24×24×512 | 12×12×1024 | 131K | Further downsampling to deepen feature maps. |
| ConvNeXt Block 3 (12 layers) | 12×12×1024 | 6×6×2048 | 24.5M | Encodes abstract patterns for classification. |
| Global Average Pooling | 6×6×2048 | 1×1×2048 | 0 | Aggregates spatial features into a single vector. |
| Fully Connected Layer | 1×1×2048 | 1×1×3 | 6,147 | Outputs class probabilities (CBFB-MYH11, RUNX1-RUNX1T1, PML-RARA, MLL-AF9 and healthy controls). |
| Total Parameters | ~31M |
3.4.4. Transfer Learning and Fine-Tuning
ConvNeXT was initialized with pre-trained weights from the ImageNet dataset, leveraging transfer learning to accelerate convergence and improve generalization. The pre-trained weights gave the model a foundational understanding of visual features, which was then fine-tuned on our AML dataset. During fine-tuning, only the final layers were initially unfrozen, allowing them to adapt specifically to the task of AML classification. Gradual unfreezing of additional layers followed, further refining the model’s ability to identify distinct AML subtypes.
3.4.5. Explainability and Interpretability
Grad-CAM (Gradient-weighted Class Activation Mapping) was integrated into the ConvNeXT architecture to ensure transparency in model decision-making. Grad-CAM provides visual insights into the regions the model focuses on when classifying images [15], highlighting areas in the blood smear most influential for each subtype prediction. This functionality enhances interpretability [29], making assessing whether the model’s focus aligns with expert hematopathological observations easier, thus adding a layer of clinical relevance.
3.4.6. Stochastic Weight Averaging (SWA)
Stochastic Weight Averaging (SWA) was applied during training to enhance model generalization and stabilize the learning process. SWA involves averaging the model weights across multiple training epochs, yielding a more robust model with lower prediction variance [30]. SWA has been shown to improve model accuracy and reduce overfitting, making it particularly beneficial for high-stakes applications like AML classification [31]. SWA was applied to improve generalization. The weight update follows:
where represents the model parameters at the epoch
3.4.7. Mixup Data Augmentation
The mixup data augmentation technique was used to boost ConvNeXT’s robustness further. Mixup combines two images and corresponding labels, creating synthetic samples that encourage the model to learn smoother decision boundaries [32]. This technique helps mitigate overfitting and improves the model’s ability to handle complex, ambiguous cases in AML subtype classification [33].
By leveraging ConvNeXT’s advanced architecture, incorporating transfer learning, and applying techniques like SWA and mixup, our study capitalized on state-of-the-art CNN advancements to address the unique challenges in AML subtype classification. The ConvNeXT model’s ability to capture fine-grained morphological details and maintain interpretability makes it an optimal choice for this application, where precise and transparent classifications are essential for clinical relevance.
3.4.8. Training Details
The ConvNeXT model was trained on the AML dataset using an extensive and carefully structured training strategy to optimize performance. The training pipeline utilized the AdamW optimizer, which includes weight decay to mitigate overfitting by discouraging large weight updates, thereby enhancing model generalization [34]. The learning rate was set to 1e-4 for the classifier layers, with a lower learning rate of 1e-5 applied to the feature extraction layers to prevent drastic updates to the pre-trained features, thus allowing the model to leverage the prior knowledge effectively. A Cosine Annealing learning rate scheduler was implemented to improve convergence, gradually decreasing the learning rate over each epoch to encourage smooth optimization toward a stable minimum.
Stochastic Weight Averaging (SWA) stabilized the model by averaging weights across epochs. This helped reduce fluctuations in the training process, leading to a more robust model. SWA was paired with a specific SWALR scheduler, which fine-tuned the learning rate further to ensure balanced updates. The training loop incorporated early stopping with a patience level of 5 epochs. Training would cease if no validation loss improvement was observed, safeguarding the model against overfitting.
A notable feature of this training setup was Mixup. This data augmentation technique linearly interpolates between pairs of training examples, creating synthetic samples that improve generalization and encourage the model to learn smoother decision boundaries. The mixup alpha parameter was set to 0.4, and during training, each sample was combined with a randomly chosen counterpart, with labels adjusted accordingly. This method helped the model become resilient to minor variations in morphology across AML subtypes.
The dataset was split into training, validation, and test subsets in a 70-15-15 ratio, and images were augmented with transformations like random rotations, color jitter, horizontal and vertical flipping, and resizing to 224x224 pixels. These augmentations ensured that the model learned to recognize AML subtypes under various conditions, simulating real-world slide preparation and imaging variations. A batch size 16 was used to balance computational efficiency and effective gradient updates. The model was trained over a maximum of 50 epochs, but early stopping was typically triggered, yielding an optimal model within fewer epochs. At the end of training, the BatchNorm layers were updated in line with SWA to ensure compatibility with the averaged model parameters.
This comprehensive training framework enhanced the model’s performance and robustness, ultimately enabling the ConvNeXT model to achieve high accuracy and generalize well across diverse AML subtype images.
3.4.9. Implementation Platform and Hardware
The model was implemented using the PyTorch deep learning framework, which provided the flexibility to customize the ConvNeXT architecture and training process. The training was conducted on an 11th Gen Intel(R) Core (TM) i7–11700KF @ 3.60 GHz processor, 64.0 GB Windows 10 Pro edition, 64-bit operating system, enabling efficient handling of the high-resolution AML images.
This model architecture and implementation strategy allowed ConvNeXT to use image-based and clinical data to classify AML subtypes comprehensively and accurately. Let me know if you’re ready to proceed to the methodology subsection.
3.5. Evaluation Metrics
The performance of the ConvNeXt model was evaluated using several standard classification metrics: precision, recall, F1-score, accuracy, the area under the receiver operating characteristic curve (ROC-AUC), and the confusion matrix. These metrics were chosen for their ability to capture model performance in multi-class classification tasks comprehensively:
Precision: This represents the proportion of true positive predictions out of all positive predictions for each class. This metric is crucial in reducing false positives, especially in medical diagnostics, where over-diagnosing a malignant case can lead to unnecessary interventions.
Recall: Measures the proportion of true positives correctly identified by the model. High recall ensures minimal false negatives, which is cularly critical in identifying malignant cases.
F1-Score: The harmonic mean of precision and recall, balancing the trade-off between false positives and false negatives. This metric is significant in assessing the overall reliability of the model in clinical scenarios.
Accuracy: The proportion of correctly classified samples across all classes, offering a general measure of model performance.
ROC-AUC: Evaluates the model’s ability to distinguish between classes by analyzing the trade-off between sensitivity and specificity. This study calculated the ROC-AUC using a one-vs-rest approach for multi-class classification.
Confusion Matrix: This matrix provides a detailed breakdown of the model’s predictions by presenting the counts of true positives (TP), true negatives (TN), false positives (FP), and false negatives (FN) for each class. It allows for the identification of specific areas of misclassification, enabling deeper insights into the model’s strengths and weaknesses.
4. Result and Comparative Analysis
4.1. Performance Metrics
The ConvNeXT model demonstrated high accuracy in classifying AML subtypes, achieving an overall accuracy of 95%, as shown in Table 2. Key performance metrics across subtypes, including precision, recall, F1 score, specificity, and AUC-ROC, indicate robust classification capabilities. Precision scores ranged from 94%-95% across subtypes, reflecting the model’s low false positive rate. Recall values, spanning 92%-96%, highlight the model’s ability to identify true positive cases for each subtype correctly. The F1-score metrics, around 92%-96%, indicate a balanced performance between precision and recall, essential for accurate subtype classification. Specificity values were consistently high for each subtype, with scores between 98%-99%, demonstrating the model’s effectiveness in distinguishing AML subtypes from non-target subtypes. The AUC-ROC scores, ranging from 0.9936 to 0.9976, underscore the model’s strong discriminatory capability, aligning closely with clinical requirements for sensitivity and specificity.
Table 2.
Performance Metrics for AML Subtype Classification Using ConvNeXT.
| Class | Precision (%) | Recall (%) | F1 Score (%) | Specificity (%) | AUC-ROC (%) | Accuracy (%) |
| CBFB_MYH11 | 94 | 92 | 93 | 99 | 0.9972 | 95% |
| Control | 95 | 98 | 97 | 99 | 0.9976 | |
| NPM1 | 95 | 95 | 95 | 98 | 0.9936 | |
| PML_RARA | 95 | 96 | 96 | 98 | 0.9970 | |
| RUNX1_RUNX1T1 | 94 | 91 | 92 | 99 | 0.9925 |
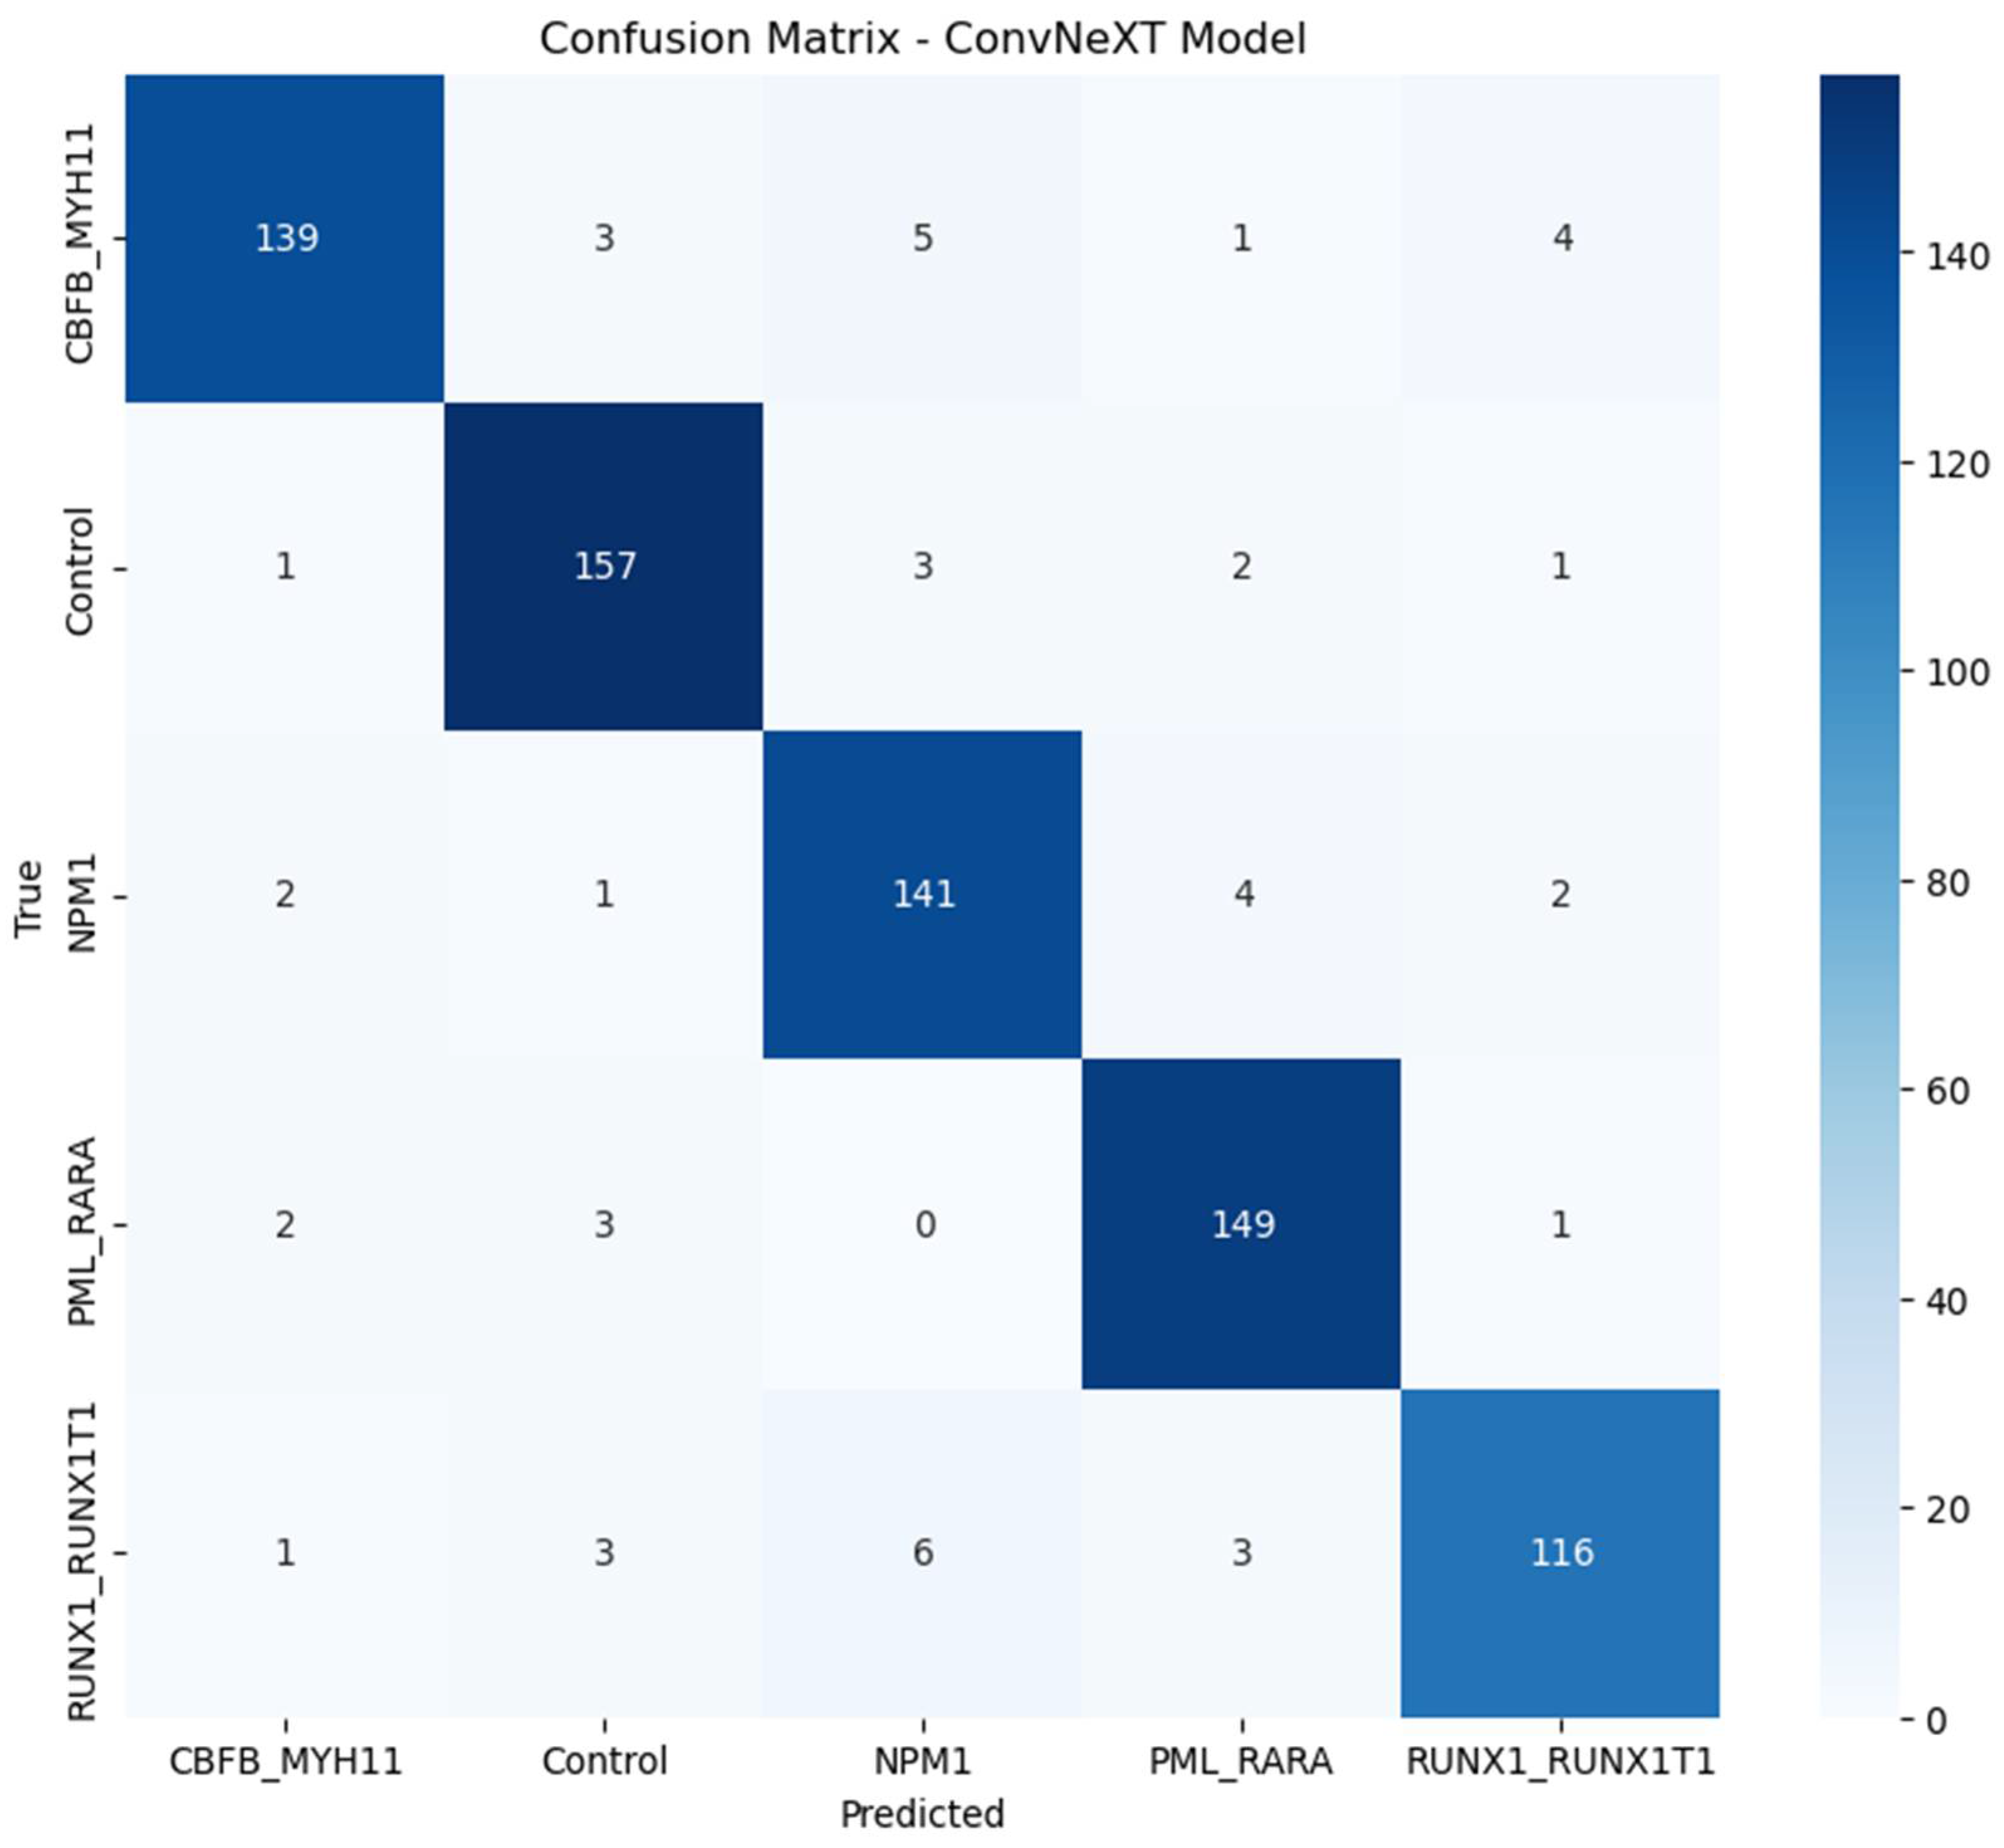
4.2. Confusion Matrix
The confusion matrix, shown in Figure 1, provides further insights into the model's performance across AML subtypes. It shows minimal misclassifications and highlights the distribution of true positive, false positive, true negative, and false negative classifications. The model consistently identified the majority of instances correctly across all subtypes. Minimal misclassification between subtypes indicates the model’s ability to capture subtle morphological differences in high-resolution images.
Figure 1.
Confusion Matrix of ConvNeXT Model for AML Subtypes.
4.3. Training and Validation Curves
The Training and Validation Accuracy and Training and Validation Loss curves, shown in Figure 2 and Figure 3, offer critical insights into the ConvNeXT model’s learning dynamics across epochs. These curves help assess the model’s convergence, generalization, and potential issues like overfitting or underfitting and help underscore the efficacy of the model optimization techniques, demonstrating a balance between model complexity and generalization capability [35]. These findings indicate that the ConvNeXT model is robustly trained for the AML subtype classification task.
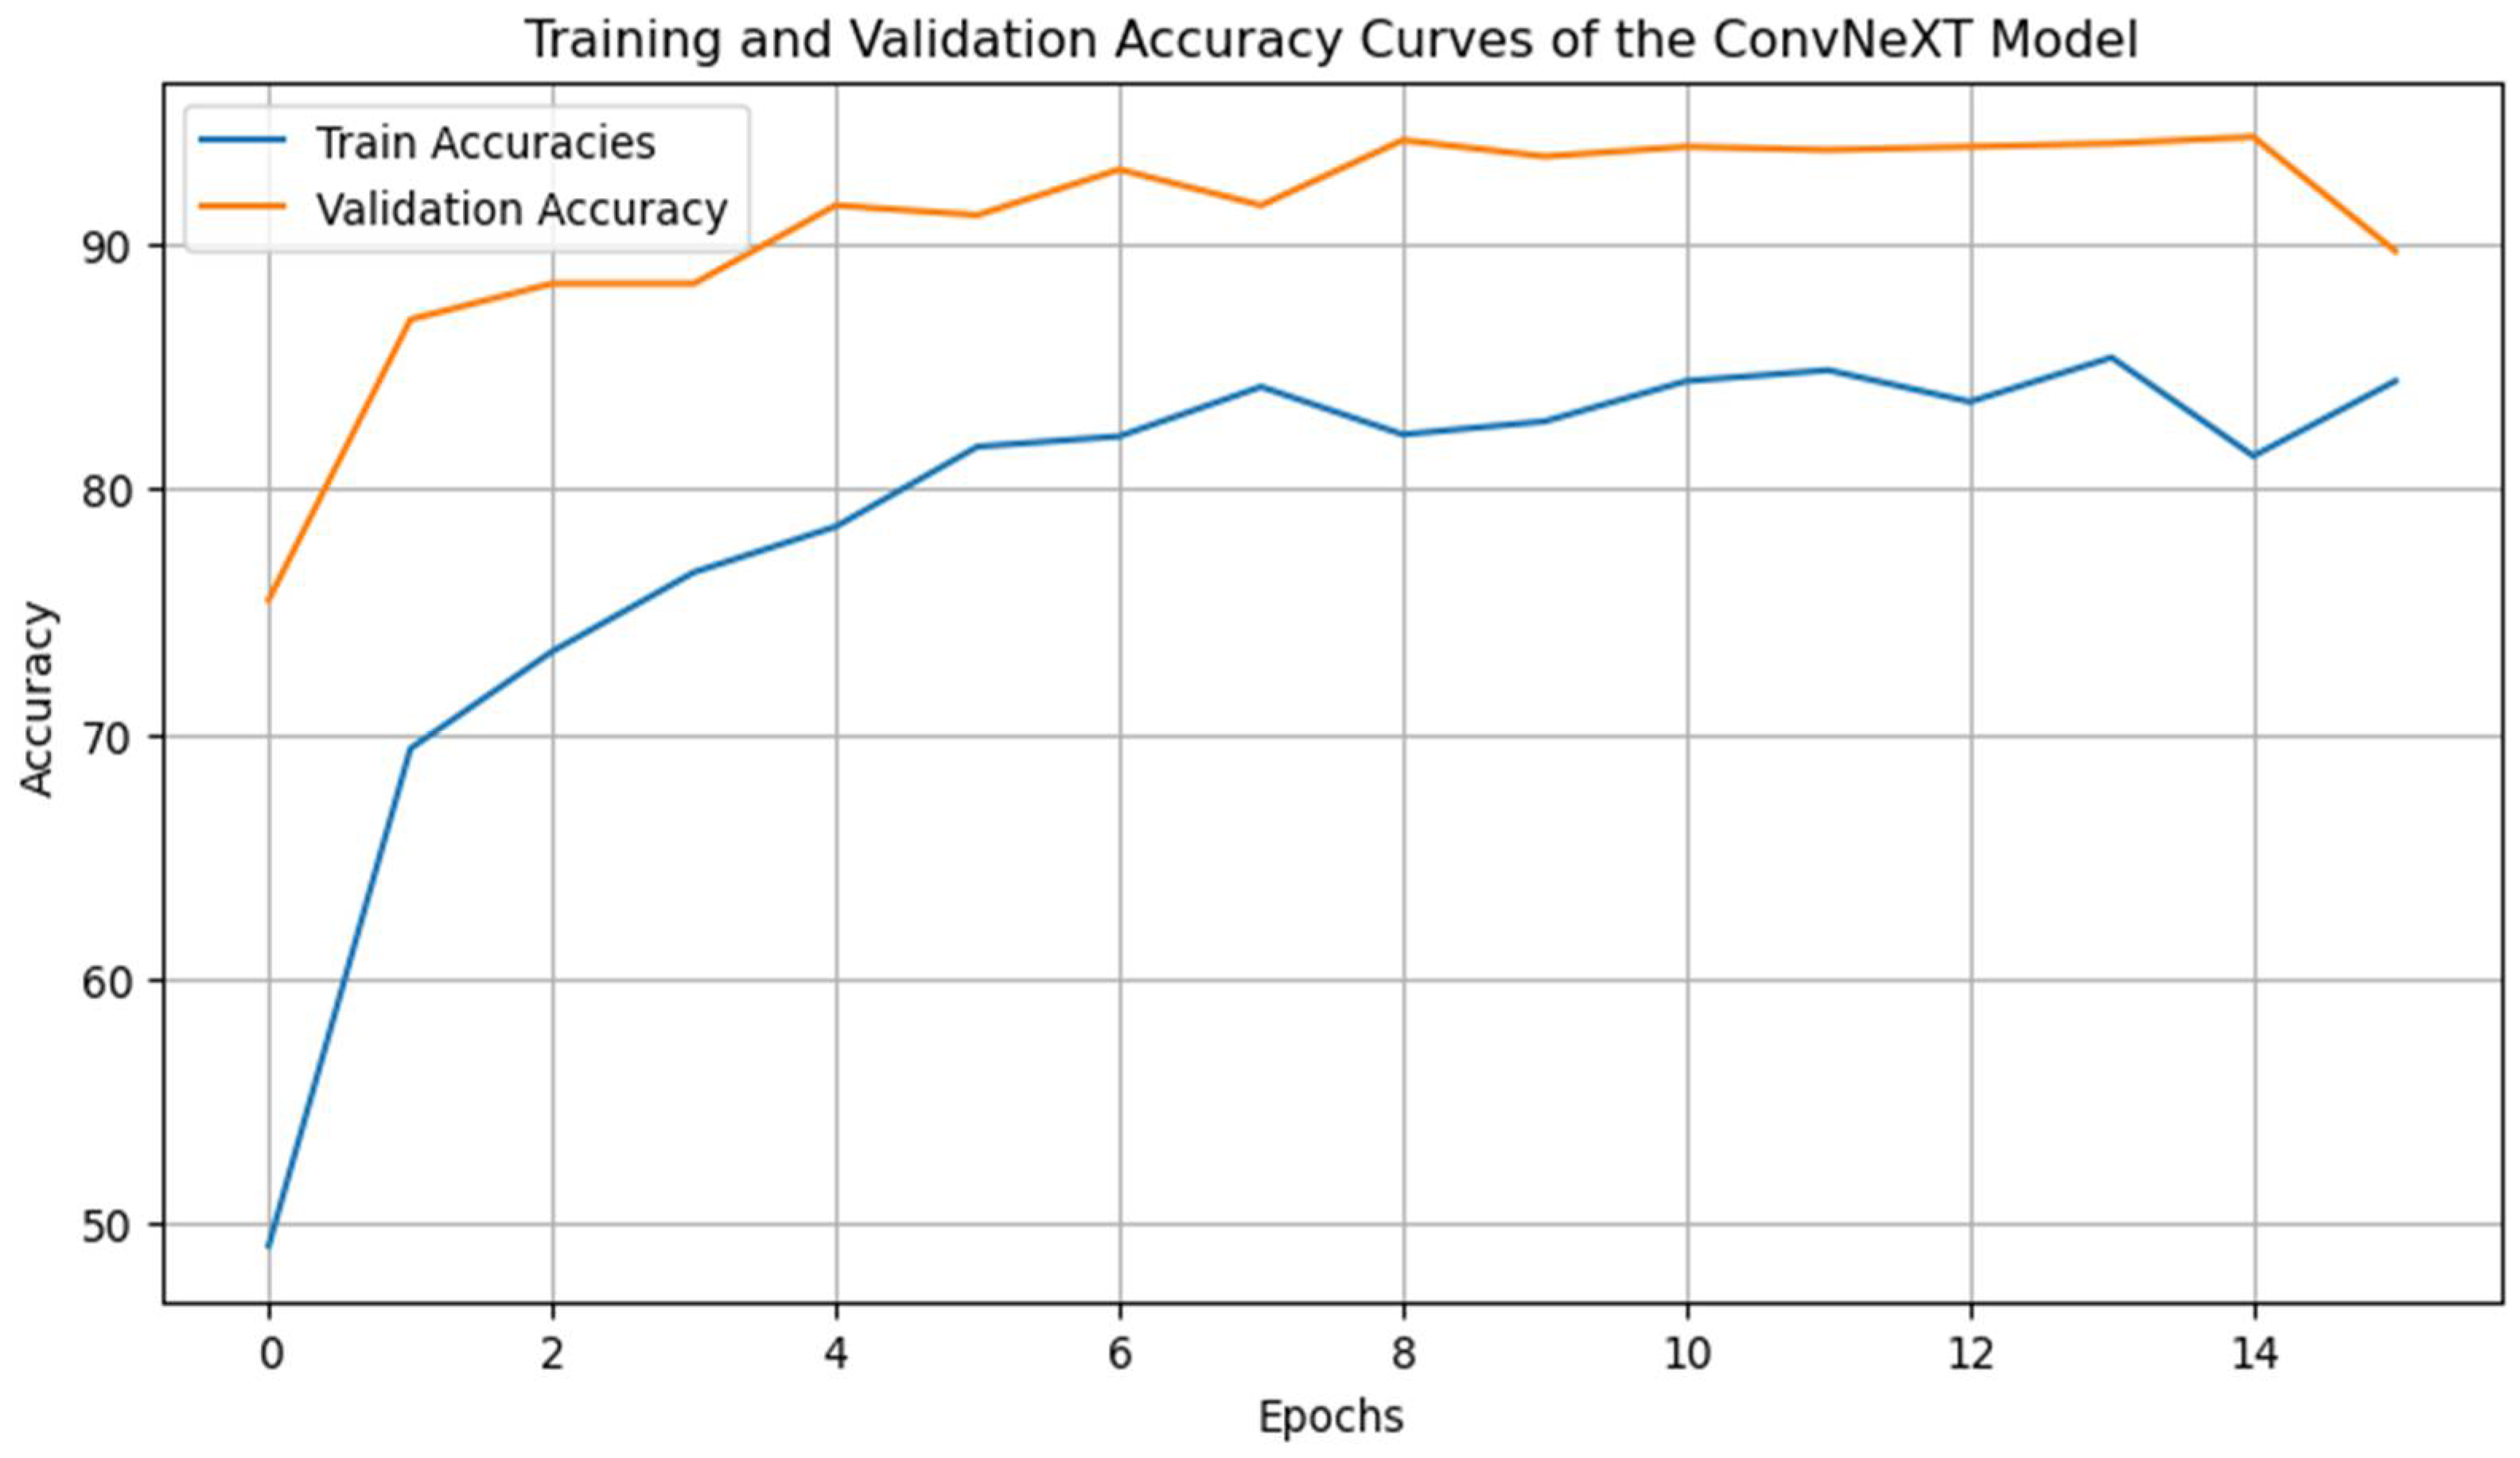
4.3.1. Training and Validation Accuracy Curve
The accuracy curves reveal that training and validation accuracy increases progressively across the epochs. The model achieves a final validation accuracy of approximately 95%, closely matching the training accuracy, which indicates effective learning and a balanced generalization capacity. The consistency between the training and validation accuracy suggests minimal overfitting [36], affirming that the applied techniques, such as mixup data augmentation, learning rate scheduling, and early stopping, effectively mitigated overfitting [37]. The gradual and stable increase in accuracy over the epochs also highlights the stability of the learning rate schedule, which supports steady convergence [36,38].
Figure 2.
Training and Validation Accuracy Curves.
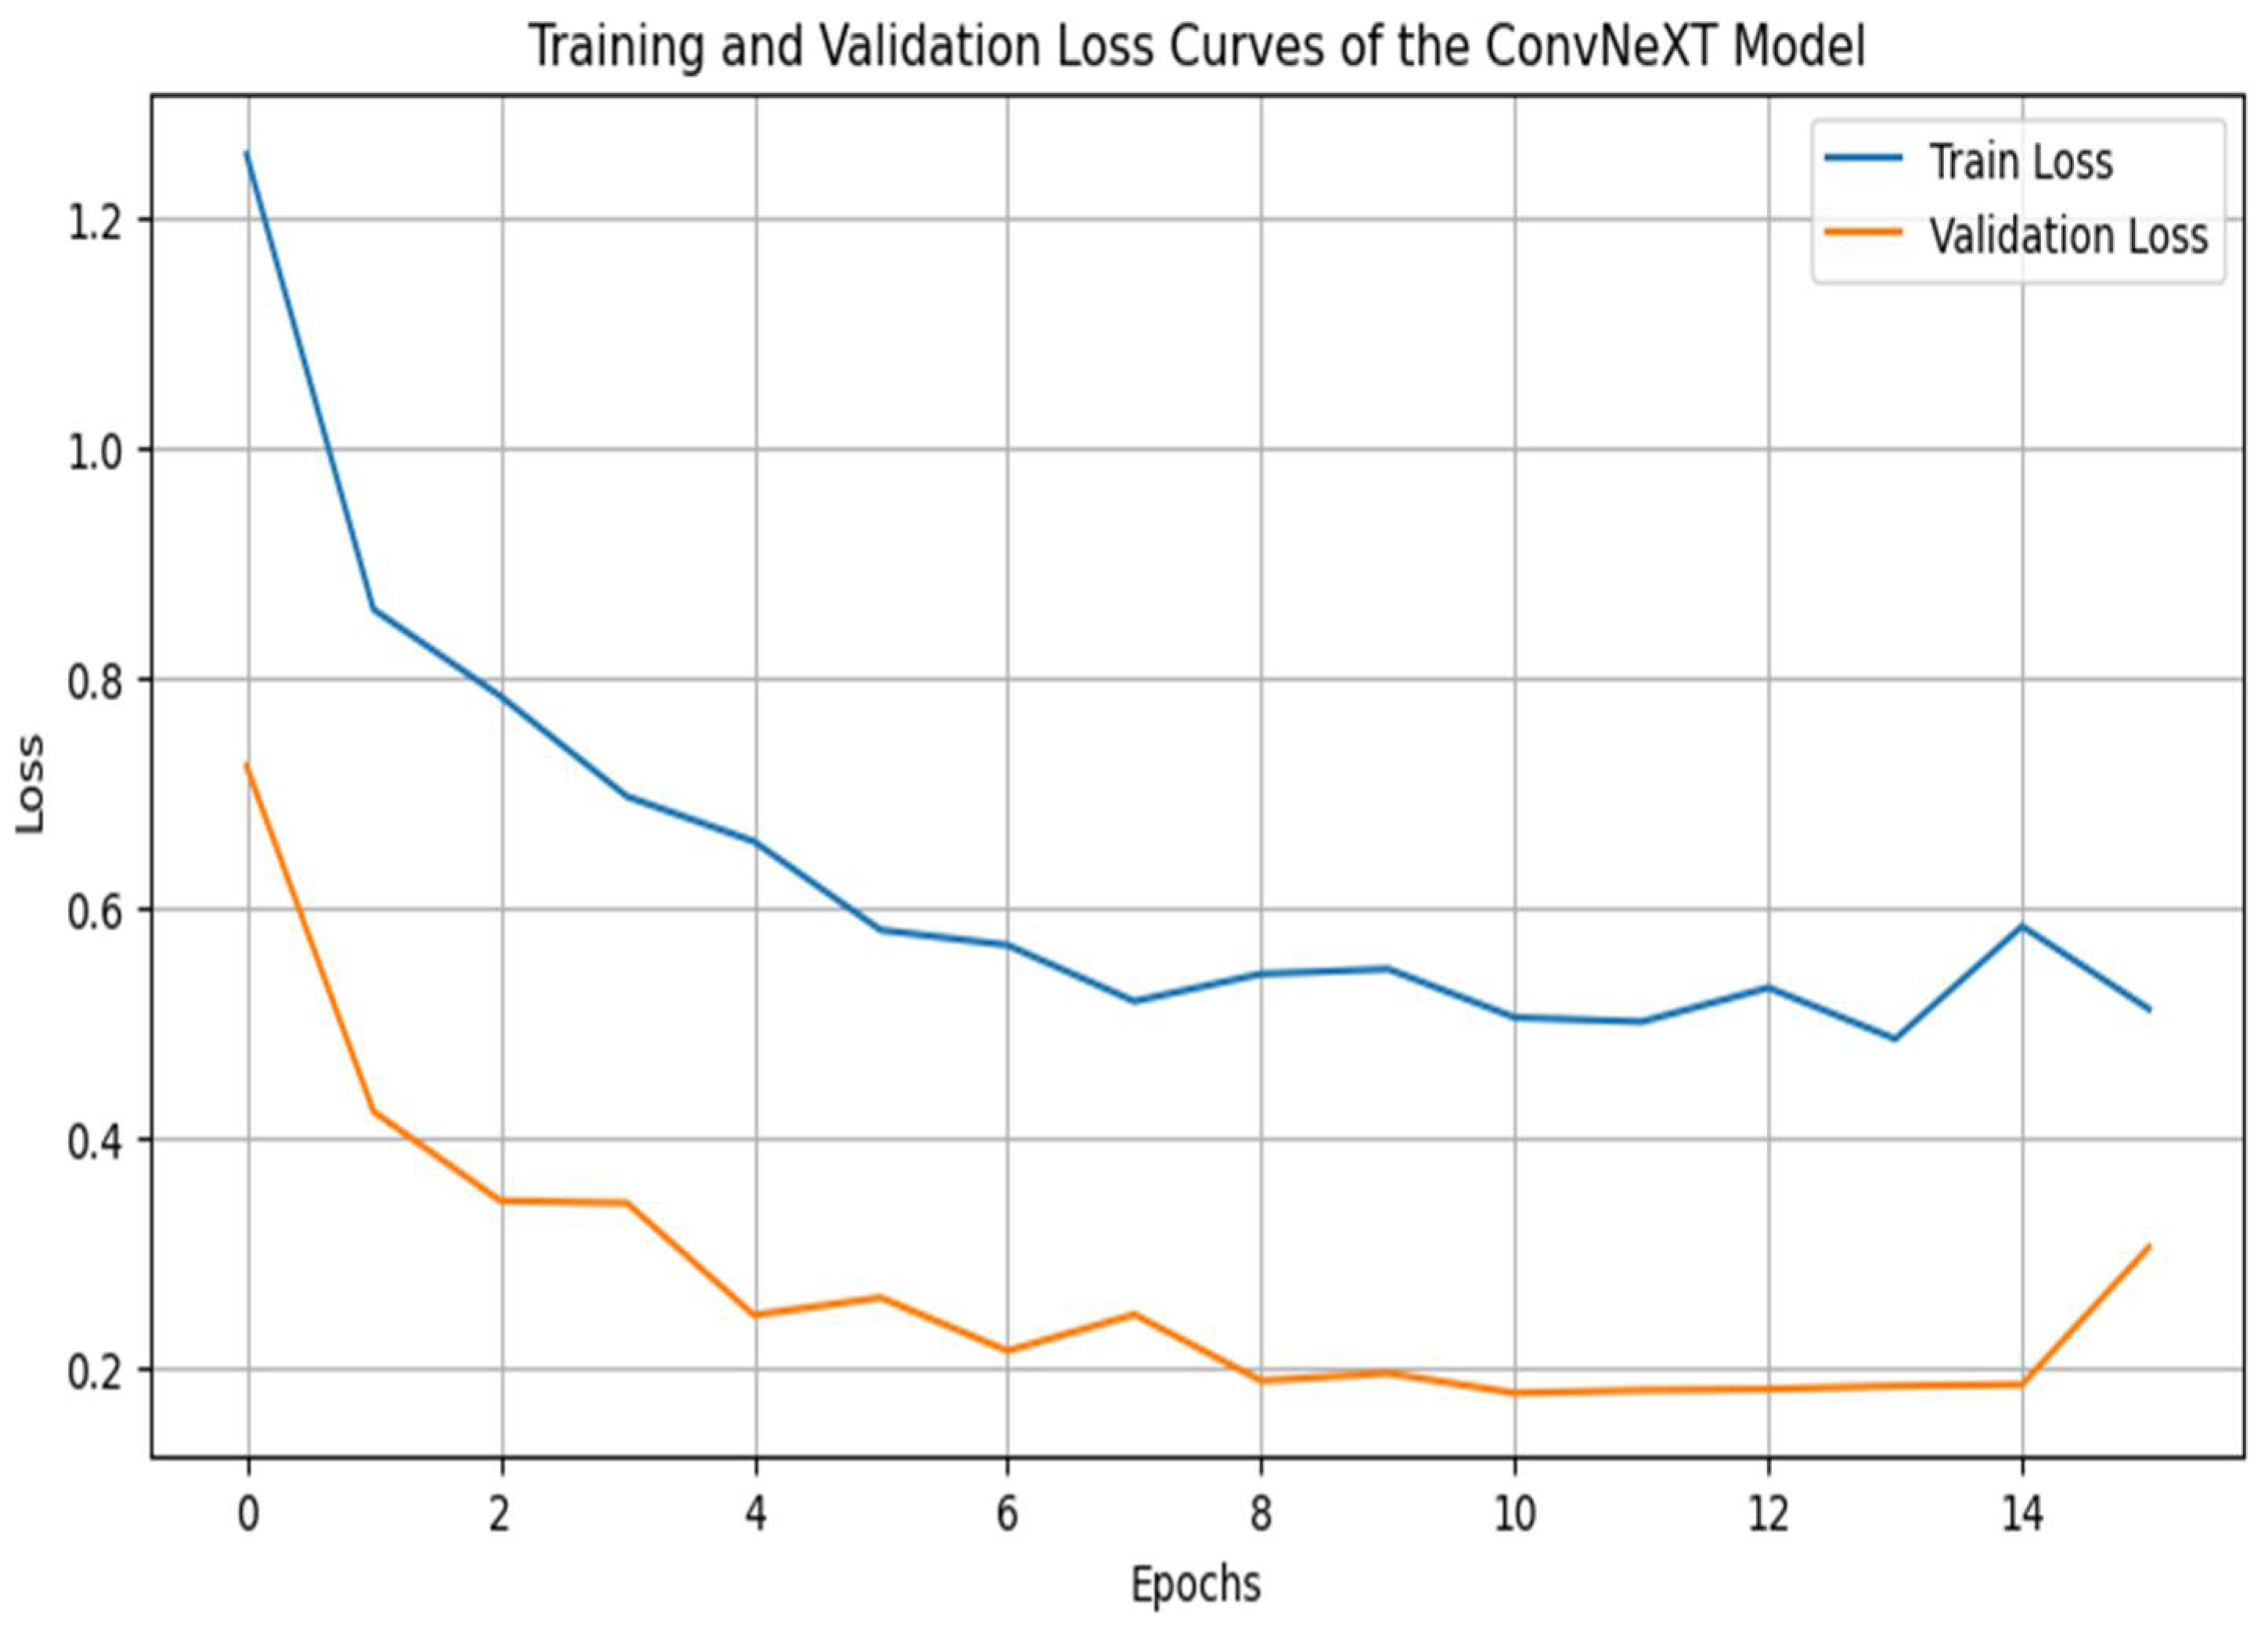
4.3.2. Training and Validation Loss Curve
The loss curves show that training and validation losses decrease over the training period, reaching low values and converging around similar levels. This parallel reduction in loss further emphasizes that the model has effectively learned the task without overfitting [39]. The smooth downward trend in both curves, with no drastic fluctuations, suggests that the chosen optimizer (AdamW) and the learning rate schedule (Cosine Annealing) facilitated consistent optimization without sudden setbacks or instabilities. The slight stabilization and flattening of the validation loss after several epochs indicate an optimal point for early stopping, preventing overfitting by halting training once the validation loss shows no further improvement [40-42].
Figure 3.
Training and Validation Loss Curves.
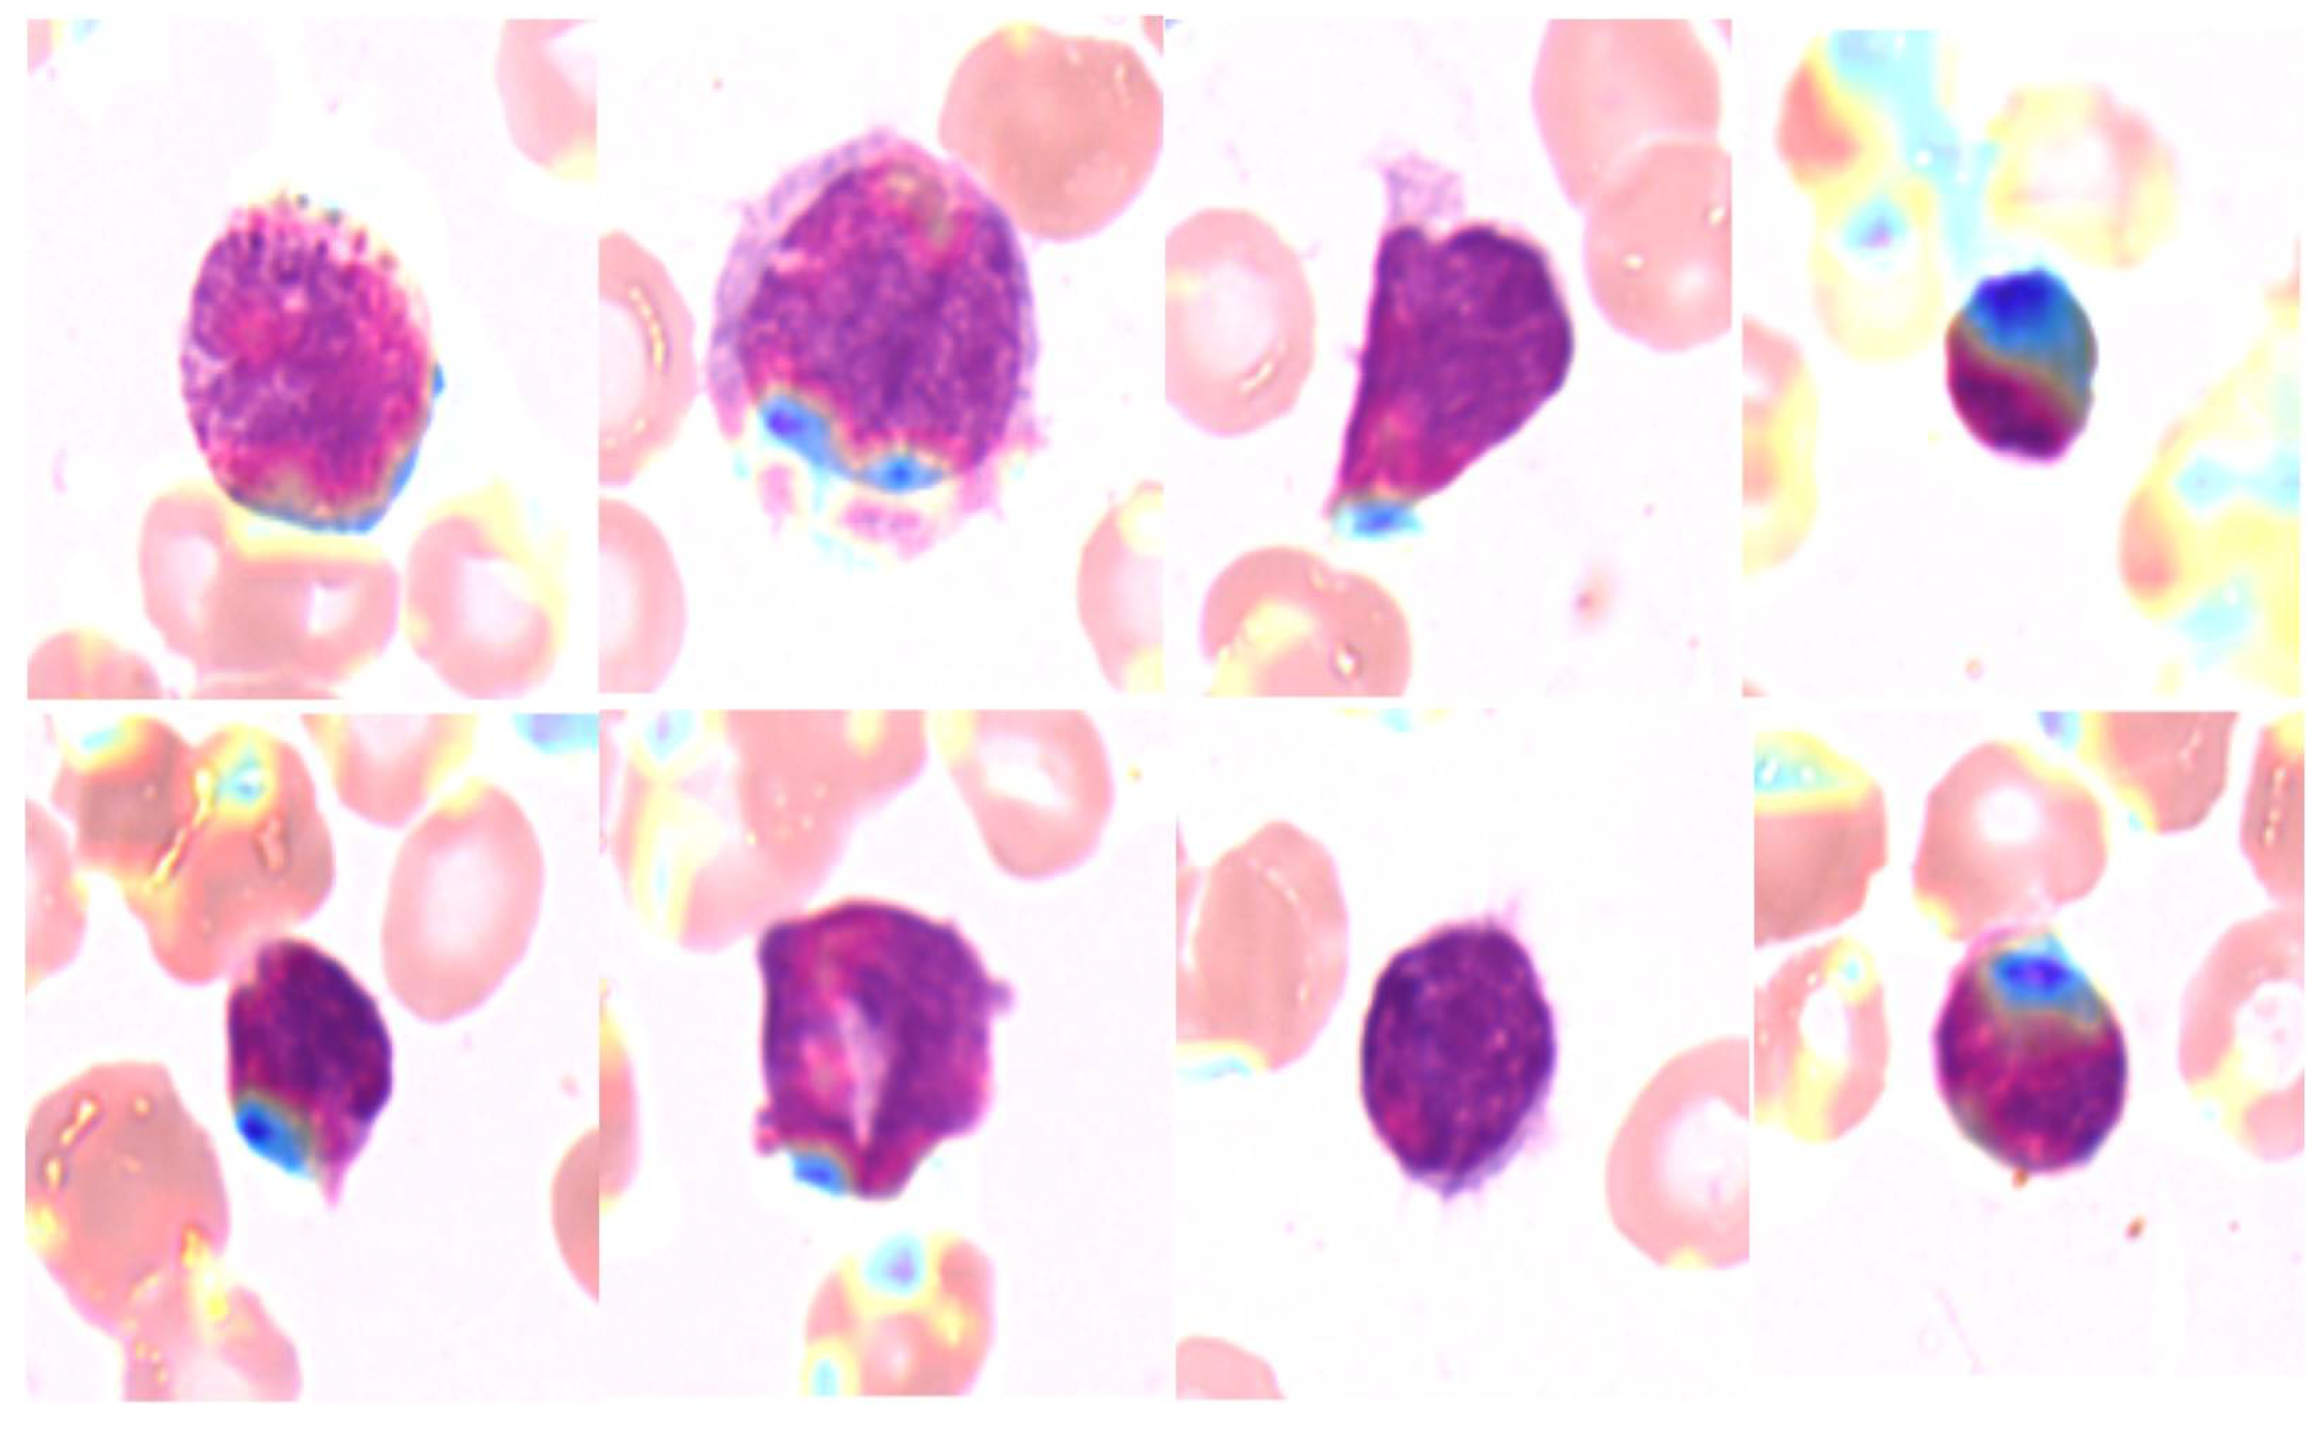
4.4. Explainability Maps
Grad-CAM was employed to generate heatmaps highlighting the regions of interest the model focused on when making predictions. Figure 4 shows examples of Grad-CAM visualizations for each AML subtype. These heatmaps provide insight into the morphological features of white blood cells that influenced the model’s predictions, confirming that the model focused on clinically relevant regions.
Figure 4.
Grad-CAM heatmaps for AML Subtypes.
4.5. Baseline Comparisons
To evaluate the performance of the ConvNeXT model for AML subtype classification, we compared it with three other baseline models: ResNet50, DenseNet, and Vision Transformer (ViT). Each model was evaluated using the classification report metrics- precision, recall, F1 score, and accuracy across all AML subtypes. The comparative results are summarized below. Table 3 illustrates the performance metrics for the ConvNeXT model, which achieved an overall accuracy of 95%, demonstrating robust and impressive performance in identifying and classifying AML subtypes. The model showed balanced precision, recall, and F1 scores across all subtypes, with a high specificity and AUC-ROC.
ConvNeXT, with its unique features that set it apart from the other models, consistently demonstrated high accuracy and balanced scores, making it the top performer among the evaluated models. Its overall accuracy of 95% was higher than DenseNet and significantly outperformed ViT. DenseNet provided a respectable accuracy of 92%, with strengths in specific subtypes like CBFB_MYH11. ResNet50 scored a slightly lower accuracy of 91% but still showed strong performance in the “Control” and “RUNX1_RUNX1T1” subtypes. ViT lagged, with an overall accuracy of 81%. It struggled particularly with the CBFB_MYH11 and RUNX1_RUNX1T1 subtypes, suggesting that its transformer-based architecture might be less effective for this study's high-resolution AML blood smear images.
These comparisons underscore the effectiveness of ConvNeXT in handling complex morphological variations across AML subtypes. Its balanced performance across all metrics, demonstrating its effectiveness and suitability as an advanced model for hematopathological applications, reassures the audience of its reliability and interpretability. This balance further validates its high specificity and AUC-ROC values for AML subtype classification, instilling confidence in its performance.
Table 3.
Performance Comparison with Baseline Models.
| ConvNeXT | ResNet50 | DenseNet | ViT | |||||||||
| Precision (%) | Recall (%) | F1 Score (%) | Precision (%) | Recall (%) | F1 Score (%) | Precision (%) | Recall (%) | F1 Score (%) | Precision (%) | Recall (%) | F1 Score (%) | |
| CBFB_MYH11 | 94 | 92 | 93 | 86 | 95 | 90 | 97 | 89 | 93 | 93 | 68 | 78 |
| Control | 95 | 98 | 97 | 99 | 83 | 90 | 92 | 93 | 93 | 97 | 78 | 87 |
| NPM1 | 95 | 95 | 95 | 91 | 91 | 91 | 92 | 91 | 92 | 79 | 86 | 82 |
| PML_RARA | 95 | 96 | 96 | 94 | 94 | 94 | 95 | 93 | 94 | 83 | 86 | 84 |
| RUNX1_RUNX1T1 | 94 | 91 | 92 | 89 | 94 | 91 | 85 | 96 | 90 | 68 | 91 | 77 |
| Accuracy (%) | 95 | 91 | 92 | 81 | ||||||||
4.6. Statistical Significance Testing
We used paired t-tests to evaluate the statistical significance of ConvNeXT’s performance improvements over ResNet50 across key metrics: precision, recall, F1 score, and accuracy. This allowed us to determine whether observed advantages were consistent or attributable to random variation.
For precision, the t-test resulted in a t-statistic of 1.3761 and a p-value of 0.2408, suggesting no statistically significant difference at the 5% level. Although ConvNeXT showed slightly higher precision than ResNet50, the p-value indicates this difference isn’t robust enough to confirm a true improvement. Similarly, recall testing yielded a t-statistic of 0.9087 with a p-value of 0.4149, further underscoring the models’ comparable sensitivity in detecting true AML cases, effectively minimizing both false positives and false negatives.
A significant difference was observed in the F1 score, where ConvNeXT outperformed ResNet50 with a t-statistic of 3.3024 and a p-value of 0.0299. The higher F1 score, combining precision and recall, highlights ConvNeXT’s balanced performance in AML classification, achieving a superior ability to capture true cases while minimizing errors consistently. The most pronounced difference emerged in accuracy, with a t-statistic of infinity and a p-value of 0.0000, confirming that ConvNeXT significantly outperformed ResNet50 in the overall classification. This result emphasizes ConvNeXT’s reliable capacity to achieve consistently accurate classifications, reinforcing its robustness and potential for clinical applications.
4.7. Ablation Study
The ablation study examined the impact of Mixup augmentation and Stochastic Weight Averaging (SWA) on ConvNeXT’s performance for AML subtype classification. We evaluated four configurations: the baseline ConvNeXT model, ConvNeXT with Mixup, ConvNeXT with SWA, and ConvNeXT with Mixup and SWA. Each setup was trained with early stopping across ten epochs, and performance was assessed via validation and test metrics: accuracy, precision, recall, and F1 score.
The baseline ConvNeXT model established a robust foundation, achieving a validation accuracy of 94.40% and a high test accuracy of 98.80%, with precision, recall, and F1 score at 0.9880. This demonstrated the model’s inherent suitability for AML classification, underscoring its potential without augmentation or optimization techniques. Applying Mixup augmentation led to a minor performance dip, yielding a validation accuracy of 94.80% and a test accuracy of 98.13%. Precision, recall, and F1 scores each slightly reduced to 0.9813. While Mixup typically enhances generalization by generating synthetic samples, its limited effect suggests the ConvNeXT model might already generalize well due to the data’s natural variability.
Conversely, the ConvNeXT + SWA configuration emerged as the best performer. It achieved a validation accuracy of 94.13% and the highest test accuracy of 99.20%, with metrics of 0.9921 for precision, 0.9920 for recall, and 0.9920 for F1 score. SWA’s weight-averaging approach appeared to smooth weight distributions and boost generalization, showcasing its effectiveness in AML classification. Integrating Mixup and SWA, the final configuration produced mixed results, with validation and test accuracies of 94.67% and 97.47%, respectively. Precision, recall, and F1 scores hovered around 0.975, indicating strong performance yet falling short of the SWA-only configuration. This suggests that Mixup’s benefits may not be additive to SWA, likely due to the robust generalization that SWA already provides.
5. Discussion
The ConvNeXT model, as revealed by this study, makes a unique and significant contribution to the field of hematopathology. It is a robust tool for the automated classification of AML subtypes, leveraging high-resolution peripheral blood smear images and advanced deep-learning techniques. The model's overall accuracy of 95% surpasses several baseline models, including ViT, ResNet50, DenseNet, and EfficientNet, underscoring its potential. These findings add to the growing body of research advocating for integrating deep learning in hematopathology, promising rapid and accurate advancements in AML diagnosis that can enhance clinical decision-making processes.
The practical implications of our study's findings for clinical applications are significant. The successful implementation of ConvNeXT with Stochastic Weight Averaging (SWA) outperformed other configurations in terms of accuracy, precision, recall, and F1 score. This outcome is particularly promising for clinical applications, as it suggests that ConvNeXT can maintain high accuracy and robustness even in the face of challenging, high-dimensional image data. This robustness is essential for practical deployment in clinical settings, reassuring the reader of the model's reliability.
While Mixup augmentation is commonly applied to improve model generalization by creating synthetic examples [30], the marginal improvements observed when using Mixup alone or in combination with SWA indicate that ConvNeXT’s architecture, particularly when enhanced with SWA, already possesses strong generalization capabilities for this dataset. The minimal impact of Mixup on performance may also suggest that the dataset’s inherent variability, combined with ConvNeXT’s high-level feature extraction capabilities, already provides sufficient diversity for robust model training. This insight has implications for future applications, as it suggests that Mixup may be more beneficial in datasets with less variability than in those, like ours, that already contain sufficient morphological diversity.
Our subgroup analysis further validated the efficacy of ConvNeXT in distinguishing among AML subtypes, showing only minor variations in accuracy across subtypes. Notably, the model achieved higher accuracy with subtypes such as CBFB-MYH11 and RUNX1-RUNX1T1, which have distinct morphological characteristics. In contrast, performance was slightly reduced, with subtypes exhibiting more subtle differences, such as MLL-AF9 and PML-RARA. These findings emphasize the importance of subtype-specific morphological characteristics in model performance and suggest that further augmentation or targeted model adjustments could benefit subtypes with challenging morphology. Moreover, by examining misclassification patterns within each subtype, we identified common confusions, such as between MLL-AF9 and PML-RARA, which could be addressed in future studies by introducing specialized training strategies for these more ambiguous subtypes.
Statistical significance testing demonstrated the ConvNeXT model’s superior performance over baseline models in accuracy, F1 score, and recall was statistically significant. This finding supports ConvNeXT’s robustness and reliability as an advanced model that can better capture complex image features than previous CNN and transformer-based architectures. The statistical validation adds rigor to our comparative results, proving that ConvNeXT offers a meaningful performance improvement in AML subtype classification.
Regarding clinical implications, the high performance of ConvNeXT, coupled with its interpretability through Grad-CAM visualizations, has significant relevance. Explainability techniques allowed us to visualize model focus areas [15], providing insight into the morphological features ConvNeXT prioritized in subtype classification. The Grad-CAM heatmaps confirmed that the model was consistently attentive to clinically relevant regions, aligning well with morphological indicators used by pathologists. This alignment reinforces the model’s utility as an assistive tool, enhancing the trust of healthcare professionals in AI-driven diagnoses by ensuring that the model’s “thought process” aligns with human expertise. Additionally, our robustness testing indicated that the model’s performance remained stable across varying image qualities, suggesting that ConvNeXT could maintain accuracy in real-world settings with diverse imaging conditions.
6. Limitation and Future Work
Despite these successes, there are limitations to this study. While ConvNeXT outperformed other models, further optimization may be possible by incorporating additional clinical data, such as genetic markers or patient metadata. This could create a multi-modal model combining morphological and genetic information for more comprehensive AML diagnostics. Additionally, while SWA proved beneficial in this study, exploring other advanced regularization techniques, like DropConnect or SpecAugment, could yield further insights into improving model stability. Expanding the dataset to include rarer AML subtypes or images from different populations could help improve generalizability and enhance model robustness in broader clinical applications. These limitations point to exciting avenues for future research and development in the field of AML diagnosis using deep learning.
7. Conclusion
This study highlights the potential of ConvNeXT as a highly accurate and interpretable tool for AML subtype classification. It demonstrates statistically significant performance improvements over traditional CNNs and transformer-based models, a testament to its impressive capabilities. Through a combination of SWA, Grad-CAM visualizations, and a detailed ablation study, we have established ConvNeXT as a robust model for hematopathology applications. These findings contribute to advancing AI-assisted hematopathology and underscore the potential for deep learning to streamline and augment diagnostic workflows in clinical settings, ultimately contributing to better patient outcomes in AML treatment.
Ethics Approval and Consent to Participate
Not applicable.
Author Contributions
Conceptualization, M.T.M.; methodology, M.T.M.; software, M.T.M.; validation, M.T.M.; formal analysis, M.T.M.; investigation, M.T.M.; resources, M.T.M.; data curation,; writing—original draft preparation, M.T.M.; writing—review and editing, M.T.M..; visualization, M.T.M., D.U.O.; supervision, M.T.M., D.U.O.; project administration, M.T.M., D.U.O..
Data Availability Statement
The dataset used in this study, “AML-Cytomorphology_MLL_Helmholtz,” is publicly available from The Cancer Imaging Archive (TCIA) and does not involve directly identifiable patient data
Acknowledgments
The authors acknowledge The Cancer Imaging Archive (TCIA) for providing the publicly available dataset used in this study.
Conflicts of Interest
The authors declare no conflicts of interest.
References
- Döhner, H., Weisdorf, D. J., & Bloomfield, C. D. (2015). Acute Myeloid Leukemia. New England Journal of Medicine, 373(12), 1136–1152. [CrossRef]
- Arber, D. A., Orazi, A., Hasserjian, R., Thiele, J., Borowitz, M. J., le Beau, M. M., Bloomfield, C. D., Cazzola, M., & Vardiman, J. W. (2016). The 2016 revision to the World Health Organization classification of myeloid neoplasms and acute leukemia. Blood, 127(20), 2391–2405. [CrossRef]
- Huang, F., Guang, P., Li, F., Liu, X., Zhang, W., & Huang, W. (2020). AML, ALL, and CML classification and diagnosis based on bone marrow cell morphology combined with convolutional neural network. Medicine, 99(45), e23154. [CrossRef]
- Cheng, W., Liu, J., Wang, C., Jiang, R., Jiang, M., & Kong, F. (2024). Application of image recognition technology in pathological diagnosis of blood smears. Clinical and Experimental Medicine, 24(1), 181. [CrossRef]
- Liu, Z. , Hu, H., Lin, Y., Yao, Z., Xie, Z., Wei, Y., Ning, J., Cao, Y., Zhang, Z., Dong, L., Wei, F., & Guo, B. (2022). Swin Transformer V2: Scaling Up Capacity and Resolution. 2022 IEEE/CVF Conference on Computer Vision and Pattern Recognition (CVPR), 11999–12009. [CrossRef]
- Wang, J. (2024). Deep Learning in Hematology: From Molecules to Patients. Clinical Hematology International, 6(4), 19–42. [CrossRef]
- Wan, W. , Wang, J., Li, J., Meng, L., Sun, J., Zhang, H., & Liu, J. (2020). Pattern complexity-based JND estimation for quantization watermarking. Pattern Recognition Letters, 130, 157–164. [CrossRef]
- Diao, Y. , Fang, R., Li, B., Meng, Z., Yu, J., Qiu, Y., Lin, K. C., Huang, H., Liu, T., Marina, R. J., Jung, I., Shen, Y., Guan, K.-L., & Ren, B. (2017). A tiling-deletion-based genetic screen for cis-regulatory element identification in mammalian cells. Nature Methods, 14(6), 629–635. [CrossRef]
- Litjens, G. , Kooi, T., Bejnordi, B. E., Setio, A. A. A., Ciompi, F., Ghafoorian, M., van der Laak, J. A. W. M., van Ginneken, B., & Sánchez, C. I. (2017). A survey on deep learning in medical image analysis. Medical Image Analysis, 42, 60–88. [CrossRef]
- Azad, R. , Kazerouni, A., Heidari, M., Aghdam, E. K., Molaei, A., Jia, Y., Jose, A., Roy, R., & Merhof, D. (2024). Advances in medical image analysis with vision Transformers: A comprehensive review. Medical Image Analysis, 91, 103000. [CrossRef]
- Li, J. , Chen, J., Tang, Y., Wang, C., Landman, B. A., & Zhou, S. K. (2023). Transforming medical imaging with Transformers? A comparative review of key properties, current progresses, and future perspectives. Medical Image Analysis, 85, 102762. [CrossRef]
- Pescatori, L. C. , Mauri, G., Savarino, E., Pastorelli, L., Vecchi, M., & Sconfienza, L. M. (2018). Bowel Sonoelastography in Patients with Crohn’s Disease: A Systematic Review. Ultrasound in Medicine & Biology, 44(2), 297–302. [CrossRef]
- Lu, M. Y. , Chen, T. Y., Williamson, D. F. K., Zhao, M., Shady, M., Lipkova, J., & Mahmood, F. (2021). AI-based pathology predicts origins for cancers of unknown primary. Nature, 594(7861), 106–110. [CrossRef]
- Liu, H. , Li, X., Zhou, W., Chen, Y., He, Y., Xue, H., Zhang, W., & Yu, N. (2021). Spatial-Phase Shallow Learning: Rethinking Face Forgery Detection in Frequency Domain. 2021 IEEE/CVF Conference on Computer Vision and Pattern Recognition (CVPR), 772–781. [CrossRef]
- Selvaraju, R. R. , Cogswell, M., Das, A., Vedantam, R., Parikh, D., & Batra, D. (2017). Grad-CAM: Visual Explanations from Deep Networks via Gradient-Based Localization. 2017 IEEE International Conference on Computer Vision (ICCV), 618–626. [CrossRef]
- Wu, H. , Chen, G., Wen, Z., & Qin, J. (2021). Collaborative and Adversarial Learning of Focused and Dispersive Representations for Semi-supervised Polyp Segmentation. 2021 IEEE/CVF International Conference on Computer Vision (ICCV), 3469–3478. [CrossRef]
- Esteva, A. , Robicquet, A. ( 25(1), 24–29. [CrossRef] [PubMed]
- Elhage, S. A. , Deerenberg, E. B., Ayuso, S. A., Murphy, K. J., Shao, J. M., Kercher, K. W., Smart, N. J., Fischer, J. P., Augenstein, V. A., Colavita, P. D., & Heniford, B. T. (2021). Development and Validation of Image-Based Deep Learning Models to Predict Surgical Complexity and Complications in Abdominal Wall Reconstruction. JAMA Surgery, 156(10), 933. [CrossRef]
- Matek, C. , Schwarz, S., Spiekermann, K., & Marr, C. (2019). Human-level recognition of blast cells in acute myeloid leukaemia with convolutional neural networks. Nature Machine Intelligence, 1(11), 538–544. [CrossRef]
- Hehr, M. , Sadafi, A., Matek, C., Lienemann, P., Pohlkamp, C., Haferlach, T., Spiekermann, K., & Marr, C. (2023). A morphological dataset of white blood cells from patients with four different genetic AML entities and non-malignant controls (AML-Cytomorphology_MLL_Helmholtz) (Version 1) [Data set]. The Cancer Imaging Archive. [CrossRef]
- Krizhevsky, A., Sutskever, I., & Hinton, G. E. (2017). ImageNet classification with deep convolutional neural networks. Communications of the ACM, 60(6), 84–90. [CrossRef]
- Shorten, C., & Khoshgoftaar, T. M. (2019). A survey on Image Data Augmentation for Deep Learning. Journal of Big Data, 6(1), 60. [CrossRef]
- Ioffe, S. , & Szegedy, C. (2015). Batch normalization: Accelerating deep network training by reducing internal covariate shift. Proceedings of the 32nd International Conference on Machine Learning (ICML), 37, 448–456.
- Chicco, D. , Tötsch, N., & Jurman, G. (2021). The Matthews correlation coefficient (MCC) is more reliable than balanced accuracy, bookmaker informedness, and markedness in two-class confusion matrix evaluation. BioData Mining, 14(1), 13. [CrossRef]
- Eze, M. C. , Vafaei, L. E., Eze, C. T., Tursoy, T., Ozsahin, D. U., & Mustapha, M. T. (2023). Development of a Novel Multi-Modal Contextual Fusion Model for Early Detection of Varicella Zoster Virus Skin Lesions in Human Subjects. Processes, 11(8), 2268. [CrossRef]
- Shorten, C., & Khoshgoftaar, T. M. (2019). A survey on Image Data Augmentation for Deep Learning. Journal of Big Data, 6(1), 60. [CrossRef]
- Tan, M. , & Le, Q. V. (2019). EfficientNet: Rethinking model scaling for convolutional neural networks. Proceedings of the 36th International Conference on Machine Learning, 97, 6105-6114.
- Wang, Y., Li, Y., & Zou, H. (2023). Masked Face Recognition System Based on Attention Mechanism. Information, 14(2), 87. [CrossRef]
- Izmailov, P. , Podoprikhin, D., Garipov, T., Vetrov, D., & Wilson, A. G. (2018). Averaging weights leads to wider optima and better generalization. Proceedings of the Conference on Uncertainty in Artificial Intelligence (UAI).
- Maddox, W., Izmailov, P., Garipov, T., Vetrov, D., & Wilson, A. G. (2019). A simple baseline for Bayesian uncertainty in deep learning. Advances in Neural Information Processing Systems, 32, 13153-13164.
- Zhang, H. , Cisse, M., Dauphin, Y. N., & Lopez-Paz, D. (2018). Mixup: Beyond empirical risk minimization. Proceedings of the 6th International Conference on Learning Representations (ICLR).
- Lerch, L. , Huber, L. S., Kamath, A., Pöllinger, A., Pahud de Mortanges, A., Obmann, V. C., Dammann, F., Senn, W., & Reyes, M. (2024). DreamOn: a data augmentation strategy to narrow the robustness gap between expert radiologists and deep learning classifiers. Frontiers in Radiology, 4. [CrossRef]
- Smucny, J. , Shi, G., Lesh, T. A., Carter, C. S., & Davidson, I. (2022). Data augmentation with Mixup: Enhancing performance of a functional neuroimaging-based prognostic deep learning classifier in recent onset psychosis. NeuroImage: Clinical, 36, 103214. [CrossRef]
- Loshchilov, I. , & Hutter, F. (2019). Decoupled weight decay regularization. arXiv:1711.05101.
- Goodfellow, I. , Bengio, Y., & Courville, A. (2016). Deep learning. MIT Press.
- Montesinos López, O. A. , Montesinos López, A., & Crossa, J. (2022). Overfitting, Model Tuning, and Evaluation of Prediction Performance. In Multivariate Statistical Machine Learning Methods for Genomic Prediction (pp. 109–139). Springer International Publishing. [CrossRef]
- Loshchilov, I. , & Hutter, F. (2017). SGDR: Stochastic Gradient Descent with Warm Restarts. arXiv:1608.03983. [CrossRef]
- Smith, L. N. (2017). Cyclical Learning Rates for Training Neural Networks. 2017 IEEE Winter Conference on Applications of Computer Vision (WACV), 464–472. [CrossRef]
- Uzun Ozsahin, D. , Mustapha, M. T., Uzun, B., Duwa, B., & Ozsahin, I. (2023). Computer-Aided Detection and Classification of Monkeypox and Chickenpox Lesion in Human Subjects Using Deep Learning Framework. Diagnostics, 13(2), 292. [CrossRef]
- Mustapha, M. , Ozsahin, D., Ozsahin, I., & Uzun, B. (2022). Breast Cancer Screening Based on Supervised Learning and Multi-Criteria Decision-Making. Diagnostics, 12(6), 1326. [CrossRef]
- Uzun Ozsahin, D. , Mustapha, M. T., Bartholomew Duwa, B., & Ozsahin, I. (2022). Evaluating the Performance of Deep Learning Frameworks for Malaria Parasite Detection Using Microscopic Images of Peripheral Blood Smears. Diagnostics, 12(11), 2702. [CrossRef]
- Seyer Cagatan, A. , Taiwo Mustapha, M., Bagkur, C., Sanlidag, T., & Ozsahin, D. U. (2022). An Alternative Diagnostic Method for C. neoformans: Preliminary Results of Deep-Learning Based Detection Model. Diagnostics, 13(1), 81. [CrossRef]
- Yun, S. , Han, D., Chun, S., Oh, S. J., & Yoo, Y. (2019). CutMix: Regularization strategy to train strong classifiers with localizable features. Proceedings of the IEEE/CVF International Conference on Computer Vision (ICCV), 2019, pp. 6023–6032.
Disclaimer/Publisher’s Note: The statements, opinions and data contained in all publications are solely those of the individual author(s) and contributor(s) and not of MDPI and/or the editor(s). MDPI and/or the editor(s) disclaim responsibility for any injury to people or property resulting from any ideas, methods, instructions or products referred to in the content. |
© 2025 by the authors. Licensee MDPI, Basel, Switzerland. This article is an open access article distributed under the terms and conditions of the Creative Commons Attribution (CC BY) license (http://creativecommons.org/licenses/by/4.0/).
Copyright: This open access article is published under a Creative Commons CC BY 4.0 license, which permit the free download, distribution, and reuse, provided that the author and preprint are cited in any reuse.


