Submitted:
15 January 2026
Posted:
16 January 2026
You are already at the latest version
Abstract
Background/Objectives: Astragalus root is a classical qi-tonifying traditional Chinese medicine that has demonstrated potential therapeutic efficacy in T2DM and NAFLD. However, the precise mechanisms underlying its effects on the comorbidity of these two disorders remain unclear. This study investigated the molecular mechanisms by which astragalus root ameliorated T2DM-NAFLD comorbidity. Methods: Network pharmacology, molecular docking, molecular dynamics simulation, and in vitro experiments were employed to elucidate the potential roles and mechanisms of astragalus root in the management of T2DM-NAFLD comorbidity. Results: A total of 25 bioactive constituents and 152 corresponding targets associated with astragalus root were identified. PPI network analysis revealed the top ten core candidate targets, among which six possessed suitable crystal structures for molecular docking, including IL-6, AKT1, JUN, TNF, CASP3, and ESR1. KEGG analysis further identified the PI3K-AKT as the most significantly en-riched pathway. Molecular docking of the principal bioactive constituent formononetin from astragalus root with the six core targets was conducted using AutoDock4 software. Molecular dynamics simulations verified the stability of the interactions between for-mononetin and each of the six core target proteins. In vitro experiments demonstrated that formononetin obviously decreased lipid droplet accumulation, downregulated TC and TG levels, suppressed the expression of TNF-α, IL-6, and IL-1β, decreased ROS and MDA levels, and enhanced GSH content and SOD activity. These therapeutical effects were achieved through inhibition of protein expression within the PI3K/AKT/mTOR signaling pathway. Conclusions: This study determined the potential therapeutic targets and underlying mechanisms of formononetin derived from astragalus root in the T2DM-NAFLD management, thereby providing a scientific basis for its clinical application.
Keywords:
astragalus root
; formononetin
; T2DM-NAFLD
; network pharmacology
; molecular docking
; molecular dynamics simulation
1. Introduction
Type 2 diabetes mellitus (T2DM) is a chronic metabolic disorder characterized by sustained hyperglycemia resulting from impaired insulin secretion and/or reduced insulin sensitivity [1]. At present, ~ 537 million adults are affected by diabetes worldwide, of which T2DM accounts for nearly 90%, and this figure may rise to 783 million by 2045, with incidence continuing to increase [2]. Notably, T2DM is largely irreversible once established, and dysfunction of the liver, kidneys, and cardiovascular system represents frequent complications, for which effective therapeutic approaches to reverse organ injury remain limited [3]. NAFLD is a metabolic disorder defined by excessive lipid accumulation in hepatocytes after exclusion of alcohol consumption and other identifiable causes of liver injury [4]. Evidence indicates that obesity and insulin resistance constitute shared pathogenic drivers of both NAFLD and T2DM [5], and the two conditions commonly coexist and interact synergistically. Their relationship is considered bidirectional: T2DM accelerates NAFLD progression by enhancing hepatic lipogenesis and suppressing fatty acid oxidation, whereas NAFLD aggravates insulin resistance through the release of free fatty acids and pro-inflammatory mediators, thereby elevating the risk of T2DM complication [6]. In the presence of concurrent T2DM and NAFLD, patients exhibit more severe insulin resistance, along with a markedly increased risk of liver fibrosis progression and cardiovascular events, imposing substantial burdens on quality of life and public health system [7]. Current clinical management relies primarily on lifestyle modification combined with hypoglycemic, lipid-lowering, and hepatoprotective agents; however, these approaches are constrained by limited efficacy, adverse effects, and the complexity of polypharmacy [8]. Integrated therapeutic strategies capable of simultaneously targeting T2DM, NAFLD, and their associated complications remain insufficient. Consequently, the identification of novel interventions with multi-target and systemic regulatory properties is essential for interrupting the pathogenic interplay between T2DM and NAFLD and improving overall metabolic health.
Traditional Chinese Medicine (TCM) is founded on syndrome differentiation and a holistic therapeutic framework. The concept that distinct diseases may be managed using similar therapeutic strategies, as guided by TCM theory, offers a distinctive perspective for addressing complex comorbid conditions. Owing to its broad availability and accessibility, TCM is associated with a lower incidence of adverse drug reactions compared with chemical pharmaceuticals and achieves synergistic therapeutic effects through multi-target and multi-pathway regulation. Accordingly, TCM demonstrates particular strengths in the management of chronic and refractory diseases [9]. Astragalus root is a classical qi-tonifying herb in TCM, derived from the leguminous plant Astragalus membranaceus (Fisch.) Bge. var. mongholicus (Bge.) Hsiao. Over many years of clinical application, astragalus root has exhibited therapeutic potential in the treatment of consumptive thirst (analogous to T2DM) and liver–spleen disharmony, attributable to its pharmacological activities, including glycemic control, lipid regulation, anti-inflammatory effects, and improvement of hepatic steatosis [10]. Contemporary studies have demonstrated that total astragalosides derived from astragalus root can ameliorate T2DM by modulating gut microbiota homeostasis, enhancing hepatic insulin signaling, suppressing hepatic glucose production, and promoting glycogen synthesis [11]. Astragalus polysaccharides have been shown to attenuate hepatic inflammation and lipid accumulation in NAFLD through regulation of gut microbiota and the SCFA-GPR signaling pathway [12]. In addition, astragaloside has been reported to mitigate diabetic liver injury in T2DM rat models by activating AMPK/mTOR-mediated autophagy [13]. Thus, these observations indicate that astragalus root may exert broad regulatory effects through the coordinated actions of multiple bioactive constituents. Although the therapeutic potential of astragalus root and its bioactive constituents in T2DM and NAFLD has been supported by clinical evidence, the precise mechanisms underlying its effects on this comorbid state remain unclear, particularly with respect to its integrated regulation of shared pathological networks involving insulin resistance, lipid metabolism disorders, and chronic inflammation. Such uncertainty substantially constrains its precise clinical application and modernization of drug development. Accordingly, a systematic elucidation of the material basis and mechanistic pathways through which astragalus root intervenes in T2DM-NAFLD comorbidity holds substantial value for informing novel clinical therapeutic strategies.
With the rapid advancement of bioinformatics and big data analytics, the integration of informatics technologies has assumed an increasingly important role in elucidating the mechanisms underlying TCM, demonstrating broad potential in the investigation of chronic diseases, tumors, and immune regulation. Within this framework, network pharmacology has emerged as a key approach for analyzing the complex systems inherent to TCM and is frequently combined with molecular docking and molecular dynamics (MD) simulation [14]. Molecular docking and simulation are widely applied in the identification of candidate compounds and in the delineation of pathological pathways associated with comorbid conditions through detailed characterization of drug–target interactions, thereby providing a theoretical foundation for the optimization of combination therapeutic strategies [15].
At present, an integrated research strategy combining network pharmacology, molecular docking, MD simulation, and in vitro experimental validation has become a prevailing paradigm for systematically clarifying the mechanisms by which TCM intervenes in complex diseases, including metabolic comorbidities. In this study, the potential mechanisms by which Astragalus root treats T2DM-NAFLD were investigated using the above four approaches, with systematic identification of key targets and signaling pathways (Figure 1). This approach was designed to provide deeper insight into shared therapeutic targets for comorbid diseases through the integration of traditional medical theory with modern pharmacological methodologies.
2. Results
2.1. Gene Landscape of T2DM-NAFLD Co-Expression
An integrated bioinformatics approach was applied using the above four databases, through which 1,995 genes concurrently associated with T2DM-NAFLD were identified (Figure 2A–C). Functional enrichment analysis indicated that these genes were predominantly involved in the pattern specification process (biological process, BP), microbody organelle, cellular components (cellular component, CC), and ubiquitin-protein transferase activity in molecular functions (molecular function, MF) (Figure 2D). KEGG analysis showed the IgSF CAM signaling pathway exhibited the highest degree of enrichment (Figure 2D). Construction of a PPI network based on STRING analysis further supported these observations (Figure 2E). Core gene targets were ultimately determined through integrated analysis using the above four algorithms implemented in the CytoHubba plugin of Cytoscape software (Figure 2F,G).
2.2. Network Pharmacology Analysis and Identification of Hub Targets for Astragalus Root in T2DM-NAFLD
To clarify the potential molecular targets of astragalus root, comprehensive target prediction was performed using the SwissTargetPrediction database, resulting in the identification of 152 candidate therapeutic targets (Figure 3A). Functional enrichment analysis revealed that these targets were distributed across 4,031 biological pathways, including 3,907 GO terms and 124 KEGG pathways. GO annotation was further categorized into 3,573 BP terms, 87 CC terms, and 247 MF terms. Visualization of GO enrichment indicated significant involvement in biological processes related to peptide hormone response (biological process, BP), cellular components associated with membrane rafts (cellular component, CC), and molecular functions linked to histone kinase activity (molecular function, MF) (Figure 3C). KEGG pathway analysis further demonstrated that the PI3K-AKT signaling pathway exhibited the most significant enrichment among all identified pathways (molecular function, Figure 3D).
To determine core regulatory nodes linking astragalus root to the pathogenesis of T2DM-NAFLD, a comprehensive PPI network construction used the STRING database and was subjected to topological analysis in Cytoscape software (Figure 3B). Network clustering based on the MCODE plugin with default parameters identified densely connected functional modules, from which ten topologically significant candidate hub genes were initially selected (Figure 3E). Subsequently, network influence was quantitatively assessed using the CytoHubba tool with four stringent centrality algorithms, leading to the identification of high-confidence consensus hub targets (Figure 3F). Validation using UpSet plots demonstrated strong concordance among the algorithms, with six core genes—IL-6, AKT1, JUN, TNF, CASP3, and ESR1—consistently ranked among the top candidates across all four independent topological methods. These genes were therefore defined as a highly reliable core regulatory network potentially mediating the effects of astragalus root in T2DM-NAFLD (Figure 3G).
2.3. Validation of Interactions Between Astragalus Root and Potential Targets Through Molecular Docking
To verify the binding interactions between astragalus root and the six prioritized hub targets, molecular docking simulations were conducted using AutoDock4 software. Computational results indicated that the principal bioactive constituents of astragalus root exhibited stable binding affinities with all target proteins, with calculated binding free energies (ΔG) reflecting favorable thermodynamic profiles (Figure 4A). Structural analysis of the optimal docking conformations demonstrated that formononetin established stable complexes with the targets through multiple noncovalent interactions, including conventional hydrogen and carbon–hydrogen bonds, and hydrophobic interactions (e.g., hydrophobic pocket of valine, alanine, and leucine), primarily involving π-alkyl, π-anion, π-cation, π-σ, π-sulfur, and π-lone pair electron interactions, as well as π–π stacking(Figure 4B-G). Collectively, these intermolecular interactions contributed to stabilization of the ligand–protein complexes and provided mechanistic insight into the regulatory actions of astragalus root on signaling pathways associated with T2DM-NAFLD.
2.4. Validation of the Binding Affinity Between Formononetin and Potential Targets via MD Simulation
To comprehensively evaluate the binding stability and conformational behavior of formononetin in complex with six key target proteins, 100-nanosecond all-atom MD simulations were conducted under physiological conditions using GROMACS (2024.3). Trajectory data were analyzed with GROMACS internal tools to quantify structural stability parameters, including RMSD, RMSF, intermolecular hydrogen bonding, Rg, and Gibbs free energy landscapes derived from PCA analysis. RMSD profiles indicated that most protein–ligand complexes maintained stable conformations throughout the simulation period; however, the JUN complex displayed instability during later stages (after 10 nanoseconds), and CASP3 exhibited noticeable deviation in the late phase of the simulation, exceeding 0.1 nanometers after 30 nanoseconds, suggestive of conformational drift (Figure 5A). RMSF analysis revealed region-specific flexibility, with CASP3 demonstrating moderate fluctuations within the range of 0.10–0.20 nanometers, whereas the remaining complexes showed relatively higher overall residue flexibility (Figure 5B). Rg analysis further indicated that most target proteins preserved compact global conformations, reflecting sustained structural integrity during the simulation (Figure 5C). SASA analysis indicated that JUN exhibited the lowest solvent exposure (33–36 nm2), whereas IL-6 and CASP3 displayed moderate exposure levels (90–100 nm2) (Figure 5D). Hydrogen bond analysis demonstrated that AKT1, IL-6, and CASP3 maintained relatively stable anchoring interactions, with 1–4 hydrogen bonds formed per 100 nanoseconds, while JUN and TNF showed greater variability; ESR1 remained in an unstable low-bonding state, with an average hydrogen bond number below one (Figure 5E). The Gibbs free energy landscape, constructed by projection onto the first two principal components, revealed deep and concentrated energy wells for AKT1, ESR1, IL-6, and CASP3, characterized by narrow 2D basins and sharp 3D valleys, indicating stable binding conformations near the global minimum. JUN demonstrated intermediate stability, whereas TNF exhibited a highly dispersed energy landscape with fragmented shallow basins and elevated energy levels, suggestive of increased conformational entropy and reduced stability (Figure 5F-G). MM-PBSA binding free energy calculations (ΔGMMPBSA) showed that formononetin displayed the strongest binding affinity toward TNF and ESR1 (ΔMMPBSA ≥ −33 kcal/mol). Although binding to the remaining four core proteins was weaker, measurable affinity was still observed (ΔMMPBSA ≥ −14 kcal/mol) (Figure 5H-J).
2.5. Effects of Formononetin on Cell Viability and Lipid Metabolism in HepG2 Cells
The cytotoxic potential of formononetin was evaluated using the CCK-8 assay to assess its effects on HepG2 cell viability. A concentration-dependent inhibitory effect on cell proliferation was observed. At low concentrations (5-20 μM/mL), no statistically significant difference in cell viability was detected compared with the control group (p > 0.05). A significant reduction in cell survival was observed at concentrations of 40 μM/mL and above (P < 0.01) (Figure 6A).
Quantitative measurements of key lipid markers within this safe concentration range revealed that, in the model group, both TC and TG levels were significantly elevated (P < 0.01). Treatment with formononetin resulted in a significant and dose-dependent reduction in these intracellular TC and TG concentrations (P < 0.01) (Figure 6B, C). These data indicate that formononetin effectively mitigates abnormalities in intracellular lipid metabolism. The ameliorative effect on lipid deposition was further corroborated by morphological observation. Oil Red O staining confirmed successful model establishment, as cells in the model group exhibited dense, red-stained lipid droplets (P < 0.01). Formononetin treatment induced a clear dose-dependent attenuation of this phenotype. The low-dose group showed a reduction in droplet number and a more dispersed distribution; the medium-dose group presented a more significant decrease alongside reduced droplet size; and the high-dose group demonstrated a substantial reduction in both the number and volume of lipid droplets compared to the model group (Figure 6D). Collectively, these results demonstrate that formononetin, within a non-cytotoxic concentration range, effectively alleviates lipid metabolic dysregulation in HepG2 cells by lowering critical lipid levels and reducing lipid droplet accumulation.
2.6. Effects of Formononetin on Oxidative Stress and Inflammatory Response in HepG2 Cells
The protective effects of formononetin against T2DM-NAFLD-related cellular injury were systematically evaluated across oxidative stress, inflammation, and key signaling pathways. As shown in Figure 7A, intracellular ROS and MDA levels in the model group were markedly elevated (P < 0.01), whereas SOD activity and GSH content were significantly reduced (P < 0.01). In contrast, treatment with formononetin significantly decreased ROS and MDA levels (P < 0.01) while elevating SOD activity and GSH levels (P < 0.01) relative to the model group. These results indicate that formononetin exerts protective effects by attenuating intracellular oxidative stress–associated damage.
Concurrently, formononetin demonstrated a potent anti-inflammatory effect. Assessment of inflammatory cytokines demonstrated that, intracellular levels of TNF-α (Figure 7B.c), IL-6 (Figure 7B.a), and IL-1β (Figure 7B.b) were significantly increased in the model group (P < 0.01). Relative to the model group, formononetin treatment significantly reduced the expressions of TNF-α, IL-6, and IL-1β (P < 0.01). This suppression was consistent at the transcriptional level, where the mRNA expressions of TNF-α, IL-6, and IL-1β were also significantly elevated (P < 0.01) in the model group and markedly reduced by formononetin treatment (P < 0.01) (Figure 7C). These findings indicate that formononetin effectively suppresses intracellular inflammatory mediator expression and attenuates the cellular inflammatory response.
2.7. Effects of Formononetin on the PI3K/AKT/mTOR Pathway at Transcriptional and Translational Levels
Further mechanistic investigation revealed that formononetin’s actions involved the modulation of the PI3K/AKT/mTOR signaling pathway, which is closely associated with inflammatory and metabolic regulation. In model group, mRNA expressions of PI3K, AKT, and mTOR—core components of the PI3K-AKT signaling pathway closely associated with inflammatory regulation—were also markedly increased (P < 0.01) (Figure 8B.a-c). Relative to the model group, accompanied by a significant decrease in PI3K, AKT, and mTOR transcript levels (P < 0.01) (Figure 8B.a-c). Consistent with the transcriptional inhibition, western blot analysis further demonstrated that formononetin suppressed the pathway at the post-translational level. Compared with the control group, the phosphorylation levels of PI3K, AKT, and mTOR proteins were significantly increased in the model group (P < 0.01). Formononetin treatment significantly reduced the phosphorylation of these key signaling proteins relative to the model group (P < 0.05) (Figure 8A, C). These results at the mRNA and phospho-protein levels conclusively indicate that formononetin downregulates the activity of the PI3K/AKT/mTOR signaling pathway. This suppression likely contributes to its observed therapeutic effects in the T2DM-NAFLD model by modulating downstream inflammatory and metabolic processes.
3. Discussion
T2DM frequently coexists with NAFLD and represents one of the most significant risk factors contributing to NAFLD progression [16]. In recent years, TCM has demonstrated systemic regulatory advantages through multi-target and multi-pathway actions in the prevention and management of complex disorders such as T2DM and NAFLD. Bioactive constituents derived from Astragalus root have exhibited notable therapeutic potential. Previous studies have reported that Astragalus polysaccharides markedly alleviate hepatic lipid accumulation and inflammatory responses in NAFLD model rats, whereas astragaloside exerts significant anti-oxidative stress and anti-inflammatory effects in T2DM models [17,18]. Nevertheless, investigations focusing on the comorbid state of T2DM-NAFLD remain comparatively limited. Network pharmacology, molecular docking, and MD simulation provide efficient strategies for identifying bioactive compounds and their potential molecular targets. In the present study, formononetin, a representative constituent of Astragalus root, was selected and analyzed to elucidate its therapeutic mechanisms in the context of T2DM-NAFLD comorbidity.
This study systematically identified six key targets—IL-6, AKT1, JUN, TNF, CASP3, and ESR1—through integrated network pharmacology analysis, molecular docking, and MD simulation, indicating that these molecules may represent potential therapeutic targets of astragalus root in T2DM-NAFLD. These targets are jointly involved in the shared pathological mechanisms underlying T2DM and NAFLD. IL-6 is a multifunctional cytokine implicated in the regulation of inflammatory responses and hepatic regeneration and has been associated with the progression of insulin resistance [19]. TNF-α is recognized as an inflammatory mediator closely linked to NAFLD pathogenesis and may promote hepatic insulin resistance, thereby connecting inflammatory signaling with metabolic dysregulation and contributing to NAFLD-related comorbidities [20]. AKT1 functions as a central kinase governing metabolism, cell growth, and survival, mediating key insulin-driven processes such as glucose uptake and lipid metabolism, and represents a critical node in the development of both T2DM and NAFLD [21,22]. CASP3, a principal effector of apoptosis, is involved in the regulation of programmed cell death and has been implicated in the pathophysiology of T2DM and NAFLD [23,24]. ESR1 is important in regulating glucose and lipid metabolism and hepatic homeostasis and interacts with AKT1 and TNF-α through signaling pathway crosstalk, collectively contributing to the initiation and progression of T2DM-NAFLD comorbidity [25,26]. Molecular docking analysis demonstrated that formononetin, a major bioactive constituent of astragalus root, exhibited strong binding affinity toward these targets. MD simulations further indicated that the formononetin–target complexes possessed favorable conformational stability, characterized by limited backbone fluctuations, persistent key hydrogen bonds throughout the simulation, and deep Gibbs free energy minima derived from binding free energy calculations. Collectively, these results substantiate the robustness of the analytical strategy employed and support the therapeutic potential of astragalus root in the management of T2DM-NAFLD comorbidity.
GO functional enrichment analysis delineated the potential biological mechanisms through which astragalus root intervened in T2DM-NAFLD, demonstrating close associations with key functional modules, including response to peptide hormones, membrane rafts, and histone kinase activity. KEGG analysis further identified the PI3K-AKT signaling pathway as a central pathway involved in T2DM-NAFLD comorbidity. This pathway is known to regulate insulin sensitivity, cell survival, and metabolic processes and is tightly linked to glycemic homeostasis in T2DM as well as the development of hepatic lipid metabolism disorders in complications such as NAFLD [27,28]. Regulation of PI3K-AKT signaling has been widely recognized as an effective approach for ameliorating metabolic dysfunction in T2DM and NAFLD. For instance, curcumin has been reported to enhance insulin sensitivity and slow diabetes progression through modulation of the PI3K-AKT pathway [29]. Ginseng polypeptides could alleviate hyperglycemia, insulin resistance, and multi-organ injury in db/db mice via PI3K-AKT–mediated signaling [30]. Mulberry polyphenols regulate genes involved in lipid metabolism and inflammation, with their effects closely associated with PI3K-AKT pathway modulation [31]. In addition, Compound Pearl Lipid-Lowering Capsules have demonstrated protective effects in T2DM-NAFLD models through regulation of PI3K-AKT signaling [32]. Collectively, these studies support the therapeutic relevance of targeting the PI3K-AKT pathway. Consistently, network pharmacology analysis in the present study also identified PI3K-AKT signaling as a major mechanism through which formononetin mediated its regulatory effects.
Based on bioinformatics analyses, the therapeutic potential of formononetin, a representative bioactive constituent of astragalus root, was further evaluated using an in vitro T2DM-NAFLD cell model, with emphasis on three core pathological processes: lipid accumulation, oxidative stress, and inflammatory response. Within the spectrum of NAFLD, factors related to hepatic lipid deposition, mitochondrial oxidative capacity, and lipoprotein secretion contribute to an increased risk of T2DM in affected individuals [33]. When T2DM and NAFLD coexist, the impact of these pathogenic factors is further amplified. Consequently, patients with T2DM-NAFLD comorbidity frequently exhibit pathological features such as excessive intracellular lipid droplet accumulation and elevated TC and TG levels [34]. Experimental observations demonstrated that formononetin markedly reduced intracellular lipid deposition and downregulated TC and TG levels, providing preliminary evidence for its capacity to ameliorate hepatic lipid metabolism disturbances. Oxidative stress and inflammation represent major drivers in the initiation and progression of both T2DM and NAFLD. Previous studies have shown that inflammatory mediators, including TNF-α and IL-6, interact synergistically with oxidative stress, forming a vicious pathological cycle in T2DM-NAFLD [35]. Clinical evidence has further indicated a strong association between alterations in antioxidant defense markers, such as SOD, GSH-Px, and GSH, and lipid peroxidation levels in patients with T2DM-NAFLD [36]. In addition, ectopic lipid accumulation and dysregulated serum lipid profiles characterized by elevated low-density lipoprotein cholesterol promote the activation and release of deleterious cytokines and chemokines, including IL-6, TNF-α, monocyte chemoattractant protein-1, and cell adhesion molecules, which are hallmarks of T2DM-NAFLD [37]. Consistently, elevated levels of TNF-α, IL-6, IL-1β, ROS, and MDA, along with reduced GSH content and SOD activity, were observed in the T2DM-NAFLD model. Intervention with formononetin significantly reversed these alterations in pro-inflammatory and oxidative stress–related indicators, indicating that its beneficial effects may be mediated through attenuation of oxidative damage and inflammatory responses. Overall, it shows that formononetin exerts therapeutic effects in T2DM-NAFLD comorbidity by modulating lipid accumulation, oxidative stress, and inflammation.
The PI3K/Akt/mTOR is a major intracellular signaling pathway involved in multiple physiological processes, including apoptosis, hepatic gluconeogenesis, and cell cycle regulation [38]. PI3K comprises a family of kinases that catalyze phosphorylation of phosphatidylinositol at the 3-position, thereby participating in inositol lipid metabolism via second messengers and transmitting insulin signals via interaction with IRS-2 [39]. AKT functions as a direct downstream effector of PI3K and mediates diverse insulin-related biological activities, primarily regulating glucose uptake and lipid metabolism [40]. Phosphorylation of PI3K represents a key event in pathway activation and requires the involvement of mTOR. mTOR acts as a central regulatory protein controlling multiple physiological functions. Once PI3K is phosphorylated, downstream AKT is rapidly activated and subsequently promotes mTOR activation, a sequence of events that contributes to insulin resistance and accelerates the progression of T2DM [41]. In addition, activation of mTOR suppresses autophagy at early stages through regulation of the Atg1–Atg13 complex. Given the intricate interplay between PI3K/Akt/mTOR signaling and autophagic processes, this pathway is closely associated with NAFLD pathogenesis [42]. Previous investigations have demonstrated that suppression of pathway phosphorylation can modulate intracellular lipid metabolism and attenuate inflammatory responses [43]. Expressions of total PI3K and its phosphorylated form reflect pathway activation status and downstream signal transduction efficiency [44]. In high-fat diet–induced NAFLD animal models, inhibition of PI3K/Akt/mTOR signaling can alleviate hepatocellular injury and lipid metabolic disturbances [45]. Consistent with these observations, RT-qPCR and Western blot analyses revealed elevated expression of p-PI3K, p-Akt, and p-mTOR in HepG2 cells from the model group, indicating activation of the PI3K/Akt/mTOR pathway. Following formononetin treatment, protein levels of p-PI3K, p-Akt, and p-mTOR were markedly reduced in HepG2 cells. These results indicate that modulation of the PI3K/Akt/mTOR signaling pathway represents a potential mechanism by which formononetin exerts protective effects against T2DM-NAFLD comorbidity.
In summary, the present study systematically identified the potential therapeutic targets of formononetin, a bioactive constituent of astragalus root, in T2DM-NAFLD through integrated network pharmacology analysis across multiple databases, in combination with molecular docking, MD simulation, and in vitro experimental validation, thereby offering valuable insights for clinical translation. Despite the translational relevance of these results, several limitations warrant further investigation. First, the in vivo blood entry characteristics, core bioactivity, and correspondence between formononetin and its molecular targets remain insufficiently defined. Future studies should address these issues through animal-based pharmacokinetic analyses and in vivo target validation. Second, experimental verification was limited to the PI3K/Akt/mTOR signaling pathway, while its upstream and downstream regulatory networks and more detailed mechanistic features have yet to be elucidated. Subsequent investigations integrating multi-omics approaches and clinical sample analyses are required to clarify the underlying molecular mechanisms and to further substantiate the clinical relevance.
4. Materials and Methods
4.1. Reagents and Materials
Formononetin (FM, batch No. HF012465) was obtained from Baoji Chenguang Biotechnology Co., Ltd., China. Oil Red O powder (batch No. O0625) and bovine serum albumin (BSA) (batch No. SRE0096) were sourced from Sigma-Aldrich, USA. D- (+)-Glucose anhydrous (batch No. G8150) was provided by Beijing Solarbio Science & Technology Co., Ltd., China. High-glucose DMEM medium (batch No. 12491015), fetal bovine serum (FBS) (batch No. 12664025), and penicillin-streptomycin solution (batch No. 15140-122) used for cell culture were supplied by Gibco, USA. The total cholesterol (TC) (batch No. E1015) and triglyceride (TG) (batch No. E1013) assay kits were purchased from Applygen Technologies Inc., Beijing, China. Assay kits for the detection of reactive oxygen species (ROS) (batch No. E-BC-K138-F), glutathione (GSH) (batch No. E-BC-K030-S), superoxide dismutase (SOD) (batch No. E-BC-K020-M), and malondialdehyde (MDA) (batch No. E-BC-K028-M) were provided by Elabscience Biotechnology Co., Ltd., Wuhan. Enzyme-linked immunosorbent assay (ELISA) kits for tumor necrosis factor-α (TNF-α) (batch No. KE10002), interleukin-6 (IL-6) (batch No. KE10091), and interleukin-1β (IL-1β) (batch No. KE10003) were purchased from Wuhan San Ying Biotechnology Co., Ltd., Wuhan. All antibodies, including PI3K (batch No. 4257T), p-PI3K (batch No. 17366S), AKT (batch No. 9272S), p-AKT (batch No. 4060T), mTOR (batch No. 2972S), p-mTOR (batch No. 5536T), and β-actin (batch No. 8457T), were purchased from Cell Signaling Technology, USA, and all procedures were strictly performed according to the manufacturers’ instructions.
4.2. Network Pharmacology Analysis
4.2.1. Disease-Related Targets of T2DM and NAFLD
To identify genes related to T2DM and NAFLD, four databases (GeneCards, PharmGKB, OMIM, and TTD) were systematically queried using the keywords “T2DM” and “NAFLD.” The search parameters were defined with a GeneCards relevance score threshold of ≥ 1. Following duplicate removal and data integration, gene sets associated with T2DM and NAFLD were obtained.
4.2.2. Drug Targets of Astragalus Root
Bioactive constituents of Astragalus root were retrieved from the TCMSP database (OB ≥ 30% and DL ≥ 0.18). Corresponding target proteins of these constituents were predicted using the SwissTargetPrediction database. The overlap between the predicted drug targets and the disease-related targets of T2DM and NAFLD was defined as the potential targets of Astragalus root in treating T2DM-NAFLD comorbidity.
4.2.3. GO and KEGG Analyses
To study the mechanisms by which astragalus root intervenes in T2DM-NAFLD, GO and KEGG analyses were conducted on the intersecting genes. A P < 0.05 (threshold) was applied to identify significantly enriched terms, and the top-ranked results were visualized using bubble plots and Sankey diagrams.
4.2.4. PPI Network
A PPI network was generated using the STRING database, incorporating co-expressed genes associated with T2DM-NAFLD and 152 target genes related to astragalus root-T2DM-NAFLD. The organism was restricted to Homo sapiens, and the interaction confidence score was set at 0.40. For network visualization and quantitative assessment of node centrality, interaction data in TSV format were obtained from STRING and imported into Cytoscape software (version 3.6.0), followed by analysis using the CytoHubba plugin.
4.2.5. Identification of Hub Genes
Core regulatory genes were systematically identified from the T2DM-NAFLD co-expression network and the astragalus root–T2DM-NAFLD target network using the CytoHubba module in Cytoscape software (v3.6.0). Within the T2DM-NAFLD co-expression network, four topological algorithms were applied to calculate node centrality: Degree, reflecting direct connectivity; EPC, assessing network robustness; MCC, representing density-weighted clustering; and MNC, indicating local network scale. Nodes were ranked according to each algorithm, and the top 10 candidates were extracted. Final hub genes were defined by the strict intersection of the results derived from all four analytical methods.
4.3. Molecular Docking
Bioactive constituents of astragalus root were retrieved from the PubChem database. Solvent molecules were removed using PyMOL software, followed by hydrogen addition and charge assignment with AutoDock Tools version 1.5.6. The bioactive constituents were docked with the six previously identified core targets, and compounds exhibiting favorable docking scores across all six targets were designated as core components.
4.4. MD Simulation
MD simulation was conducted to further validate and characterize protein–ligand binding interactions. MD simulations of the protein–ligand complexes were performed using the GROMACS 2025.3 software package. Each system was embedded in a periodic cubic box, solvated with the AMBER14SB force field and the TIP3P water model, and topology files for small molecules were generated by sobtop program. Counterions were introduced to achieve physiological ionic strength (150 mM NaCl). Following energy minimization and stepwise NPT equilibration under positional constraints (100 ps), a 100 ns production run was carried out with a 2 fs integration time step. Simulation trajectories were processed to eliminate periodic boundary effects and to recenter the system. Subsequent analyses included calculation of the RMSD and Rg of protein backbone Cα atoms, RMSF of individual residues, solvent-accessible surface area (SASA), and the number of protein–ligand hydrogen bonds.
MM-PBSA approach was applied to estimate the binding free energy (ΔGbind). In addition, 2D and 3D free energy landscapes (FEL) were constructed to visualize conformational stability of the complexes. These landscapes, defined by Rg and RMSD coordinates, depicted the free energy distribution within conformational space, in which deep blue low-energy regions represented global minima corresponding to thermodynamically stable conformations.
4.5. Cell Culture and Treatment
HepG2 cells (batch No.TCH-C196) were obtained from Suzhou Haixing Biosciences Co., Ltd. and maintained in high-glucose DMEM (10% FBS and 1% penicillin–streptomycin). Cultures were incubated under conditions of 37 °C and 5% CO2. The T2DM-NAFLD cellular model was established by exposure to free fatty acids (oleic acid/palmitic acid, 2:1) at 0.01 mM/mL in combination with high glucose (75 mM/L) for 24 hours at 37 °C.
4.6. Cell Viability Assay
Cells were seeded into 96-well plates at 1 × 10⁴ cells/well and cultured for 24 hours. Subsequently, treatment with graded concentrations of the test compound was performed for an additional 24 hours. After treatment, CCK-8 reagent (10 µL) was added to each well and incubated at 37 °C for 3 hours. Absorbance at 450 nm was measured using a microplate reader.
4.7. Oil Red O Staining
HepG2 cells were seeded into 6-well plates and exposed to 75 mM/L glucose, 1 mM/mL free fatty acids (oleic acid and palmitic acid ratio, 2:1), together with low, medium, and high concentrations of the drug components, as well as simvastatin, for 24 hours. After incubation, the culture medium was discarded, and the cells were rinsed twice with PBS. Fixation with 4% paraformaldehyde for 20 minutes was done, followed by removal of the fixative and two additional PBS washes. Oil Red O staining solution was then applied and incubated for 30 minutes. After removing staining solution, cells underwent washing three times using distilled water. Hematoxylin staining was subsequently carried out for 2 minutes, after which the cells were washed three times with distilled water. Differentiation was performed briefly using 1% hydrochloric acid ethanol, followed by removal of the solution and three washes with distilled water. Three randomly selected microscopic fields were captured, and lipid droplet areas were quantified using Image J software. For quantitative analysis, cells were stained with Oil Red O for 60 minutes, rinsed, and eluted with 1 mL isopropanol per well under gentle agitation. Absorbance at 490 nm was measured using a microplate reader.
4.8. Determination of Pharmacological Efficacy Indicators
HepG2 cells were seeded into 6-well plates and treated with 75 mM/L glucose, 1 mM/mL free fatty acids (oleic acid/palmitic acid, 2:1), and low, medium, or high concentrations of the drug component simvastatin for 24 hours. Levels of total cholesterol and triglycerides, oxidative stress markers (ROS, MDA, GSH, SOD), and inflammatory mediators (IL-6, IL-1β, TNF-α) in each group were determined based on the manufacturers’ instructions.
4.9. RT-qPCR
Total RNA was isolated from HepG2 cells using the Trizol method, and RNA concentration was quantified with a NanoDrop. Reverse transcription utilized PrimeScript RT Master Mix (Perfect Real Time) to synthesize cDNA. RT-qPCR analysis was subsequently conducted with TB Green Premix Ex Taq II on the qTOWER2.0 real-time PCR system (Germany). GADPH served as the internal reference, and relative gene expressions were calculated using the 2-ΔΔCt method. Table 1 shows primer sequences.
4.10. Western Blot
Total cellular protein was extracted from HepG2 cells using RIPA lysis buffer containing 1% protease inhibitor, and protein concentrations were determined using a BCA assay kit. Protein samples were separated by 4%–12% SDS–polyacrylamide gel electrophoresis and transferred onto PVDF membranes. Blocking was done with 5% non-fat milk for 1 hour and incubation was conducted with primary antibodies at 4 °C overnight. The primary antibodies included PI3K (1:1000), p-PI3K (1:1000), AKT (1:2000), p-AKT (1:2000), mTOR (1:1000), p-mTOR (1:1000), and β-actin (1:2000). Following triple TBST rinses, membranes were exposed to HRP-linked secondary antibodies (1:10,000) for 1 h and signals were detected by enhanced chemiluminescence. Data analysis used the t-test, with significance defined at P < 0.05.
4.11. Statistical Analysis
Experimental data were processed and visualized using IBM SPSS Statistics 26.0 and GraphPad Prism 8.3.0 software. For datasets following a normal distribution, one-way ANOVA was applied to evaluate differences among groups. Multiple comparisons were conducted using the LSD test under conditions of equal variance, whereas Dunnett’s T3 test was employed when variance homogeneity was not satisfied. Quantitative results are presented as (x̅ ± s). A significance threshold of P < 0.05 was adopted, and it was considered statistically significant.
5. Conclusions
This study systematically elucidated the potential therapeutic targets and underlying mechanisms of bioactive constituents from astragalus root in the context of T2DM-NAFLD through integrated network pharmacology analysis across multiple databases. Molecular docking analysis demonstrated that formononetin, the principal bioactive constituent of astragalus root, exhibited strong binding affinity toward core targets, including IL-6, AKT1, JUN, TNF, CASP3, and ESR1. Subsequent MD simulations indicated that the formononetin–target complexes maintained favorable conformational stability, supporting the role of formononetin as a key molecular mediator of astragalus root in T2DM-NAFLD intervention. In vitro experiments further confirmed that formononetin effectively reversed aberrant expression of lipid metabolism–related factors, pro-inflammatory mediators, and oxidative stress markers, thereby attenuating pathological injury induced by lipid accumulation, oxidative stress, and inflammatory responses. These therapeutic effects are associated with modulation of PI3K/AKT/mTOR pathway–related protein expression (Figure 9). Overall, this study offers novel insight into the shared pathophysiological basis of T2DM-NAFLD, clarifies the bioactivity and mechanistic actions of astragalus root constituent, and provides a scientific foundation for their potential clinical application.
Author Contributions
Conceptualization, J.L.; methodology, Y.G. and N.S.; software, Y.G.; validation, B.L. and N.S.; formal analysis, Y.Y.; resources, J.L. and B.L.; data curation, Y.G.; writing—original draft preparation, J.L.; writing—review and editing, J.L.; visualization, Y.Y.; funding acquisition, J.L., and J.L. All authors have read and agreed to the published version of the manuscript.
Funding
This research was funded by the Karamay Science and Technology Plan Project, Doctoral Science Foundation of Xinjiang Second Medical College (XGYK2025-102), and Scientific research project of Xinjiang Second Medical College.
Institutional Review Board Statement
Not applicable.
Informed Consent Statement
Not applicable.
Data Availability Statement
Data are contained within the article.
Acknowledgments
We thank Bullet Edits Limited for linguistic editing and proofreading of the manuscript.
Conflicts of Interest
The authors declare no conflicts of interest.
Abbreviations
The following abbreviations are used in this manuscript:
| T2DM | Type 2 diabetes mellitus |
| NAFLD | Non-alcoholic fatty liver disease |
| TCM | Traditional Chinese Medicine |
| LD | Linear dichroism |
| MD | Molecular dynamics |
| FM | Formononetin |
| FBS | Fetal bovine serum |
| TC | Total cholesterol |
| TG | Triglyceride |
| ROS | Reactive oxygen species |
| SOD | Superoxide dismutase |
| GSH | Glutathione |
| MDA | Malondialdehyde |
| TNF-α | Tumor necrosis factor-α |
| IL-1β | Interleukin-1β |
| IL-6 | Interleukin-6 |
| BP | Biological process |
| CC | Cellular component |
| MF | Molecular function |
| TTD | Therapeutic Target Database |
| EPC | EdgePercolation Component |
| MCC | Maximum Cluster Centrality |
| MNC | Maximum Neighborhood Component |
| RMSD | Root-mean-square deviation |
| RMSF | Root-mean-square fluctuation |
| SASA | Solvent Accessible Surface Area |
| ΔMMGBSA | Δ molecular mechanics-generalized-Born surface area; Rg: radius of gyration. |
References
- Ahmad, E.; Lim, S.; Lamptey, R.; Webb, D.R.; Davies, M.J. Type 2 diabetes. The Lancet. 2022, 400, 1803–1820. [Google Scholar] [CrossRef]
- Demir, S.; Nawroth, P.P.; Herzig, S.; Ekim Üstünel, B. Emerging Targets in Type 2 Diabetes and Diabetic Complications. Advanced science 2021, 8, e2100275. [Google Scholar] [CrossRef]
- Basil, B.; Adiri, W.; Ugwu, E.L.; Okoro, N.I. Association between vitamin D and metabolic-associated steatotic liver disease in type 2 diabetes mellitus patients: a systematic review and meta-analysis. Diabetol Metab Syndr. 2025, 17, 457. [Google Scholar] [CrossRef]
- Mantovani, A.; Dalbeni, A. Recent Developments in NAFLD. International Journal of Molecular Sciences 2022, 23, 2882. [Google Scholar] [CrossRef]
- Tanase, D.M.; Gosav, E.M.; Costea, C.F.; Ciocoiu, M.; Lacatusu, C.M.; Maranduca, M.A.; Ouatu, A.; Floria, M. The Intricate Relationship between Type 2 Diabetes Mellitus (T2DM), Insulin Resistance (IR), and Nonalcoholic Fatty Liver Disease (NAFLD). J. Diabetes Res. 2020, 1–16. [Google Scholar] [CrossRef] [PubMed]
- Tilg, H.; Moschen, A.R.; Roden, M. NAFLD and diabetes mellitus. Nature reviews. Gastroenterology & hepatology. 2017, 14, 32–42. [Google Scholar]
- Shamansurova, Z.; Saatov, T.; Rakhmonova, G.; Khasanova, G.; Abdiev, I.; Aikhodjaeva, M.; Maksutova, N. Linkage of NAFLD with diabetes complications. Physiology. 2023, 38, 5730663. [Google Scholar] [CrossRef]
- Targher, G.; Corey, K.E.; Byrne, C.D.; Roden, M. The complex link between NAFLD and type 2 diabetes mellitus — mechanisms and treatments. Nat Rev Gastro Hepat. 2021, 18, 599–612. [Google Scholar] [CrossRef] [PubMed]
- Zhou, M.; Liu, X.; Wu, Y.; Xiang, Q.; Yu, R. Liver Lipidomics Analysis Revealed the Protective mechanism of Zuogui Jiangtang Qinggan Formula in type 2 diabetes mellitus with non-alcoholic fatty liver disease. J. Ethnopharmacol. 2024, 329, 118160. [Google Scholar] [CrossRef]
- Liu, Y.; Yu, R.; Wang, X.; Chen, Y.; Yin, T.; Gao, Q.; Sun, L.; Zheng, Z. Research progress of the effective active ingredients of Astragalus mongholicus in the treatment of diabetic peripheral neuropathy. Biomed Pharmacother. 2024, 173, 116350. [Google Scholar] [CrossRef]
- Liu, S.; Wang, L.; Zhang, Z.; Leng, Y.; Yang, Y.; Fu, X.; Xie, H.; Gao, H.; Xie, C. The potential of astragalus polysaccharide for treating diabetes and its action mechanism. Front Pharmacol. 2024, 15. [Google Scholar] [CrossRef] [PubMed]
- Liu, S.; Wang, L.; Zhang, Z.; Leng, Y.; Yang, Y.; Fu, X.; Xie, H.; Gao, H.; Xie, C. The potential of astragalus polysaccharide for treating diabetes and its action mechanism. Front Pharmacol. 2024, 15. [Google Scholar] [CrossRef]
- Zhu, Y.; Su, Y.; Zhang, J.; Zhang, Y.; Li, Y.; Han, Y.; Dong, X.; Li, W.; Li, W. Astragaloside IV alleviates liver injury in type 2 diabetes due to promotion of AMPK/mTOR-mediated autophagy. Mol Med Rep. 2021, 23, 437. [Google Scholar] [CrossRef]
- Banu, H.; Al-Shammari, E.; Shahanawaz, S.; Azam, F.; Patel, M.; Alarifi, N.A.; Ahmad, M.F.; Adnan, M.; Ashraf, S.A. Insights into the Therapeutic Targets and Molecular Mechanisms of Eruca sativa Against Colorectal Cancer: An Integrated Approach Combining Network Pharmacology, Molecular Docking and Dynamics Simulation. Pharmaceuticals 2025, 18, 453. [Google Scholar] [CrossRef] [PubMed]
- Hu, H.M.; Deng, J.L.; Pan, Y.; Wang, Z.H.; Zhang, J.; Yu Gu, X.; Fan, S.X.; Zhao, J.Z. Breviscapine targets EGFR and SRC to abrogate diabetes-driven GPX4 lactylation and ferroptosis resistance in gastric cancer. Phytomedicine 2025, 148, 157387. [Google Scholar] [CrossRef]
- George, H.; Permata, F.S.; D’Souza, C.M.; Adeghate, E.A. Cultural and Molecular Factors Predisposed to Non-Alcoholic Fatty Liver Disease and Type 2 Diabetes Mellitus. In Nutrients 2025, 17, 1797. [Google Scholar] [CrossRef] [PubMed]
- Zhong, M.; Yan, Y.; Yuan, H.; A, R.; Xu, G.; Cai, F.; Yang, Y.; Wang, Y.; Zhang, W. Astragalus mongholicus polysaccharides ameliorate hepatic lipid accumulation and inflammation as well as modulate gut microbiota in NAFLD rats. Food Funct. 2022, 13, 7287–7301. [Google Scholar] [CrossRef]
- Zhang, Y.; Yuan, Y.; Zhang, J.; Zhao, Y.; Zhang, Y.; Fu, J. Astragaloside IV supplementation attenuates cognitive impairment by inhibiting neuroinflammation and oxidative stress in type 2 diabetic mice. Front Aging Neurosci. 2022, 14. [Google Scholar] [CrossRef]
- Xie, F.; Zhu, J.; Hou, B.; Wang, Y.; Meng, F.; Ren, Z.; Ren, S. Inhibition of NF-κB activation improves insulin resistance of L6 cells. Endocr J. 2017, 64, 685–693. [Google Scholar] [CrossRef]
- Vityala, Y.; Palagudi, M.; Para, S.; Kamma, R.B.; Kotha, P.; Divity, S.; Tagaev, T. Association Between G308A Polymorphism of TNF-α Gene and TNF-α levels, Insulin Resistance and Histological Alterations in Patients with NAFLD. Metabolism - Clinical and Experimental. 2024, 153. [Google Scholar] [CrossRef]
- Li, S.; Hao, L.; Deng, J.; Zhang, J.; Hu, X. Coptidis rhizoma and evodiae fructus against lipid droplet deposition in nonalcoholic fatty liver disease-related liver cancer by AKT. Chem Biol Drug Des. 2023, 102, 828–842. [Google Scholar] [CrossRef] [PubMed]
- Yang, S.; Zhao, M.; Lu, M.; Feng, Y.; Zhang, X.; Wang, D.; Jiang, W. Network Pharmacology Analysis, Molecular Docking Integrated Experimental Verification Reveal the Mechanism of Gynostemma pentaphyllum in the Treatment of Type II Diabetes by Regulating the IRS1/PI3K/Akt Signaling Pathway. Current Issues in Molecular Biology 2024, 46, 5561–5581. [Google Scholar] [CrossRef]
- Li, Y.; Wu, F.; Zhang, J.; Xu, Y.; Chang, H.; Yu, Y.; Jiang, C.; Gao, X.; Liu, H.; Chen, Z.; et al. Mechanisms of Action of Potentilla discolor Bunge in Type 2 Diabetes Mellitus Based on Network Pharmacology and Experimental Verification in Drosophila. Drug design, development and therapy 2024, 18, 747–766. [Google Scholar] [CrossRef]
- Sun, C.; Zhao, P.; Yan, P.; Li, J.; Zhao, D. Investigation of Lonicera japonica Flos against Nonalcoholic Fatty Liver Disease Using Network Integration and Experimental Validation. In Medicina. 2022, 58, 1176. [Google Scholar] [CrossRef]
- He, Q.; Yin, Y.; Xu, Y.; Tan, X.; Wang, Y.; Zhang, W. Mechanistic insights into bisphenol A – Induced liver fibrosis: Evidence of PPARγ downregulation and AKT1/FN1 signaling from multi-level analysis. Ecotox Environ Safe. 2025, 303, 119068. [Google Scholar] [CrossRef]
- Dai, W.; Chen, C.; Dong, G.; Li, G.; Peng, W.; Liu, X.; Yang, J.; Li, L.; Xu, R.; Hu, X. Alleviation of Fufang Fanshiliu decoction on type II diabetes mellitus by reducing insulin resistance: A comprehensive network prediction and experimental validation. J. Ethnopharmacol. 2022, 294, 115338. [Google Scholar] [CrossRef]
- Lei, Y.; Huang, J.; Xie, Z.; Wang, C.; Li, Y.; Hua, Y.; Liu, C.; Yuan, R. Elucidating the pharmacodynamic mechanisms of Yuquan pill in T2DM rats through comprehensive multi-omics analyses. Front Pharmacol. 2023, 14. [Google Scholar] [CrossRef]
- Oh, K.; Yoon, S.; Lee, S.; Lee, S.Y.; Gupta, H.; Ganesan, R.; Sharma, S.P.; Won, S.; Jeong, J.; Kim, D.J.; et al. The convergent application of metabolites from Avena sativa and gut microbiota to ameliorate non-alcoholic fatty liver disease: a network pharmacology study. J. Transl Med. 2023, 21, 263. [Google Scholar] [CrossRef] [PubMed]
- Pokhrel, A.; Chong, K.T.; Tayara, H. Therapeutic potential of curcuminoids in type 2 diabetes mellitus (T2DM): Insights from network pharmacology, molecular docking, and dynamics simulations. Food Biosci. 2025, 68, 106406. [Google Scholar] [CrossRef]
- Liu, T.; Zhu, C.; Duan, Z.; Ma, P.; Ma, X.; Fan, D. Network Pharmacological Analysis Combined with Experimental Verification to Explore the Effect of Ginseng Polypeptide on the Improvement of Diabetes Symptoms in db/db Mice. J. Agr Food Chem. 2024, 72, 18537–18551. [Google Scholar] [CrossRef]
- Adiham, A.; Zhang, Z.; Han, F.; Han, C.; Yan, Y.; Huang, F.; Fei, Y.; Li, D.; Gong, P. Mulberry polyphenols alleviate nonalcoholic fatty liver disease: Action mechanisms via modulating the gut microbiota and PI3K-Akt signaling pathway. Food Biosci. 2025, 68, 106733. [Google Scholar] [CrossRef]
- Wang, H.; Tan, H.; Zhan, W.; Song, L.; Zhang, D.; Chen, X.; Lin, Z.; Wang, W.; Yang, Y.; Wang, L.; et al. Molecular mechanism of Fufang Zhenzhu Tiaozhi capsule in the treatment of type 2 diabetes mellitus with nonalcoholic fatty liver disease based on network pharmacology and validation in minipigs. J. Ethnopharmacol. 2021, 274, 114056. [Google Scholar] [CrossRef]
- Bian, L.; Tang, T.; Yu, Q.; Tong, X.; Hu, S.; You, Y.; Zhang, S.; Wang, H.; Fu, X.; Chen, J.; et al. Association between the triglyceride to high-density lipoprotein cholesterol ratio and type 2 diabetes mellitus in non-alcoholic fatty liver disease. Sci Rep-Uk 2024, 14, 31048. [Google Scholar] [CrossRef] [PubMed]
- Long, C.; Li, Z.; Jiang, L.; Yang, X.; Deng, S.; Jiang, Y.; Zhang, B.; Yue, R. Lipid droplet dynamics in type 2 diabetes and its complications: pathophysiological insights and therapeutic options. Lipids Health Dis. 2025, 24, 284. [Google Scholar] [CrossRef] [PubMed]
- Bhatti, J.S.; Sehrawat, A.; Mishra, J.; Sidhu, I.S.; Navik, U.; Khullar, N.; Kumar, S.; Bhatti, G.K.; Reddy, P.H. Oxidative stress in the pathophysiology of type 2 diabetes and related complications: Current therapeutics strategies and future perspectives. Free Radical Bio Med. 2022, 184, 114–134. [Google Scholar] [CrossRef] [PubMed]
- Meng, L.; Wei, G.; Chang, Z.; Zhao, Y.; Liu, H. Changes of Oxidative Stress in Peripheral Blood of Patients with T2DM and Its Relationship with Comorbid NAFLD. Chin J Lab Diagn. 2024, 28, 429–433. [Google Scholar]
- Liu, R.; Liu, R.; Liu, M.; Tian, Y.; Liu, J.; Wang, Y.; Sui, Q.; Zhang, J.; Xu, H.; Qi, Z. The inflammatory index and cytokines are associated with non-alcoholic fatty liver disease in type 2 diabetes mellitus. Frontiers in Medicine 2025, 12. [Google Scholar] [CrossRef]
- Ramasubbu, K.; Devi Rajeswari, V. Impairment of insulin signaling pathway PI3K/Akt/mTOR and insulin resistance induced AGEs on diabetes mellitus and neurodegenerative diseases: a perspective review. Mol Cell Biochem 2023, 478, 1307–1324. [Google Scholar] [CrossRef]
- Ji, X.; Dong, X.; Li, J.; Tai, G.; Qiu, S.; Wei, W.; Silumbwe, C.W.; Damdinjav, D.; Otieno, J.N.; Li, X.; et al. Fisetin Clears Senescent Cells Through the Pi3k-Akt-Bcl-2/Bcl-xl Pathway to Alleviate Diabetic Aortic Aging. Phytotherapy research PTR 2025, 10–1002. [Google Scholar] [CrossRef]
- Gao, W.; Wang, M.; Xu, W.; Ma, R.; Wang, X.; Sun, T.; Li, P.; Li, F.; He, Y.; Xie, X.; et al. Modified weiling decoction inhibited excessive autophagy via AKT/mTOR/ULK1 pathway to alleviate T2DM: Integrating network pharmacology and experimental validation. J. Ethnopharmacol. 2025, 347, 119753. [Google Scholar] [CrossRef]
- Lou, F.; Fu, T.; Li, Q.; Rao, P.; Peng, S.; Lu, S.; Wu, T.; Li, Q.; Xiao, J. Activation of autophagy mediated by PI3K/Akt/mTOR signalling cascade alleviates impaired adipose-derived stem cell osteogenesis in a diabetic microenvironment. Brit J Pharmacol. 2025, 182, 3522–3538. [Google Scholar] [CrossRef] [PubMed]
- Sun, C.; Zhang, J.; Hou, J.; Hui, M.; Qi, H.; Lei, T.; Zhang, X.; Zhao, L.; Du, H. Induction of autophagy via the PI3K/Akt/mTOR signaling pathway by Pueraria flavonoids improves non-alcoholic fatty liver disease in obese mice. Biomed Pharmacother. 2023, 157, 114005. [Google Scholar] [CrossRef] [PubMed]
- Zhang, J.; Feng, J.; Bai, Y.; Che, Q.; Cao, H.; Guo, J.; Su, Z. Ameliorating the effect and mechanism of chitosan oligosaccharide on nonalcoholic fatty liver disease in mice. Food Funct. 2023, 14, 10459–10474. [Google Scholar] [CrossRef]
- Taheri, R.; Mokhtari, Y.; Yousefi, A.; Bashash, D. The PI3K/Akt signaling axis and type 2 diabetes mellitus (T2DM): From mechanistic insights into possible therapeutic targets. Cell Biol Int. 2024, 48, 1049–1068. [Google Scholar] [CrossRef]
- Hu, M.; Chen, Y.; Deng, F.; Chang, B.; Luo, J.; Dong, L.; Lu, X.; Zhang, Y.; Chen, Z.; Zhou, J. D-Mannose Regulates Hepatocyte Lipid Metabolism via PI3K/Akt/mTOR Signaling Pathway and Ameliorates Hepatic Steatosis in Alcoholic Liver Disease. Front Immunol. 2022, 13. [Google Scholar] [CrossRef] [PubMed]
Figure 1.
Network pharmacology analysis flow chart used in this study.
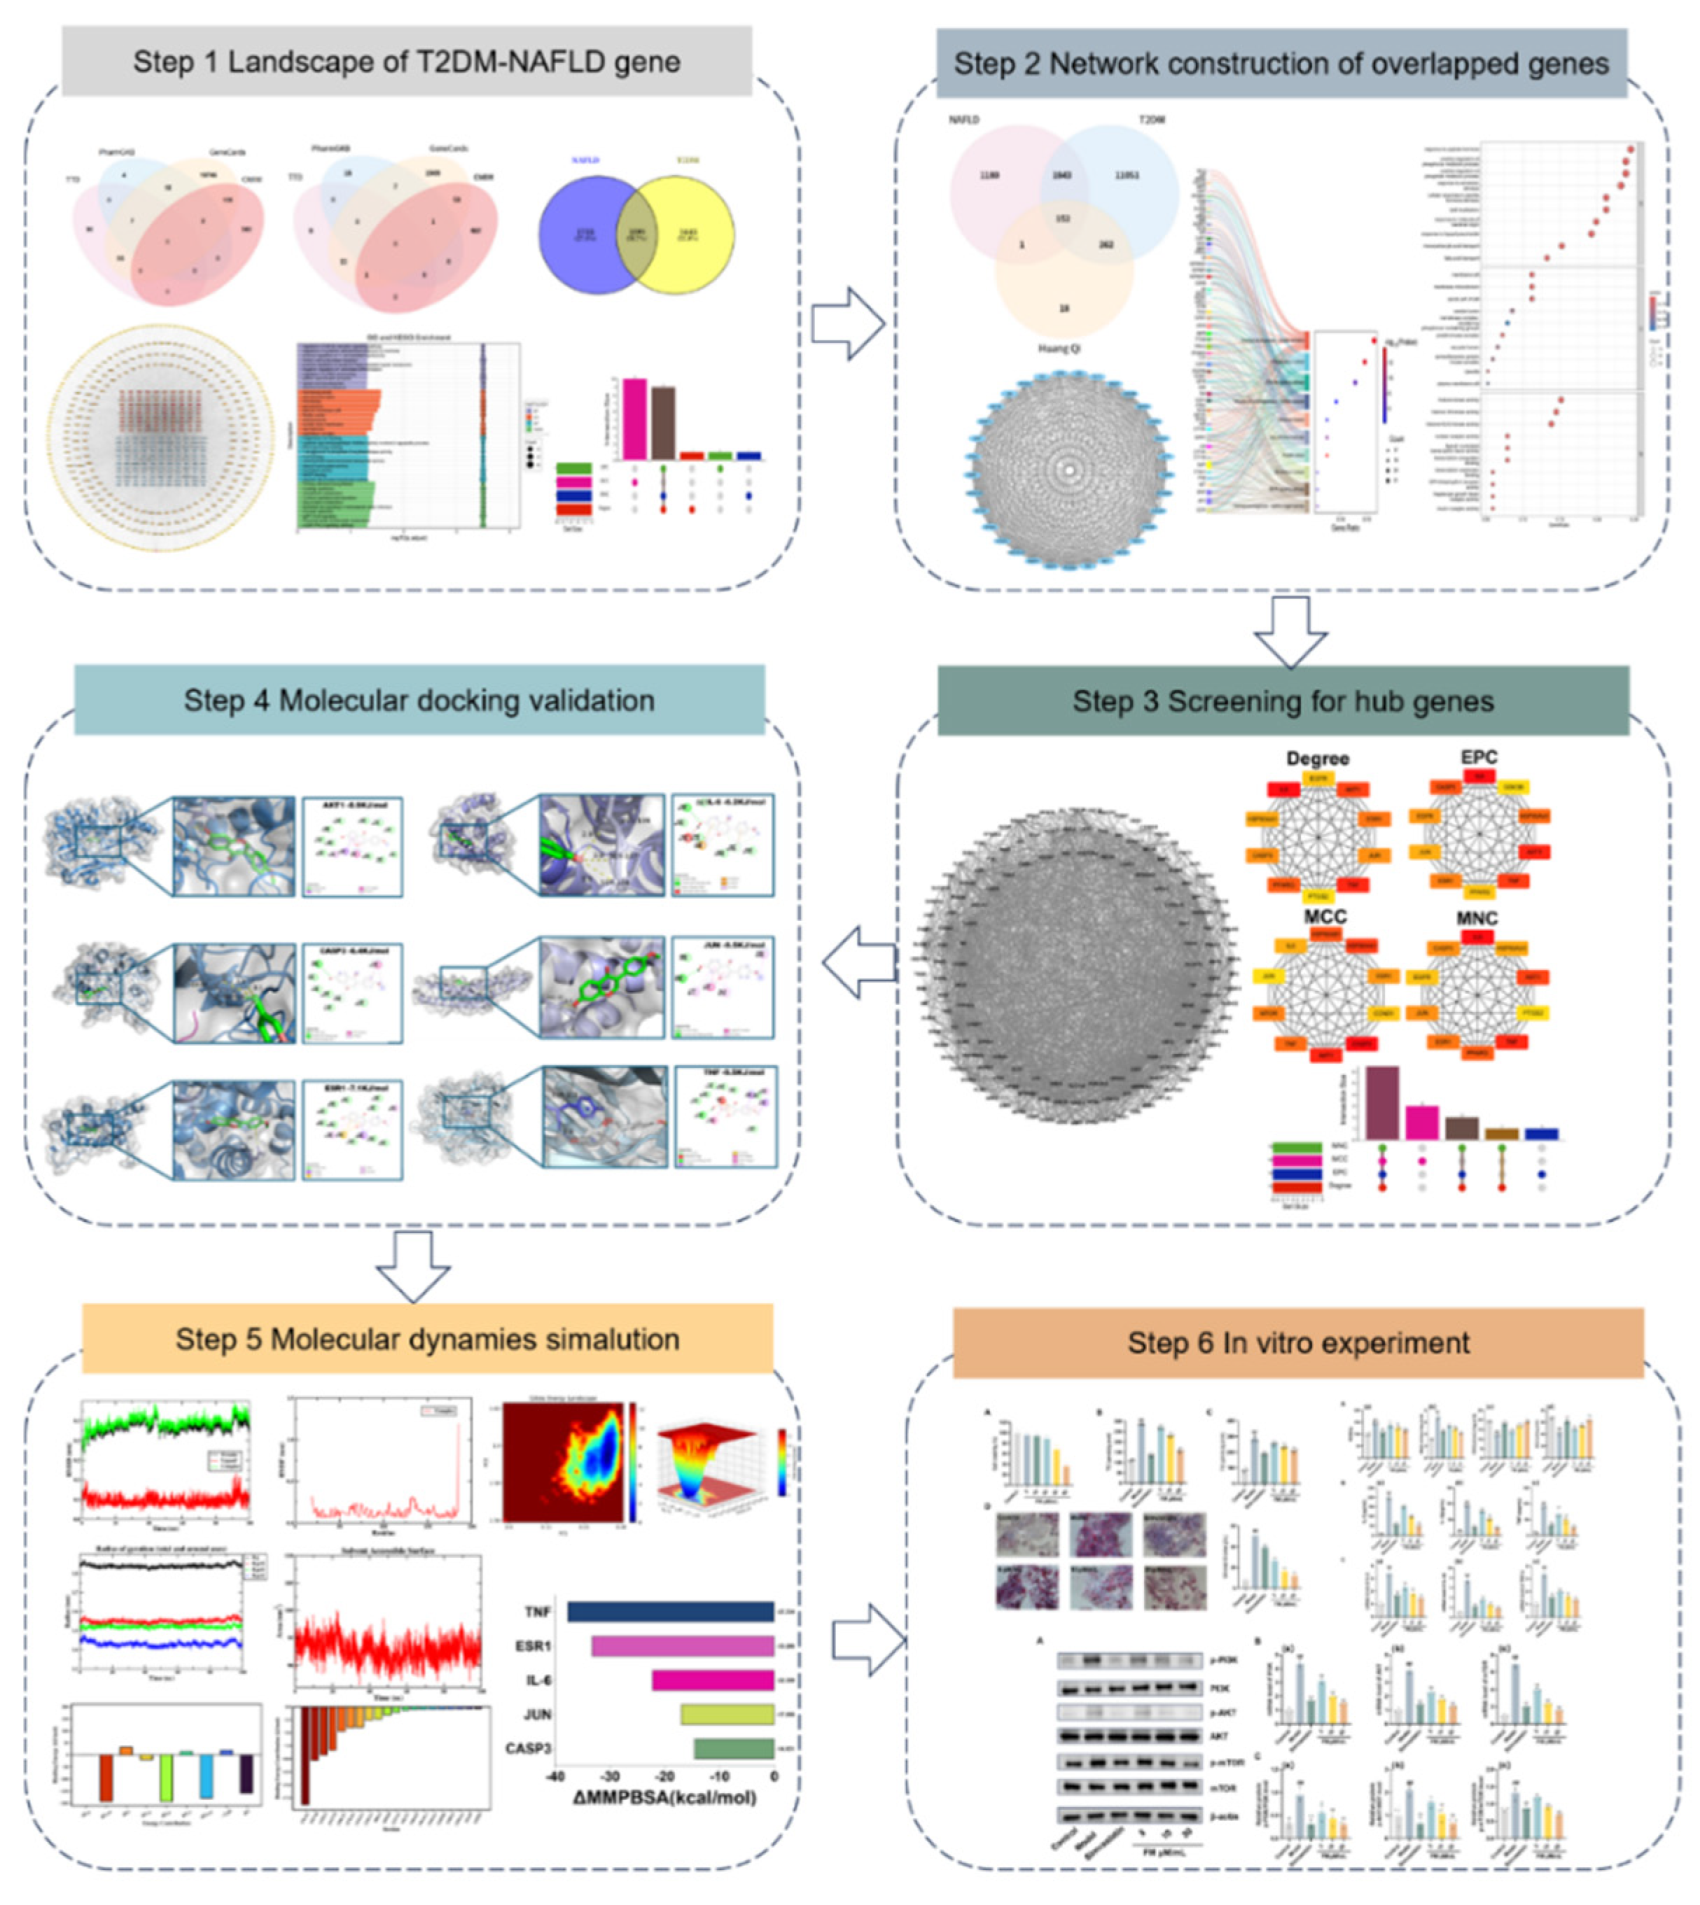
Figure 2.
Identification of targets related to T2DM and NAFLD. (A-B) Venn diagram showing the number of targets related to T2DM (A) and NAFLD (B) obtained from different databases. (C) Venn diagram showing overlapping targets between T2DM and NAFLD. (D) GO analysis and KEGG pathway enrichment analysis were performed on overlapping targets. (F) Protein-protein interaction (PPI) network of overlapping genes. (F) Hub gene identification in Cytoscape using the Degree, EPC, MCC, and MNC algorithms (G) Overlay of the hub genes using an UpSet plot. OMIM: Online Mendelian Inheritance in Man; TTD: Therapeutic Target Database; EPC: EdgePercolation Component; MCC: Maximum Cluster Centrality; MNC: Maximum Neighborhood Component.
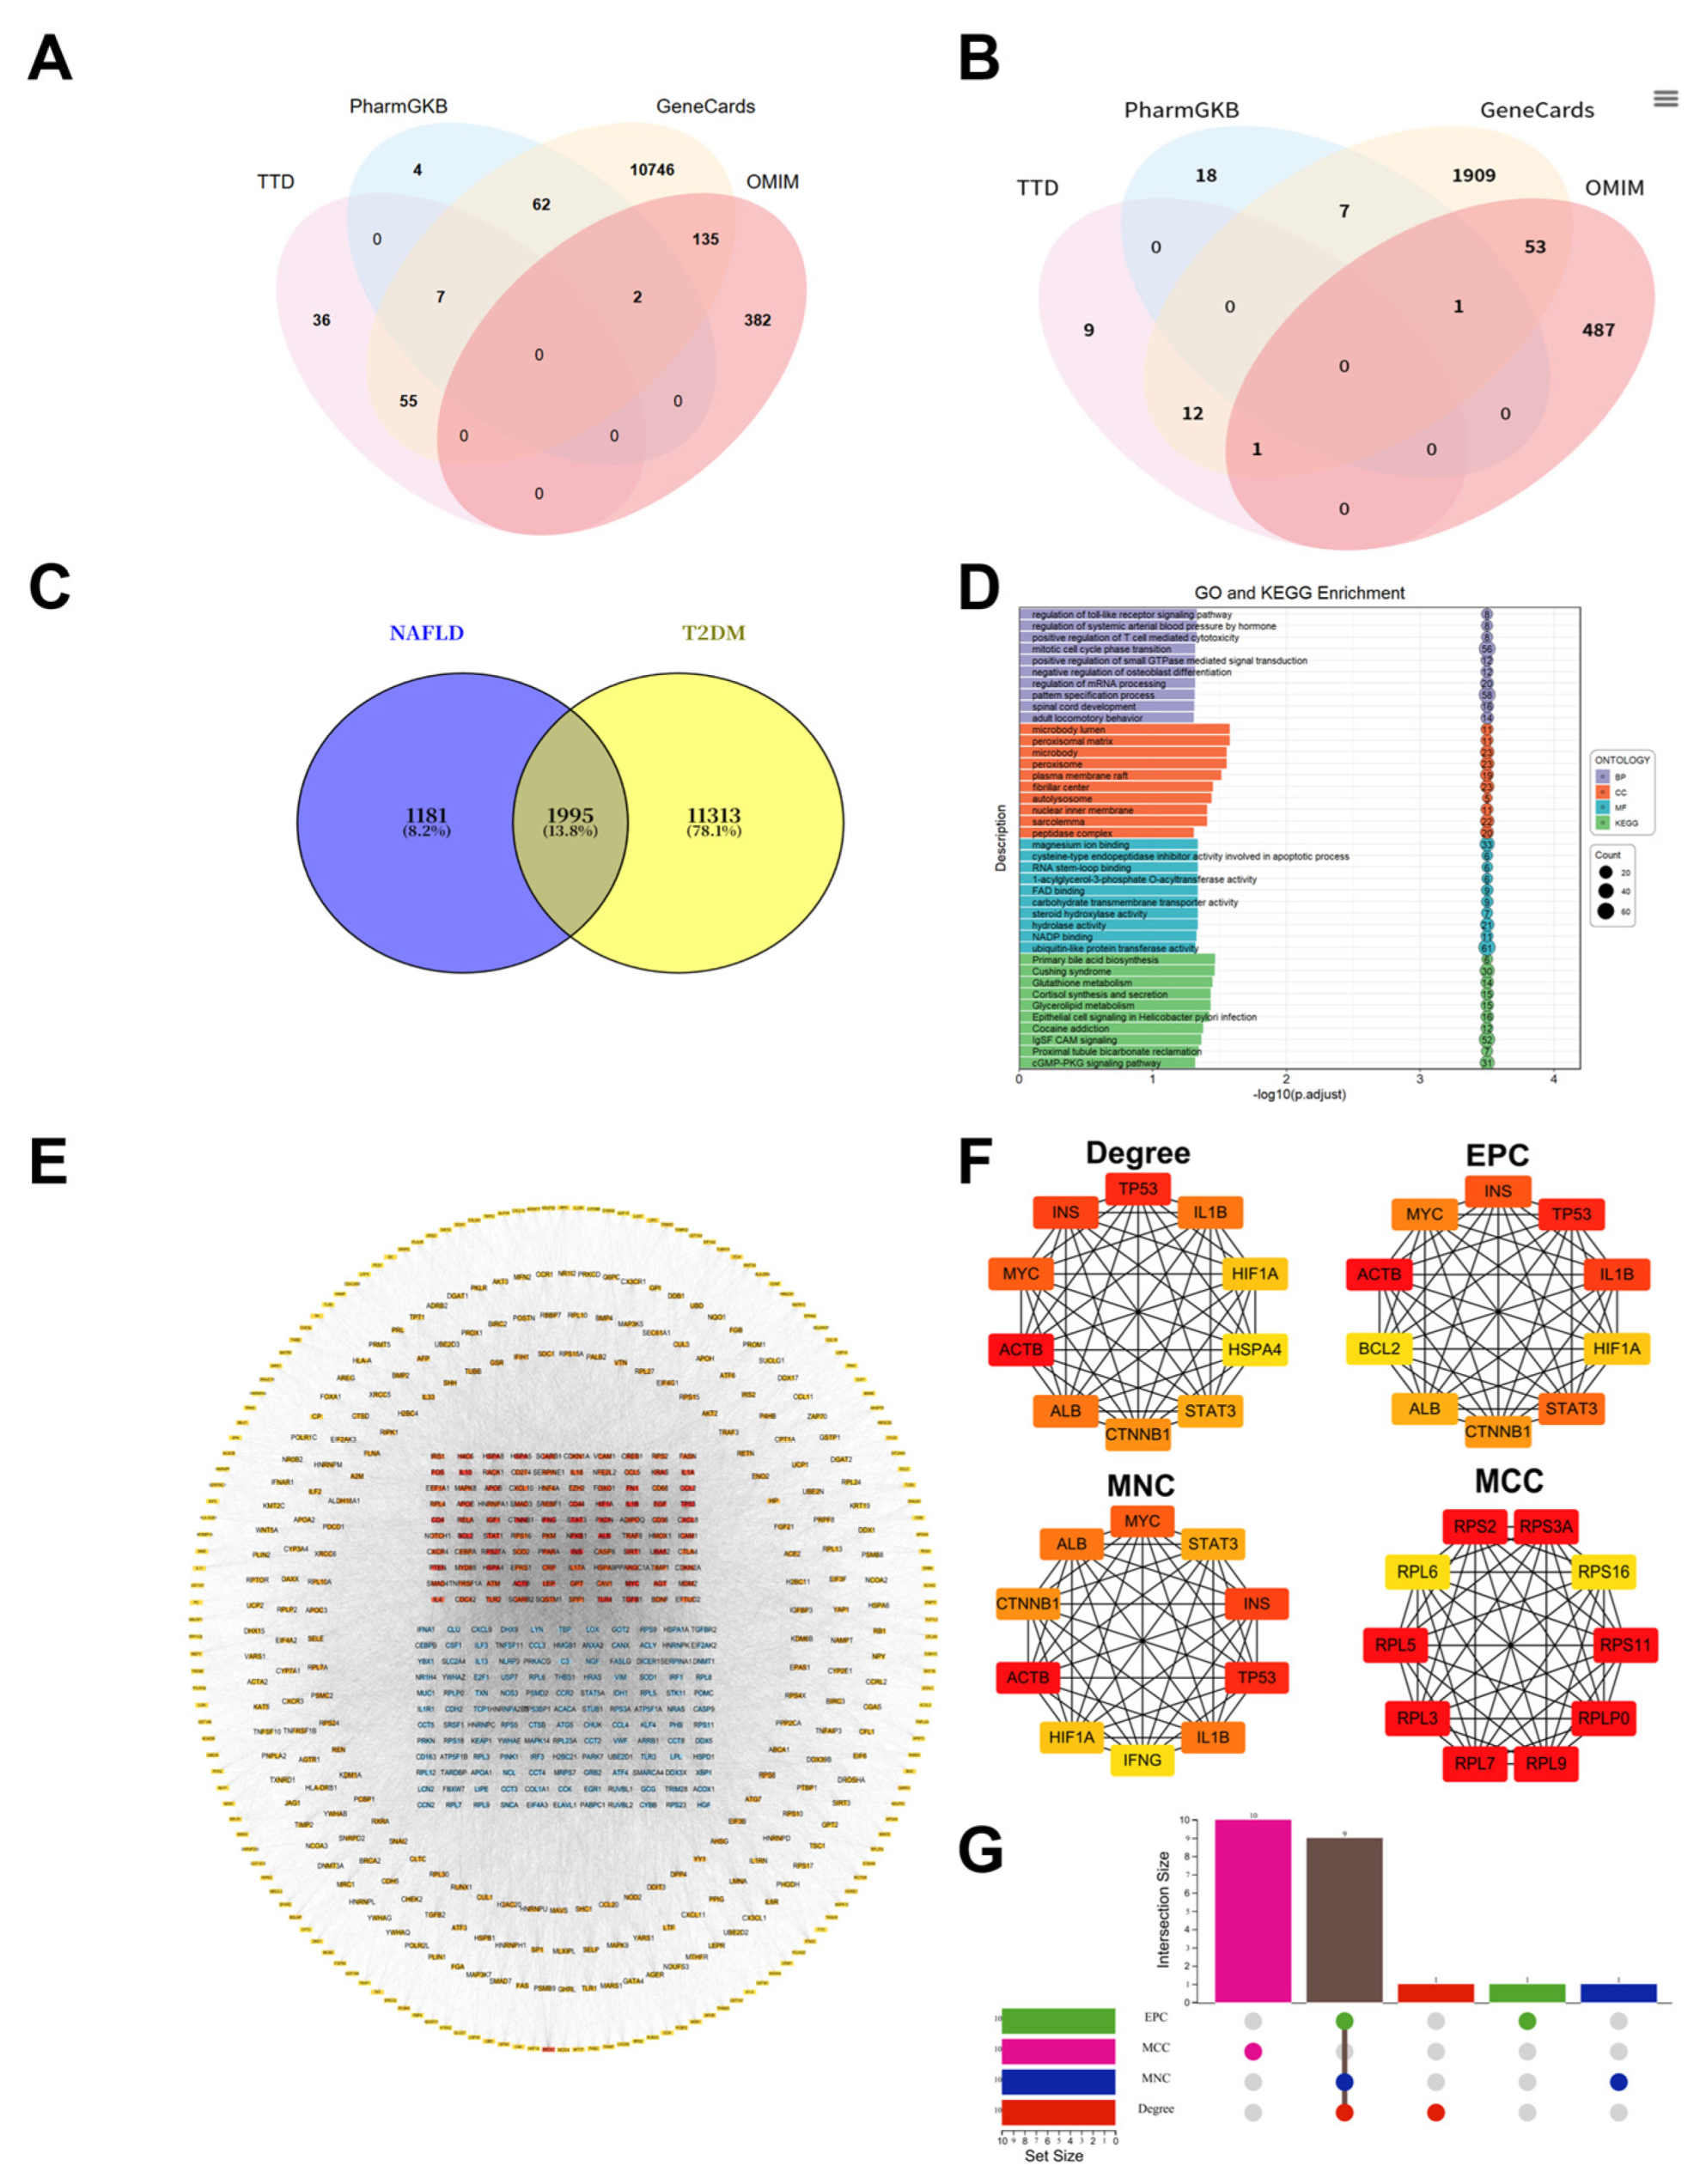
Figure 3.
GO functional annotation, KEGG pathway enrichment analysis and hub gene identification of Astragalus’ targets for treating T2DM-NAFLD. (A) Intersection relationship between Astragalus’ target and T2DM-NAFLD target. (B) PPI network of the 152 overlapping genes constructed using the STRING database and Cytoscape software. (C) GO analysis. (D) KEGG pathway analysis. (E) Key modules identified in the PPI network using the molecular complex detection algorithm. (F) The top 10 highest connectivity genes in the PPI network as determined by Cytoscape. (G) UpSet plot showing the overlap of 6 hub genes derived from Degree, EPC, MCC, and MNC algorithms in the CytoHubba plugin.
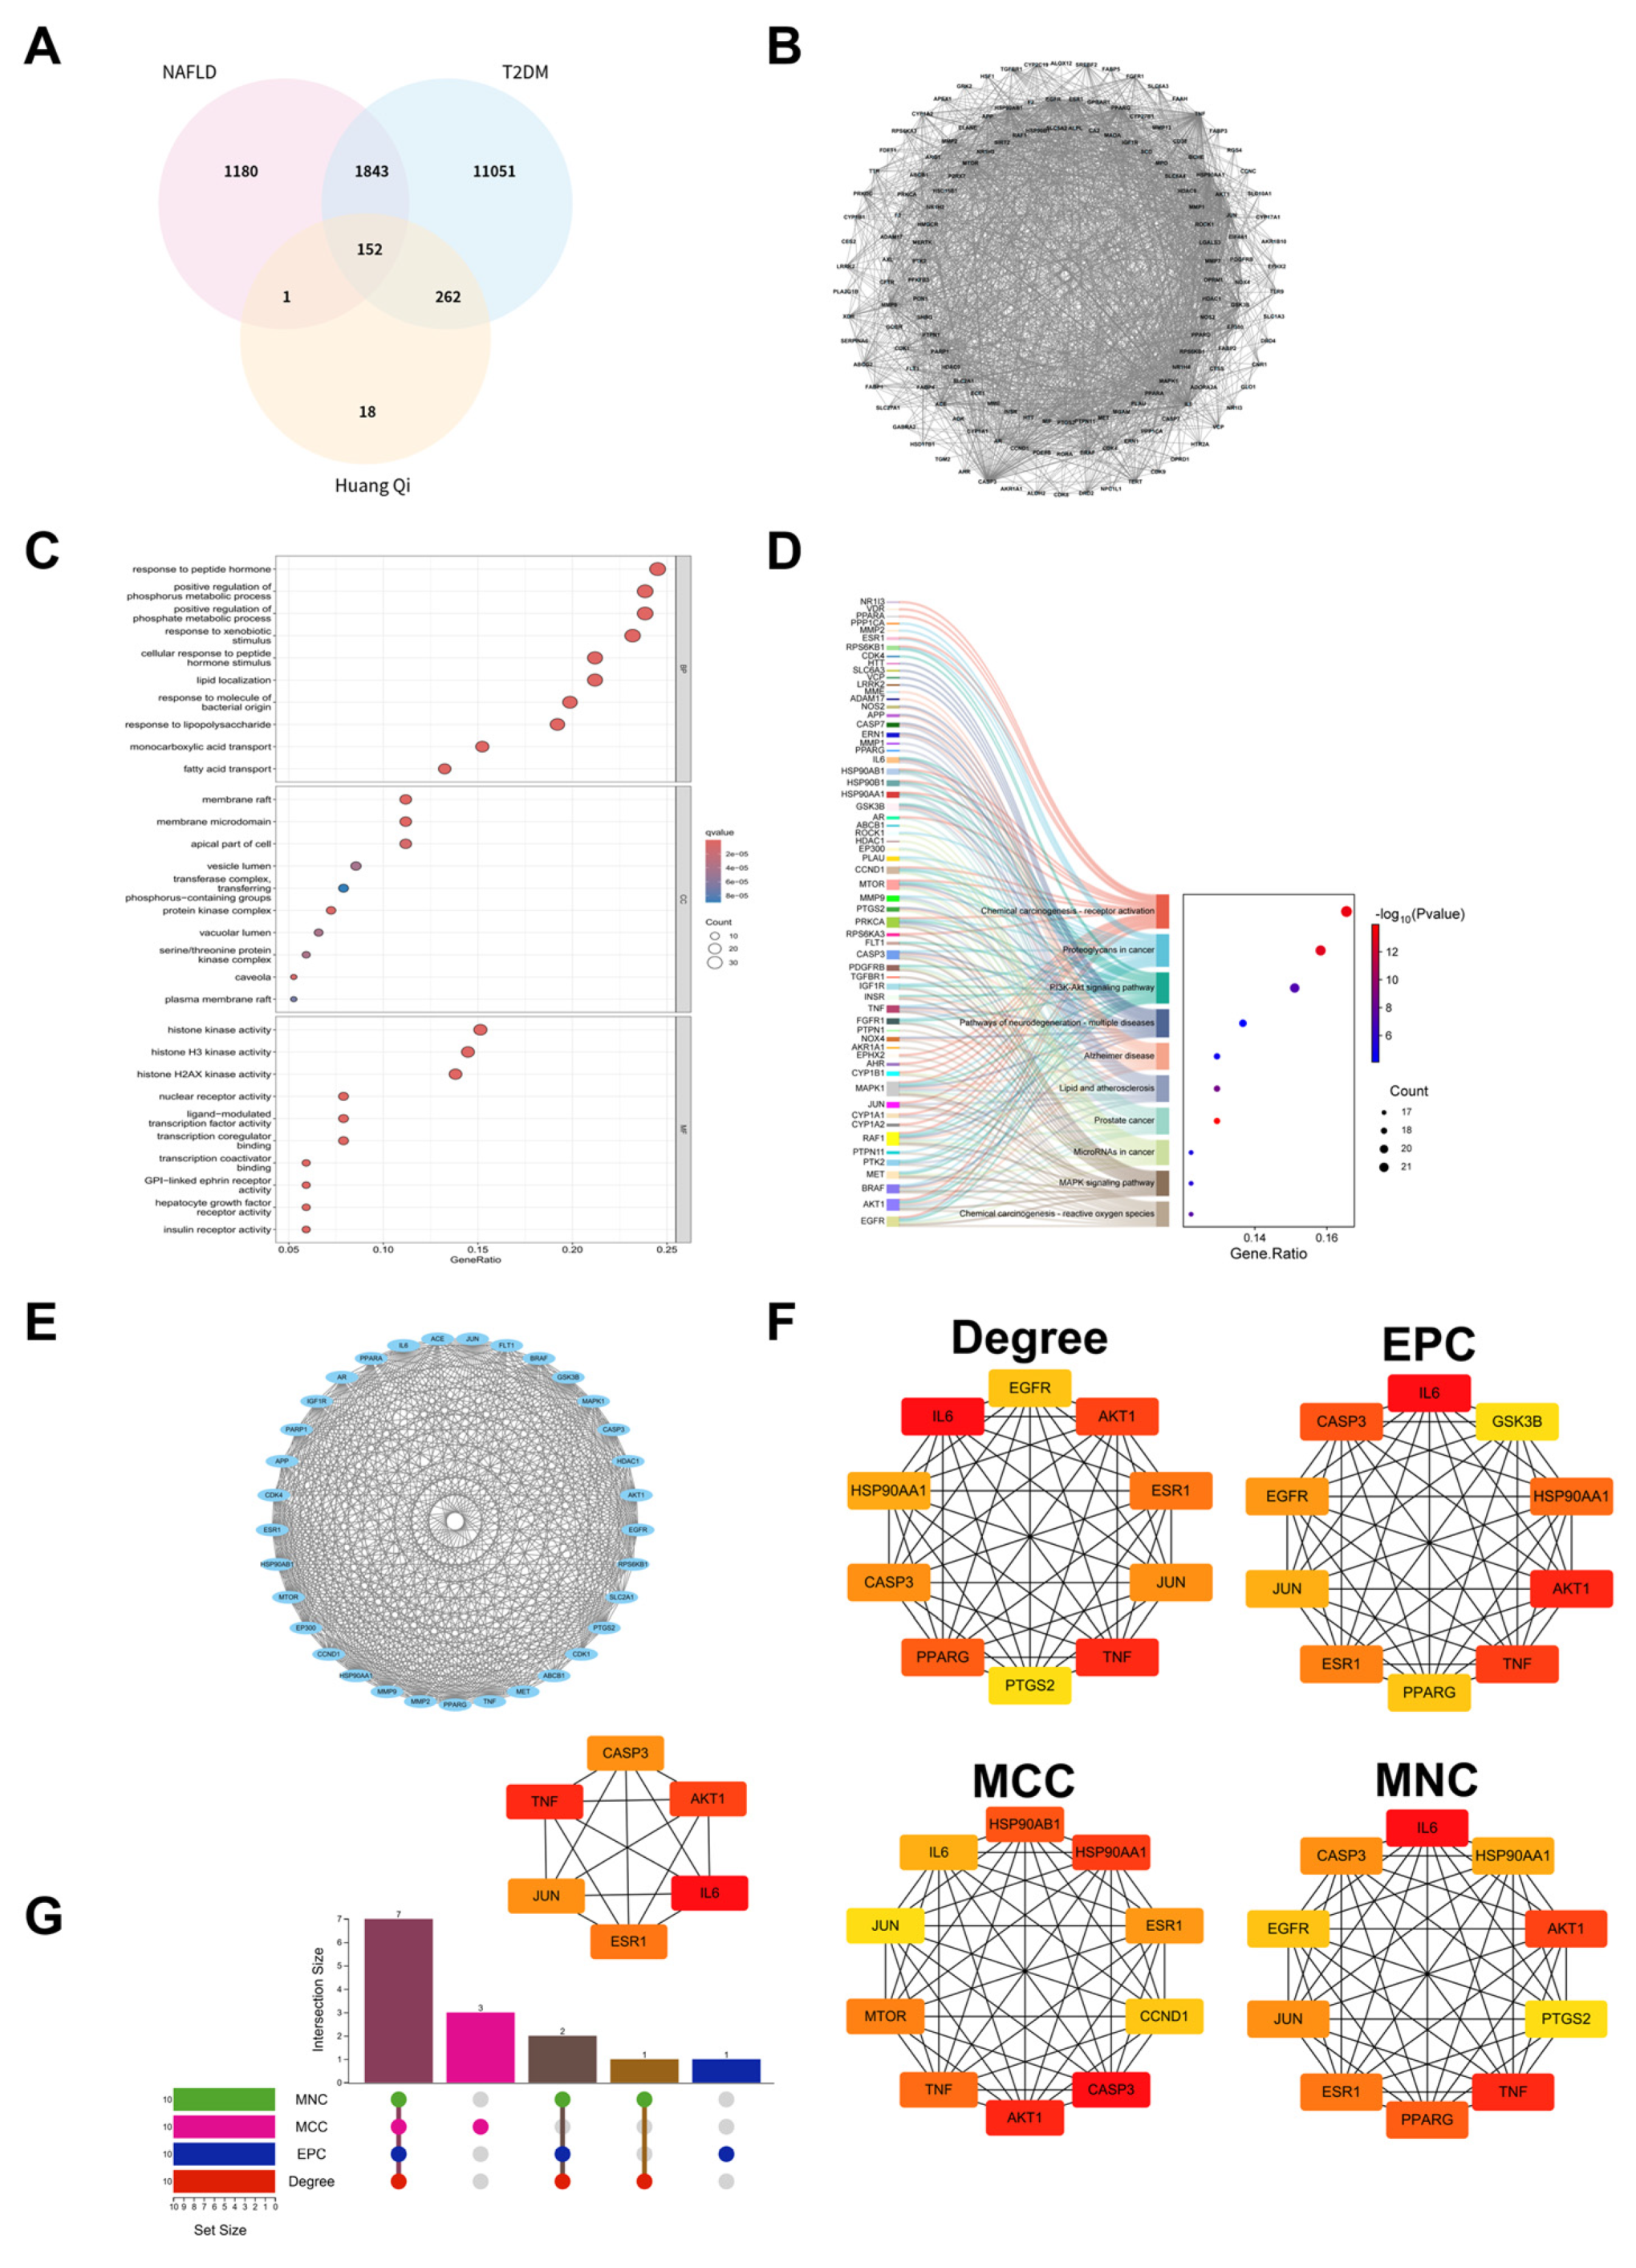
Figure 4.
Molecular docking map of main components of Formononetin and core targets. (A) Heat map of binding energy between different components and target sites. (B) Molecular docking of the structure for Formononetin with IL-6, AKT1, JUN, TNF, CASP3, and ESR1.
Figure 4.
Molecular docking map of main components of Formononetin and core targets. (A) Heat map of binding energy between different components and target sites. (B) Molecular docking of the structure for Formononetin with IL-6, AKT1, JUN, TNF, CASP3, and ESR1.
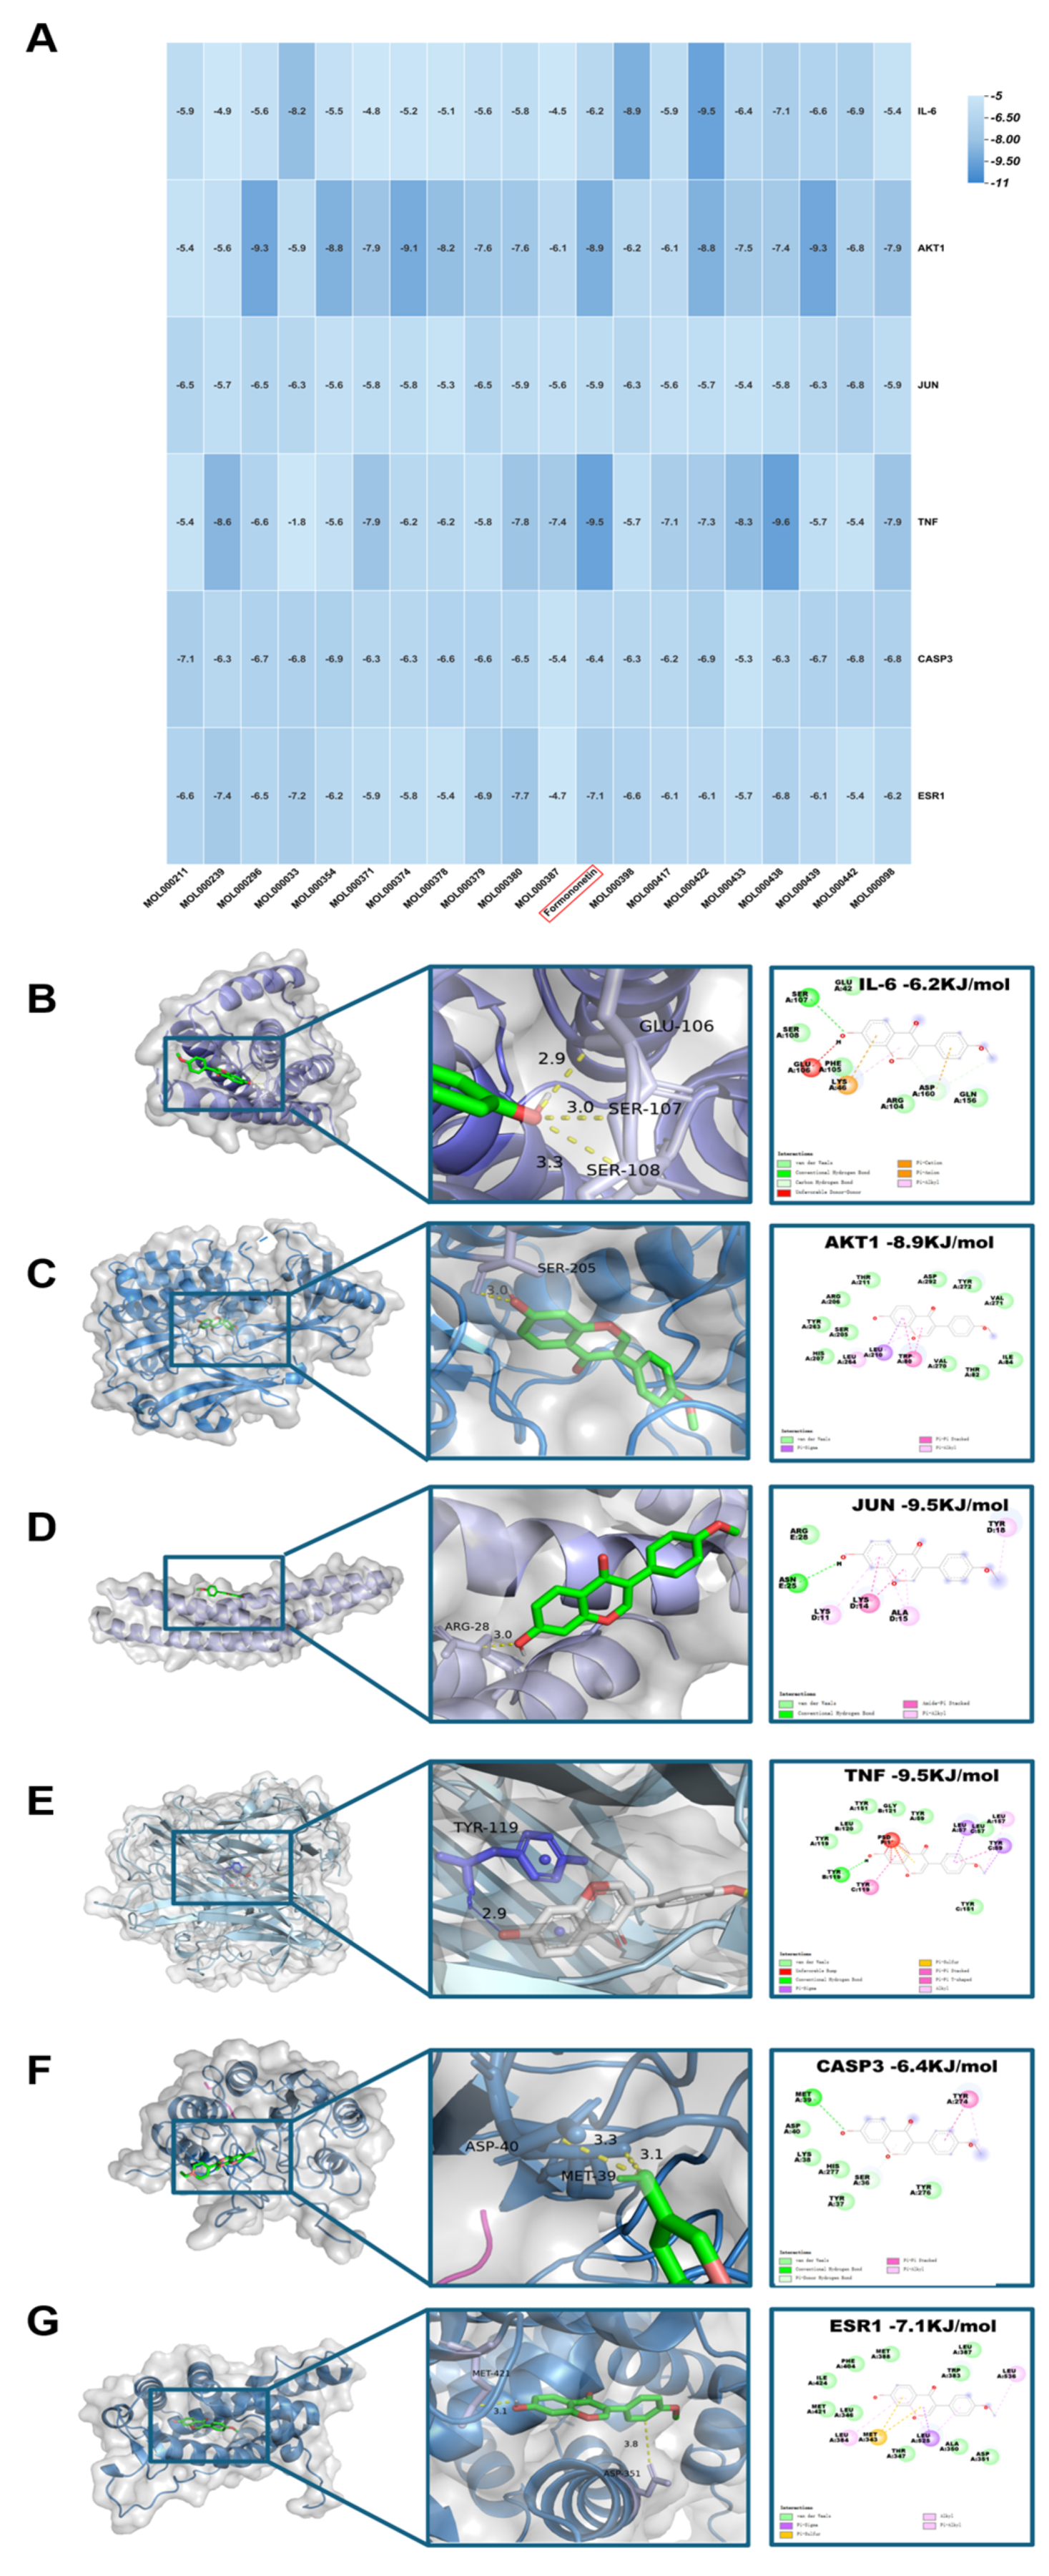
Figure 5.
Results of molecular dynamics simulation (MDS) involving formononetin and target proteins. (A) The RMSD values values for each target protein-formononetin complex. (B) Variations in protein flexibility throughout the formononetin simulation. (C) Rg rate curve of the protein-formononetin complex. (D) SASA of the protein-formononetin complex during 100 ns simulation. (E) Dynamics of hydrogen bonding as observed in the molecular dynamics simulations. (F-G) Two-dimensional and three-dimensional mappings of the free energy landscape. (H-I) Residue energy decomposition for the binding of formononetin to protein. (J) Binding energy profiles of formononetin with target proteins during the MDS calculations. (Note: RMSD: root-mean-square deviation; RMSF: root-mean-square fluctuation; SASA: Solvent Accessible Surface Area; ΔMMGBSA: Δ molecular mechanics-generalized-Born surface area; Rg: radius of gyration.
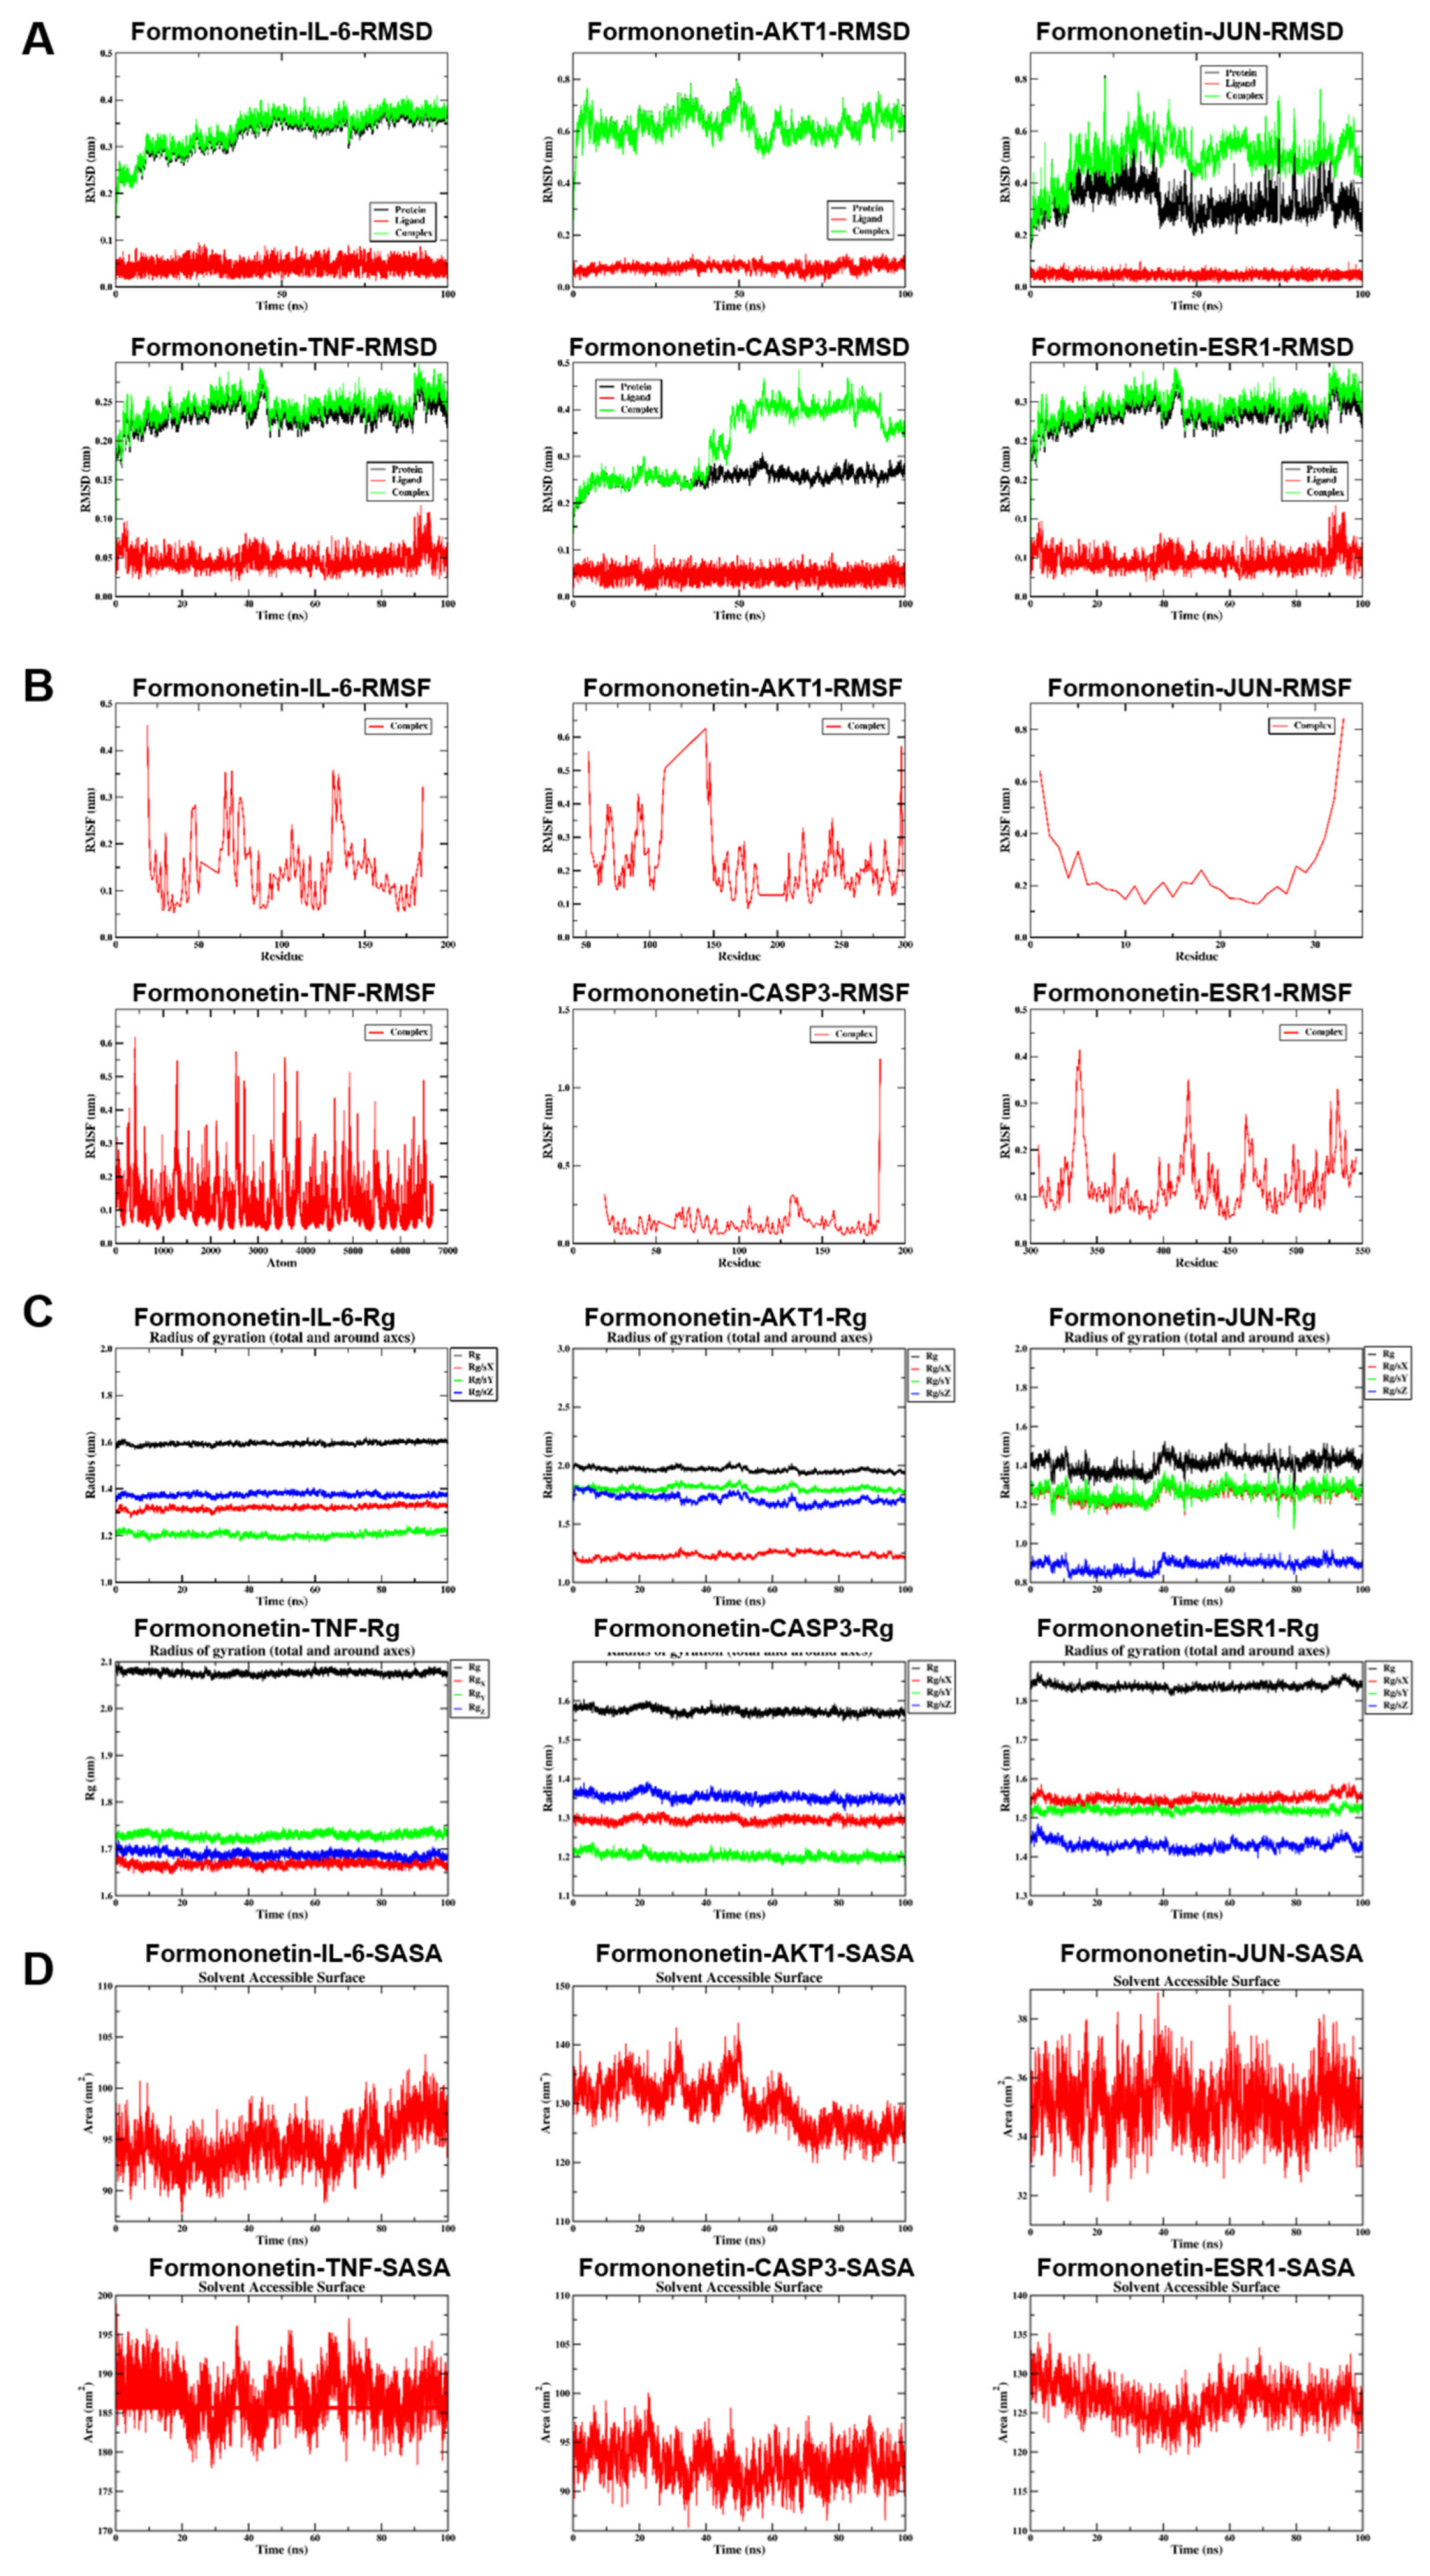
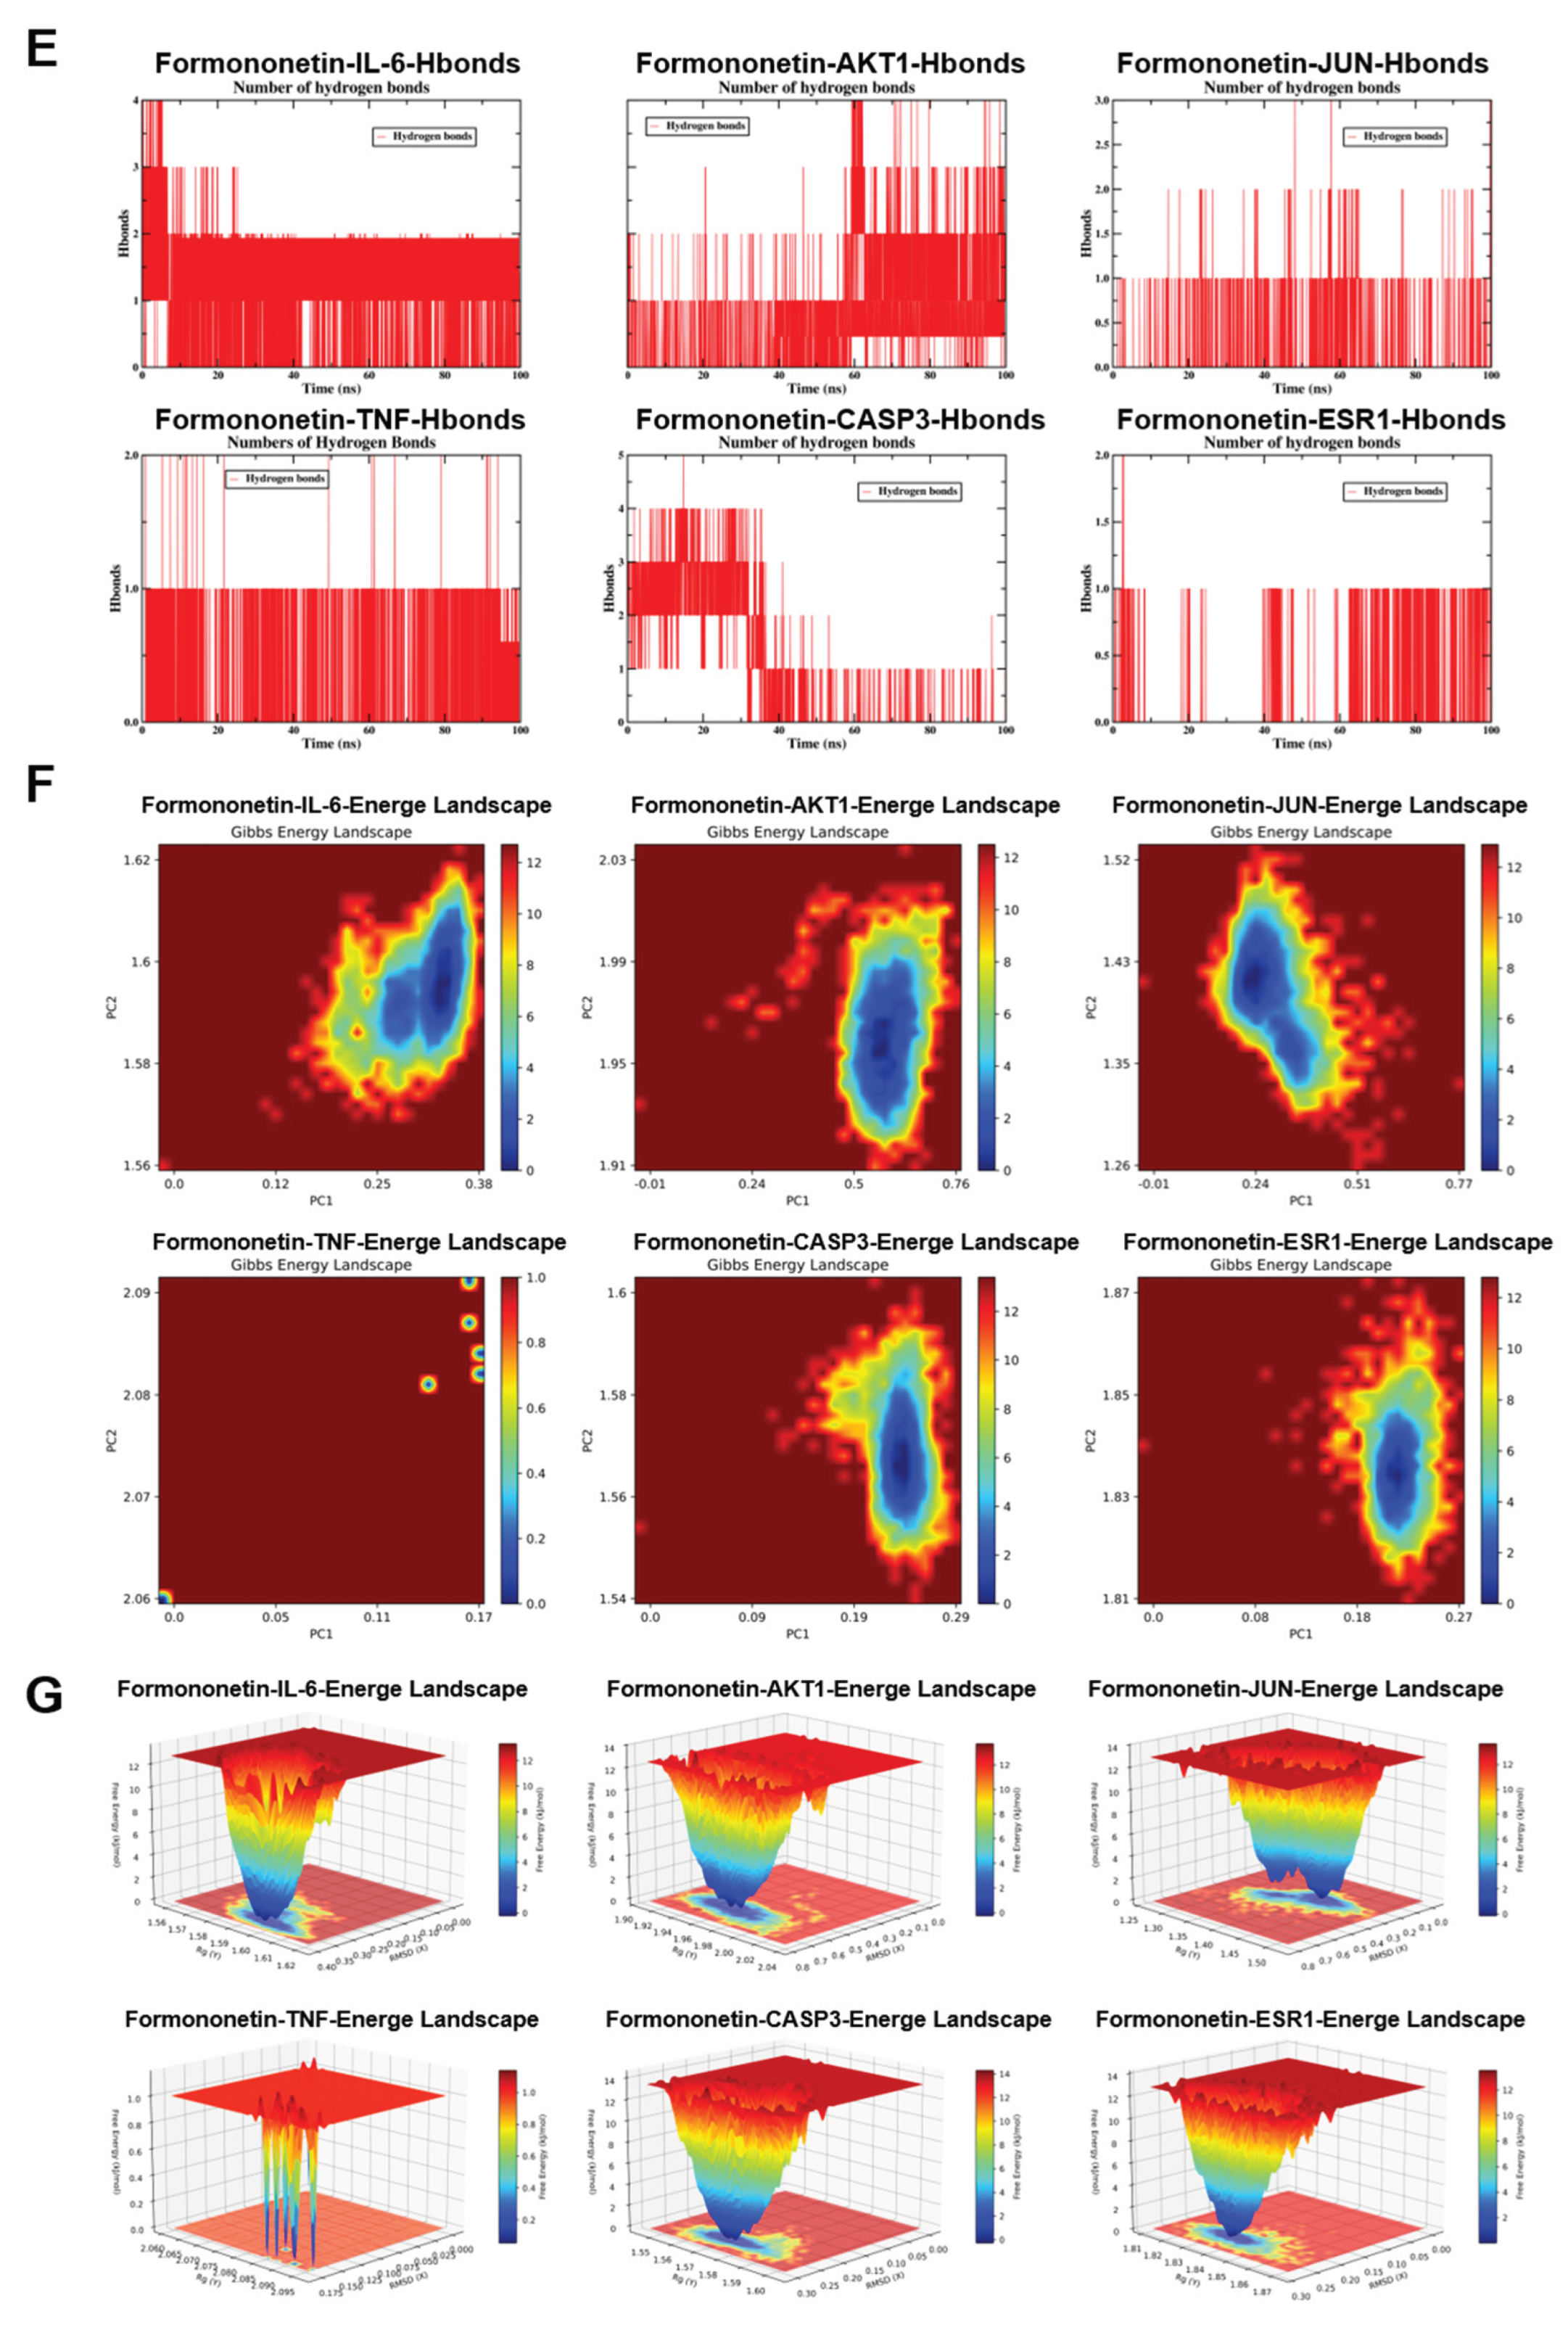
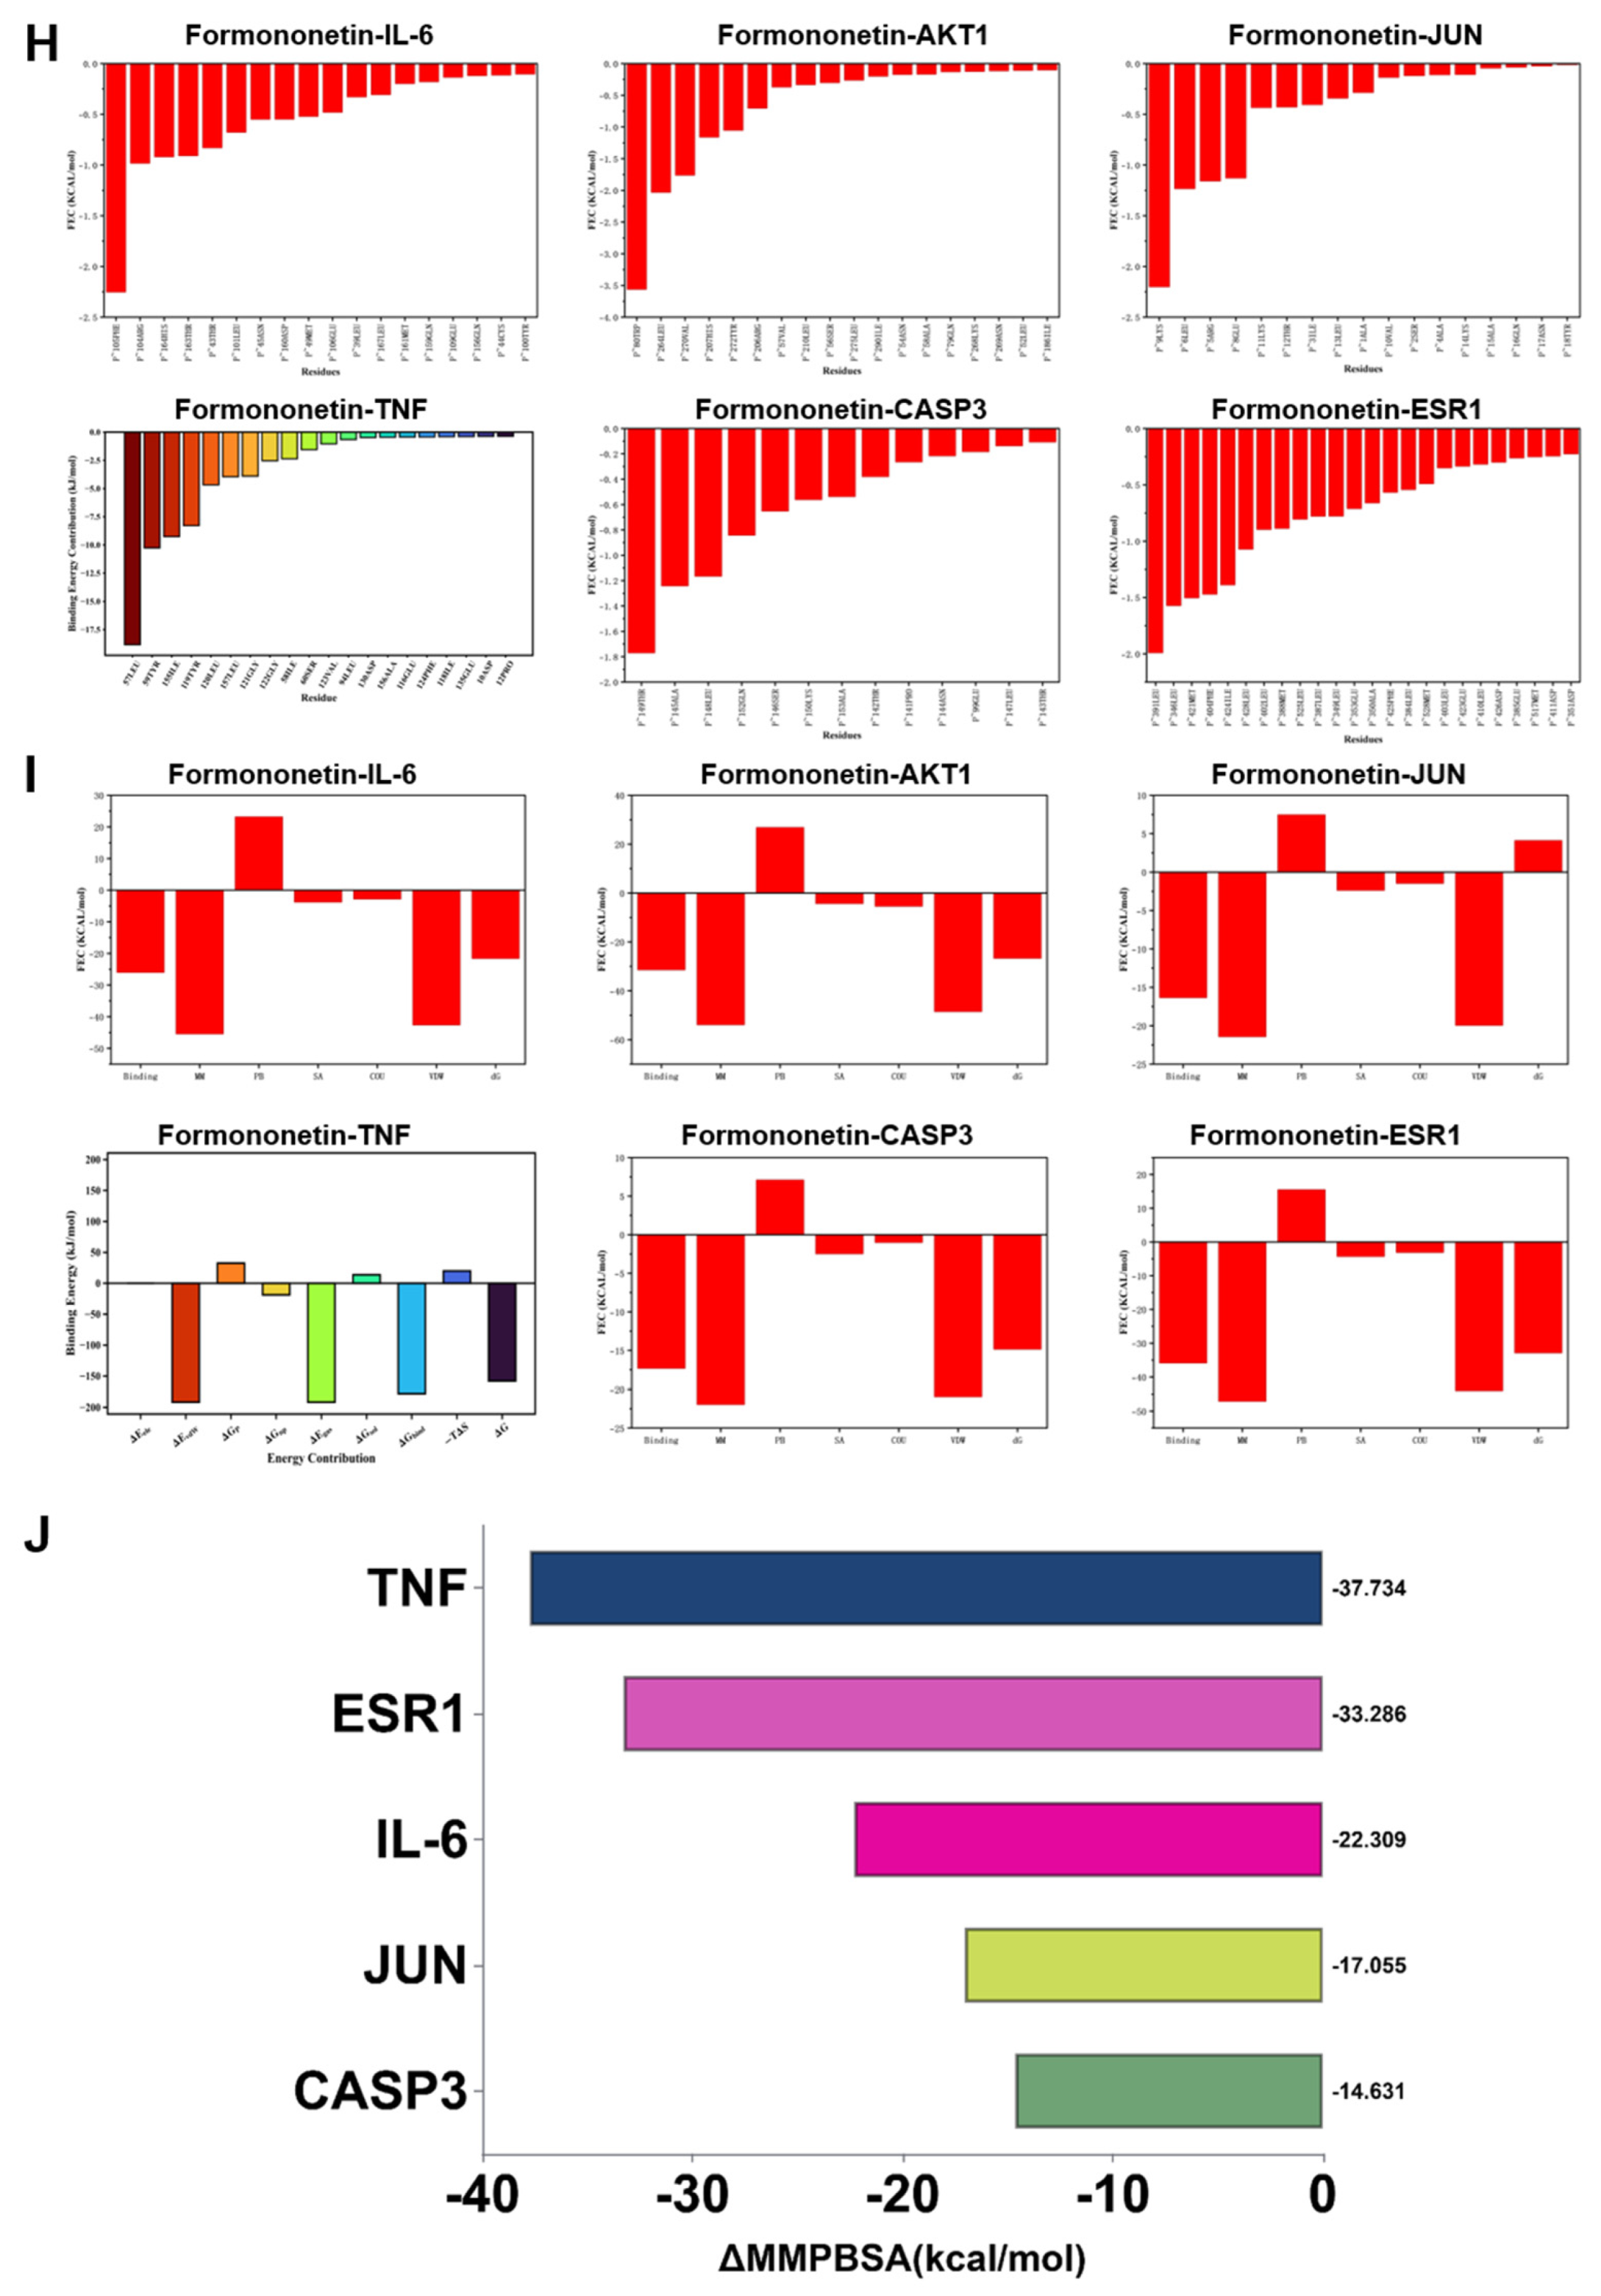
Figure 6.
Effect of formononetin on lipid accumulation in vitro. (A) Activity of HepG2 cells cultured with concentration gradient of formononetin. (B) TG levels. (C) TC level. (D) Oil Red O staining. Note: ##P < 0.01, vs Control; **P < 0.01, vs Model.
Figure 6.
Effect of formononetin on lipid accumulation in vitro. (A) Activity of HepG2 cells cultured with concentration gradient of formononetin. (B) TG levels. (C) TC level. (D) Oil Red O staining. Note: ##P < 0.01, vs Control; **P < 0.01, vs Model.
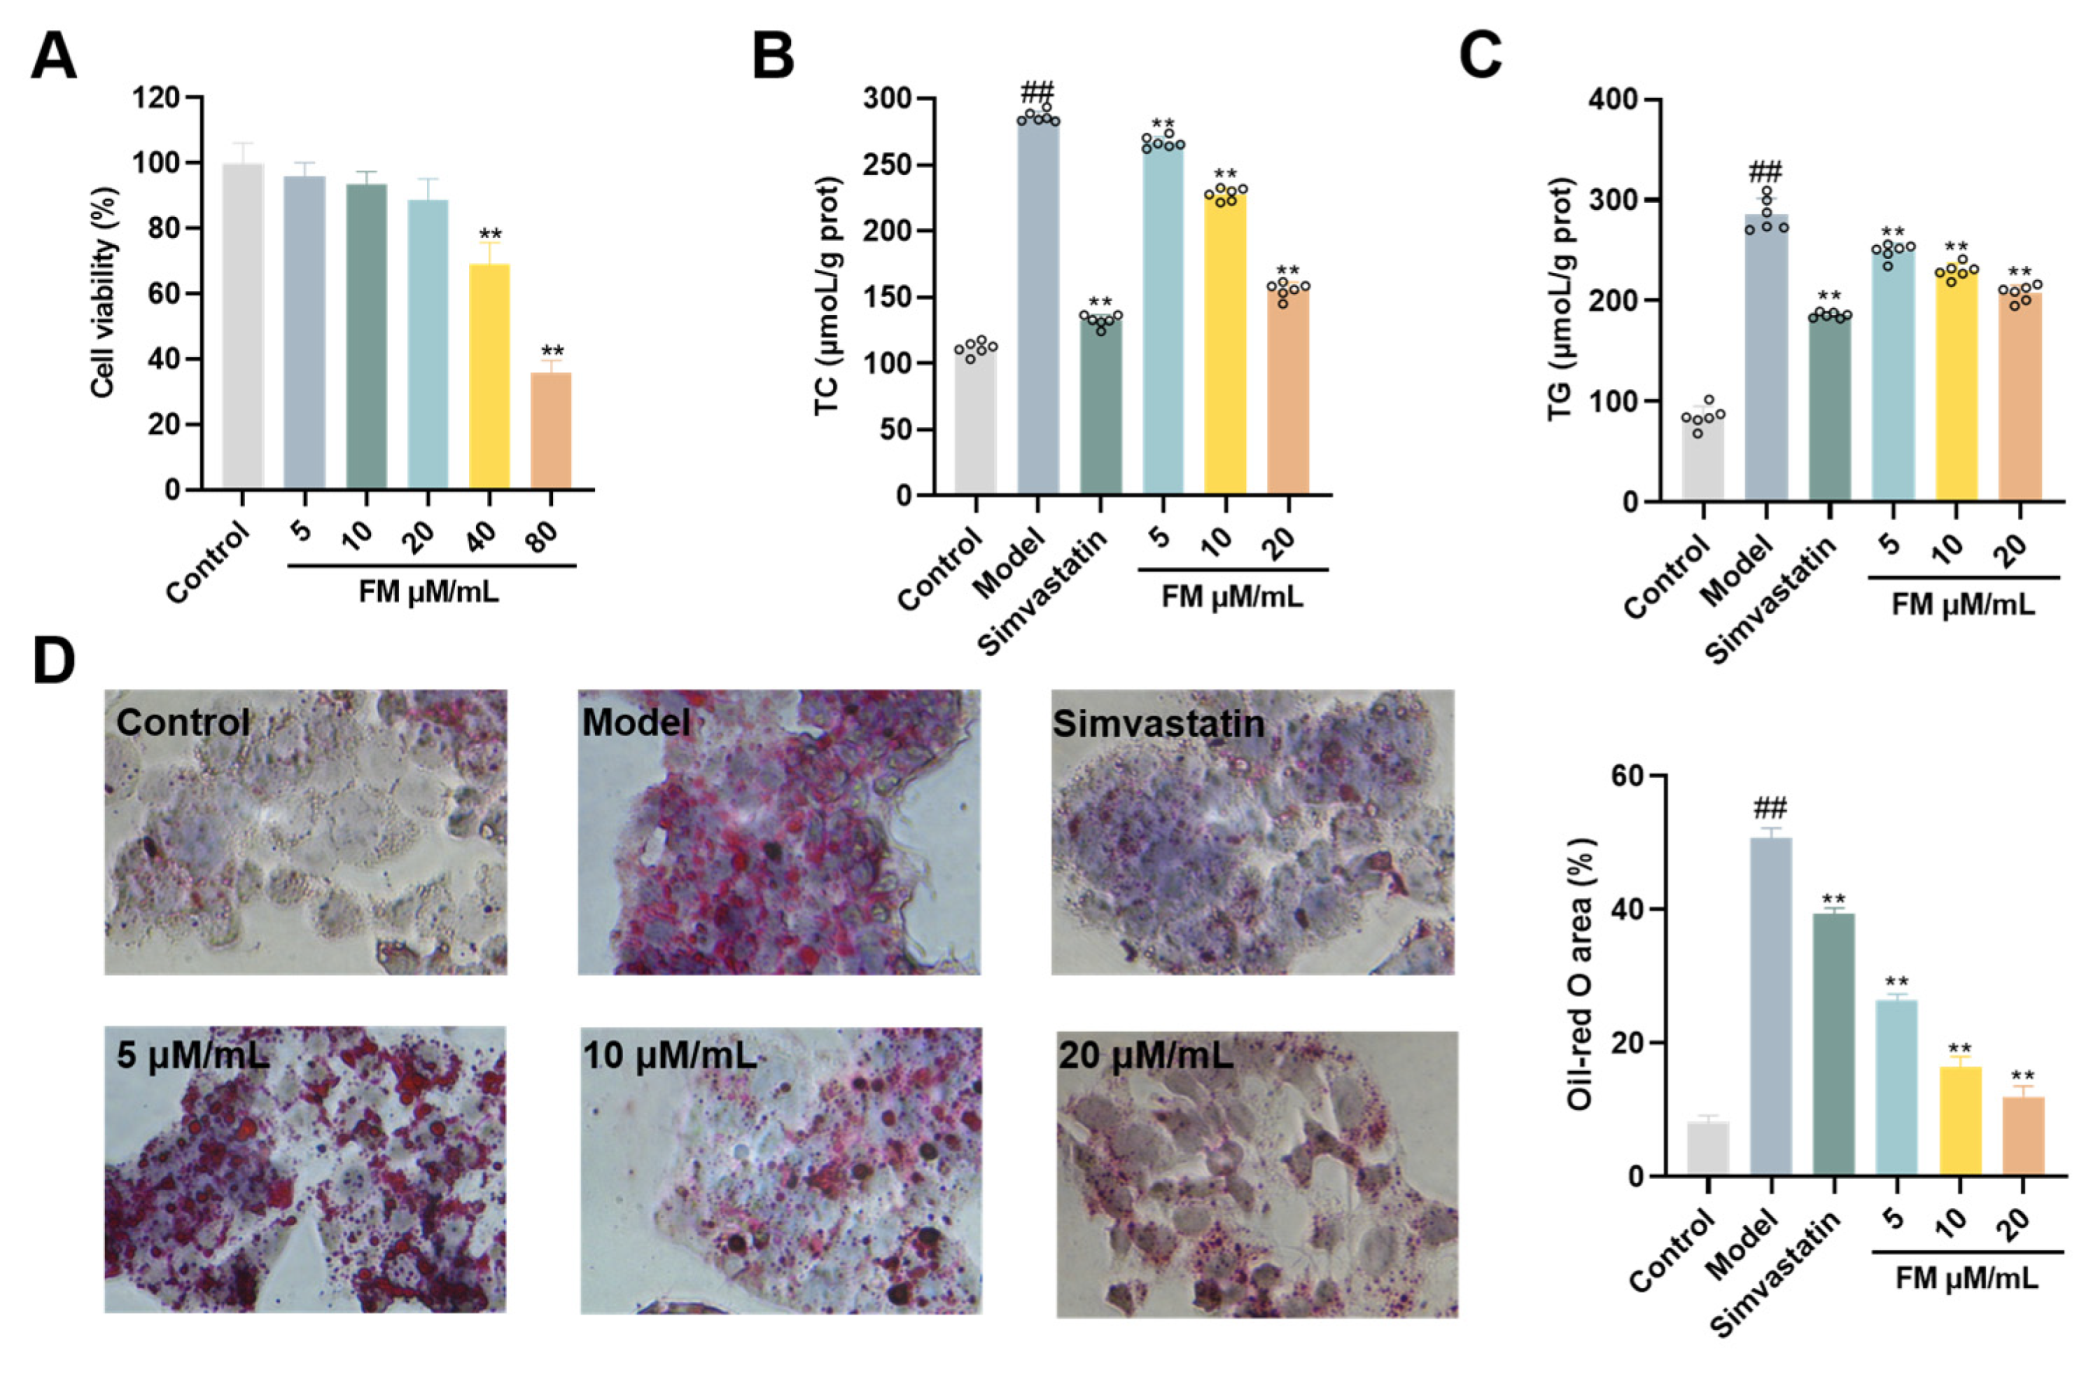
Figure 7.
The improving effect of formononetin on the oxidative stress and inflammatory response of HepG2 cells under T2DM-NAFLD pathology. (A) Formononetin inhibits the oxidative stress of HepG2 cells under T2DM-NAFLD pathology (a) ROS levels. (b) MDA levels. (c) GSH levels. (d) SOD levels. (B) Formononetin improves T2 Inflammatory response of HepG2 cells under T2DM-NAFLD pathology (a) IL-6 levels. (b) IL-1β levels. (c) TNF-α levels. (C) Effect of formononetin on the mRNA expression of inflammatory factors in HepG2 cells under T2DM-NAFLD pathology (a) IL-6 levels. (b) IL-1β levels. (c) TNF-α levels. Note: ##P < 0.01, vs Control; **P < 0.01, vs Model.
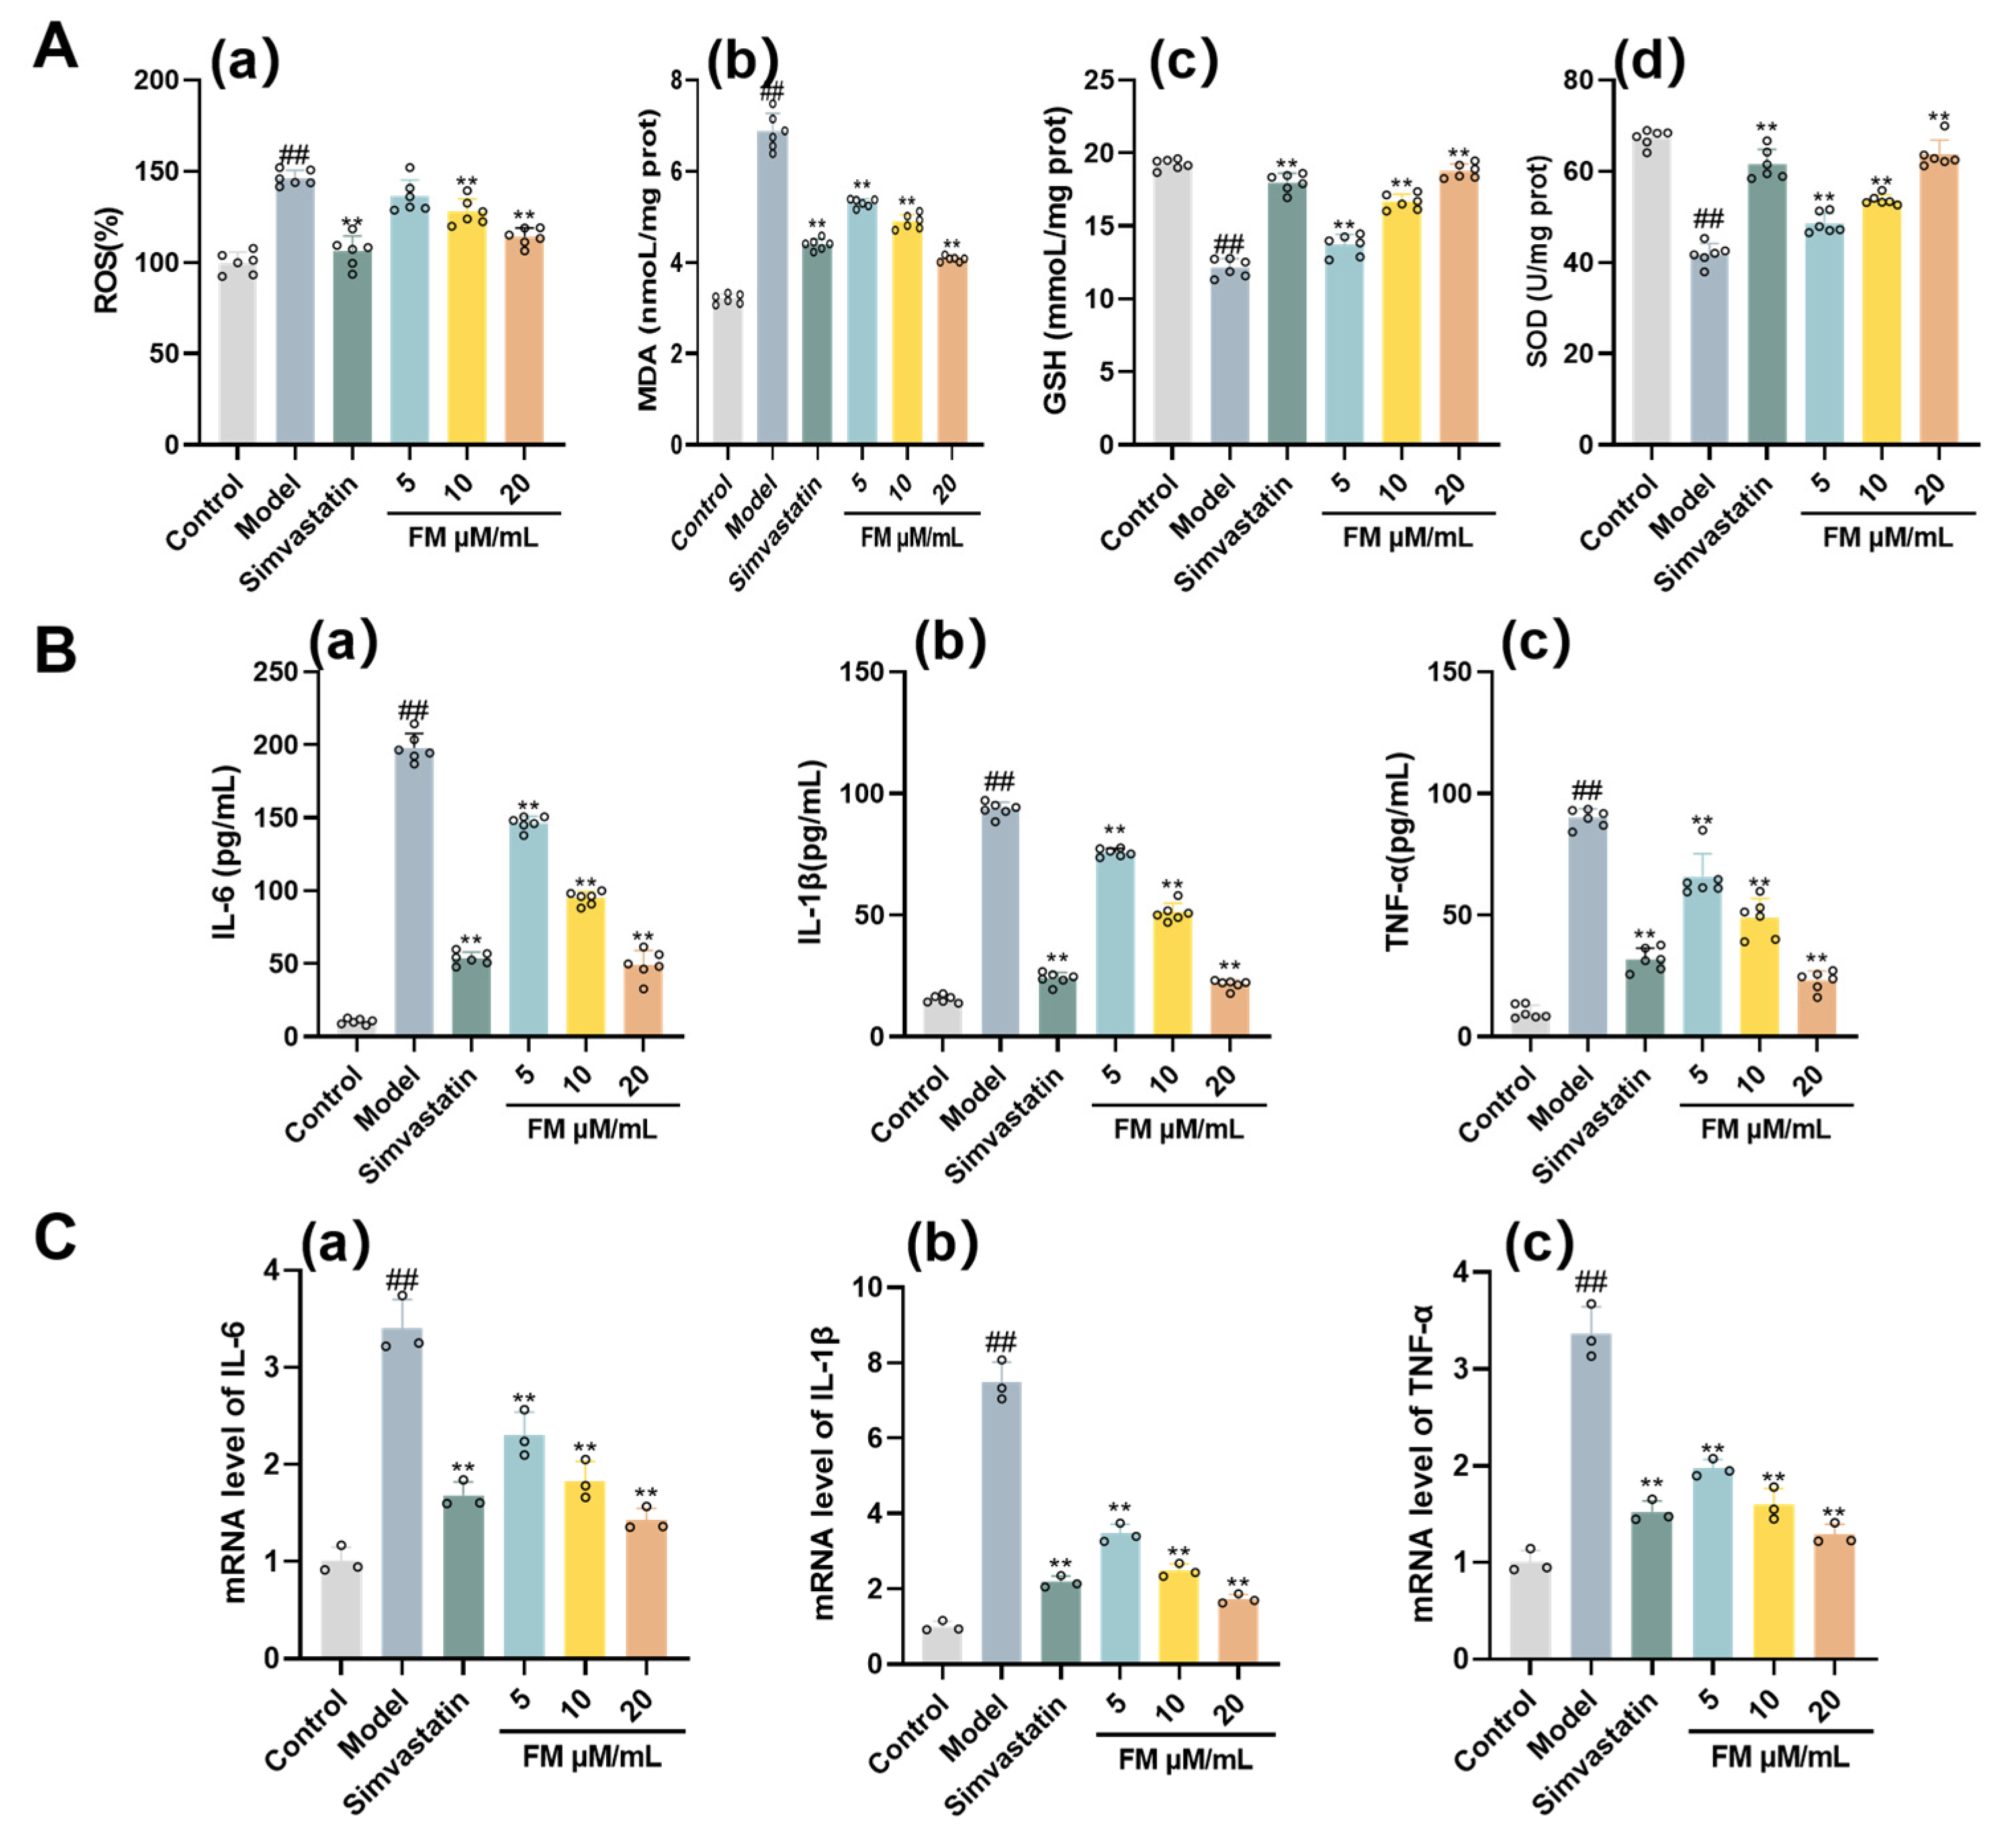
Figure 8.
Assessment of the Effect of Formononetin on Alleviating T2DM-NAFLD via PI3K/AKT/mTOR Pathway mRNA and Protein Expression. (A) Western blot analysis of PI3K, AKT, and mTOR in each group. (B) mRNA analysis (a) PI3K levels. (b)AKT levels. (c) mTOR levels. (C) Quantitative analysis of Western blot for (a) PI3K levels. (b)AKT levels. (c) mTOR levels. Note: ##P< 0.01, vs Control; *P < 0.05, **P < 0.01, vs Model.
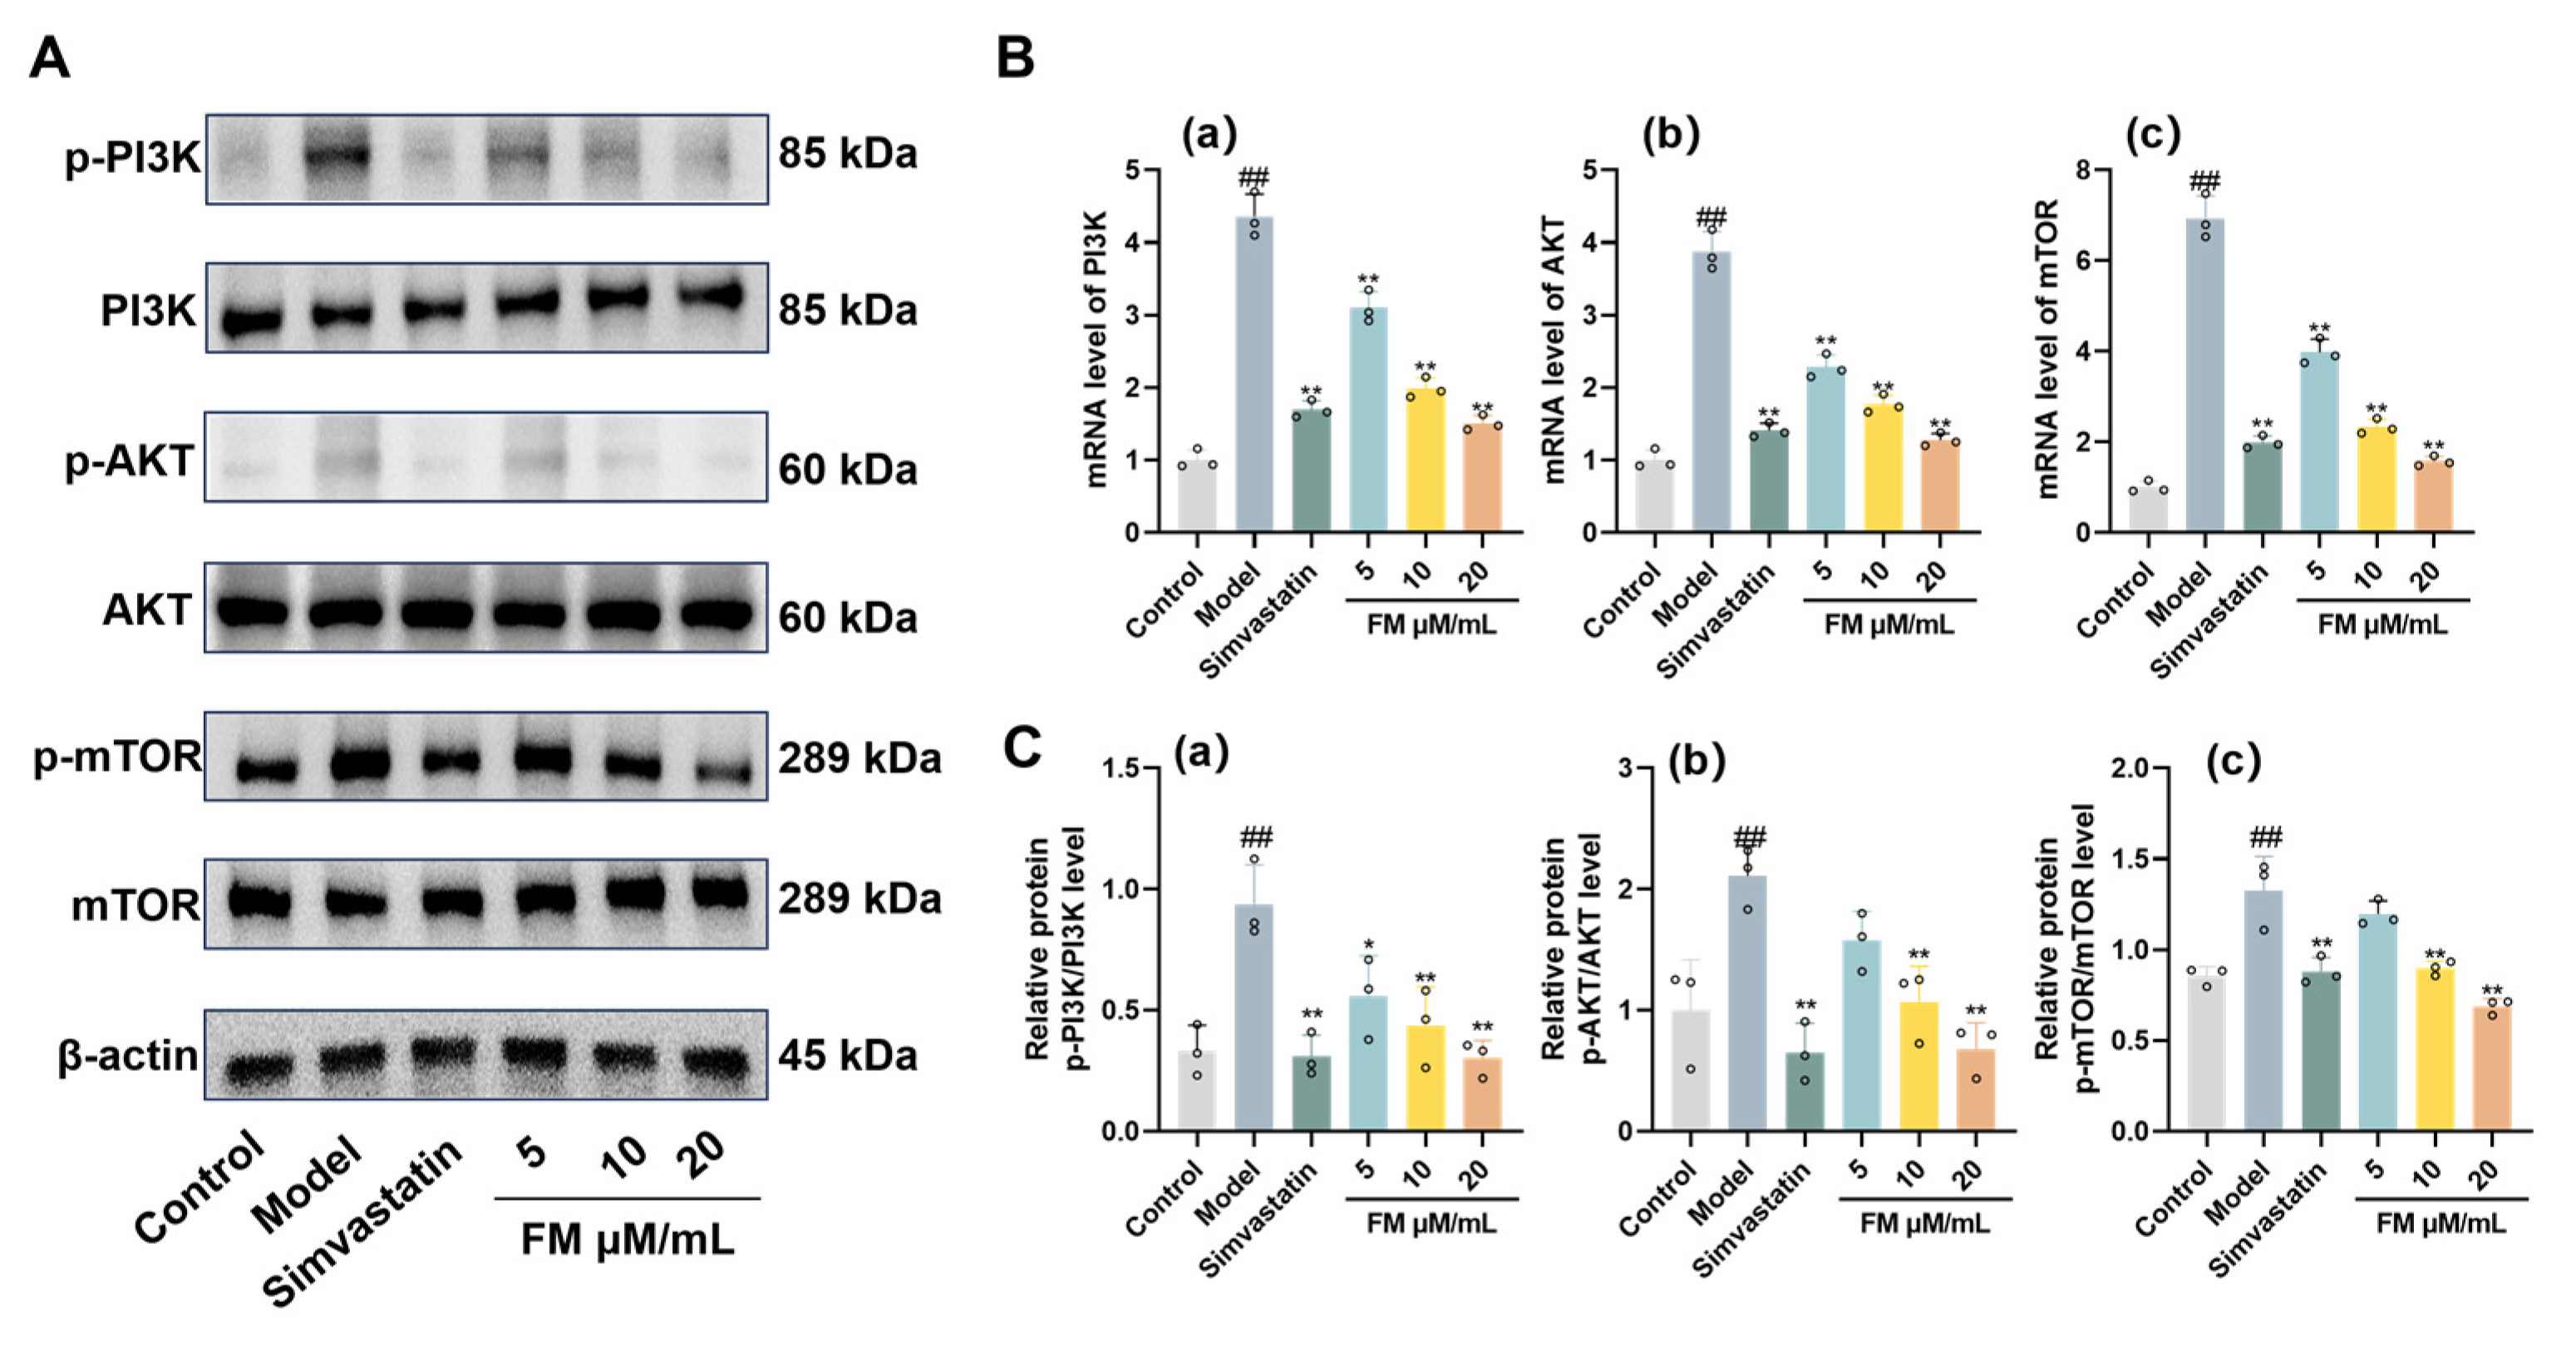
Figure 9.
Mechanisms of Formononetin in Improving T2DM-NAFLD.
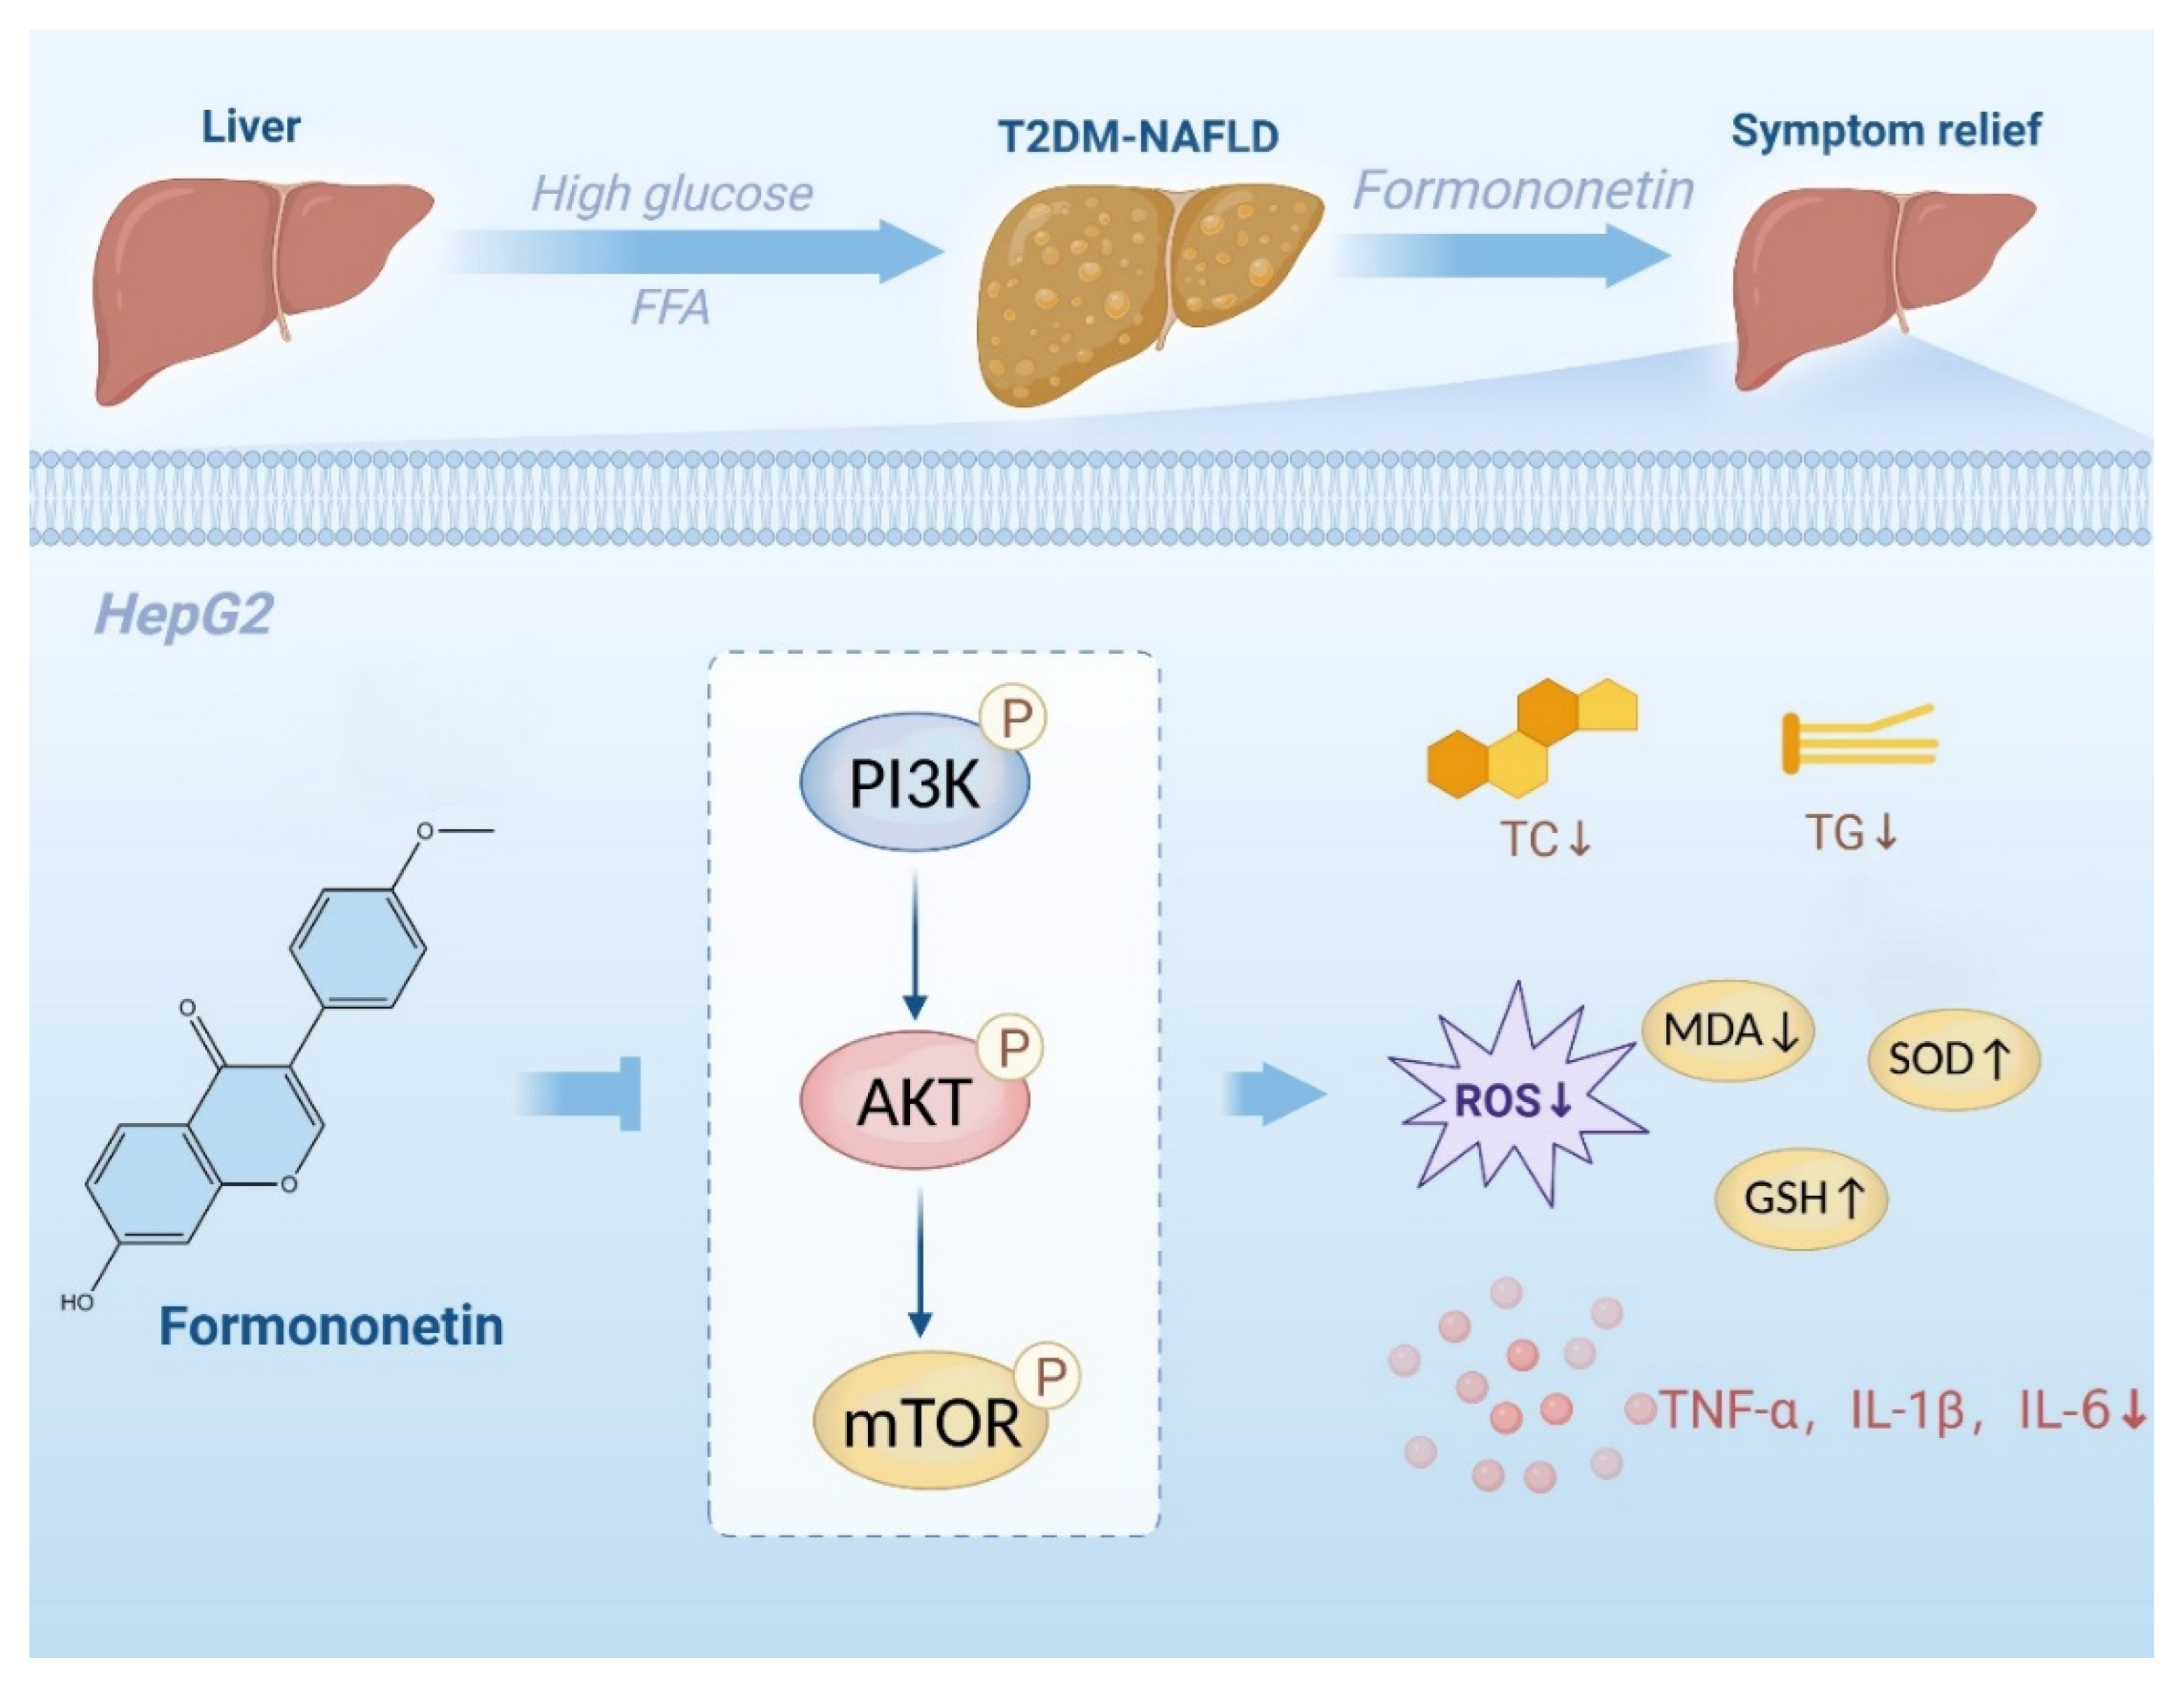

Table 1.
Primers sequences used for RT-qPCR.
| Genes | Forward primer (5′-3′) | Reverse primer (5′-3′) |
|---|---|---|
| IL-6 | CTTCCAGCCAGTTGCCTTCTTG | TGGTCTGTTGTGGGTGGTATCC |
| IL-1β | ATGCCTCGTGCTGTCTGACC | TTTGTCGTTGCTTGTCTCTCCTTG |
| TNF-α | AACGCTTCTTGTCACTTC | GGGCTACGGGCTTGTCACTC |
| PI3K | CCACGACCATCATCAGGTGAA | CCTCACGGAGGCATTCTAAAGT |
| AKT | ATGGCACCTTCATTGGCTAC | AACGGACTTCGGGCTCTTG |
| mTOR | GCCGCGCGAATATTAAAGGA | CTGGTTTCCTCATTCCGGCT |
| β-actin | CTGGAGAAACCTGCCAAGTATG | GGTGGAAGAATGGGAGTTGCT |
Disclaimer/Publisher’s Note: The statements, opinions and data contained in all publications are solely those of the individual author(s) and contributor(s) and not of MDPI and/or the editor(s). MDPI and/or the editor(s) disclaim responsibility for any injury to people or property resulting from any ideas, methods, instructions or products referred to in the content. |
© 2026 by the authors. Licensee MDPI, Basel, Switzerland. This article is an open access article distributed under the terms and conditions of the Creative Commons Attribution (CC BY) license (http://creativecommons.org/licenses/by/4.0/).
Copyright: This open access article is published under a Creative Commons CC BY 4.0 license, which permit the free download, distribution, and reuse, provided that the author and preprint are cited in any reuse.


