
Submitted:
04 September 2023
Posted:
07 September 2023
You are already at the latest version
Abstract
ObjectivesAbrus precatorius (AP) is a medicinal plant seldomly studied for its beneficial effects and as such significant gap exists in understanding the basis by which AP leaf bioactives (APLBs) elicit beneficial effects against diabetes mellitus (DM) type-1. MethodsWe estimated DM type-1 related parameters - total protein (TP), direct bilirubin (DB), urea, creatinine, alanine transaminase (ALT), aspartate transaminase (AST), alkaline phosphatase (ALP) and serum glucose (SG) after treatment with methanol extracts of AP leaves (APMLE) for 21 days followed by histopathological analysis of kidney and liver sections. APLBs were collected from GCMS fractions, database and literature searches and common targets were cross-intersected with annotated DM type-1 genes from experimental GSE14503 microarray dataset and genecard database. Overlapping differentially expressed genes were collected, their protein-protein interaction network was constructed and analyzed using various bioinformatics tools: Enrichr, SRplot, GSEA, Cytoscape, PyRx, and Discovery Studio to provide insight into the potential molecular basis of APLBs in DM-type-1.Results 15 compounds were identified from GCMS analysis of APMLE. Antidiabetic potential of APMLE was observed with significant (p <0.05) normalization of SG, TP, DB, ALT, AST, ALP, urea & creatinine while hepatorenal photomicrographs indicated moderate safety of use. Erucic acid, oleic acid, phytol and stigmasterol interact with 25 type-1 DM biomarkers revealed to be enriched in lipid and prostaglandin metabolic processes, neuroactive ligand receptor interaction, PPAR signaling pathway, diabetic cardiomyopathy, and cAMP signaling pathway. Furthermore, PPARalpha (peroxisome proliferator-activated alpha) and SCD (stearoyl-coenzyme A desaturase) were revealed as core biotargets interacting with APLBs via hydrogen bond, hydrophobic interaction and van der Waals forces from docking study. ConclusionThis study demonstrated the potency of APLBs in vivo against type-1 DM. The potential basis of action has been studied from computational perspective. Future interests may provide additional experimental data into mechanisms by which APLBs elicit this remarkable ability.
Keywords:
Abrus precatorius
; diabetes
; GSEA
; PPARalpha
; SCD
Introduction
Several debilitating diseases have become causes of concerns in the world today with solutions constantly being sought from day to day. Among these is diabetes mellitus (DM), a disease affecting about 537 million people and projected to increase to 643 million by 2030 worldwide.1 DM is metabolically distinguished by hyperglycemia resulting from poor response of the body to insulin (DM type 2) or an autoimmune process whereby insulin producing cells are attacked as a result of genetic or environmental predispositions (DM type-1).1
While side effects and the high burden of cost involved in DM treatments have been majorly perturbing, DM type-1 treatment involves daily insulin procedures as well as monitoring blood glucose regularly. Similarly, DM type 2 treatment typically involves the use of medications such as alpha glucosidase inhibitors, glucagon-like peptide 1 (GLP-1) agonists, sulphonylureas, dipeptidyl peptidase 4 (DPP-4) inhibitors, thiazolidinediones as well as sodium-glucose co-transporter 2 inhibitors.2
With biological and pharmacological potential attributed to medicinal plants, Nanu et al.2 acknowledged that available ethnobotanical data underpinned the roles of potent bioactives of medicinal plants in the treatment of various pathological conditions including DM.
Abrus precatorius (AP) plant from the Fabaceae family is a significantly underused food legume having widespread distribution across the tropics. Its medicinal potentials according to Bhakta and Das3 include anti-DM, anticancer, antimalarial, and antimigraine, anti-microbial, anti-serotonergic, anti-fertility activities. Other pharmacological potencies reported for AP by Boye et al.4 are: anti-inflammatory, anti-trypanosomal, anti-oxidant, anti-helminthic, anti-α-amylase, immuno-modulatory, antiasthmatic among others.
Computational biology, artificial intelligence, bioinformatics and big data science have provided foundational shift from the conventional single isolation modes of traditional medicine research to the more holistic approach where there is much more reference to the whole. This provides better understanding of the molecular mechanisms of multicomponent medicinal plants in drug discovery, design and development. Construction of biomolecular networks of bioactive-targets/network-targets exerts significant visualization of these physiological mechanisms, hence elucidating the therapeutic targets of the complex and multifaceted botanical drug candidates.5
Boye et al.4, Gaddala and Nataru6, Boye et al.7 and Pokharkar et al.8 have provided some insights into the type II antidiabetic potentials of A. precatorius extracts in murine models as well as their bioactive components, however, this current study expanded the exploration of the potency of the methanolic extract of the plant’s leaf against alloxan-induced DM type-1 in wistar rats. We furthermore aimed to provide insight into the potential molecular basis by which AP leaf bioactives (APLBs) elicit this biological effect in vivo. We administered the methanolic extract of AP leaf (APMLE) to experimental rats for in vivo antidiabetic efficacy elucidation and thereafter obtained a library of the plant’s bioactives via GCMS and literature searches. We performed network pharmacology study along with other bioinformatics analyses to elucidate the plant’s potential molecular basis; a novel committed approach to the best of our understanding. This provides a useful foundation for scientific evidence of AP use in traditional medicine.
Materials and Methods
Chemicals and Drugs
Alloxan monohydrate and methanol were purchased from SigmaAldrich Co., St. Louis, MO, USA, glibenclamide was a product of May & Baker, Nigeria; Diagnostic kits were products of Randox, UK. All other chemicals and solvents used in the study were of analytical grade.
Plant Collection, Identification and Authentication
A. precatorius leaves were harvested in August, 2022 from an uncultivated local neighborhood (Latitude: 7.081374 and Longitude 3.3041158) of Harvarde College of Science Business and Management Studies (HCSBMS), Obada campus and was subsequently identified by a taxonomist, Mr. O.A Oropo of Botany unit, HCSBMS where a voucher number (HCSBMS/001/012) was deposited for future reference.
Preparation of APMLE
Harvested and authenticated AP leaves were fully shade-dried, milled into fine powder, passed through 60 mesh before storage in airtight containers (plastics) for further procedures. 150g of the powdered leaf was soaked in 800 mL of methanol for 72 hours while covering with cheesecloth and mild stirring four times per day. A Whatman Filter paper (No. 1) was utilized for filtering the content at the end of 72 hours followed by the use of a rotary evaporator (Heidolph Laborato 400) on a water bath to recover the methanol. This left a dark-green liquid extract which was dried using a desiccator until completely dried. The procedures were repeated to obtain sufficient yield of APMLE and thereafter stored for further use.
Gas Chromatography – Mass Spectrometry (GC-MS) of Plant Extract
The GC-MS of the plant extract was carried out using a Hewlett Packard Agilent 6890 Gas Chromatograph with a 5973 Mass Selective Detector. The column was fused with silica capillary column, HP – 5 (30m × 0.25µm film thickness, CA, USA). Helium gas was used as the carrier gas at a flow rate of 1.0ml/min and the oven temperature was programmed from 500C (2 mins hold) to 2800C (10mins hold) at 20oC/min rate. Respective injection and interface temperatures were set at 250oC and 280oC. Splitless injection of 1ml of the sample followed and analysis was done in full MS scan mode. The spectrums of the bioactives were compared with the GC-MS National Institute Standard and Technology [NIST 11] library containing spectrums of known components.
Ethical Clearance
All animal protocols followed in the study were reviewed and approved by the Institutional Review Board on Animal Experimentation (Approval ID: HCSBMS/AEAN/005). We followed (guidelines on use of animals in scientific experimentation subscribed by Nigeria) while international (National Institutes of Health, NIH, OPRR Public Health Service Policy on Humane Care and Use of Laboratory Animals. Rockville, MD: NIH/ Office for Protection from Research Risks, 1996 (http://grants. nih.gov/grants/olaw/olaw.htm) guidelines on human care and use of animals in scientific experimentation were strictly adhered to as well as the European Commission Directive 86/609/EEC for animal experiments.8
Acquisition and Care of Animals
A total of 30 six weeks male wistar rats weighing between 120g – 170g were obtained from the laboratory animal housing and care facility of the Biochemistry unit of HCSBMS. Rats were housed in standard plastic cages of dimension 50 cm × 36 cm × 60 cm and fed with standard rodent chow (Vital Feeds Nig. Ltd). Dry wood shavings were used as bedding while they had unrestricted access to water and were maintained under ambient conditions of temperature, humidity, and normal dark/light cycle. At the end of the first week, fasting blood glucose (FBG) levels of the animals was ascertained via tail clip sampling to ensure that only animals with FBG levels not above 100mg/dl were retained for the study.
Induction of Diabetes Mellitus Type-1and Experimental Design
For induction of DM type-1, the rats were fasted overnight and diabetes was induced by intraperitoneal injection of a single dose 200 mg/kg b.wt alloxan monohydrate. The rats were exposed to 10% glucose solution post diabetes induction while blood was collected after 48 hours from the tail vein to confirm diabetic status (blood glucose ≥ 250 mg/dl). The current study randomly assigned the rats to six experimental groups of 5 rats each as follows:
Control: normal (5ml/rat/day; po) + rodent chow + water
Model: Alloxan monohydrate (200mg/kg; ip) + rodent chow + water
Glibenclamide: Alloxan monohydrate (200mg/kg; ip) + Glibenclamide (0.5mg/kg; po) + rodent chow + water
APMLE (100mg/kg): Alloxan monohydrate (200mg/kg; ip) + APMLE (100mg/kg; po) + rodent chow + water
APMLE (200mg/kg): Alloxan monohydrate (200mg/kg; ip) + APMLE (200mg/kg; po) + rodent chow + water
APMLE (400mg/kg): Alloxan monohydrate (200mg/kg; ip) + APMLE (400mg/kg; po) + rodent chow + water
The treatment was administered for 21 days at a doses not exceeding LD50 of plant extract10 while final body weight and final blood glucose were recorded.
Blood Collection and Analysis of Biochemical Parameters in Serum and Isolation of Organs
Blood was collected into plain tubes via ocular puncture before sacrifice using capillary tubes and centrifuged at 1006×g (Eppendorf centrifuge 5702R, 4°C) for 5 minutes to obtain the serum (supernatant) which was dispensed into labelled tubes. This was followed by the assay of alanine transaminase (ALT), aspartate transaminase (AST), alkaline phosphatase (ALP), creatinine (CREA), urea, serum glucose (GLC), direct bilirubin (DB) and total protein (TP) parameters in the obtained serum using diagnostic kits (Randox, UK) with adherence to manufacturer’s instruction. Liver and kidney from each group were collected and preserved in 10% buffered formalin for histopathological procedure.
Histopathology Examination of Liver and Kidney Tissues
A portion of each of these tissues were observed and cut into small pieces of not more than 4mm thick into pre-labeled cassettes. These were further immersed in 10% formal saline for 24 hours to fix. Tissue processing was carried out using the automatic tissue processor (Leica TP 1020) before embedding in paraffin wax followed by sectioning of the tissues at 4µm (ribbon section), and floating on water bath (Raymond lamb) set at 550C. Drying at 600C for 1hour followed before staining using haematoxylin and eosin technique.
Collection of A. precatorius Bioactives and Targets
We created a library of AP chemical ingredients from the identified fractions by GCMS analysis. The library was expanded by searching reported APLB from the traditional Chinese medicine systems pharmacology database (TCMSP).11 The chemical ingredients were filtered by the integration of pharmacokinetic properties - the oral bioavailability (OB) ≥ 20 and drug-likeness (DL) ≥ 0.1. Next, the SMILES specifications of the bioactives were obtained from the PUBCHEM database12 and fed into the SwissTarget prediction database13 for the elucidation of their Homo sapiens biotargets. Targets with a probability score ≥ 0.1 were retained for further studies.
Determination of Therapeutic Biotargets of DM Type-1 and Common Target Screening
To create a therapeutic target library of DM type-1, the gene expression omnibus database14 (GEO) [http://www.ncbi.nlm.nih.gov/geo/] and the genecard database15 (http://www.genecard.org/), were utilized. The experimental DNA microarray dataset, GSE1450316, a human gene expression microarray profile of type-1 diabetes mellitus was downloaded from GEO. GSE14503 was profiled on Affymetrix Human Genome U133 Plus 2.0 Array platform GPL570 (Affymetrix, Inc., Santa Clara, CA, USA). Stored .CEL files generated by the Affymetrix platform was downloaded and processed using the Bioconductor package in R software program.17,18 Using the Bioconductor R Package Oligo, the data underwent format conversion, missing data filling, background correction, and data normalization by the Robust Multiarray Average (RMA) method.19 Furthermore, annotation of the dataset was carried out using the Bioconductor Limma package via the GEO2R tool.14 All the expression probes were referenced against gene symbols with the removal of duplicate transcripts. The genes showing Log Fold change (FC) expression difference ≥ 1.1 and which cleared Benjamini and Hochberg’s false discovery rate (FDR) with adjusted p-value ≤ 0.05 were noted as differentially expressed genes (DEGs).20 DEGs from GSE14503 dataset and those from genecard database were cross intersected with those obtained for APLBs using the Venny 2.1 webtool (www.bioinfogp.cnb.csic.es/tools/venny) to finally obtain a library of overlapped genes (OGEs) as therapeutic targets as expressed by A. precatorius.
Network Construction and Functional Enrichment Analysis
A protein-protein interaction (PPI) network of the OGEs was constructed using the StringApp of the cytoscape software21 for studying both the indirect and direct interactions of OGEs. To understand the enriched molecular functions, cellular components and biological processes of the OGEs, we carried out Gene ontology (GO) terms with KEGG pathway enrichment analysis using Enrichr webserver22. Summary of the GO terms and removal of redundancies was carried out using the REVIGO tool.23 This was followed by the visualization of the results using the SRPlot webtool (http://www.bioinformatics.com.cn/en).
Gene Set Enrichment Analysis (GSEA)
GSEA is a potent computational tool which provides biological information on the link between gene sets and a disease phenotype. In the current study, the GSEA of GSE14503 dataset was run using JAVA GSEA 4.3.2 software24,25 at default [except permutation type = gene set; gene set database = h.all.v2023.1.Hs.symbols.gmt and chip platform = Human_AFFY_HG_U133_MSigDB.v2023.1.Hs.chip ]. Expression dataset and phenotype labels were provided in gct, and cls formats.
Functional Clustering Core PPI Subnetwork Extraction
A Cytoscape plug-in, MCODE was used for clustering the protein network. The parameters were set at default (degree cutoff: 2, cluster finding: haircut, node score cutoff: 0.2, max. depth: 100, K-Core: 2). For extraction of the core PPI subnetwork via in-depth topological analyses, we used CytoNCA, a Cytoscape plug-in for the network centrality analysis. The filtering criteria was set to be above the average of closeness, betweenness, and subgraph centralities of the preliminary network and the corresponding subnetworks extracted respectively. The merge function of the Cytoscape software was thereafter used to isolate the core PPI subnetwork (core proteins) with the sorting out of the key nodes in the preliminary PPI network.
Molecular Docking of Key Targets
To simulate the interaction of the core targets with the APLBs, crystal structures of the key targets were downloaded in PDB format and were prepared in Discovery Studio analyzer26 software by removing water molecules. Pyrx27 was utilized for adding charge, and parameterizing for molecular docking via AutoDock Vina-based platform of APLBs on binding sites of crystal structures elucidated using the protein-ligand interaction identifier tool (https://plip-tool.biotec.tu-dresden.de/plip-web/plip/index). The corresponding affinity energy values were recorded with the best pose taken as the pose with the lowest binding energy in kcal/mol. Docking results were then exported away from PyRx into Discovery Studio software for receptor-ligand interactions analysis.
Statistical Analysis
Analyses of the biochemical parameters were conducted in triplicates and the results were expressed as mean ±SD. Student’s t-test was used to analyze statistical differences in weight and FBG changes assayed before and after treatment while one-way ANOVA was used to determine the statistical difference between the treatments and the control group at 95% level of confidence (p<0.05) using IBM SPSS (v.23). Post-hoc analysis was done using post Tukey’s post-hoc test.
Results
Gas Chromatography – Mass Spectrometry (GC-MS) of Plant Extract
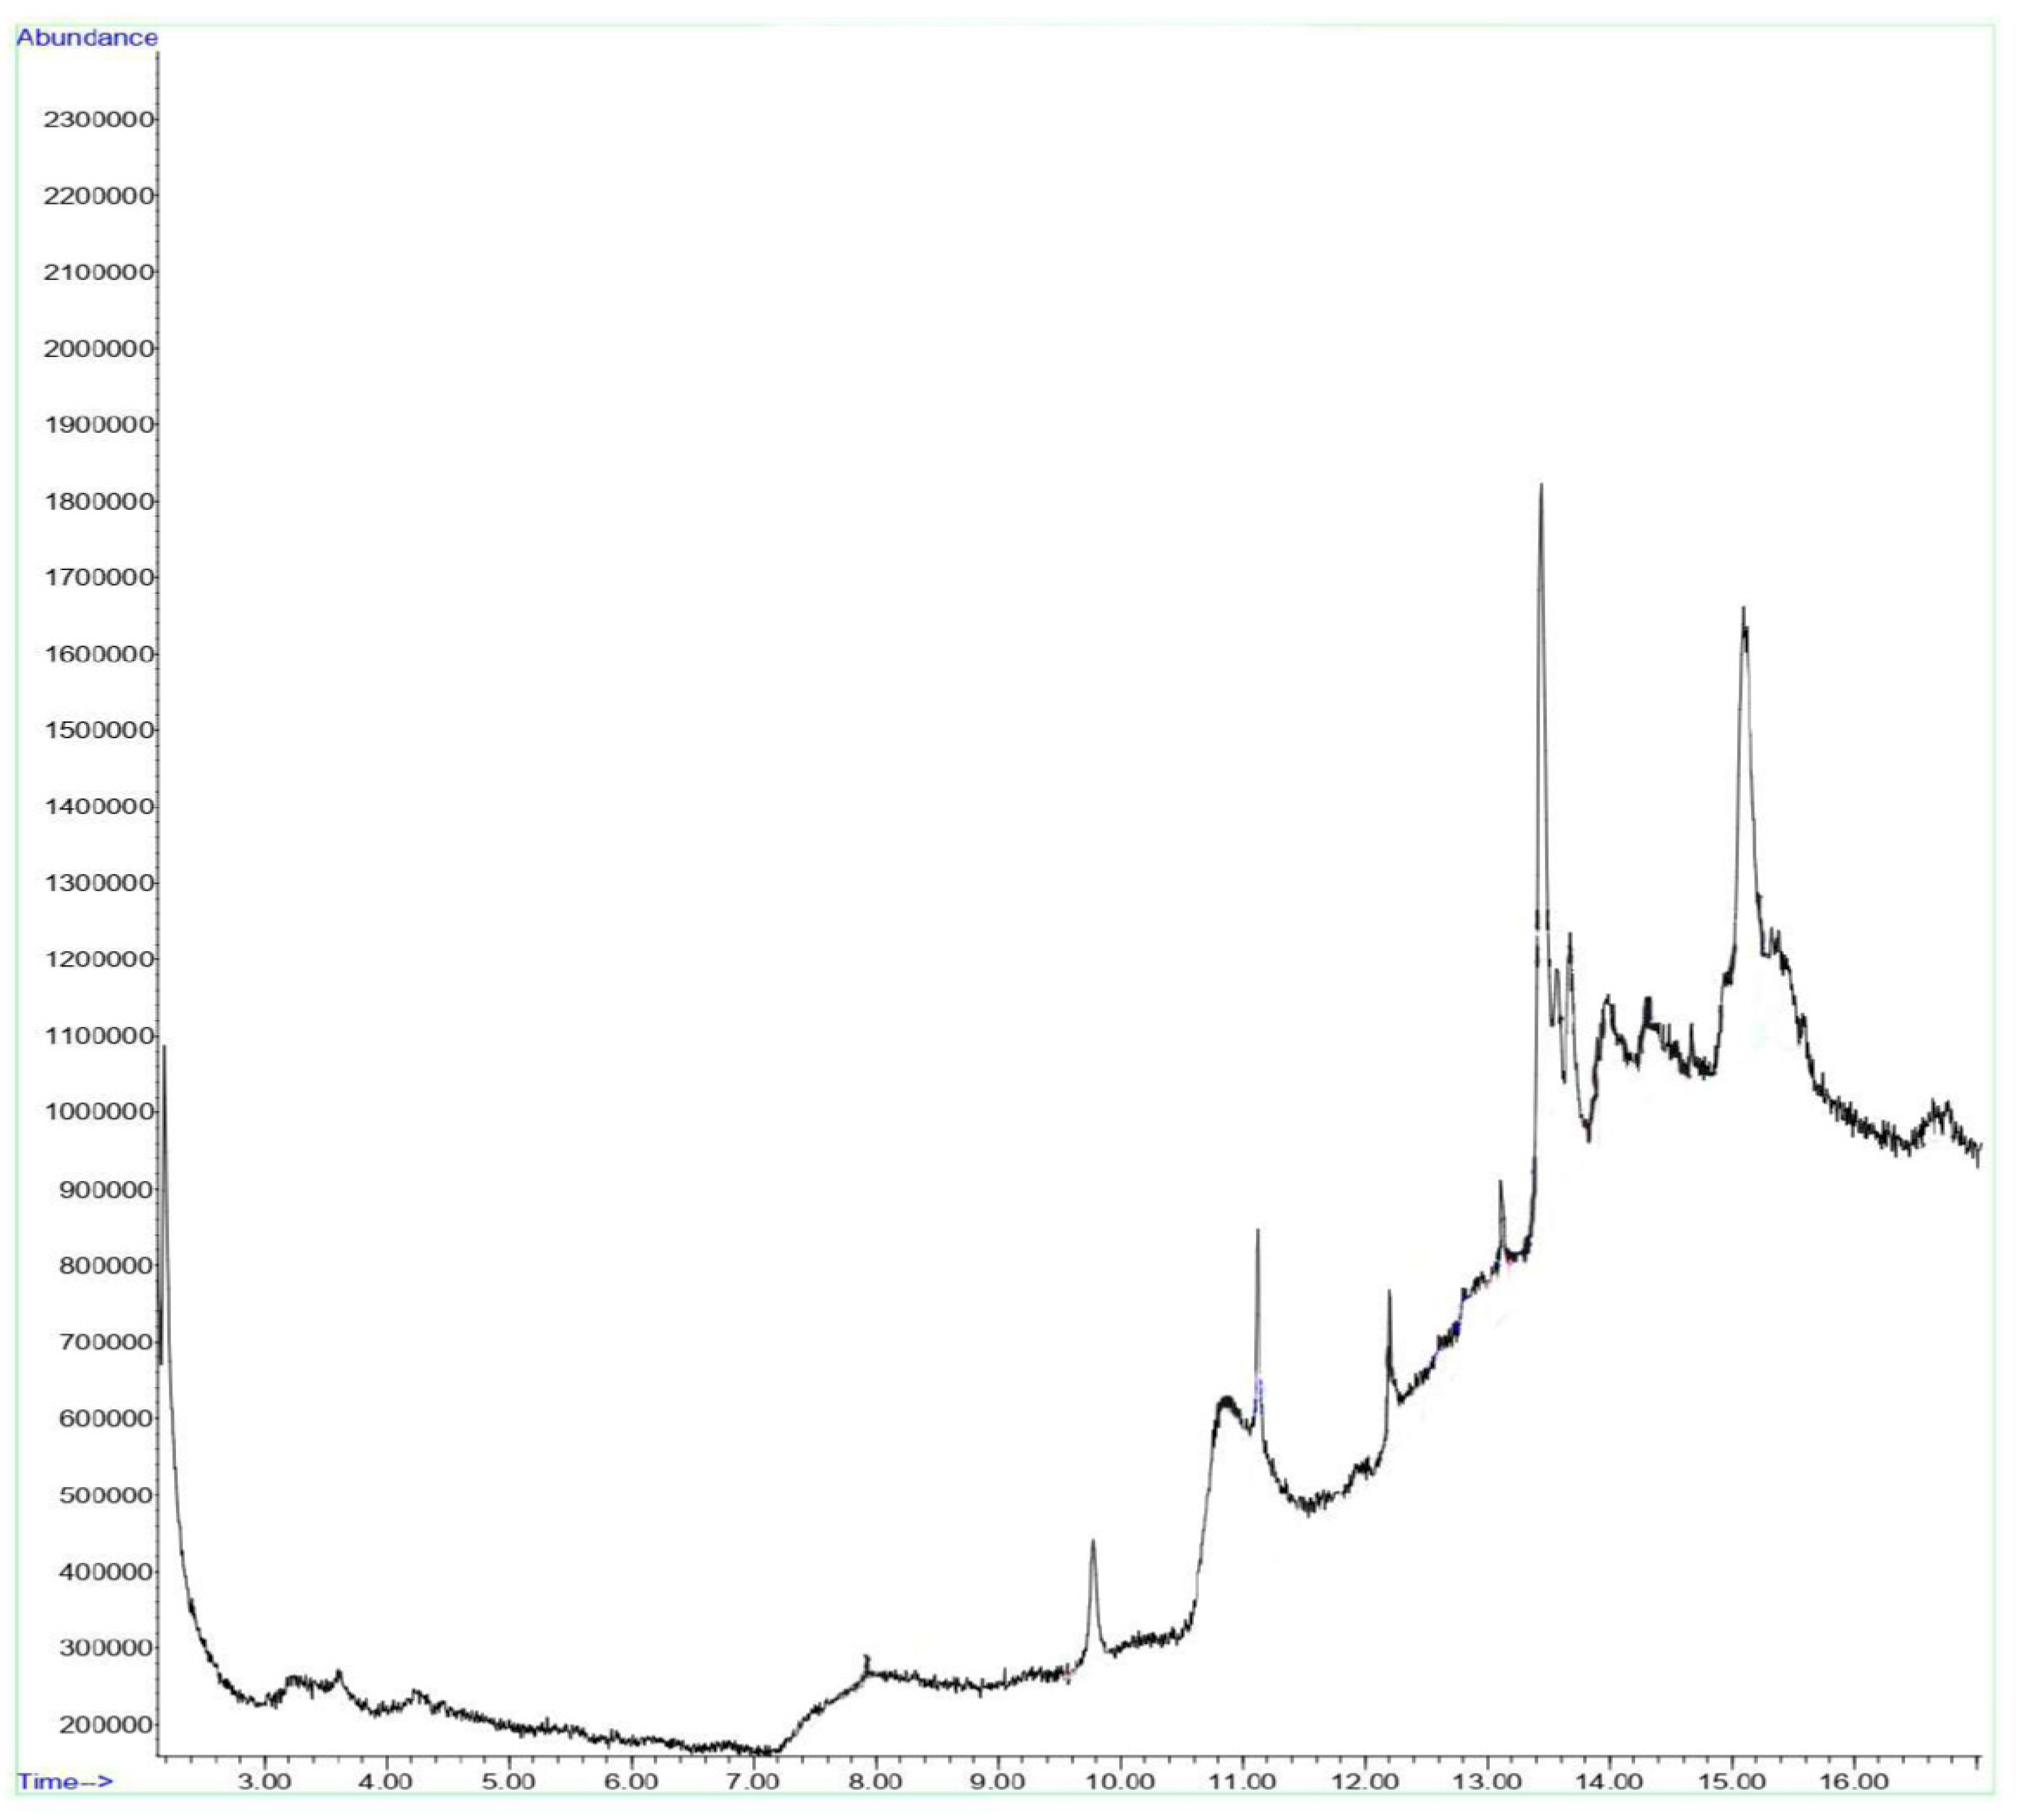
GC-MS analysis shows the active ingredients present in APMLE showing multiple peaks with 15 compounds being identified. They included (1) 3,7,11,15-Tetramethyl-2-hexadecen-1-ol (phytol); (2) oleic acid; (3) erucic acid; (4)11,13-Dimethyl-12-tetradecen-1-ol; (5) Morpholine; (6) 2-Methyl-Z,Z-3,13-octadecadienol; (7) Oxiraneundecanoic acid, 3-pentyl-, methyl ester, cis-; (8) Cyclopropaneoctanal, 2-octyl-; (9) Piperidine, 1-methanesulfonyl-4-methoxy-; (10) Benzeneethanamine, N-[(pentafluorophenyl)methylene]-.beta.,3,4-tris[(trimethylsilyl)oxy]-; (11) Cycloheptasiloxane, tetradecamethyl-; (12) cumidine; (13) Cyclohexasiloxane, dodecamethyl-; (14) Benzenamine, N-ethyl-3-methyl- and (15) Benzofuran, 2,3-dihydro-.
Figure 1.
GCMS spectrum of APMLE showing abundances of bioactives present and the retention time.
Body Weight and Blood Glucose Post Diabetes Mellitus Type-1 Induction
Table 1 showed that there were significant (p < 0.05) differences between the initial and final body weights of the experimental rats. The percentage differences in weight was between -3.099 and 12. 676 after a 21-day period of the study. The initial and final FBG levels after 21 days of the study were also observed to be significantly different (p < 0.05) indicating the hypoglycemic ability of APMLE against DM type-1. The percentage differences in the FBG levels across the experimental groups were between -1.854 to 81.854 as shown in Table 1.
Effect of APMLE on Serum Biochemical Parameters
The effect of APMLE administration on serum biochemical parameters compared to the model, control and glibenclamide groups were as observed in Table 2. The table showed that except for value obtained for the TP, all serum biochemical parameters studied were higher in values for model group compared to the other groups. Further noted in the Table is the significant differences (p < 0.05) in the obtained values of TP, ALT, AST, and ALP in all the APMLE treated groups compared to the glibenclamide group. Although significantly different, these differences fall within normal ranges of TP and the liver marker enzymes. Table 2 additionally indicated that data obtained for DB levels in serum of experimental animals following administration of 200mg/kg b.wt and 400mg/kg b.wt APMLE were not statistically different (p < 0.05) from the glibenclamide group. This trend was similar also to the observation obtained in the DB values for 100mg/kg b.wt APMLE treated group and the normal group. It can further be noted from Table 2 that administration of 200mg/kg b.wt APMLE did not result to statistical difference in urea levels of these groups compared to the glibenclamide treated groups, an observation conversely noted for the 100mg/kg b.wt and 200mg/kg APMLE treated groups. Creatinine values obtained after 21days of APMLE treatment at 100mg/kg b.wt compared favorably well (p<0.05) with control group. While the values obtained for the 200mg/kg b. wt treated group was not statistically different (p <0.05) from glibenclamide group, similar observation was noted for data obtained data for the 100mg/kg b.wt treated group compared to the 400mg/kg b.wt treated group. Serum glucose levels obtained after 21 days of 100mg/kg b.wt and 400mg/kg b. wt APMLE administration were not significantly different (p < 0.05) from data obtained for the model and control groups. These ranges of values obtained which were observed to be within normal ranges compared to the model group indicated the hypoglycemic ability of APMLE against DM.
Histopathological Effect of APMLE on Kidney Tissues
Histopathological effects on the kidneys following APMLE treatment compared to the control, model and glibenclamide groups are as shown in Figure 2 A-F. Here, the renal cortex showed normal glomeruli with normal mesangial cells and capsular spaces (white arrow), while the renal tubules also appear normal (blue arrow). In 2A and 2C, the interstitial spaces appear normal (slender arrows). Apparently in 2B, the interstitial spaces showed congested dilated vessels (slender arrow). In 2D-F, the interstitial spaces showed mild vascular congestion in D and much less congestion in dilated vessels of E and F (slender arrows) indicating the progressive corrective effect of the administration A. p recatorius type-1 DM in rats.
Histopathological Effect of APMLE on Liver Tissues
Figure 3 A-F shows the photomicrograph of a liver section stained by Haematoxylin and Eosin. Figure 3A shows a normal central venule (yellow arrow), normal portal veins with mild congestion (white arrow). The morphology of the hepatocytes appear normal (blue arrow), as well as that of the sinusoids (black arrow). Similar observations were noted in 3C-F. Figure 3B showed congested portal vein (white arrow), the morphology of the hepatocytes show cytoplasmic infiltration of fat (blue arrow); hepatic steatosis and necrotized hepatocytes (green arrow). Treatment with APMLE showed progressive atenuation of this effect [Figure 3F].
Collection of A. precatorius Bioactives and Targets
We obtained a total of 105 targets (probability score ≥ 0.1) from the Swisstarget prediction software for APLBs obtained from GCMS, TCMSP database and literature which passed the screening criteria (OB ≥ 20 and DL ≥ 0.1). These bioactives included erucic acid, stigmasterol, oleic acid and phytol (E,7R,11S)-3,7,11,15-tetramethylhexadec-2-en-1-ol) [Figure 4A-D].
Therapeutic Biotargets of Diabetes Mellitus Type-1 and Common Target Screening
Cross intersection of annotated DEGs genes from the microarray dataset, GSE14503, DM Type-1 genes from the genecard database and AP expressed biotargets resulted into 25 significantly regulated (adjusted p-value ≤ 0.05; logFC ≥ 1.1) OGEs, 12 of which were up regulated and 13 downregulated as shown in Table 3.
Network Construction and Functional Enrichment Analysis
Using the String App of the cytoscape software, a preliminary protein-protein interaction (PPI) network of the OGEs was generated characterized by 25 nodes connected to 24 edges (Figure 5) and have average clustering coefficient of 0.404, network density of 0.242, heterogeneity of 0.646 and centralization of 0.346. Using the Enrichr tool, the top GO enriched terms (p < 0.05) – Biological process, Cellular component and Molecular function are presented in Bubble plots (Figure 6). The enriched KEGG pathways are as shown in the Bubble plot combined with Sankey diagram in Figure 7.
Figure 6 showed that biological processes for which the OGEs were significantly enriched (p < 0.05) included regulation of lipid metabolic process, regulation of primary metabolic process, transcription initiation from RNA polymerase II promoter, regulation of cholesterol storage and so on. Go terms enriched for cellular components included mostly integral component of plasma membrane, followed by peroxisome, endoplasmic reticulum membrane, and voltage-gated calcium channel complex. For molecular function, the enriched GO terms were oxidoreductase activity, acting on the CH-OH group of donors; NAD or NADP as acceptor; prostaglandin E receptor activity; prostaglandin receptor activity; and so on. Top KEGG pathway for which OGEs were enriched as obtained in this study (FDR < 0.05) included Neuroactive ligand-receptor interaction, PPAR signaling pathway, Diabetic cardiomyopathy, cAMP signaling pathway, Chemical carcinogenesis etc. (Figure 7).
Gene Set Enrichment Analysis of OGEs
AS shown in Figure 8 A-E, GSEA results showed core enrichment of OGEs in UV response (NES = 2.19), androgen response (NES = 1.71), heme metabolism (NES = 1.5), and xenobiotic metabolism (NES = 1.41) and hypoxia (NES = 1.31).
Functional Clustering Core PPI Subnetwork Extraction
As proteins show propensity for forming different clusters while eliciting their functions in vivo, we used MCODE plugin of cytoscape software to cluster the OGEs and obtained 3 clusters. (Figure 9). Further topological analysis of the preliminary PPI using the CytoNCA plugin of cytoscape software provided additional insight into the core proteins which define the PPI network. The topology of the PPI network suggests that nodes occupying critical locations usually have significant values of centrality and includes Subgraph Centrality, Betweenness Centrality and Closeness Centrality. We first calculated the average values of these centrality measures and obtained 5.7186, 11.36 and 0.0617 respectively. We went further to extract these networks by setting the threshold to be the obtained averages to obtain the subnetworks (Figure 9 A, B, C). Additionally, we used the intersectional merge function of the cytoscape software to extract the core proteins involved in our PPI network. We obtained PPARalpha (peroxisome proliferator-activated alpha) and SCD (stearoyl-coenzyme A desaturase) as the core protein targets of APLB in DM type-1.
Molecular Docking of Key Targets
Docking of PPARA and SCD against APLBs are presented in Figure 11. In the current study, more hydrophobic interactions were observed compared to other interaction types with binding energies ranging from -8.4 kcal/mol to -5.6 kcal/mol (Figure 11); lower binding energy implying more affinity. Hydrogen bonds on the other hand, were the second most encountered interactions in our protein–ligand complexes (figure 11). PPARA docking (Figure 11 A-D) showed binding site residues’ interaction with erucic acid involves one hydrogen bond with SER 280, hydrophobic alkyl and pi-alkyl interactions with MET 320 and PHE 218 respectively. With oleic acid, the interactions were hydrophobic alkyl interactions with MET 220, VAL 324, LEU 331; with stigmasterol, van der Waals interactions as well as hydrophobic alkyl interactions with PRO 424, ILE 420 and LEU 412 and finally with phytol, the observed interactions were pi-sigma (TYR 334), alkyl (MET 220, VAL 324, ILE 317, LEU 321, LEU 331) and pi-alkyl (PHE 218) hydrophobic interactions.
Docking with SCD (Figure 11 E-H) showed binding site residues’ interaction with erucic acid produces van der Waals interaction, hydrophobic alkyl (MET 79, VAL 182, LEU 186) and pi-alkyl (HIS 83) interactions. On the other hand, its binding with oleic produces one hydrogen bond (HIS 83) and one pi-alkyl interaction (PHE 178). With stigmasterol, the binding produces van der Waals interaction as well as hydrophobic alkyl (LYS 162, ILE 280, PRO 282, PRO 305), hydrophobic pi-alkyl (HIS 125, HIS 161, HIS 302) interactions. Binding with phytol produces one pi-sigma (TRP 153), one carbon hydrogen bond (GLN 147), hydrophobic alkyl (ILE 115, LEU 185, VAL 264, ALA 292), pi-alkyl (HIS 120, HIS 157, HIS 171, TRP 184, LEU 185, HIS 298) interactions.
Discussion
Medicinal plants elicit their pharmacological and therapeutic effects due to the presence of various potent bioactives or natural products. These are elucidated using methods such as GC-MS, LC-MS, and LC-NMR, NMR, HPLC and so on. In this study, we have utilized GCMS for APLBs constituent determination. Weight gain in treated groups suggests enhancement of glucose metabolism in the APMLE treated groups compared to model group. The remarkable hypoglycemic activity of APMLE observed in this study as also reported by Boye et al.7 and Pokharkar et al.8 could be linked to stimulation of insulin release following pancreatic beta cells repair by the extract.
Normal total protein level is an important parameter for ascertaining health and diagnosing disease. During diabetes for example, increased protein catabolism increases amino acids flow into the liver. With glucagon responses being abnormal in type 1 diabetes, this enhanced proteolysis in uncontrolled diabetes might explain the observed decrease in the total protein content of the model group. Conversely, APMLE administration significantly increased the total protein levels to about normalcy, possibly inhibiting increased proteolysis observed in DM type -1.
Liver inflammation might have been indicated in the model group due to the increase in serum levels of bilirubin and marker enzymes (ALT, AST, and ALP). Increase in the activities of these enzymes in the serum might probably have occurred due to leakage from breached cell membrane structure of the model rat groups. The cell membrane compromise could be attributed to an increase in free radical generation in response to alloxan induction causing leakage into extrahepatic tissues. Oral administration of APMLE abated this observed elevated activities of the enzymes. This protective effect of the plant extract in reversing liver damage due to diabetes was also reported by Uroko et.al.28 using methanolic extract of A. precatorius leaf in CCl4 induced diabetic rats.
DB estimation is a good indication of liver health. Elevated DB in the serum of model animals in the present study may be due to reduced clearance arising from liver disease. Treatment with APMLE reversed this condition in treatment groups, thereby lowering DB level. The increase in serum levels of urea and creatinine in the model group is not unexpected. This is because insulin absence and attendant glucose starvation of extrahepatic tissues stimulates gluconeogenic pathway as an alternative in the route of glucose supply and consequently, increased proteolysis. This results into increased urea level in the blood due to deamination of free glucogenic amino acids in the liver. Urea levels in the plasma therefore increases as a result of increase in proteolysis. Creatinine is a degradative metabolite of muscle creatine phosphate, and its serum concentration is usually fairly constant. Its concentrations however, becomes elevated in conditions of compromised renal function. Elevated creatinine levels of model animals suggests renal function impairment. Treatment with APMLE, however, clearly attenuated this effect, signifying better clearance in the event of treatment with APMLE. In type-1 diabetes, interstitial space accumulation causes impaired oxygen delivery to issues (cellular hypoxia) and is associated with dysfunction of the mitochondria which increases oxidative stress as well as hyperglycemia.29 Hyperglycemia induces activation of the transcription factors - carbohydrate response element-binding protein (ChREBP) and sterol regulatory element-binding protein 1c (SREBP-1c),30 hence hepatic steatosis and necrosis observed in the model group which are cleared in APMLE treated groups. This indicates restorative potential of the plant extract and implies that APMLE help clear fats infiltrating the cytoplasm of the hepatocytes as well aiding cellular recovery from the effect of necrotized hepatocytes. Enrichment of APLBs in lipid catabolic process explains that APLBs potentially corrects lipid abnormalities due to hyperglycemia associated with type-1 diabetes. This potentially may include correcting qualitatative and quantitative abnormalities in triglyceride, LDL-cholesterol and HDL-cholesterol levels associated with type-1 DM. Top enrichment of APLBs in prostaglandin metabolic process suggests the plant extract potentially corrects altered prostaglandin metabolism implicated in the occurrence and advancement of vascular complexity in type -1 DM. Enrichment in the neuroactive ligand receptor interaction pathway which contains G protein-coupled receptors (GPCRs) of dopamine and serotonin could explain that APLBs may elicit physiological effect via correcting altered dopamine and serotonin metabolism in type-1 DM.
SCD and PPARA have been revealed as core targets of APLBs in this study. SCD is the rate-limiting enzyme in monounsaturated fatty acid biosynthesis and is therefore demonstrated in this study as a risk factor for diabetes. Brenner (2006) 31 submitted that type 1 diabetes depresses unsaturated fatty acids biosynthesis via depressing the mRNAs and activities of SCD while PPARA on the other hand is activated by unsaturated fatty acids. This potentially surmises that APLBs elicited ameliorative action in type-1 DM via regulation of biosynthesis of unsaturated fatty acids which play important critically varied roles in human health. 31
The varied interactions of APLBs with core type-1 DM biomarkers revealed in this study have been shown to include hydrogen bonds, van der Waals forces, weak hydrogen bond (carbon hydrogen bond) and hydrophobic interactions (alkyl, pi-alkyl and pi-sigma) at the proteins’ binding sites. Hydrophobic interactions are formed between ligand lipophilic groups and non-polar amino acid side chains of proteins when they come in close proximity. They are the major driving forces in drug–receptor/protein-ligand interactions32 and help to bury methyl groups in solvent-exposed locations into the hydrophobic pocket of the protein/receptor. Hydrophobic interactions help intercalate the ligands at the receptor binding sites. Hydrogen bonds on the other hand provide directional interactions underpinning protein structure, folding, and molecular recognition.32 Vander Waals forces as well as weak hydrogen bonds observed in the current study provided further support in stabilizing protein structures between non-polar surfaces.32
Funding
This research did not receive any specific grant from funding agencies in the public, commercial, or not-for-profit sectors.
Conclusion
The potential of APLBs against diabetes mellitus type-1 has been demonstrated in this study. Potential basis by which APLB elicited this activity was elucidated computationally and was shown to involve 25 overlapping genes (OGEs) of which in-depth analysis revealed SCD and PPARalpha as core targets of APLBs. This provides a prospective foundation for consideration of this medicinal plant in the fight against type-1 diabetes conditions. It is noteworthy that this study provided insight into the in vivo anti-diabetes type-1 activity of APLBs, while also computationally providing a basis for this observed effect, future studies may provide additional quantification methods such as HPLC, HPTLC, LCMS etc. in standardizing APLBs as well as exploring robust experimental validation of gene expression data analysis.
Novelty
Our study shed more light on the in vivo activities of APLBs against diabetes mellitus type-1. It expanded our current knowledge on the basis by which this activity is elicited.
Authors’ Contributions
OOT, OMO: Conceptualized and analyzed the data. FOA, POA, DVD, OTF, JEA, EOJ, SOA, MAA: methodology, investigation, resources, project administration. OOT, OMO, FOA, POA, DVD: database and literature search, writing; OOT, OMO, OTF, JEA, EOJ, SOA, MAA: Interpretation of results, software, editing and proofreading. All authors have critically reviewed and approved the final draft and are responsible for the content and similarity index of the manuscript.
Ethical Approval
Animal handling and care followed the European Commission Directive 86/609/EEC for animal experiments.
Acknowledgement
We would like to appreciate Mr. Odedele from Accurate Medical Diagnostics and Mr. Rahman Samson from SOAR Research Laboratory for their advice and timely technical support during the course of this research work.
Conflict of Interest
The authors declare no conflict of interest regarding this publication.
References
- Federation ID. IDF Diabetes Atlas, tenth. International Diabetes. 2021.
- Nanu R, Raghuveer I, Chitme HR, Chandra R. Antidiabetic activity of Nyctanthes arbortristis. Pharmacogn. Mag. 2008;4(16):335-340.
- Bhakta S, Das SK. The medicinal values of Abrus precatorius: a review study. J Adv Biotechnol Exp Ther. 2020;3(2):84-91. [CrossRef]
- Boye A, Acheampong DO, Gyamerah EO, Asiamah EA, Addo JK, Mensah DA, Brah AS, Ayiku PJ. Glucose lowering and pancreato-protective effects of Abrus precatorius (L.) leaf extract in normoglycemic and STZ/Nicotinamide–Induced diabetic rats. J. Ethnopharmacol. 2020;258:112918.
- Lai X, Wang X, Hu Y, Su S, Li W, Li S. Network pharmacology and traditional medicine. Front. Pharmacol. 2020:1194. [CrossRef]
- Gaddala B, Nataru S. Synthesis, characterization and evaluation of silver nanoparticles through leaves of Abrus precatorius L.: an important medicinal plant. Appl. Nanosci. 2015:99-104. [CrossRef]
- Boye A, Barku VY, Acheampong DO, Ofori EG. Abrus precatorius Leaf Extract Reverses Alloxan/Nicotinamide-Induced Diabetes Mellitus in Rats through Hormonal (Insulin, GLP-1, and Glucagon) and Enzymatic (α-Amylase/α-Glucosidase) Modulation. Biomed Res. Int.. 2021. [CrossRef]
- Pokharkar R, Saraswat R, Bhavare V, Kanawade M. GCMS studies of Abrus precatorius. Pharmacology Online. 2011;2:1178-1189.
- Louhimies S. Directive 86/609/EEC on the protection of animals used for experimental and other scientific purposes. Altern Lab Anim. 2002;30(2_suppl):217-219.
- Ogbuehi IH, Ebong OO, Obianime AW. Oral acute toxicity (LD50) study of different solvent extracts of Abrus precatorius Linn leaves in wistar rats. Eur. J. Exp. Biol. 2015;5(1):18-25.
- Ru J, Li P, Wang J, Zhou W, Li B, Huang C, Li P, Guo Z, Tao W, Yang Y, Xu X. TCMSP: a database of systems pharmacology for drug discovery from herbal medicines. J. Cheminformatics. 2014;6:1-6. doi:10.1186/1758-2946-6-13.
- Kim S, Thiessen PA, Bolton EE, Chen J, Fu G, Gindulyte A, Han L, He J, He S, Shoemaker BA, Wang J. PubChem substance and compound databases. Nucleic Acids Res. 2016;44(D1):D1202-1213. doi:10.1093/nar/gkv951.
- Gfeller D, Grosdidier A, Wirth M, Daina A, Michielin O, Zoete V. SwissTargetPrediction: a web server for target prediction of bioactive small molecules. Nucleic Acids Res. 2014;42(W1):W32-38. [CrossRef]
- Clough E, Barrett T. The gene expression omnibus database. Statistical Genomics: Methods and Protocols. 2016:93-110.
- Safran M, Dalah I, Alexander J, Rosen N, Iny Stein T, Shmoish M, Nativ N, Bahir I, Doniger T, Krug H, Sirota-Madi A. GeneCards Version 3: the human gene integrator. Database. 2010. [CrossRef]
- Chen BZ, Yu SL, Singh S, Kao LP, Tsai ZY, Yang PC, Chen BH, Shoei-Lung Li S. Identification of microRNAs expressed highly in pancreatic islet-like cell clusters differentiated from human embryonic stem cells. Cell Biol. Int.. 2011;35(1):29-37. [CrossRef]
- Irizarry RA, Hobbs B, Collin F, Beazer-Barclay YD, Antonellis KJ, Scherf U, Speed TP. Exploration, normalization, and summaries of high density oligonucleotide array probe level data. Biostatistics. 2003;4(2):249-264.
- Gautier L, Cope L, Bolstad BM, Irizarry RA. affy—analysis of Affymetrix GeneChip data at the probe level. Bioinformatics. 2004;20(3):307-315.
- Ritchie ME, Silver J, Oshlack A, Holmes M, Diyagama D, Holloway A, Smyth GK. A comparison of background correction methods for two-colour microarrays. Bioinformatics. 2007;23(20):2700-2707. [CrossRef]
- Gentleman RC, Carey VJ, Bates DM, Bolstad B, Dettling M, Dudoit S, Ellis B, Gautier L, Ge Y, Gentry J, Hornik K. Bioconductor: open software development for computational biology and bioinformatics. Genome Biol. 2004;5(10):1-6. [CrossRef]
- Shannon P, Markiel A, Ozier O, Baliga NS, Wang JT, Ramage D, Amin N, Schwikowski B, Ideker T. Cytoscape: a software environment for integrated models of biomolecular interaction networks. Genome Res. 2003;13(11):2498-2504. [CrossRef]
- Xie Z, Bailey A, Kuleshov MV, Clarke DJ, Evangelista JE, Jenkins SL, Lachmann A, Wojciechowicz ML, Kropiwnicki E, Jagodnik KM, Jeon M. Gene set knowledge discovery with Enrichr. Curr. Protoc. 2021;1(3):e90. [CrossRef]
- Supek F, Bošnjak M, Škunca N, Šmuc T. REVIGO summarizes and visualizes long lists of gene ontology terms. PloS one. 2011;6(7):e21800. [CrossRef]
- Subramanian A, Tamayo P, Mootha VK, Mukherjee S, Ebert BL, Gillette MA, Paulovich A, Pomeroy SL, Golub TR, Lander ES, Mesirov JP. Gene set enrichment analysis: a knowledge-based approach for interpreting genome-wide expression profiles. Proc. Natl. Acad. Sci. U.S.A.. 2005;102(43):15545-15550. [CrossRef]
- Mootha VK, Lindgren CM, Eriksson KF, Subramanian A, Sihag S, Lehar J, Puigserver P, Carlsson E, Ridderstråle M, Laurila E, Houstis N. PGC-1α-responsive genes involved in oxidative phosphorylation are coordinately downregulated in human diabetes. Nat. Genet. 2003;34(3):267-273. [CrossRef]
- Studio D. Discovery studio. Accelrys [2.1]. 2008.
- Dallakyan S, Olson AJ. Small-Molecule Library Screening by Docking with PyRx. In: Hempel J, Williams C, Hong C, eds. Chemical Biology. Methods in Molecular Biology. New York, NY:Humana Press; 2015:243-250.
- Uroko RI, Sangodare RS, Muhammad KH, Asadu CL. Effect of methanol extract of Abrus precatorius leaves on male Wistar albino rats induced liver damage using carbon tetrachloride. J Biol Sci. 2015;15(3):116-123.
- Khoo J, Hagemeyer CE, Henstridge DC, Kumble S, Wang TY, Xu R, Gani L, King T, Soh SB, Puar T, Au V. Effects of water stably-enriched with oxygen as a novel method of tissue oxygenation on mitochondrial function, and as adjuvant therapy for type 2 diabetes in a randomized placebo-controlled trial. Plos one. 2021;16(7):e0254619. [CrossRef]
- Ortega-Prieto P, Postic C. Carbohydrate sensing through the transcription factor ChREBP. Front. Genet. 2019;10:472. [CrossRef]
- Brenner R. Antagonism between Type 1 and Type 2 diabetes in unsaturated fatty acid biosynthesis. Future Lipidol. 2006;1(5):631-40. [CrossRef]
- de Freitas RF, Schapira M. A systematic analysis of atomic protein–ligand interactions in the PDB. Medchemcomm. 2017;8(10):1970-1981. [CrossRef]
Figure 2.
Photomicrographs of kidney sections stained by Haematoxylin and Eosin for Control (A), Model (B), Glibenclamide (C), APMLE 100mg/kg, APMLE 200mg/kg and APMLE 400mg/kg.
Figure 2.
Photomicrographs of kidney sections stained by Haematoxylin and Eosin for Control (A), Model (B), Glibenclamide (C), APMLE 100mg/kg, APMLE 200mg/kg and APMLE 400mg/kg.
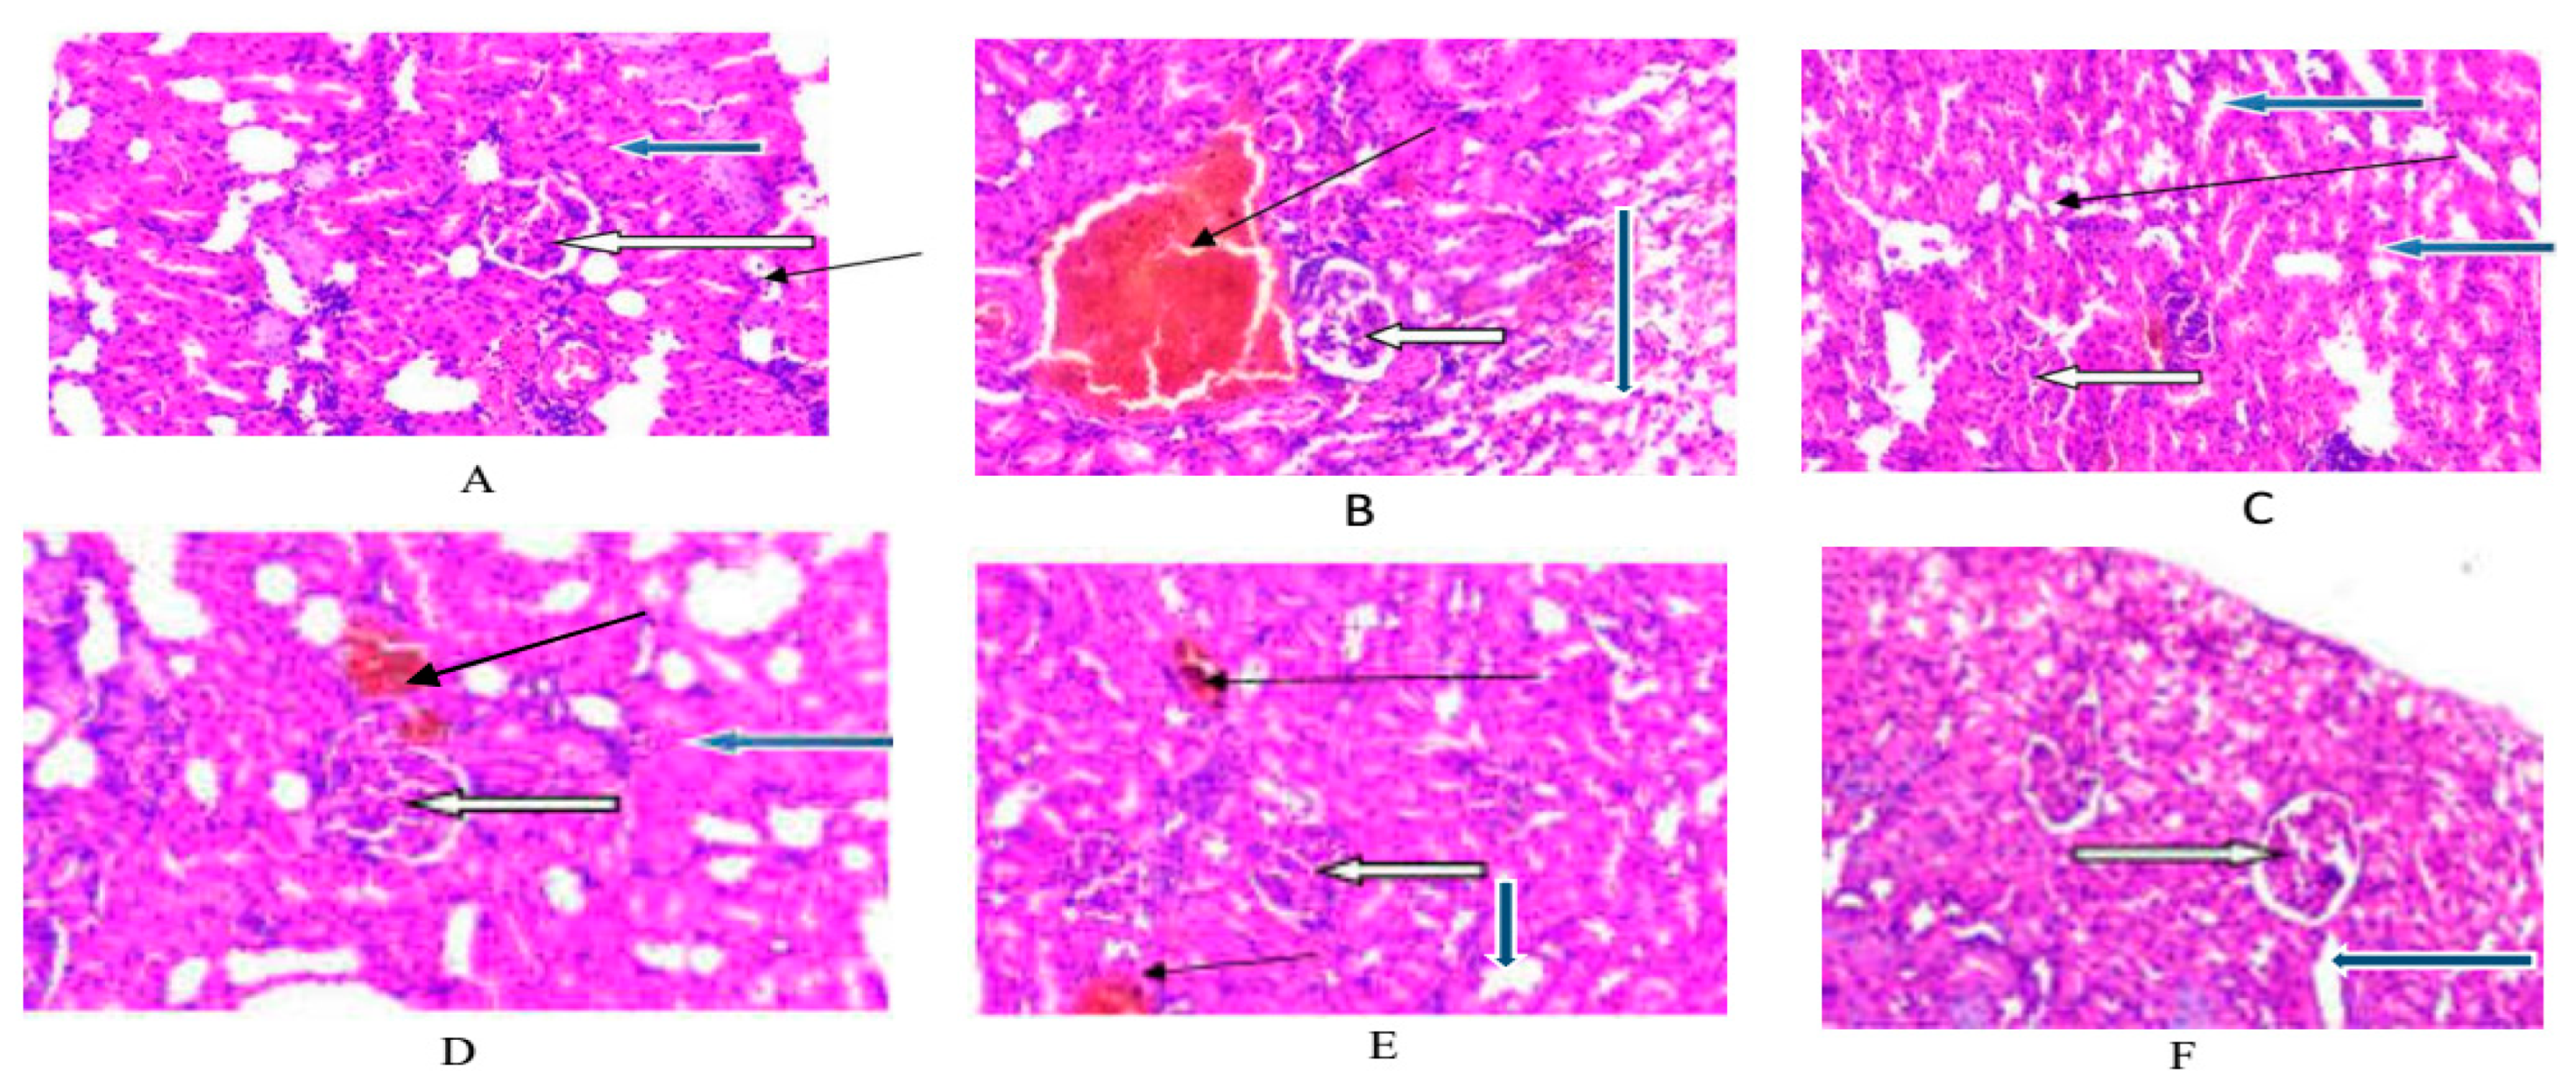
Figure 3.
Photomicrographs of kidney sections stained with Haematoxylin and Eosin for Control (A), Model (B), Glibenclamide (C), APMLE 100mg/kg, APMLE 200mg/kg and APMLE 400mg/kg.
Figure 3.
Photomicrographs of kidney sections stained with Haematoxylin and Eosin for Control (A), Model (B), Glibenclamide (C), APMLE 100mg/kg, APMLE 200mg/kg and APMLE 400mg/kg.
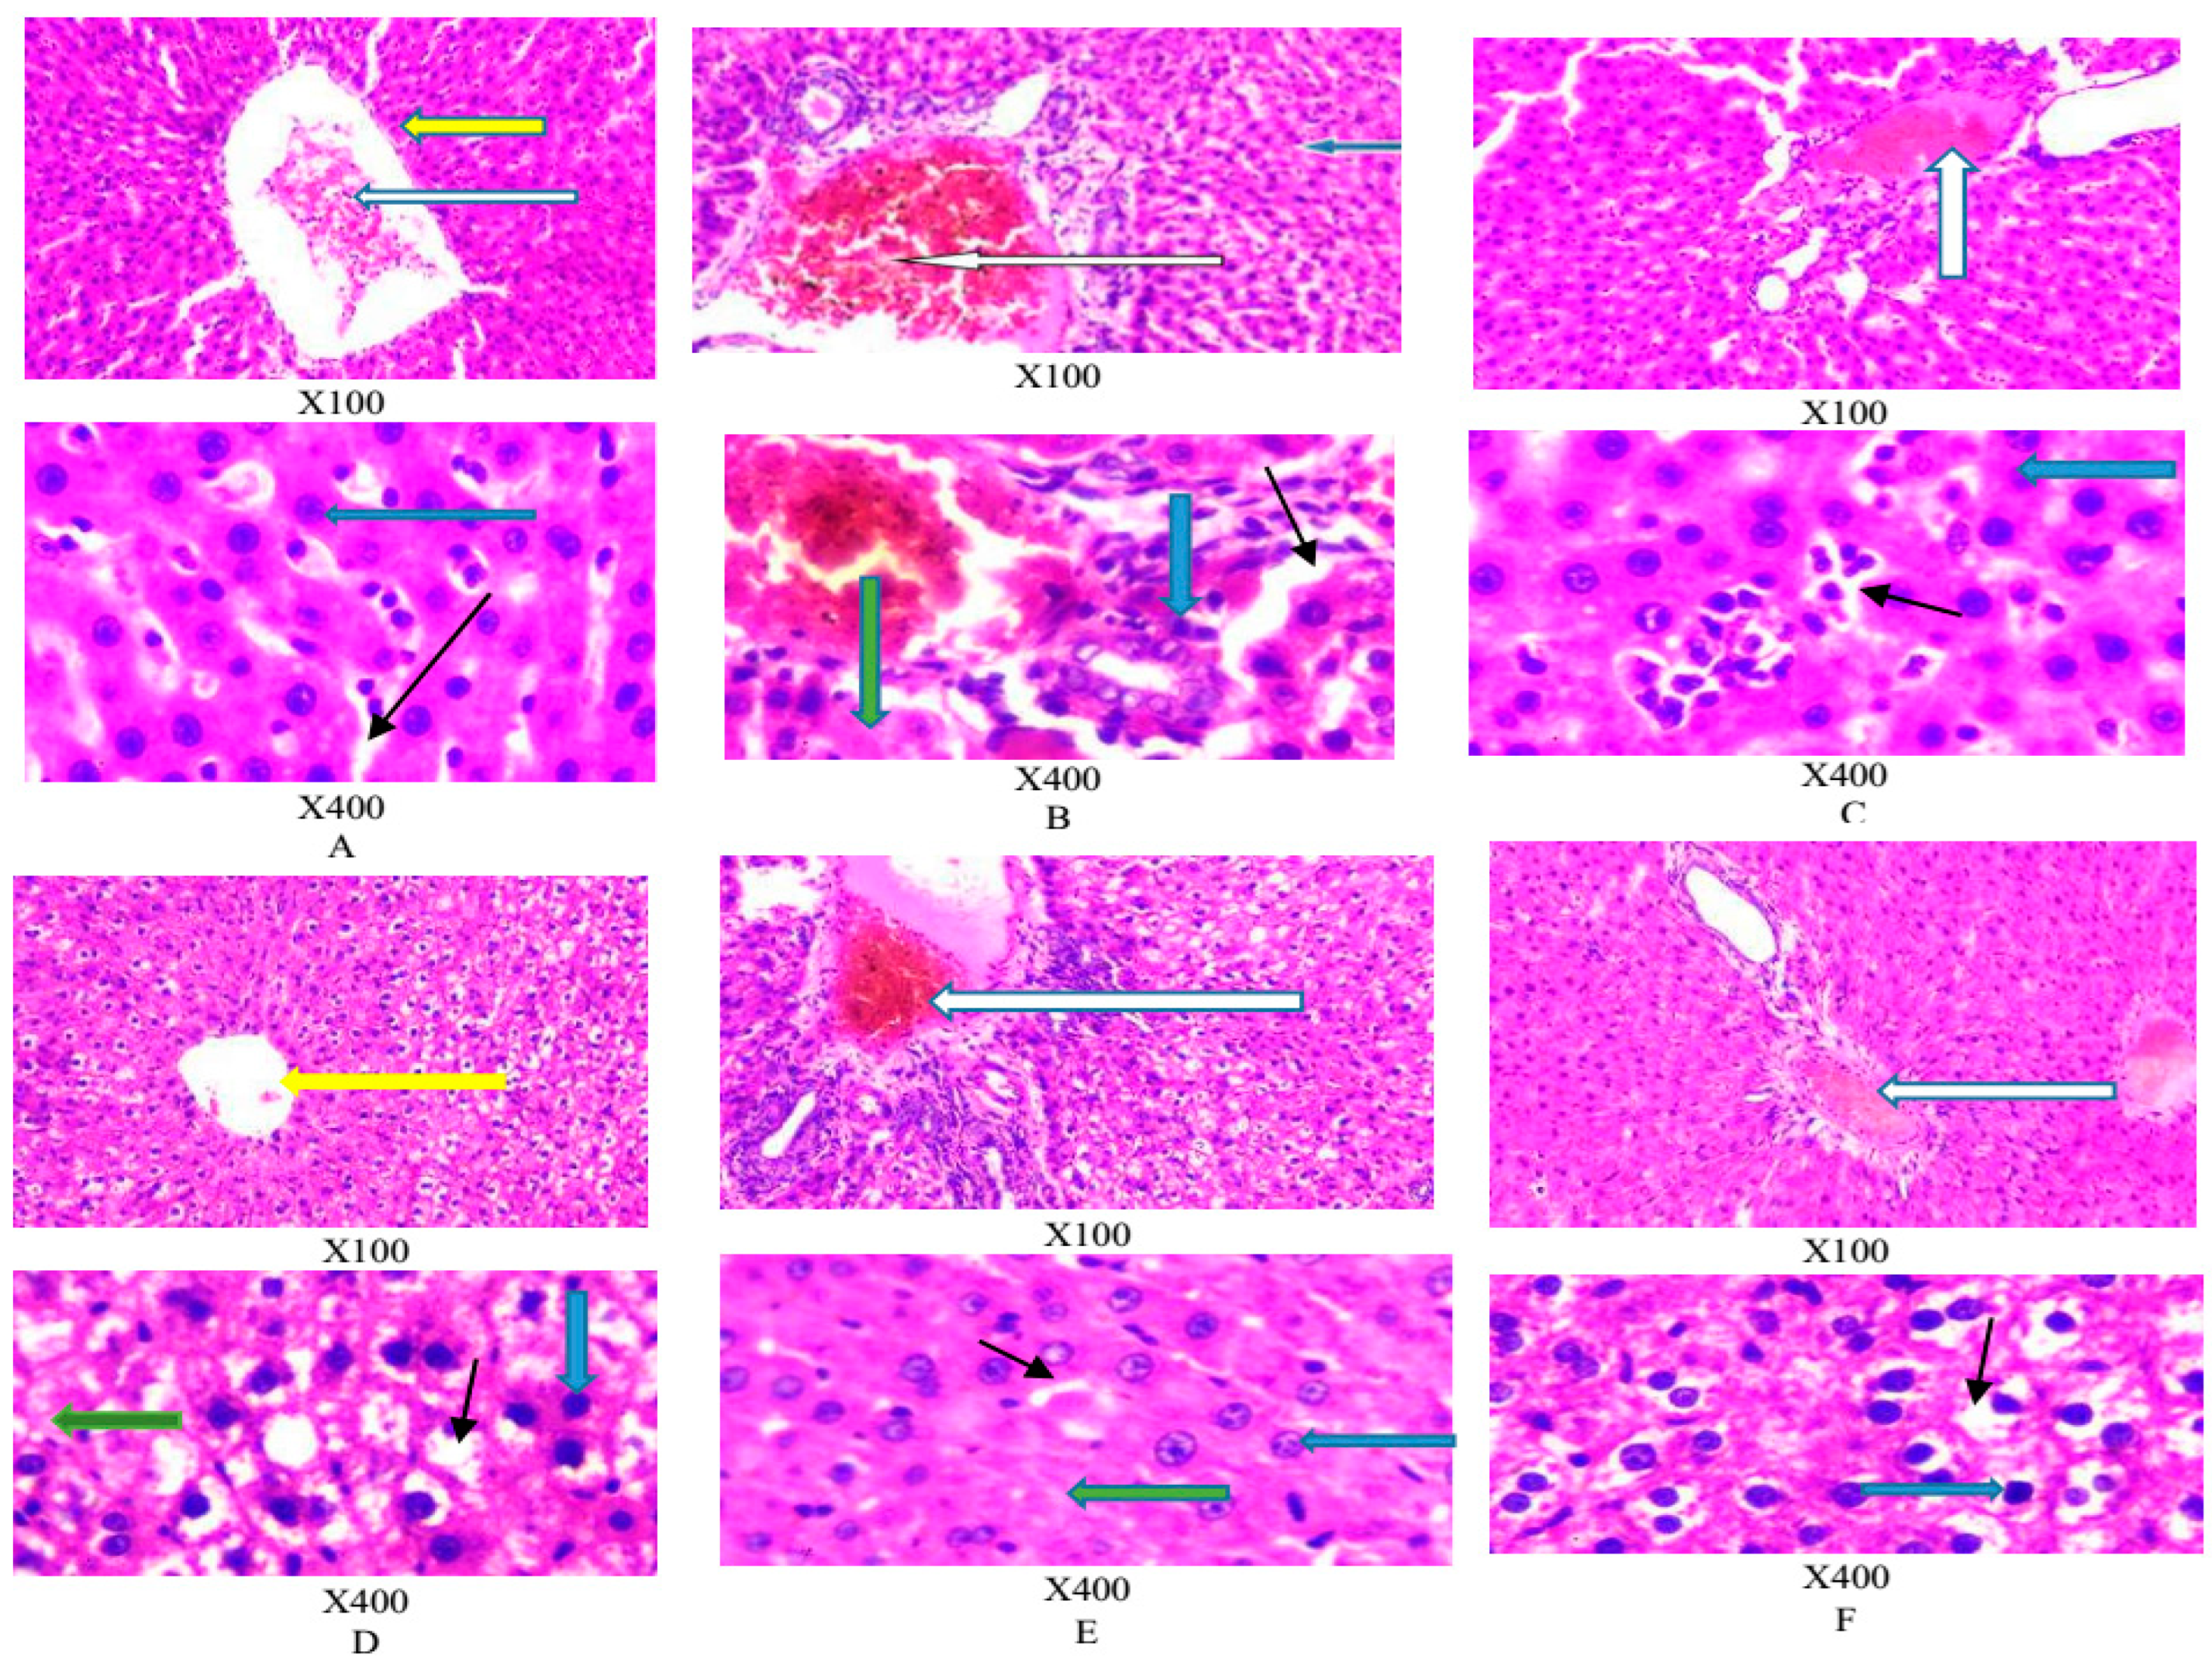
Figure 4.
Structures of A. precatorius leaf bioactives obtained after screening criteria (OB ≥ 20, DL ≥ 0.1).
Figure 4.
Structures of A. precatorius leaf bioactives obtained after screening criteria (OB ≥ 20, DL ≥ 0.1).
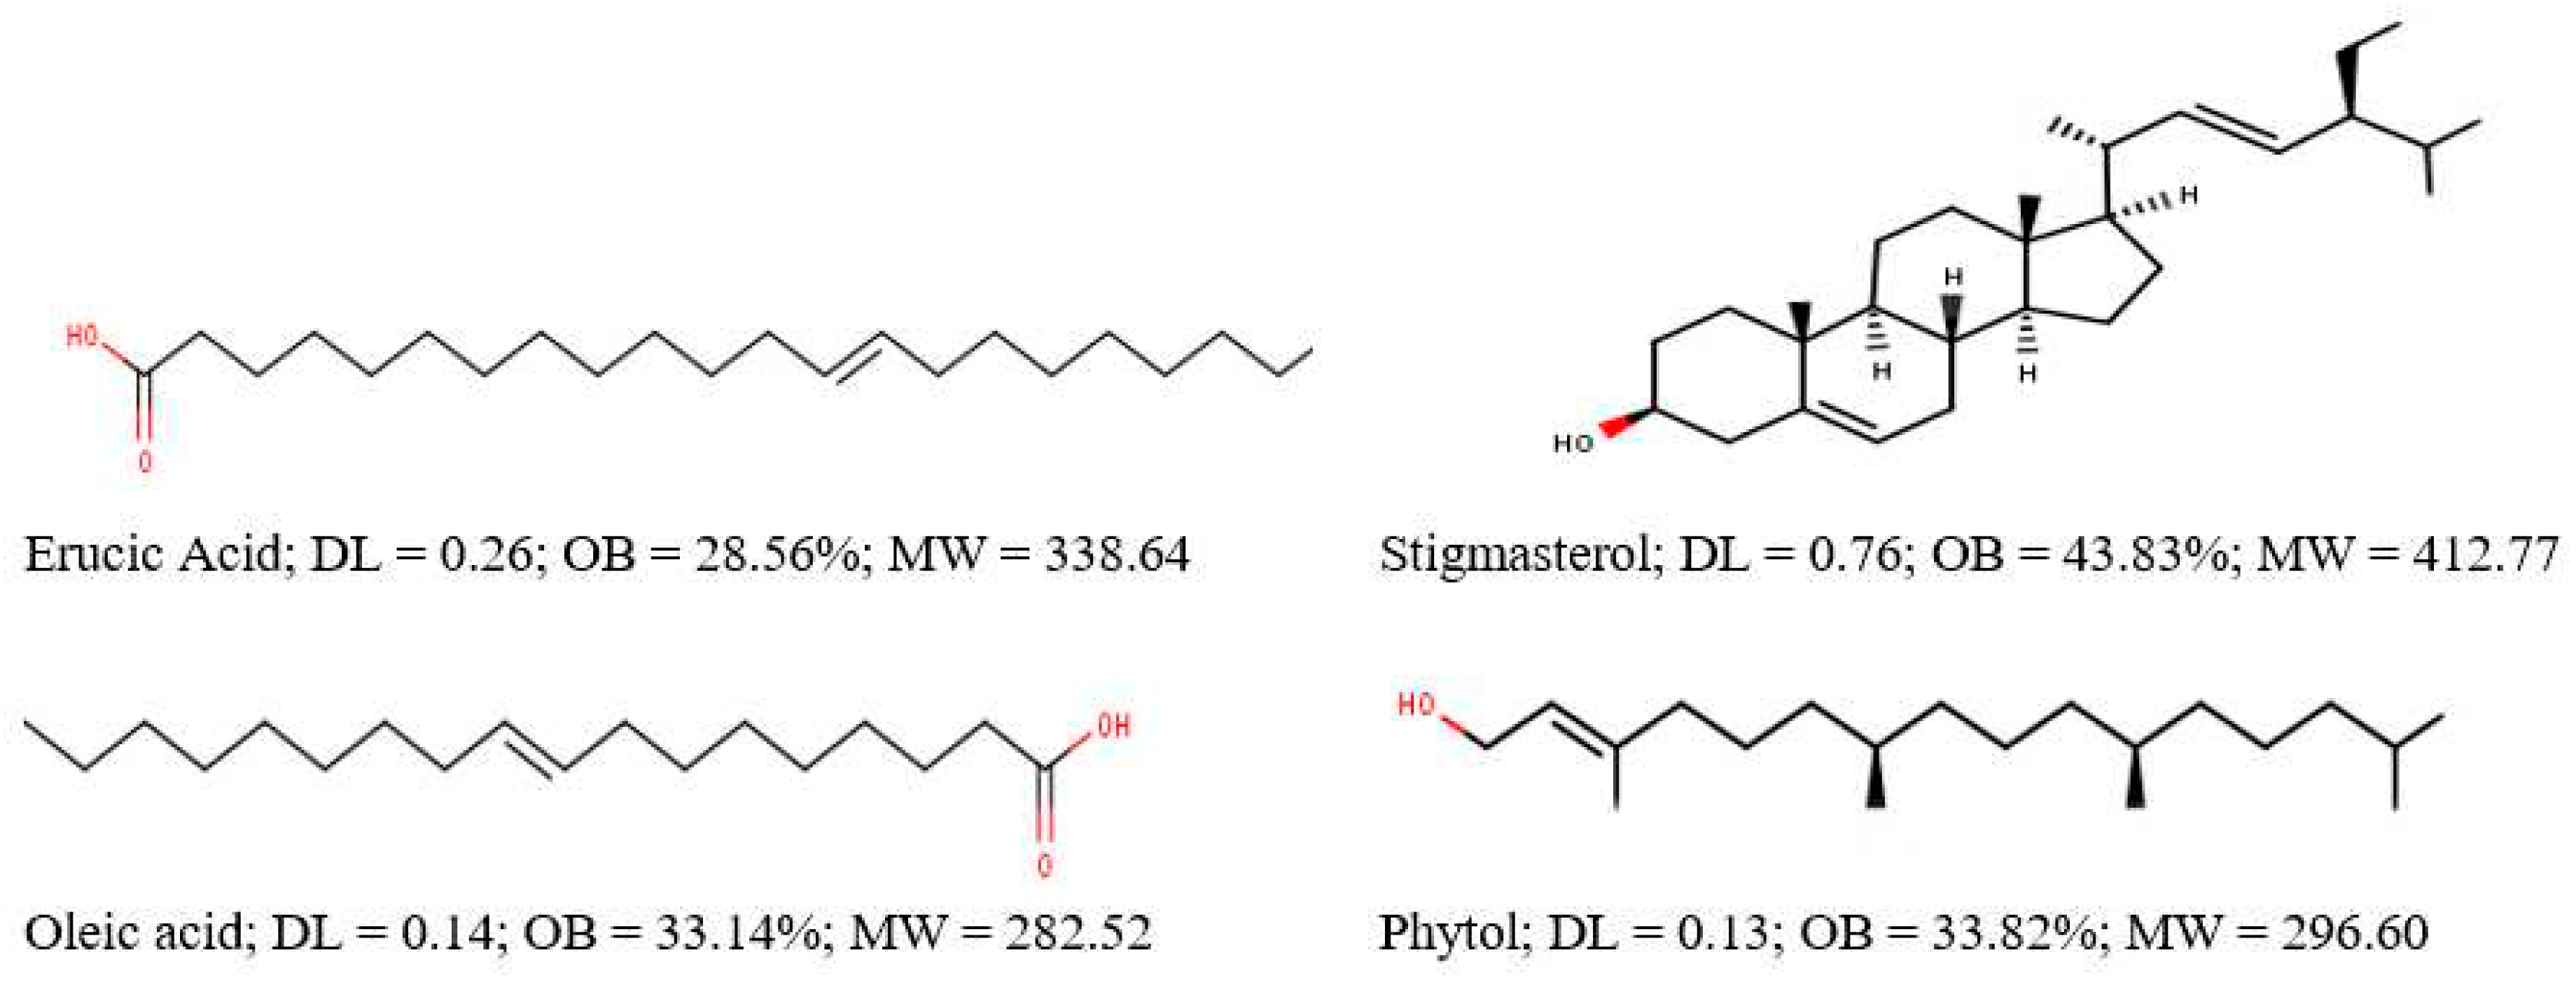
Figure 5.
PPI network of the 25 regulated A. precatorius targets. The stronger the interaction between the nodes, the thicker and deeper the color of the edge.
Figure 5.
PPI network of the 25 regulated A. precatorius targets. The stronger the interaction between the nodes, the thicker and deeper the color of the edge.

Figure 6.
Bubble plot demonstrating top enriched GO terms in biological process, cellular component, as well as molecular function on the y-axis and the combined scores of these terms (p-value ≤ 0.05 and FDR ˂ 0.05) on the x-axis.
Figure 6.
Bubble plot demonstrating top enriched GO terms in biological process, cellular component, as well as molecular function on the y-axis and the combined scores of these terms (p-value ≤ 0.05 and FDR ˂ 0.05) on the x-axis.
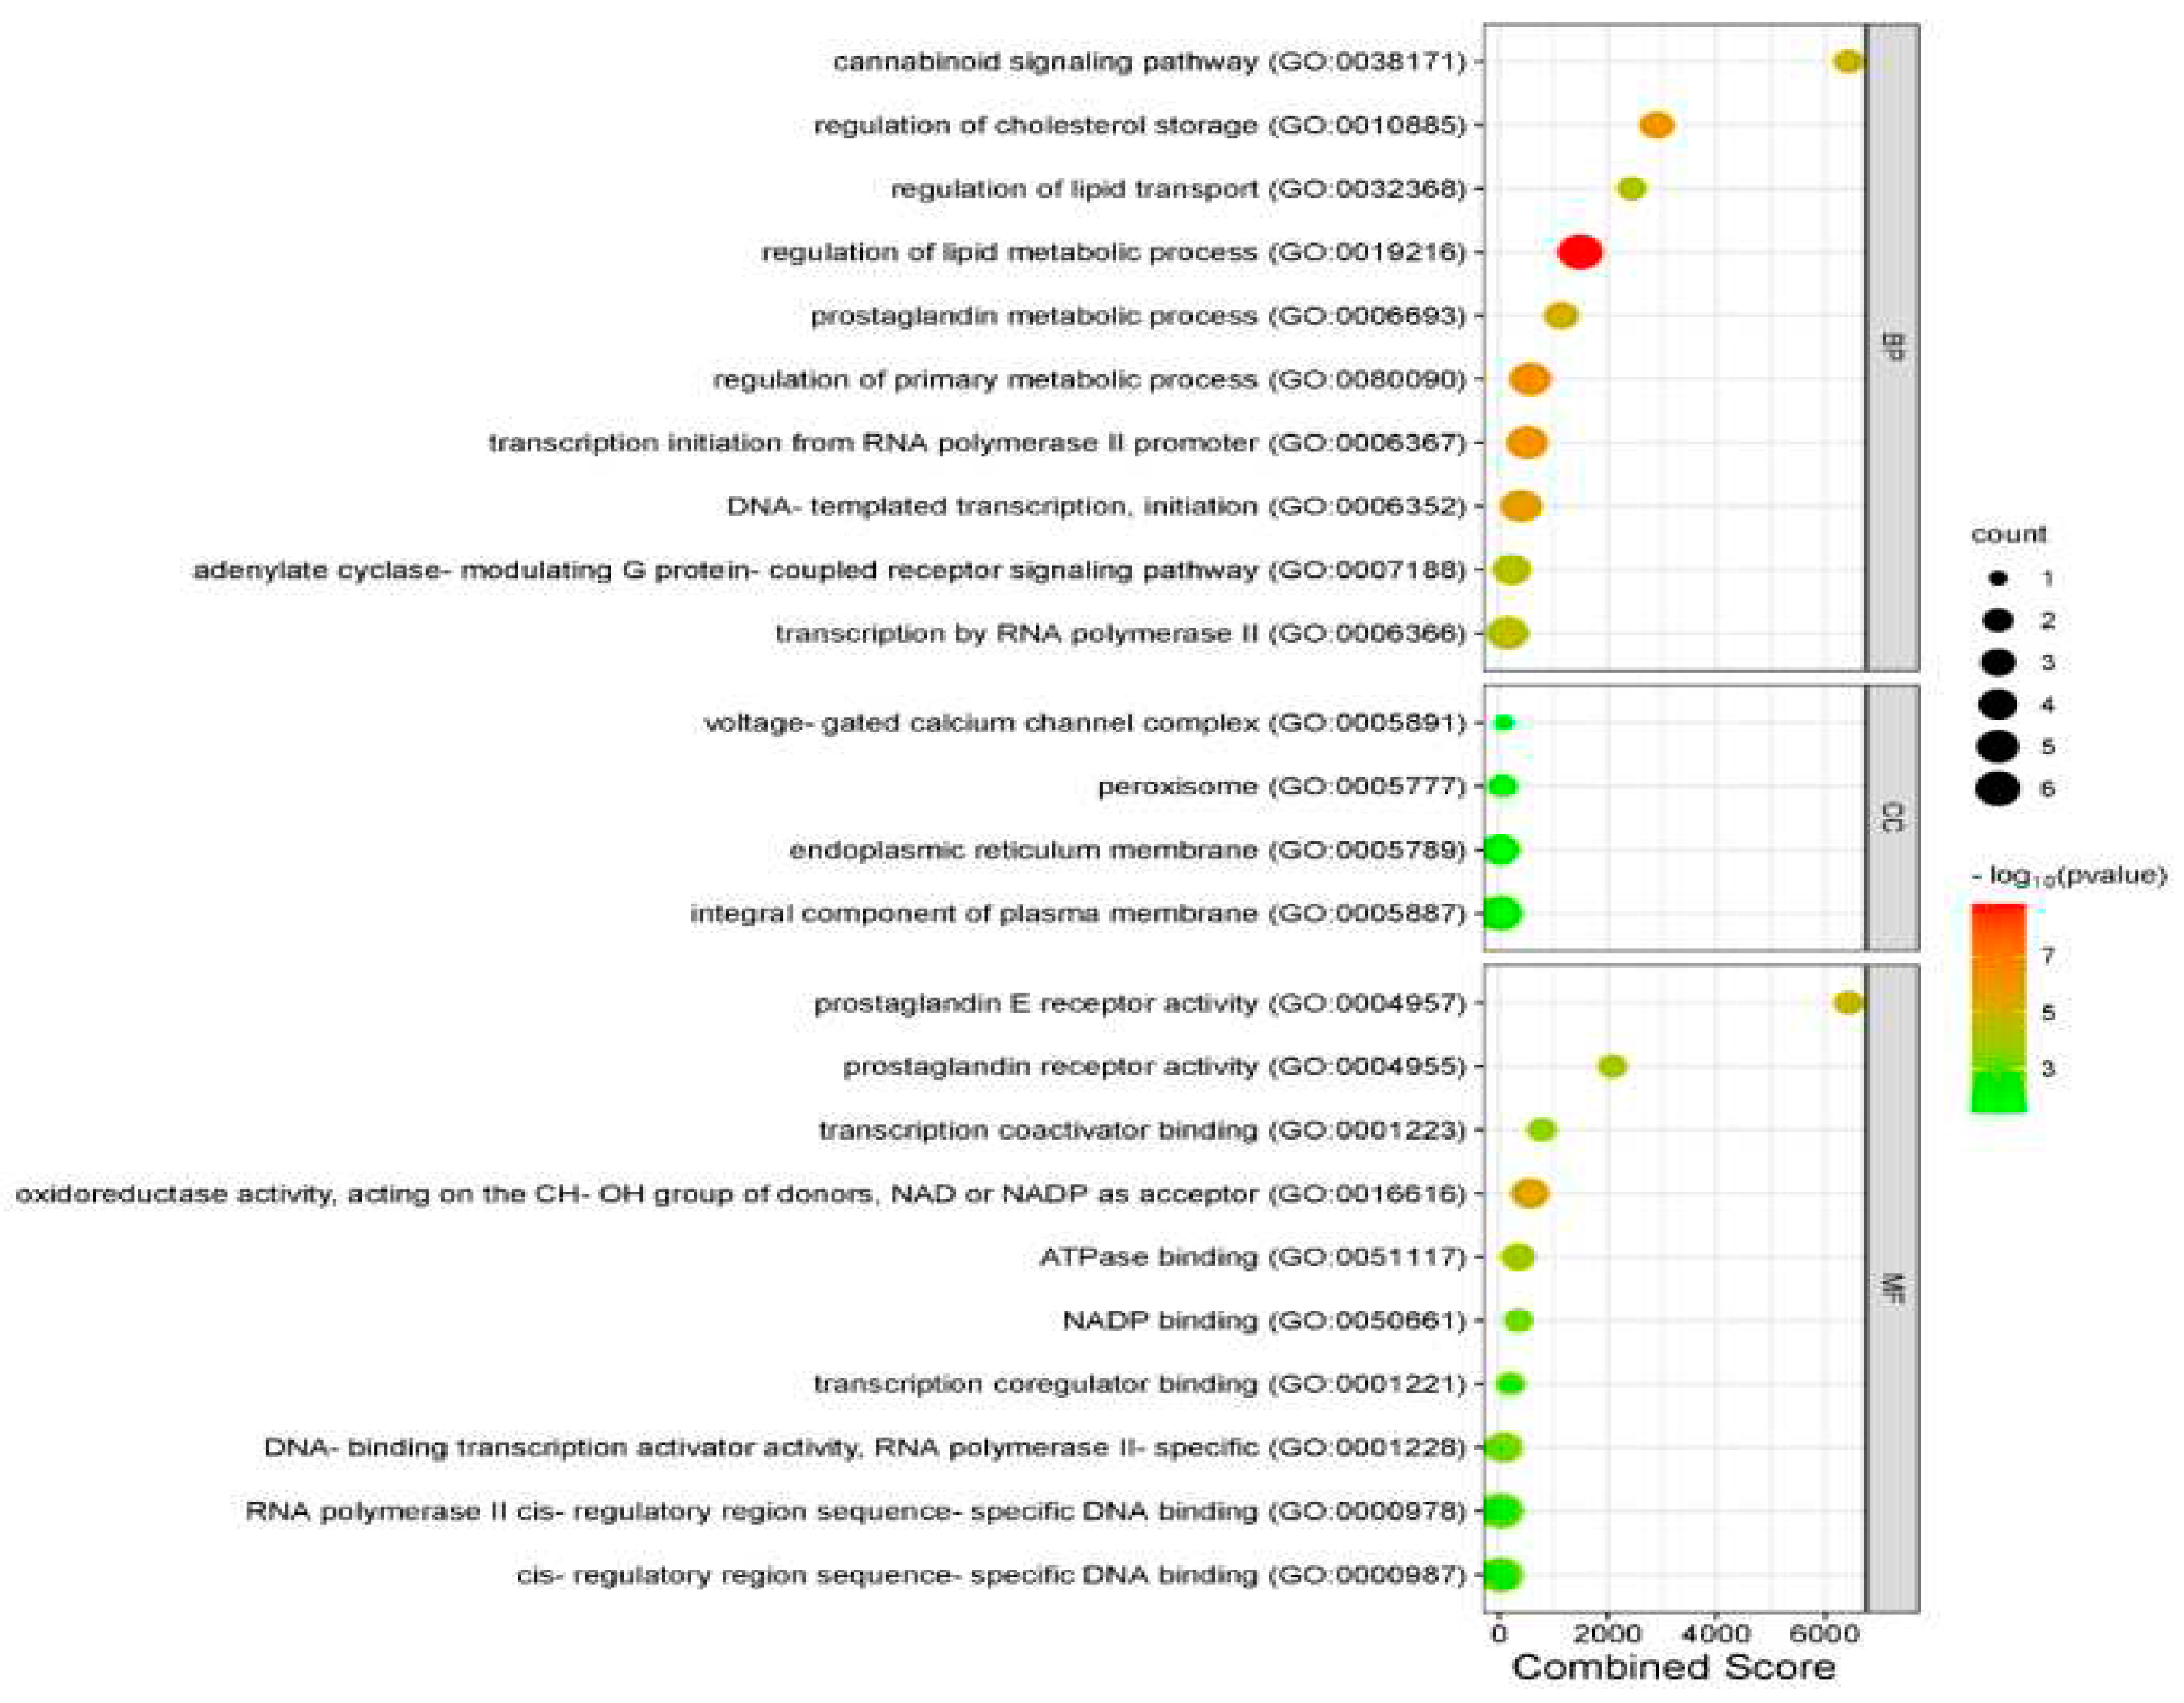
Figure 7.
Bubble plot combined with Sankey diagram demonstrating statistically significant KEGG pathways and the genes within each pathway on the y-axis and the gene ratio (p-value ≤ 0.05 and FDR ˂ 0.05) on the x-axis.
Figure 7.
Bubble plot combined with Sankey diagram demonstrating statistically significant KEGG pathways and the genes within each pathway on the y-axis and the gene ratio (p-value ≤ 0.05 and FDR ˂ 0.05) on the x-axis.
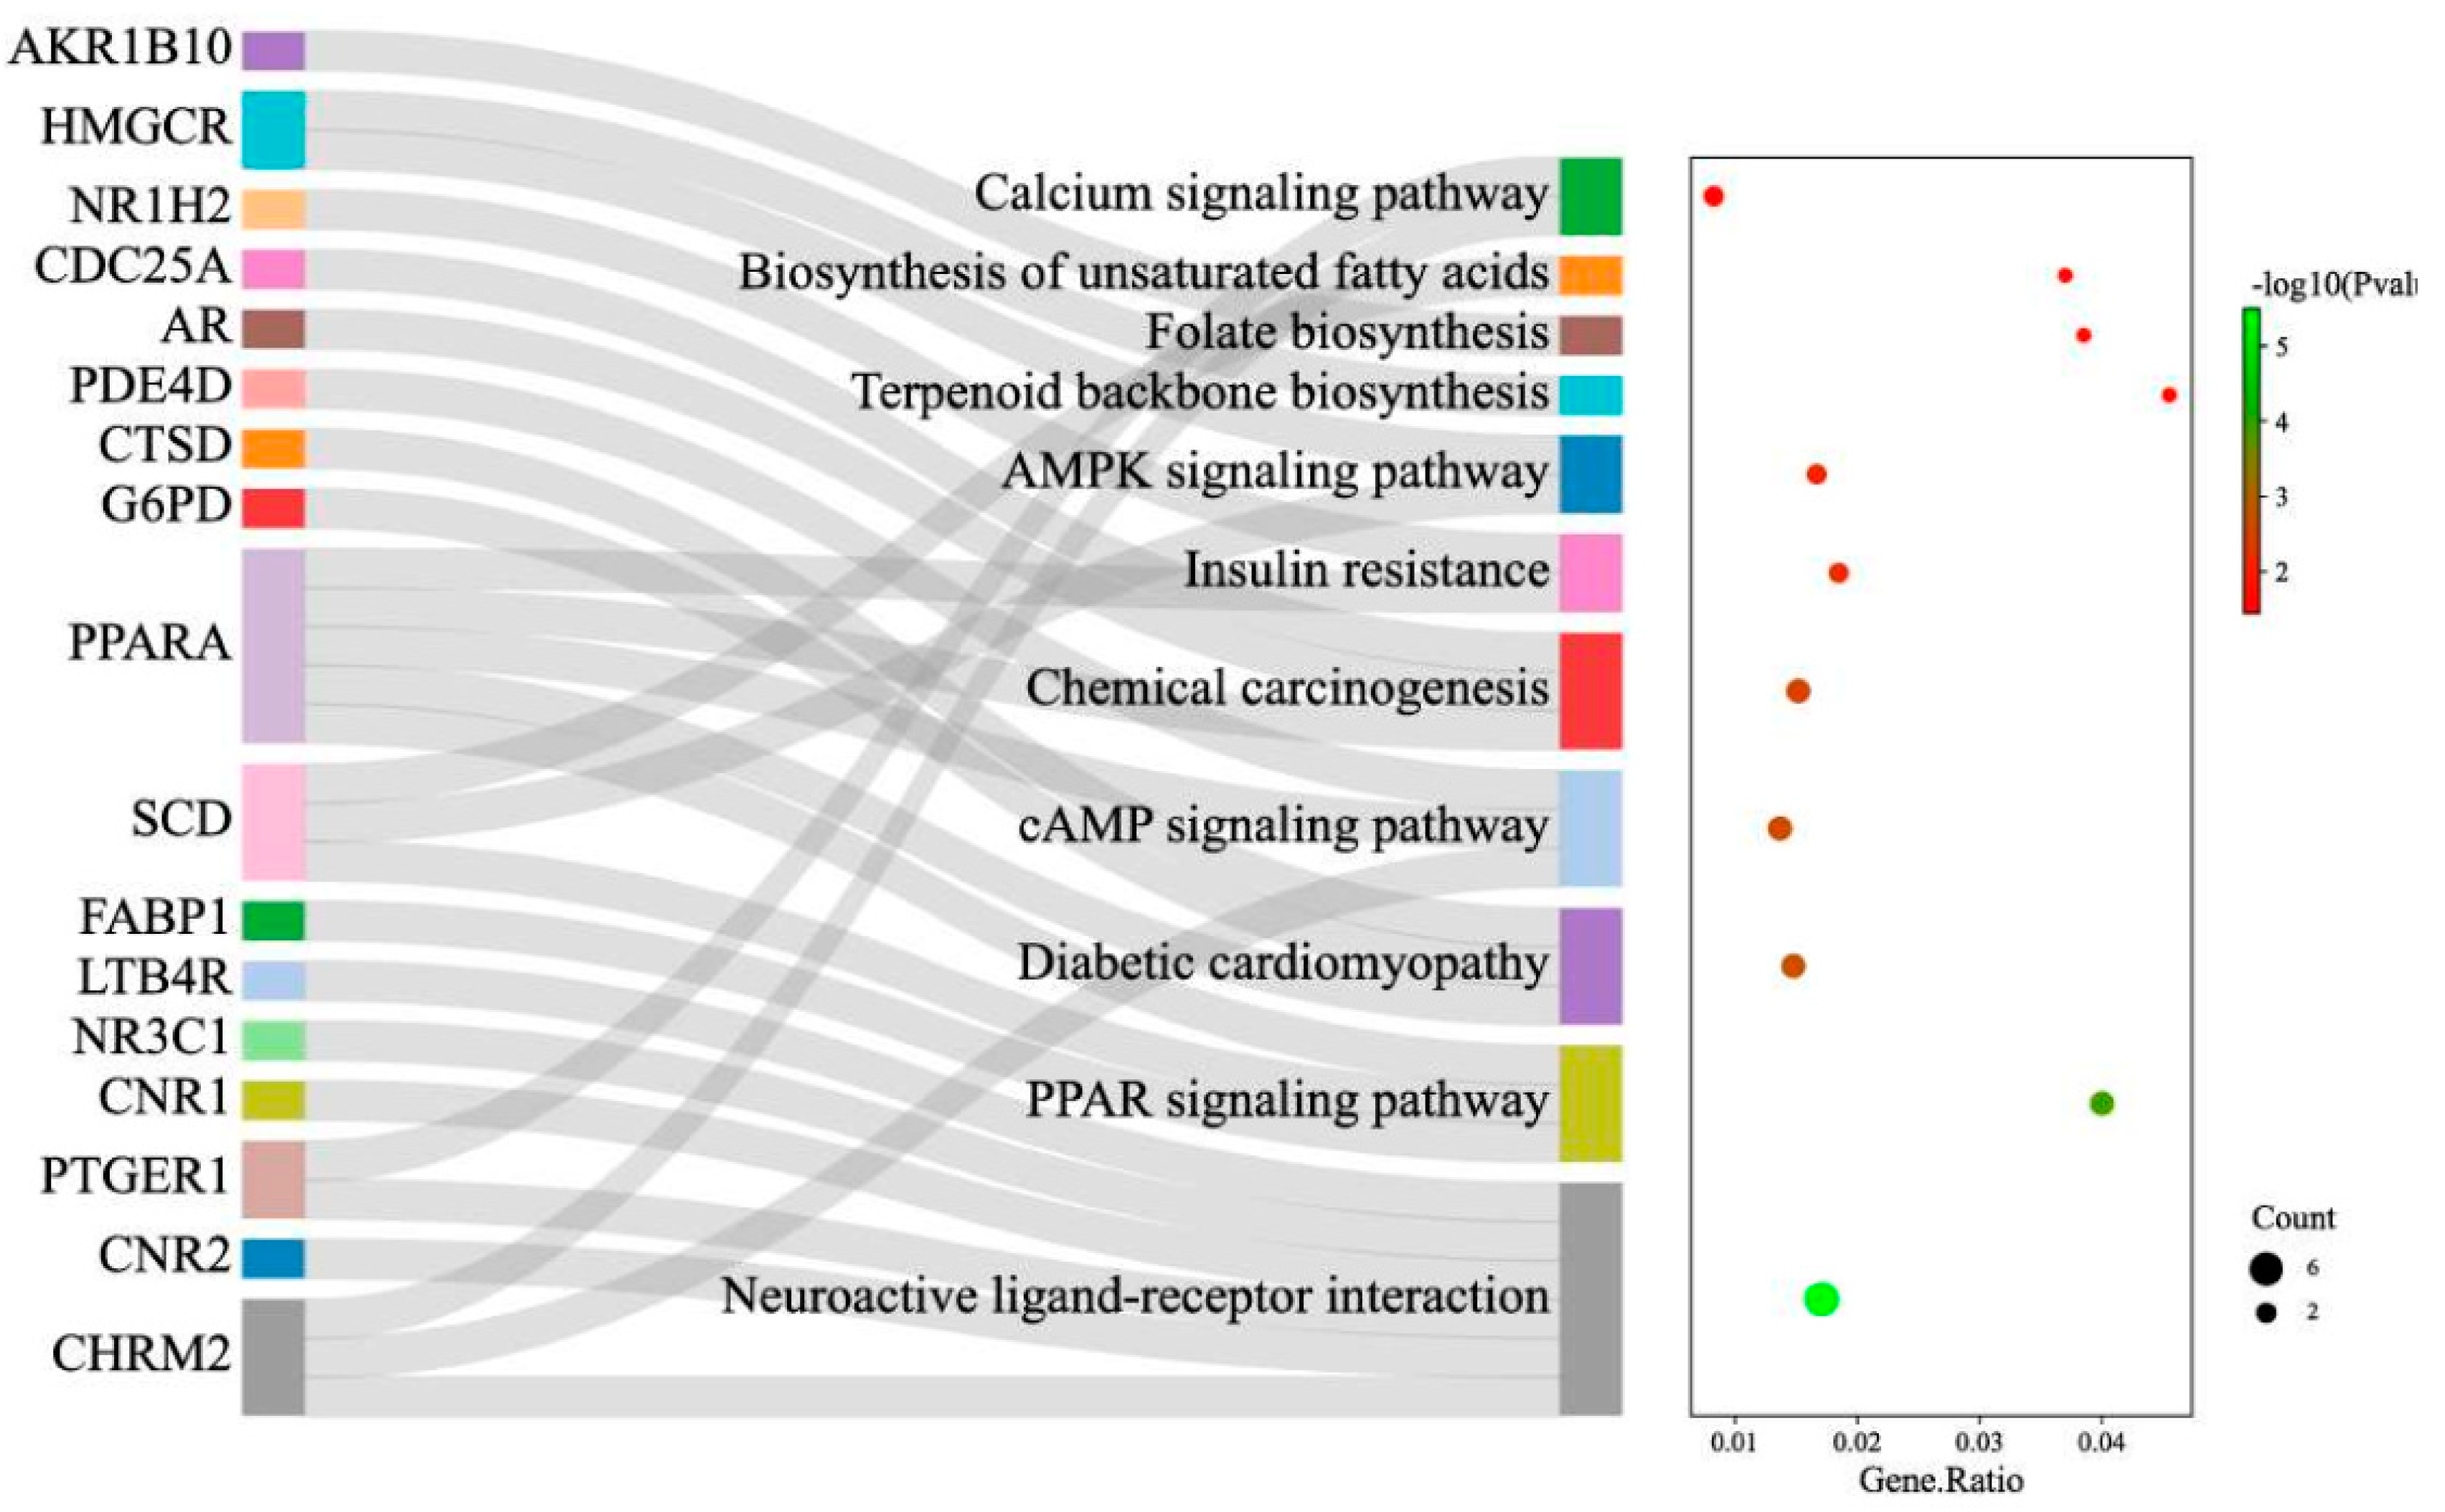
Figure 8.
Gene set enrichment analysis (GSEA) using GSE14503 showing the Hallmark Collections for which OGEs are significantly enriched (FDR < 0.25, Nominal p-value < 0.01).
Figure 8.
Gene set enrichment analysis (GSEA) using GSE14503 showing the Hallmark Collections for which OGEs are significantly enriched (FDR < 0.25, Nominal p-value < 0.01).
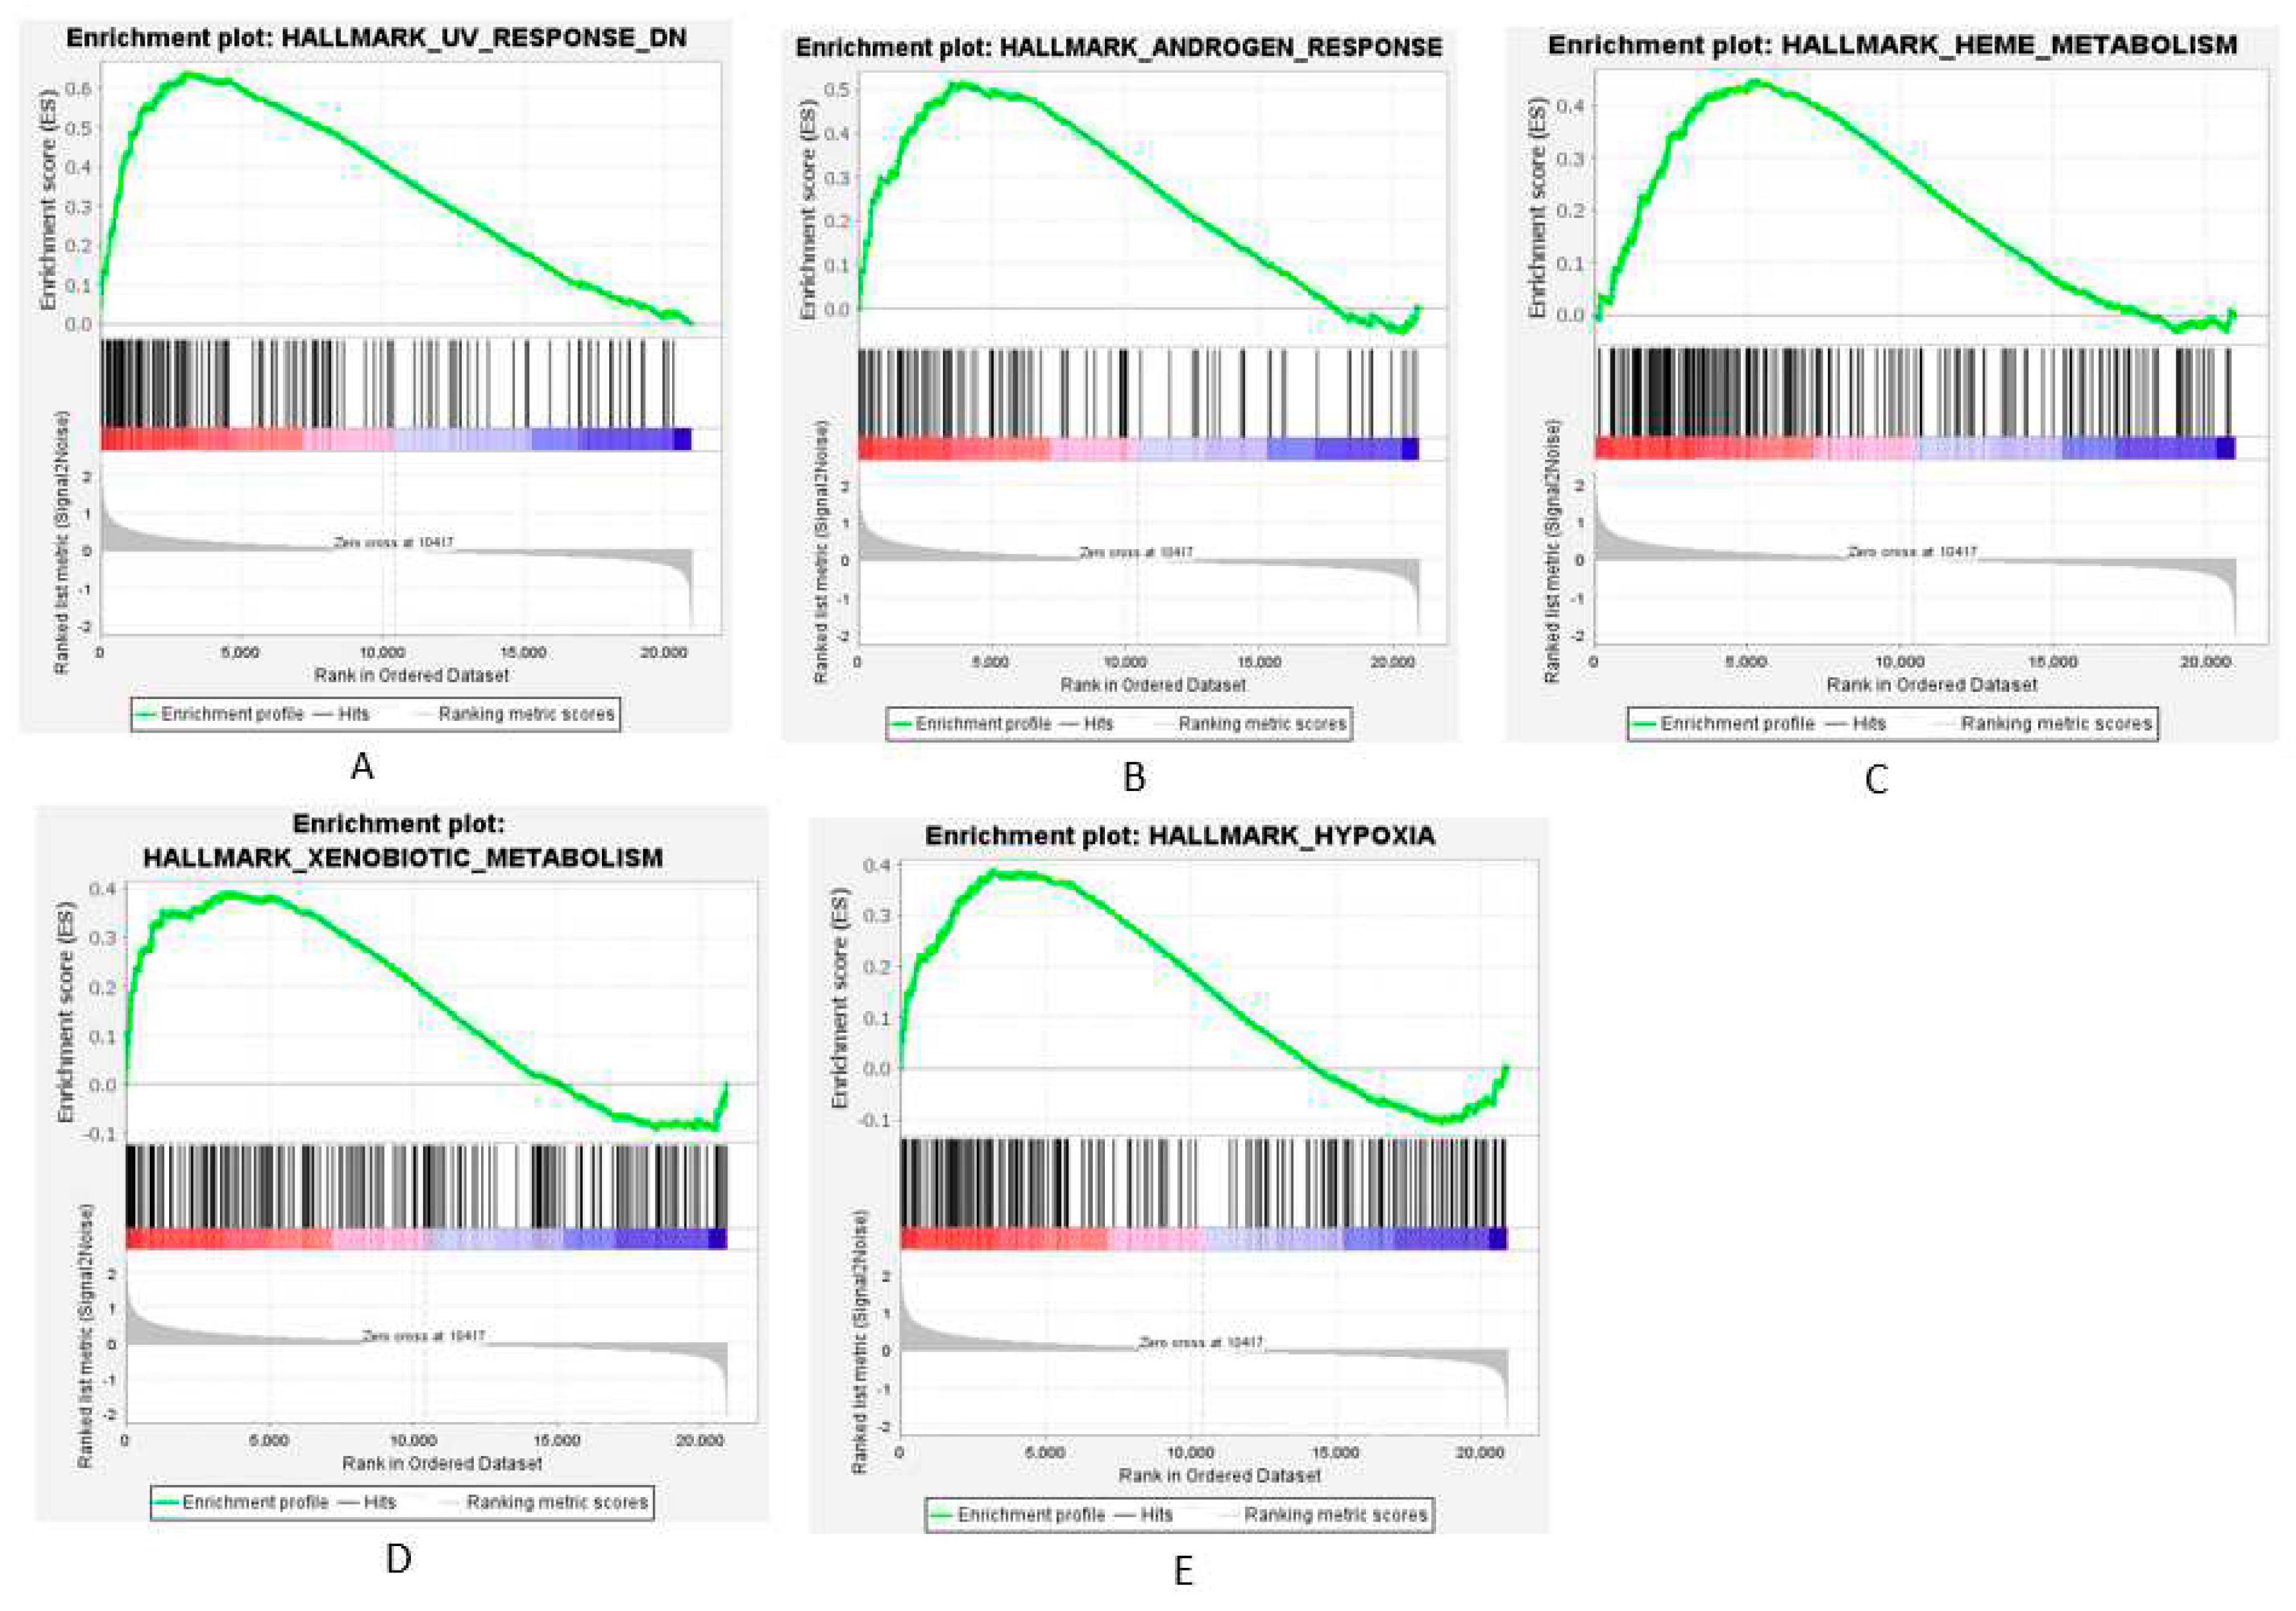
Figure 9.
Cluster classification of the preliminary PPI network. MCODE plug-in clustered the PPI network into A-C.
Figure 9.
Cluster classification of the preliminary PPI network. MCODE plug-in clustered the PPI network into A-C.
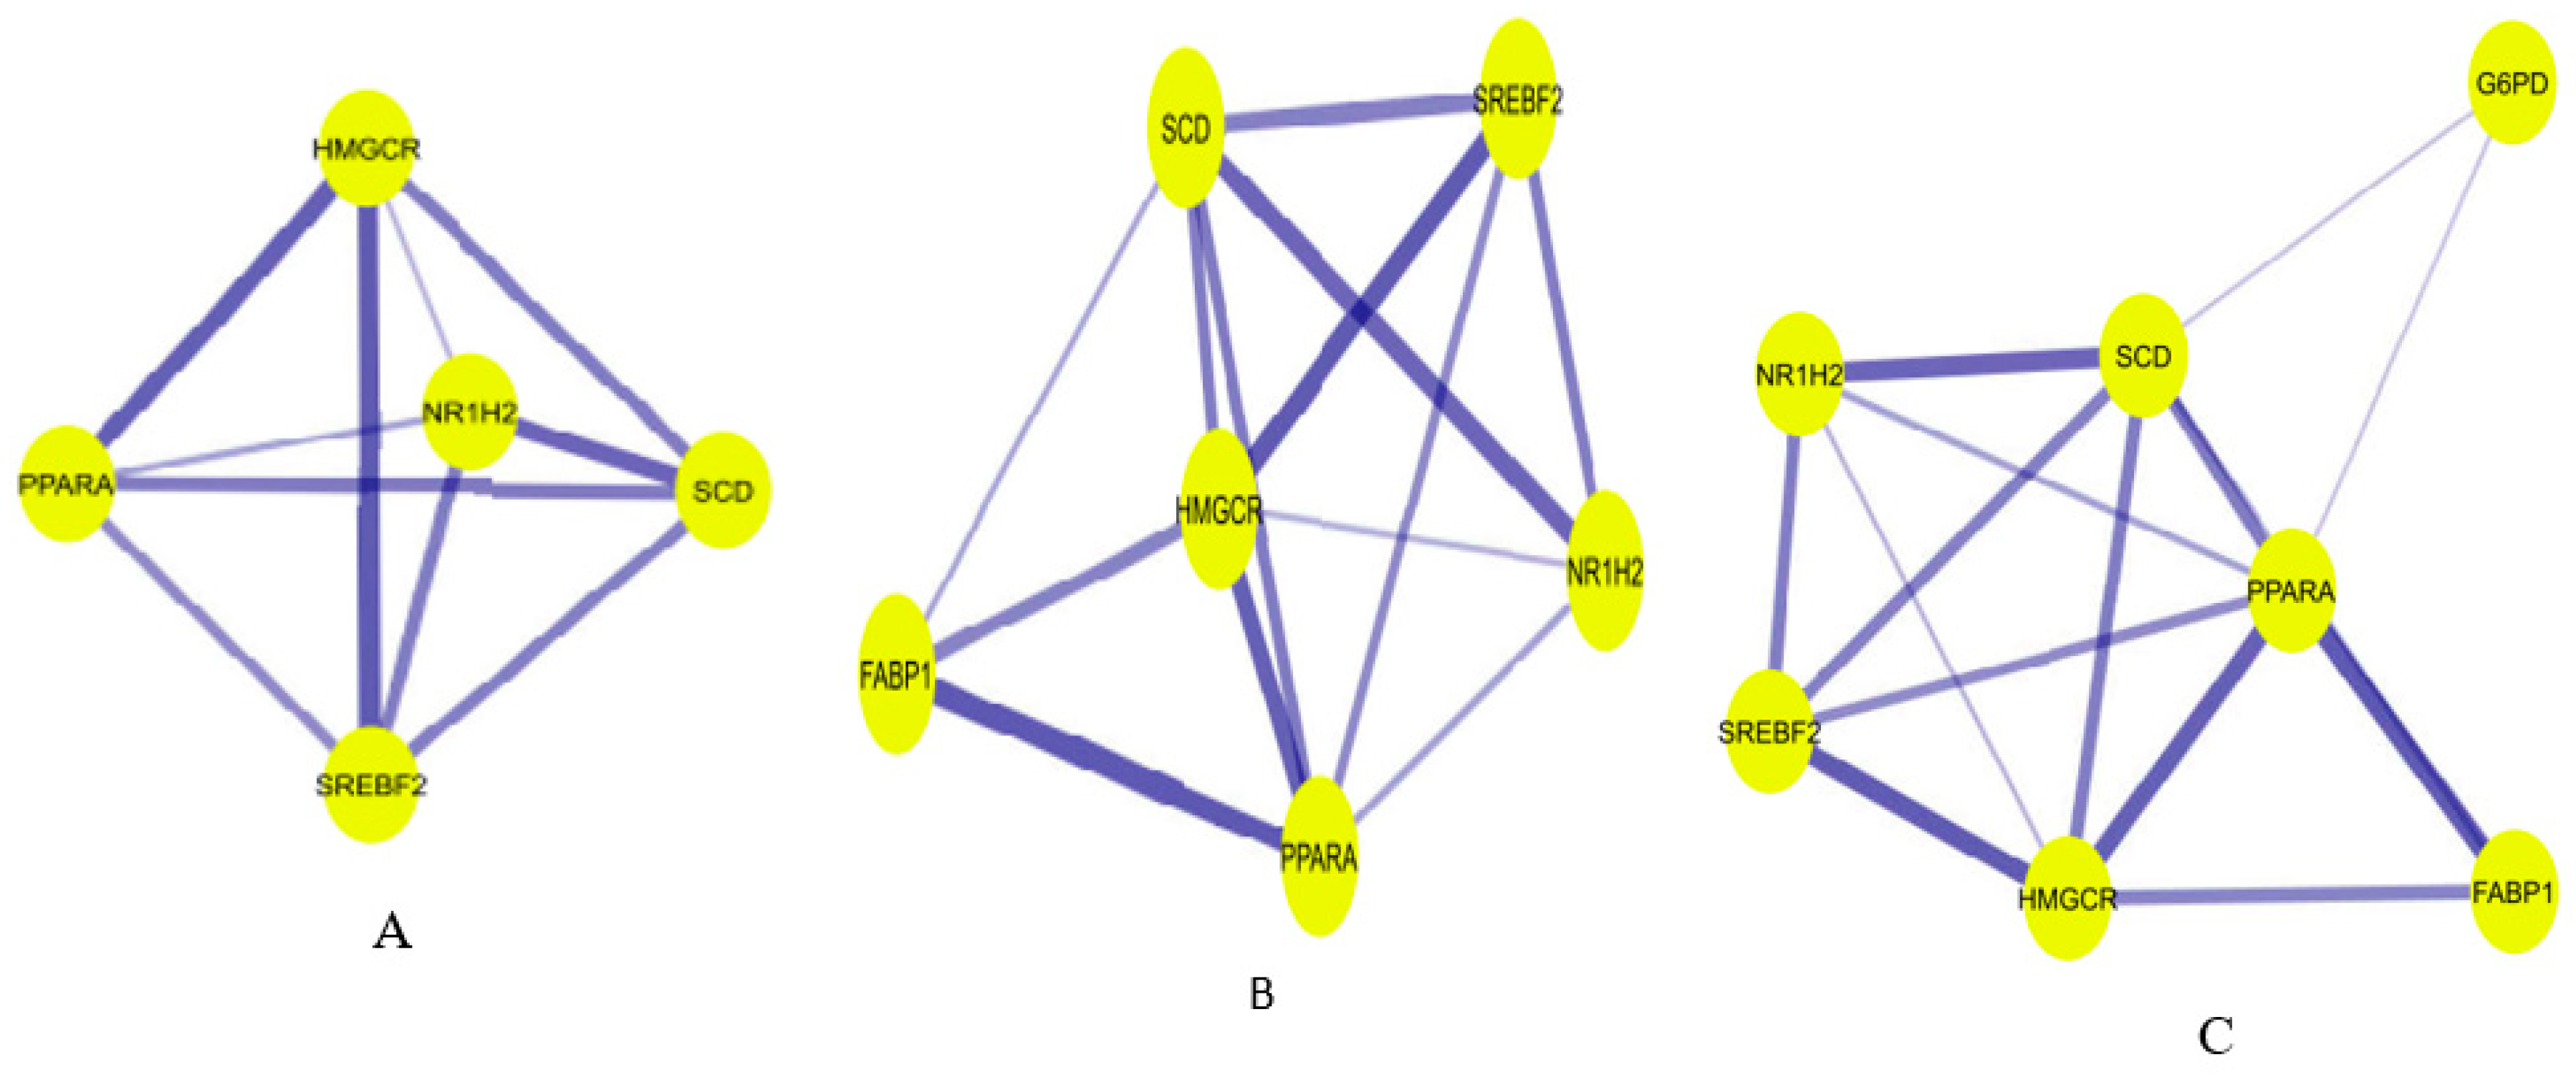
Figure 10.
PPI subnetworks from the preliminary PPI network according to subgraph (A), betweenness (B), and closeness (C) centralities respectively.
Figure 10.
PPI subnetworks from the preliminary PPI network according to subgraph (A), betweenness (B), and closeness (C) centralities respectively.
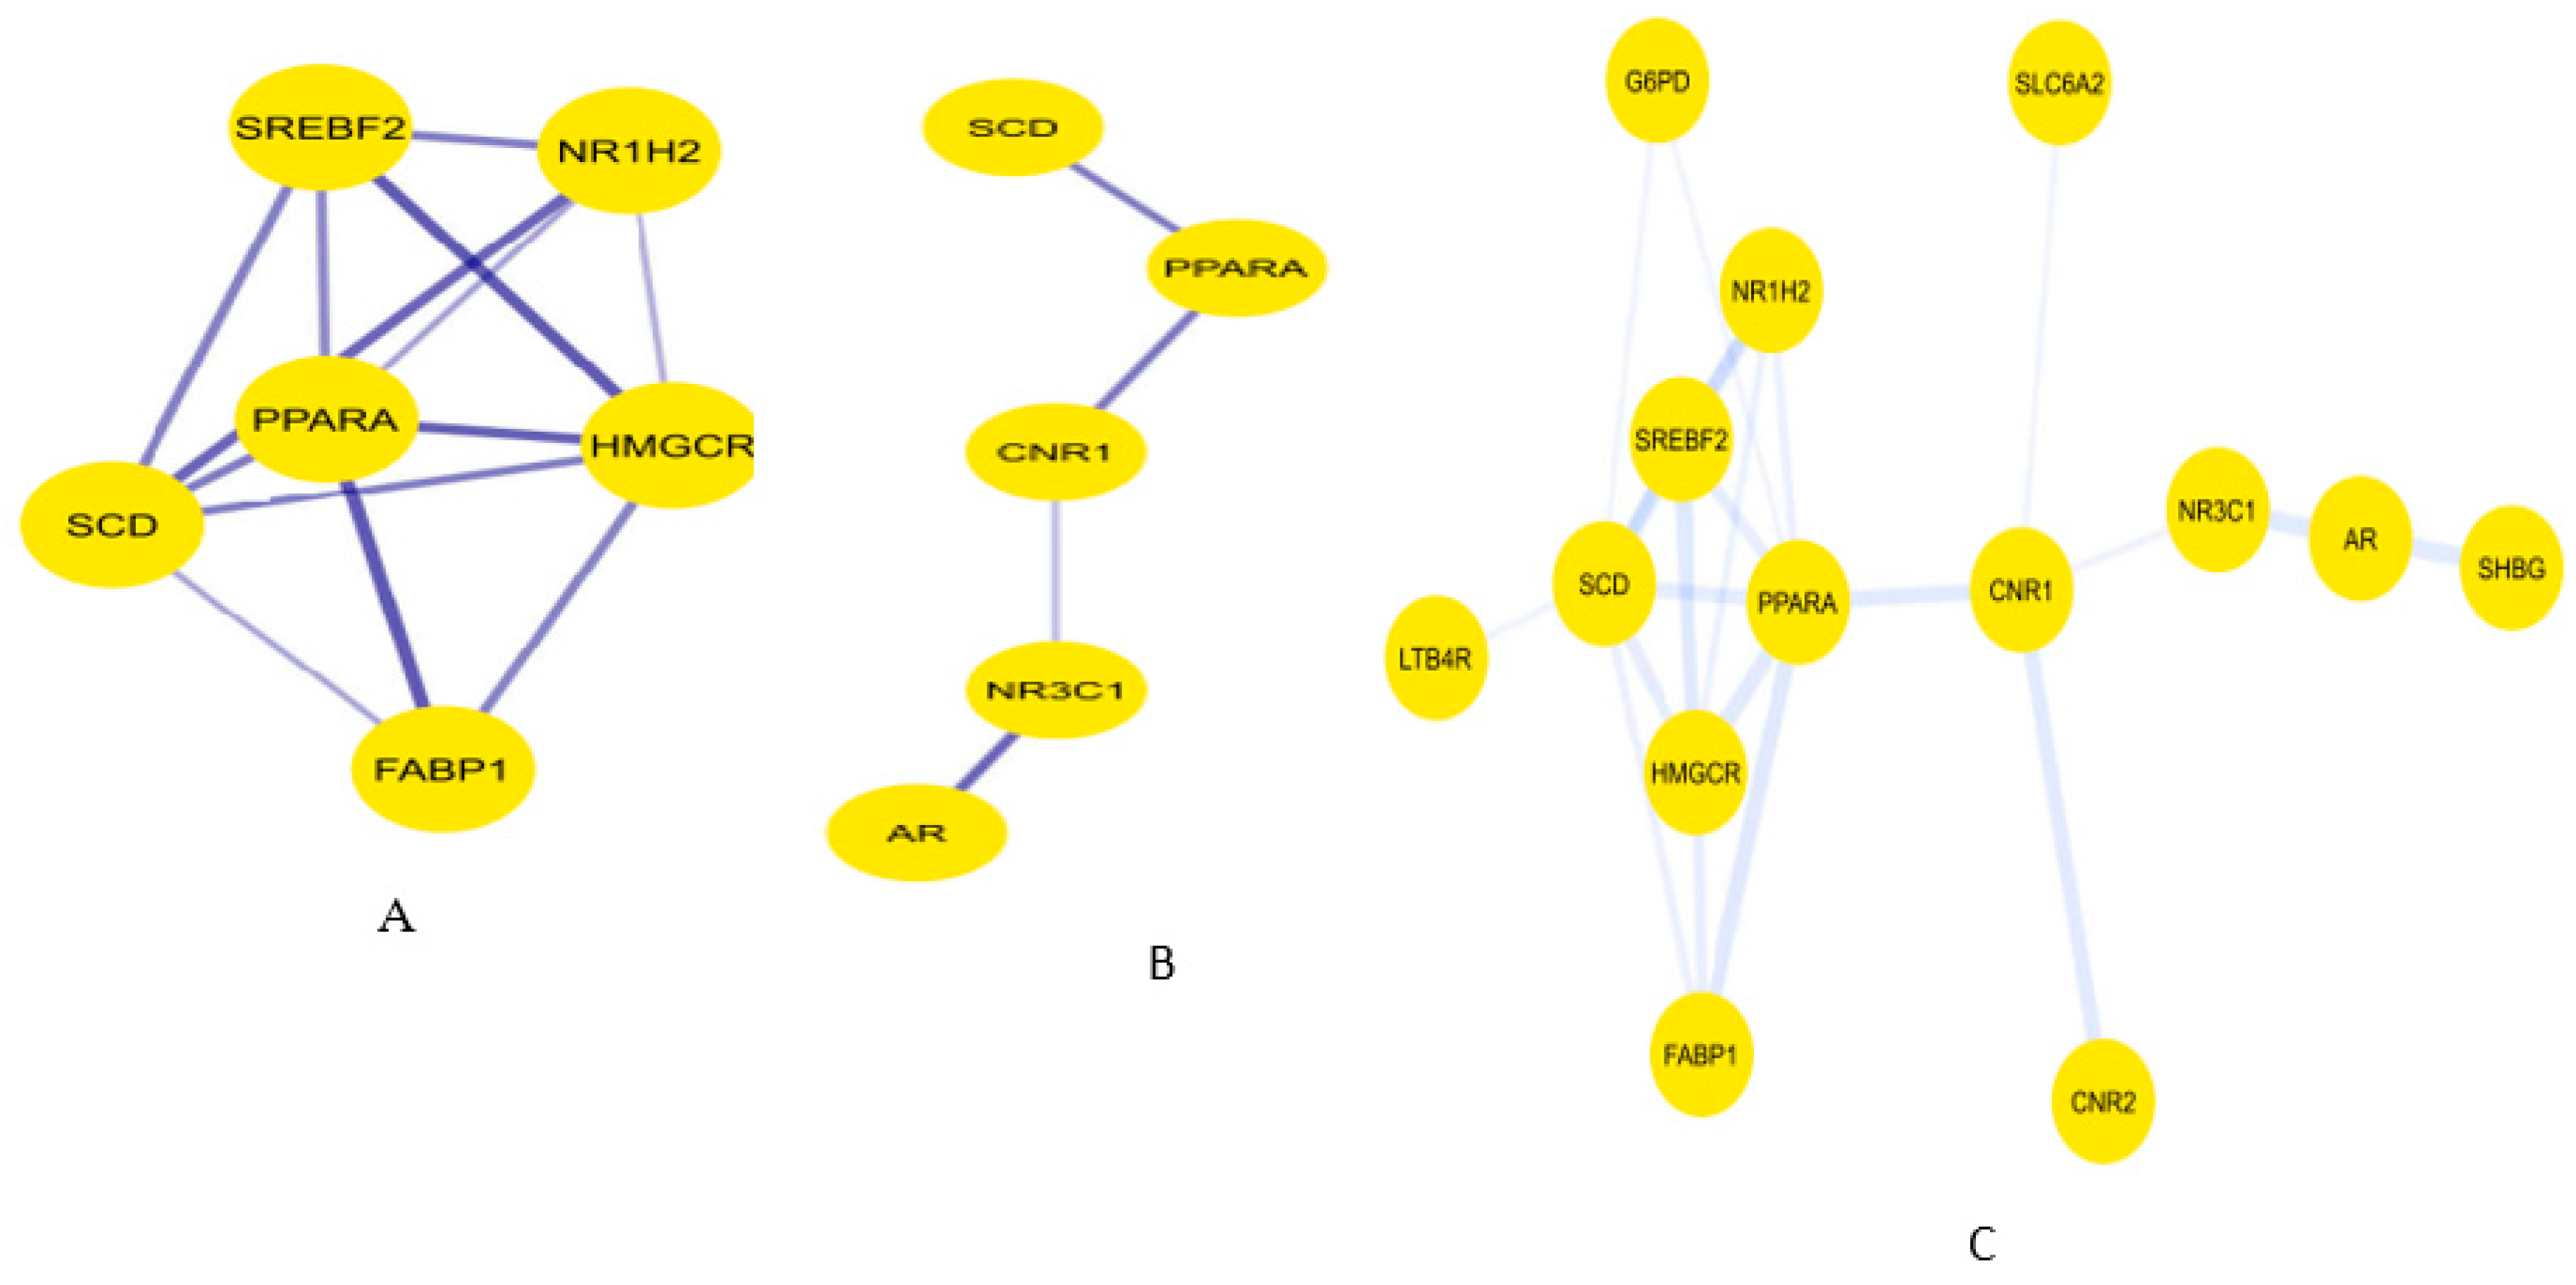
Figure 11.
Three-dimensional coordinates of molecular docking results with affinity energy. (A) PPARA with erucic acid (B) PPARA with oleic acid (C) PPARA with stigmasterol (D) PPARA with phytol (E) SCD with erucic acid (F) SCD with oleic acid (G) SCD with stigmasterol (H) SCD with phytol.
Figure 11.
Three-dimensional coordinates of molecular docking results with affinity energy. (A) PPARA with erucic acid (B) PPARA with oleic acid (C) PPARA with stigmasterol (D) PPARA with phytol (E) SCD with erucic acid (F) SCD with oleic acid (G) SCD with stigmasterol (H) SCD with phytol.
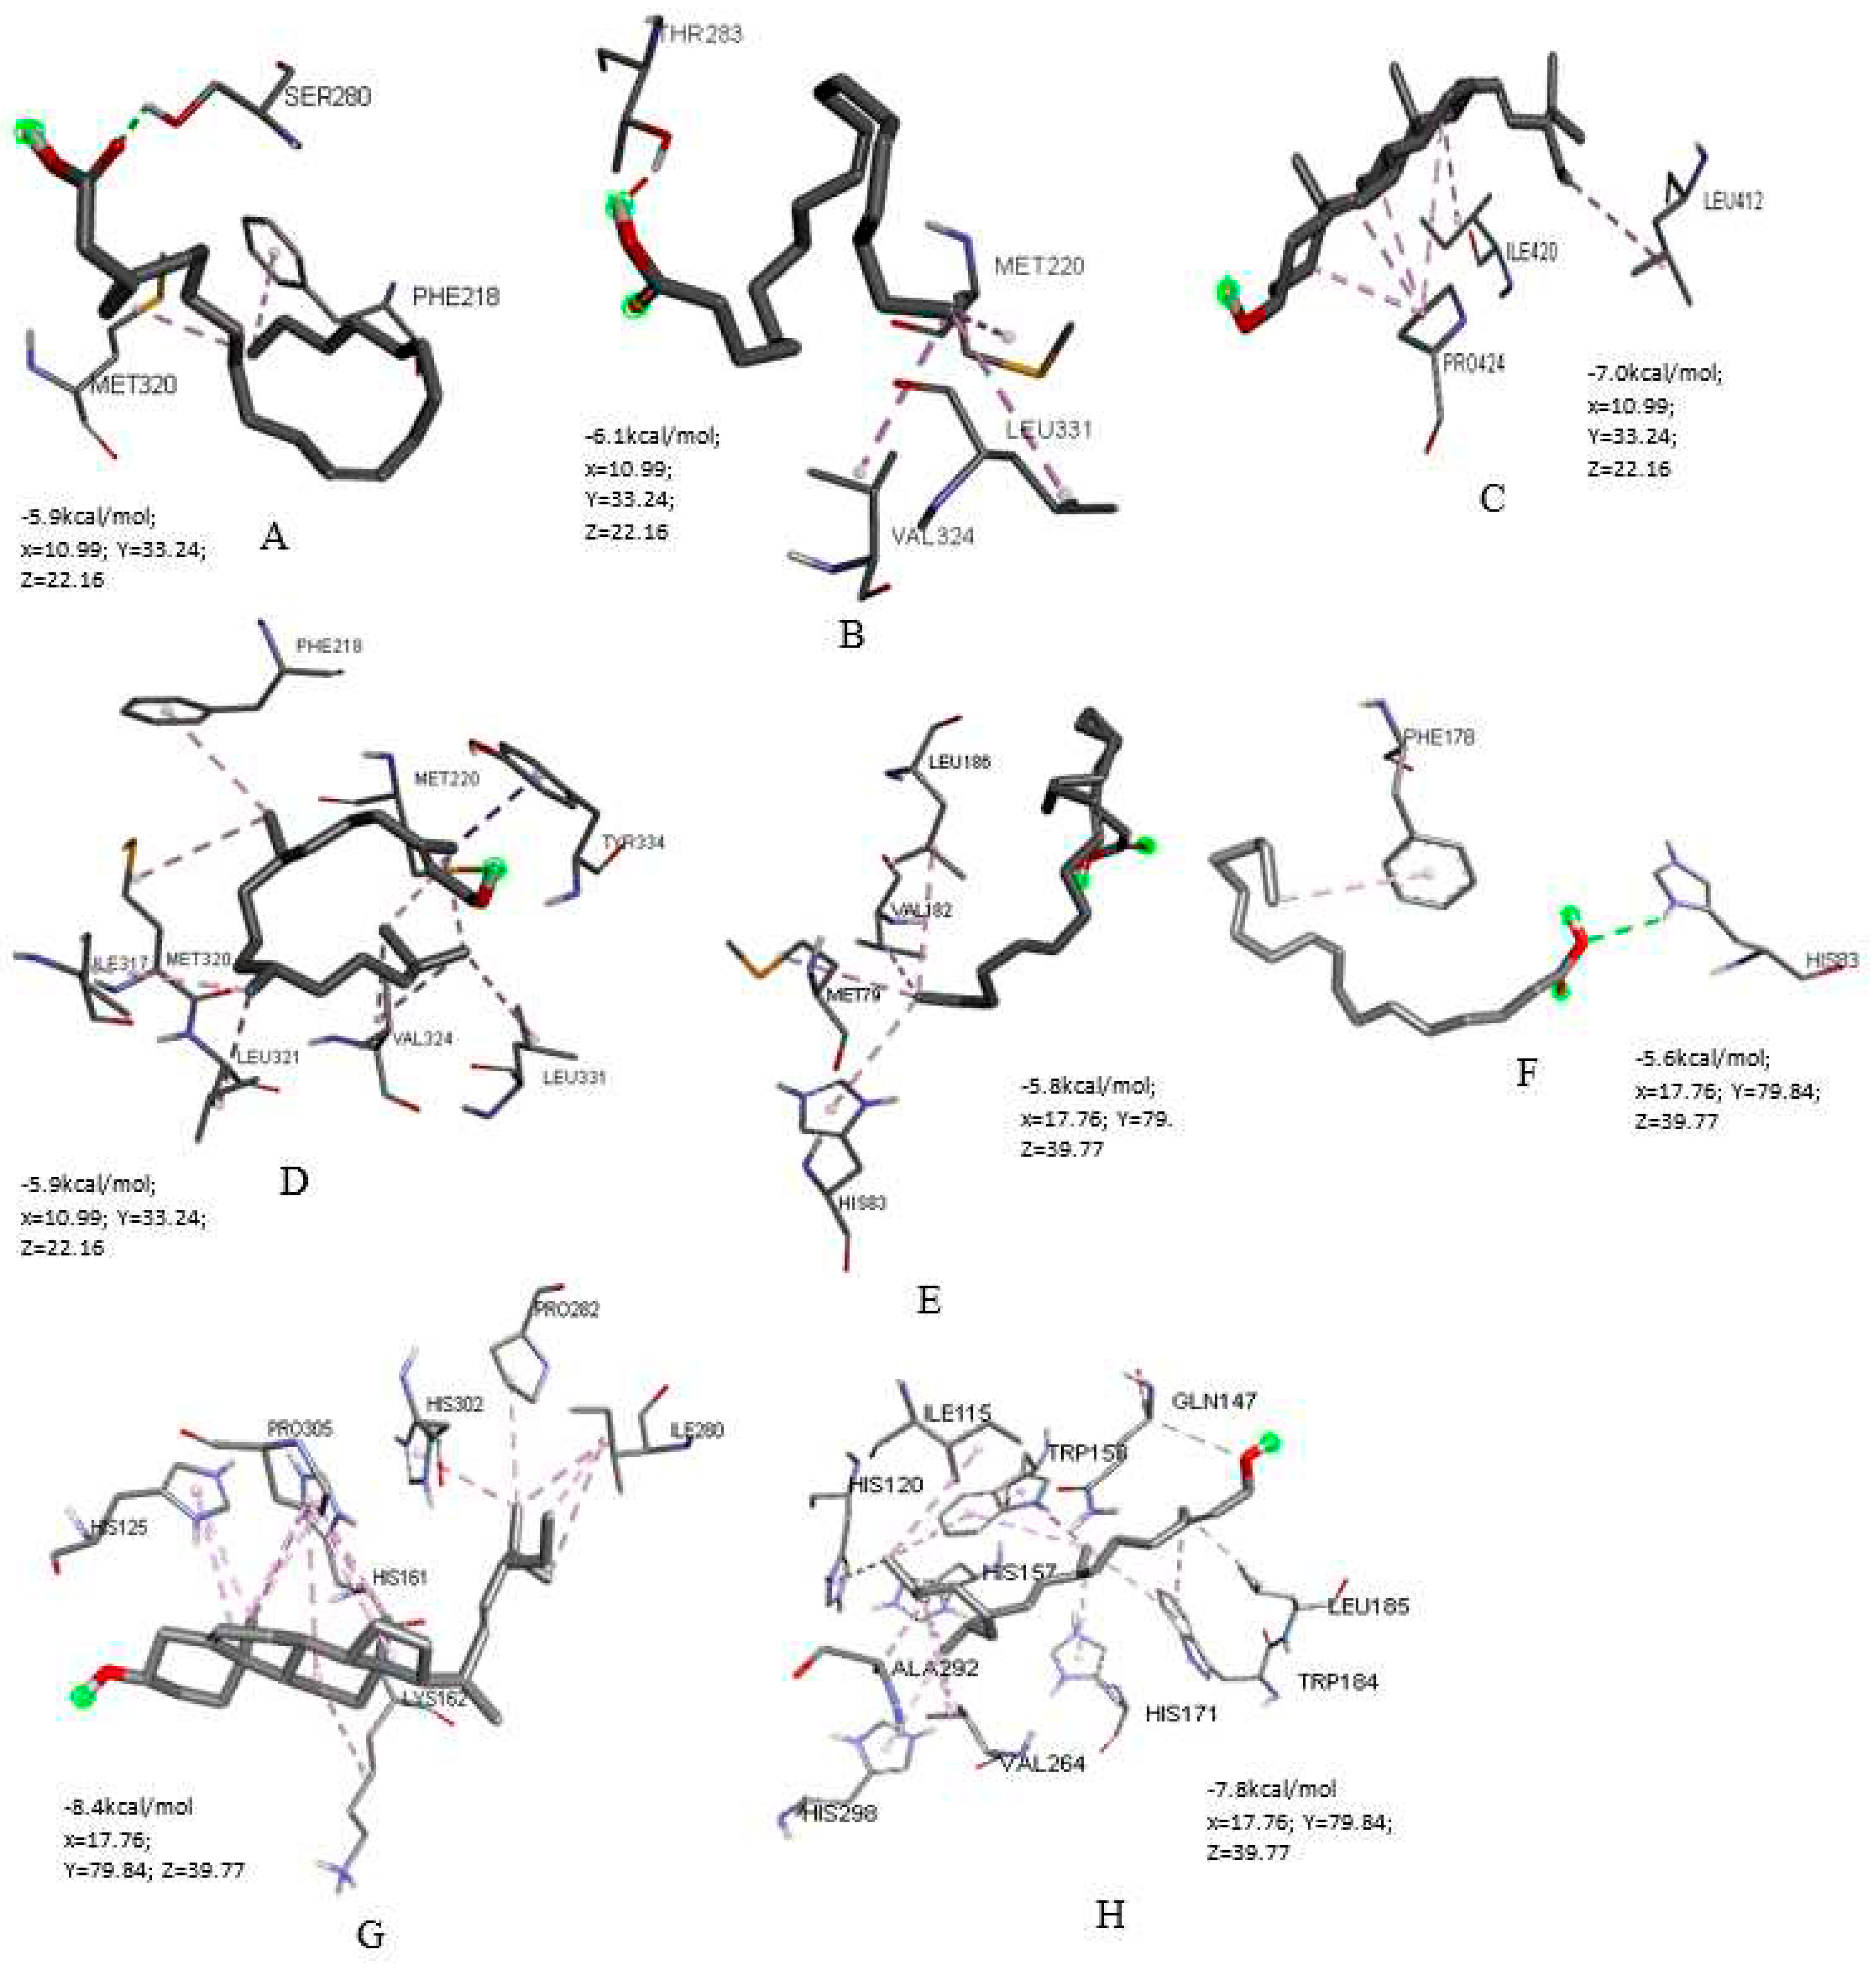

Table 1.
The mean values of body weight and blood glucose in experimental groups of rats. Values are expressed as mean ± SD. (n = 5).
Table 1.
The mean values of body weight and blood glucose in experimental groups of rats. Values are expressed as mean ± SD. (n = 5).
| Experimental groups | Initial body weight (g) | Final body weight (g) | Initial glucose level(mg/dL) | Final glucose level(mg/dL) | % difference in weight | % difference in glucose level |
| 1 | 133.621 ± 0.021a | 146.285 ± 0.214b | 90.601 ± 0.025a | 92.281 ± 1.119b | 9.478 | -1.854 |
| 2 | 143.585 ± 0.011a | 148.035 ± 0.004b | 339.001 ± 0.011a | 300.921 ± 0.126b | -3.099 | 11.233 |
| 3 | 160.605 ± 0.110a | 180.021 ± 0.854b | 569.301 ± 0.234a | 103.304 ± 0.114b | 12.089 | 81.854 |
| 4 | 125.103 ± 0.102a | 140.175 ± 0.142b | 354.001 ± 0.103a | 109.752 ± 1.092b | 12.048 | 68.997 |
| 5 | 138.692 ± 1.032a | 153.981 ± 0.152b | 360.201 ± 0.261a | 80.4091 ± 0.992b | 11.023 | 77.677 |
| 6 | 121.872 ± 0.345a | 137.321 ± 1.231b | 365.015 ± 0.235a | 91.565 ± 0.173b | 12.676 | 74.914 |
Different superscripts between initial (a) and final values (b) indicate statistically significant difference at P < 0.05 after 21 days of treatment.
Table 2.
Effect of APMLE administration on Serum Biochemical Parameters of Experimental Rats.
| Treatment Groups | TP | DB | UREA | CREA | ALT | AST | ALP | GLC |
| Control | 6.630 ± 0.060a | 0.097 ± 0.018a | 26.450 ± 0.054a | 0.675 ± 0.014a | 12.568 ± 0.154a | 63.234 ± 0.241a | 73.608 ± 0.194a | 98.471 ± 1.348a |
| Model | 4.462 ± 0.490b | 0.191 ± 0.010b | 35.096 ± 0.006b | 1.133 ± 0.019b | 18.9269 ± 0.319b | 112.419 ± 0.243b | 151.819 ± 0.029b | 320.985 ± 2.211b |
| Glibenclamide (0.5mg/kg) | 5.167 ± 0.029c | 0.136 ± 0.008c | 27.111 ±0.024c | 0.624 ± 0.012c | 13.047 ± 0.014c | 55.547 ± 0.162c | 110.116± 0.312c | 115.202 ± 0.095c |
| APMLE (mg/kg) | ||||||||
| 100 | 7.991 ± 0.019d | 0.099 ± 0.011a | 29.194 ± 0.035d | 0.569 ± 0.016a,d | 15.099 ± 006d | 55.2211 ± 0.162d | 111.416 ± 0.162d | 118.677 ± 4.268c |
| 200 | 6.059 ± 0.008e | 0.127 ± 0.014c | 26.625 ± 0.046c | 0.500 ± 0.007c | 12.109 ± 0.028e | 49.510 ± 0.002e | 101.301 ± 0.479e | 95.283 ± 0.169d |
| 400 | 7.242 ± 0.016f | 0.151 ± 0.022c | 27.201 ± 0.133e | 0.510 ± 0.004d | 10.062 ± 0.014f | 50.699 ± 0.062f | 105.564 ± 1.070f | 103.718 ± 0.263a |
Values with different superscripts along the same column indicate statistically significant differences at P < 0.05 after 21 days of treatment.
Table 3.
Differentially Expressed A. precatorius Biotagets in DM Type-1 (logFC > 1.1).
| ID | Gene Symbol | adj.P.Val | P | T | B | FC |
| Upregulated | ||||||
| 218215_s_at | NR1H2 | 0.003904 | 0.000217 | 7.13 | 0.906957 | 1.76 |
| 215689_s_at | SHBG | 0.001335 | 0.0000365 | 9.49 | 2.830106 | 1.71 |
| 202275_at | G6PD | 0.007802 | 0.000652 | 5.93 | -0.2964 | 1.11 |
| 206586_at | CNR2 | 0.003339 | 0.00017 | 7.43 | 1.173545 | 1.09 |
| 204696_s_at | CDC25A | 0.00069 | 0.0000116 | 11.3 | 4.04345 | 2.39 |
| 210426_x_at | RORA | 0.009569 | 0.000896 | 5.61 | -0.64293 | 2.93 |
| 211162_x_at | SCD | 0.027999 | 0.00452 | 4.16 | -2.40582 | 2.4 |
| 208130_s_at | TBXAS1 | 0.023064 | 0.00339 | 4.4 | -2.09381 | 1.91 |
| 216611_s_at | SLC6A2 | 0.022584 | 0.00328 | 4.43 | -2.05945 | 1.4 |
| 242748_at | SREBF2 | 0.048189 | 0.00994 | 3.54 | -3.25601 | 1.37 |
| 216388_s_at | LTB4R | 0.021365 | 0.00302 | 4.5 | -1.96962 | 1.26 |
| 226192_at | AR | 0.039555 | 0.00748 | 3.76 | -2.95059 | 1.17 |
| Downregulated | ||||||
| 211671_s_at | NR3C1 | 0.001064 | 0.0000253 | -10 | 3.219625 | -1.61 |
| 211549_s_at | HPGD | 0.005966 | 0.000423 | -6.38 | 0.176824 | -1.08 |
| 204491_at | PDE4D | 0.002799 | 0.000126 | -7.79 | 1.494475 | -1.82 |
| 207650_x_at | PTGER1 | 0.022819 | 0.00333 | -4.42 | -2.07626 | -1.84 |
| 205892_s_at | FABP1 | 0.000056 | 8.69E-08 | -23.7 | 8.727534 | -5.76 |
| 213436_at | CNR1 | 0.009857 | 0.00094 | -5.56 | -0.69546 | -3.2 |
| 213509_x_at | CES2 | 0.001047 | 0.0000243 | -10.1 | 3.261971 | -1.48 |
| 202540_s_at | HMGCR | 0.002473 | 0.000103 | -8.05 | 1.715511 | -1.12 |
| 200766_at | CTSD | 0.002048 | 0.0000747 | -8.47 | 2.061115 | -1.16 |
| 221330_at | CHRM2 | 0.021049 | 0.00296 | -4.52 | -1.94602 | -1.44 |
| 206561_s_at | AKR1B10 | 0.002139 | 0.0000806 | -8.37 | 1.979737 | -2.96 |
| 205433_at | BCHE | 0.010991 | 0.00111 | -5.4 | -0.8764 | -3.33 |
| 223437_at | PPARA | 0.000459 | 0.0000053 | -12.8 | 4.855719 | -2.21 |
Disclaimer/Publisher’s Note: The statements, opinions and data contained in all publications are solely those of the individual author(s) and contributor(s) and not of MDPI and/or the editor(s). MDPI and/or the editor(s) disclaim responsibility for any injury to people or property resulting from any ideas, methods, instructions or products referred to in the content. |
© 2023 by the authors. Licensee MDPI, Basel, Switzerland. This article is an open access article distributed under the terms and conditions of the Creative Commons Attribution (CC BY) license (http://creativecommons.org/licenses/by/4.0/).
Copyright: This open access article is published under a Creative Commons CC BY 4.0 license, which permit the free download, distribution, and reuse, provided that the author and preprint are cited in any reuse.


