
Submitted:
24 March 2025
Posted:
26 March 2025
You are already at the latest version
Abstract
Type 2 diabetes mellitus (T2DM) is a common chronic metabolic disorder that imposes a substantial healthcare burden globally. Recent advances highlight the potential of natural products in ameliorating T2DM. In this study, we investigated the therapeutic efficacy of nootkatone (Nok), a natural sesquiterpene ketone, in T2DM and elucidated its underlying mechanisms. In vivo experiments demonstrated that Nok administration markedly improved dysregulated glucose metabolism and ameliorated serum biochemical abnormalities in db/db mice. Leveraging a network pharmacology-based approach, we identified putative molecular targets of Nok. Subsequent in vitro analyses revealed that Nok significantly enhanced glucose consumption in cultured cells. Mechanistically, Nok robustly activated AMP-activated protein kinase (AMPK) while suppressing mitogen-activated protein kinase (MAPK) signaling. Western blot validation further indicated that Nok downregulated the phosphorylation of MAPK1/3 (ERK2/1), attenuating MAPK pathway activation and thereby alleviating metabolic dysfunction-associated fatty liver disease (MAFLD) progression in the diabetic model. Collectively, our findings suggest that Nok exerts anti-diabetic effects by dual modulation of AMPK activation and MAPK inhibition, effectively restoring metabolic homeostasis and mitigating inflammation in T2DM. This study positions Nok as a promising natural compound for therapeutic intervention in T2DM and associated metabolic disorders.
Keywords:
nootkatone
; diabetes
; liver
; pancreatic
; network pharmacology
; db/db mice
1. Introduction
Type 2 diabetes mellitus (T2DM) is a chronic metabolic disorder characterized by hyperglycemia, relative insulin deficiency, and insulin resistance [1]. This condition often leads to multiple complications such as diabetic retinopathy, nephropathy, cardiovascular diseases, and neuropathy, which are significant causes of morbidity and mortality in diabetic patients [2]. Current pharmacological treatments for T2DM include sulfonylureas, biguanides, α-glucosidase inhibitors, thiazolidinediones, and insulin. While these medications effectively control blood glucose levels, they can also cause side effects such as hepatotoxicity, hypoglycemia, and edema, which may limit their tolerability for some patients [3]. Therefore, there is an urgent need for the development of new antidiabetic drugs with better efficacy and safety profiles.
Alpinia oxyphylla, a traditional medicinal herb native to Hainan Island, has been historically used to treat conditions such as enuresis, frequent urination, premature ejaculation, abdominal pain from spleen cold, and diarrhea [4]. The herb is an integral part of Hainan’s traditional medicine. The primary bioactive compounds of Alpinia oxyphylla include sesquiterpenoids, diarylheptanoids, flavonoids, volatile oils, and steroids, which have shown various pharmacological activities such as antidiuretic, cognitive enhancement, antimicrobial, antitumor, neuroprotection, and antioxidative stress [5].
Nootkatone (Nok), a sesquiterpenoid ketone, is a key bioactive component of Alpinia oxyphylla [6], grapefruit, and other citrus fruits. It is widely used in the flavoring and fragrance industries due to its distinctive grapefruit, orange, and tropical fruit aroma. Researcher has demonstrated that Nok enhances the sensitivity of non-small cell lung cancer A549 cells to doxorubicin [7], protects against chronic kidney injury, and exhibits anxiolytic and antidepressant properties [8]. These pharmacological effects are related to its activation of AMPK, a highly conserved intracellular protein kinase that regulates energy homeostasis and is considered a crucial target for treating metabolic disorders such as diabetes, dyslipidemia, fatty liver, and obesity [9,10,11]. Our previous research showed that Nok can significantly improve glucose and lipid metabolism disorders and enhance glucose tolerance in MAFLD animal model. Therefore, we hypothesize that Nok may also have beneficial therapeutic effects for T2DM.
2. Results
2.1. Nok Improves Glucose and Lipid Metabolism and Reduces Body Weight in db/db Mice
To investigate the efficacy of Nok on T2DM, we first examined the effects of Nok on Glucose and lipid metabolism as well as changes in body weight. As illustrated in Figure 1, fasting blood glucose (FBG) levels in db/db diabetic mice were significantly higher than those in C57BL/6J mice (Figure 1A). Following 4 weeks of Nok administration, FBG levels in the Nok-treated db/db mice decreased in a dose-dependent manner. Notably, the 100 mg/kg Nok-H group exhibited a significant reduction in FBG levels compared to the untreated db/db model group, achieving a 26.74% decrease in blood glucose concentration. In contrast, FBG levels in the untreated db/db model group increased significantly from baseline, whereas all Nok-treated groups displayed reductions (Figure 1A). The glucose-lowering efficacy of Nok was comparable to that observed in the 200 mg/kg metformin-treated group (Figure 1A).
In terms of body weight, the Nok treatment groups showed varying degrees of weight reduction compared to the db/db model group, with the 100 mg/kg Nok-H group showing a significant weight reduction effect (Figure 1B). Lipid profile analysis indicated that serum LDL-c and TG levels were significantly higher in the db/db model group compared to the normal C57BL/6J mice (Figure 1C,D). However, after treatment with 100 mg/kg Nok, serum LDL-c and TG levels decreased significantly (Figure 1C,D), with lipid-lowering effects comparable to those of metformin (Figure 1C,D).
2.2. Nok Improves Glucose Tolerance and Insulin Resistance in db/db Diabetic Mice
Glucose tolerance and insulin resistance are key indicators and contributors to the development of T2DM. To further assess the effects of Nok on these parameters in db/db diabetic mice, we conducted oral glucose tolerance tests (OGTT) and insulin tolerance tests (ITT), alongside measurements of serum insulin levels and calculation of the Homeostatic Model Assessment of Insulin Resistance (HOMA-IR). As shown in Figure 2A and 2B, blood glucose levels peaked 30 minutes after oral glucose administration in all mice and then gradually decreased. Compared to the C57BL/6J control group, the area under the curve (AUC) for the OGTT in the untreated db/db model group was significantly elevated, approximately 3.79-fold higher, reflecting impaired glucose tolerance. After 4 weeks of Nok treatment, glucose tolerance in the Nok-treated groups improved significantly compared to the untreated db/db model group, with AUC values decreasing in a dose-dependent manner (Figure 2B).
For ITT results (Figure 2C and 2D), blood glucose levels in the normal C57BL/6J mice significantly decreased after intraperitoneal insulin injection, reaching their lowest level around 60 minutes. In contrast, the untreated db/db model diabetic mice showed no significant decrease in blood glucose levels post-insulin injection, with AUC values significantly higher than those of the C57BL/6J group, approximately 5.6 times greater, indicating marked insulin resistance. However, in Nok-treated db/db mice, blood glucose levels significantly decreased after insulin injection, with a minimum value reached at 60 minutes, and AUC values significantly lower than those of the untreated db/db model mice, comparable to the Metformin-treated group (Figure 2C and 2D), suggesting that Nok markedly improves insulin resistance in db/db diabetic mice. Further analysis of serum insulin levels showed that insulin levels and HOMA-IR were significantly elevated in the db/db model group compared to the normal C57BL/6J group, indicating hyperinsulinemia and insulin resistance (Figure 2E and 2F). However, Nok treatment at a dose of 100 mg/kg significantly reduced insulin levels and HOMA-IR values, comparable to those in the Metformin-treated group (Figure 2E and 2F).
2.3. Nok Significantly Reduces Inflammation in db/db Diabetic Mice
Inflammation plays a pivotal role in the progression and pathogenesis of diabetes. To investigate the effects of Nok on inflammation in db/db diabetic mice, we quantified serum levels of key inflammatory cytokines across all experimental groups. As shown in Figure 3, levels of interleukin-1β (IL-1β), interleukin-6 (IL-6), interleukin-18 (IL-18), and tumor necrosis factor-α (TNF-α) were significantly elevated in the db/db diabetic model group compared to the C57BL/6J control group (Figure 3). These findings indicate that db/db diabetic mice exhibit pronounced inflammation, likely driven by metabolic dysregulation of glucose and lipid homeostasis. In contrast, Nok treatment reduced the levels of these inflammatory cytokines relative to the untreated db/db model group, with the most notable reductions observed in the high-dose (100 mg/kg) Nok group. Specifically, serum concentrations of IL-1β, IL-6, and IL-18 were significantly decreased in this group (Figure 3A,B,D). These results demonstrate that Nok effectively attenuates inflammation in db/db diabetic mice. The positive control, metformin (Met), similarly exerted significant anti-inflammatory effects (Figure 3).
2.4. Nok Improves Liver Function in db/db Diabetic Mice
To evaluate liver function in mice, we measured serum levels of alanine aminotransferase (ALT) and aspartate aminotransferase (AST). Compared to the C57BL/6J control group, the db/db model group exhibited significantly elevated serum ALT and AST activities (Figure 4A,B). Additionally, liver mass and the liver index (liver mass/body weight ratio) were markedly higher in the db/db model group than in the C57BL/6J controls, indicative of liver enlargement and compromised hepatic function (Figure 4C,D). Following Nok treatment, serum ALT and AST activities were significantly reduced compared to the untreated db/db model group (Figure 4A,B). Similarly, treatment with 200 mg/kg metformin (Met), the positive control, significantly lowered ALT and AST activities, with effects comparable to those observed in the 100 mg/kg Nok-treated group (Figure 4A,B). Moreover, Nok treatment, particularly at the 100 mg/kg dose, significantly decreased liver mass and the liver index (Figure 4C,D). These findings suggest that Nok effectively mitigates diabetes-associated liver enlargement and enhances hepatic function.
2.5. Nok Improves Pathological Changes in the Liver and Pancreas of db/db Mice
Nok significantly reduces serum ALT and AST levels, decreases liver mass, and lowers the liver index, demonstrating pronounced hepatoprotective effects. To further elucidate these effects, we assessed pathological changes in liver tissue using hematoxylin and eosin (H&E) staining. As shown in Figure 5, liver sections from the db/db diabetic model group exhibited marked macrovesicular steatosis and cellular degeneration (Figure 5A). In contrast, the C57BL/6J control group displayed no evidence of steatosis or lipid accumulation, with the steatosis pathological score being significantly higher in the db/db model group than in the controls (Figure 5A). This suggests that liver enlargement in the db/db mice likely results from fat accumulation, corroborating the observed increases in liver mass and liver index. Nok treatment, however, significantly mitigated these pathological alterations, reducing both macrovesicular and microvesicular steatosis and substantially lowering pathological scores (Figure 5A,B). These findings indicate that Nok effectively protects liver function and ameliorates degeneration and lipid accumulation in hepatic tissue, providing further evidence of its hepatoprotective properties.
We also examined pancreatic tissue using H&E staining. As shown in Figure 6, the pancreatic architecture of the C57BL/6J control group was well-defined, with islets appearing as spherical clusters of cells exhibiting regular morphology and a cord-like cellular arrangement (Figure 6). In contrast, the db/db diabetic model group displayed significantly enlarged islets, characterized by disorganized cellular structure, scattered vacuolar degeneration, and evidence of cell loss and collapse (Figure 6A). The pathological scores in the db/db group were significantly elevated compared to those in the C57BL/6J controls (Figure 6A). Following 4 weeks of Nok treatment, these pathological changes in the islets of db/db mice were markedly alleviated, with reductions in islet size, restoration of morphological integrity, and significant decreases in pathological scores (Figure 6A,B). The improvements in pancreatic histopathology observed in the 100 mg/kg Nok-treated group were comparable to those in the 200 mg/kg metformin (Met)-treated group.
2.6. The Effects of NOK on Glucose Metabolism and AMPK Activation
To explore the effects of Nok on glucose metabolism and its underlying mechanism of action, we assessed its cytotoxicity and influence on cellular energy pathways in AML-12 hepatocytes. Nok exhibited no cytotoxicity in AML-12 cells at a concentration of 20 μM, whereas cell viability was significantly reduced at 80 μM (Figure 7A). Additionally, Nok increased glucose consumption in a dose-dependent manner (Figure 7B). Given the pivotal role of AMP-activated protein kinase (AMPK) in regulating energy homeostasis and glucose metabolism, we investigated its activation in AML-12 cells. Western blot analysis demonstrated that Nok enhanced AMPK activation, as evidenced by elevated levels of phosphorylated AMPKα (Thr172) and its downstream target, phosphorylated acetyl-CoA carboxylase (ACC) (Ser79) (Figure 7C–G). These findings suggest that Nok may ameliorate type 2 diabetes mellitus (T2DM) by modulating glucose metabolism through the AMPK signaling pathway.
2.7. Network Pharmacology Prediction and Experimental Validation of Nok’s Targets
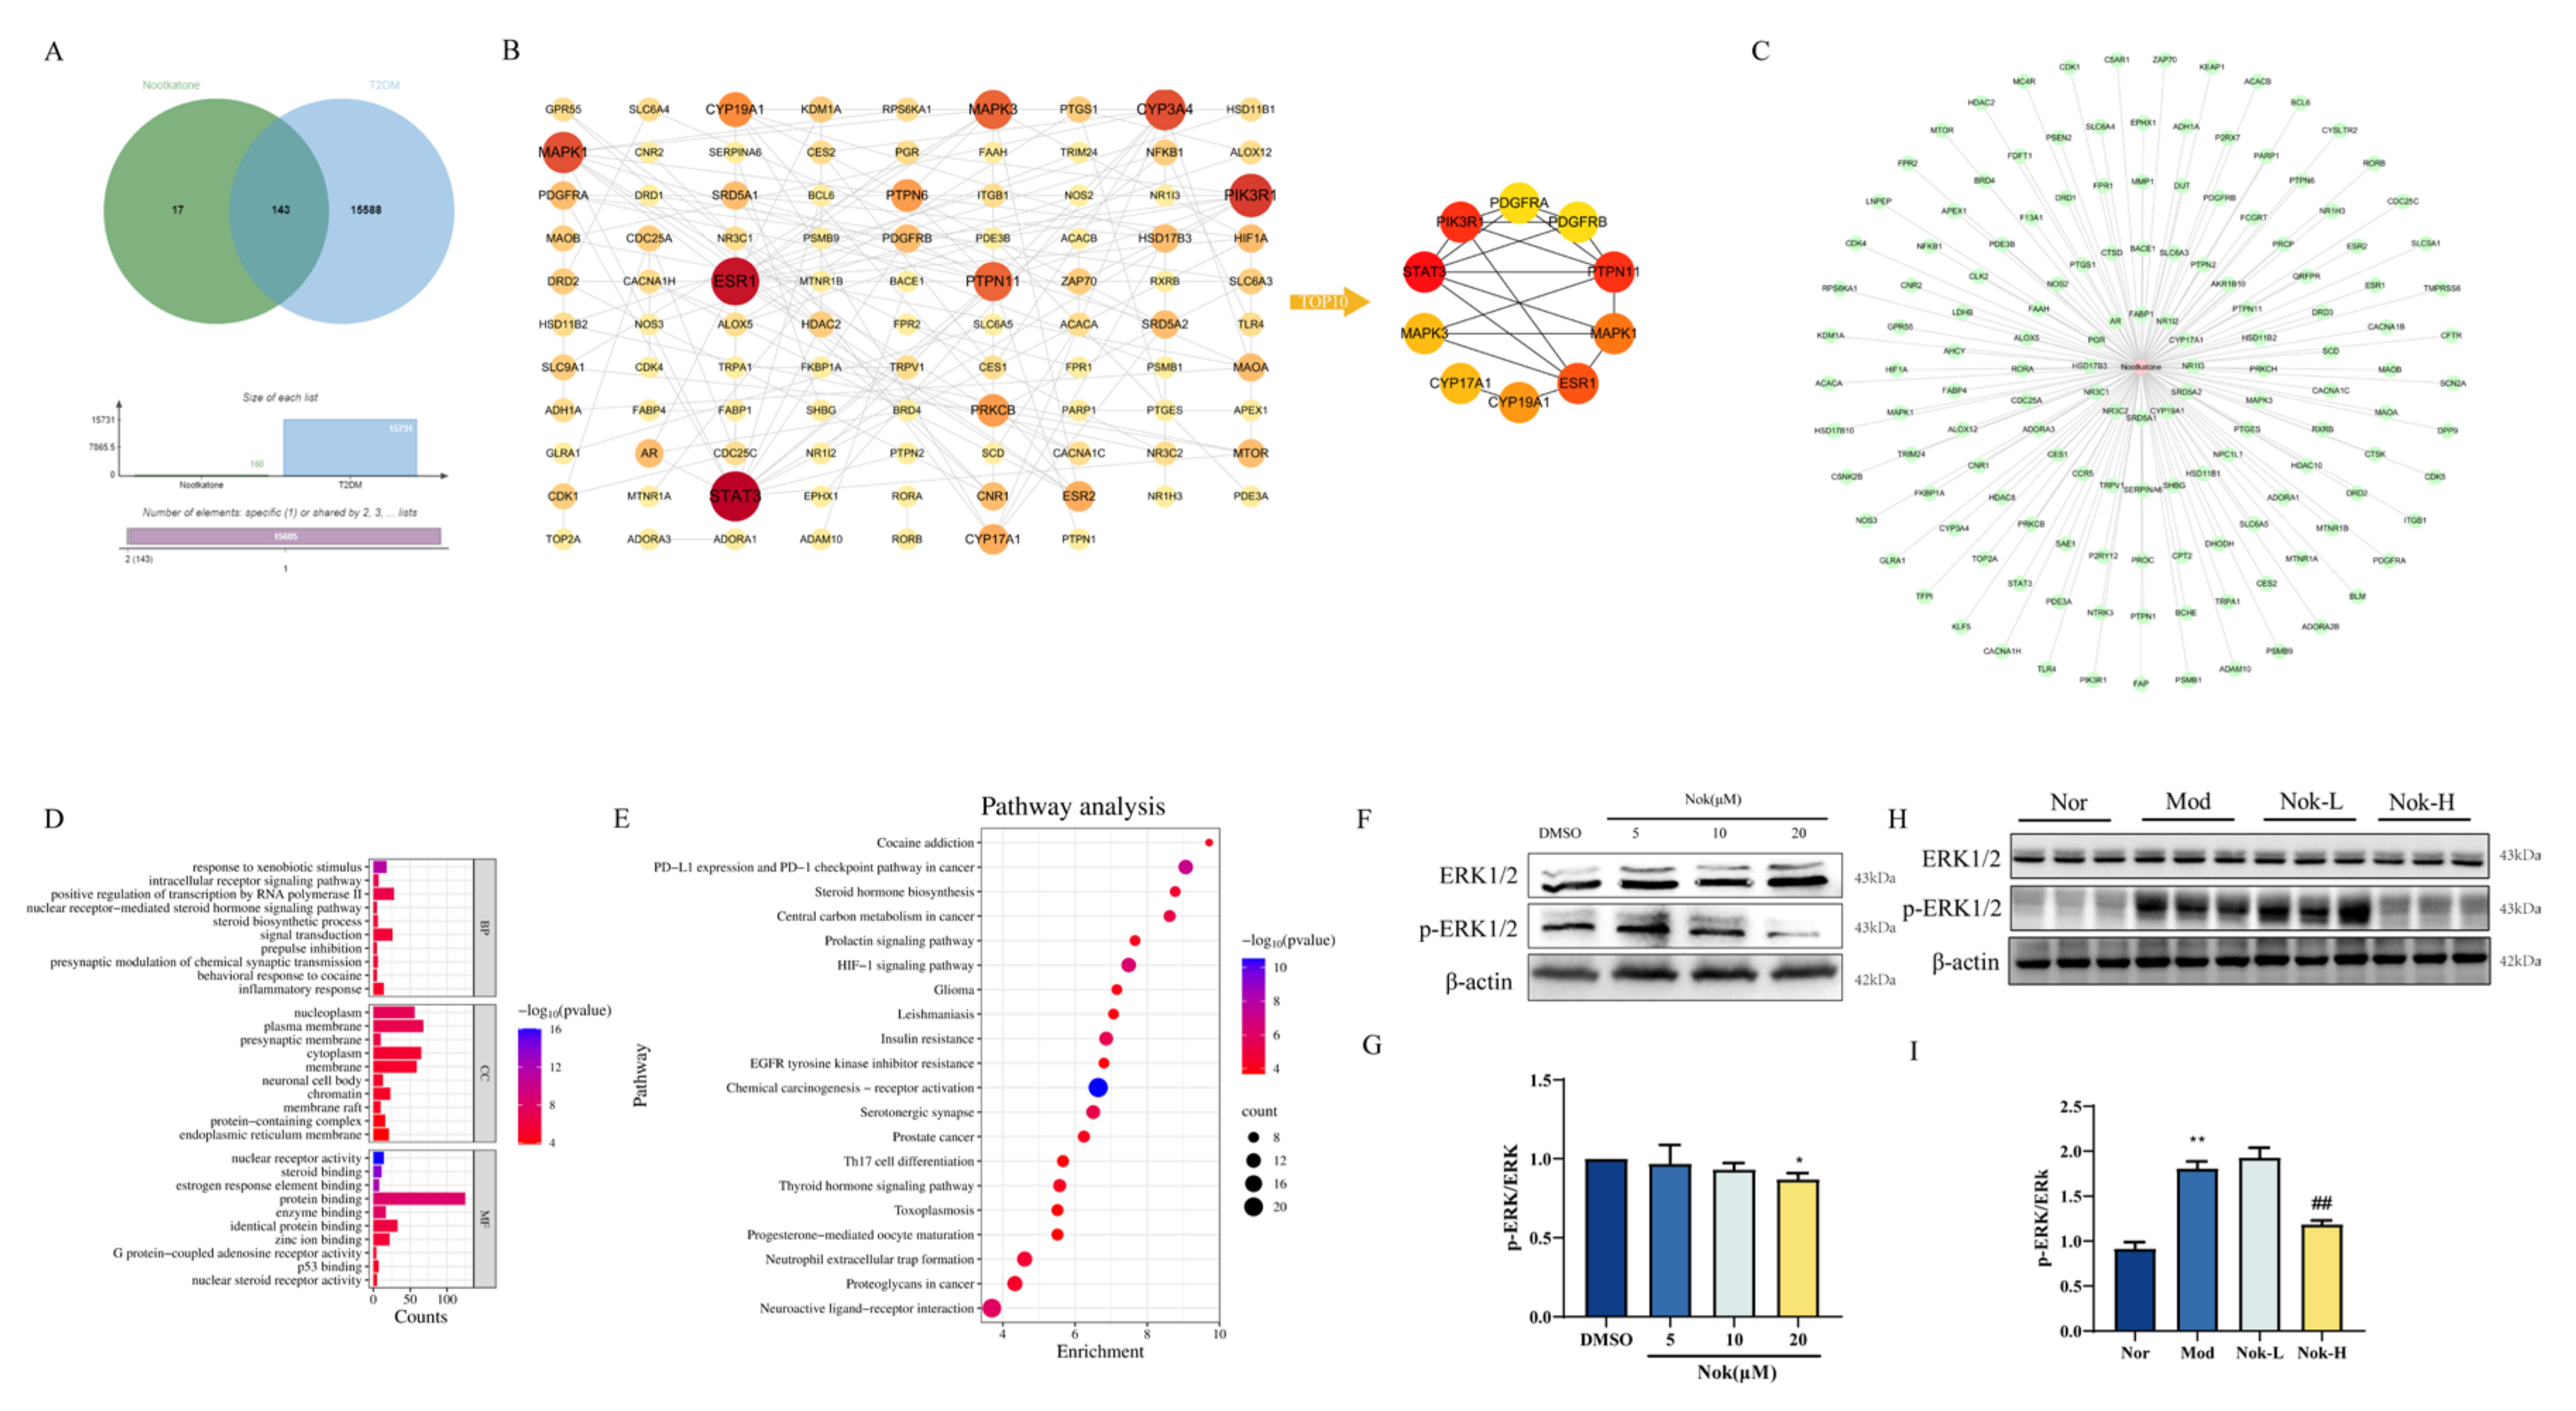
To identify potential therapeutic targets of Nok in the treatment of type 2 diabetes mellitus (T2DM), we employed network pharmacology predictions. Drug target prediction and T2DM-related target prediction were integrated to construct a Venn diagram illustrating the overlap between Nok-associated and T2DM-related proteins (Figure 8A). The overlapping genes, designated as differentially expressed genes (DEGs), were considered potential hub genes underlying Nok’s effects on T2DM. A total of 143 DEGs (Nok-T2DM overlapping proteins) were incorporated into a protein-protein interaction (PPI) network, highlighting their relevance to Nok’s therapeutic impact on T2DM (Figure 8B). To elucidate the mechanisms of Nok’s effects, we constructed a Nok target-T2DM network (Figure 8C). Gene function analysis of the 143 DEGs was performed using R software, with Gene Ontology (GO) annotation encompassing biological process (BP), cellular component (CC), and molecular function (MF) categories (Figure 8D). BP terms were predominantly enriched in inflammatory response, response to xenobiotic stimuli, signal transduction, and positive regulation of RNA polymerase II-mediated transcription. CC terms were associated with nucleoplasm, plasma membrane, and cytoplasm, while MF terms included protein binding, identical protein binding, and enzyme binding. Furthermore, Kyoto Encyclopedia of Genes and Genomes (KEGG) pathway enrichment analysis revealed significant associations between Nok and pathways such as insulin resistance and the hypoxia-inducible factor-1 (HIF-1) signaling pathway (Figure 8E). These results suggest that Nok’s therapeutic effects on T2DM are closely linked to these signaling pathways.
Western blot analysis further demonstrated that Nok significantly suppressed the phosphorylation of extracellular signal-regulated kinase 1/2 (p-ERK1/2) both in vivo and in vitro (Figure 8F–I), indicating that its anti-inflammatory effects may be mediated, at least in part, through inhibition of the ERK signaling pathway.
3. Discussion
As the global prevalence of diabetes continues to rise, the burden on healthcare systems has become increasingly substantial. Although current anti-diabetic drugs offer some efficacy in glycemic control, long-term use can lead to side effects that render treatment intolerable for some patients. Consequently, the need for safer anti-diabetic therapies is pressing. In recent years, there has been growing interest in the potential of natural products and Traditional Chinese Medicine (TCM) in the development of anti-diabetic drugs. For example, resveratrol and laurolitsine have demonstrated significant efficacy in the treatment of T2DM [12]. The objective of this study was to systematically explore the potential therapeutic mechanisms of Nok in T2DM.
AMPK is a key energy sensor in cells, crucial for regulating glucose and lipid metabolism, which makes it a valuable target in T2DM treatment [13]. Activation of AMPK enhances insulin sensitivity by promoting glucose uptake in muscle and fat cells and inhibits lipogenesis by suppressing ACC [14,15], thereby reducing hepatic triglyceride accumulation and improving lipid profiles. Additionally, AMPK activation exerts anti-inflammatory effects by downregulating pro-inflammatory cytokines [16], which helps alleviate insulin resistance, a key factor in T2DM pathophysiology. Consequently, AMPK is an important therapeutic target for T2DM management [17], with AMPK activators such as metformin and berberine demonstrating notable effects on glycemic control and lipid metabolism. Building on our prior findings that Nok activates AMPK in MAFLD, this study confirmed that Nok’s effects on T2DM are likely mediated through AMPK activation, supporting its potential as a multi-functional therapeutic approach.
Inflammation plays a crucial role in the onset and progression of T2DM [18], with various signaling pathways contributing to the inflammatory environment that exacerbates insulin resistance and metabolic dysfunction. Among these, the role of the ERK signaling pathway is critical and cannot be overlooked. The ERK pathway not only mediates inflammatory responses but also influences insulin signaling, creating a complex link between inflammation and metabolic imbalance in T2DM [19]. Inhibiting the ERK signaling pathway has been shown to reduce inflammation and improve insulin sensitivity, making it a potential therapeutic target for T2DM. Drugs that modulate the ERK signaling pathway, such as resveratrol and PD98059, have demonstrated anti-inflammatory benefits in T2DM treatment [20]. These agents not only help control hyperglycemia but also alleviate the associated inflammation. In this study, we propose that Nok may exert its anti-T2DM effects through the modulation of the ERK signaling pathway, potentially by inhibiting inflammation that exacerbates insulin resistance. Our findings provide a foundation for further exploration of the molecular mechanisms by which Nok regulates the ERK pathway, potentially offering a novel strategy for developing therapeutic drugs for T2DM.
To explore potential molecular targets of Nok in T2DM, we used network pharmacology. Among the top 10 predicted targets, ERK1/2 emerged as a key target. Recent studies have identified the ERK signaling pathway as an important mechanism in the treatment of insulin resistance and T2DM. Inhibiting ERK has been shown to reduce obesity and prevent insulin resistance. Additionally, studies have demonstrated that diabetogenic factors can activate ERK, disrupting insulin signaling. Consequently, inhibiting ERK may represent a novel strategy for T2DM therapy. We confirmed Nok’s inhibitory effect on ERK1/2 both in vivo and in vitro, supporting the hypothesis that Nok exerts its effects on T2DM through ERK pathway inhibition. However, further research is needed to fully understand Nok’s molecular mechanisms, and these will be the focus of future investigations.
4. Materials and Methods
4.1. Reagents
Nootkatone (Nok) and metformin (Met) were purchased from Sigma (Cat No: W316620). The ACCU-CHEK glucose meter and test strips were sourced from Roche Diagnostics (Shanghai) Co., Ltd. Enzyme-linked immunosorbent assay (ELISA) kits for mouse insulin were procured from the Institute of Biological Engineering. Alanine aminotransferase (ALT), aspartate aminotransferase (AST), low-density lipoprotein (LDL), and triglyceride (TG) assay kits were purchased from Beijing Jiuqiang Biological Technology Co., Ltd. D- (+)-glucose was obtained from Sigma (USA). Recombinant human insulin injection was sourced from Beyotime Biotechnology. ERK1/2 and p-ERK1/2 (Thr202/Tyr204) Polyclonal antibody were purchased from proteintech (Cat No: 51068-1-AP and 28733-1-AP). AMPK, p-AMPK, ACC and p-ACC antibody were purchased from Cell Signaling Technology (Cat NO: 2532S, 50081T, 3676T and 11818T). DMEM/F12, penicillin-streptomycin solution and fetal bovine serum were purchased from Gibco (Cat NO: C11330500BT, 15140122 and 160000-044).
4.2. Experimental Animals
Six-week-old male db/db and C57BL6/KsJ mice were provided by GemPharmatech Co., Ltd. (Nanjing, China). The animals were housed in a humidity-controlled room on a 12-hour light/dark cycle with free access to standard food and water for three days. Afterward, db/db mice were fed a high-fat diet to induce diabetes. Fasting blood glucose (FBG) levels above 11.1 mM were considered indicative of successful diabetic status. The diabetic db/db mice were then randomly divided into five groups of six animals each: a model group, a positive control group, and two groups receiving different doses of Nok. Six C57BL6/KsJ mice were used as the normal control group. The normal control and model groups were given equal volumes of saline solution, while the positive control group was treated with metformin at 200 mg/kg/day, and the Nok groups were administered Nok at 25 or 100 mg/kg/day via oral gavage. Body weight, food intake, water intake, and FBG were measured weekly.
After 4 weeks of treatment, all animals were fasted for 12 hours, and blood samples were collected from the tail to measure fasting blood glucose (FBG). Blood was then collected from the eyes of all animals into 1.5 ml centrifuge tubes, allowed to stand at room temperature for 2 hours, and centrifuged at 3000 rpm for 15 minutes at 4°C. The serum was separated, aliquoted, and stored at -80°C. Serum levels of alanine aminotransferase (ALT), aspartate aminotransferase (AST), low-density lipoprotein (LDL), and triglycerides (TG) were measured using corresponding assay kits. Insulin levels in the serum were determined using an ELISA kit. The homeostasis model assessment of insulin resistance (HOMA-IR) was calculated using the formula: FBG (mM) × insulin (mIU/L) / 22.5. The animals were subsequently euthanized, and the liver, kidney, epididymal fat, and pancreas were dissected and weighed. Tissue samples were divided into two parts: one was frozen in liquid nitrogen for further analysis, and the other was fixed in 10% formalin for pathological examination.
All animal experiments were conducted in strict accordance with the “National Institutes of Health Guide for the Care and Use of Laboratory Animals.” The experimental protocol was approved by the Medical Ethics Committee of Hainan Medical University (No. SYXK-2017-0013).
4.3. Oral Glucose Tolerance Test (OGTT) and Insulin Tolerance Test (ITT)
OGTT and ITT experiments were conducted during the 4th week of treatment as our previous methods [21].
After 12 hours of fasting, the fasting blood glucose (FBG) of all animals was measured as the 0-time point value. A 20% glucose solution was prepared and administered to all animals by oral gavage at a dose of 2 g/kg. Blood glucose levels were measured at 30, 60, 120, and 180 minutes after glucose administration. The blood glucose data were recorded, and the OGTT curve was plotted.
All animals were fasted for 6 hours in the morning, and blood glucose levels were measured as the 0-time point value. Recombinant human insulin was administered via intraperitoneal injection at a dose of 0.5 IU/kg. Blood glucose levels were measured at 30, 60, 90, and 120 minutes post-insulin injection, and the ITT curve was plotted.
The area under the curve (AUC) for both OGTT and ITT was calculated using GraphPad Prism 8 software.
4.4. HE Staining and Histopathological Examination
All mice were euthanized by cervical dislocation, and the liver and pancreas were collected. The tissues were fixed in 10% formalin, embedded in paraffin, and sectioned at 4 μm thickness. The sections were stained with hematoxylin and eosin (HE) and photographed. The extent of hepatic steatosis was scored on a scale of 0 to 5 based on the severity, with the following criteria: 0 = less than 5% of hepatocytes affected; 1 = 5%-25% of hepatocytes affected; 2 = 25%-50% of hepatocytes affected; 3 = 50%-75% of hepatocytes affected; 4 = more than 75% of hepatocytes affected. Pancreatic histopathological changes were scored based on the extent of tissue damage and lesion severity on a scale of 0 to 4: 0 = no lesions; 1 = less than 25% of the pancreatic tissue affected; 2 = 25%-50% of the tissue affected; 3 = 50%-75% of the tissue affected; 4 = more than 75% of the tissue affected.
4.5. Drug Database and Related Target Prediction
The molecular formula and molecular weight data of Nok were obtained from the PubChem database. The target genes of Nok were predicted using the SwissTargetPrediction database and designated as the hypothetical targets of Nok. These hypothetical targets are considered as drug-related genes.
4.6. Pridiction of T2DM Related Targets from Oline Database
Various gene information related to T2DM was obtained from the GeneCards database, which provides comprehensive data on human genes and genetic disorders. The keywords used to search this database were “Type II diabetes” and “T2DM”, and the results were exported online.
4.7. Cell Culture and Treatment
We used AML-12 cells, with DMEM/F12 as the culture medium, supplemented with 10% fetal bovine serum (FBS), 1% ITS Liquid Media Supplement (100×), and 1% penicillin-streptomycin solution. After two stable passages of the AML-12 cells, a cell suspension was prepared and seeded into culture plates and cultured for 24 hours. NOK dissolved in dimethyl sulfoxide (DMSO) was then added for co-incubation for 24 hours. Subsequent assays were performed.
4.8. Cytotoxicity and Glucose Consumption Assay
Cell culture and treatment were carried out as described above, with three replicates for each drug treatment. An equal volume of DMSO (volume ratio of 0.1%) was added to the control group. After 24 hours of drug treatment, the supernatant was collected to measure glucose consumption. The culture medium was completely removed, and pre-prepared CCK-8 solution was added to the cells, followed by incubation at 37°C for 1 hour. The OD value at 450 nm was measured using a microplate reader to assess cell viability. Glucose consumption was calculated by subtracting the glucose level in the medium from that of cells treated with the drug or an equal volume of DMSO (volume ratio of 0.1%) for 24 hours. After drug treatment, the glucose concentration in the cell supernatant was measured using a glucose assay kit.
4.9. Western Blot
Total protein was extracted from AML-12 and liver tissue using RIPA lysis buffer containing 1× protease and 1× phosphatase inhibitors. Proteins were separated using SDS-PAGE electrophoresis system and transferred to PVDF membranes. 5% skim milk was used to block the membranes at 4°C overnight. After blocking, the membranes were incubated with the primary antibodies (diluted 1:1,000 in 5% skim milk/1×TBST) for 2h at room temperature, washed with 1×TBST and then incubated with the secondary antibodies of the same source for 1 h. The membranes were subsequently washed with 1×TBST again and then visualized using ECL detection kit.
4.10. Statistical Analysis
Results were expressed as mean ± S.E.M., with n=6. Statistical analyses were performed using GraphPad Prism 8 software. Comparisons between two groups were conducted using the Student ’s t-test, while differences among multiple groups were analyzed using one-way ANOVA. P <0.05 was considered statistically significant.
5. Conclusion
In conclusion, Nok may improve insulin resistance, glucose and lipid metabolism disorders, and liver damage in T2DM by targeting both the AMPK and ERK signaling pathways. Network pharmacology helped identify potential molecular targets, which were validated in vivo and in vitro.
Author Contribution
Conceptualization, Y. Z. and W. Z.; Data curation, L. Z., and M. C.; Funding acquisition, Y. Z. and W. Z.; Investigation, Y. L., L. Z., M. C., R. L., Y. Y., L. Q., J. L. and X. Z.; Methodology, Y. Z., L. Z. and M. C.; Project administration, Y. Z., Y. Z. and W. Z.; Validation, Y. Z; Writing – original draft, Y. L.; Writing – review & editing, X. Z., L. Z., R. L. and L. Q. All authors have read and agreed to the published version of the manuscript.
Delararations: Ethics Approval and Consent to Participate
All animal experiments were conducted in strict accordance with the “National Institutes of Health Guide for the Care and Use of Laboratory Animals.” The experimental protocol was approved by the Medical Ethics Committee of Hainan Medical University (No. SYXK-2017-0013).
Data Availability Statement
The original contributions presented in the study are included in the article; further inquiries can be directed to the corresponding author(s).
Consent for Publication
Not applicable.
Funding
The Hainan provincial Nature Science Foundation of China (822RC694), the Hainan provincial Key Research and Development Projects (ZDYF2024SHFZ113, ZDYF2022SHFZ074 and ZDYF2022SHFZ037), the Nature Science Foundation of China (82260304, 82204476 and 82060778), the Project Supported by the Hainan Province Clinical Medical Center (QWYH202175), the Excellent Talent Team of Hainan Province (QRCBT202121), and the College Students’ Innovative Entrepreneurial Training Plan Program (202311810011, 202311810025) all provided financial support for this work.
Conflicts of Interest
The authors declared no conflicts of interest.
References
- Werfalli M, Raubenheimer PJ, Engel M, et al. The effectiveness of peer and community health worker-led self-management support programs for improving diabetes health-related outcomes in adults in low- and-middle-income countries: a systematic review. Syst Rev. 2020, 9, 133.
- Hu C, Jia W. Diabetes in China: Epidemiology and Genetic Risk Factors and Their Clinical Utility in Personalized Medication. Diabetes. 2018, 67, 3–11.
- Sanchez-Rangel E, Inzucchi SE. Metformin: clinical use in type 2 diabetes. Diabetologia. 2017, 60, 1586–1593.
- Wang J, Wang X, Ma T, Xie Y. Research progress on Alpinia oxyphylla in the treatment of diabetic nephropathy. Front Pharmacol. 2024, 15, 1390672. Published 2024 Jun 14.
- Zhang Q, Zheng Y, Hu X, et al. Ethnopharmacological uses, phytochemistry, biological activities, and therapeutic applications of Alpinia oxyphylla Miquel: A review. J Ethnopharmacol. 2018, 224, 149-1688.
- Deng X, Ye Z, Duan J, et al. Complete pathway elucidation and heterologous reconstitution of (+)-nootkatone biosynthesis from Alpinia oxyphylla. New Phytol. 2024, 241, 779–792.
- Hung LVM, Moon JY, Ryu JY, Cho SK. Nootkatone, an AMPK activator derived from grapefruit, inhibits KRAS downstream pathway and sensitizes non-small-cell lung cancer A549 cells to adriamycin. Phytomedicine. 2019, 63, 153000.
- Yan T, Li F, Xiong W, et al. Nootkatone improves anxiety- and depression-like behavior by targeting hyperammonemia-induced oxidative stress in D-galactosamine model of liver injury. Environ Toxicol. 2021, 36, 694–706.
- Herzig S, Shaw RJ. AMPK: guardian of metabTolism and mitochondrial homeostasis. Nat Rev Mol Cell Biol. 2018, 19, 121–135.
- Carling D. AMPK signalling in health and disease. Curr Opin Cell Biol. 2017, 45:31-37. [CrossRef]
- Trefts E, Shaw RJ. AMPK: restoring metabolic homeostasis over space and time. Mol Cell. 2021, 81, 3677–3690.
- Yonamine CY, Pinheiro-Machado E, Michalani ML, et al. Resveratrol Improves Glycemic Control in Type 2 Diabetic Obese Mice by Regulating Glucose Transporter Expression in Skeletal Muscle and Liver. Molecules 2017, 22, 1180.
- Yong Z, Ruiqi W, Yanan Y, et al. Laurolitsine ameliorates type 2 diabetes by regulating the hepatic LKB1-AMPK pathway and gut microbiota. Phytomedicine. 2022, 106, 154423.
- Lin SC, Hardie DG. AMPK: Sensing Glucose as well as Cellular Energy Status. Cell Metab. 2014, 27, 299–313.
- Fullerton MD, Galic S, Marcinko K, et al. Single phosphorylation sites in Acc1 and Acc2 regulate lipid homeostasis and the insulin-sensitizing effects of metformin. Nat Med. 2013, 19, 1649–1654.
- Zhang L, Zhou X, Chen H, et al. Mulberry extract ameliorates T2DM-related symptoms via AMPK pathway in STZ-HFD-induced C57BL/6J mice. J Ethnopharmacol. 2023, 313:116475.
- Xiang HC, Lin LX, Hu XF, et al. AMPK activation attenuates inflammatory pain through inhibiting NF-κB activation and IL-1β expression. J Neuroinflammation. 2019, 16, 34.
- Vahidi Ferdowsi P, Ahuja KDK, Beckett JM, Myers S. TRPV1 Activation by Capsaicin Mediates Glucose Oxidation and ATP Production Independent of Insulin Signalling in Mouse Skeletal Muscle Cells. Cells. 2021, 10, 1560.
- Lontchi-Yimagou E, Sobngwi E, Matsha TE, Kengne AP. Diabetes mellitus and inflammation. Curr Diab Rep. 2013, 13, 435–444.
- Yu L, Xu M, Yan Y, et al. ZFYVE28 mediates insulin resistance by promoting phosphorylated insulin receptor degradation via increasing late endosomes production. Nat Commun. 2023, 14, 6833.
- Ahmadzadeh AM, Aliabadi MM, Mirheidari SB, et al. Beneficial effects of resveratrol on diabetes mellitus and its complications: focus on mechanisms of action. Naunyn Schmiedebergs Arch Pharmacol. Published online October 24, 2024. [CrossRef]
- Yong Z, Zibao H, Zhi Z, et al. Nootkatone, a Sesquiterpene Ketone From Alpiniae oxyphyllae Fructus, Ameliorates Metabolic-Associated Fatty Liver by Regulating AMPK and MAPK Signaling. Front Pharmacol. 2022, 13, 909280.
Figure 1.
The Effects of Nok on Fasting Blood Glucose, Blood Lipids, and Body Weight in Mice. (A) Fasting Blood Glucose (FBG)(B) Body Weight(C) Low-Density Lipoprotein (LDL)(D) Triglycerides (TG)All data are presented as mean ± S.E.M., with n = 6 mice per group. ***P < 0.001 vs Normal, #P < 0.05 vs db/db model.
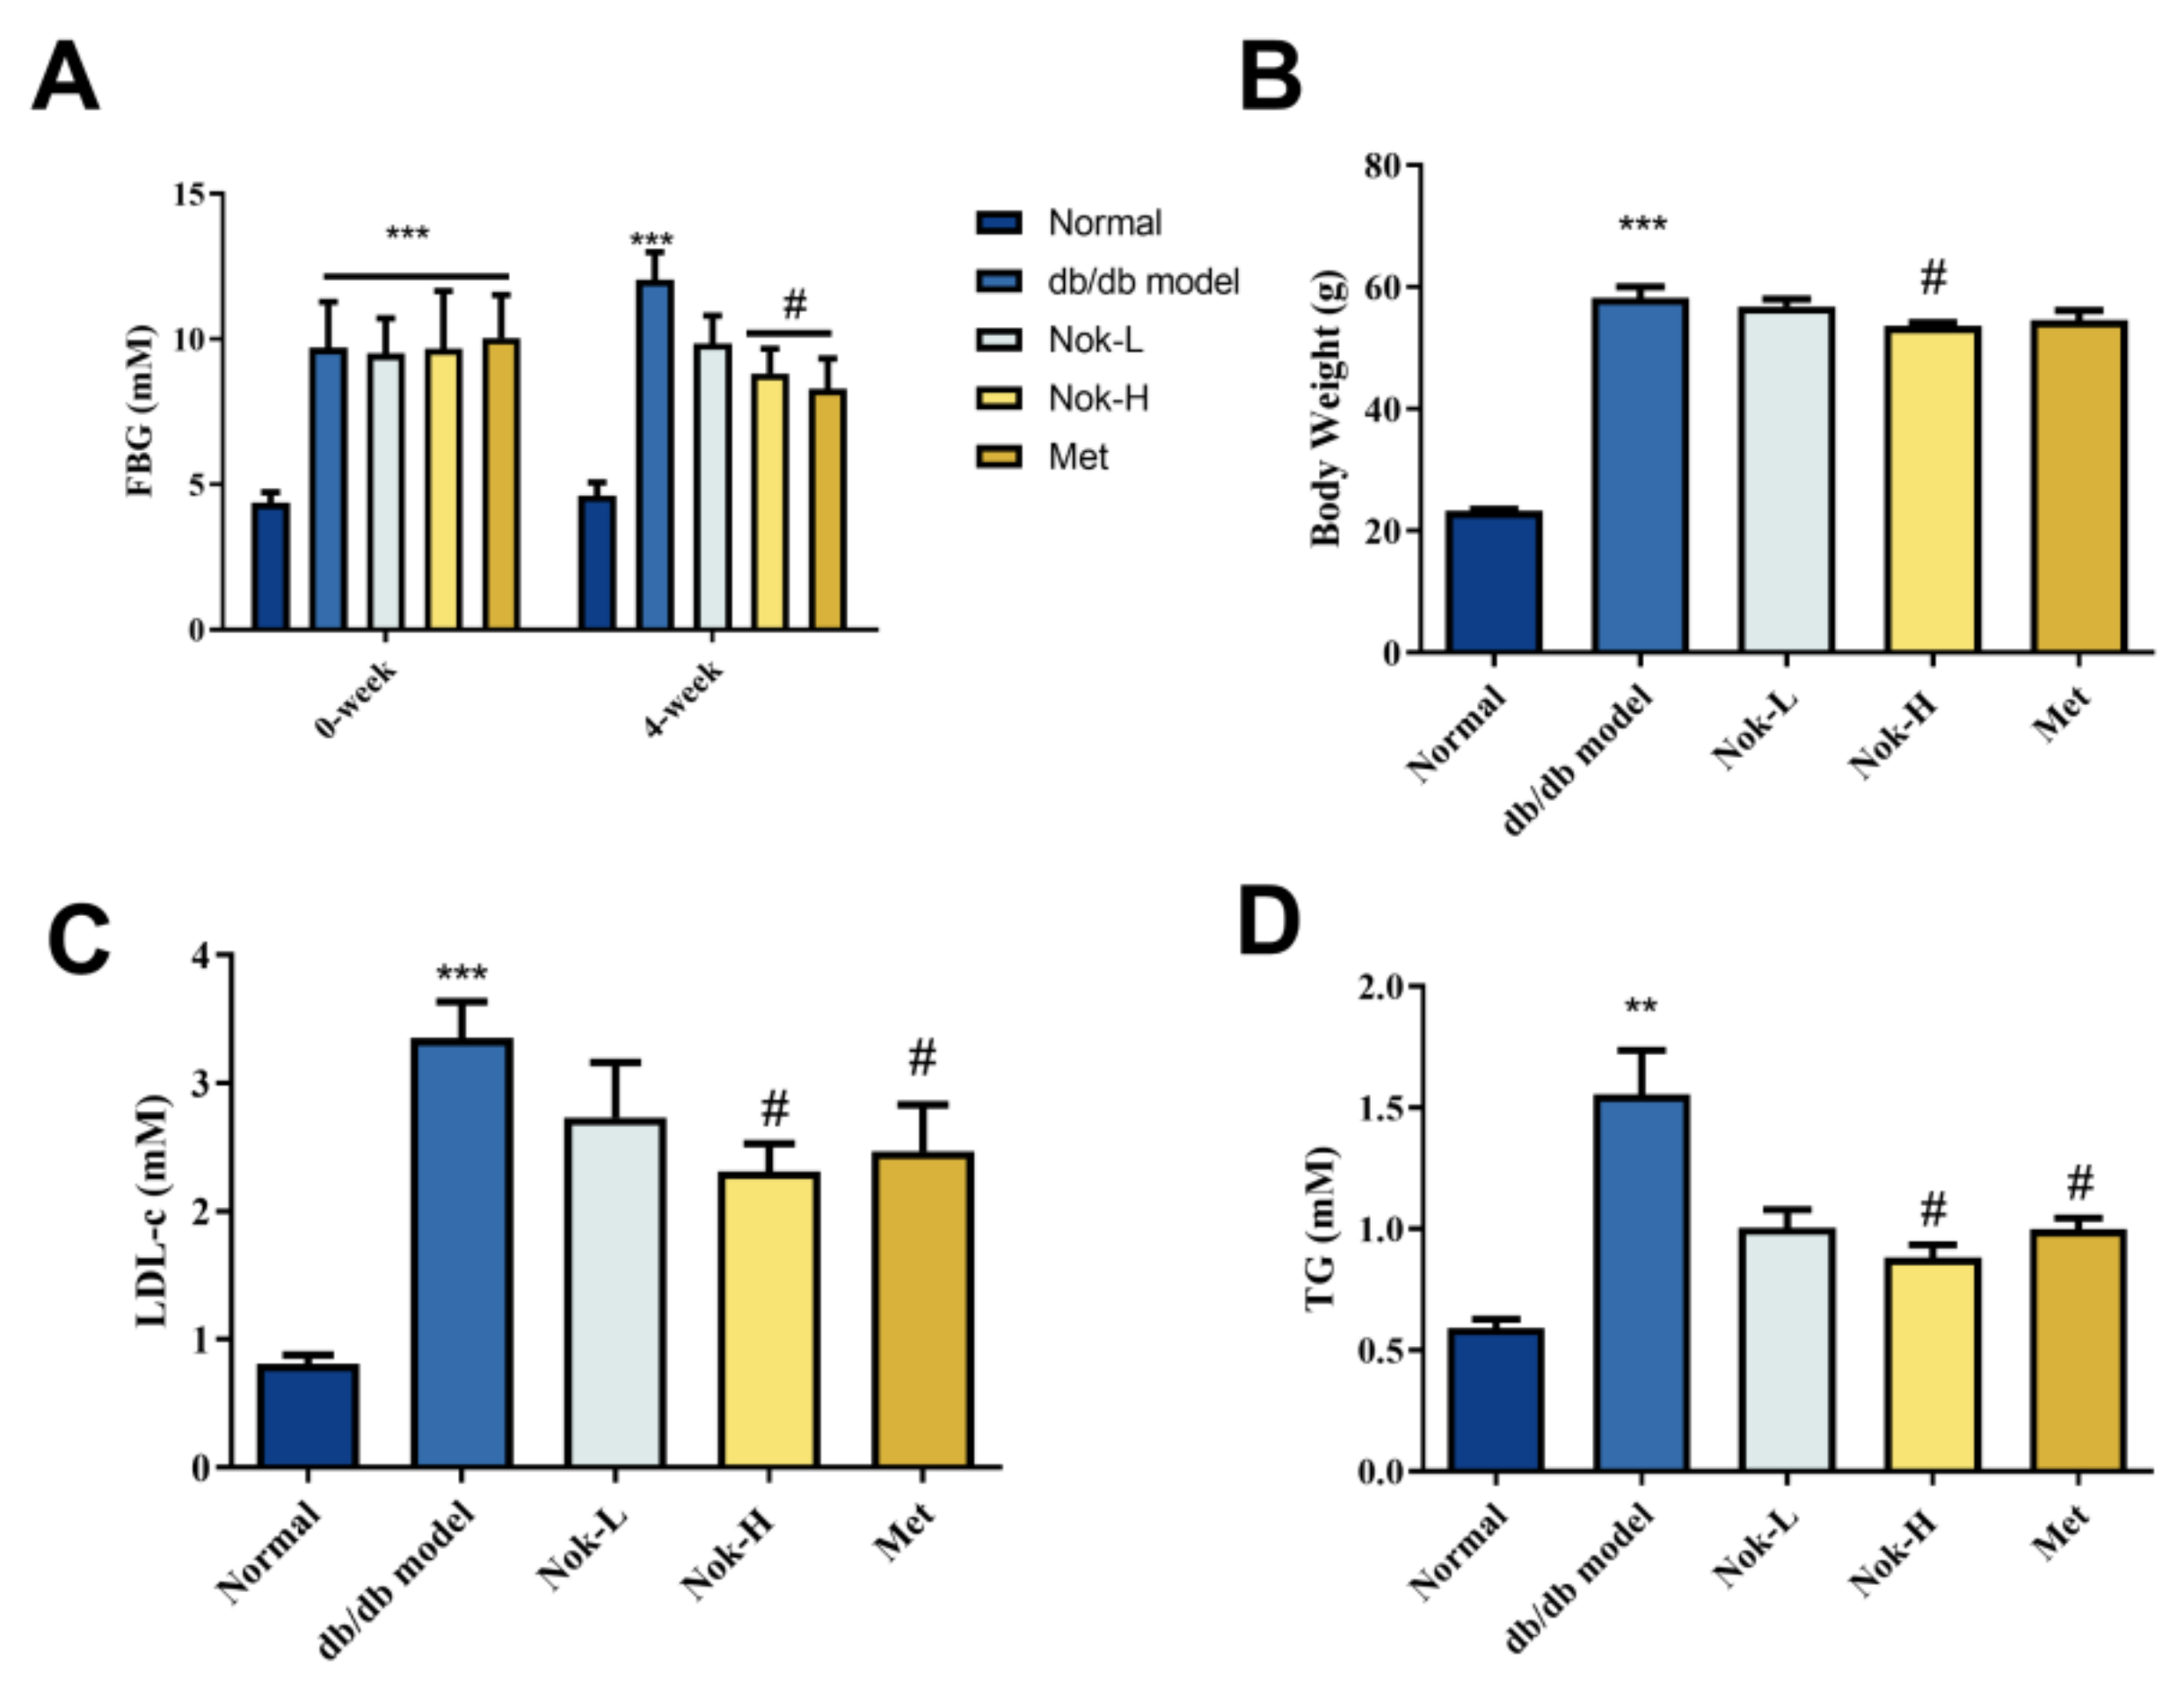
Figure 2.
Effect of Nok on Glucose Tolerance and Insulin Resistance in db/db Diabetic Mice. (A) Oral Glucose Tolerance Test (OGTT); (B) Area Under the Curve (AUC) for OGTT; (C) Insulin Tolerance Test (ITT); (D) AUC for ITT; (E) Serum Insulin Concentration; (F) Homeostasis Model Assessment of Insulin Resistance (HOMA-IR). All results are expressed as mean ± S.E.M., n=6. ***P < 0.001 vs Normal, #P < 0.05 or ##P<0.01 vs db/db model.
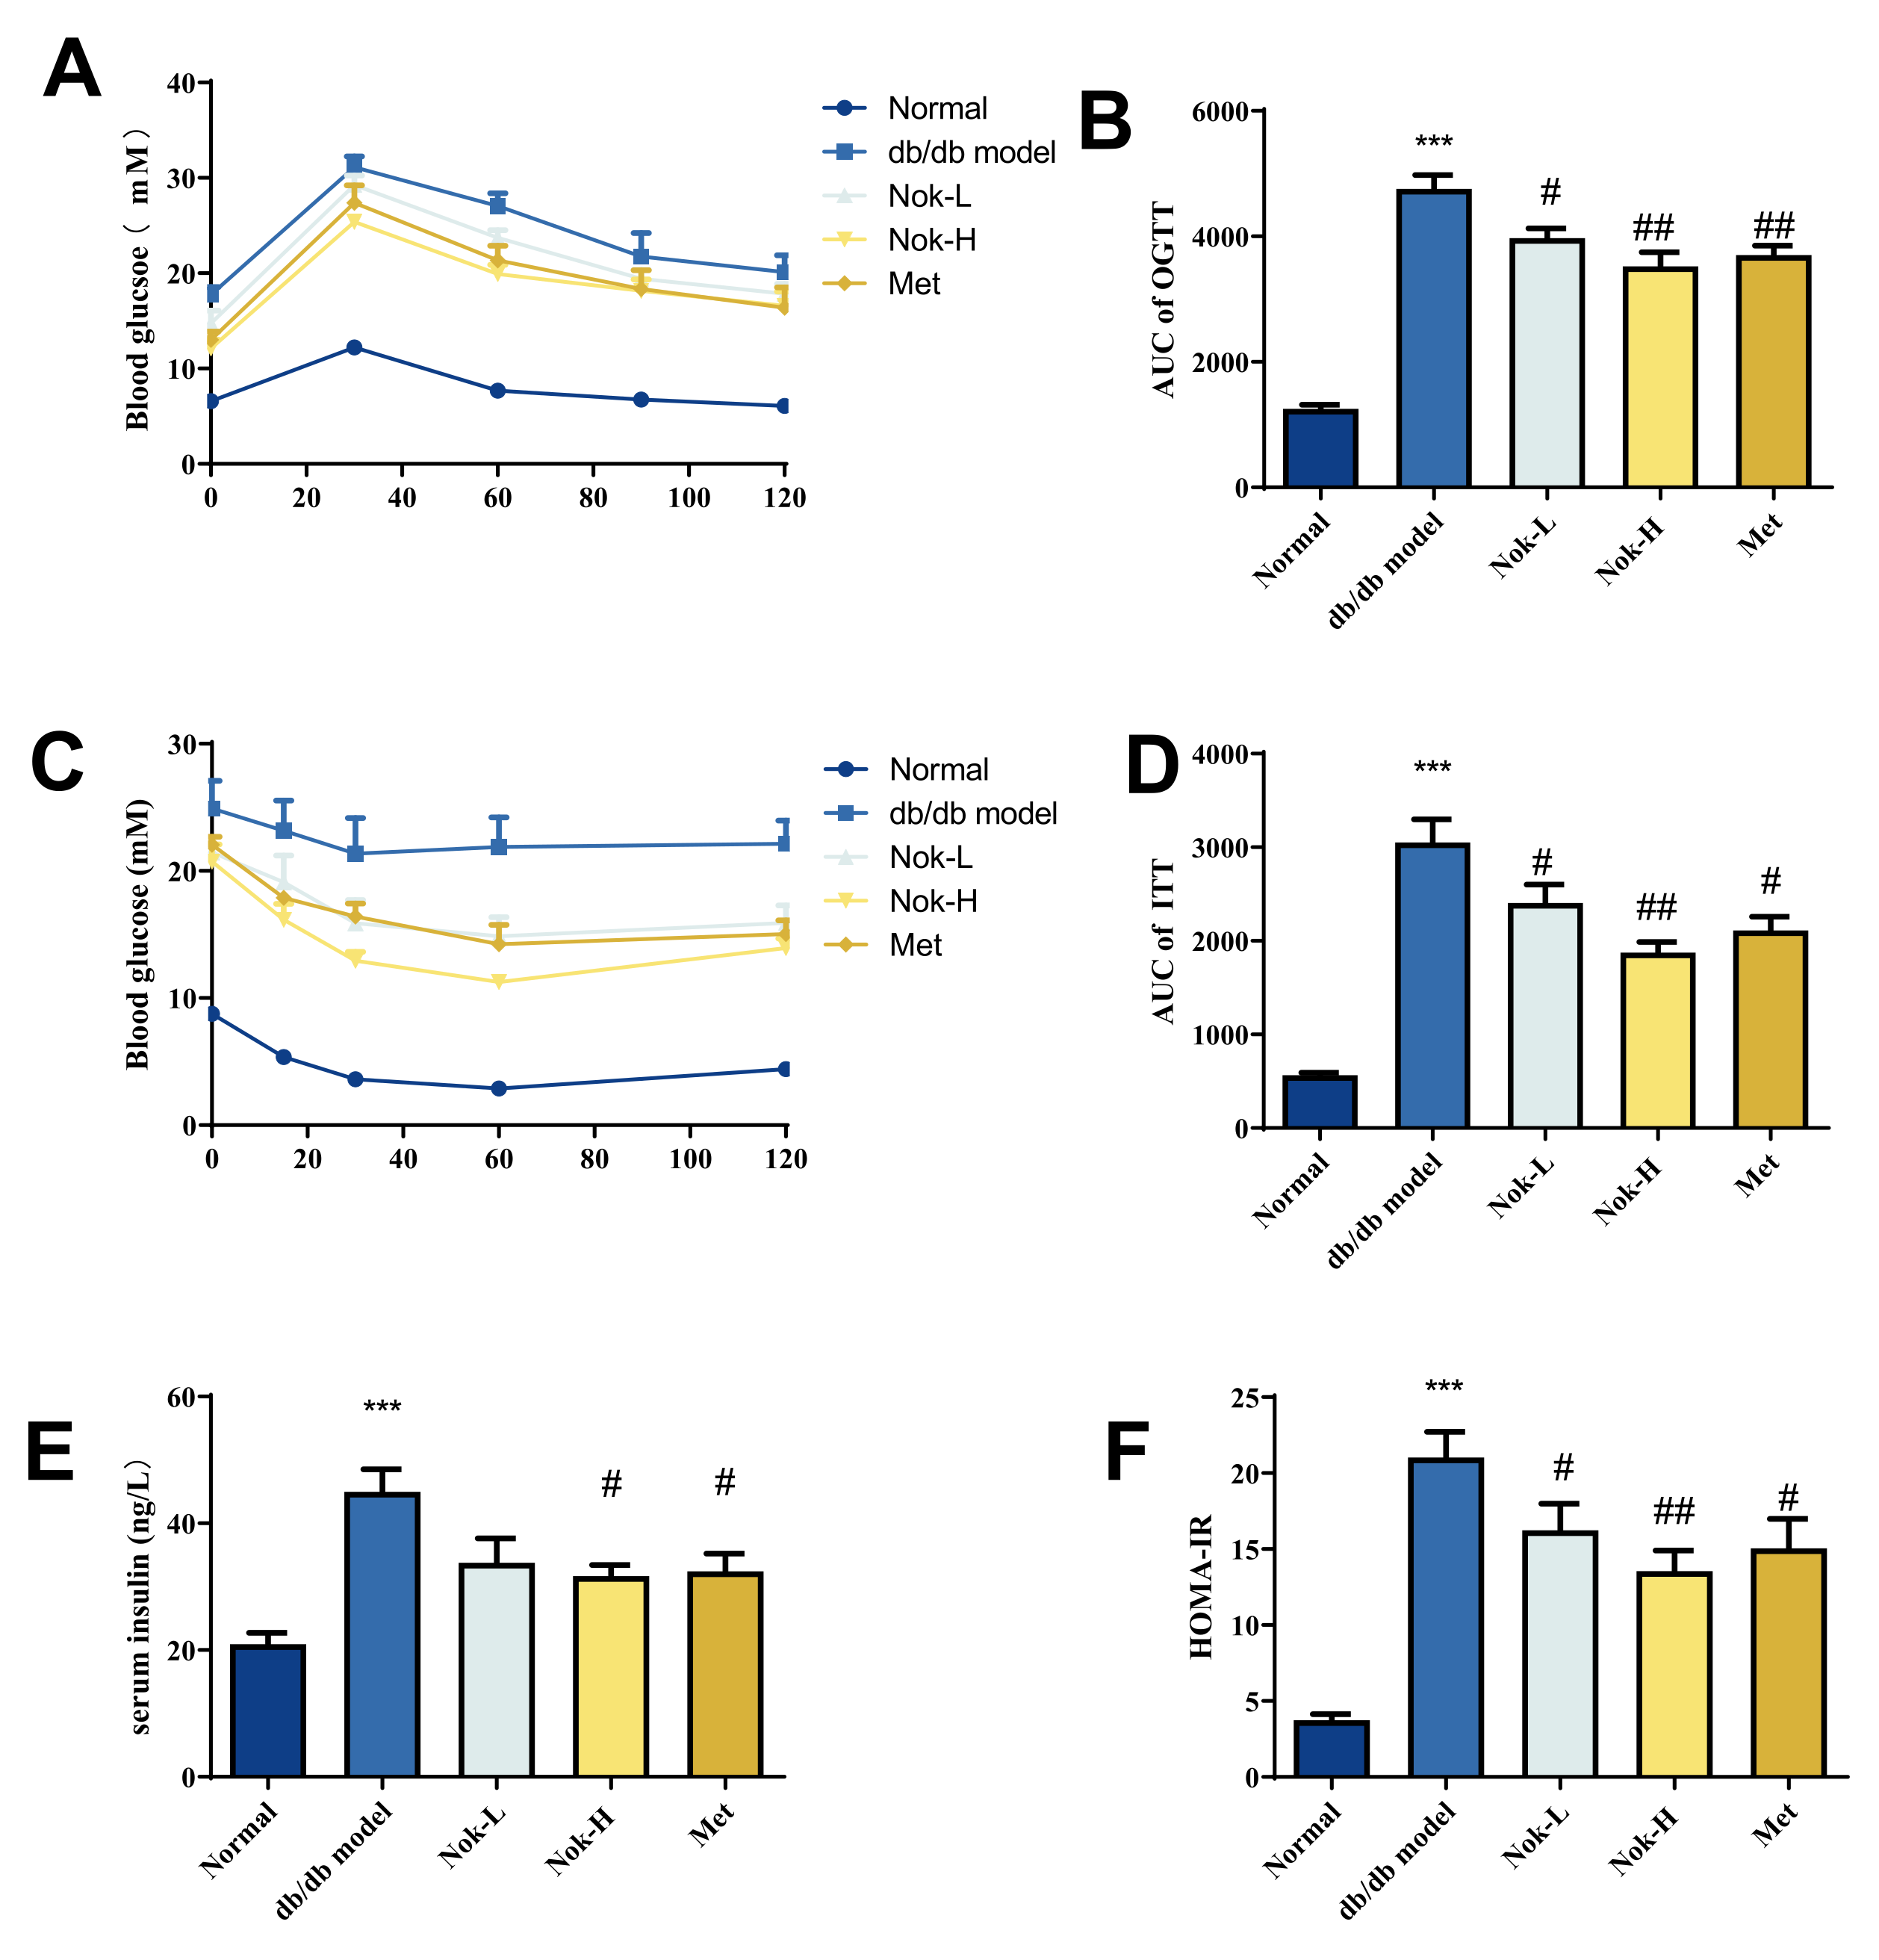
Figure 3.
Effect of Nok on Serum Levels of Inflammatory Factors in Mice. (A) IL-1β; (B) IL-18; (C) TNFα; (D) IL-6. All results are presented as mean ± S.E.M., n = 6. **P < 0.001 or *P < 0.05 vs. Normal, #P < 0.05 or ##P < 0.01 vs. db/db model.
Figure 3.
Effect of Nok on Serum Levels of Inflammatory Factors in Mice. (A) IL-1β; (B) IL-18; (C) TNFα; (D) IL-6. All results are presented as mean ± S.E.M., n = 6. **P < 0.001 or *P < 0.05 vs. Normal, #P < 0.05 or ##P < 0.01 vs. db/db model.
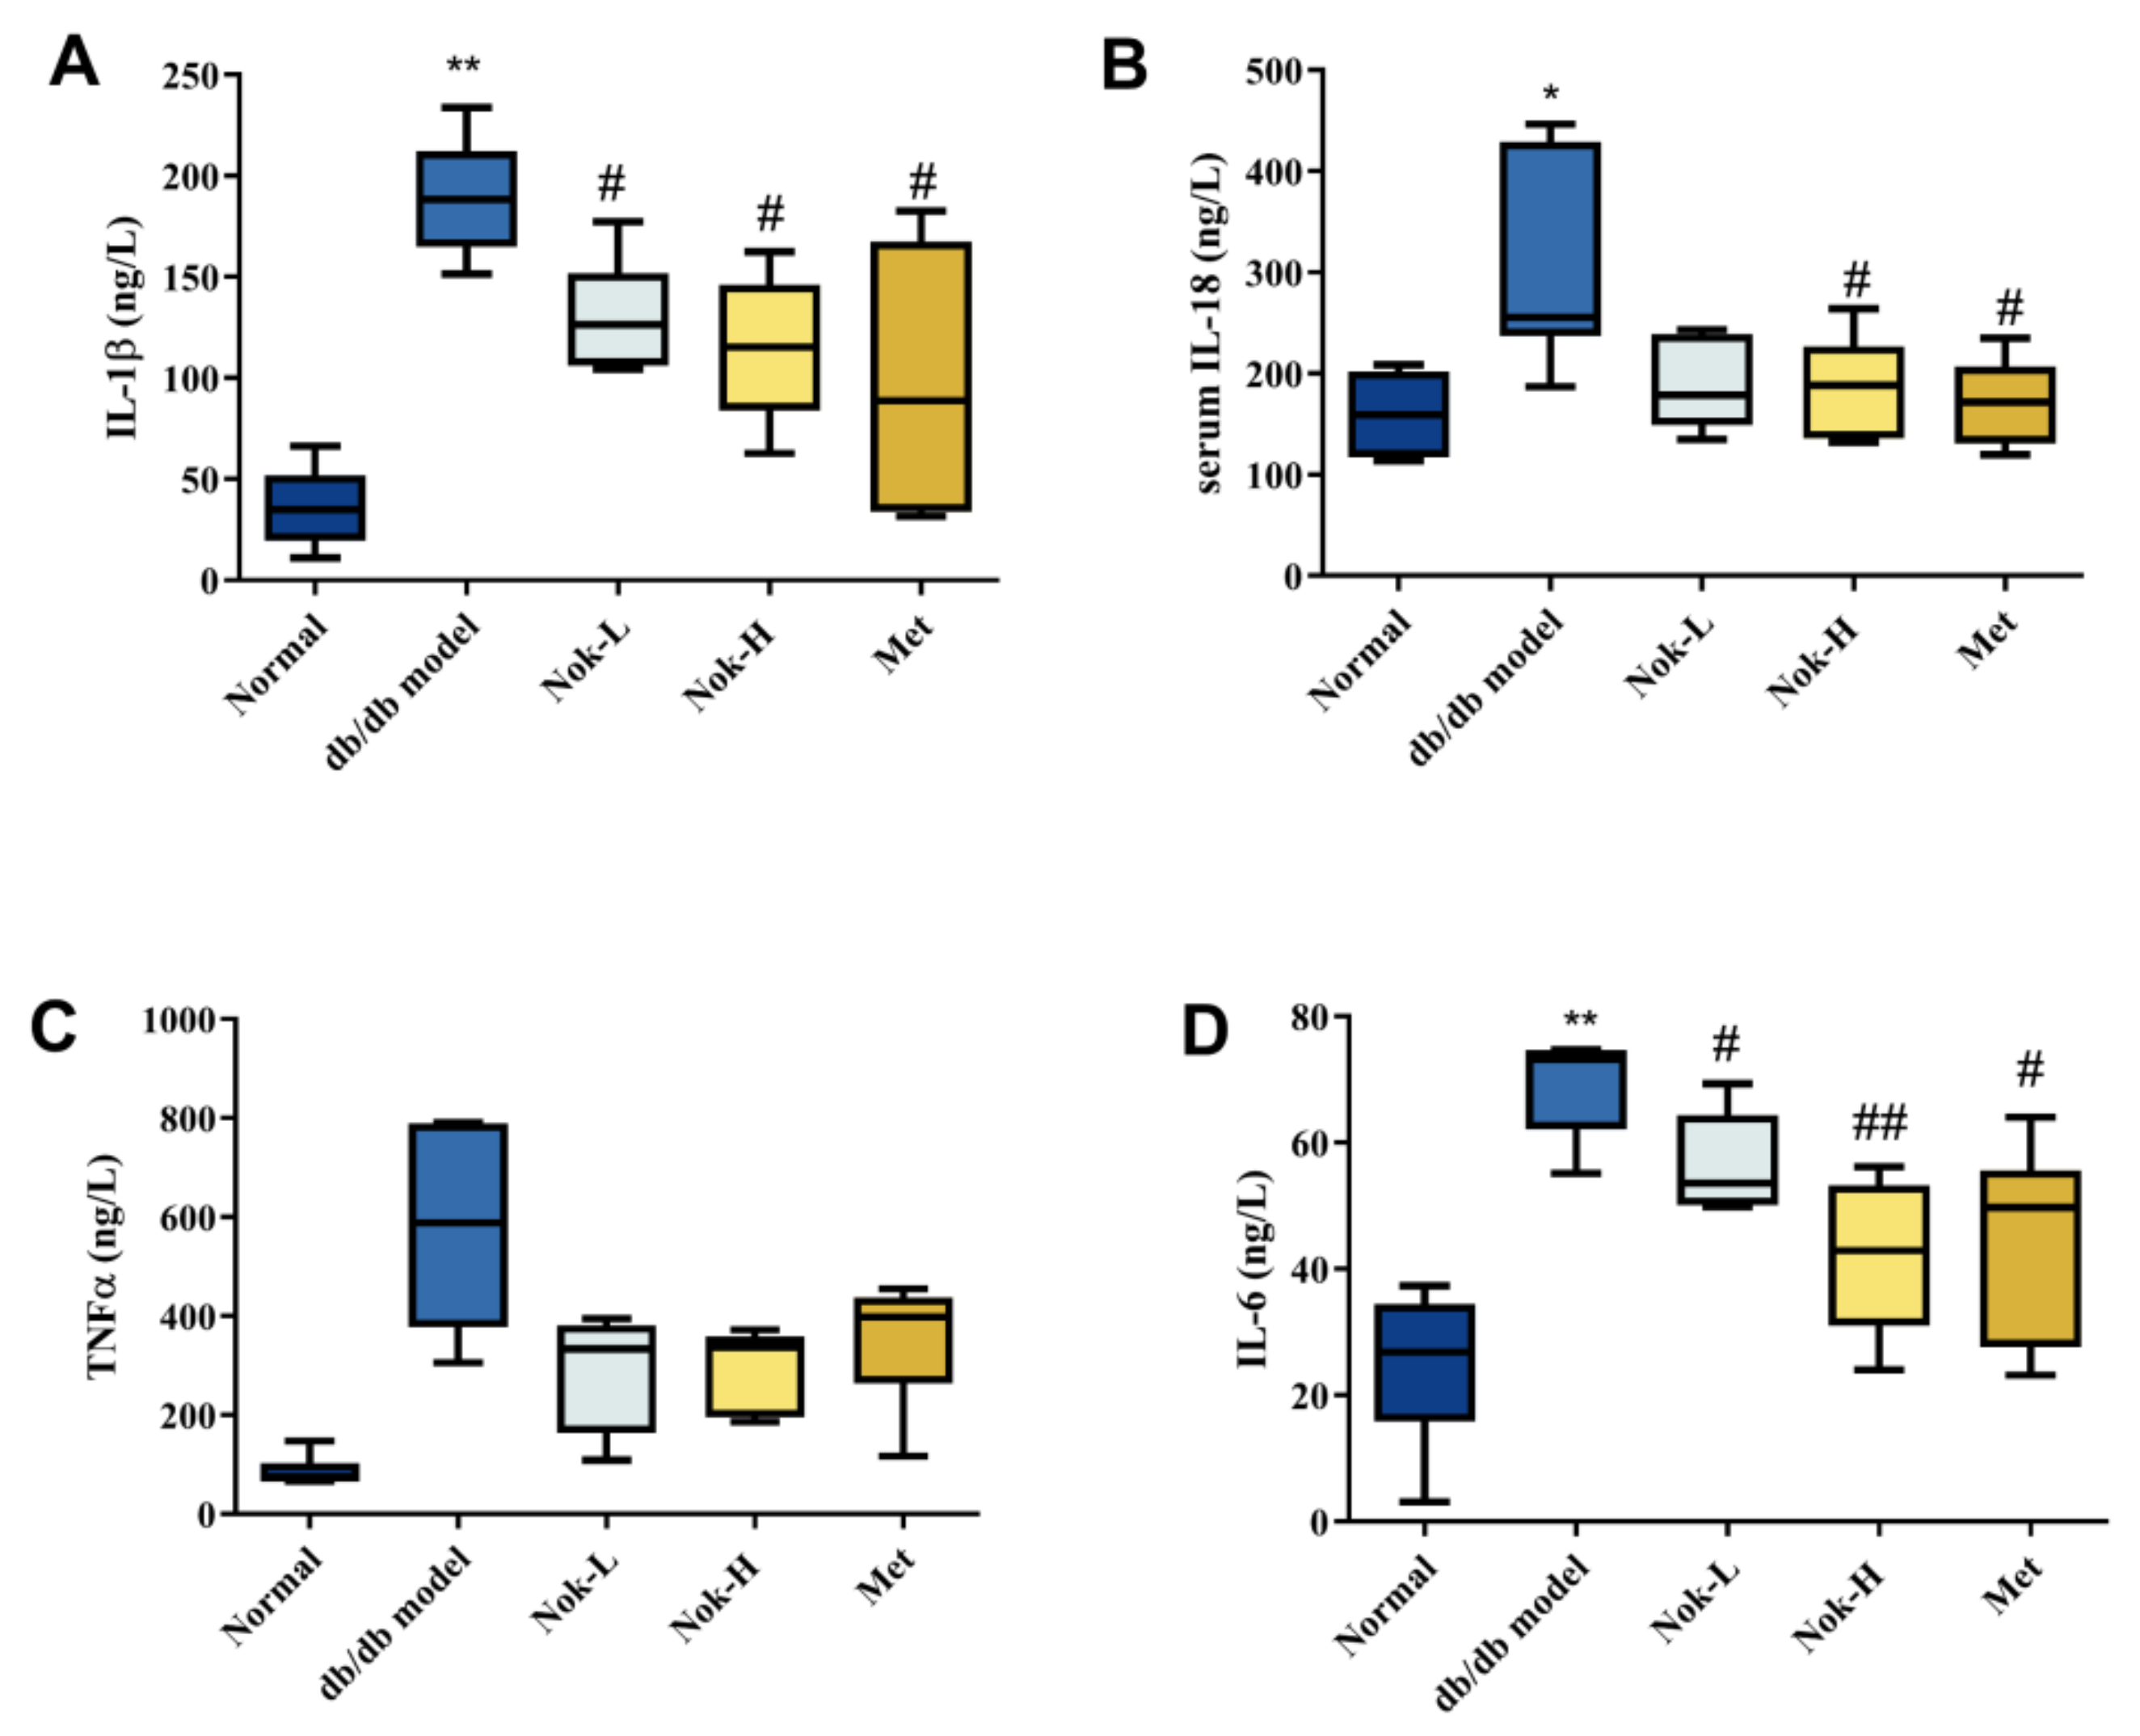
Figure 4.
Effect of Nok on Liver Function in Mice. (A) Serum ALT levels; (B) Serum AST levels; (C) Liver mass; (D) Liver index. All results are expressed as mean ± S.E.M., n = 6. ,**P < 0.001 or ***P < 0.001 vs Normal, #P < 0.05 or ##P<0.01 vs db/db model.
Figure 4.
Effect of Nok on Liver Function in Mice. (A) Serum ALT levels; (B) Serum AST levels; (C) Liver mass; (D) Liver index. All results are expressed as mean ± S.E.M., n = 6. ,**P < 0.001 or ***P < 0.001 vs Normal, #P < 0.05 or ##P<0.01 vs db/db model.
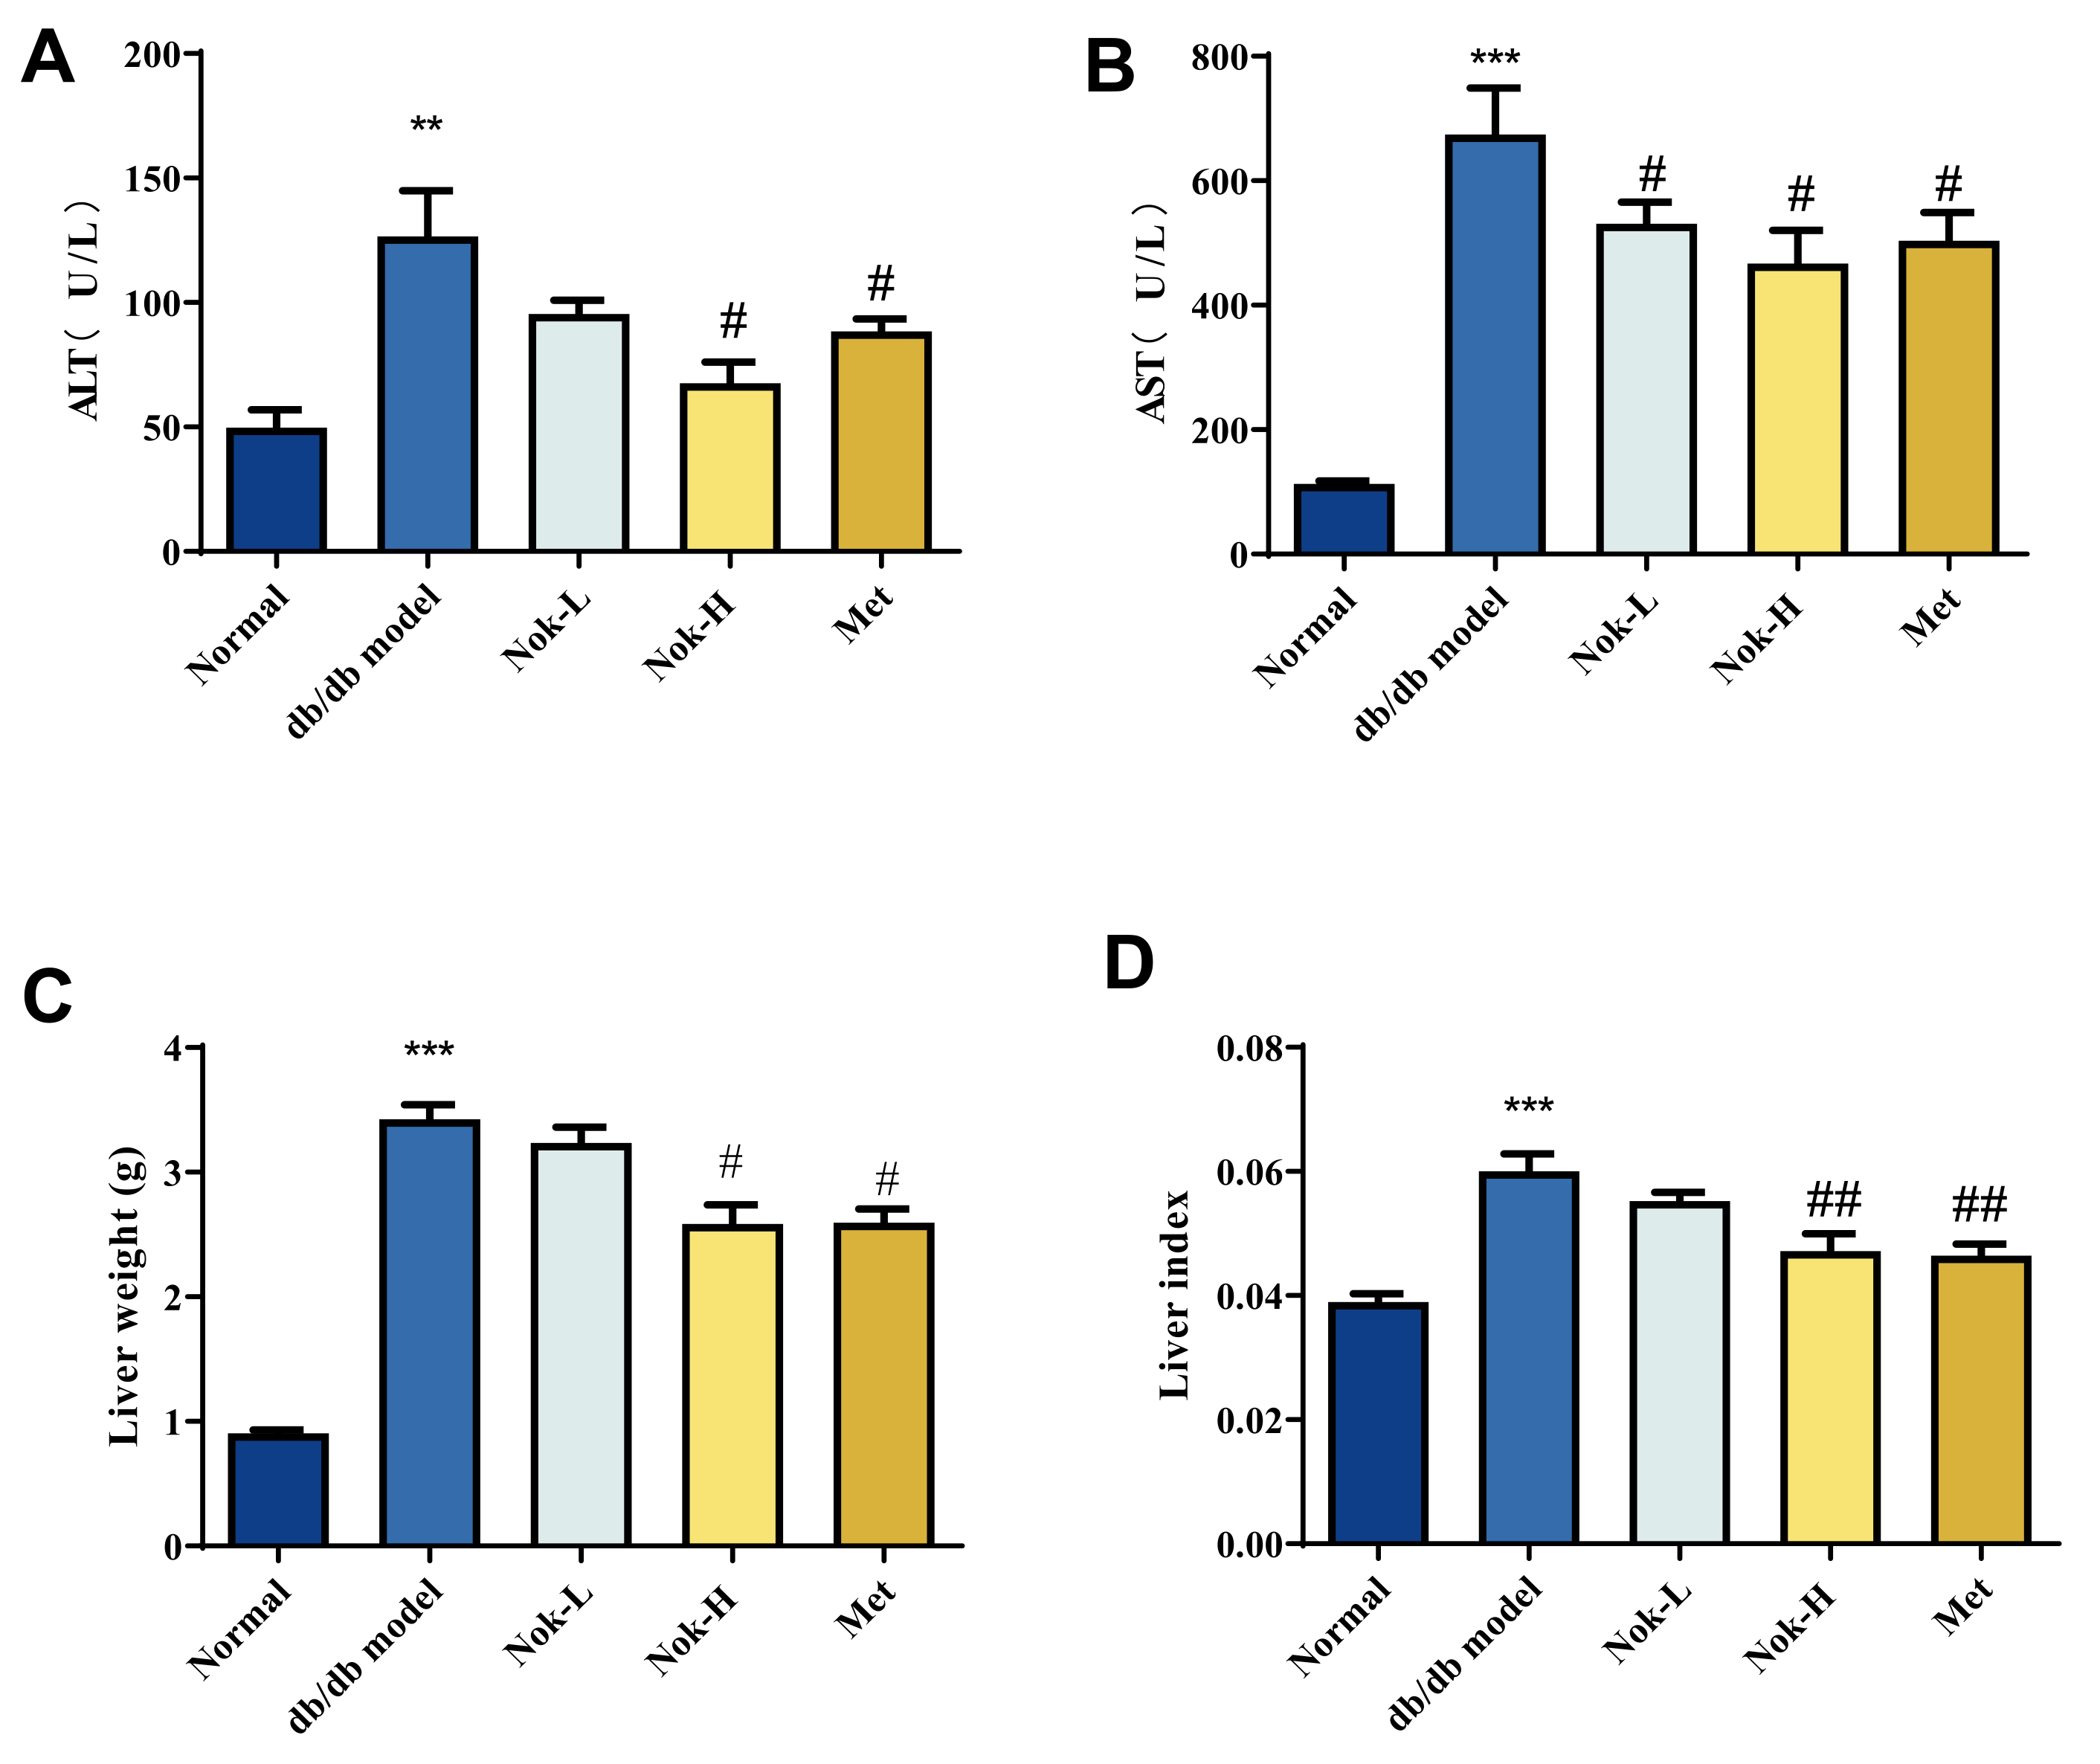
Figure 5.
Effect of Nok on Pathological Changes in Liver Tissue of db/db Diabetic Mice. (A) HE staining of liver tissue; (B) Pathological scoring results. Data are presented as mean ± SEM, n = 6. **P < 0.001 vs. Normal, #P < 0.05 or ##P < 0.01 vs. db/db model.
Figure 5.
Effect of Nok on Pathological Changes in Liver Tissue of db/db Diabetic Mice. (A) HE staining of liver tissue; (B) Pathological scoring results. Data are presented as mean ± SEM, n = 6. **P < 0.001 vs. Normal, #P < 0.05 or ##P < 0.01 vs. db/db model.
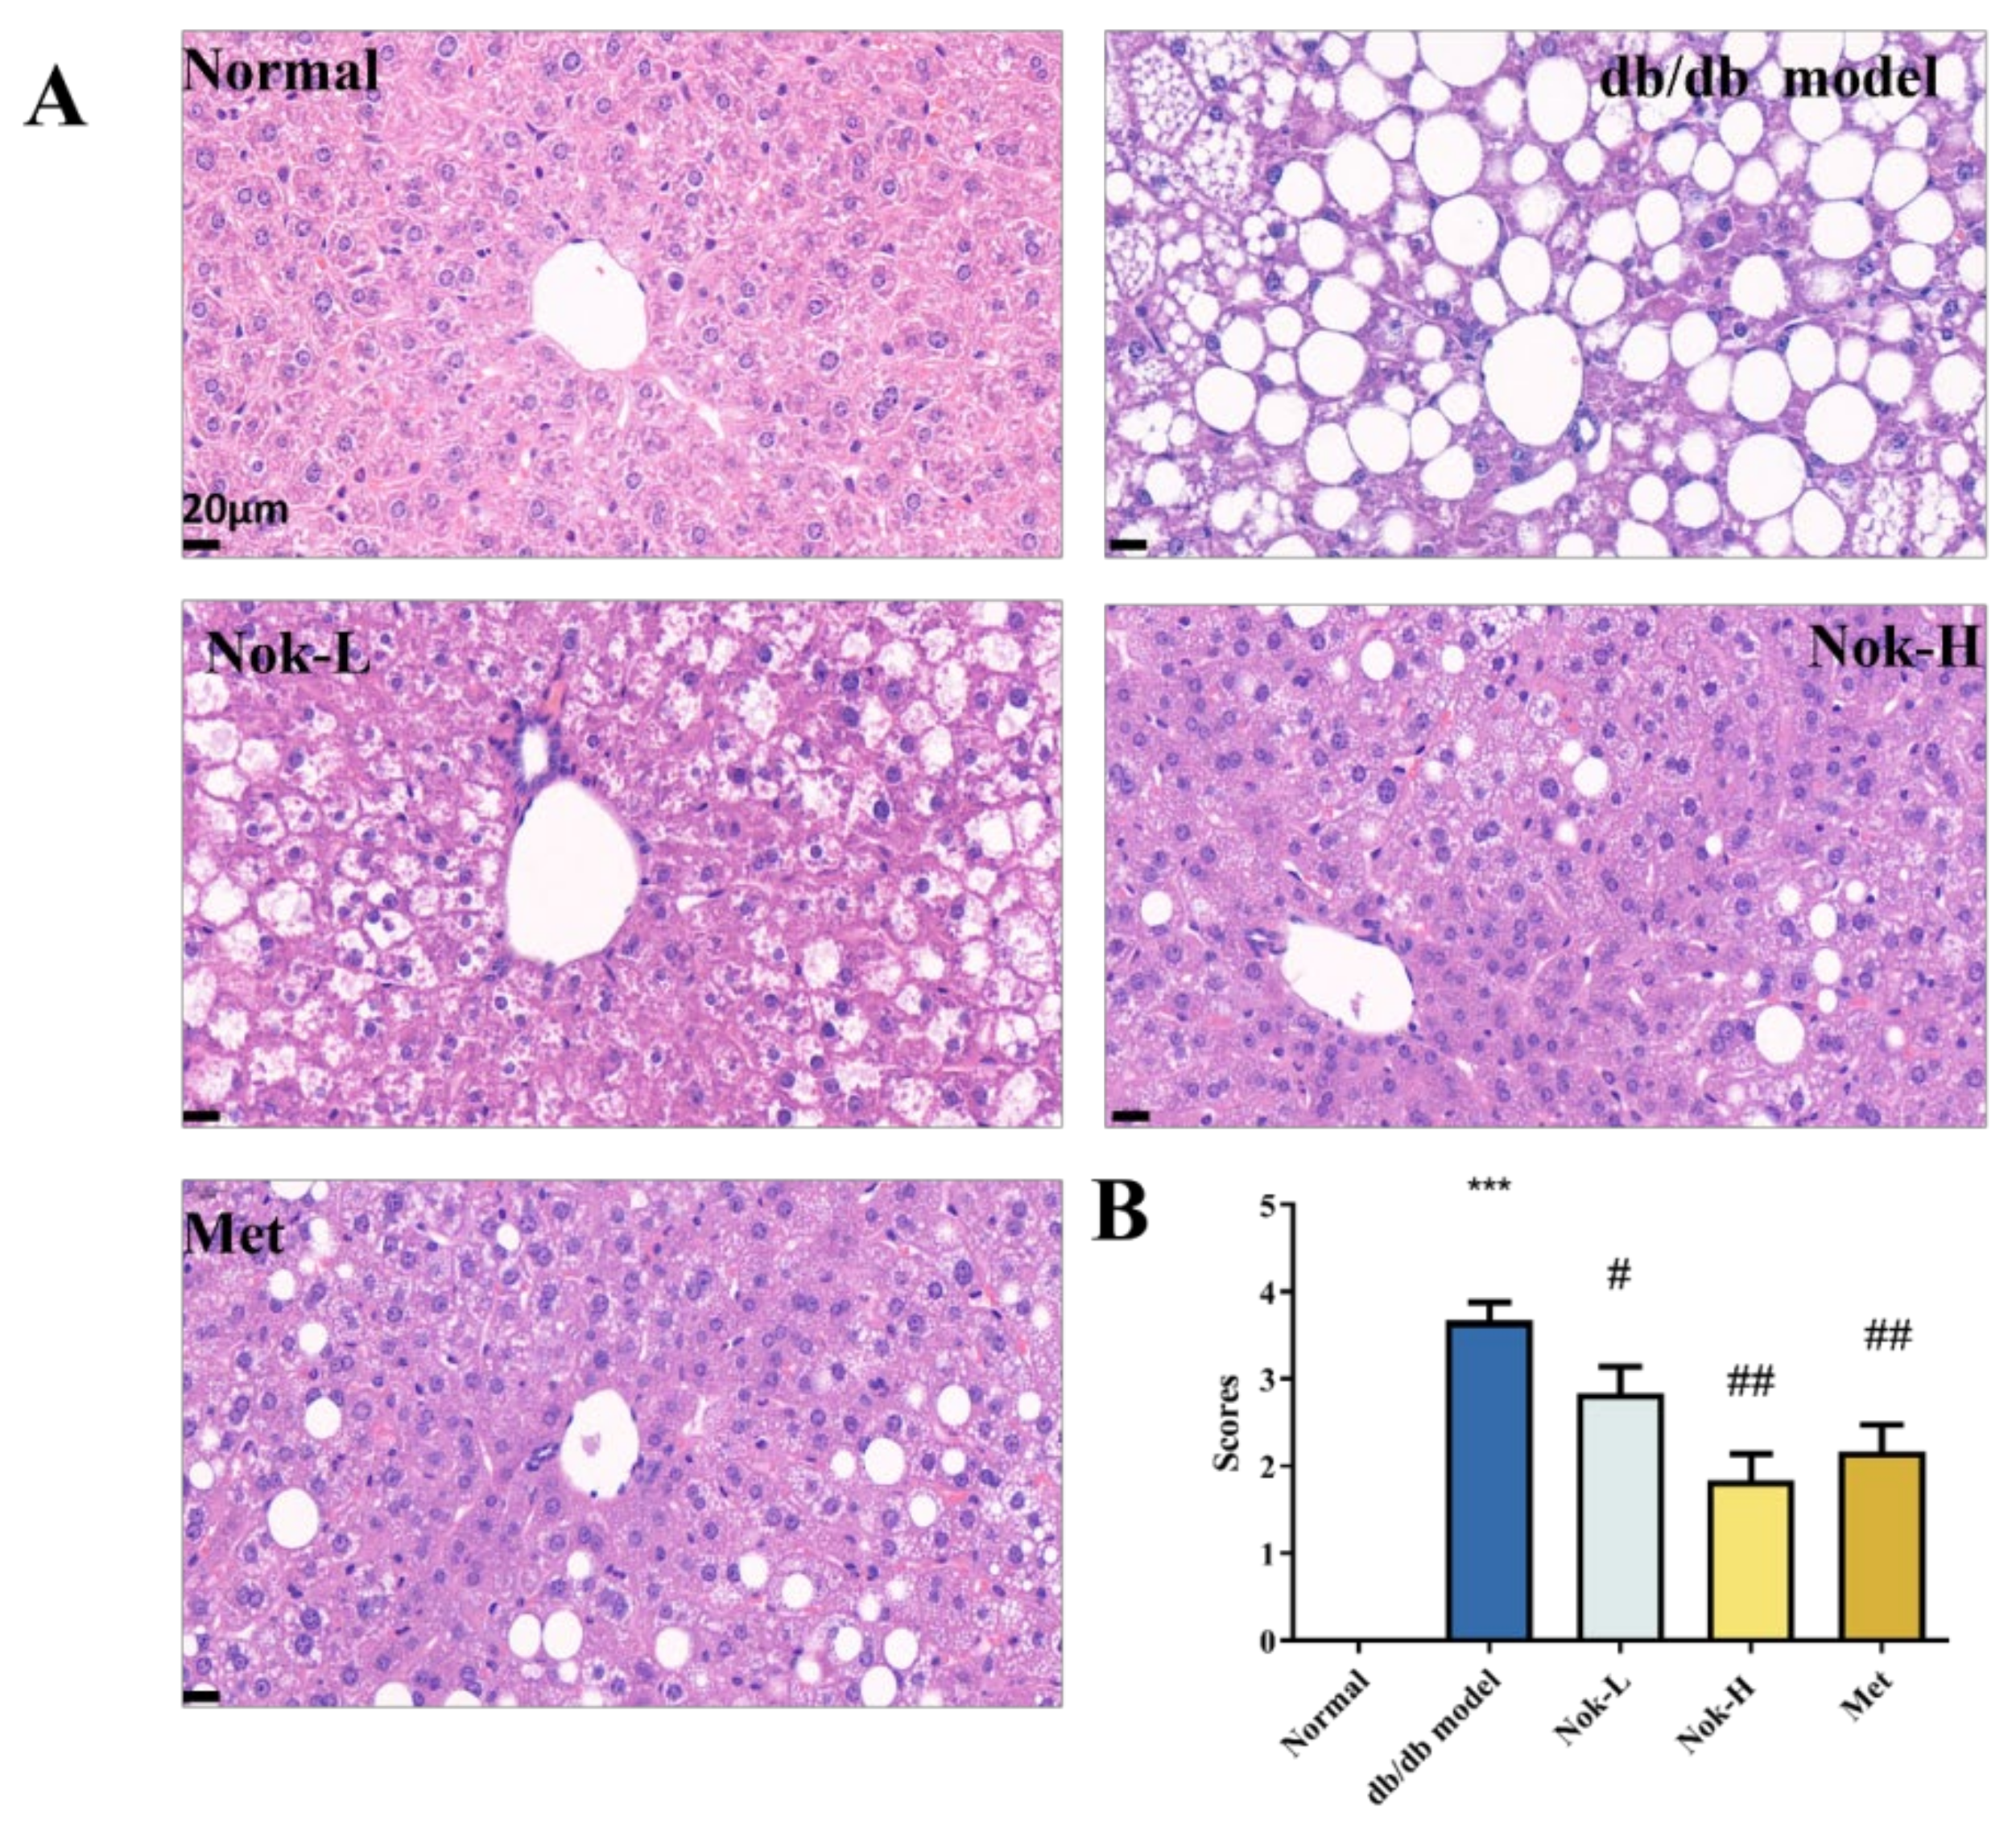
Figure 6.
Effect of Nok on pathological changes in pancreatic tissue of db/db diabetic mice. (A) Histopathological results of HE staining; (B) Pathological scoring results. Data are presented as mean ± SEM, n = 6. ***P < 0.001 vs Normal, #P < 0.05 or ##P < 0.01 vs db/db model.
Figure 6.
Effect of Nok on pathological changes in pancreatic tissue of db/db diabetic mice. (A) Histopathological results of HE staining; (B) Pathological scoring results. Data are presented as mean ± SEM, n = 6. ***P < 0.001 vs Normal, #P < 0.05 or ##P < 0.01 vs db/db model.
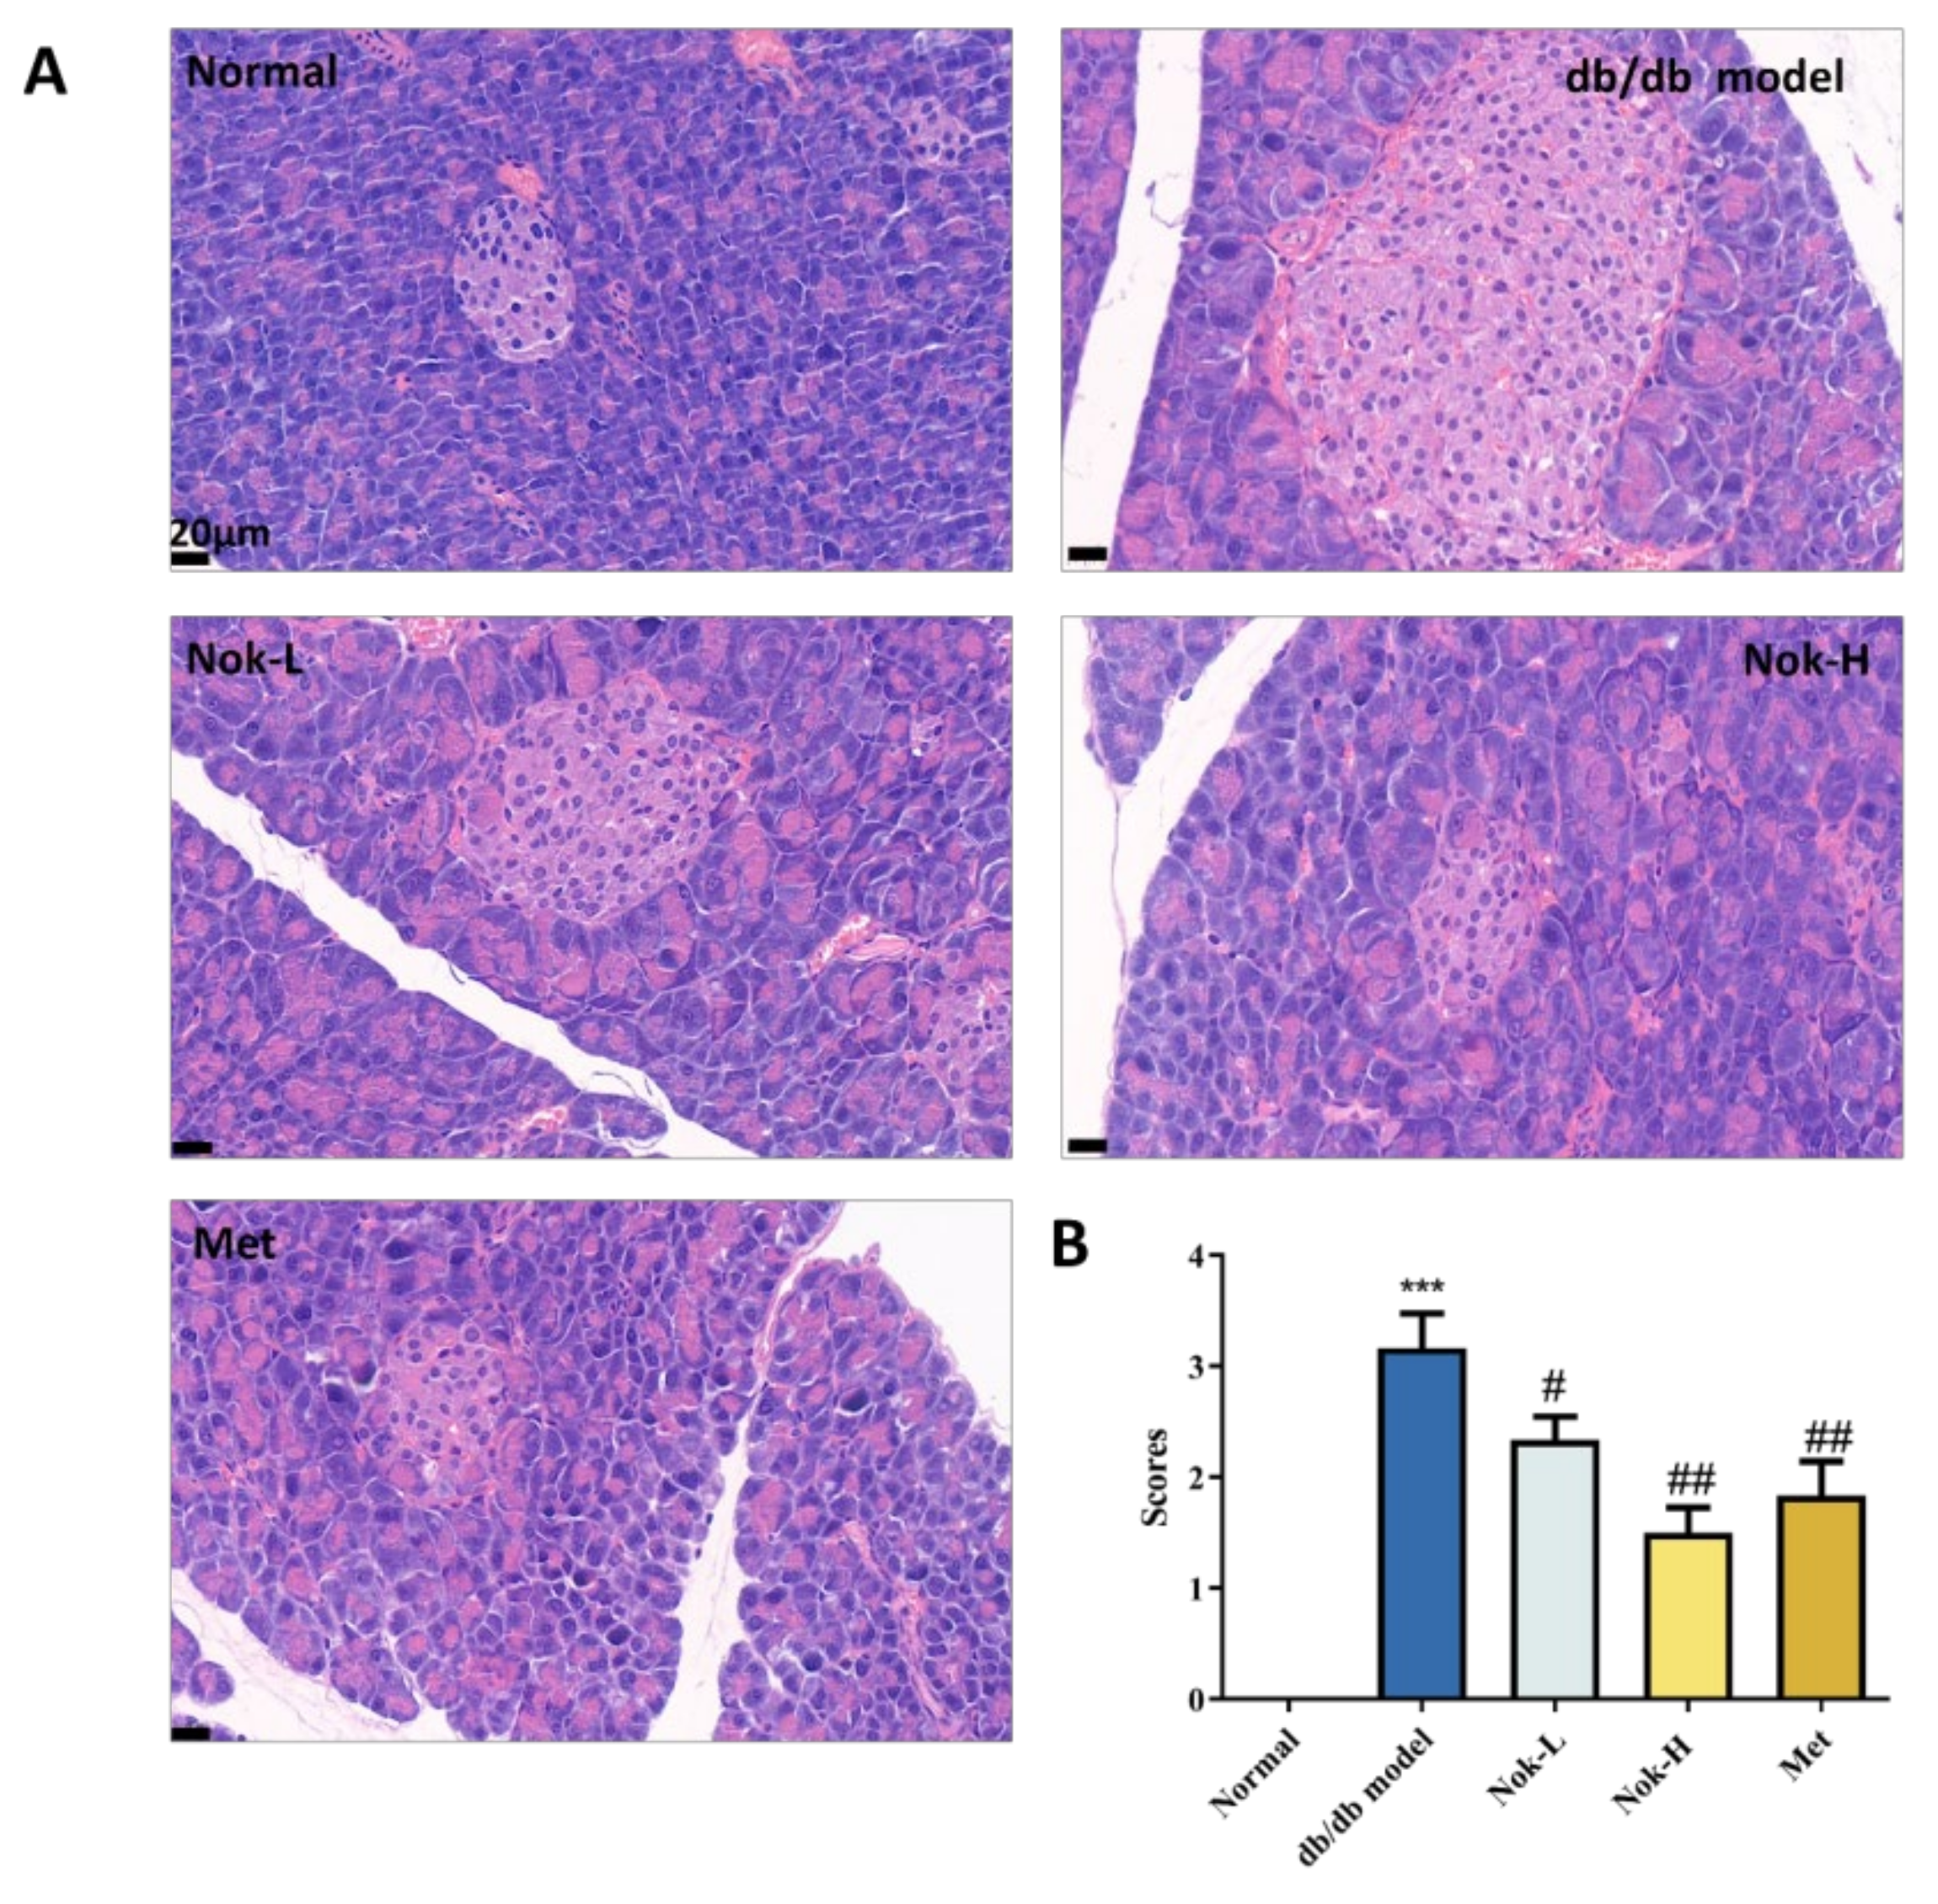
Figure 7.
The Effects of NOK on Glucose Metabolism and AMPK Activation (A) Effects of Nok on cell viability in vitro. (B) Glucose consumption. (C) Western blots were performed to analyze the levels of p-AMPK, AMPK, p-ACC and ACC in AML-12 cells. Examples of representative blots as above and fold changes of (D) p-ACC/t-ACC (E) p-AMPK/t-AMPK are shown by semiquantitative analyses. (F) Western blots were performed to analyze the levels of p-AMPK, AMPK, p-ACC and ACC in vivo. Examples of representative blots as above and fold changes of (G) p-ACC/t-ACC (H) p-AMPK/t-AMPK are shown by semiquantitative analyses.
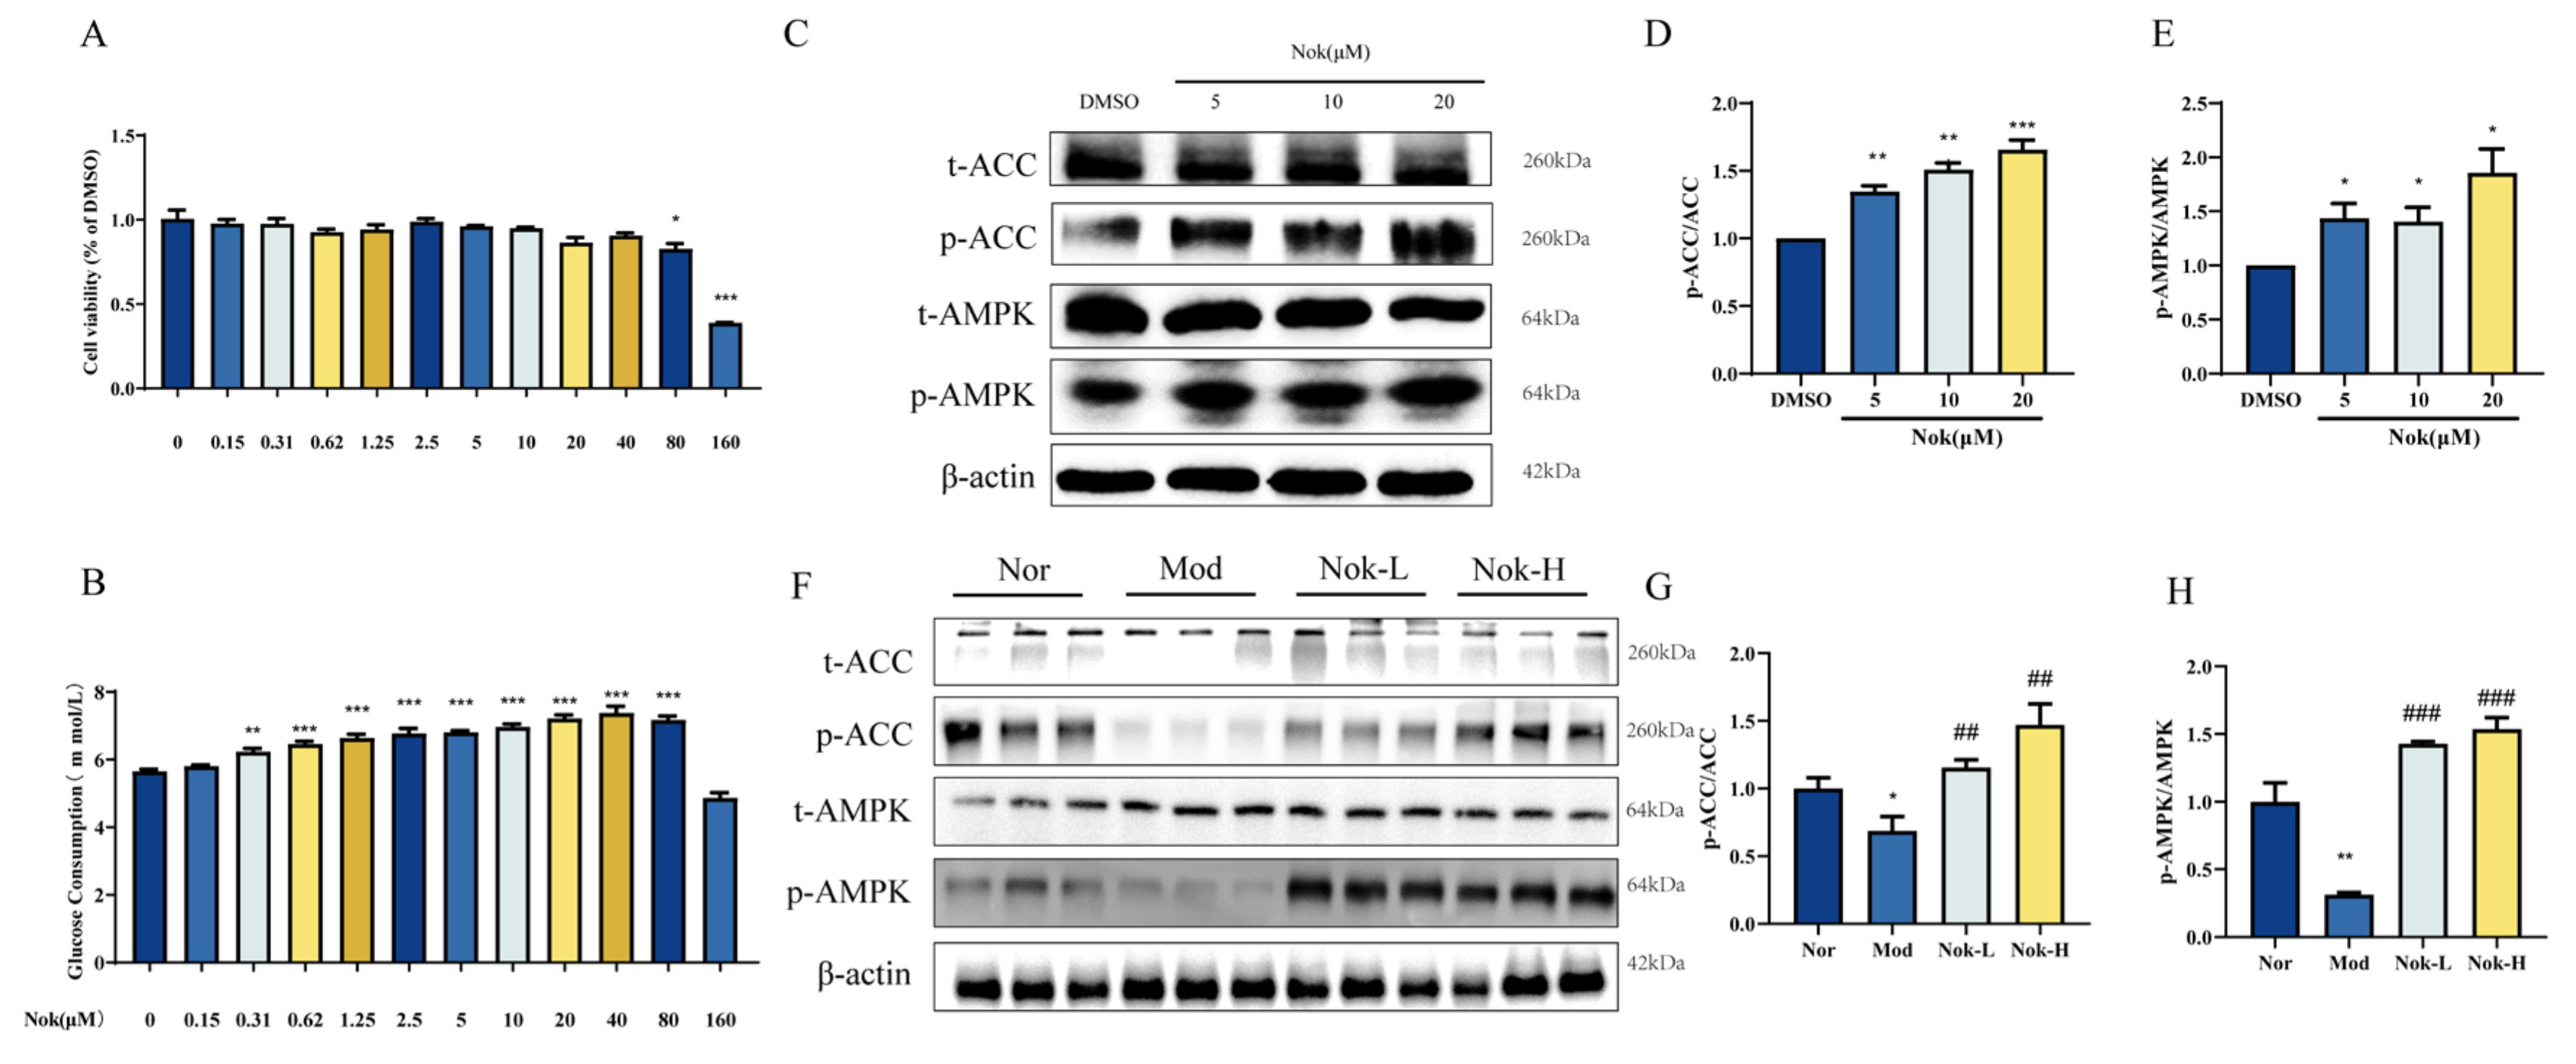
Figure 8.
Consructiong of Nok Target-T2DM Network. (A)Venn diagram of Nok- and T2DM-related proteins. The overlapped genes were considered as the potential hub genes of Nok against T2DM. (B) Cluster analysis of the PPI network. (C) The Nok- Target protein network. (D) Gene ontology annotations, including BP, CC, MF analysis. (E) KEGG pathway enrichment analysis. (F) Western blots were performed to analyze the levels of ERK and p-ERK in AML-12 cells. (G) Examples of representative blots as above and fold changes of p-ERK/ERK are shown by semiquantitative analyses. (H) Western blots were performed to analyze the levels of ERK and p-ERK in vivo. (I) Examples of representative blots as above and fold changes of p-ERK/ERK are shown by semiquantitative analyses. **P < 0.01 vs Normal, or ##P < 0.01 vs db/db model.
Disclaimer/Publisher’s Note: The statements, opinions and data contained in all publications are solely those of the individual author(s) and contributor(s) and not of MDPI and/or the editor(s). MDPI and/or the editor(s) disclaim responsibility for any injury to people or property resulting from any ideas, methods, instructions or products referred to in the content. |
© 2025 by the authors. Licensee MDPI, Basel, Switzerland. This article is an open access article distributed under the terms and conditions of the Creative Commons Attribution (CC BY) license (http://creativecommons.org/licenses/by/4.0/).
Copyright: This open access article is published under a Creative Commons CC BY 4.0 license, which permit the free download, distribution, and reuse, provided that the author and preprint are cited in any reuse.


