Submitted:
15 January 2026
Posted:
16 January 2026
You are already at the latest version
Abstract
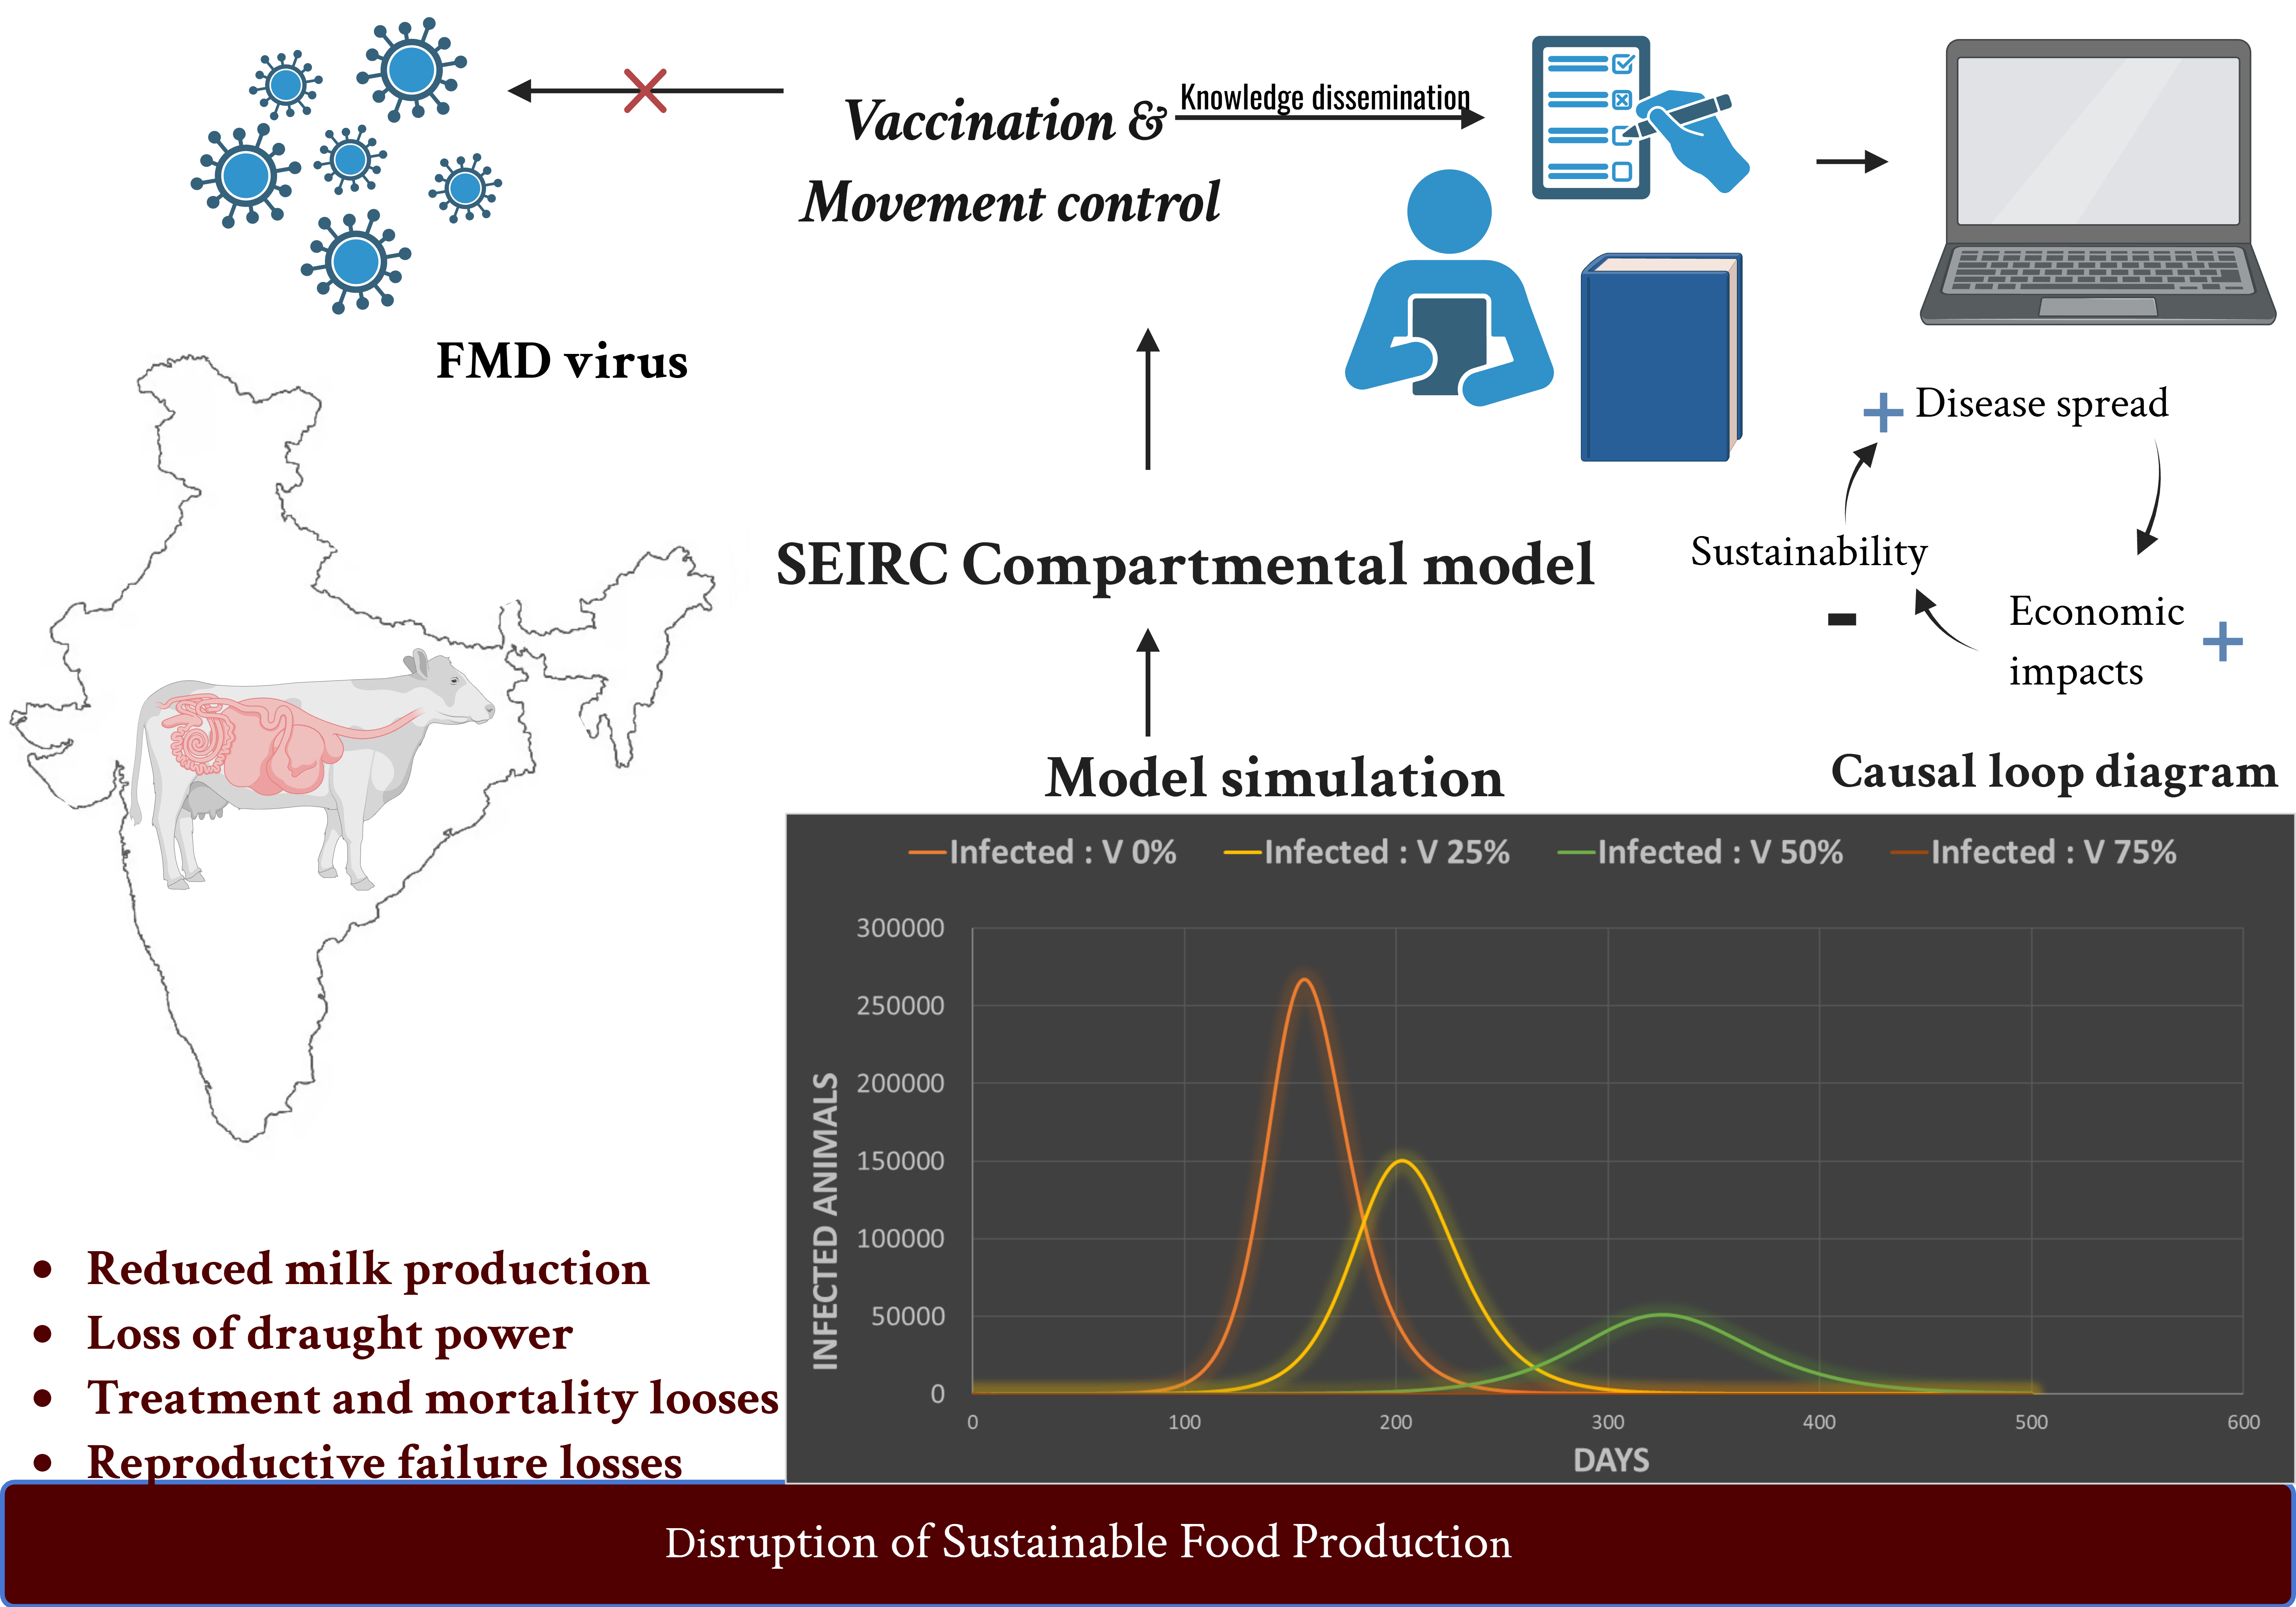
Foot-and-Mouth Disease (FMD) is a highly contagious transboundary animal disease causing substantial productivity losses and economic burdens in livestock systems. This study aimed to examine FMD transmission dynamics in Indian cattle populations and to evaluate the potential impact of key control strategies using a system dynamics approach. A Susceptible–Exposed–Infectious–Recovered–Carrier (SEIRC) model was developed to represent disease progression, incorporating causal loop diagrams and stock-and-flow structures to capture feedback mechanisms and time delays inherent to FMD epidemiology. Model simulations were conducted by systematically varying critical parameters, including the basic reproduction number (R₀), duration of infectivity, vaccination coverage, persistence of the carrier state, and duration of movement restrictions during outbreaks. The results indicated that higher R₀ values accelerated disease spread and increased peak infection levels, while shorter infectious periods resulted in more abrupt outbreaks. Vaccination coverage of at least 75% effectively stabilized the susceptible population and reduced epidemic risk. In simulated scenarios, an R₀ of 4 combined with a 14-day infectious period led to the elimination of infectious animals. Overall, the findings highlight the importance of integrated control strategies, particularly high vaccination coverage and timely movement restrictions, for reducing outbreak magnitude and duration, and provide evidence-based insights to support FMD prevention and control planning in endemic settings.
Keywords:
system dynamics
; foot-and-mouth disease
; SEIRC model
; vaccination
; basic reproduction number
; infectivity
; disease control strategies
1. Introduction
India’s population is projected to be approximately 1.463 billion, up in 2025 from around 1.451 billion in 2024 [1]. Growing population also intensifies the demand for food security, particularly in sectors such as milk and meat production [2]. Livestock play an important role in India’s agricultural economy, serving as an essential source of income, nutrition, and labor [3]. Their contributions span various sectors from dairy and meat to by-products that support organic farming, making livestock farming integral to rural livelihoods and national food systems [4]. Despite their significance, most animals face the threat of infectious diseases, which can seriously harm their health and reduce the number of livestock, affecting the whole community's well-being [5]. Maintaining animal health is critical not only for animal welfare but also for sustaining agricultural productivity [6]. Disease prevention and proper animal care are vital to reducing economic losses, ensuring production stability, and protecting both animals and public health [7].
Foot and Mouth Disease (FMD) is a highly contagious transboundary viral disease that primarily affects cloven-hoofed animals such as cattle, pigs, sheep, goats, and various wildlife species [8]. Despite its low mortality rate, the disease impacts large populations of multiple species and causes considerable economic losses in endemic areas [9]. Effective control of FMD is crucial for safeguarding India’s agricultural economy and ensuring stable food production systems [10]. Understanding FMD dynamics is essential to design robust prevention and control measures [11]. Epidemiological models serve as a vital tool for evaluating intervention strategies, informing policy decisions, and predicting outbreaks [12]. By conceptualizing the complex behavior of disease systems, these models allow for computer simulations that help forecast broader epidemiological and economic impacts [13]. There are several studies which examined the epidemiological and economic implications of FMD, there remains a critical gap in context-specific modeling approaches that can support policy and intervention planning in India. Simulation-based modeling provides a practical way to assess disease spread, duration, and the impact of interventions such as vaccination or movement control, offering a cost- and time-efficient decision-support tool that reduces resource use and risk before implementing real-world measures [14]. Existing models often generalize disease dynamics or fail to incorporate the range of variability in key transmission parameters such as the basic reproduction number (R₀), infectious periods, and control measure [15]. Early detection and timely recognition of FMD symptoms can enable farmers to take rapid and effective actions to limit disease spread and reduce the overall impact of outbreaks. In addition, improving early diagnosis supports progress toward Sustainable Development Goals (SDG) by safeguarding livestock productivity, enhancing food security, and improving access to adequate and nutritious food [16]. The objective of this study is to develop an epidemiological model using a systems-dynamics tailored to the Indian livestock rearing context. By integrating various R₀ values, serotype-specific infectivity durations, and control strategies such as immunization coverage and movement restrictions, this work aims to enhance understanding of FMD transmission dynamics and assess the effectiveness of intervention scenarios through simulation-based analysis.
2. Materials and Methods
a) Defining system and surroundings
In this System Dynamics (SD) model, India’s cattle population was selected as the focal system due to its central role in the transmission dynamics of FMD in high-density livestock settings. Defining the system is essential in SD modeling [17]; here, the system refers to the cattle population within India, behavioral characteristics include disease transmission drivers and intervention strategies. The model boundary is geographically limited to India, allowing for focused analysis within a national context.
b) Formulation of dynamic hypothesis
The spread of FMD can be effectively controlled by balancing feedback of increased immunization coverage and extended livestock movement control durations. These interventions reduce the susceptible population and limit contact between infected and susceptible animals, thereby weakening the reinforcing loop of disease transmission and promoting long-term disease suppression. Our dynamic hypothesis was that FMD's epidemiological behavior within Indian cattle systems could be simulated using the reinforcing factors like disease transmission, while the disease could be mitigated using the balancing feedback mechanisms available through immunization and movement control of susceptible cattle.
c) Model assumptions
The population was modeled as a homogeneous unit representing India’s one million cattle population. Disease dynamics were structured into five epidemiological states—Susceptible, Exposed, Infected, Recovered, and Carrier. The model was not accounted for the climatic or geographic heterogeneity across the population, and the probability of viral mutation during the simulated period is considered zero.
d) Model parameterization: Identification of stocks, flows and auxiliary variables.
By conducting thorough literature review factors affecting FMD transmission were analyzed, and they were designated as distinct stocks, flows and auxiliary variables
e) Model Overview
SD model was designed to simulate the transmission of FMD in cattle using the SEIRC (Susceptible, Exposed, Infected, Recovered, Carrier) framework [18]. The model captures disease progression and the effects of various control measures over time. Parameters (Table 1) for both direct and environmental transmission were derived from existing epidemiological data and published research.
Vaccination effects were included to assess their role in controlling the disease [19]. The model was built and tested in Vensim® Personal Learning Edition (PLE), allowing for causal loop visualization and scenario analysis. The disease transmission begins with the susceptible population, which may become exposed based on reproduction rates, infectivity periods and incubation periods. Following an incubation period, exposed animals transit to the infectious state. After a period, infected animals recover and it depends on the length of infection and treatment practices, while a subset of recovered animals may become carriers which host the virus without active shedding. Multiple factors influence these transitions, including vaccination, which reduces the susceptible pool.
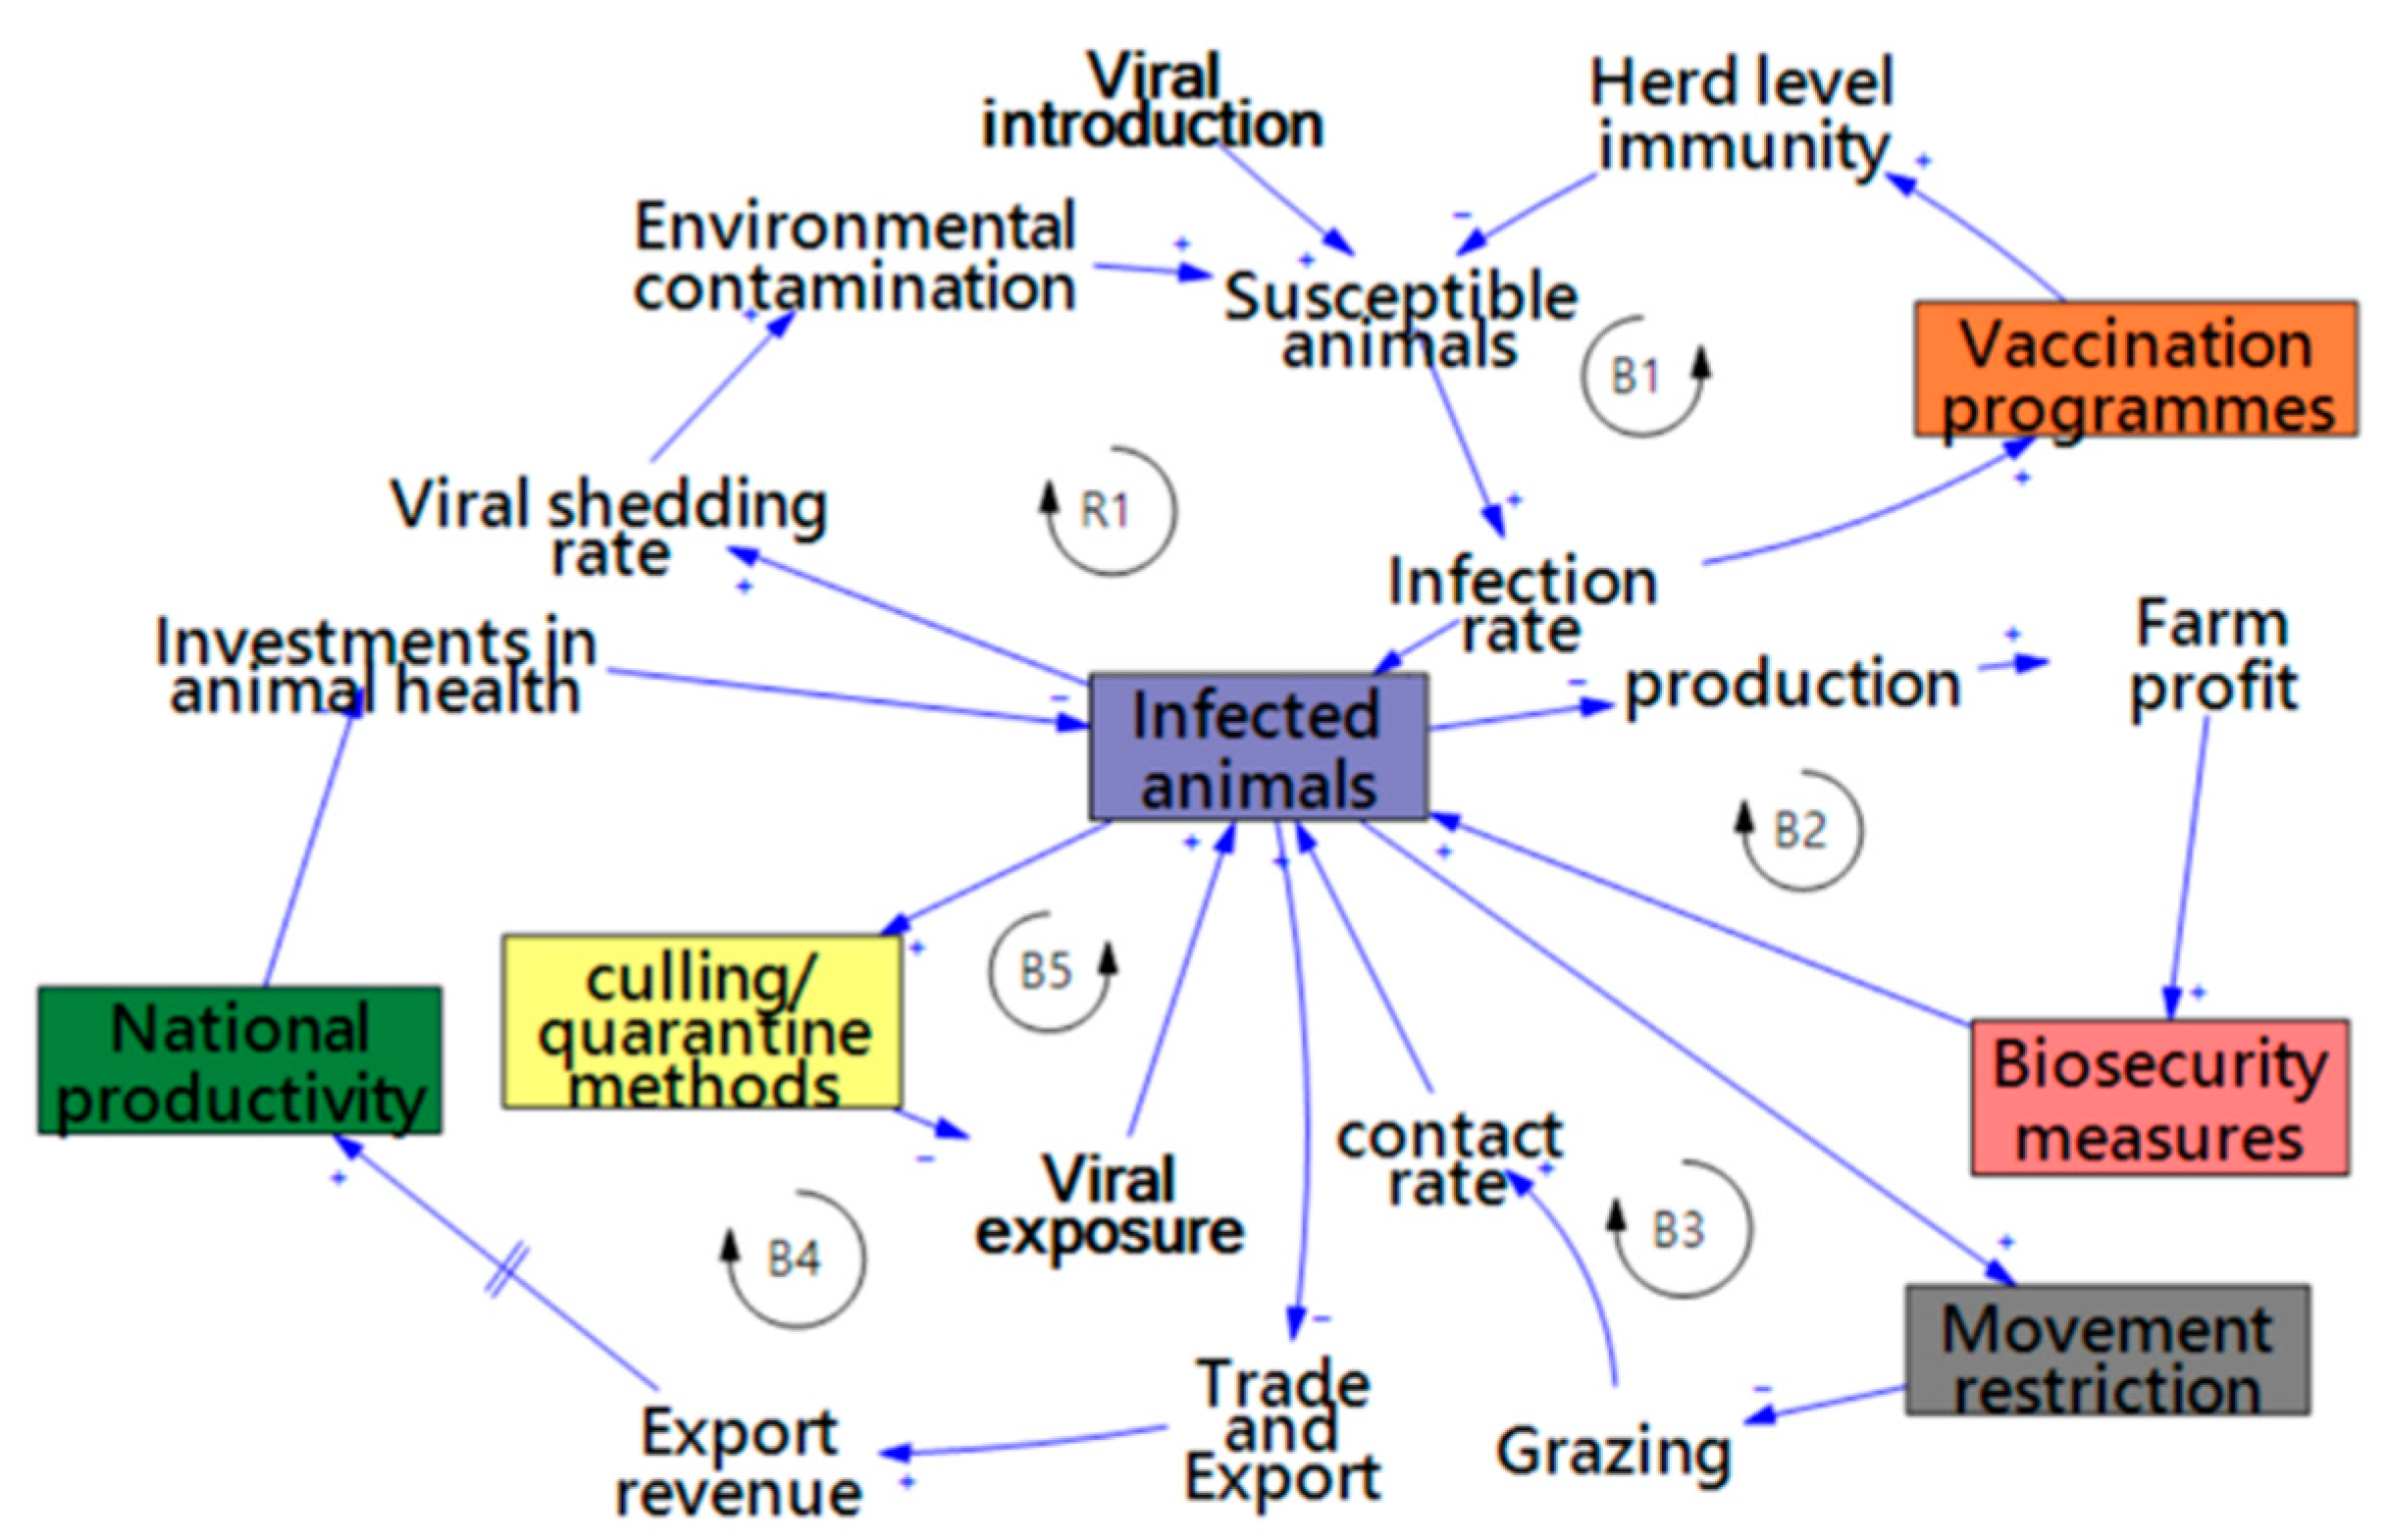
f) Formation of causal loop diagram
Dynamic relationships influencing FMD transmission and control outcomes were analyzed, using a causal loop diagram (CLD). This qualitative model was constructed based on an extensive literature review of peer-reviewed articles, epidemiological reports, expert opinions and policy documents related to FMD epidemiology, livestock management practices, and intervention strategies. Key variables influencing FMD transmission including infection rate, contact rate, vaccination, biosecurity, movement restrictions, and economic outcomes were identified and mapped to visualize feedback mechanisms. The CLD was designed to capture both reinforcing (R) and balancing (B) feedback loops that govern the system's behavior over time. The central stock variable was “Infected animals,” around which causal pathways were constructed to reflect interconnections with other critical components such as viral shedding, susceptible population, environmental contamination, vaccination programs, quarantine measures, and national productivity. Arrows with positive or negative polarity represent the direction and type of influence between variables. The diagram was created using Vensim® PLE software to facilitate visual clarity and to support later integration into the quantitative SEIRC (Susceptible–Exposed–Infected–Recovered–Carrier) model. The CLD served as a conceptual foundation to identify leverage points and guide the design of simulation scenarios in the quantitative modeling phase
g) Development of stock and flow diagram and generation of equations
A deterministic stock-and-flow model was constructed to capture the transmission dynamics of the disease in a livestock population. The framework was based on standard SEIRC-type structures, with additional compartments for carriers and recovered animals. The model was implemented in discrete time with a simulation horizon of 500 days and a time step of 1 day.
h) Model structure
One million Indian cattle population was divided into Susceptible (S), Exposed (E), Infected (I), Carrier (C), and Recovered (R) compartments. Transitions between compartments were defined by ordinary differential equations expressed in integral form equations are given below
S= ∫(-ϵ).dt (N-I')(1-ι)
E=∫ϵ-β
I=∫ β-µ-γ
R=∫λ-γ
C=∫µ-λ
Transition dynamics
The movement of animals across compartments was governed by biological parameters and epidemiological assumptions and the equation for different flows is given below:
ϵ = ω × I
β = E / η η = 7 days
µ = I × (1 / di) × (1 - Pc)
γ = I × (1 / di) × Pc
λ = C/dc dc = 365 days
3. Results
3.1. Causal Loop Diagram
Causal Loop Diagram (CLD) represents systemic interactions affecting FMD dynamics and its broader impact on farm-level and national outcomes. The diagram includes both reinforcing (R) and balancing (B) feedback loops.
R1- Viral Amplification Loop: reinforcing feedback mechanism. In this loop, an increase in the number of infected animals leads to higher viral shedding, resulting in greater environmental contamination. This environmental contamination increases the exposure risk for susceptible animals, raising the infection rate and, subsequently, the number of infected animals. This positive feedback loop highlights how, in the absence of control measures, the disease can spread rapidly due to self-sustaining transmission.
B1- Herd Immunity Control Loop: is a balancing loop centered on vaccination. Increased implementation of vaccination programs improves herd-level immunity, which in turn reduces the number of susceptible animals. A smaller susceptible population leads to a lower infection rate and a consequent reduction in the number of infected animals. This loop demonstrates the vital role of vaccination in curbing disease transmission and establishing long-term control.
B2- Biosecurity Investment Incentive Loop: captures the interaction between biosecurity measures and economic outcomes. Enhanced biosecurity reduces contact rates among animals, thereby lowering infection rates and the number of infected animals. A reduction in disease burden improves farm profitability, which can further encourage investment in biosecurity. This loop illustrates self-reinforcing behavior within a balancing context, where improvements in health status support economic gains that, in turn, enable continued disease prevention.
B3- Quarantine and Culling Response Loop: reflects a direct disease control mechanism. An increase in infected animals triggers the implementation of culling or quarantine methods, which reduces viral exposure and subsequent infection rates. By removing infected individuals from the population, this loop acts as a negative feedback mechanism to suppress the epidemic curve.
B4- Movement Restriction Containment Loop: highlights the importance of restricting animal movement in controlling disease spread. An increase in infections prompts the enforcement of movement restrictions, which reduce grazing and inter-animal contact. This reduction in contact rate lowers the infection rate and helps to contain the outbreak, showcasing another key intervention pathway.
B5- Productivity-Stability Investment Loop: connects disease reduction to economic stability and reinvestment. As infected animals decrease, national productivity improves, leading to increased investments in animal health. These investments strengthen control interventions such as vaccination or quarantine, which further contribute to the reduction of infections. This loop highlights how health gains can translate into economic and institutional reinforcement for long-term disease control.
B6- Trade Recovery Loop: links animal health status to trade outcomes. A lower number of infected animals enables the resumption of trade and export activities, increasing export revenue and enhancing national productivity. This loop underscores the broader economic incentive for effective disease management, as improved export performance can reinforce national-level efforts toward disease eradication.
Together, these loops reveal critical leverage points within the FMD system—such as vaccination coverage, biosecurity, movement control, and carrier management—that can be strategically targeted to minimize disease spread and enhance both farm-level profitability and national productivity.
Figure 1.
Causal loop diagram depicting key factors influencing the foot and mouth disease and the control strategies.
Figure 1.
Causal loop diagram depicting key factors influencing the foot and mouth disease and the control strategies.
3.2. Stock and Flow Diagram
The system dynamics-based SEIRC (Susceptible–Exposed–Infected–Recovered–Carrier) model was constructed to simulate FMD transmission under varying epidemiological and intervention scenarios (Figure 2). The model integrates key parameters, including basic reproduction number (R₀), transmission rate, incubation and infectivity periods, vaccination coverage, immunity duration, and movement control measures. The structure captures the flow of animals between compartments based on disease progression and control measures. Susceptible animals transition to the exposed category via the exposure rate, influenced by the initial number of infected animals, R₀, and fraction of the population susceptible. Exposed animals become infectious after the incubation period, with infection duration determined by the infectivity period. Recovery pathways include movement to the recovered category or persistence in the carrier state, with the latter influenced by the percentage of carriers and carrier duration.
Figure 2.
Stock-and-Flow structure of the SEIRC model for FMD transmission and control.
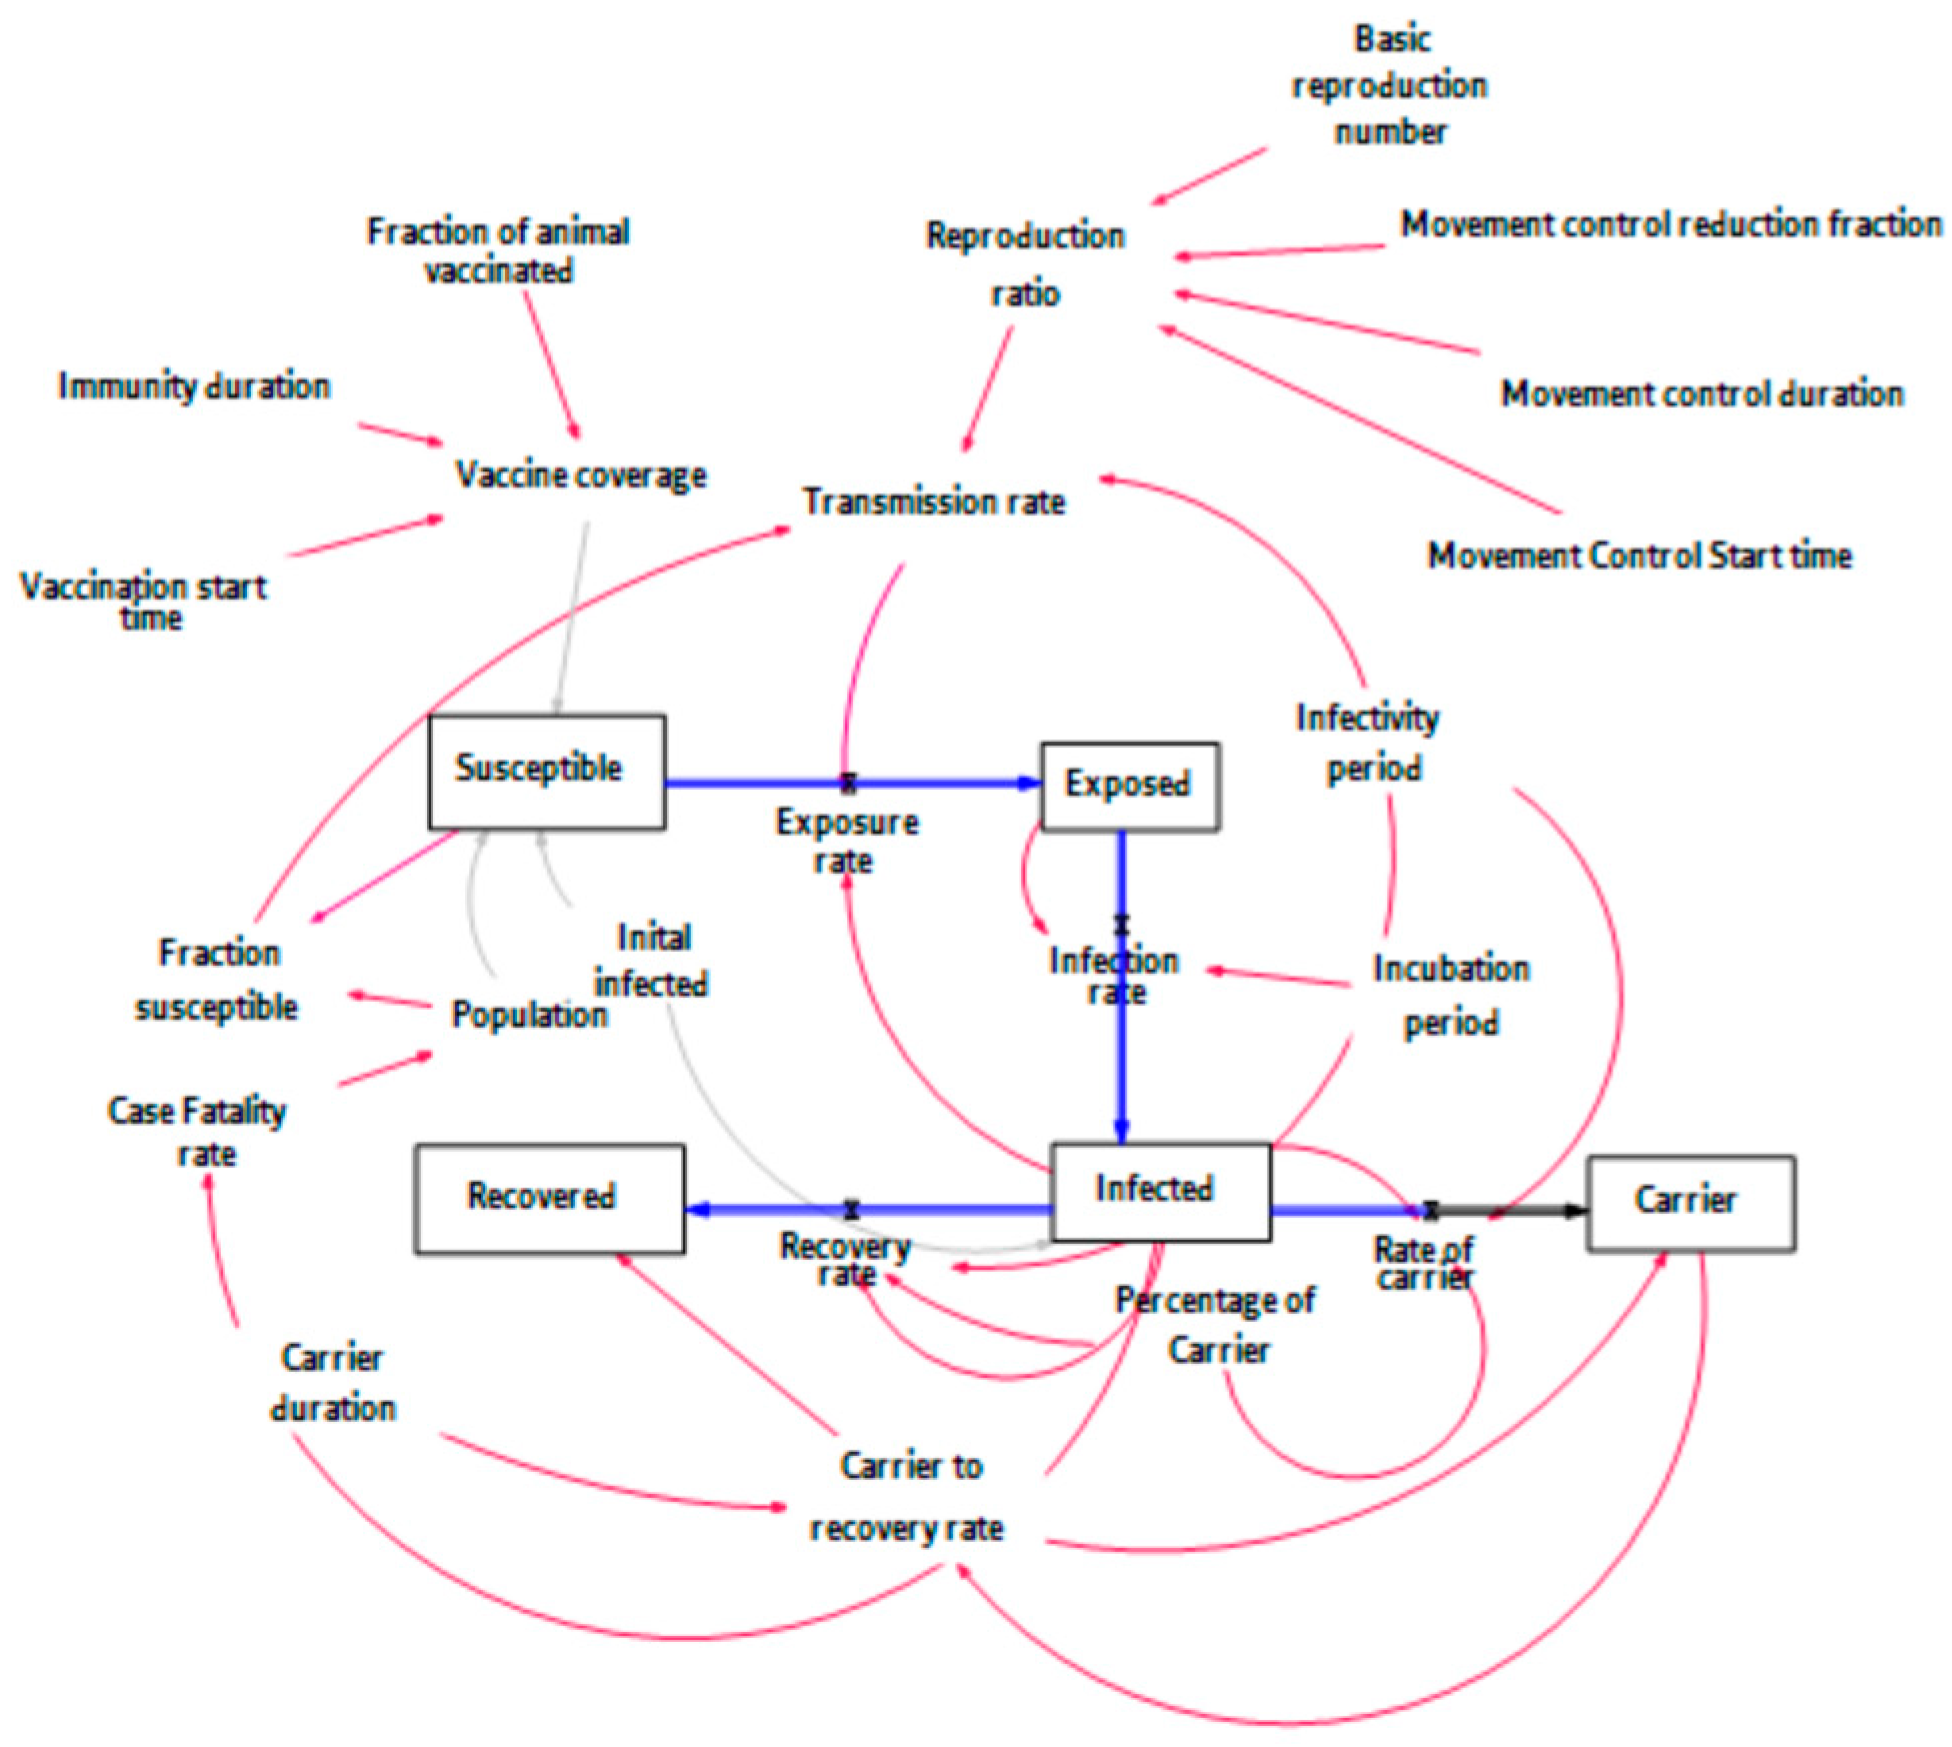
Intervention parameters, such as vaccination start time, vaccine coverage, and movement control measures (start time, duration, and reduction fraction), are linked to their respective leverage points in the model. These variables influence the susceptible population size, contact rates, and ultimately the disease transmission rate. This dynamic structure enables simulation of different control strategies, allowing assessment of their relative effectiveness in reducing outbreak magnitude, shortening epidemic duration, and limiting the persistence of carriers.
3.3. Model Based Evaluations in SEIRC Model
3.3.1. Simulations to Demonstrate Population Trends Under R0 Values
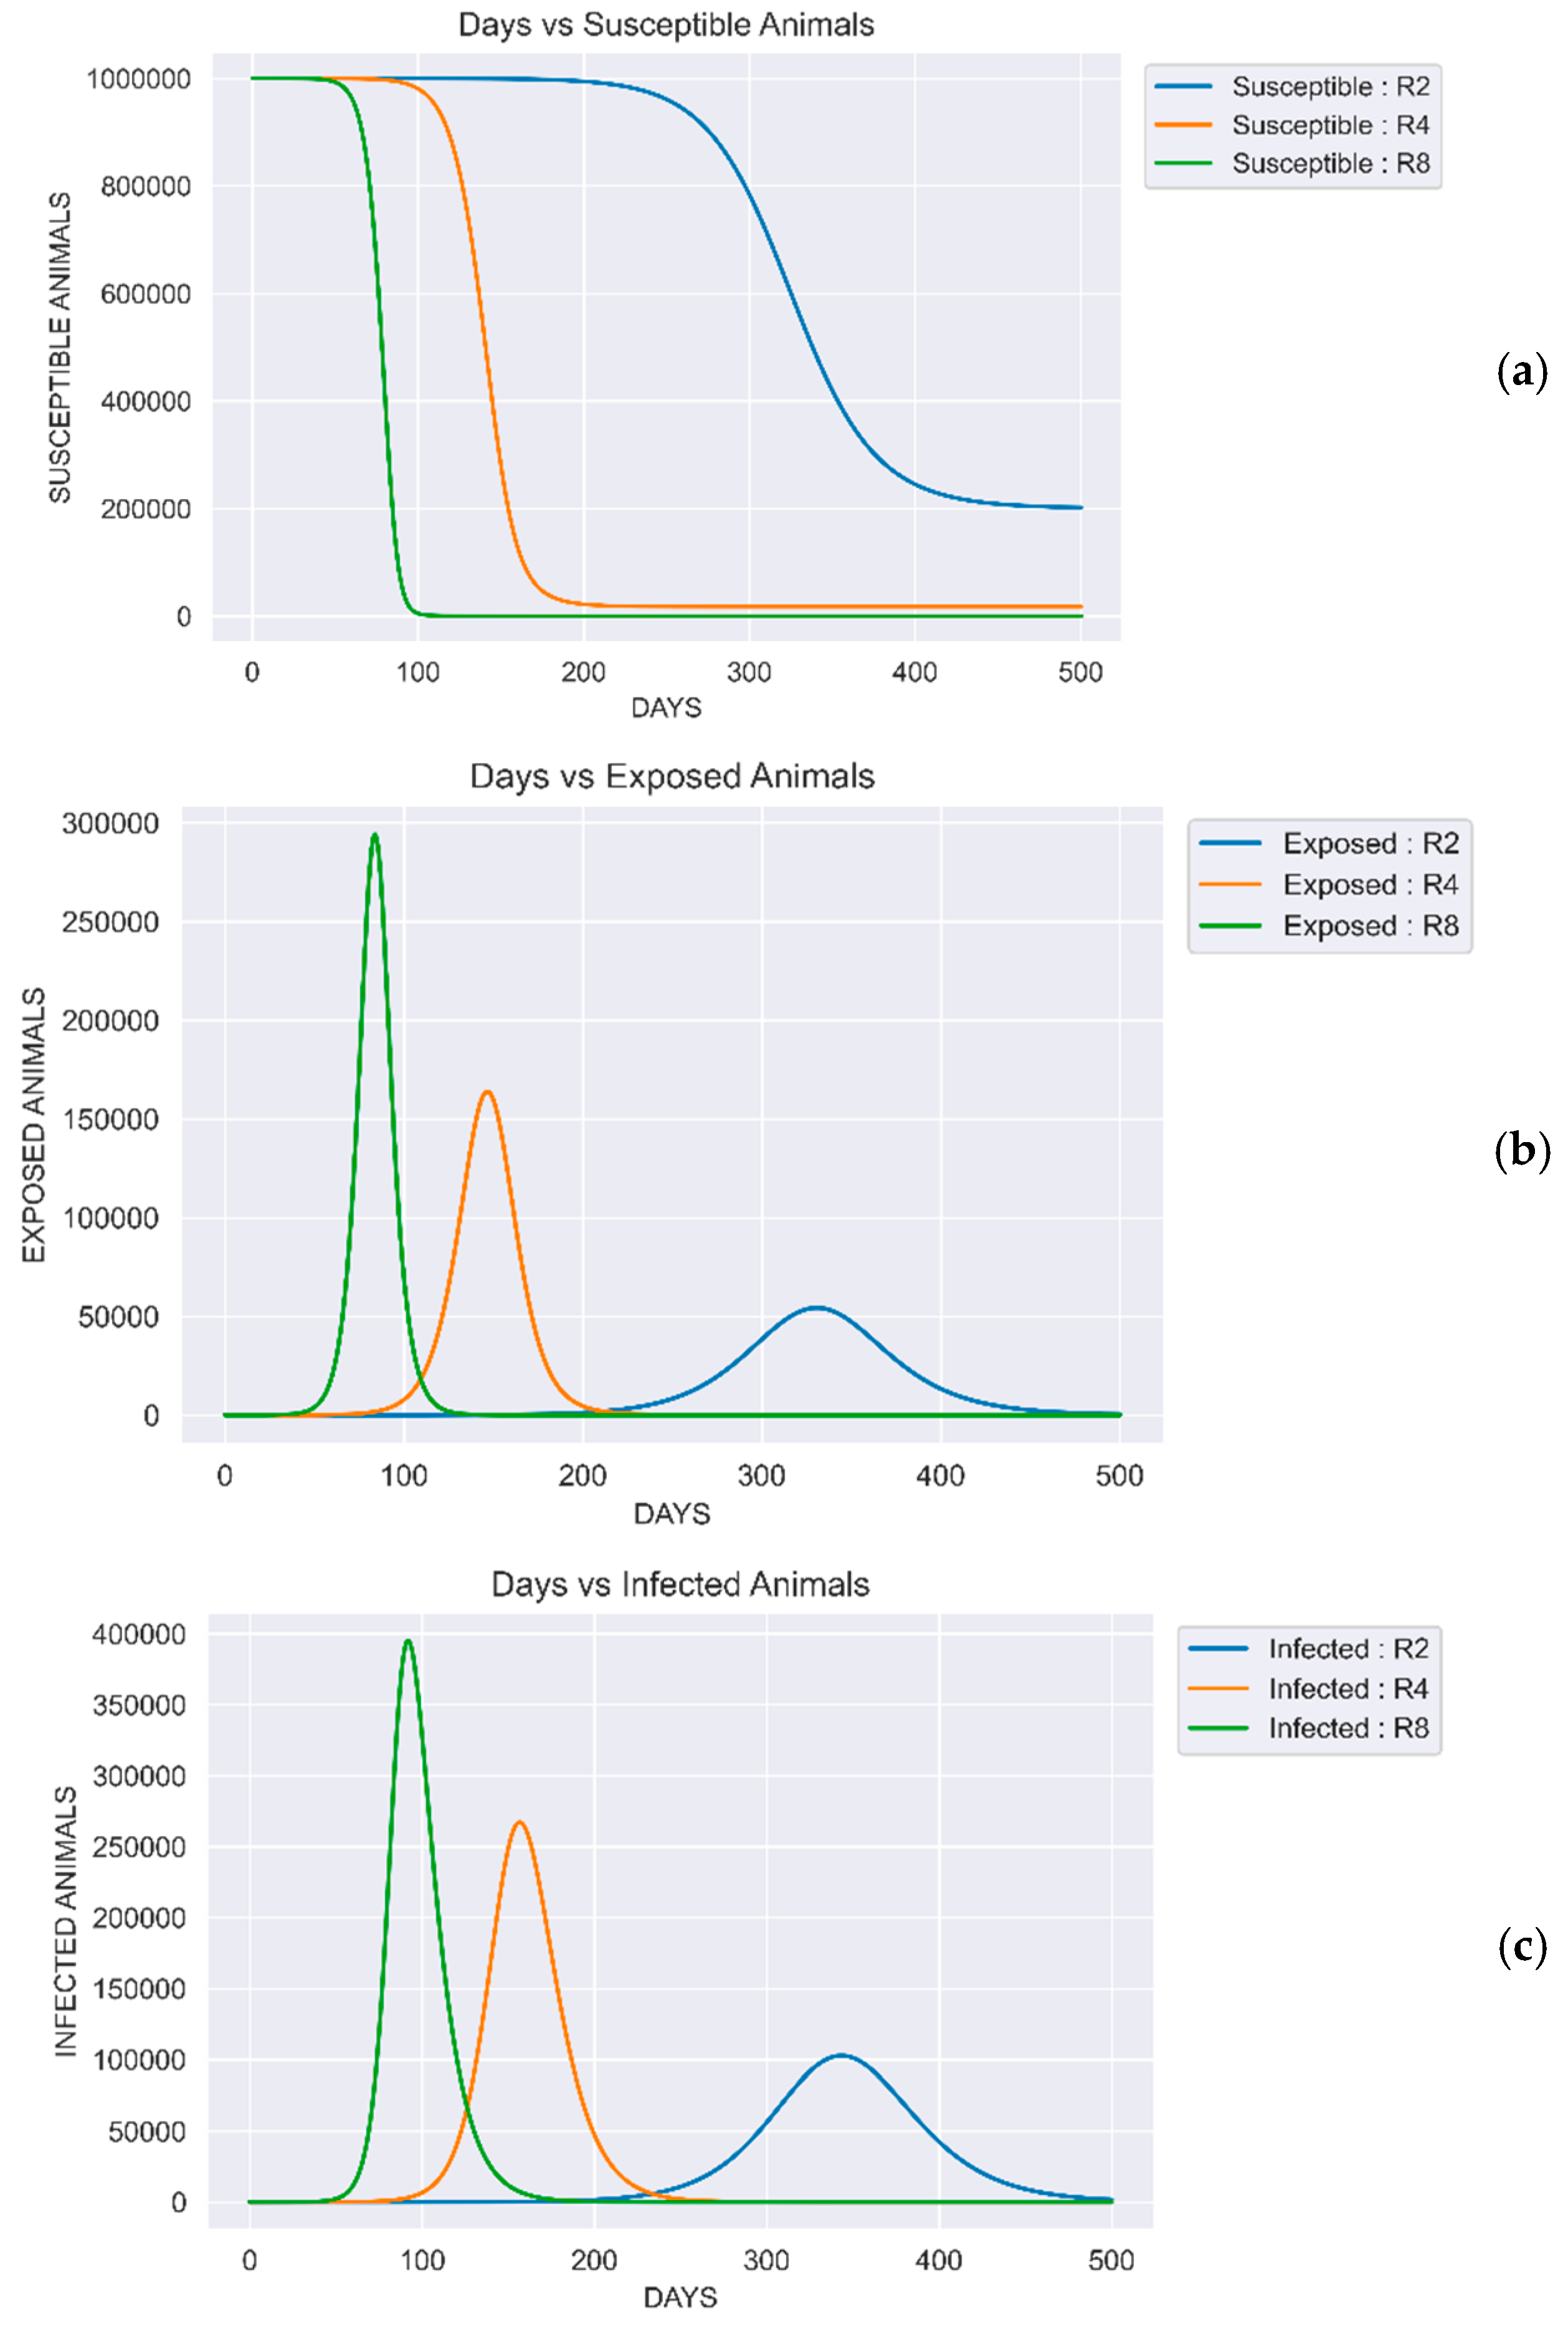
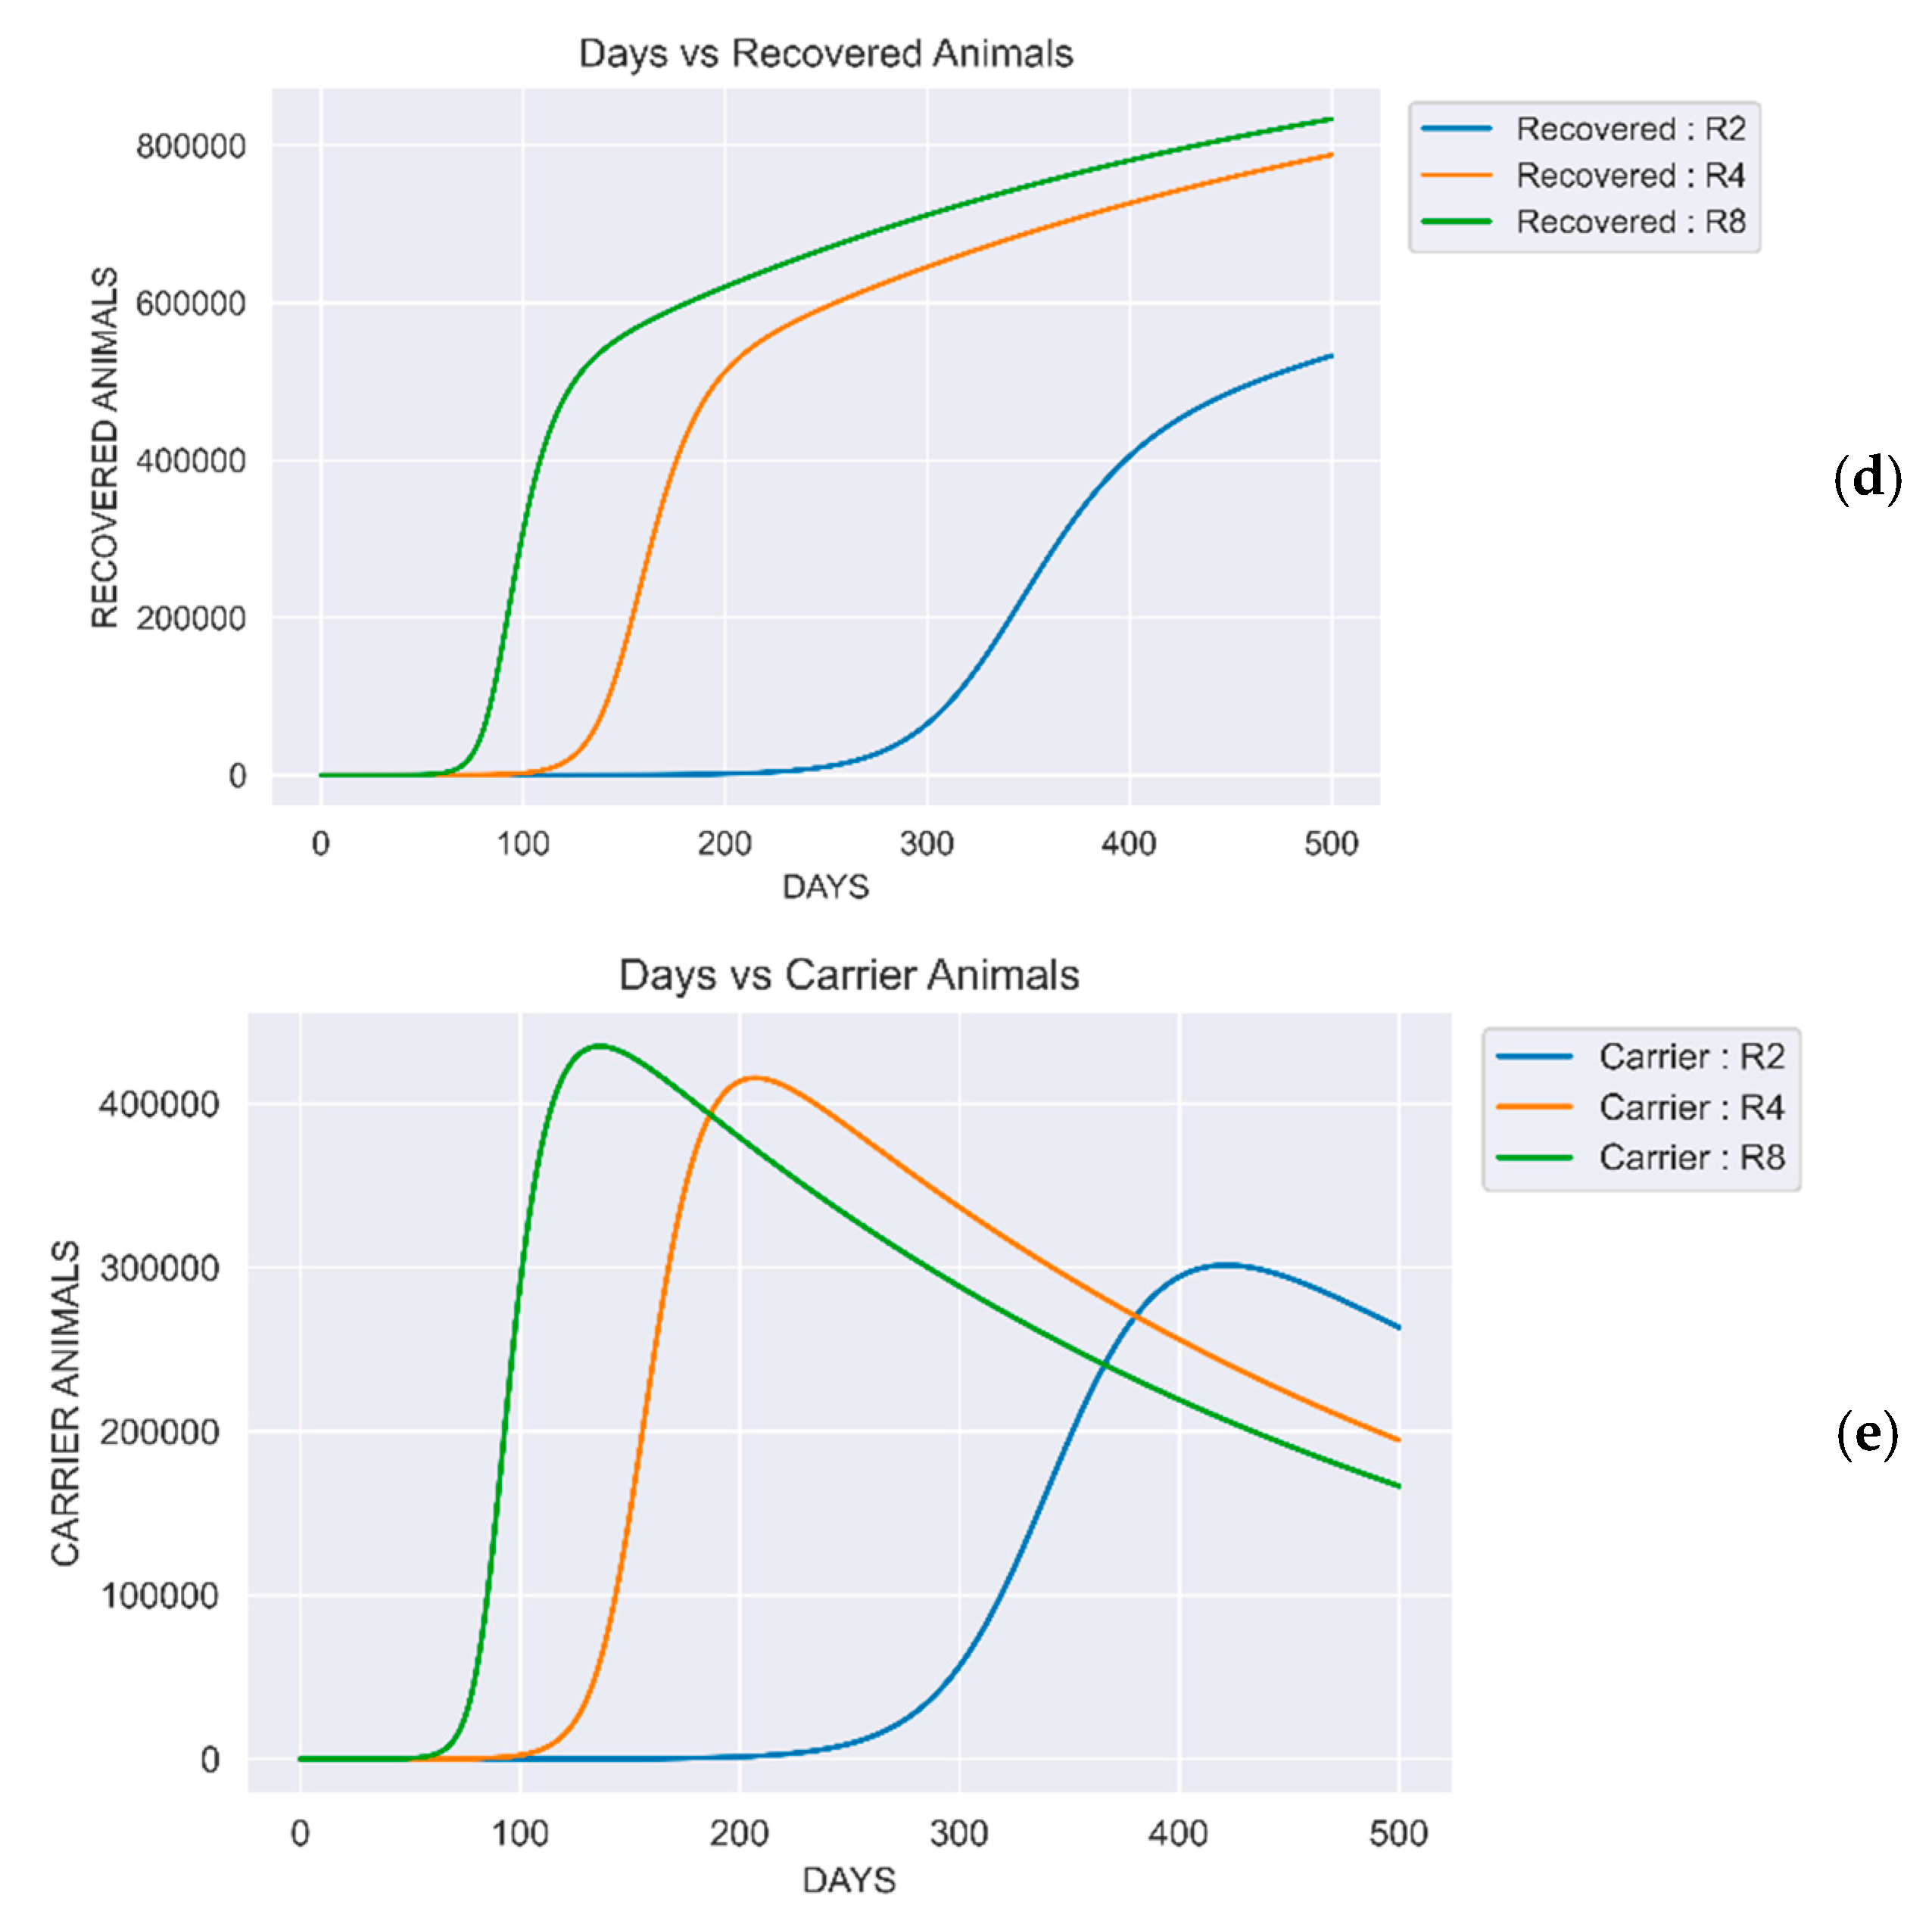
Under normal circumstances, the basic reproduction number (R₀) is considered a constant characteristic of a particular disease. However, our literature review revealed that reported R₀ values for the same disease can vary significantly across studies. Simulation results from this study illustrate how varying R₀ values influence the dynamics of disease transmission. When R₀ was set to 8, the epidemic peaked on the 92nd day with 395,145 infected animals. At an R₀ of 4, the peak occurred on the 157th day with 267,114 infections. In contrast, an R₀ of 2 delayed the peak to the 343rd day, with 102,777 infected animals. These results indicate that higher R₀ values lead to more rapid and intense outbreaks, reflected by an earlier and more pronounced peak in infections.
Figure 3.
(a), (b), (c), (d), (e) SEIRC stock dynamics under basic reproduction numbers (R₀) of 2, 4, and 8.
Figure 3.
(a), (b), (c), (d), (e) SEIRC stock dynamics under basic reproduction numbers (R₀) of 2, 4, and 8.
3.3.2. Impact of Different Infectivity Duration in FMD Disease Dynamic
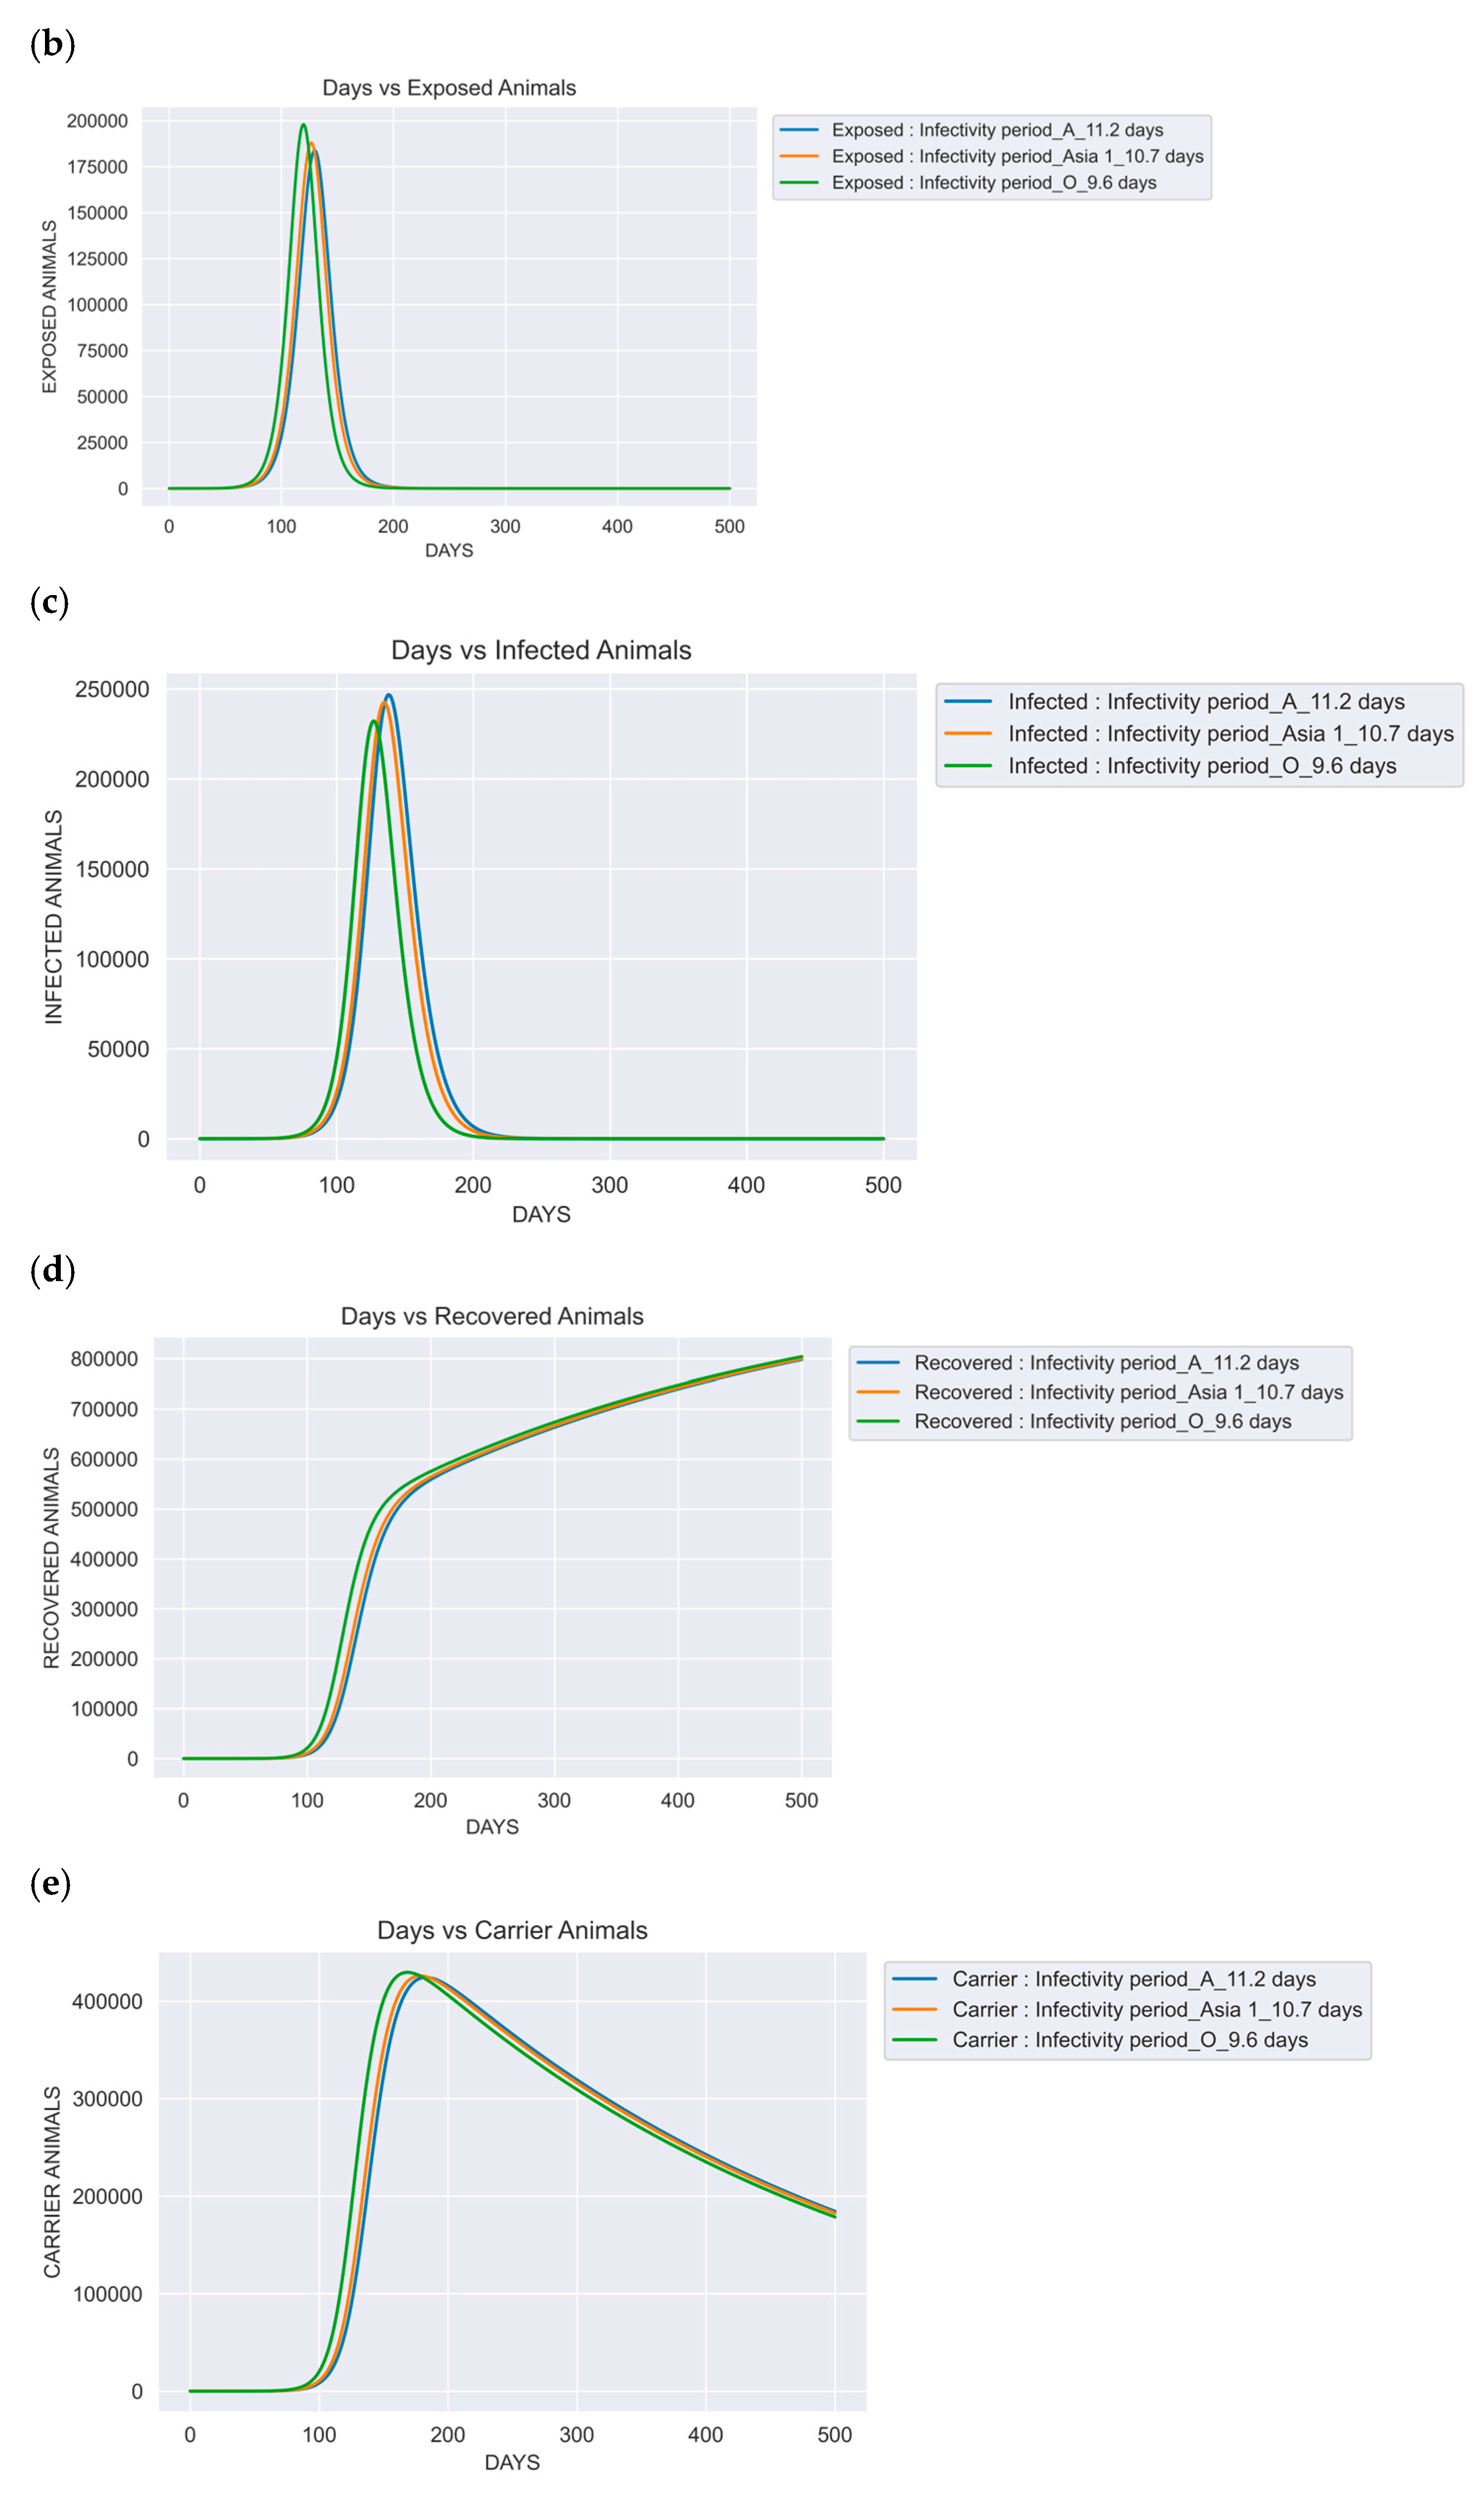
Variations in FMD dynamics were observed across three serotypes, emphasizing the importance of serotype-specific management strategies. Simulation results indicated that Serotype O led to a peak infection of 232,155 animals on day 127, while Serotype Asia 1 resulted in a slightly higher peak of 242,457 animals on day 135. Serotype A caused the highest peak, with 246,751 infected animals on day 138. These differences highlight the necessity of tailoring control measures to the epidemiological characteristics of each serotype.
Figure 4.
(a), (b), (c), (d), (e) Graphs representing SEIRC stocks with specified duration of infectivity(d) for serotype O (9.6 days), serotype Asia 1 (10.7 days), and for serotype A with 11.2 days respectively (Yadav et al., 2019). These simulations were carried at an R₀ of 4, where no interventions were applied.

3.3.3. Impact of Vaccination in Disease Dynamics
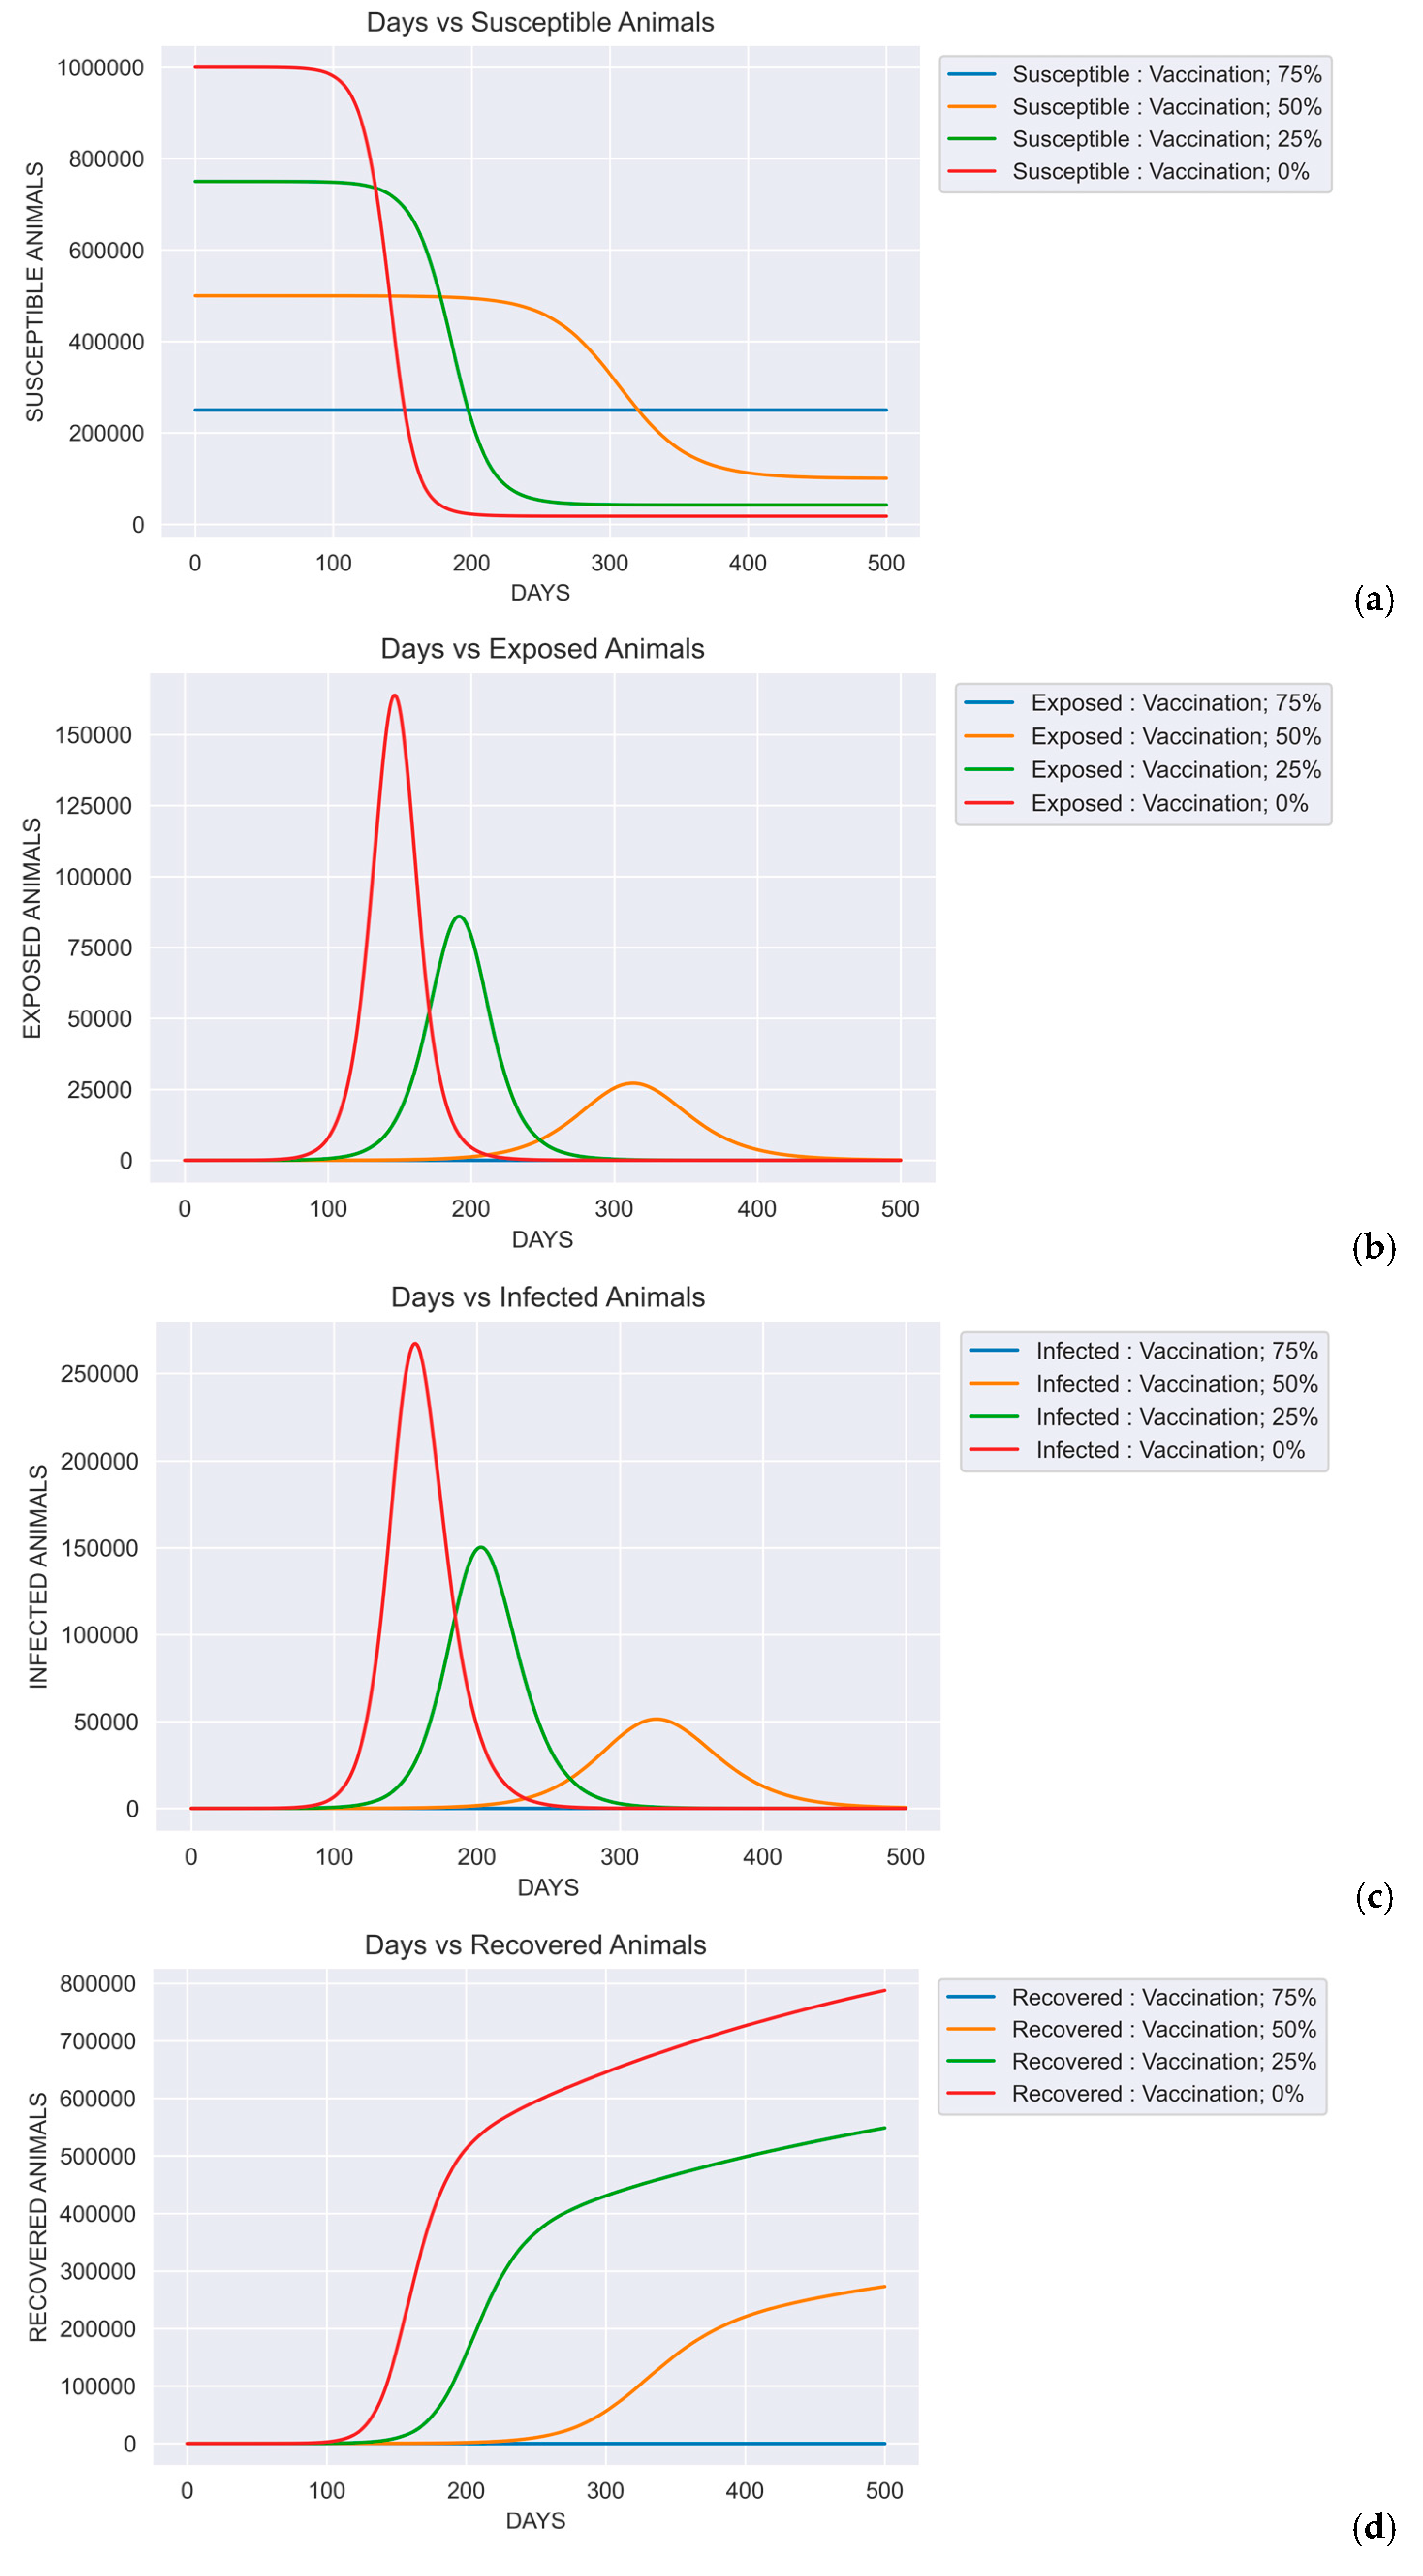
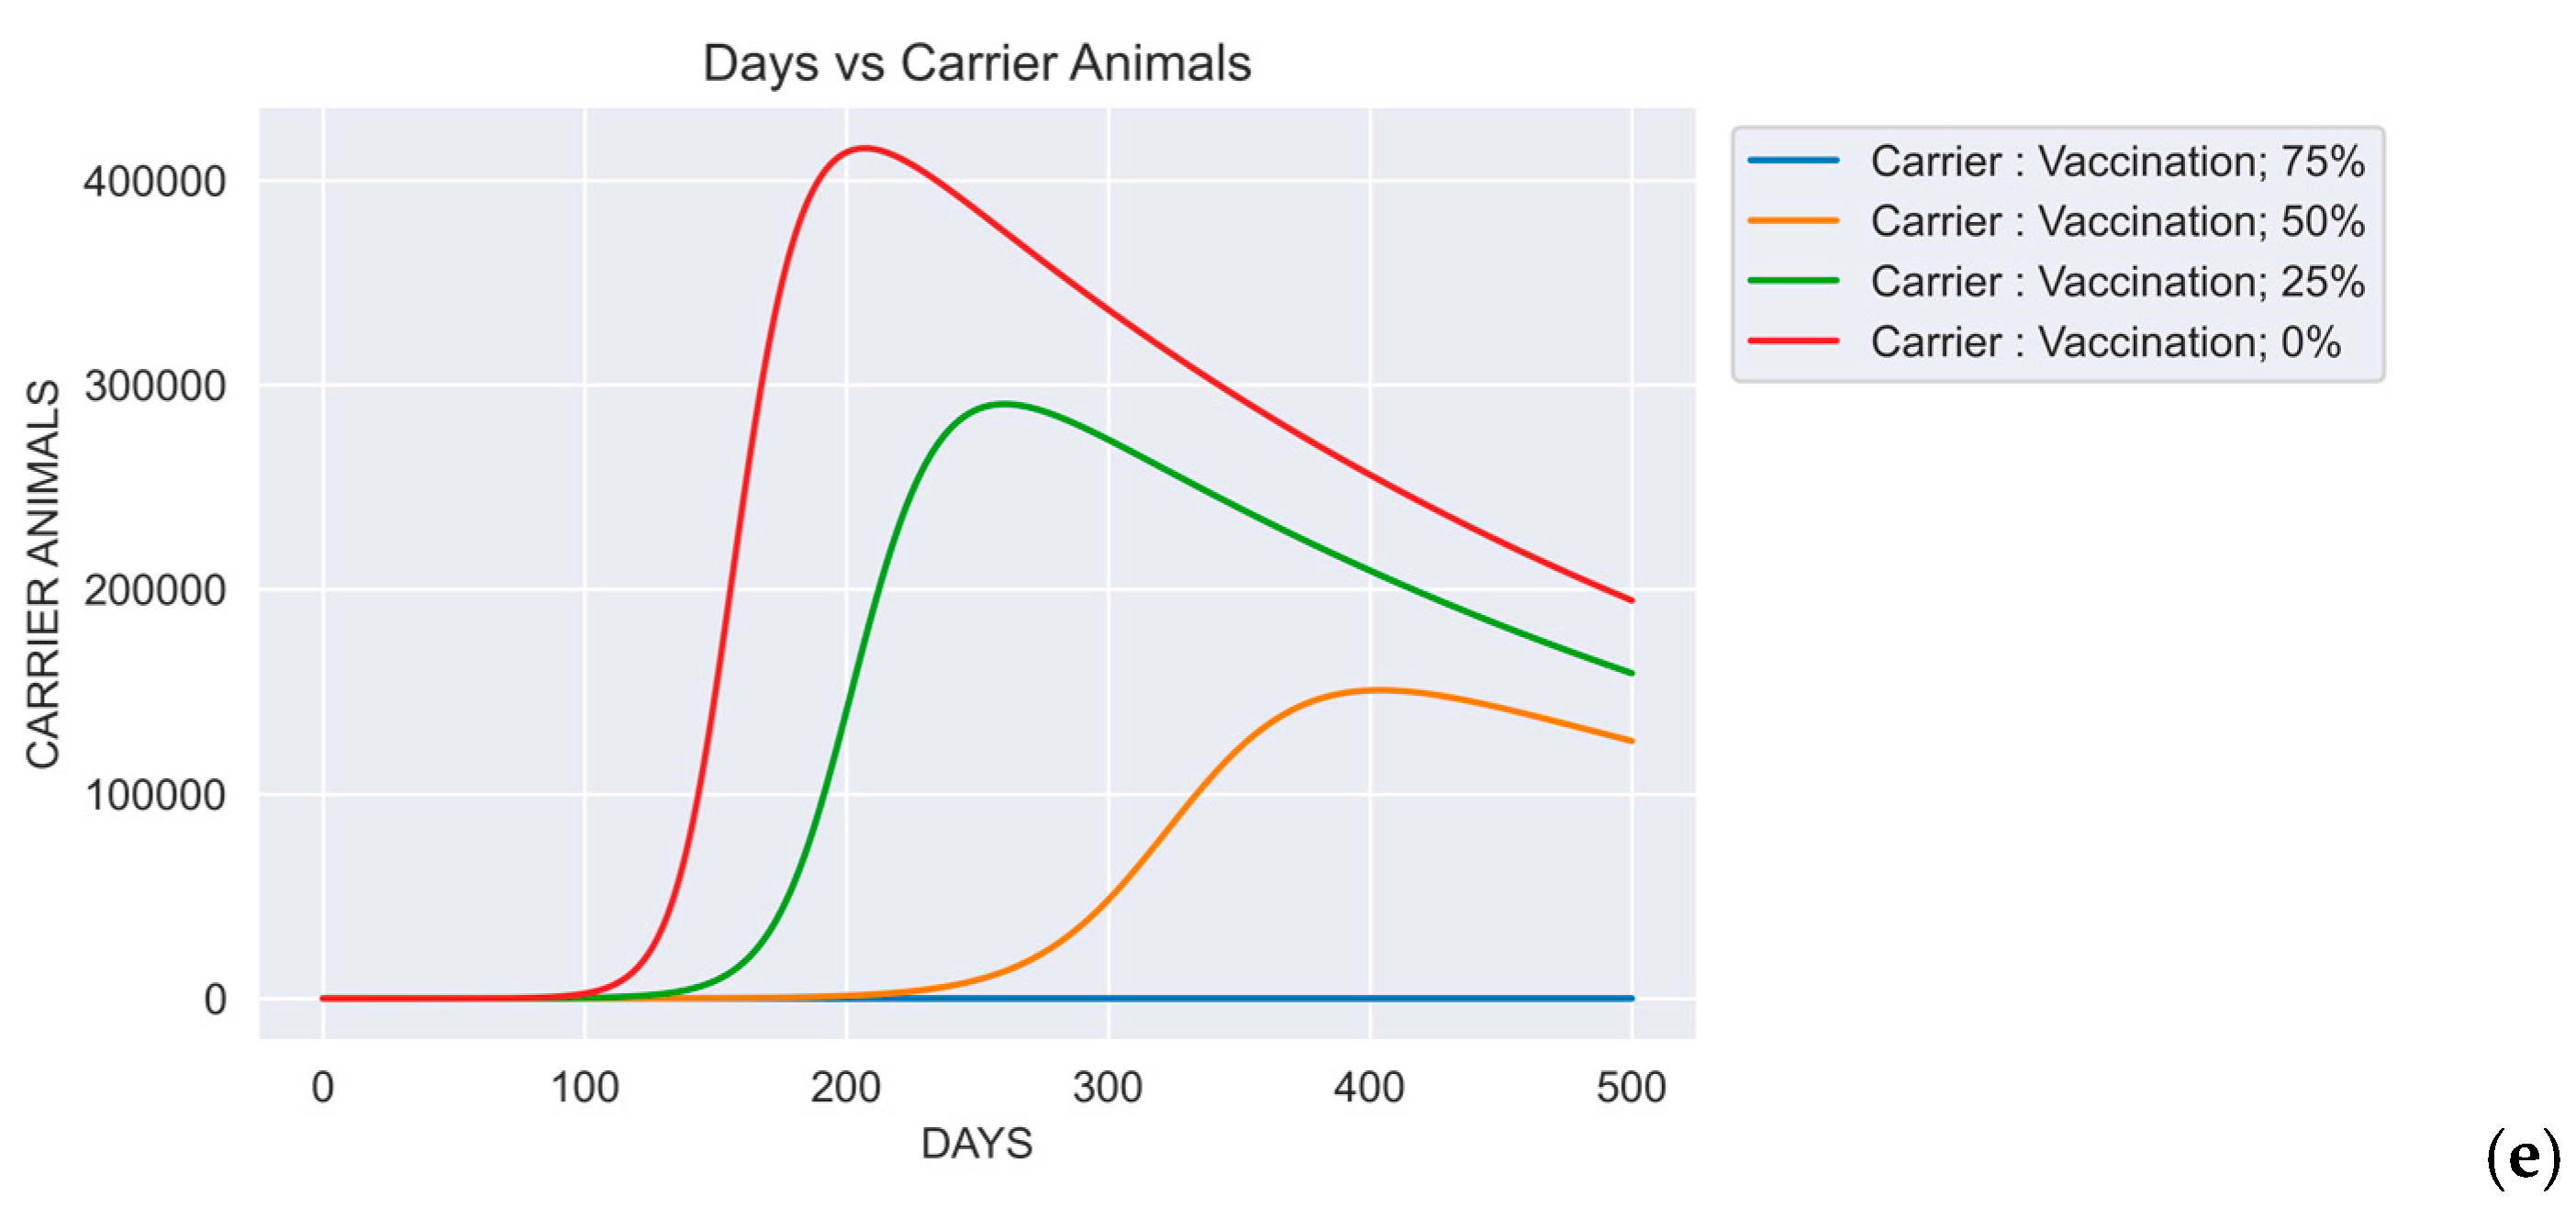
The impact of vaccination on FMD dynamics was evaluated by simulating varying levels of vaccination coverage and analyzing the resulting infection patterns. In the absence of vaccination (0% coverage), the epidemic peaked on day 157 with 267,114 infected animals. At 25% coverage, the peak was delayed to day 203, with 150,276 infections. Increasing coverage to 50% further postponed the peak to day 326, with a reduced infection count of 51,386 animals. At 75% vaccination coverage, the outbreak was nearly eliminated, with only a single infection and no discernible peak observed.
Figure 5.
(a), (b), (c), (d), (e) Graphs representing SEIRC stocks in accordance with proportion of animals immunized respectively. Different levels of vaccination coverage (V = 75%, 50%, 25%, 0%) impacted the spread of a disease in a population. All these simulations were done with R0 of 4, duration of infectivity was 14 and the only control strategy involved here was immunization.
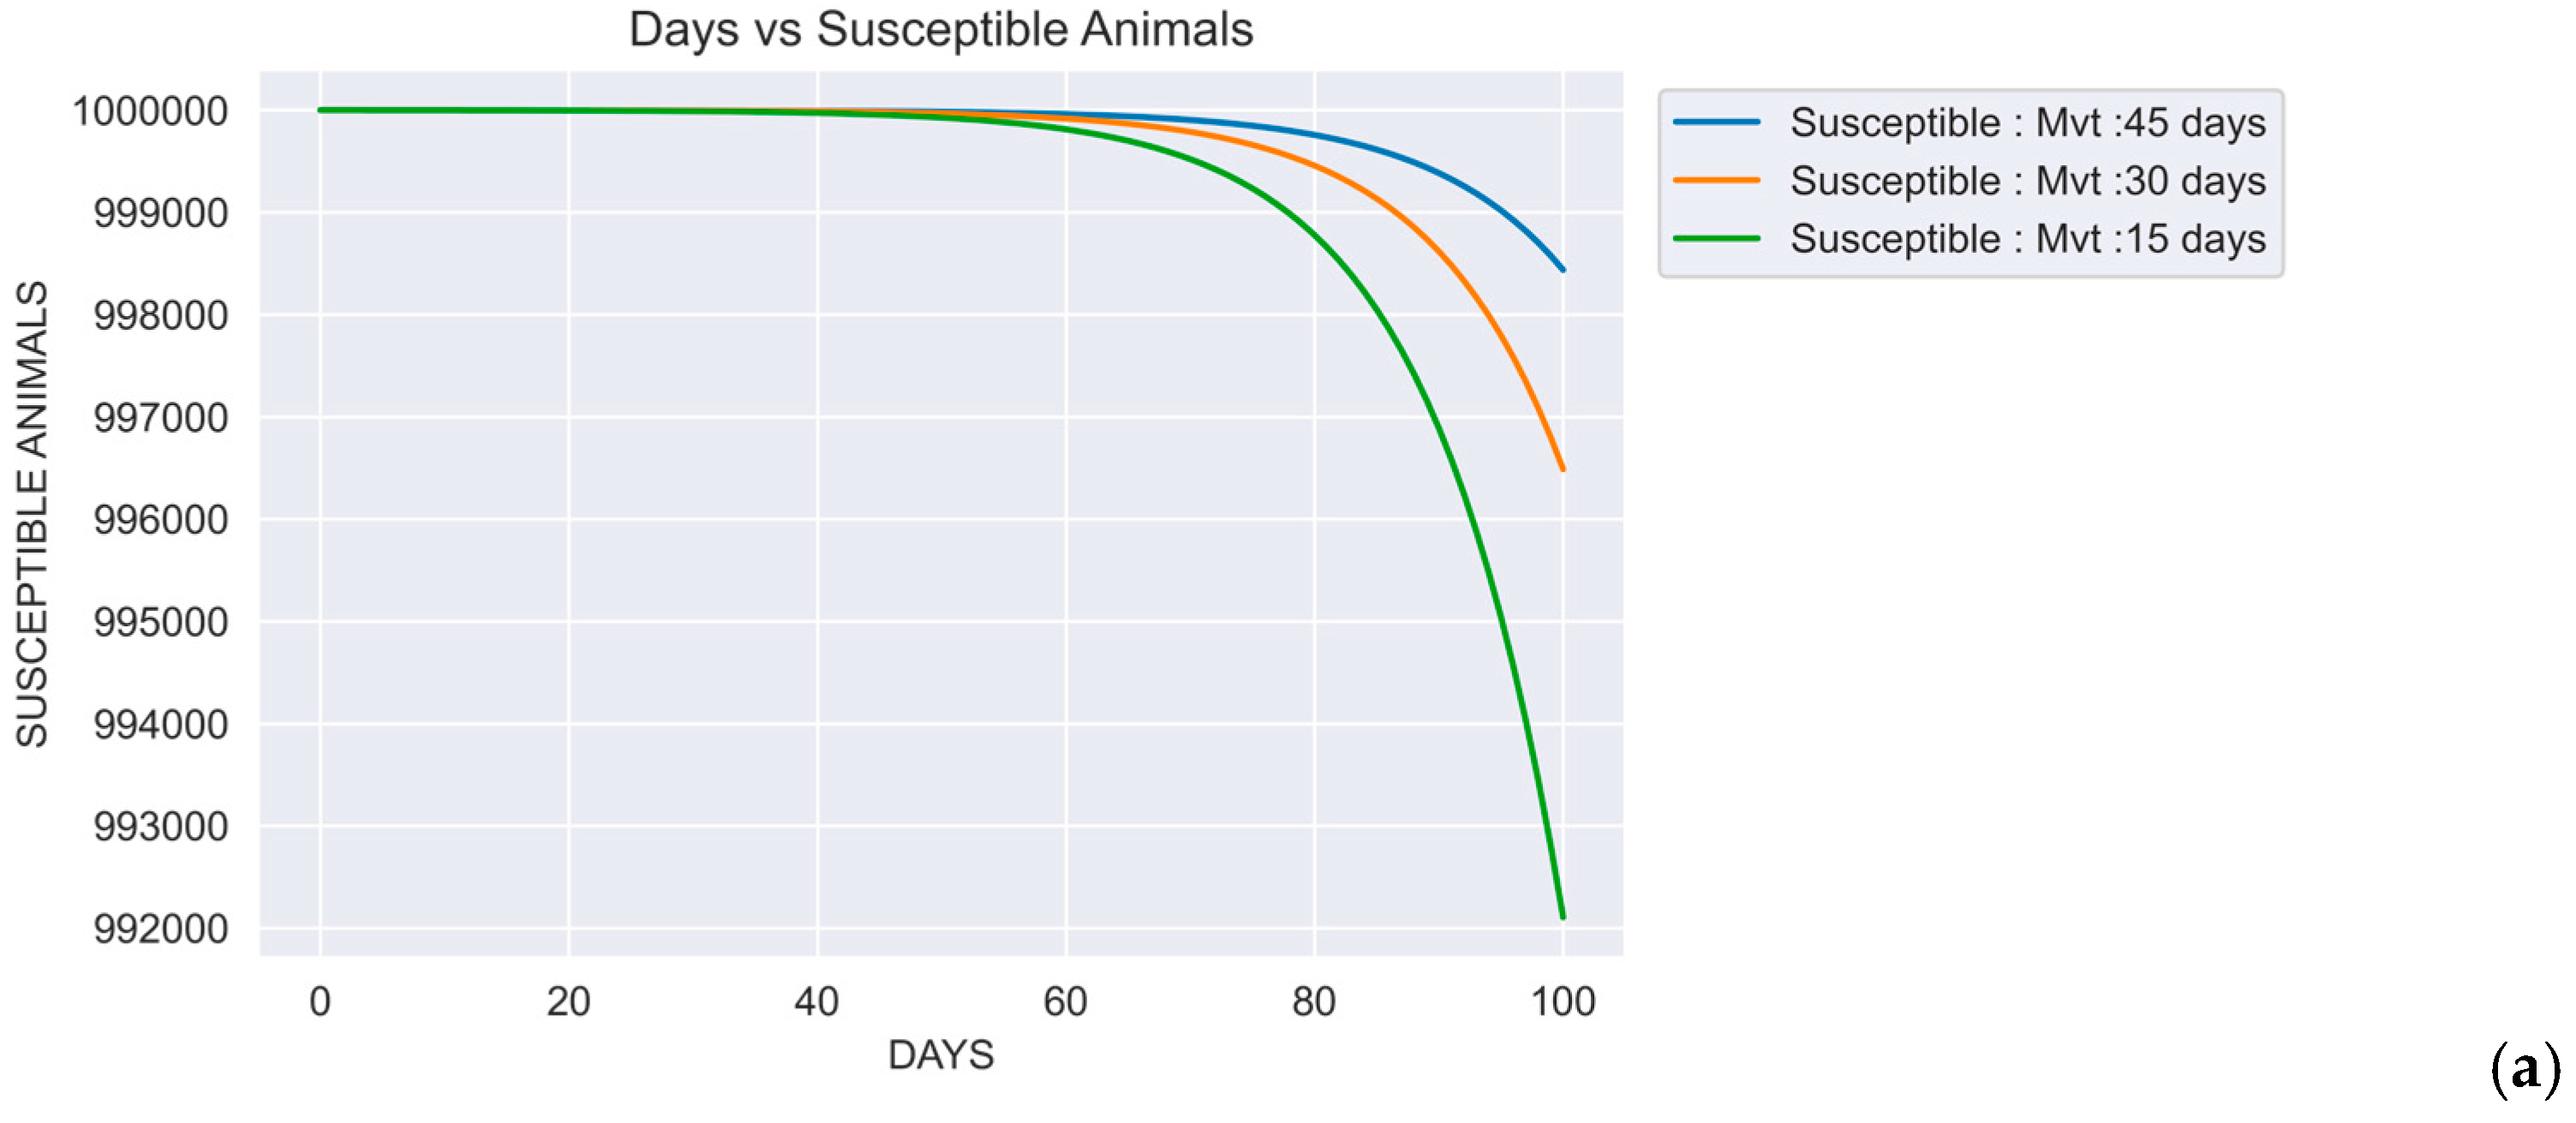
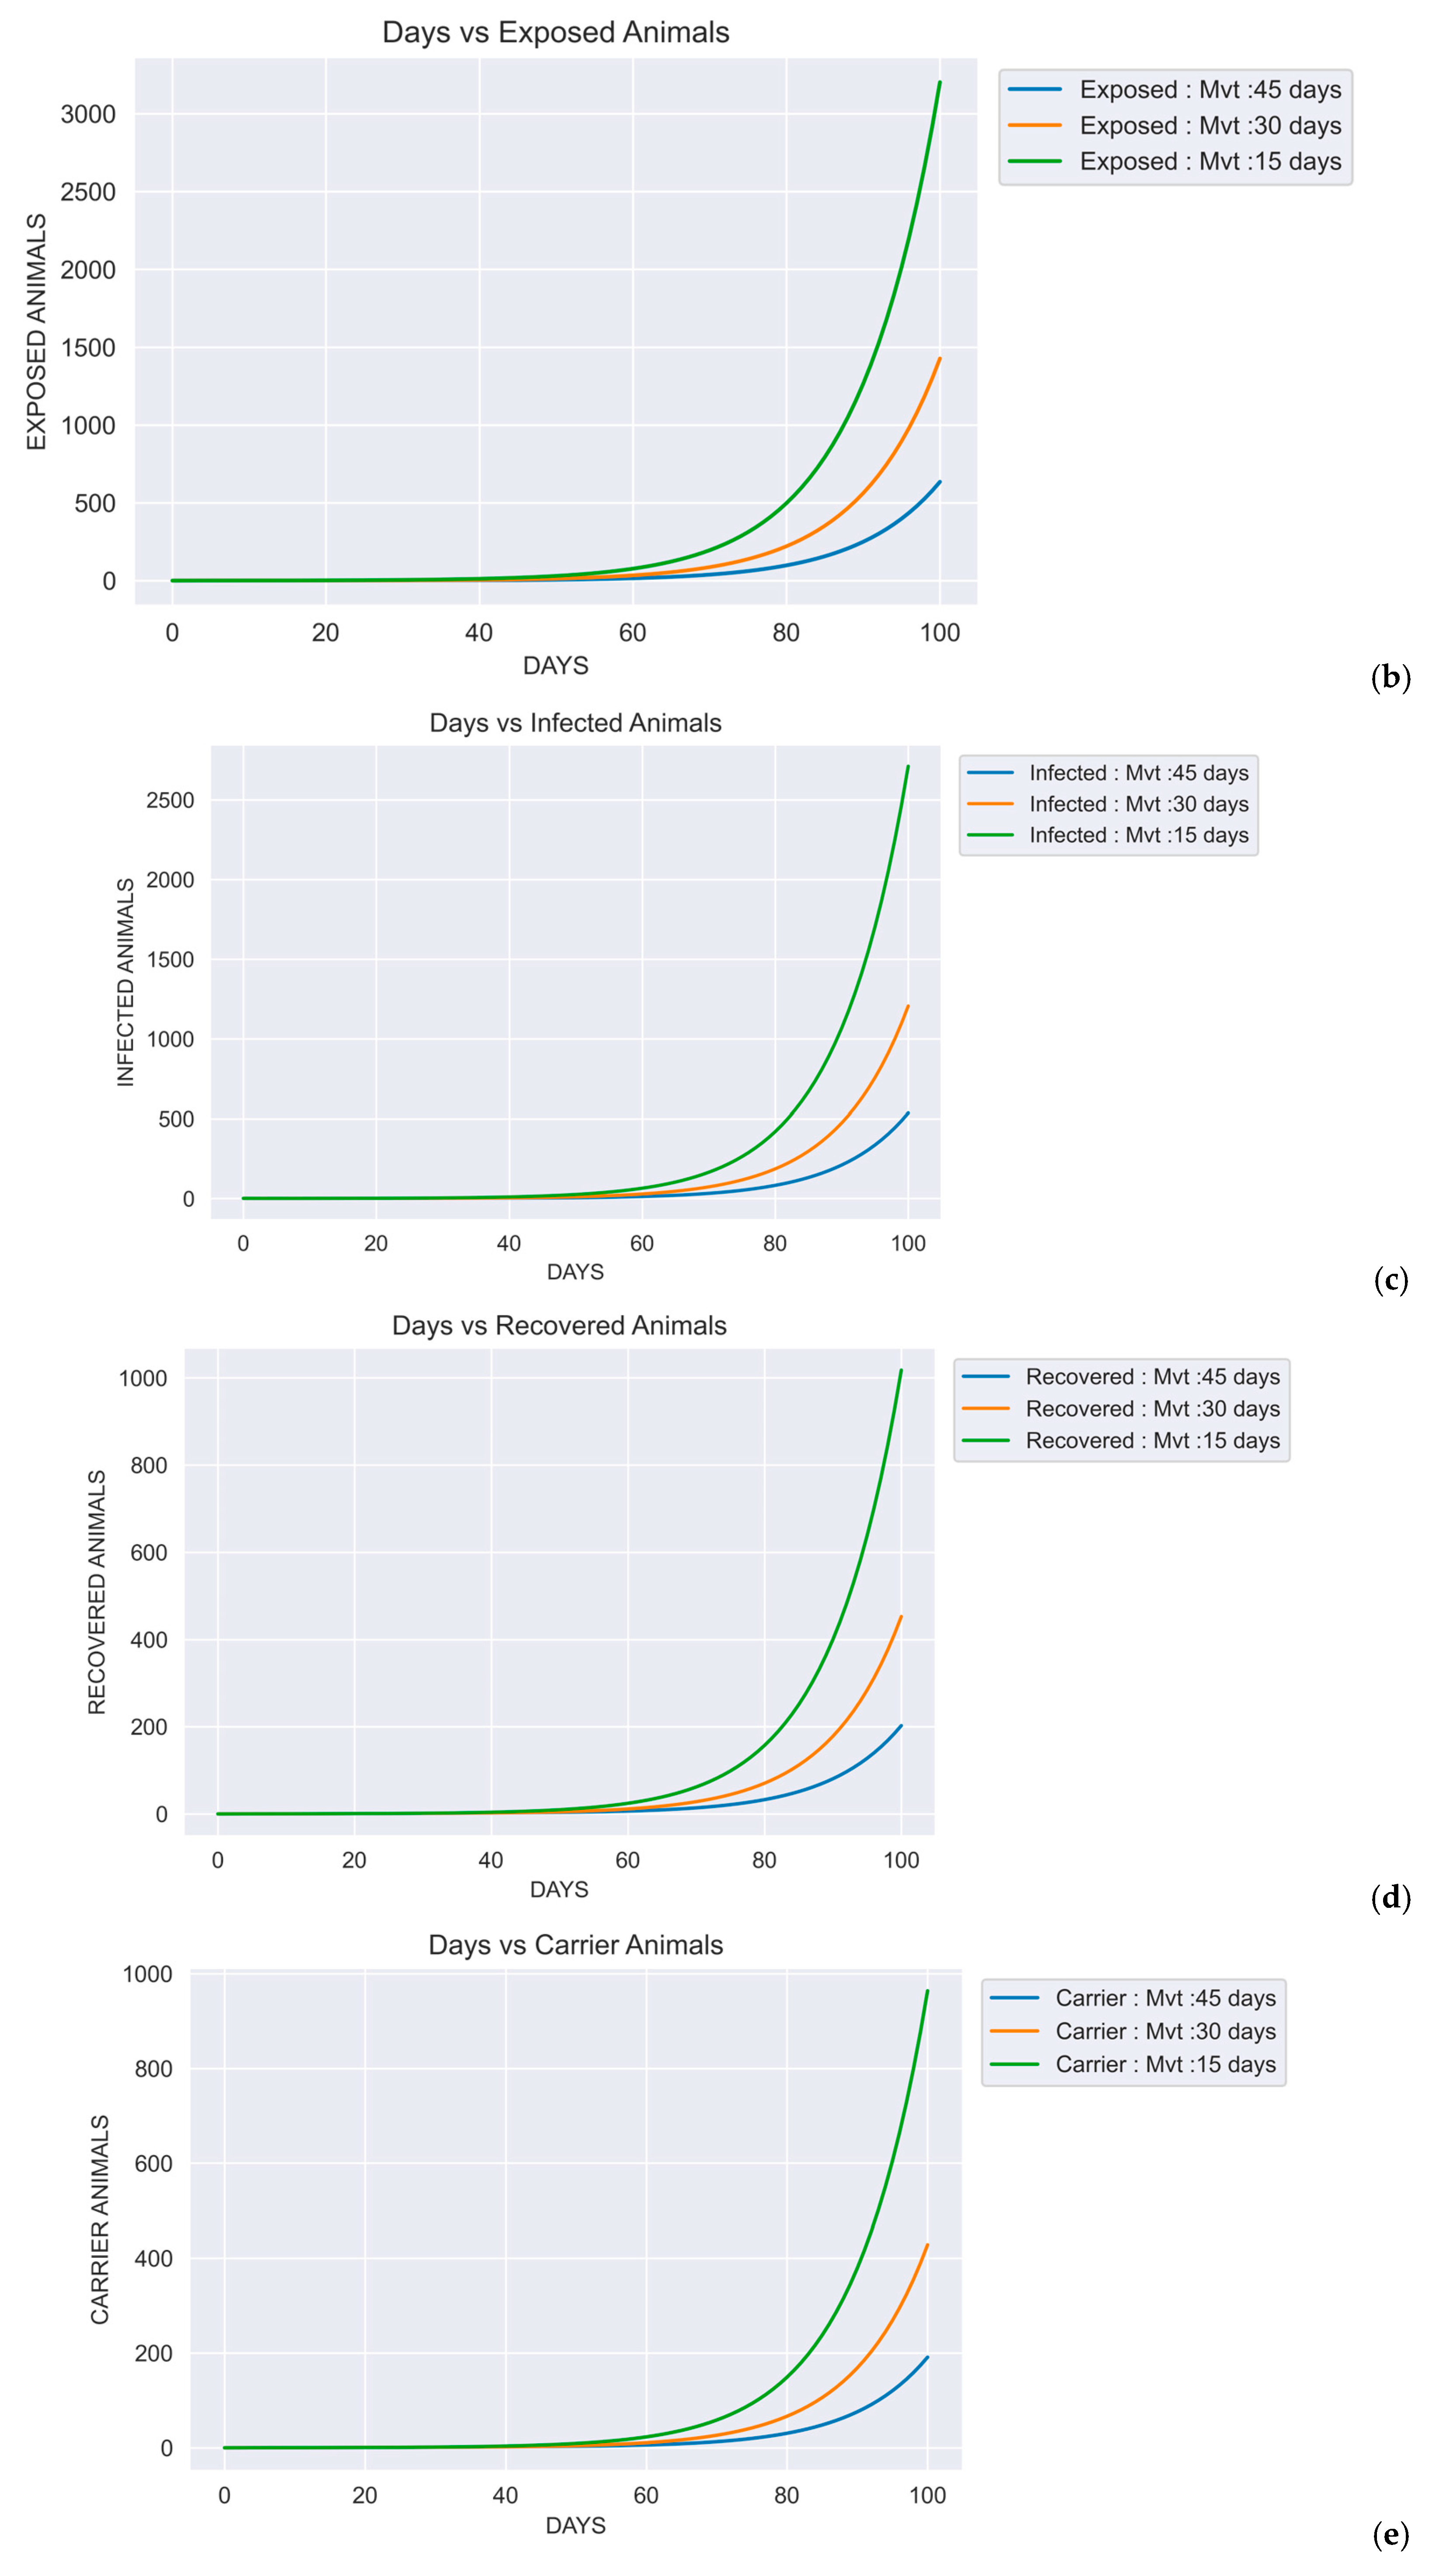
3.3.4. Impact of Movement Restrictions on Disease Dynamics
The influence of movement control duration on the spread of foot-and-mouth disease (FMD) was assessed through simulations varying the length of restriction periods. A 15-day movement control resulted in a rapid rise in infections, with the number of infected animals peaking at nearly 1,200 within 100 days. Extending the restriction to 30 days substantially reduced both the infection rate and peak number of cases. Further extending the duration to 45 days led to a delayed and significantly diminished outbreak, with the flattest infection curve observed. These results underscore the effectiveness of prolonged movement control in mitigating disease transmission. Additional simulations were conducted using a fixed basic reproduction number (R₀) of 4, while varying movement restriction durations (15, 30, and 45 days). The results consistently showed that longer movement control delayed the timing of the infection peak and reduced its magnitude, thereby creating a critical window for implementing complementary control strategies.
Figure 6.
(a), (b), (c), (d), (e) Graphs representing SEIRC stocks on different movement restriction durations of 45, 15 and 30 days. The simulations were configured with an R0 of 4, a 14-day duration of infectivity, no animals were vaccinated, and movement control measures was started on the initial day of first case. The movement reduction factor was set to 0.5.
3.3.5. Impact of Carriers on Population
Number of carriers over time under two different scenarios of carrier management: one with 65% of carriers managed and the other with 50% managed. In both scenarios, the number of carriers increases rapidly initially, reaching a peak and then gradually decreasing. However, the scenario with 65% of carriers managed (Figure 7: represented by the orange line) results in a lower peak and a faster decline in carrier numbers compared to the 50% management scenario (Figure 7 represented by the yellow line). This indicates that a higher proportion of managed carriers leads to a more effective reduction in the overall carrier population over time
4. Discussion
Causal loop is usually referred to as a circular sequence in which variables continuously influence one another, forming a feedback cycle. Each variable impacted the next, and ultimately, the final variable looped back to influence the first. These loops can involve additional variables, creating complex cycles with multiple elements, as described by [20]. Reinforcing loops, or positive loops, amplify changes among variables, whereas balancing loops, or negative loops, counteract changes to stabilize the system [21]. The causal loop diagram developed for the analysis of FMD dynamics highlighted the intricate interplay between various factors influencing the spread of disease& spread. It contained nine balancing loops (B1-B9) and two reinforcing loops (R1, R2), which illustrated the feedback mechanisms that either mitigated or exacerbated the transmission of FMD. The infected, susceptible, and recovered populations formed the central focus of this causal loop diagram. The infection rate, which dictated the transition of susceptible individuals to the infected category, was further influenced by factors such as vaccination rate and herd immunity levels. A reinforcing loop was formed by the interaction between environmental contamination and virus shedding from the infected population, which directly impacted the infection rate. This loop exemplified a positive feedback process, where an increase in one variable led to an increase in the other, driving the system into a log phase of rapid disease transmission. This dynamic aligned with the findings of [22], who detailed how viral shedding influenced environmental contamination, thereby elevating infection rates.
In contrast, a balancing loop was formed by government policies and public awareness, both critical in implementing movement control measures and vaccination strategies. These interventions reduced contact rates, thereby limiting the spread of FMD. As a result, the system entered a plateau, reflecting the stabilization achieved through control measures. [23] also emphasized the significant role of government initiatives in shaping effective prevention and control measures that successfully curb disease transmission. In conjunction with biosecurity protocols and farmers, adherence, these efforts were instrumental in managing the disease at the herd level.
Economic impacts further influenced public awareness and effectiveness of government policies. Trade and travel restrictions, driven by government intervention, played a crucial role in reducing contact between susceptible and infected populations, thus limiting the spread of the disease. As outlined by [24], balancing loops in the causal loop diagram represented stability or equilibrium. These negative feedback loops counteracted changes by responding in the opposite direction to deviations from a desired state, maintaining balance within the system. In contrast, reinforcing loops depicted rapid disease transmission in highly susceptible populations, functioning as positive feedback loops [25]. A similar approach was adopted by [26], who developed a causal loop diagram for rabies vaccination, incorporating a range of relevant variables. The conceptual SEIRC model for FMD in India gave an elaborate framework to understand how the disease takes place through different stages or compartments within the cattle population. Similarly, [27] described a simpler SEIRC conceptual model, focused on the cycles of FMDV replication and transmission in livestock. In this model, susceptible animals became infected through direct contact with infectious animals, ingestion of infected animal products, exposure to contaminated inanimate objects (fomites), or aerosol contact with infected animal products. Likewise, [18] also developed a stochastic, compartmental SEIRC model to explore disease persistence and dynamics. Their model varied the proportion of infectious individuals who became carriers before recovering and examining scenarios both with and without carriers. [28] developed a conceptual model that illustrated the impact of foot and mouth disease. However, this model was not aligned with the SEIRC conceptual model because it contained transmission dynamics along with economic impact of the disease.
The basic reproduction number (R0) is a fundamental metric used to indicate the contagiousness or transmissibility of infectious agents, and it is one of the most frequently utilized measures in the study of infectious disease dynamics [29]. In this study varying basic reproduction numbers were simulated in Vensim PLE and found that the outbreak dynamics varied significantly with different reproduction numbers (R0). The SIR model results emphasized the importance of the basic reproduction number (R0) in shaping the epidemic curve. Scenarios with higher R0 values demonstrated a faster and more widespread disease transmission, leading to higher infection peaks. Conversely, a reduction in R0 resulted in lower infection peaks and a flatter curve. Similar findings were also observed in SEIRC model. This is in accordance with [30] who stated that, when R0 was equal to or less than one, it indicated that the transmission chains were not self-sustaining, and a significant outbreak was unlikely. Contrarily, if the effective reproductive number exceeds one, there was a higher likelihood of an epidemic occurrence. According to [31] when R0 was less than one, each infected individual produced less than one new infected individual, which led to the prediction that the infection would eventually be cleared from the population. On the other hand, if R0 was greater than one, the pathogen could spread through the susceptible population. The most important and useful component of the R0 was this threshold behavior. Determining which control measures to apply and at what level in the event of an endemic infection was essential for effective control measures to lower R0 below unity [32]. [33] who used an SIR model to simulate epidemic dynamics under varying R₀ conditions. Conversely, lower R₀ values result in a slower spread and a more flattened epidemic curve
Infectiousness is the ability of the disease to spread from one animal to another. The length of various phases like incubation period, subclinical, clinical and total infectious period was different for different serotypes of FMD [34]. As per [15] the total infectious duration for the pan-serotypic FMDV was 10.8 days (8.2–14.2) and for specific serotypes, the infectious durations were 11.2 days (9.9–12.6) for serotype A, 9.6 days (8.3–11.0) for serotype O, and 10.7 days (8.5–13.4) for serotype Asia1. Simulations were carried out in SEIRC models with these above-mentioned infectious durations and a basic reproduction number (R0) of 4, it was observed that peak infection status of all the serotypes remained same but serotypes having lesser infectious duration anticipated sudden onset of outbreak. This is in par with [35] who reported that serotype O was linked to a rapid manifestation of clinical signs and the severity and progression of symptoms can differ widely across serotypes. Serotyping can aid in predicting outbreaks, as certain serotypes, such as serotype O, are linked to faster manifestation of clinical signs. Additionally, since commercially available vaccines do not offer cross-protection, understanding specific serotypes is crucial for improving immunization strategies [36]. Therefore, prompt diagnosis and tailored strategies are essential for effective management and outbreak control.
Vaccination was one of the important prevention and control strategy for preventing FMD [37]. Simulations were conducted using the SEIRC model with varying levels of vaccination coverage. When 75 per cent of the population was vaccinated (V = 0.75), the number of susceptible animals remained stable, infections were nearly nonexistent, and only a few animals required recovery, as the disease was effectively prevented. Moderate coverage (V = 0.5), where 50 percent of the population was vaccinated, led to a reduction in susceptible animals, a small peak in infections, and a gradual increase in recoveries as the outbreak was somewhat contained. In contrast, low coverage (V = 0.25), with only 25 per cent of the population vaccinated, resulted in a mild decline in susceptible animals, a significant peak in infections, and many recoveries. The herd immunity threshold was the proportion of a population that needed to be immune to prevent the spread of a disease [38]. When vaccination coverage reached 75 per cent, infections were almost eliminated, likely due to achieving the herd immunity threshold (HIT). The minimum percentage of animals required to achieve the herd immunity threshold (HIT) could be calculated using the formula (1 - 1/R0) [39]. This was consistent with [40], who also applied this equation to determine HIT. Achieving HIT effectively stopped disease transmission and provided protection even to unvaccinated animals. In this model, R0 was assumed to be 4, indicating that 75 per cent of animals needed to be vaccinated to reach the HIT. Additionally, [41] found that increasing the size of the vaccination zone during an outbreak reduced both its duration and the number of herds culled, which aligns with the outcomes observed in this SEIRC models.
Simulations in SEIRC model were conducted for 90 days with a constant R0 of 4, duration of infectivity of 14 days and movement control reduction fraction of 0.5 revealed that, movement restrictions effectively delayed the peak infection day as well as level, thereby provided crucial time for interventions. Movement control durations were kept for 15, 30 and 45 days. This is in accordance with [42] who demonstrated that regulations like movement control of 30 days led to a concentration of the FMD-affected area, resulting in a significant reduction in the size and duration of epidemics. According to [43], the impact of movement restrictions was more pronounced in highly connected markets than in low connectivity markets. They suggested implementing a cattle trader tracking system while considering the potential socio-economic effects. In the SEIRC model simulations, the percentage of animals becoming carriers was set at 50 per cent and 65 per cent, based on studies by [44] and [45] respectively. Scenarios with changing probability of becoming carriers were simulated, when the probability increased, the number of carriers also increased, indicated the proper functioning of the developed model. This also in turn led to a decrease in recovered animals, prolonging the persistence of infection. [46] also pointed out that carriers shed only a very little infectious virus, it is still enough to spread disease to susceptible animals. This means that even though the risk from individual carrier cattle is low, the large number of carriers following FMD outbreaks in endemic areas could still contribute to the spread of the virus at the population level and leads to persistent infection in the population. Similarly, [47] also specified that FMD persistence through carrier transmission was feasible at significantly lower rates than earlier estimates, with the length of the carrier phase and natural immunity being critical factors indicating the importance of carrier phase.
5. Conclusions
The model was utilized to study the dynamics of FMD transmission under varying key epidemiological parameters, including the basic reproduction number (R₀), duration of the infectivity period, population immunity levels, and implementation of control strategies such as vaccination and movement restrictions. By systematically altering these parameters, the model simulated multiple outbreak scenarios to evaluate the effectiveness of different intervention measures.
The simulation outputs were consistent with general epidemiological understanding, suggesting that vaccination and movement control are effective strategies for reducing the transmission of FMD. Within the model, these interventions significantly decreased both the number of infections and the duration of outbreaks. This supports their continued use as key containment measures in FMD control programs.
This study has several limitations that should be acknowledged. The model does not incorporate actual data from the field, which may limit its contextual accuracy. It also does not utilize agent-based modeling, which could have captured individual-level behavioral variability and complex contact patterns. The influence of macro- and microclimatic conditions on disease dynamics was not considered, nor was the heterogeneity within the population in terms of susceptibility, immunity, and contact structure. Additionally, the model did not account for intra-herd and inter-herd transmission pathways, or the role of other susceptible species such as sheep, goats, and pigs in the epidemiology of foot-and-mouth disease (FMD). Furthermore, the scope of control strategies was limited to vaccination and movement restrictions, excluding other potentially relevant interventions such as culling, quarantine, and enhanced surveillance.
Future improvements should focus on integrating empirical and field-level data to enhance the model’s realism and accuracy. Incorporating agent-based modeling approaches would allow for better representation of population heterogeneity and dynamic interactions [48]. Climatic variables should be included to understand their influence on disease spread, especially in diverse agro-ecological zones. Modeling both intra- and inter-herd transmission pathways, along with including additional species that can act as reservoirs or transmitters of the virus, will improve the model’s comprehensiveness. Lastly, expanding the range of control measures evaluated will provide a more holistic framework for decision-making in FMD management.
References
- India Population. Worldometers. Available online: https://www.worldometers.info/world-population/india-population/ (accessed on 24 November 2025).
- Godfray, H.C.J.; Garnett, T. Food security and sustainable intensification. Philos. Trans. R. Soc. B 2014, 369, 20120273. [Google Scholar] [CrossRef] [PubMed]
- Das, A.; Raju, R.; Patnaik, N.M. Present scenario and role of livestock sector in rural economy of India: A review. Int. J. Livest. Res. 2020, 10, 23–30, (accessed on 24 November 2025). [Google Scholar] [CrossRef]
- Banda, L.J.; Tanganyika, J. Livestock provide more than food in smallholder production systems of developing countries. Anim. Front. 2021, 11, 7–14. [Google Scholar] [CrossRef] [PubMed]
- Tomley, F.M.; Shirley, M.W. Livestock infectious diseases and zoonoses. Philos. Trans. R. Soc. B 2009, 364, 2637–2642. [Google Scholar] [CrossRef]
- Buller, H.; Blokhuis, H.; Jensen, P.; Keeling, L. Towards farm animal welfare and sustainability. Animals 2018, 8, 81. [Google Scholar] [CrossRef]
- McElwain, T.F.; Thumbi, S.M. Animal pathogens and their impact on animal health, the economy, food security, food safety and public health. Rev. Sci. Tech. Off. Int. Epizoot. 2017, 36, 423. [Google Scholar] [CrossRef]
- Edo, J.J.; Bekele, J.T. A review on trans-boundary animal diseases management. Vet. Res. 2019, 12, 1–9.16. [Google Scholar]
- James, A.D.; Rushton, J. The economics of foot and mouth disease. Rev. Sci. Tech. Off. Int. Epizoot. 2002, 21, 637–641. [Google Scholar] [CrossRef]
- Govindaraj, G.; Krishnamohan, A.; Raveendra, H.; Nandakumar, S.; Lokhande, T.; Krishna, S.; Amit, K.; Limaye, A.; Natchimuthu, K.; Tanveer, A.K.; Dash, B.B. Economic impact of foot-and-mouth disease in cattle and buffaloes in India. Prev. Vet. Med. 2021, 195, 105318. [Google Scholar]
- Chakraborty, S.; Kumar, N.; Dhama, K.; Verma, A.K.; Tiwari, R.; Kumar, A.; Kapoor, S.; Singh, S.V. Foot-and-mouth disease, an economically important disease of animals. Adv. Anim. Vet. Sci. 2014, 2, 1–18. [Google Scholar] [CrossRef]
- Adegoke, B.O.; Odugbose, T.; Adeyemi, C. Data analytics for predicting disease outbreaks: A review of models and tools. Int. J. Life Sci. Res. Updates 2024, 2, 1–9. [Google Scholar] [CrossRef]
- Akselrod, H.; Mercon, M.; Kirkeby Risoe, P.; Schlegelmilch, J.; McGovern, J.; Bogucki, S. Creating a process for incorporating epidemiological modelling into outbreak management decisions. J. Bus. Contin. Emerg. Plan. 2012, 6, 68–83. [Google Scholar] [CrossRef]
- Calkin, D.E.; Thompson, M.P.; Finney, M.A.; Hyde, K.D. A real-time risk assessment tool supporting wildland fire decision making. J. For. 2011, 109, 274–280. [Google Scholar]
- Yadav, S.; Stenfeldt, C.; Branan, M.A.; Moreno-Torres, K.I.; Holmstrom, L.K.; Delgado, A.H.; Arzt, J. Parameterization of the durations of phases of foot-and-mouth disease in cattle. Front. Vet. Sci. 2019, 6, 263. [Google Scholar] [CrossRef] [PubMed]
- Mohamad, A.B.D.U.L.L.A.H.; Shaari, N.F. Foot and mouth disease on cattle in Peninsular Malaysia: Towards a sustainable livestock. J. Sustain. Sci. Manag. 2022, 17, 149–156. [Google Scholar] [CrossRef]
- Forrester, J.W. Lessons from system dynamics modeling. Syst. Dyn. Rev. 1987, 3, 136–149. [Google Scholar] [CrossRef]
- McLachlan, I.; Marion, G.; McKendrick, I.J.; Porphyre, T.; Handel, I.G.; Bronsvoort, B.D.C. Endemic foot and mouth disease: Pastoral in-herd disease dynamics in sub-Saharan Africa. Sci. Rep. 2019, 9, 17349. [Google Scholar] [CrossRef] [PubMed]
- Hayer, S.S.; Ranjan, R.; Biswal, J.K.; Subramaniam, S.; Mohapatra, J.K.; Sharma, G.K.; Rout, M.; Dash, B.B.; Das, B.; Prusty, B.R.; Sharma, A.K. Quantitative characteristics of the foot-and-mouth disease carrier state under natural conditions in India. Transbound. Emerg. Dis. 2018, 65, 253–260. [Google Scholar] [CrossRef]
- Bridgeland, D.M.; Zahavi, R. Business Process Modeling Notation; Elsevier: Burlington, MA, USA, 2009; p. 500 pp. [Google Scholar]
- Lannon, C.J.S.T. Causal loop construction: The basics. The Systems Thinker 2012, 23, 7–8. [Google Scholar]
- MacLachlan, N.; Dubovi, E. Fenner’s Veterinary Virology, 5th ed.; Academic Press: New York, NY, USA, 2017; p. 602 pp. [Google Scholar]
- Gleeson, L.J. A review of the status of foot and mouth disease in South-East Asia and approaches to control and eradication. Rev. Sci. Tech. 2002, 21, 465–472. [Google Scholar] [CrossRef]
- Sterman, J. Instructor's Manual to Accompany Business Dynamics: Systems Thinking and Modeling for a Complex World, 3rd ed.; McGraw-Hill: Cambridge, MA, USA, 2000; 1008p. [Google Scholar]
- Hayward, J.; Boswell, G.P. Model behaviour and the concept of loop impact: A practical method. Syst. Dyn. Rev. 2014, 30, 29–57. [Google Scholar] [CrossRef]
- Savadogo, M.; Renmans, D.; Alambedji, R.B.; Tarnagda, Z.; Antoine-Moussiaux, N. Using causal loop analysis to explore pathways for zoonosis control in low-income setting: The case of dog rabies vaccination in Burkina Faso. Prev. Vet. Med. 2022, 203, 105623. [Google Scholar] [CrossRef]
- Paton, D.J.; Gubbins, S.; King, D.P. Understanding the transmission of foot-and-mouth disease virus at different scales. Curr. Opin. Virol. 2018, 28, 85–91. [Google Scholar] [CrossRef]
- Perry, B.D.; Randolph, T. The economics of foot and mouth disease, its control and its eradication. Sci. Méd. 2003, 1, 23–41. [Google Scholar]
- Delamater, P.L.; Street, E.J.; Leslie, T.F.; Yang, Y.T.; Jacobsen, K.H. Complexity of the basic reproduction number (R0). Emerg. Infect. Dis. 2019, 25, 1. [Google Scholar] [CrossRef] [PubMed]
- Mushayabasa, S.; Tapedzesa, G. Modeling the effects of multiple intervention strategies on controlling foot-and-mouth disease. Biomed. Res. Int. 2015, 2015, 584234. [Google Scholar] [CrossRef] [PubMed]
- Heffernan, J.M.; Smith, R.J.; Wahl, L.M. Perspectives on the basic reproductive ratio. J. R. Soc. Interface 2005, 2, 281–293. [Google Scholar] [CrossRef] [PubMed]
- Arjkumpa, O.; Picasso-Risso, C.; Perez, A.; Punyapornwithaya, V. Subdistrict-level reproductive number for foot and mouth disease in cattle in Northern Thailand. Front. Vet. Sci. 2021, 8, 757132. [Google Scholar] [CrossRef]
- Aparna, P.A.; Davis, J.K.; Kaniyamattam, K.; Tresamol, P.V.; Vinodkumar, K.; Jolly, D. Analyzing the dynamics of foot-and-mouth disease transmission: A model-based approach. J. Vet. Anim. Sci. 2025, 56, 45–52. [Google Scholar] [CrossRef]
- Mardones, F.; Perez, A.; Sanchez, J.; Alkhamis, M.; Carpenter, T. Parameterization of the duration of infection stages of serotype O foot-and-mouth disease virus: An analytical review and meta-analysis with application to simulation models. Vet. Res. 2010, 41. [Google Scholar] [CrossRef]
- Islam, M.S.; Habib, M.A.; Islam, M.R.; Mahmud, M.S.; Saha, P.C.; Ruba, T.; Das, P.M.; Khan, M.A. Clinicopathological investigation of foot and mouth disease and serotype identification of the viruses in cattle of Bangladesh. Immunol. Infect. Dis. 2017, 5, 16–23. [Google Scholar] [CrossRef]
- Parida, S. Vaccination against foot-and-mouth disease virus: Strategies and effectiveness. Expert Rev. Vaccines 2009, 8, 347–365. [Google Scholar] [CrossRef]
- Orsel, K.; Bouma, A. The effect of foot-and-mouth disease (FMD) vaccination on virus transmission and the significance for the field. Can. Vet. J. 2009, 50, 1059. [Google Scholar]
- Sharma, G.K.; Mahajan, S.; Matura, R.; Biswal, J.K.; Ranjan, R.; Subramaniam, S.; Misri, J.; Bambal, R.G.; Pattnaik, B. Herd immunity against foot and mouth disease under different vaccination practices in India. Transbound. Emerg. Dis. 2017, 64, 1133–1147. [Google Scholar] [CrossRef]
- Halloran, M.E.; Longini, I.M.; Struchiner, C.J. Design and analysis of vaccine studies, 2nd ed.; Springer: New York, NY, USA, 2010; 408p. [Google Scholar]
- Gibson, A.J.; Paton, D.J.; Werling, D. Vaccination strategies, implementation, and monitoring. In Veterinary Vaccines: Principles and Applications, 1st ed.; Wiley-Blackwell: United Kingdom, 2021; 442p. [Google Scholar]
- McReynolds, S.W.; Sanderson, M.W.; Reeves, A.; Hill, A.E. Modeling the impact of vaccination control strategies on a foot and mouth disease outbreak in the Central United States. Prev. Vet. Med. 2014, 117, 487–504. [Google Scholar] [CrossRef] [PubMed]
- Velthuis, A.G.J.; Mourits, M.C.M. Effectiveness of movement-prevention regulations to reduce the spread of foot-and-mouth disease in The Netherlands. Prev. Vet. Med. 2007, 82, 262–281. [Google Scholar] [CrossRef]
- Wiratsudakul, A.; Sekiguchi, S. The implementation of cattle market closure strategies to mitigate foot-and-mouth disease epidemics: A contact modeling approach. Res. Vet. Sci. 2018, 121, 76–84. [Google Scholar] [CrossRef]
- Moonen, P.; Schrijver, R. Carriers of foot-and-mouth disease virus: A review. Vet. Q. 2000, 22, 193–197. [Google Scholar] [CrossRef] [PubMed]
- Stenfeldt, C.; Eschbaumer, M.; Rekant, S.I.; Pacheco, J.M.; Smoliga, G.R.; Hartwig, E.J.; Rodriguez, L.L.; Arzt, J. The foot-and-mouth disease carrier state divergence in cattle. J. Virol. 2016, 90, 6344–6364. [Google Scholar] [CrossRef]
- Stenfeldt, C.; Arzt, J. The carrier conundrum: A review of recent advances and persistent gaps regarding the carrier state of foot-and-mouth disease virus. Pathogens 2020, 9, 167. [Google Scholar] [CrossRef] [PubMed]
- Fletcher, G.G.; Gorsich, E.E.; Tildesley, M.J. A model exploration of carrier and movement transmission as potential explanatory causes for the persistence of foot-and-mouth disease in endemic regions. Transbound. Emerg. Dis. 2022, 69, 2712–2726. [Google Scholar] [CrossRef] [PubMed]
- Kaniyamattam, K. Agent-based modeling: A historical perspective and comparison to other modeling techniques. J. Anim. Sci. 2022, 100, 32–33. [Google Scholar] [CrossRef]
Figure 7.
Recovered and Carrier stock dynamics under carrier percentage of 50% and 65%.
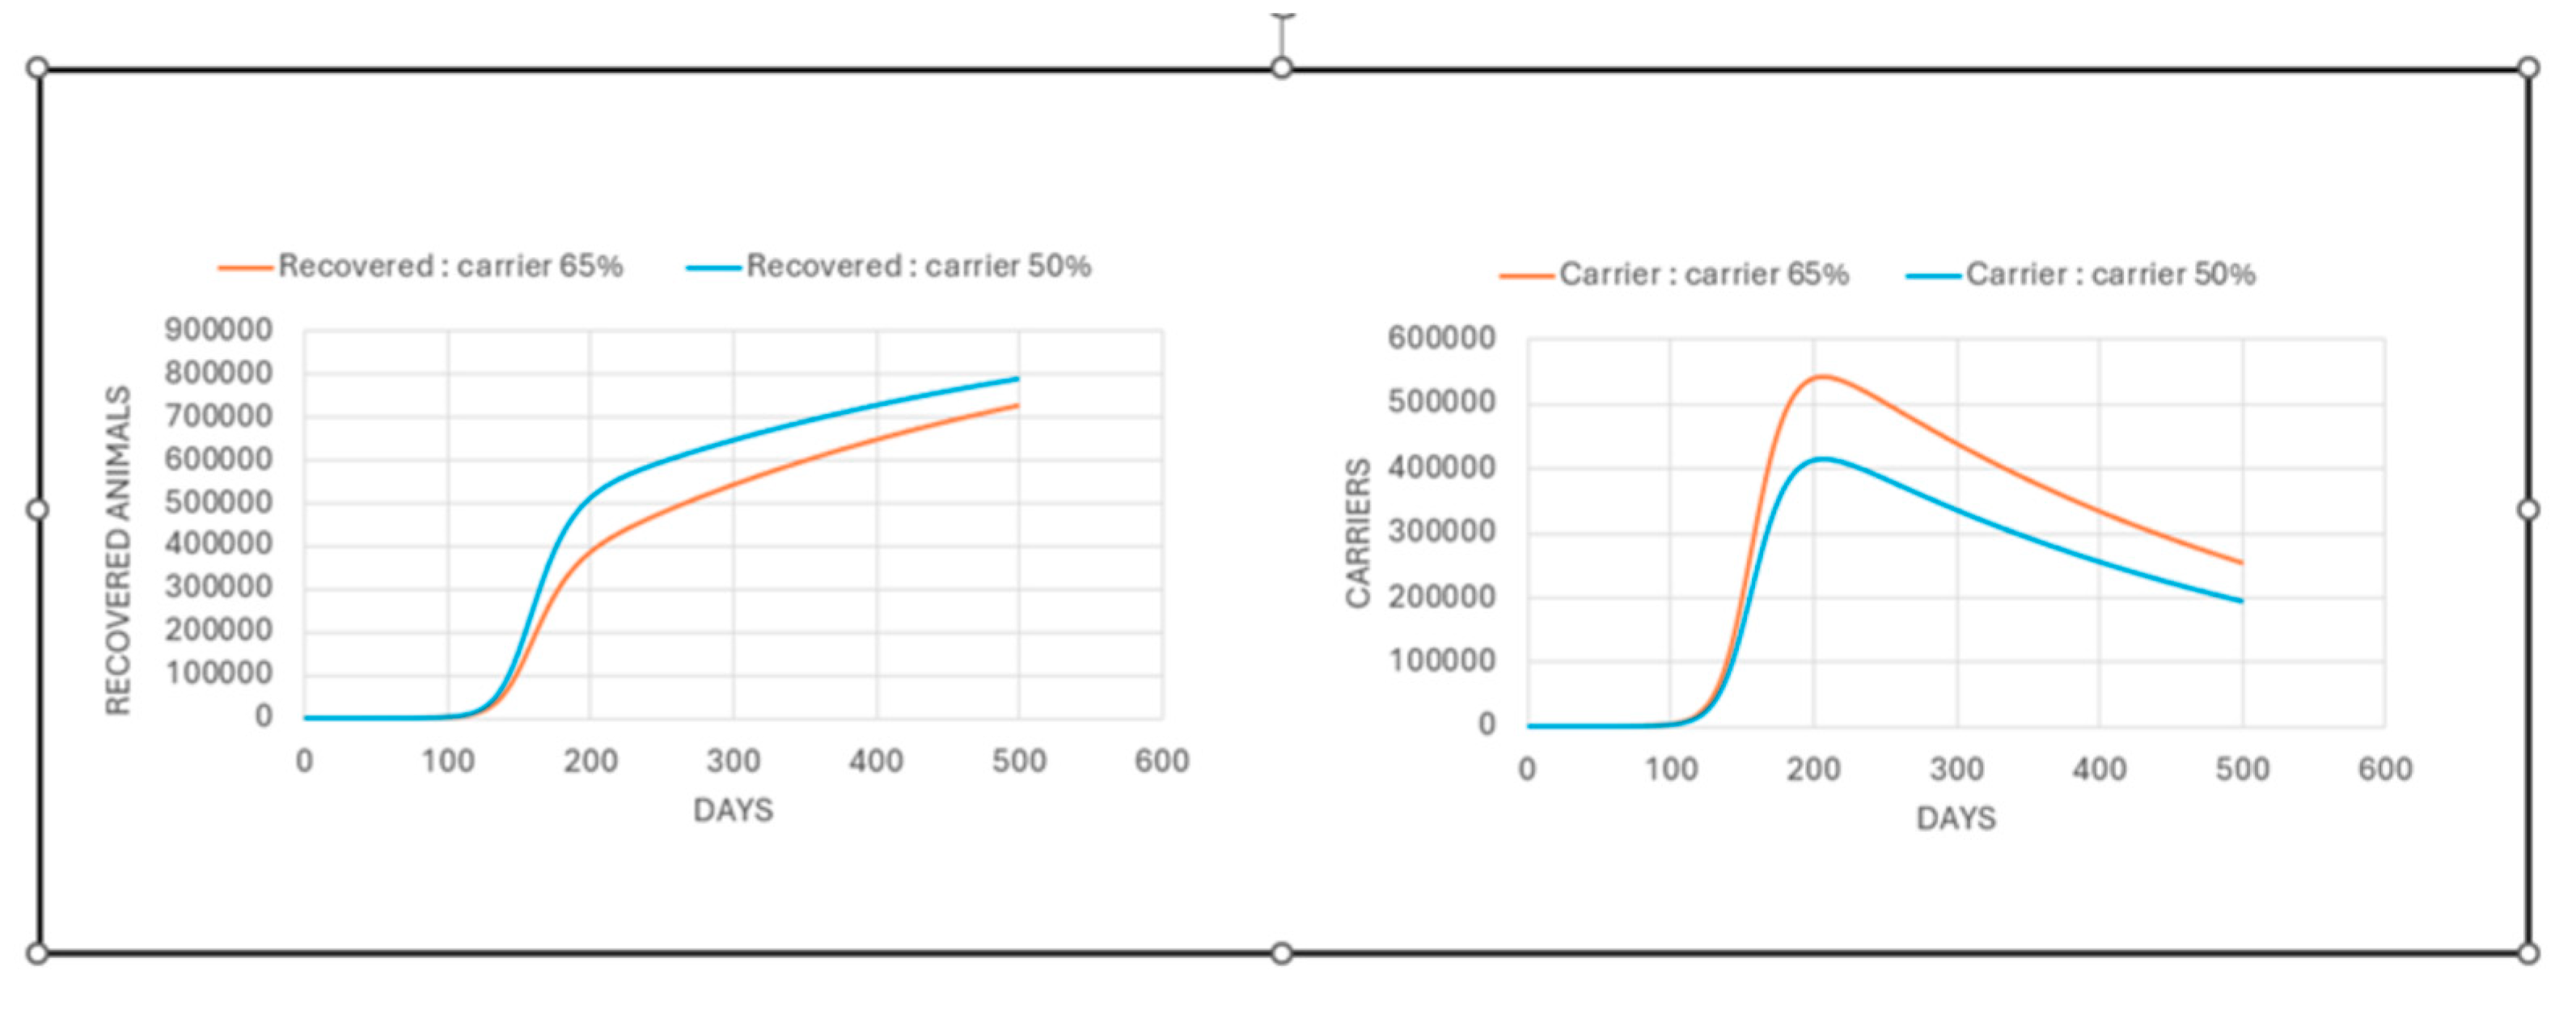

Table 1.
Documentation of stocks, flows and auxiliary variables sourced from literature review.
| Sl. No | Stocks | Flows | Auxiliary variables |
| a) | Susceptible (S) | Exposure Rate (ε) | Immunity duration (ρ) |
| b) | Exposed (E) | Infection Rate (β) | Basic Reproduction Number (R₀) |
| c) | Infected (I) | Recovery Rate (γ) | Transmission Rate (ω) |
| d) | Recovered (R) | Rate of carrier (µ) | Incubation Period (η) |
| e) | Carrier | Vaccine coverage (ι) | |
| f) | Reproduction ratio (R) | ||
| g) | Population (N) | ||
| h) | Case Fatality Rate (ϝ) | ||
| i) | Vaccination Rate (V) | ||
| j) | Movement control reduction fraction (κ) | ||
| k) | Movement control duration (φ) | ||
| l) | Movement control start time (ν) | ||
| m) | Fraction of animals vaccinated (Vf) | ||
| n) | Vaccination start time (Tv) | ||
| o) | Infectivity Period (di) | ||
| p) | Carrier duration (dc) | ||
| q) | Fraction susceptible (χ) | ||
| r) | Initial infected (I’) | ||
| s) | Carrier to recovery rate (λ) | ||
| t) | Percentage of carrier (Pc) |
Disclaimer/Publisher’s Note: The statements, opinions and data contained in all publications are solely those of the individual author(s) and contributor(s) and not of MDPI and/or the editor(s). MDPI and/or the editor(s) disclaim responsibility for any injury to people or property resulting from any ideas, methods, instructions or products referred to in the content. |
© 2026 by the authors. Licensee MDPI, Basel, Switzerland. This article is an open access article distributed under the terms and conditions of the Creative Commons Attribution (CC BY) license.
Copyright: This open access article is published under a Creative Commons CC BY 4.0 license, which permit the free download, distribution, and reuse, provided that the author and preprint are cited in any reuse.


