
Submitted:
13 January 2026
Posted:
16 January 2026
You are already at the latest version
Abstract
Galectin-3 (Gal-3) is a β-galactoside-binding lectin implicated in metabolic inflammation, cardiovascular and renal dysfunction, neurodegenerative disorders, and obesity-related pathologies. Although Gal-3 is recognized as a clinically relevant biomarker, the mechanisms controlling its tissue expression and circulating abundance remain poorly defined. O-GlcNAcase (Oga; encoded by Mgea5), the enzyme that removes O-linked β-N-acetylglucosamine (O-GlcNAc) from proteins, regulates nutrient-sensitive signaling and transcriptional processes that overlap with Gal-3 associated disease pathways. To investigate the relationship between metabolic status and Gal-3 expression, male mice were fed a high fat diet (HFD) for eight weeks to induce obesity. HFD-fed mice exhibited significant increases in body weight and fasting and fed blood glucose levels compared with lean controls, confirming metabolic dysregulation. ELISA revealed approximately threefold higher serum and plasma Gal-3 concentrations in obese mice, indicating enhanced Gal-3 production in diet-induced obesity. To determine whether Oga regulates Gal-3 expression, Oga wild-type (WT), heterozygous (HET), and knockout (KO) mice were analyzed. Circulating Gal-3 protein levels were significantly reduced in Oga KO mice, with intermediate levels in Oga HET animals. RT-qPCR revealed genotype-dependent modulation of Gal-3 (Lgals3) mRNA expression across multiple tissues, demonstrating tissue-specific regulation by Oga. These findings establish Oga as a critical regulator of Gal-3 expression and systemic abundance. The data reveal a mechanistic link between O-GlcNAc signaling and lectin-mediated metabolic inflammation, suggesting that Oga activity influences Gal-3 homeostasis and may affect its interpretation as a biomarker in metabolic disease.
Keywords:
O-GlcNAcylation
; galectin-3
; Oga KO mice
; tissue and blood
; obesity and type 2 diabetes
1. Introduction
O-GlcNAcylation, the noncanonical posttranslational modification (PTM) form of protein glycosylation, which involves the attachment of O-GlcNAc to serine and threonine residues, has emerged as a major cellular signaling mechanism, rivaling protein phosphorylation in the breadth of its target proteins [1,2,3]. O-GlcNAc modifications have been identified on over 15,000 proteins across 43 distinct species [4,5]. The addition and removal of O-GlcNAc on nucleocytoplasmic and mitochondrial proteins is catalyzed by the intracellular enzymes O-GlcNAc transferase (Ogt) and Oga respectively [6,7]. As a dynamic PTM, O-GlcNAcylation regulates essential cellular processes such as gene expression, signal transduction, the cell cycle, nutrient sensing, protein homeostasis, cellular responses to diverse stress conditions, and epigenetic regulation [8,9,10,11,12,13,14,15,16,17]. Additionally, O-GlcNAcylation contributes to diverse biological processes by modulating protein dynamics including synthesis, localization, degradation, and interaction with other macromolecules [3,6,14,15,17,18,19,20,21]. Altered and abnormal O-GlcNAcylation is frequently observed in multiple disease conditions including cancer, cardiac hypertrophy, Alzheimer’s disease, renal disease, and type 2 diabetes [22,23,24,25,26,27,28]. This supports the notion that O-GlcNAcylation is implicated not only in maintaining normal cellular functions but also in the pathological processes of human diseases [3,29].
Gal-3, encoded by the Lgals3 gene, has a high affinity for β-galactoside-containing glycans, particularly galactose β-(1,4)-N-acetylglucosamine (N-acetyllactosamine) linkages found in both N-linked and O-linked glycans, glycolipids, and blood group antigens. In mammals, Gal-3 is ubiquitously distributed throughout the body and is expressed in various tissues and cell types, except for the spleen and lymph nodes. Gal-3 is expressed both intracellularly (nucleus, cytoplasm) and extracellularly (cell surface, extracellular space) and is highly expressed in inflammatory and epithelial cells as well as in immune cells like macrophages, dendritic cells, and neutrophils. Gal-3 is also expressed in various tissues and organs, including the kidney, heart, blood vessels, skin, bones, and nervous system [30]. This dynamic distribution is thought to enable Gal-3 to participate in diverse cellular functions such as gene regulation, mRNA splicing, glucose homeostasis, and signaling pathways linked to cell survival and apoptosis [31]. Since Gal-3 is readily secreted to the cell surface as well as in biological fluids such as blood and urine, particularly from injured or inflammatory cells, it holds potential as a sensitive diagnostic and prognostic indicator for a range of pathological conditions, including metabolic syndromes like obesity, cancer, heart failure, fibrosis, and inflammatory diseases such as rheumatoid arthritis and chronic kidney disease [32,33]. Gal-3 has also garnered considerable attention for its role in the onset and progression of long-term diabetes complications because of its ability to bind advanced glycation end products (AGEs) and advanced lipoxidation end products (ALEs) that accumulate in target organs, triggering proinflammatory and prooxidant pathways that contribute to tissue damage [34,35].
Surprisingly, O-GlcNAcylation and Gal-3 exhibit a unique interplay, leading to distinct interactions and functions that make them a compelling subject for further study [30]. O-GlcNAcylation and Gal-3 share a similar subcellular localization. Functionally, they are at the crossroads of nutrient sensing through the hexosamine biosynthetic pathway (HBP) and UDP-GlcNAc availability, as well as associated with an overlapping spectrum of pathological conditions [30,36]. We have previously reported that Gal-3 is a substrate for Ogt and that secreted Gal-3 levels are tightly regulated by O-GlcNAc cycling [36]. To further investigate the role of O-GlcNAc dynamics on Gal-3 secretion in vivo, we examined circulating Gal-3 levels in plasma and serum as well as Lgals3 gene expression in Oga WT, HET, and KO mice.
2. Materials and Methods
2.1. Mouse maintenance and diet:
The mice for Oga WT, KO and HET experiments (C57BL/6J) were maintained according to the animal protocol #K023-LCBB-23 and were maintained on a standard mouse chow diet (fat: 15% kcal; energy density: 3.1 kcal/g; NIH-07 diet #7022, Envigo). Male C57BL/6NTAC mice utilized for obesity model experiments were maintained according to the animal protocol #K083-LBC-23. One cohort was maintained on a standard mouse chow diet. A separate cohort of 8-week-old male littermates were switched to a high-fat diet (HFD, fat: 60% kcal; energy density: 5.49 kcal/g; #F3282, BioServ) for 8 weeks and body weight was recorded weekly. All animal experiments were performed between 16-20 weeks of age. All animal procedures were approved by the Institutional Animal Care and Use Committee of the National Institute of Diabetes and Digestive and Kidney Diseases (NIDDK) and conducted in accordance with the U.S. National Institutes of Health (NIH) Guidelines for Animal Research.
2.2. Blood profiling:
Lean and obese mice were assigned to either ad libitum feeding or a 12–14 h fasting, after which blood glucose levels were measured under both fed and fasted conditions using a portable glucometer (Contour). Blood was collected from the tail vein of lean and obese mice, and facial blood was collected from Oga WT, KO and HET mice in serum collection tubes (KMIC-SER, Kent Scientific Corporation) or chilled EDTA K containing plasma collection tubes (KMIC-EDTA Kent Scientific Corporation). Blood was centrifuged at 4 oC for 10 minutes at 2,000 X g to obtain serum or plasma and stored at -80 oC until use. Mouse Gal-3 ELISA kit (Abcam, ab 188394) was used to measure plasma and serum Gal-3 levels following the manufacturer’s instructions.
2.3. RT-qPCR:
At least 10 mg of tissue were collected for each sample. RNA was extracted using RNeasy plus micro kit (Qiagen, 74104) following manufacturer’s protocol. cDNA was prepared from 1 μg of RNA using cDNA synthesis kit (Quantabio, 95047-100) following manufacturer’s protocol. Fast SYBR Green Master Mix (Applied Biosystems, 4385612) was used for amplification following manufacturer’s protocol using 5 ng of cDNA and the appropriate primer (Supplemental Table 1) on an 7900HT fast real-time PCR system (Applied Biosystems, 4351405). Each reaction was performed in technical triplicate. Relative gene expression was normalized to the geometric mean of Rplp0.
3. Results
3.1. Confirmation that elevated circulating Gal-3 is linked to obesity and type 2 diabetes
In human studies, circulating Gal-3 levels have been reported to correlate positively with obesity and type 2 diabetes [37,38], although its precise role remains unclear, with some evidence suggesting that Gal-3 may act as a marker of glucose disposal [37,39,40,41,42], or insulin sensitivity [43]. In animal studies, macrophage Gal-3 expression is elevated in mice fed high-fat diet, falling when mice are returned to a normal diet [44], and plasma Gal-3 levels are elevated in HFD-induced obese mice [45]. To further investigate this in our in-house mouse colonies, male C57BL/6NTAC mice were fed a HFD for 8 weeks (Figure 1A). Body weight (Figure 1B) as well as both fed and fasting blood glucose levels (Figure 1C) were measured to confirm the establishment of diet-induced obesity. Circulating Gal-3 levels were then quantified by ELISA in serum and plasma from lean and obese mice (Figure 1D). Both serum and plasma Gal-3 concentrations were nearly threefold higher in obese mice compared with lean controls (Figure 1D), indicating that diet-induced obesity markedly enhances Gal-3 production and/or release into circulation. These findings parallel human studies [37,42,46], where elevated Gal-3 levels are associated with obesity and type 2 diabetes, thereby underscoring the potential of Gal-3 as a prognostic indicator of metabolic disease and possible contributor to insulin resistance through metabolic and inflammatory stress-responsive pathways [37,38,44].
3.2. The distribution and levels of Gal-3 are influenced by Oga expression
Earlier studies from our laboratory as well as others have linked O-GlcNAc cycling to stress response [16,47], nutrient sensitivity [17,27,48], and insulin resistance [27,49,50,51,52]. Systematic studies utilizing mouse embryonic fibroblasts (MEFs) derived from Oga WT, HET and KO mice showed insulin-response signaling through GSK3β is dramatically altered in Oga KO animals and Oga KO neonatal mice exhibit morbid hypoglycemia [52]. Our previous exploration of the role of O-GlcNAc cycling in Gal-3 secretion has been focused on MEFs derived from Oga WT and KO mice [36]. However, the influence of O-GlcNAc cycling in modulating Gal-3 distribution in vivo, especially in mouse blood and tissues, remains uncharacterized. In order to study the impact of O-GlcNAc cycling on tissue-specific and circulating Gal-3 levels in the blood in vivo, we utilized male and female mice in which the Oga gene had been deleted globally [52]. For this study, facial blood was collected from 16- to 20-week-old Oga WT, HET, and KO mice to obtain serum and plasma. The mice were then euthanized to separately harvest the heart, liver, and kidney (Figure 2A). Tissue-specific Oga mRNA levels of those whole body Oga WT, HET, and KO mice were measured to validate the attenuated Oga expression levels in the kidney (Figure 2B), liver (Figure 2C), and heart (Figure 2D). Further measurement of Ogt mRNA expression, the enzyme responsible for adding O-GlcNAc, in the kidney (Figure 2E), liver (Figure 2F), and heart (Figure 2G) confirmed altered O-GlcNAcylation levels in these mice.
ELISA was used to measure the amount of circulating Gal-3 in both male and female mouse blood. There is a significant decrease in the Gal-3 concentration in both serum (Figure 3A) and plasma (Figure 3B) in male and female Oga KO mice relative to the WT controls. Oga HET mice exhibit intermediate Gal-3 levels. Notably, Gal-3 concentrations (ng/mL) are elevated in the serum relative to the plasma in both male and female mice, further indicating that Gal-3 levels are influenced by blood coagulation processes. Blood glucose levels measured under fed conditions revealed that Oga KO mice were significantly hypoglycemic (Figure 3C), consistent with our earlier observations in neonatal mice [52]. Oga HET mice did not show this effect. Together, this observation, along with the positive correlation between blood Gal-3 concentrations and Oga expression, suggests that circulating Gal-3 levels are not solely determined by glucose availability, but are critically influenced by Oga and the extent of O-GlcNAcylation.
Additionally, comparison of basal Gal-3 concentrations in serum and plasma (ng/mL) revealed no significant differences between Oga WT males (C57Bl/6JMgea5tm2Jah/cre) and lean control males (C57BL/6NTAC), indicating that genotype alone does not alter circulating Gal-3 levels under baseline conditions (Figure 3D). This underscores the idea that the elevation of Gal-3 observed in obese mice arises primarily from diet-induced metabolic stress rather than from inherent genetic background and suggests that O-GlcNAcylation may contribute to the regulation of circulating Gal-3 through mechanisms that remain to be clarified and warrant further investigation.
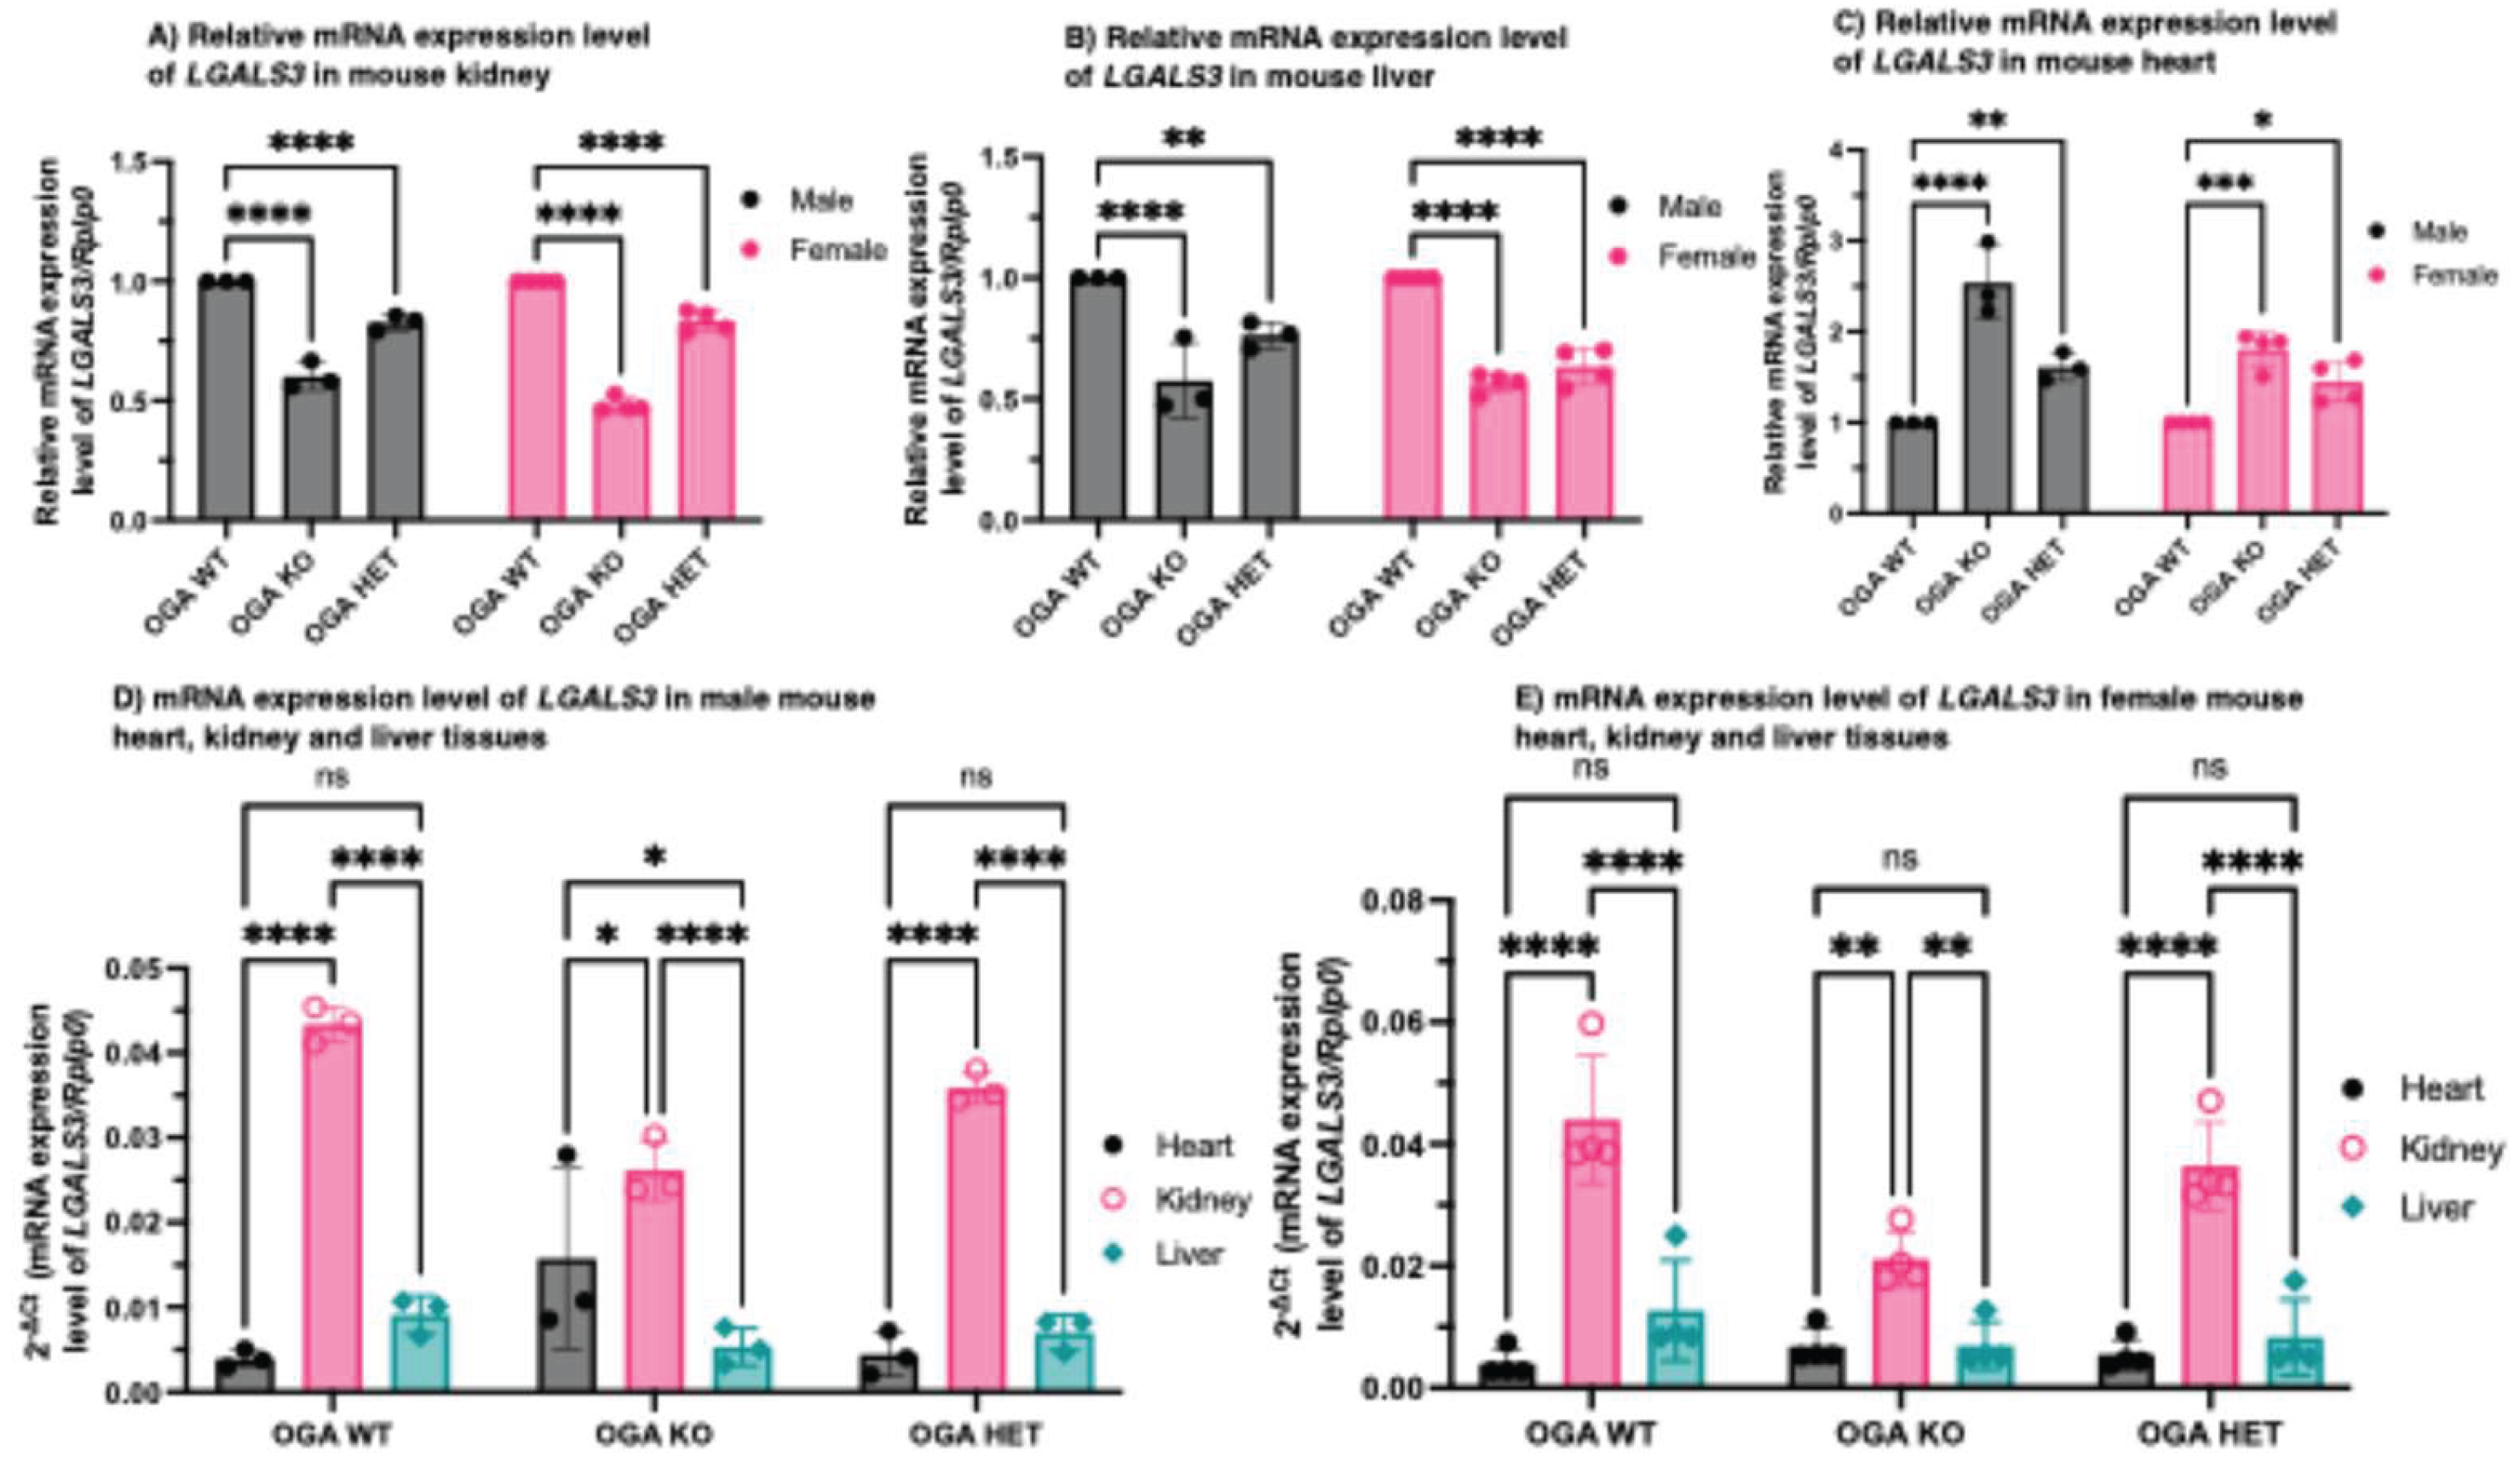
To further assess the relationship between Oga expression and Gal-3 regulation, we quantified tissue-specific Lgals3 transcript levels by RT-qPCR in kidney, liver, and heart tissues obtained from Oga WT, HET, and KO mice. In contrast to circulating Gal-3 concentrations in mouse plasma or serum, tissue-specific Lgals3 expression exhibited organ-dependent variation in response to altered Oga expression. In the kidney (Figure 4A) and liver (Figure 4B), Lgals3 transcript levels were significantly downregulated in both male and female Oga KO mice compared with WT controls, whereas HET mice exhibited intermediate expression. Contrastingly, in heart tissue (Figure 4C) from both sexes, Lgals3 expression was significantly elevated in Oga KO mice relative to the WT controls, with HET mice again displaying intermediate levels. Together with circulating Gal-3 measurements, these findings indicate that the loss of Oga modulates Lgals3 expression in an organ-dependent manner, consistent with tissue-specific roles of O-GlcNAc cycling in the regulation of Gal-3 expression. Additionally, these findings suggest that altered O-GlcNAc homeostasis may differentially influence Gal-3-mediated processes such as inflammation, fibrosis, and cardiac remodeling across tissues. Analysis of relative Lgals3 transcript levels across kidney, liver, and heart tissues from Oga WT, HET, and KO mice revealed their differential contribution to the overall Gal-3 pool. Among the tissues examined, the kidney exhibited the highest Lgals3 expression, the heart displayed the lowest, and the liver showed an intermediate level corresponding to their relative contributions to the overall Gal-3 pool (Figure 4D and Figure 4F), and corroborating the established tissue distribution of Lgals3 RNA expression [30].
4. Discussion
In this study, we report distinct alterations in circulating Gal-3, a recognized prognostic indicator, in two complementary mouse models: diet-induced type 2 diabetic obesity and Oga-deficient mice. In the dietary model of obesity, both serum and plasma Gal-3 concentrations (ng/mL) were significantly elevated relative to lean controls, consistent with clinical observations linking increased Gal-3 to obesity and diabetes [37,38,42,46]. This increase likely reflects enhanced Gal-3 production and/or release in response to metabolic and inflammatory stress associated with obesity. In contrast, Oga KO mice exhibited significantly reduced circulating Gal-3 levels compared with Oga WT littermates, whereas Oga HET mice displayed intermediate levels, suggesting a gene dosage effect. These findings point toward a role for O-GlcNAc cycling in regulating Gal-3 homeostasis, where loss of Oga may impair pathways that normally sustain basal Gal-3 expression and secretion. Tissue specific Gal-3 mRNA (Lgals3) expression is also significantly altered in Oga altered mice. Together, these contrasting models highlight the dual nature of Gal-3 as both a prognostic indicator and potential effector of metabolic dysfunction, reinforcing its relevance to the pathophysiology of obesity and type 2 diabetes.
O-GlcNAcylation has been implicated in altering the functional activity of proteins and regulating their intracellular trafficking and localization [18,53]. O-GlcNAcylation directly modifies key subunits of the protein complexes responsible for the formation of COPII, COPI, and clathrin-coated vesicles (CCVs), as well as other proteins involved in vesicle budding and fusion [18,53]. Additionally, O-GlcNAcylation has been reported to regulate proteins involved in autophagy and noncanonical secretory pathways [54,55,56]. Gal-3 and O-GlcNAcylation are also closely interconnected at both structural and functional levels, particularly in their roles within intracellular trafficking and secretion. The translocation of Gal-3 to the nucleolus is dependent on the importin transport complex [57], structurally resembling the enzyme Oga involved in the O-GlcNAcylation cycle [58]. Notably, Gal-3 is secreted via a “noncanonical” secretory pathway [30,59,60,61], a process that is significantly influenced by the dynamics of O-GlcNAcylation [18,53,56]. This interplay suggests that fluctuations in O-GlcNAc cycling not only affect intracellular trafficking of Gal-3 but may also influence its extracellular functions in cell signaling, immunity, and disease pathology. Previous studies have shown that the expression and secretion of Gal-3 in HL-60 cells is influenced by the homeostatic regulation of intracellular protein O-GlcNAcylation levels [62]. Furthermore, our laboratory has previously demonstrated that Gal-3 undergoes O-GlcNAcylation and that cellular O-GlcNAcylation levels modulate Gal-3 secretion in cultured cells [36].
A few studies have investigated the relationship between circulating levels of Gal-3, obesity and parameters of glucose metabolism, as well as insulin sensitivity in patients with diabetes. Weigert et al. reported that circulating Gal-3 levels were elevated in 30 overweight nondiabetic individuals and in 30 patients with type 2 diabetes compared with 23 normal-weight controls [41]. Moreover, Gal-3 concentrations correlated positively with body mass index (BMI), and in a BMI-dependent manner with leptin, resistin, IL-6, and age [41]. In a clinical cohort of 174 individuals stratified into diabetic, prediabetic, and nondiabetic groups, blood Gal-3 concentrations were significantly elevated in diabetic patients compared with both prediabetic and nondiabetic subjects, and were also higher in prediabetic individuals than in the nondiabetic group [42,46]. In contrast, a smaller study involving 20 individuals suggested that Gal-3 may influence insulin concentrations more strongly than glucose levels, raising the possibility that increased Gal-3 activity in diabetic subjects could improve insulin sensitivity [43]. However, given the limited cohort size, these observations should be interpreted with caution and require validation in larger populations. While these two studies appear to be contrasting, their differences can be explained if Gal-3 upregulation acts as an adaptive mechanism that counteracts the progression of metabolic derangement by promoting glucose disposal. From this perspective, Gal-3 levels may rise with the development of obesity and diabetes, thereby serving as a marker of these disorders, while potentially exerting a protective influence against insulin resistance. This interpretation is consistent with the proposed role of Gal-3 in facilitating the clearance of AGEs and ALEs [39,40]. Supporting this notion, several studies in nondiabetic individuals have demonstrated that circulating levels of AGEs, or their reactive carbonyl precursors, are independently correlated with insulin resistance, as assessed by the HOMA-IR index [63]. In line with this framework, the reduction in circulating Gal-3 observed in Oga KO mice raises the possibility that disruption of O-GlcNAc cycling may modify or limit this potential protective function, thereby influencing the relationship between metabolic stress and insulin sensitivity. Future studies are needed to determine the precise mechanisms by which O-GlcNAc cycling regulates Gal-3 and to clarify whether this pathway contributes directly to the development of insulin resistance.
5. Conclusions
This study demonstrates that Oga is a key regulator of Gal-3 expression and systemic abundance in vivo. HFD induced obesity markedly elevates circulating Gal-3, whereas genetic loss of Oga produces a gene-dosage–dependent reduction in Gal-3 in both serum and plasma, accompanied by tissue-specific changes in Lgals3 transcription. These findings establish O-GlcNAc cycling as a previously unrecognized control point for Gal-3 homeostasis in vivo. By linking nutrient-sensitive O-GlcNAc signaling to Gal-3–mediated inflammatory and metabolic pathways, this work provides a mechanistic framework explaining how metabolic stress and post-translational modification intersect to regulate a clinically important biomarker, with implications for the interpretation of Gal-3 in obesity, diabetes, and related disorders.
Supplementary Materials
The following supporting information can be downloaded at the website of this paper posted on Preprints.org.
Author Contributions
Conceptualization, M.M.M.; A.P. and J.A.H.; methodology, M.M.M.; A.P.; M.C.; and D.B.; software, M.M.M.; A.P. and D.B.; validation, M.M.M.; A.P.; M.C.; and D.B.; formal analysis, M.M.M.; A.P. and D.B.; investigation, M.M.M.; K.A.J. and J.A.H.; resources, J.A.H. and K.A.J.; data curation, M.M.M.; A.P.; M.C.; and D.B.; writing—original draft preparation, M.M.M.; A.P.; writing—review and editing, D.B.; M.C.; K.A.J. and J.A.H.; visualization, M.M.M. and J.A.H.; supervision, K.A.J. and J.A.H.; project administration, K.A.J. and J.A.H.; funding acquisition, K.A.J. and J.A.H. All authors have read and agreed to the published version of the manuscript.
Funding
“This research was funded by NIDDK, National Institutes of Health, intramural research program grant, grant number DK060101-18 awarded to J.A.H.; and grant number ZIA DK031116 awarded to K.A.J.” and “The APC was funded by NIDDK, National Institutes of Health, intramural research program grant, grant number DK060101-18”.
Institutional Review Board Statement
The animal study protocol was approved by the Institutional Animal Care and Use Committee of the National Institute of Diabetes and Digestive and Kidney Diseases (NIDDK) and conducted in accordance with the U.S. National Institutes of Health (NIH) Guidelines for Animal Research (protocol code #K023-LCBB-23 and #K083-LBC-23).
Informed Consent Statement
Not applicable.
Data Availability Statement
The original contributions presented in this study are included in the article/supplementary material. Further inquiries can be directed to the corresponding author(s).
Acknowledgments
M.M.M., M.C., D.B., and J.A.H. thank members of the Hanover lab for discussion, advice, and valuable suggestions. This work was conducted in the Laboratory of Cell and Molecular Biology (LCMB) section in NIDDK, National Institutes of Health, and supported by the NIDDK, National Institutes of Health, intramural research program grant (DK060101-18). The content is solely the responsibility of the authors and does not necessarily represent the official views of the National Institutes of Health. AP and KAJ are supported by the Intramural Research Program at the NIH, NIDDK (ZIA DK031116). The views, information or content, and conclusions presented do not necessarily represent the official position or policy of, nor should any official endorsement be inferred on the part of, the NIDDK, the National Institutes of Health, or the Department of Health and Human Services. During the preparation of this manuscript/study, the author(s) used biorender.com for the purposes of figure preparation. The authors have reviewed and edited the output and take full responsibility for the content of this publication.
Conflicts of Interest
The authors declare no conflicts of interest. The funders had no role in the design of the study, in the collection, analyses, or interpretation of data, in the writing of the manuscript, or in the decision to publish the results.
Abbreviations
The following abbreviations are used in this manuscript:
| Gal-3 | Galectin-3 |
| O-GlcNAc | O-linked β-N-acetylglucosamine |
| OGA | O-GlcNAse |
| WT | Wild type |
| HET | Heterozygous |
| KO | Knockout |
| PTM | Posttranslational modification |
| HFD | High fat diet |
| OGT | O-GlcNAc transferase |
| mRNA | Messenger RNA |
| ELISA | Enzyme-linked Immunosorbent Assay |
| RT-qPCR | Reverse Transcription quantitative Polymerase Chain Reaction |
| AGEs | advanced glycation end products |
| ALEs | advanced lipoxidation end products |
| COP | Coat protein complex |
| CCV | clathrin-coated vesicles |
References
- Yang, X.; Qian, K. Protein O-GlcNAcylation: emerging mechanisms and functions. Nat Rev Mol Cell Biol 2017, 18, 452–465. [Google Scholar] [CrossRef]
- Zeidan, Q.; Hart, G.W. The intersections between O-GlcNAcylation and phosphorylation: implications for multiple signaling pathways. J Cell Sci 2010, 123, 13–22. [Google Scholar] [CrossRef] [PubMed]
- Bond, M.R.; Hanover, J.A. A little sugar goes a long way: the cell biology of O-GlcNAc. J Cell Biol 2015, 208, 869–880. [Google Scholar] [CrossRef]
- Mannino, M.P.; Hart, G.W. The Beginner's Guide to O-GlcNAc: From Nutrient Sensitive Pathway Regulation to Its Impact on the Immune System. Front Immunol 2022, 13, 828648. [Google Scholar] [CrossRef] [PubMed]
- Wulff-Fuentes, E.; Berendt, R.R.; Massman, L.; Danner, L.; Malard, F.; Vora, J.; et al. The human O-GlcNAcome database and meta-analysis. Sci Data 2021, 8, 25. [Google Scholar] [CrossRef] [PubMed]
- Hanover, J.A. Glycan-dependent signaling: O-linked N-acetylglucosamine. The FASEB Journal 2001, 15, 1865–1876. [Google Scholar] [CrossRef]
- Love, D.C.; Hanover, J.A. The Hexosamine Signaling Pathway: Deciphering the "O-GlcNAc Code. Science's STKE 2005, 2005, re13–re13. [Google Scholar] [CrossRef]
- Chatham, J.C.; Zhang, J.; Wende, A.R. Role of O-Linked N-Acetylglucosamine Protein Modification in Cellular (Patho)Physiology. Physiol Rev 2021, 101, 427–493. [Google Scholar] [CrossRef]
- Erickson, J.R.; Pereira, L.; Wang, L.; Han, G.; Ferguson, A.; Dao, K.; et al. Diabetic hyperglycaemia activates CaMKII and arrhythmias by O-linked glycosylation. Nature 2013, 502, 372–376. [Google Scholar] [CrossRef]
- Lu, S.; Liao, Z.; Lu, X.; Katschinski, D.M.; Mercola, M.; Chen, J.; et al. Hyperglycemia Acutely Increases Cytosolic Reactive Oxygen Species via O-linked GlcNAcylation and CaMKII Activation in Mouse Ventricular Myocytes. Circulation Research 2020, 126, e80–e96. [Google Scholar] [CrossRef]
- Han, C.; Gu, Y.; Shan, H.; Mi, W.; Sun, J.; Shi, M.; et al. O-GlcNAcylation of SIRT1 enhances its deacetylase activity and promotes cytoprotection under stress. Nat Commun 2017, 8, 1491. [Google Scholar] [CrossRef]
- Lewis, B.A.; Hanover, J.A. O-GlcNAc and the epigenetic regulation of gene expression. J Biol Chem 2014, 289, 34440–34448. [Google Scholar] [CrossRef]
- Sakabe, K.; Wang, Z.; Hart, G.W. Beta-N-acetylglucosamine (O-GlcNAc) is part of the histone code. Proc Natl Acad Sci U S A 2010, 107, 19915–19920. [Google Scholar] [CrossRef]
- Hanover, J.A. Epigenetics gets sweeter: O-GlcNAc joins the "histone code. Chem Biol 2010, 17, 1272–1274. [Google Scholar] [CrossRef] [PubMed]
- Love, D.C.; Krause, M.W.; Hanover, J.A. O-GlcNAc cycling: Emerging roles in development and epigenetics. Semin Cell Dev Biol 2010, 21, 646–654. [Google Scholar] [CrossRef] [PubMed]
- Hanover, J.A.; Krause, M.W.; Love, D.C. The hexosamine signaling pathway: O-GlcNAc cycling in feast or famine. Biochimica et Biophysica Acta (BBA) - General Subjects 2010, 1800, 80–95. [Google Scholar] [CrossRef] [PubMed]
- Konzman, D.; Abramowitz, L.K.; Steenackers, A.; Mukherjee, M.M.; Na, H.J.; Hanover, J.A. O-GlcNAc: Regulator of Signaling and Epigenetics Linked to X-linked Intellectual Disability. Front Genet 2020, 11, 605263. [Google Scholar] [CrossRef]
- Zhang, J.; Wang, Y. Emerging roles of O-GlcNAcylation in protein trafficking and secretion. J Biol Chem 2024, 300, 105677. [Google Scholar] [CrossRef]
- Mukherjee, M.M.; Bond, M.R.; Abramowitz, L.K.; Biesbrock, D.; Woodroofe, C.C.; Kim, E.J.; et al. Tools and tactics to define specificity of metabolic chemical reporters. Front Mol Biosci 2023, 10, 1286690. [Google Scholar] [CrossRef]
- Mukherjee, M.M.; Biesbrock, D.; Abramowitz, L.K.; Pavan, M.; Kumar, B.; Walter, P.J.; et al. Selective bioorthogonal probe for N-glycan hybrid structures. Nat Chem Biol 2025, 21, 681–692. [Google Scholar] [CrossRef]
- Mukherjee, M.M.; Watson, M.D.; Biesbrock, D.; Abramowitz, L.K.; Drake, S.K.; Lee, J.C.; et al. A dual fluorescent-Raman bioorthogonal probe for specific biosynthetic labeling of intracellular gangliosides. Commun Chem 2025, 8, 293. [Google Scholar] [CrossRef] [PubMed]
- Slawson, C.; Copeland, R.J.; Hart, G.W. O-GlcNAc signaling: a metabolic link between diabetes and cancer? Trends Biochem Sci 2010, 35, 547–555. [Google Scholar] [CrossRef]
- Dassanayaka, S.; Jones, S.P. O-GlcNAc and the cardiovascular system. Pharmacol Ther 2014, 142, 62–71. [Google Scholar] [CrossRef]
- Slawson, C.; Hart, G.W. O-GlcNAc signalling: implications for cancer cell biology. Nat Rev Cancer 2011, 11, 678–684. [Google Scholar] [CrossRef]
- Ferrer, C.M.; Lynch, T.P.; Sodi, V.L.; Falcone, J.N.; Schwab, L.P.; Peacock, D.L.; et al. O-GlcNAcylation regulates cancer metabolism and survival stress signaling via regulation of the HIF-1 pathway. Mol Cell 2014, 54, 820–831. [Google Scholar] [CrossRef]
- Gelinas, R.; Mailleux, F.; Dontaine, J.; Bultot, L.; Demeulder, B.; Ginion, A.; et al. AMPK activation counteracts cardiac hypertrophy by reducing O-GlcNAcylation. Nat Commun 2018, 9, 374. [Google Scholar] [CrossRef]
- Mondoux, M.A.; Love, D.C.; Ghosh, S.K.; Fukushige, T.; Bond, M.; Weerasinghe, G.R.; et al. O-Linked-N-Acetylglucosamine Cycling and Insulin Signaling Are Required for the Glucose Stress Response in Caenorhabditis elegans. Genetics 2011, 188, 369–382. [Google Scholar] [CrossRef] [PubMed]
- Sekine, O.; Love, D.C.; Rubenstein, D.S.; Hanover, J.A. Blocking O-Linked GlcNAc Cycling in Drosophila Insulin-producing Cells Perturbs Glucose-Insulin Homeostasis *. J Biol Chem 2010, 285, 38684–38691. [Google Scholar] [CrossRef] [PubMed]
- Olivier-Van Stichelen, S.; Hanover, J.A. You are what you eat: O-: linked N-acetylglucosamine in disease, development and epigenetics. Current Opinion in Clinical Nutrition & Metabolic Care 2015, 18. [Google Scholar]
- Mukherjee, M.M.; Biesbrock, D.; Hanover, J.A. Galectin-3: Integrator of Signaling via Hexosamine Flux. Biomolecules 2025, 15. [Google Scholar] [CrossRef]
- Rabinovich, G.A.; Toscano, M.A.; Jackson, S.S.; Vasta, G.R. Functions of cell surface galectin-glycoprotein lattices. Curr Opin Struct Biol 2007, 17, 513–520. [Google Scholar] [CrossRef] [PubMed]
- Sciacchitano, S.; Lavra, L.; Morgante, A.; Ulivieri, A.; Magi, F.; De Francesco, G.P.; et al. Galectin-3: One Molecule for an Alphabet of Diseases, from A to Z. Int J Mol Sci 2018, 19. [Google Scholar] [CrossRef]
- Dong, R.; Zhang, M.; Hu, Q.; Zheng, S.; Soh, A.; Zheng, Y.; et al. Galectin-3 as a novel biomarker for disease diagnosis and a target for therapy (Review). Int J Mol Med 2018, 41, 599–614. [Google Scholar] [CrossRef] [PubMed]
- Pugliese, G. Do advanced glycation end products contribute to the development of long-term diabetic complications? Nutrition, Metabolism and Cardiovascular Diseases 2008, 18, 457–460. [Google Scholar] [CrossRef]
- Iacobini, C.; Amadio, L.; Oddi, G.; Ricci, C.; Barsotti, P.; Missori, S.; et al. Role of Galectin-3 in Diabetic Nephropathy. Journal of the American Society of Nephrology 2003, 14, S264–S270. [Google Scholar] [CrossRef]
- Mathew, M.P.; Abramowitz, L.K.; Donaldson, J.G.; Hanover, J.A. Nutrient-responsive O-GlcNAcylation dynamically modulates the secretion of glycan-binding protein galectin 3. J Biol Chem 2022, 298, 101743. [Google Scholar] [CrossRef] [PubMed]
- Menini, S.; Iacobini, C.; Blasetti Fantauzzi, C.; Pesce, C.M.; Pugliese, G. Role of Galectin-3 in Obesity and Impaired Glucose Homeostasis. Oxid Med Cell Longev 2016, 2016, 9618092. [Google Scholar] [CrossRef]
- Li, Y.; Li, T.; Zhou, Z.; Xiao, Y. Emerging roles of Galectin-3 in diabetes and diabetes complications: A snapshot. Rev Endocr Metab Disord 2022, 23, 569–577. [Google Scholar] [CrossRef]
- Pugliese, G.; Iacobini, C.; Ricci, C.; Fantauzzi, C.B.; Menini, S. Galectin-3 in diabetic patients. 2014, 52, 1413–1423. [Google Scholar] [CrossRef]
- Pugliese, G.; Iacobini, C.; Pesce, C.M.; Menini, S. Galectin-3: an emerging all-out player in metabolic disorders and their complications. Glycobiology 2015, 25, 136–150. [Google Scholar] [CrossRef]
- Weigert, J.; Neumeier, M.; Wanninger, J.; Bauer, S.; Farkas, S.; Scherer, M.N.; et al. Serum galectin-3 is elevated in obesity and negatively correlates with glycosylated hemoglobin in type 2 diabetes. J Clin Endocrinol Metab 2010, 95, 1404–1411. [Google Scholar] [CrossRef]
- Yilmaz, H.; Cakmak, M.; Inan, O.; Darcin, T.; Akcay, A. Increased levels of galectin-3 were associated with prediabetes and diabetes: new risk factor? J Endocrinol Invest 2015, 38, 527–533. [Google Scholar] [CrossRef]
- Ohkura, T.; Fujioka, Y.; Nakanishi, R.; Shiochi, H.; Sumi, K.; Yamamoto, N.; et al. Low serum galectin-3 concentrations are associated with insulin resistance in patients with type 2 diabetes mellitus. Diabetology & Metabolic Syndrome 2014, 6, 106. [Google Scholar] [CrossRef]
- Li, P.; Liu, S.; Lu, M.; Bandyopadhyay, G.; Oh, D.; Imamura, T.; et al. Hematopoietic-Derived Galectin-3 Causes Cellular and Systemic Insulin Resistance. Cell 2016, 167, 973–984 e912. [Google Scholar] [CrossRef]
- Jiang, Q.; Zhao, Q.; Chen, Y.; Ma, C.; Peng, X.; Wu, X.; et al. Galectin-3 impairs calcium transients and beta-cell function. Nat Commun 2024, 15, 3682. [Google Scholar] [CrossRef]
- Storman, M.; Przybyłkowski, A.; Czupryniak, L. Cross-Sectional Study of Serum Galectin-3 Levels in Patients with Type 2 Diabetes and Colorectal Polyps. International Journal of Molecular Sciences 2025, 26. [Google Scholar] [CrossRef] [PubMed]
- Na, H.J.; Akan, I.; Abramowitz, L.K.; Hanover, J.A. Nutrient-Driven O-GlcNAcylation Controls DNA Damage Repair Signaling and Stem/Progenitor Cell Homeostasis. Cell Rep 2020, 31, 107632. [Google Scholar] [CrossRef] [PubMed]
- Forsythe, M.E.; Love, D.C.; Lazarus, B.D.; Kim, E.J.; Prinz, W.A.; Ashwell, G.; et al. Caenorhabditis elegans ortholog of a diabetes susceptibility locus: oga-1 (O-GlcNAcase) knockout impacts O-GlcNAc cycling, metabolism, and dauer. Proc Natl Acad Sci U S A 2006, 103, 11952–11957. [Google Scholar] [CrossRef]
- McClain, D.A.; Lubas, W.A.; Cooksey, R.C.; Hazel, M.; Parker, G.J.; Love, D.C.; et al. Altered glycan-dependent signaling induces insulin resistance and hyperleptinemia. Proc Natl Acad Sci U S A 2002, 99, 10695–10699. [Google Scholar] [CrossRef] [PubMed]
- Vosseller, K.; Wells, L.; Lane, M.D.; Hart, G.W. Elevated nucleocytoplasmic glycosylation by O-GlcNAc results in insulin resistance associated with defects in Akt activation in 3T3-L1 adipocytes. Proc Natl Acad Sci U S A 2002, 99, 5313–5318. [Google Scholar] [CrossRef]
- Ansari, S.A.; Emerald, B.S. The Role of Insulin Resistance and Protein O-GlcNAcylation in Neurodegeneration. Front Neurosci 2019, 13, 473. [Google Scholar] [CrossRef]
- Keembiyehetty, C.; Love, D.C.; Harwood, K.R.; Gavrilova, O.; Comly, M.E.; Hanover, J.A. Conditional knock-out reveals a requirement for O-linked N-Acetylglucosaminase (O-GlcNAcase) in metabolic homeostasis. J Biol Chem 2015, 290, 7097–7113. [Google Scholar] [CrossRef] [PubMed]
- Ben Ahmed, A.; Lemaire, Q.; Scache, J.; Mariller, C.; Lefebvre, T.; Vercoutter-Edouart, A.-S. O-GlcNAc Dynamics: The Sweet Side of Protein Trafficking Regulation in Mammalian Cells. Cells. [CrossRef] [PubMed]
- Guo, B.; Liang, Q.; Li, L.; Hu, Z.; Wu, F.; Zhang, P.; et al. O-GlcNAc-modification of SNAP-29 regulates autophagosome maturation. Nat Cell Biol 2014, 16, 1215–1226. [Google Scholar] [CrossRef]
- Jo, Y.K.; Park, N.Y.; Park, S.J.; Kim, B.-G.; Shin, J.H.; Jo, D.S.; et al. O-GlcNAcylation of ATG4B positively regulates autophagy by increasing its hydroxylase activity. Oncotarget 2016, 7, 57186–57196. [Google Scholar] [CrossRef] [PubMed]
- Bond, M.R.; St Amand, M.M.; Kolodrubetz, M.C.; Shiloach, J.; Hanover, J. O-GlcNAcase knockout disrupts mammalian cell autophagy 12 Ed; OXFORD UNIV PRESS INC JOURNALS DEPT: 2001 EVANS RD, CARY, NC 27513 USA, 2016; pp. 1439–1439. [Google Scholar]
- Nakahara, S.; Hogan, V.; Inohara, H.; Raz, A. Importin-mediated nuclear translocation of galectin-3. J Biol Chem 2006, 281, 39649–39659. [Google Scholar] [CrossRef]
- Jinek, M.; Rehwinkel, J.; Lazarus, B.D.; Izaurralde, E.; Hanover, J.A.; Conti, E. The superhelical TPR-repeat domain of O-linked GlcNAc transferase exhibits structural similarities to importin alpha. Nat Struct Mol Biol 2004, 11, 1001–1007. [Google Scholar] [CrossRef]
- Honig, E.; Schneider, K.; Jacob, R. Recycling of galectin-3 in epithelial cells. Eur J Cell Biol 2015, 94, 309–315. [Google Scholar] [CrossRef]
- Mehul, B.; Hughes, R.C. Plasma membrane targetting, vesicular budding and release of galectin 3 from the cytoplasm of mammalian cells during secretion. J Cell Sci 1997, 110, 1169–1178. [Google Scholar] [CrossRef]
- Nyenhuis, S.B.; Steenackers, A.; Mukherjee, M.M.; Hinshaw, J.; Hanover, J.A. Human O-GlcNAcase catalytic stalk dimer anchors flexible histone binding domains Commun Chem. 2025. [Google Scholar] [CrossRef]
- McTague, A.; Tazhitdinova, R.; Timoshenko, A.V. O-GlcNAc-Mediated Regulation of Galectin Expression and Secretion in Human Promyelocytic HL-60 Cells Undergoing Neutrophilic Differentiation. Biomolecules 2022, 12. [Google Scholar] [CrossRef] [PubMed]
- Song, F.; Schmidt, A.M. Glycation and Insulin Resistance. Arterioscler, Thromb, Vasc Biol 2012, 32, 1760–1765. [Google Scholar] [CrossRef] [PubMed]
Figure 1.
Serum and plasma Gal-3 is elevated in obese mice. (A) Workflow representing the regular and HF dietary intervention of the C57BL/6NTAC mice. (B) Body weight of regular and HFD-induced mice. (C) Fed and fasting blood glucose of regular and HFD-induced mice shows higher blood glucose for obese mice. (D) Serum and plasma Gal-3 of obese mice are higher than that of the lean mice. N = 3 biological replicates.
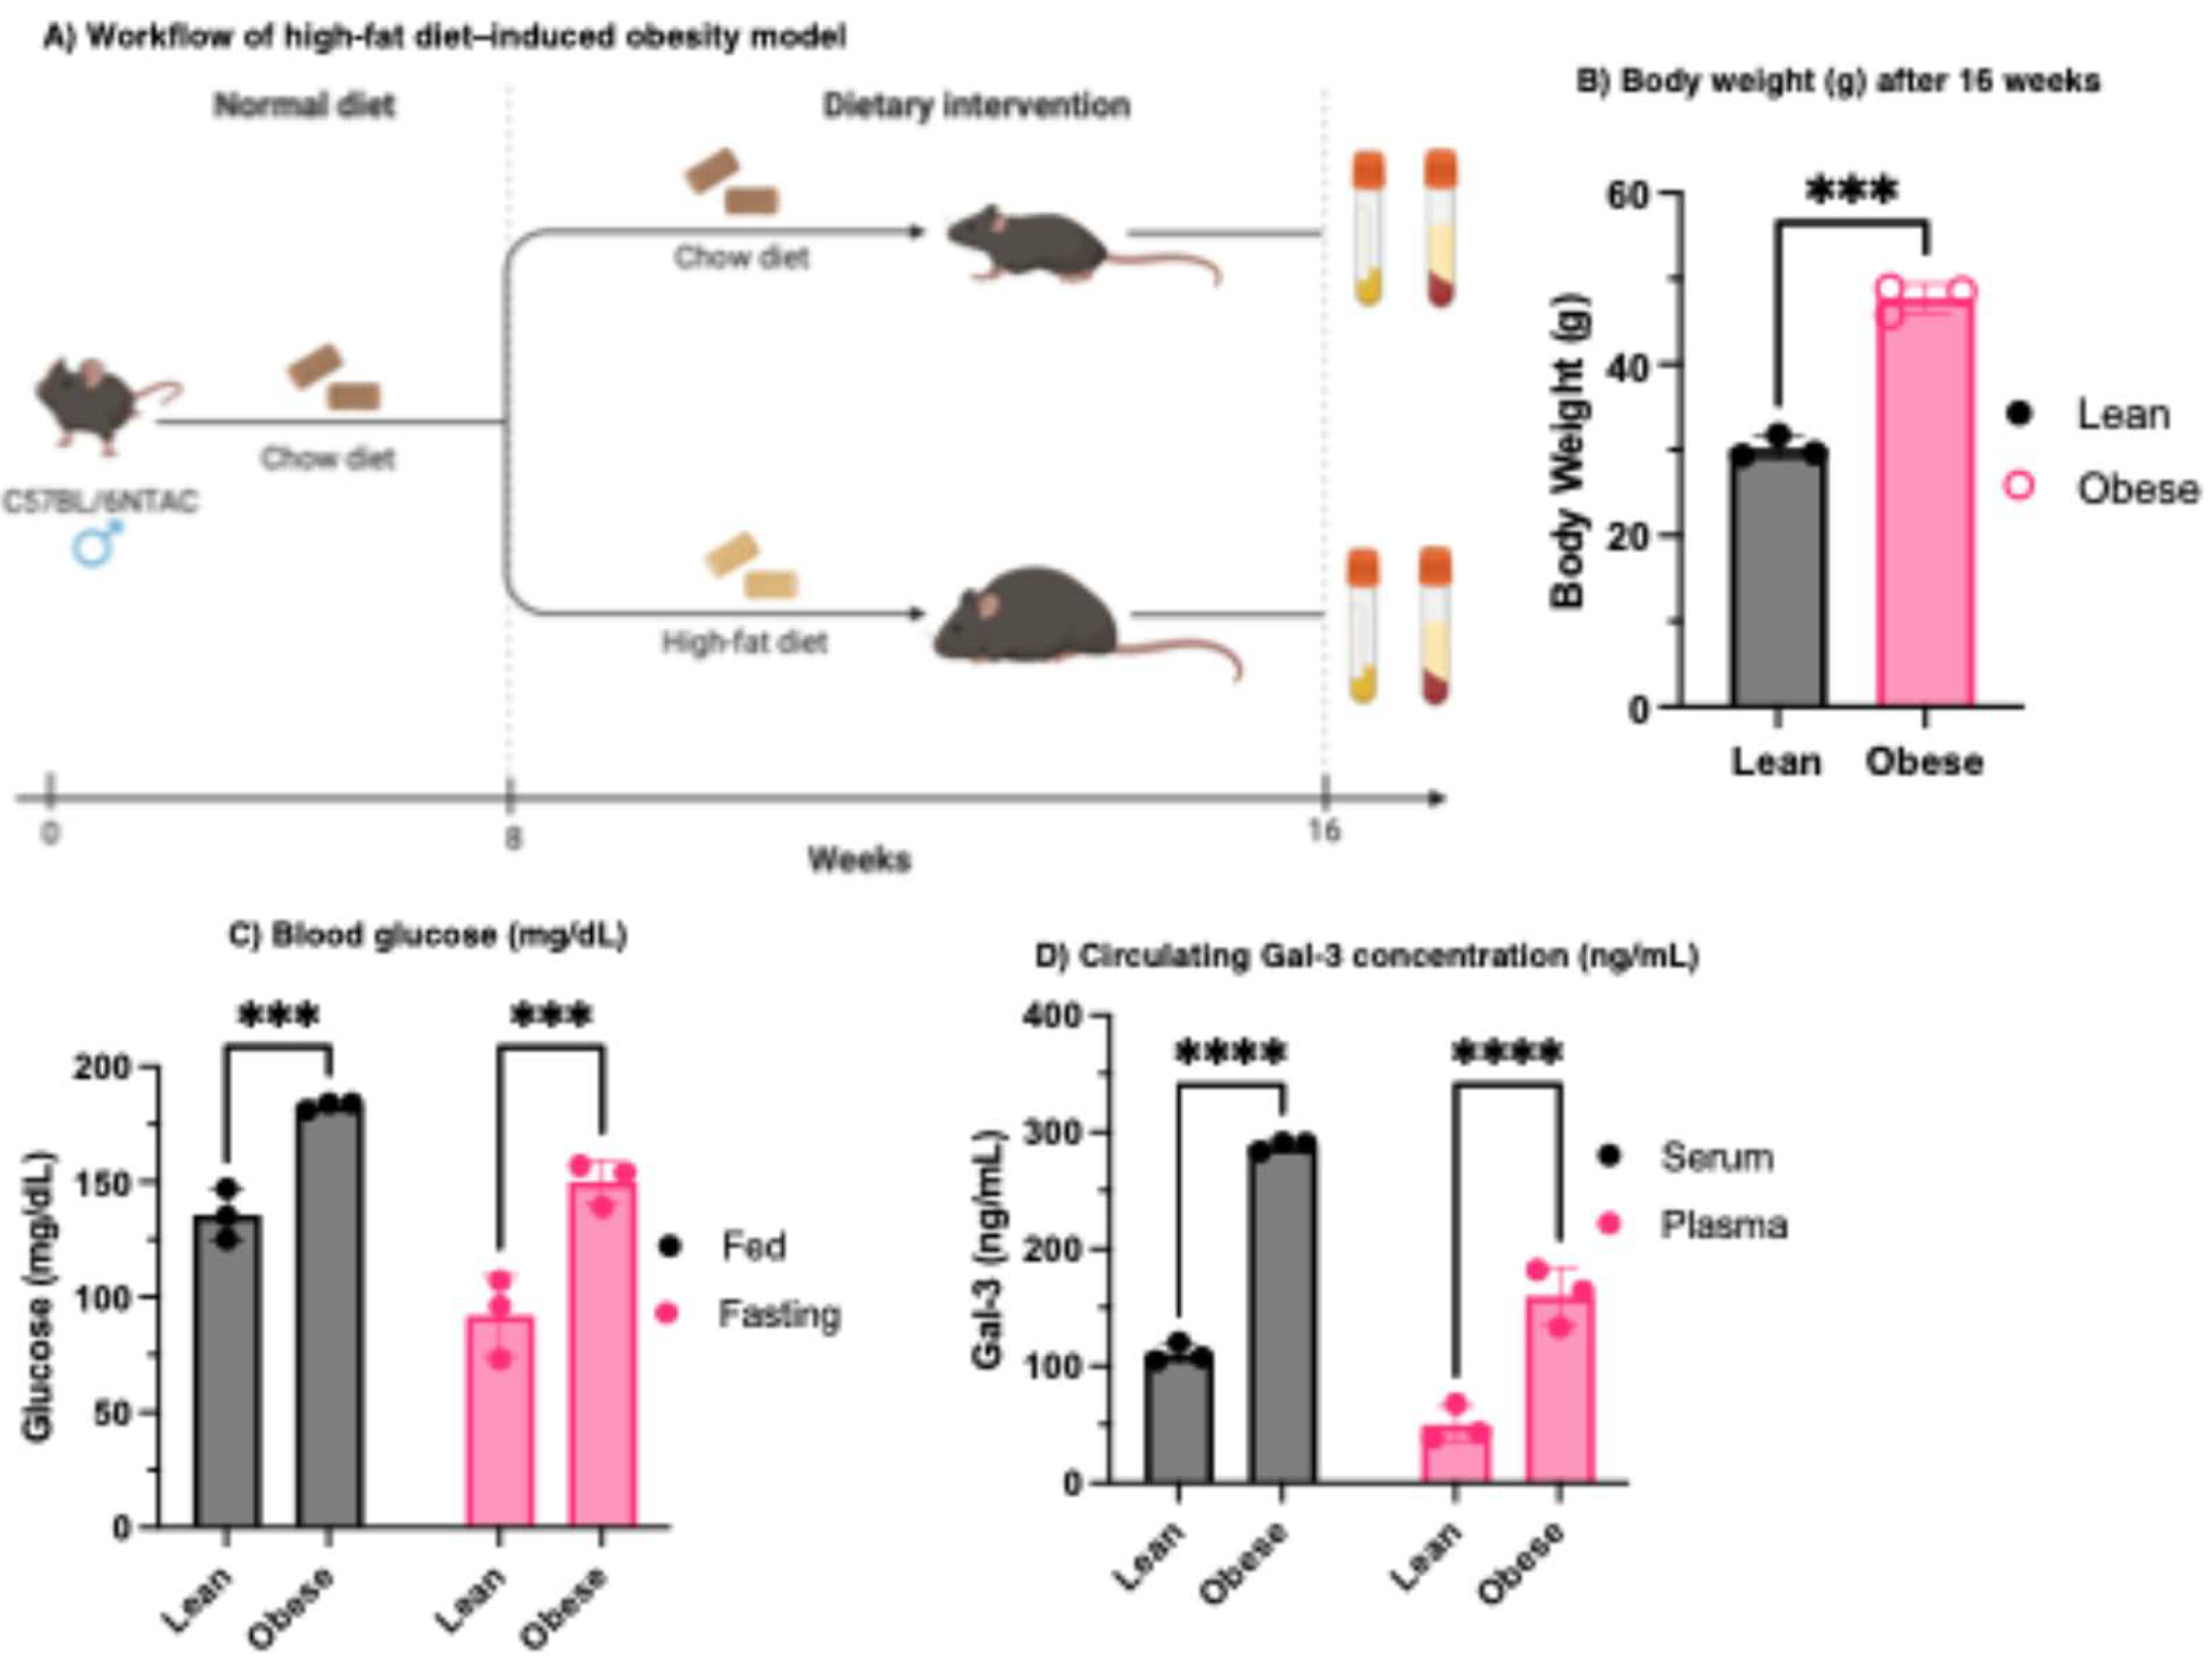
Figure 2.
Genotyping of Oga WT, KO and HET mice organs and Ogt mRNA expression levels in Oga WT, KO and HET mice organs. (A) Schematic presentation of the experimental workflow. (B-D) Oga mRNA expression levels in the kidney (B), liver (C), and heart (D) tissues of the Oga WT, KO, and HET mice. Ogt mRNA expression levels in the kidney (E), liver (F), and heart (G) tissues of the Oga WT, KO, and HET mice. N = 3 and 4 biological replicates for male and female mice respectively.
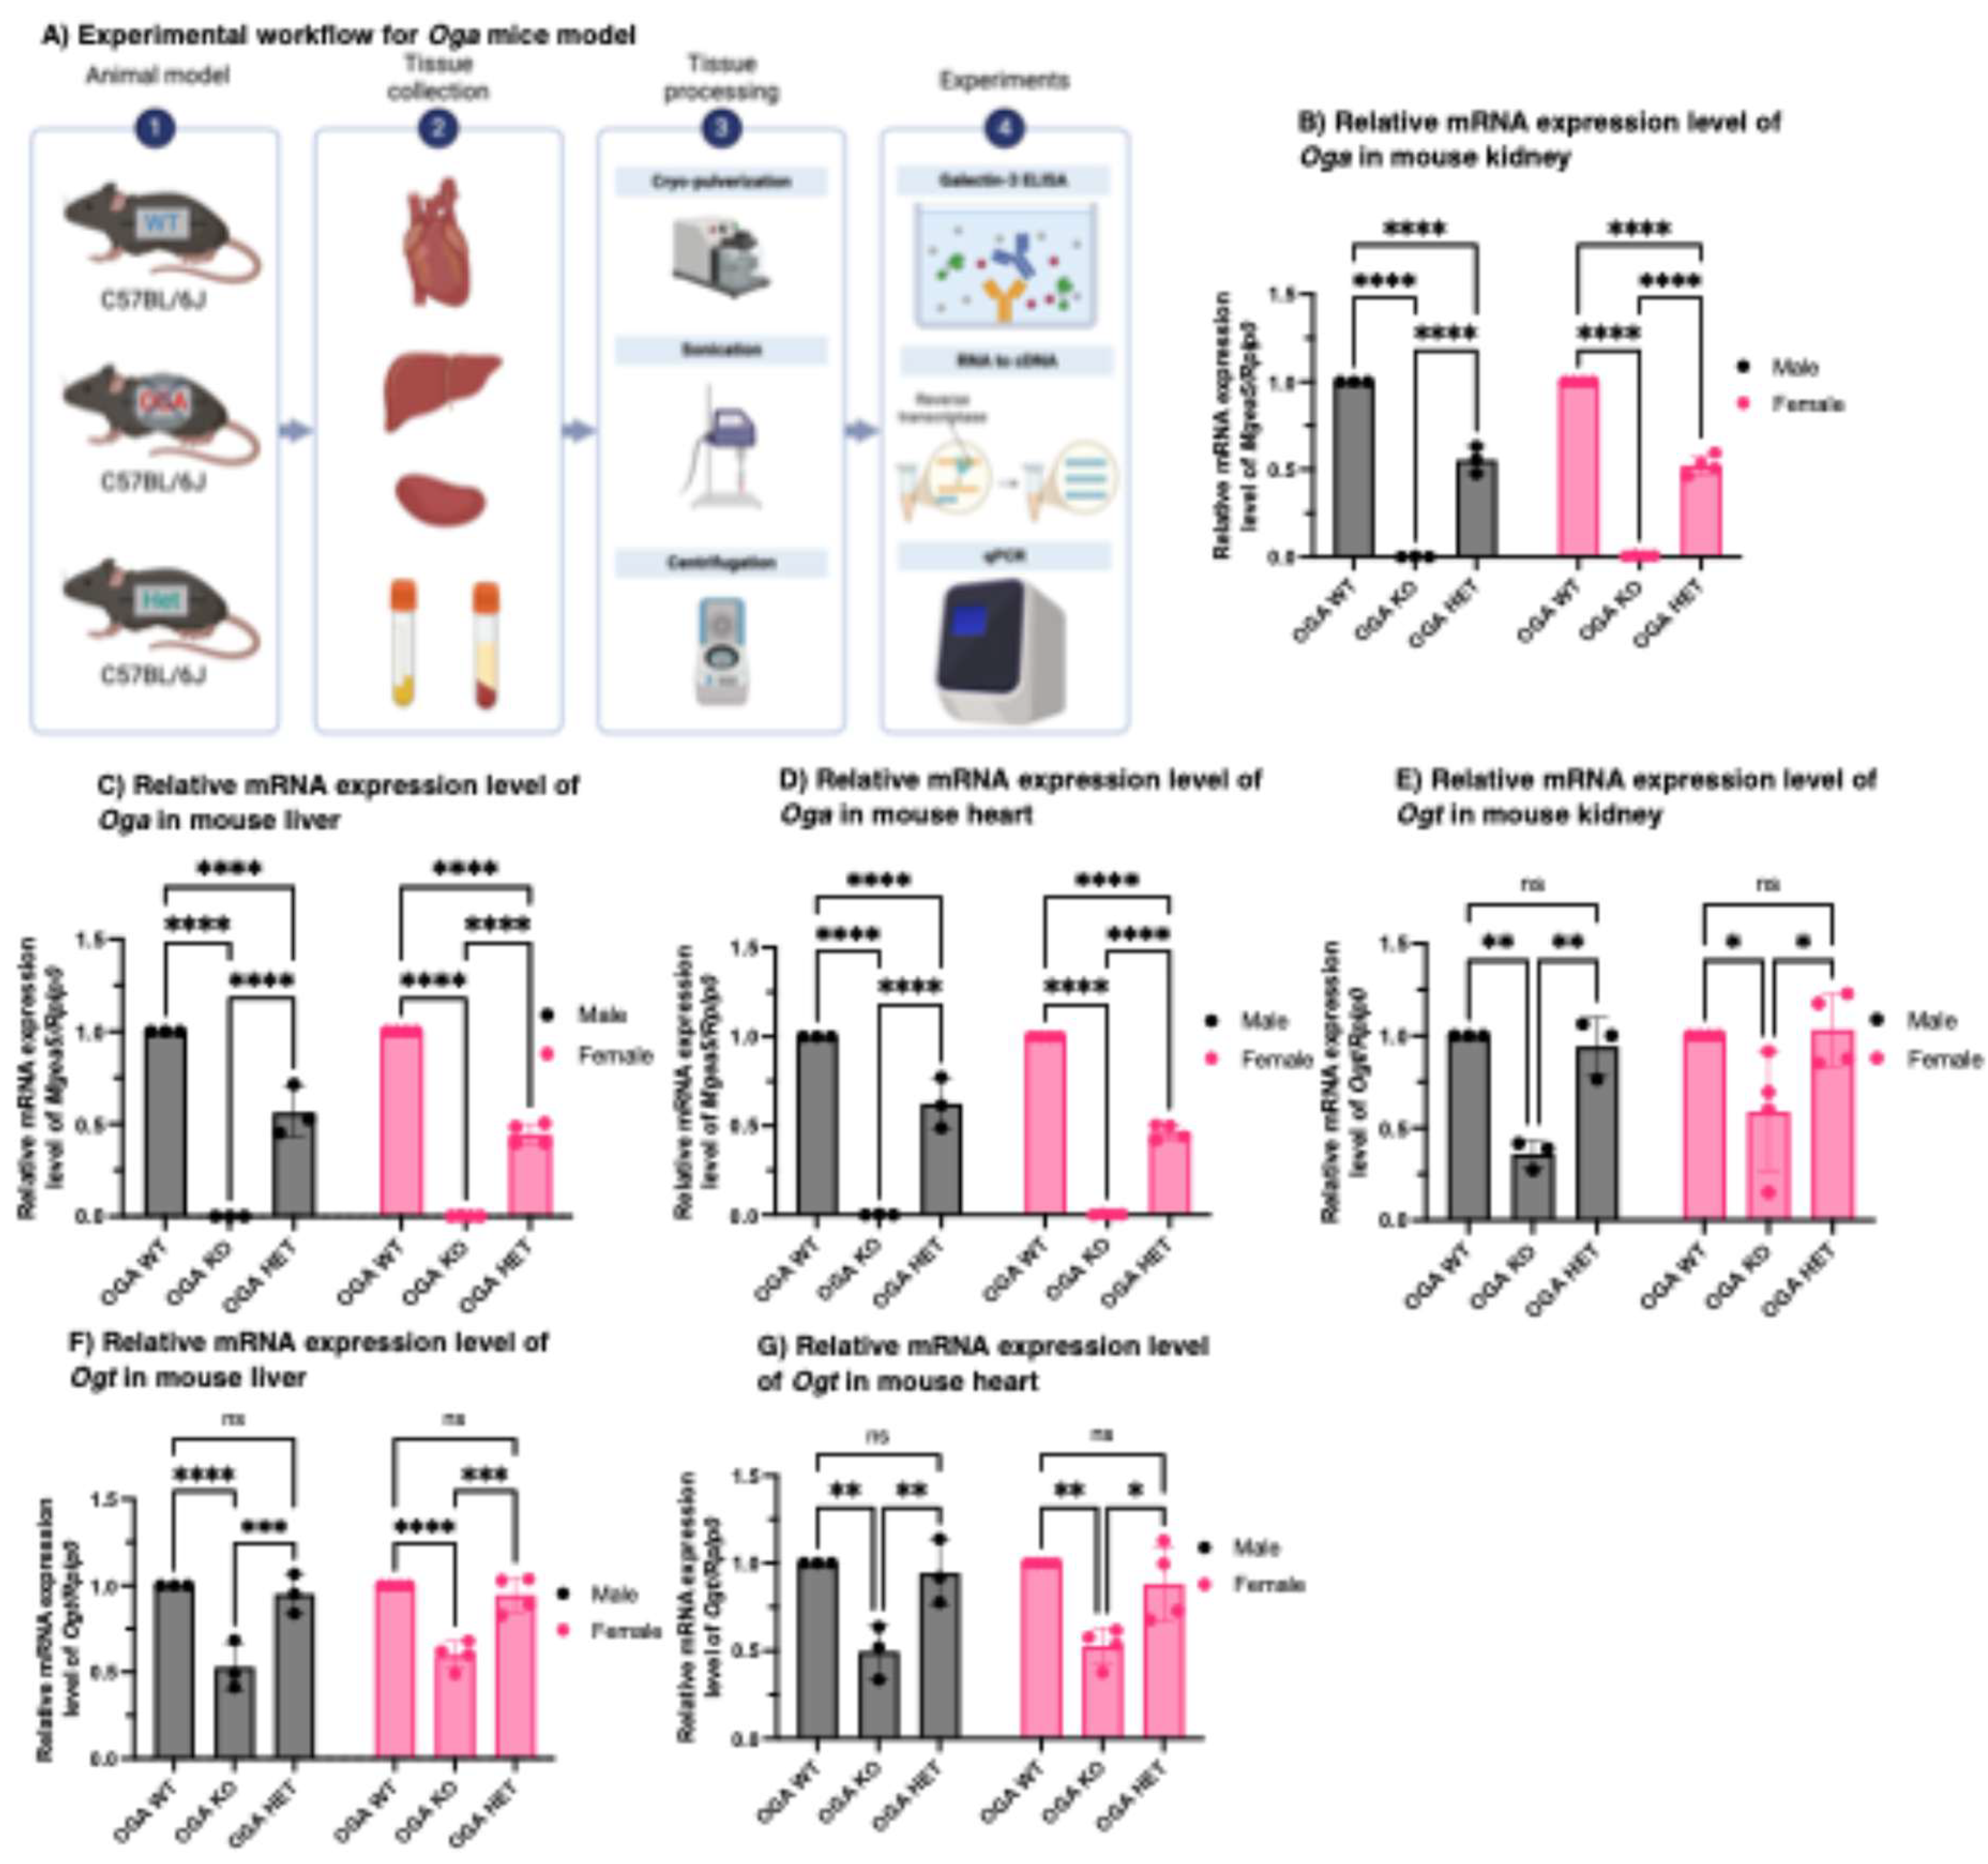
Figure 3.
Serum and plasma Gal-3 levels are significantly lower in Oga depleted mice. (A) Serum Gal-3 levels of Oga KO male and female mice are lower than Oga WT, and HET mice exhibit an intermediate level. (B) Plasma Gal-3 levels of Oga KO male and female mice are lower than Oga WT, and HET mice exhibit an intermediate level. N = 8 and 10 biological replicates for male and female mice respectively. (C) Blood glucose levels in Oga KO male and female mice are significantly lower than Oga WT, and HET mice exhibit similar blood glucose levels to WT mice. N = 4 biological replicates. (D) Both Oga WT and lean male mice exhibit similar serum and plasma Gal-3 concentrations. N = 8 and 4 biological replicates for Oga WT and lean mice respectively.
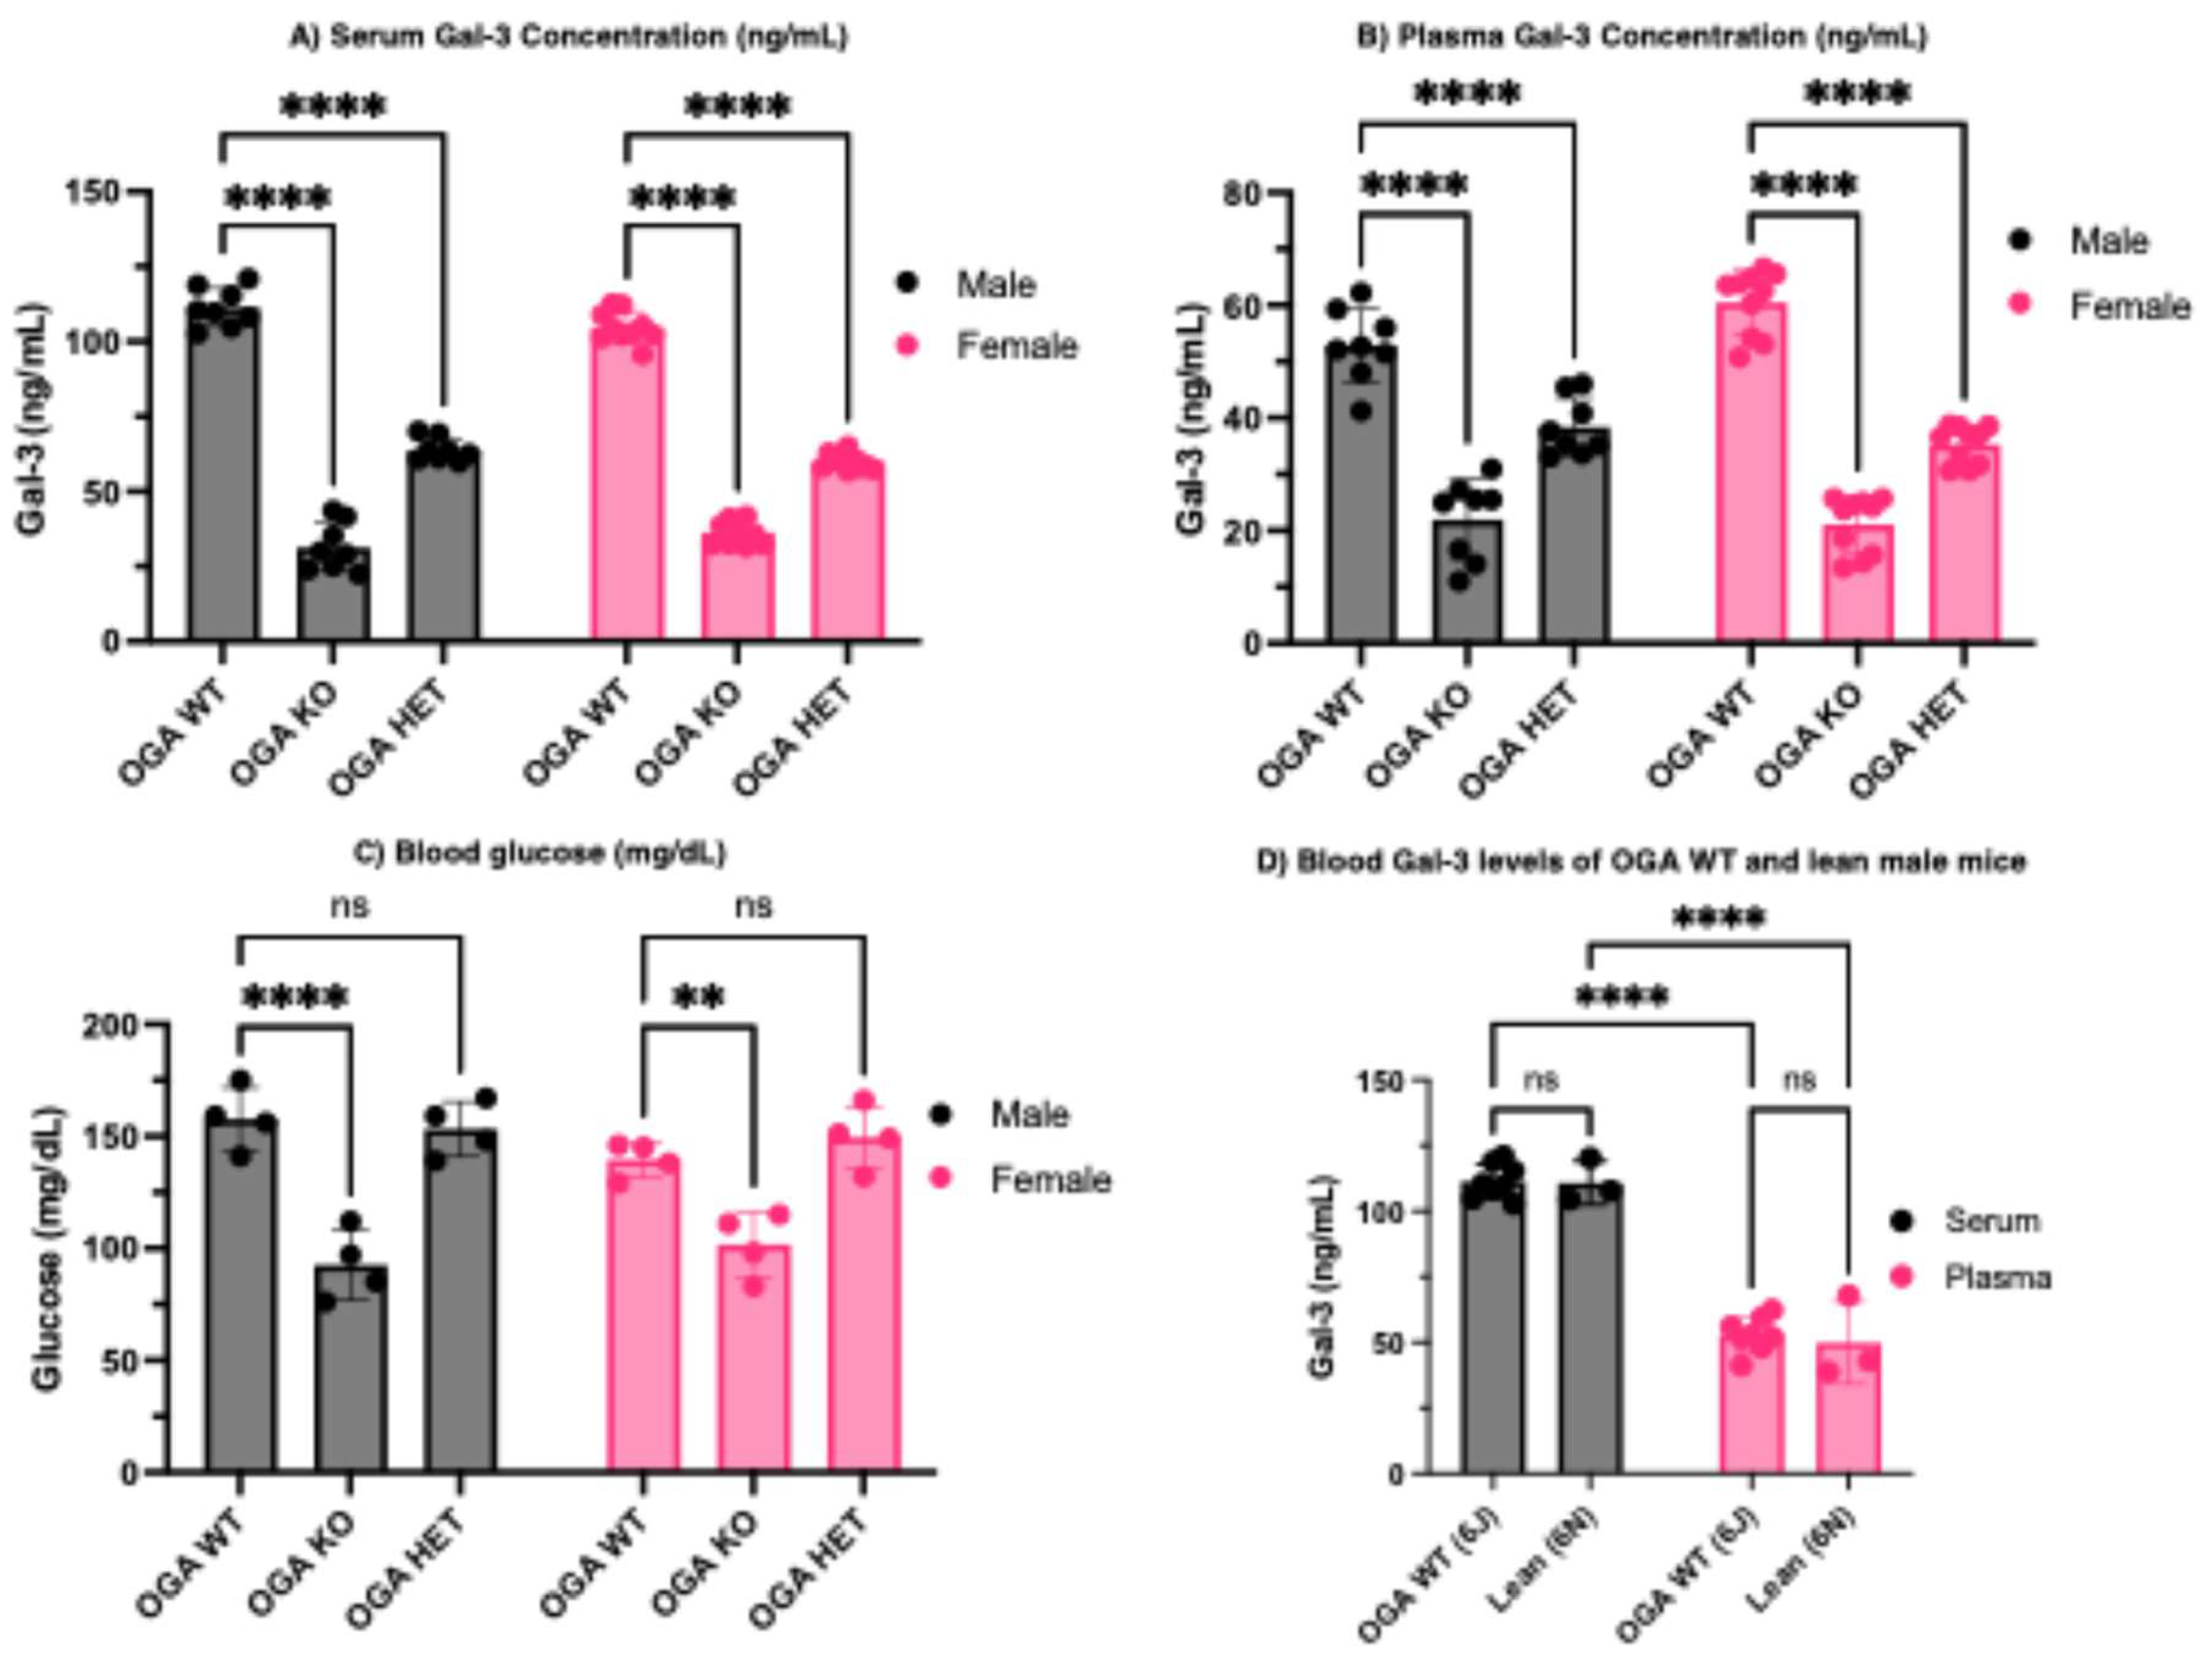
Figure 4.
Lgals3 mRNA is differentially expressed in different tissues. Lgals3 mRNA expression is higher in Oga WT mouse liver (A) and kidney (B) compared to Oga KO mouse liver and kidney tissues. (C) Lgals3 mRNA expression is lower in Oga WT mouse heart compared to Oga KO mouse heart tissue. Comparison of Lgals3 mRNA expression in different organs of (D) male and (E) female Oga WT, KO, and HET mice. N = 3 and 4 biological replicates for male and female mice respectively.
Disclaimer/Publisher’s Note: The statements, opinions and data contained in all publications are solely those of the individual author(s) and contributor(s) and not of MDPI and/or the editor(s). MDPI and/or the editor(s) disclaim responsibility for any injury to people or property resulting from any ideas, methods, instructions or products referred to in the content. |
© 2026 by the authors. Licensee MDPI, Basel, Switzerland. This article is an open access article distributed under the terms and conditions of the Creative Commons Attribution (CC BY) license (http://creativecommons.org/licenses/by/4.0/).
Copyright: This open access article is published under a Creative Commons CC BY 4.0 license, which permit the free download, distribution, and reuse, provided that the author and preprint are cited in any reuse.


