
Submitted:
10 July 2025
Posted:
11 July 2025
You are already at the latest version
Abstract
Background: Obesity and its complications have increased in both adults and children, with pediatric populations developing metabolic disorders earlier ages. Long non-coding RNAs, particularly MEG3, are involved in obesity through regulation of lipid metabolism genes including ATF4, FTO, SREBP1, FASN, and ACACA. However, data on MEG3 expression in pediatric obesity are limited. This study evaluated MEG3, FTO, and ATF4 expression in PBMCs from children with obesity and their associations with added sugar intake and lipid metabolism genes. Methods: In this cross-sectional study a total of 71 children aged of 6 to 12 years were included (28 normal weight and 43 with obesity). Anthropometrical and clinical parameters and dietary added sugar consumption were analyzed. Real-time PCR was performed to assess MEG3, FTO, ATF4, SREBP1, FASN and ACACA gene expression in peripheral blood mononuclear cells. Results: The expression of MEG3, ATF4, FTO, SREBP1, FASN, and ACACA was decreased in children with obesity. MEG3 and FTO showed sex-dependent expression in children without obesity, while additional sex-related differences were observed for SREBP1, FASN, ACACA, FTO, and MEG3 in children with obesity. MEG3 was correlated with increased levels of ATF4 and SREBP1, and moderately with FTO and FASN. In insulin resistance (IR) children, MEG3, ATF4, FTO, ACACA, and SREBP1 were reduced, while FASN was increased. Added sugar intake negatively correlated with FTO, SREBP1, and ACACA. Conclusions: The MEG3–FTO–ATF4 axis was altered in children with obesity, showing sex- and IR-related differences. Added sugar intake correlated negatively with lipid metabolism gene expression.
Keywords:
LncRNA MEG3
; Pediatric Obesity
; Lipid metabolism
; Added sugar
1. Introduction
Obesity and its related diseases have increased in recent decades, both adults and children, becoming a major public health concern. Epidemiological studies have demonstrated a significant increase in the prevalence of overweight and obesity among children worldwide. For instance, the prevalence of obesity in children aged 5 – 14 years has tripled worldwide, increasing from 2.0% in 1990 to 6.8% in 2021, and it is estimated that by 2050, the prevalence will reach 15.6% [1]. In Mexico, the prevalence of obesity among children aged 5 – 11 years has been reported at 18.1% [2]. Obesity is the main risk factor for insulin resistance (IR), type 2 diabetes (T2D), dyslipidemia, and cardiovascular diseases. The pediatric population in Mexico is considered prone to developing these metabolic complications at earlier ages [3]. As for genetic factors, several genes involved in lipid metabolism have been identified as potential contributors to the development of obesity and its metabolic complications [4].
Long non-coding RNAs (lncRNAs), which are longer than 200 nucleotides, play a role in development of IR by regulating lipid and carbohydrate metabolisms and inflammation [5]. Maternally expressed gene 3 (MEG3), a prominent gene located on chromosome 14 in humans, encodes a lncRNA approximately 700 nucleotides [6]. It is highly conserved and enriched in several tissues, including peripheral blood mononuclear cells (PBMCs) [7,8,9]. MEG3 participates in the pathogenesis of obesity and obesity-related disease, including cardiovascular diseases and T2D [10,11,12], and its differential expression offers significant potential for its use as both biomarkers and therapeutic targets [5]. Although MEG3 expression has been studied mainly in adult populations, there is limited evidence in pediatric populations in this context.
In addition to genetic factors, dietary factors also play a key role in the development of obesity and its metabolic complications. High intake of added sugars has been associated with increased risk of obesity, IR, and dyslipidemia, especially in children [13,14]. Emerging evidence suggests that excessive consumption of added sugars may alter lipid metabolism and contribute to the dysregulation of gene expression, including lncRNAs, such as MEG3 [15].
Recent studies demonstrated that MEG3 modulates key lipid metabolism genes, such as ATF4, FTO, SREBP1c, FASN, and ACACA. For instance, ATF4 is a key transcription factor in the regulation of lipids biosynthesis [16], and its deficiency is involved in reduction of hepatic lipogenesis through the regulation of SREBP1c, PPARγ and FASN expression [17]. FTO increases lipid accumulation in hepatocytes by promoting the nuclear translocation and maturation of SREBP1c [18]. Given these findings, the evaluation of the expression of these genes in PBMCs allows for a minimally invasive approach to explore molecular alterations related to obesity and dietary factors in children. Accordingly, the present study aimed to evaluate the expression of MEG3, FTO, and ATF4 in PBMCs from children with obesity and to assess their associations with added sugar intake and the expression of lipid metabolism-related genes.
2. Materials and Methods
2.1. Study Participants
A total of 71 unrelated children between the ages of 6 to 12 were enrolled from Mexico City (28 with normal weight and 43 with obesity) to evaluate the association of the consumption of added sugar with gene expression related to lipid metabolism, obesity, and cardiometabolic risk factors. The research was approved by the ethics committee of the Instituto Mexicano del Seguro Social (R-2024-785-061) and was conducted in compliance with the Declaration of Helsinki. Assent was obtained from all participating children, and informed consent was provided by their parents or legal guardians. Children presenting with acute infections, chronic diseases, participation in a weight loss program, or fasting plasma glucose levels exceeding 126 mg/dL were excluded from the study.
Weight and height were measured using a digital scale (Seca, Hamburg, Germany) and a portable stadiometer (Seca 225, Hamburg, Germany), respectively. Body mass index (BMI) was calculated as weight (kg) divided by height squared (m²). BMI values were converted into age- and sex-specific percentiles using the growth charts provided by the Centers for Disease Control and Prevention (CDC). Based on the CDC 2000 growth reference, children were classified as having normal weight if their BMI was ≥5th and <85th percentile, and as having obesity if their BMI was ≥95th percentile.
2.2. Biochemical Measurements
Following an 8-hour overnight fast, venous blood samples were collected to assess biochemical parameters, including low-density lipoprotein cholesterol (LDL-C), high-density lipoprotein cholesterol (HDL-C), total cholesterol (Total CHO), triglycerides (TG), glucose and insulin. Serum concentrations of LDL-C, HDL-C, Total CHO, TG, and glucose were determined using an enzymatic colorimetric method on the ILab 350 Clinical Chemistry System (Instrumentation Laboratory IL, Barcelona, Spain). Fasting insulin levels were measured using the Elecsys Insulin Assay on the Cobas e411 immunoassay analyzer (Roche Diagnostics GmbH, Mannheim, Germany). To determine the HOMA-IR, we multiply the fasting glucose concentration (mg/dL) by the fasting insulin concentration (µU/mL) and dividing by 405. IR was also evaluated in children, according to HOMA-IR values: those with HOMA-IR ≤ 3 were considered as not having IR, and those with HOMA-IR > 3 as having IR.
2.3. Dietary Added Sugar Consumption
Dietary added sugar consumption was assessed using a semi-quantitative food frequency questionnaire (FFQ) that inquiries about food intake over the past month [19]. It was designed using the Food Frequency Questionnaire from the Mexican National Health and Nutrition Survey (ENSANUT) for school-aged children (from the National Institute of Public Health) as a reference. Reference portions were estimated based on 24-hour dietary recalls from ENSANUT for school-aged children, and all portions were expressed in household measurements.
To estimate added sugar intake, a specific food composition database was developed to process the data collected through the questionnaire. This database was built using the Mexican Food Composition Table (BAM) [20]. The FFQ was analyzed following the same methodological criteria used in the analysis of grams and nutrients in the ENSANUT FFQ [21].
2.4. RT-qPCR
Total RNA was extracted from whole venous blood using the TRIzol reagent (Thermo Scientific, USA), according to the manufacturer’s instructions. The concentration and purity of the extracted RNA were subsequently evaluated using a NanoDrop 1000 Spectrophotometer (Thermo Scientific, USA). To remove genomic DNA, RNA was treated with DNase I (Thermo Fisher Scientific) according to the manufacturer’s instructions. RNA integrity was assessed using agarose gel electrophoresis. cDNA was synthesized from 500 ng of total RNA using the RevertAid First Strand cDNA Synthesis Kit (Thermo Scientific, USA). The resulting cDNA was subsequently used as a template for RT-qPCR, which was conducted using a Maxima SYBR Green/ROX qPCR Master Mix Thermo Scientific, USA) on a 7900HT Fast Real-Time PCR System (Applied Biosystems, California, USA). To determine gene expression, the following primers were used: FTO (Assay ID: QT00088802), ATF4 (Assay ID: QT00074466), SREBP1 (Assay ID: QT00036897), FASN (Assay ID: QT00030618), ACACA (Assay ID: QT01670053), RPLP0 (Assay ID: QT01839887), and MEG3 (Assay ID: LPH02974A) (Qiagen; Hilden, Germany). mRNA relative concentrations were normalized with Ct values of RPLP0, and values were calculated using 2−ΔΔCt formula.
2.5. Statistical Analysis
The normality of continuous variables was assessed using the Shapiro-Wilk test. Variables with normal distribution were analyzed using the student’s t-test, while non-normally distributed variables were analyzed using the Mann-Whitney U test. Differences between categorical variables were evaluated using the Chi-square test. To evaluate the relationship between variables, Pearson’s correlation was used for parametric data and Spearman’s correlation for nonparametric data.
Due to the non-normal distribution of residuals in the linear regression model, quantile regression was used to evaluate associations across different points of the outcome distribution, adjusting for age, sex, and total energy intake. No variable standardization was applied. For all analyses, a two-tailed p-value of <.05 was statistically meaningful. All statistical analyses were performed using STATA (version 19.5; StataCorp LLC, USA).
3. Results
3.1. Characteristics of the Study Population
The health outcome variables of the children are shown in Table 1. The mean age was 8.94 ± 1.68 years. Girls represented 60.56% of the sample, while boys accounted for 39.44%. BMI, insulin, HOMA-IR, and TG levels were significantly higher in the obesity group compared to the without obesity group. Moreover, HDL-C concentration was significantly lower in children with obesity than in those without obesity. No differences were found in glucose, total cholesterol, or LDL-C between the two groups. Finally, no significant differences in added sugar and total energy intake were observed between the groups.
3.2. Expression of Genes Involved in Lipid Metabolism in Children with Obesity
Results showed alterations in gene expression associated with lipid metabolism in children with obesity. As shown in Figure 1, the mRNA expression of SREBP1 (p= 0.0176), FASN (p= 0.0412), ACACA (p= 0.0255), FTO (p <0.0001), and ATF4 (p <0.0001) were remarkably reduced in obesity group compared to control group. Moreover, the expression of lncRNA MEG3 (p = 0.0197) was increased in children with obesity compared to those with normal weight. This finding suggests that obesity in children decrease the expression of gene involved with lipid metabolism.
In addition, gene expression was also analyzed according to sex in both the normal weight and obesity groups. As shown in Figure 2, among children with normal weight, the expression of FASN (p= 0.0293) was higher in boys compared to girls. In contrast, the expression of ACACA (p= 0.0309) and MEG3 (p= 0.0144) was higher in girls compared to boys. However, no differences were found in the expression of SREBP1, FTO, or ATF4 between those children. Instead, in children with obesity, the expression of FASN (p= 0.0316), FTO (p= 0.0443), and MEG3 (p= 0.0487) was higher in boys compared to girls as shown in Figure 3. No differences were found in the expression of SREBP1, ACACA, or ATF4 between boys and girls with obesity. Thus, evidence indicate FASN, ACACA, FTO and MEG3 are differential expressed in girls and boys.
Based on the IR criterion, 50.70% of children were diagnosed with IR. As show in the Figure 4, the expression of SREBP1 (p = 0.028), ACACA (p = 0.038), FTO (p = 0.045), ATF4 (p = 0.041) and MEG3 (p= 0.021) was reduced in children with IR compared to those without IR. These results suggest the downregulation of these genes may be involved in IR.
3.2. Associations Between lncRNA MEG3 and Gene Expression and Biochemical Parameters
The correlation between the expression of lncRNA MEG3 and of genes involved with lipid metabolisms was analyzed and the results are presented in Table 2. A positive correlation was found between the expression of MEG3 and the expression of SREBP1 (Rho= 0.408; p= 0.001), FTO (Rho= 0.389; p = 0.001) and ATF4 (Rho= 0.422; p < 0.001), whereas it showed a positive correlation with FASN (Rho= 0.238; p= 0.025). Quantile regression analysis was performed to examine the association between the expression levels of lncRNA MEG3 and genes involved in lipid metabolism. All models were adjusted for sex, age and BMI. β coefficients and p-values are presented in Supplementary Table S1. In quantile regression analysis, the expression of MEG3 was positively associated with SREBP1 (β= 0.322; p < 0.001), FASN (β= 0.186; p= 0.001), ACACA (β= 0.174; p= 0.033), FTO (β= 0.147; p= 0.003) and ATF4 (β=0.116; p= 0.007) expression. The above suggest that MEG3 expression may be modulating the expression of SREBP1, FASN, FTO and ATF4.
The correlation of the expression of the gene involved with lipid metabolism and lncRNA MEG3 with clinical and metabolic parameters was analyzed and the results are presented in Table 3. There was a negative correlation between SREBP1 and glucose (Rho= -0.260; p= 0.029), insulin (Rho= -0.354; p= 0.003), and HOMA-IR (Rho= -0.373; p= 0.001). Likewise, FASN showed a positive correlation between glucose (Rho= 0.304; p= 0.012), and HOMA-IR (r= 0.254; p= 0.040). In the case of ACACA, there was a negative correlation with BMI (Rho= -0.347; p= 0.003), waist circumference (Rho= -0.408; p <0.001), hip circumference (Rho= -0.307, p= 0.009), insulin (Rho= -0.425; p < 0.001), HOMA-IR (Rho= -0.438; p < 0.001), and triglycerides (Rho= -0.276; p= 0.019), whereas it showed a positive correlation with HDL-C (Rho= 0.302; p= 0.010). Additionally, FTO showed a negative correlation between BMI percentile (Rho= -0.452; p < 0.001), waist circumference (Rho= -0.497; p <0.001), hip circumference (Rho= -0.466; p < 0.001), insulin (Rho= -0.426; p < 0.001), and HOMA-IR (Rho= -0.419; p < 0.001). Similarly, ATF4 showed a negative correlation between BMI percentile (Rho= -0.381; p <0.001), waist circumference (Rho= -0.340; p= 0.003), hip circumference (Rho= -0.293; p= 0.012), insulin (Rho= -0.267; p= 0.026) and HOMA-IR (Rho= -0.241; p= 0.046). However, MEG3 did not show a significant correlation with any variable.
Quantile regression analysis was performed to examine the association between the expression levels of genes involved in lipid metabolism and clinical and biochemical parameters. All models were adjusted for sex, age and BMI. β coefficients and p-values are presented in Supplementary Table S2. In quantile regression analysis, the expression of SREBP1 was negatively associated with glucose (p < 0.05), and HOMA-IR (p < 0.05). However, FASN, ACACA, FTO, ATF4 and MEG3 did not show a significant association with any variable (p > 0.05).
3.3. Association Between Added Sugar Intake and Molecular and Biochemical Parameters
Although no significant differences in added sugar intake were observed between children without obesity and those with obesity (Table 1), analyses revealed significant correlations with gene expression as show in Table 4. There was a significant negative correlation between added sugar intake and SREBP1 (Rho= -0.317; p= 0.026), ACACA (Rho= -0.314; p= 0.026), and FTO (Rho= -0.355; p= 0.011), whereas FASN, ATF4 and MEG3 no significant correlation were observed.
Quantile regression analysis was performed to examine the association between the added sugar intake and expression levels of MEG3 and genes involved in lipid metabolism. All models were adjusted for sex and total energy intake. β coefficients and p-values are presented in Supplementary Table S3. In quantile regression analysis, the added sugar intake was significant negative associated with SREBP1 (β= -0.360; = 0.050) and FTO (β= -0.221: p= 0.032) expression, whereas FASN, ACACA, ATF4 and MEG3 no significant association were observed.
4. Discussion
Emerging studies in both animal models and humans have begun to elucidate the molecular mechanisms of the lncRNA MEG3 in obesity and obesity-related diseases [22]. However, its clinical relevance in the context of pediatric obesity remains poorly understood.
In this study, the expression of the MEG3, known to be involved in lipid metabolism, was evaluated in PBMCs from children with obesity, and compared with children with normal weight. Our results show an elevated expression of MEG3 in children with obesity. Consistent with recent findings reporting elevated expression of MEG3 in the serum of children with obesity [7]. Interestingly, we observed a sex-dependent expression pattern: in children from the control group, MEG3 expression was higher in girls than in boys, whereas in the obesity group, MEG3 expression were higher in boys than in girls.
Previous studies have reported positive correlation between MEG3 and lipid metabolism genes, such as FASN and PPARG, in the subcutaneous adipose tissue of females with obesity [23]. In line with these observations, our data showed that MEG3 expression in PBMCs was associated with the expression of SREBP1, FASN, FTO, and ATF4 in children with obesity, but no significant correlations were found with anthropometric and biochemical parameters.
Experimental studies in vivo and in vitro models have demonstrated that Meg3 inhibits of de novo lipogenesis by reducing the expression of Acc and Fasn [10,11]. Furthermore, silencing Meg3 in mice feed high fat diet led to reduce body weight, lower glucose and insulin levels, decreased inflammation and diminished fat accumulation [12].
Our results showed that children with IR exhibited lower of MEG3 expression. This finding contrasts with increased MEG3 levels in adult patients with T2D [8,9]. In animal studies, Meg3 upregulating worsen hepatic IR by increasing Foxo1 expression [24]. Additionally, Meg3 can act as a competing endogenous RNA, modulating miR-214 and consequently inducing Atf4 expression, thereby contributing to hepatic IR [25]. Therefore, the evidence suggests that the reduction expression of MEG3 could be related to the novo lipogenesis present in children with obesity and IR. However, it is needing more experimental studies in humans for elucidate the function of MEG3 in this context.
Regarding ATF4 gene, in our results found a decreased expression in PBMCs from children with obesity compared to those without obesity. In contrast, a previous study reported no changes in ATF4 expression in women with obesity compared to those with normal weight [26]. Also, that study showed a positive correlation between ATF4 expression and BMI, cholesterol, triglycerides, HDL-C [26]. In contrast to these observations, our data revealed no significant correlations between ATF4 expression and these lipid parameters.
ATF4 is a key transcription factor in regulating of lipids biosynthesis [16]. Previous experimental studies conducted in Atf4-deficient animal models demonstrated a diminished hepatic lipogenesis induced by high fructose intake, due to reduced expression of, Srebp1c, Pparγ and Fasn expression [17]. In vitro experiments reported that Atf4 inhibits the transcription of Srebp1, a central regulator of fatty acid synthesis [27]. In our study, ATF4, SREBP1 and FASN expression was reduced in PBMCs from children with obesity, contrasting with reports showing no differences in women with obesity [28]. Interestingly, we observed a significant positive correlation between ATF4 and SREBP1, FASN and ACACA expression in PBMCs from children with obesity (Supplementary Table S4). Moreover, SREBP1 and FASN expression correlated with glucose homeostasis markers, whereas ACACA expression correlated with glucose homeostasis markers, clinical and lipid parameters. After adjusted for sex and age, ATF4 expression was negatively associated with clinical parameters, while SREPB1 expression was negatively associated with glucose homeostasis markers (Supplementary Table S2). These findings suggest that the ATF4–SREBP1 interaction may be regulated differently in pediatric obesity, possibly reflecting early compensatory mechanisms.
On the other hand, we reported that children with IR presented a decreased in ATF4 expression compared to those without IR. Conversely, recent studies have reported high ATF4 expression in PBMCs from adult patients with T2D compared to non-diabetic subjects [29,30]. That study also found a positive correlation between ATF4 expression and MEG3 expression [29]. Consistently, we also observed a significant correlation between ATF4 and MEG3 expression, in PBMCs from children [29]. These results suggest that MEG3 may regulate ATF4 expression through the mechanisms molecular mentioned above. Interestingly, in contrast to adult data [29], we found negative correlations between ATF4 expression and insulin levels, HOMA-IR values, and BMI in the pediatric population.
In experimental studies have reported that, the inhibition of Atf4 reversed hepatic IR induced by acute brain endoplasmic reticulum stress [31]. Conversely, a recent study in β-cell–specific Atf4-deficient animal models exhibited exacerbated diabetes, shown by hyperglycemia, as well as markers of dedifferentiation [32,33]. Furthermore, Atf4 in β-cells is required for glucose homeostasis during aging and metabolic stress, but not in young mice [33]. Interestingly, recent in vitro experiments have also suggested a regulatory interplay between Fto and Atf4, showing that Fto expression may promote gluconeogenesis by inhibiting Atf4 expression [34]. Therefore, the results show an opposing trend found between children and adults, which may reflect developmental or compensatory differences in the regulation of ATF4. This discrepancy may suggest that, in early stages of metabolic dysfunction, reduced ATF4 expression represents an adaptive response aimed at mitigating cellular stress or limiting further metabolic impairment.
According to FTO gene, a previous study demonstrated that high FTO expression in PBMCs is associated with increased body mass [35]. In contrast, our results showed decreased FTO expression levels in PBMCs from children with obesity, with a significant negative correlation observed with BMI, and waist and hip circumference. Conversely, in adolescent and adult patients with overweight and obesity have reported no significant changes in FTO expression in PBMCs and adipose tissue compared to normal weight subjects [36,37,38,39]. These findings suggest that the reduce FTO expression observed in children may reflect age-specific regulatory mechanisms of FTO in early stages of metabolic dysregulation.
In addition, experimental studies have shown that Fto increases lipid accumulation in hepatocytes by promoting the nuclear translocation and maturation of Srebp1 [18]. Consistent with these findings, our results showed a strong positive correlation between FTO and SREBP1, FASN and ACACA in PBMCs (Supplementary Table S4). However, after adjusting for sex and age, FTO expression was negatively associated with anthropometric parameters (Supplementary Table S2).
On the other hand, recent experimental studies in animal models have demonstrated that m6A modification of Meg3 by demethylase activity of Fto reduces Meg3 expression [40]. Conversely, our study found a positive correlation between FTO and MEG3 expression in PBMCs from children with obesity. These findings suggest that the regulation of MEG3 expression by FTO may differ in humans. However, further studies are needed to elucidate the role of FTO activity in regulating MEG3 expression in this context.
A previous study reported increased mRNA and protein expression of FTO in subcutaneous adipose tissue from women with higher HOMA-IR values. In that study, a positive correlation was also found between FTO expression and HOMA-IR index [41]. Conversely, our findings showed reduced FTO expression in PBMCs from children with IR compared to those without IR. Additionally, we found a strong negative correlation between FTO expression and both insulin levels and HOMA-IR values. In line with these observations, a recent study reported downregulation of FTO expression in human pancreatic islets from patients with diabetes [42]. That study also demonstrated that reduced Fto expression impaired insulin release in rat pancreatic cells [42]. Therefore, these findings suggest that FTO may play an important role in the development of T2D. However, further experimental and clinical studies are needed to elucidate the role in both children and adult in this context.
In addition to these molecular associations, we evaluated the potential influence of dietary added sugar intake on gene expression. Our analysis showed significant negative correlations between added sugar intake and the expression of SREBP1, ACACA, and FTO in PBMCs from children with obesity. Similar findings have been reported in adipose tissue, where a significant negative correlation was observed between FTO expression in adipose tissue and total carbohydrate intake in subjects with and without obesity [39]. Furthermore, after adjusting for sex and total energy intake, dietary intake of added sugar was negatively associated with the FTO and SREBP1 expression in PBMCs from children with obesity. Specifically, intake > 50g of added sugar was associated with reductions of 0.221 and 0.360 units in of FTO and SREPB1 expression levels in PBMCs, respectively (Supplementary Table S3). These findings suggest that excessive added sugar intake may contribute to early dysregulation of lipid metabolism pathways mediated by FTO and SREBP1 in pediatric obesity.
The main limitations of this study are that gene expression was analyzed in PBMCs, which may not fully reflect expression patterns in primary metabolic tissues such as liver, adipose tissue, or muscle. However, PBMCs are a relevant surrogate to investigate systemic metabolic alterations, particularly in pediatric populations where invasive sampling is not feasible. The cross-sectional design limits the ability to establish causal relationships between gene expression, metabolic parameters, and added sugar intake. Additionally, dietary intake was assessed using food frequency questionnaires, which may be affected by recall bias and reporting errors, especially in children. Notably, a strength of this study is that it is among the first to examine the association between added sugar intake and the expression of genes related to metabolic disease in a pediatric population, providing insight into early molecular alterations potentially linked to diet.
5. Conclusions
Our findings indicate that the expression of the MEG3–FTO–ATF4 axis is altered in children with obesity. Both MEG3 and FTO exhibit sex-dependent expression pattern in children without obesity, while in children with obesity, this sex-related variation is also observed for SREBP1, FASN, ACACA, FTO and MEG3, suggesting a potential role of sex in the regulation of lipid metabolism genes under obesogenic conditions. In children with IR, FAS was expression increased, whereas SREBP1, ATF4, ACACA, FTO and MEG3 expression were reduced. Moreover, added sugar intake correlated negatively with SREBP1, ACACA and FTO, suggesting a potential modulatory effect of dietary sugar on lipid metabolism gene expression. Taken together, these findings suggest that dietary sugar intake, gene expression, and sex differences may interact and contribute to early metabolic alterations in children with obesity.
Supplementary Materials
The following supporting information can be downloaded at the website of this paper posted on Preprints.org.
Author Contributions
Conceptualization, A.H.-D.C. and M.C.; methodology, P.J.P.-G., M.V.-G., C.I.R.-S, K.O.A.-S, A.P.-B., A.P.-B., M-V.-M., A.N.-C., R.R.-N., F.H., and A.H.-D.C.; validation, M.C.; formal analysis, A.H.-D.C., C.I.R.-S., M.V.-M., and R.R.-N.; investigation, A.H.-D.C., P.J.P.-G., M.V.-G., C.I.R.-S., K.I.A.-S., M.V.-M., R.R.-N., F.H., and M.C.; resources, M.C.; data curation, A.H.-D.C., C.I.R.-S., M.V.-M., R.R.-N., and F.H.; writing—original draft preparation, A.H.-D.C., P.J.P.-G, M.V.-G., and M.C.; writing—review and editing, C.I.R.-S., K.I.A.-S., A.P.-B., M.V.-M., A.N.-C., R.R.-N., and F.H.; visualization, A.H.-D.C.; supervision, M.C.; project administration, A.H.-D.C., C.I.R.-S., M.V.-M., A.N.-C., R.R.-N., F.H., and M.C. funding acquisition, M.C. All authors have read and agreed to the published version of the manuscript.
Funding
This research received no external funding.
Institutional Review Board Statement
This study was conducted in accordance with the Declaration of Helsinki and approved by the Ethics Committee of the Instituto Mexicano del Seguro Social (CONBIOETI-CA-09-CEI-009-20160601; approved date: 23 Octuber 2024; approval number: R-2024-785-061).
Informed Consent Statement
Informed consent was obtained from all subjects involved in the study.
Data Availability Statement
The raw data supporting the conclusions of this article will be made available by the authors on request.
Acknowledgments
We are grateful to all participants involved in this study. Ana María Nava Cabrera and Araceli Pérez Bautista and the staff of the clinical laboratory service for the invaluable efforts and contributions to the present work.
Conflicts of Interest
The authors declare no conflicts of interest.
Abbreviations
The following abbreviations are used in this manuscript:
| ACACA | Acetyl-CoA Carboxylase ALPHA |
| ATF4 | Activating Transcription Factor 4; |
| BAM | Mexican Food Composition Table |
| BMI | Body Mass Index |
| CDC | Disease Control and Prevention |
| CHO | Cholesterol |
| ENSANUT | Mexican National Health and Nutrition Survey |
| FASN | Fatty Acid Synthase |
| FFQ | food frequency questionnaire |
| FTO | Fat Mass and Obesity-Associated Gene |
| HDL-C | High-Density Lipoprotein Cholesterol |
| HOMA-IR | Homeostatic Model Assessment of Insulin Resistance |
| IR | Insulin resistance |
| LDL-C | Low-Density Lipoprotein Cholesterol |
| lncRNA | Long non-coding RNA |
| MEG3 | Maternally Expressed Gene 3 |
| PBMCs | peripheral blood mononuclear cells |
| PPARγ | Peroxisome Proliferator-Activated Receptor γ |
| SREBP1 | Sterol Regulatory Element-Binding Protein 1 |
| T2D | Type 2 diabetes |
| TG | Triglycerides |
References
- Kerr, J.A.; Patton, G.C.; Cini, K.I.; Abate, Y.H.; Abbas, N.; Abd Al Magied, A.H.A.; Abd ElHafeez, S.; Abd-Elsalam, S.; Abdollahi, A.; Abdoun, M.; et al. Global, Regional, and National Prevalence of Child and Adolescent Overweight and Obesity, 1990–2021, with Forecasts to 2050: A Forecasting Study for the Global Burden of Disease Study 2021. The Lancet 2025, 405, 785–812. [CrossRef]
- Shamah-Levy, T.; Gaona-Pineda, E.B.; Cuevas-Nasu, L.; Morales-Ruan, C.; Valenzuela-Bravo, D.G.; Humarán, I.M.G.; Ávila-Arcos, M.A. Prevalencias de Sobrepeso y Obesidad En Población Escolar y Adolescente de México. Ensanut Continua 2020-2022. Salud Publica Mex 2023, 65, s218–s224. [CrossRef]
- Mercado-Mercado, G. Childhood Obesity in Mexico: A Constant Struggle and Reflection for Its Prevention on the Influence of Family and Social Habits. Obes Med 2023, 44, 100521. [CrossRef]
- Rasool, A.; Mahmoud, T.; Mathyk, B.; Kaneko-Tarui, T.; Roncari, D.; White, K.O.; O’Tierney-Ginn, P. Obesity Downregulates Lipid Metabolism Genes in First Trimester Placenta. Sci Rep 2022, 12, 19368. [CrossRef]
- Shettigar, V.K.; Garikipati, V.N.S. Role of LncRNAs in Pathophysiology of Obesity. Curr Opin Physiol 2025, 44, 100832. [CrossRef]
- Zhou, Y.; Zhang, X.; Klibanski, A. MEG3 Noncoding RNA: A Tumor Suppressor. J Mol Endocrinol 2012, 48, R45–R53. [CrossRef]
- Zavhorodnia, N.Yu. The Clinical and Pathogenetic Role of LncRNA MEG3 and MiRNA-421 in Obese Children with Non-Alcoholic Fatty Liver Disease. Zaporozhye Medical Journal 2022, 24, 293–300. [CrossRef]
- Parvar, S.N.; Mirzaei, A.; Zare, A.; Doustimotlagh, A.H.; Nikooei, S.; Arya, A.; Alipoor, B. Effect of Metformin on the Long Non-Coding RNA Expression Levels in Type 2 Diabetes: An in Vitro and Clinical Trial Study. Pharmacological Reports 2023, 75, 189–198. [CrossRef]
- Heydari, N.; Sharifi, R.; Nourbakhsh, M.; Golpour, P.; Nourbakhsh, M. Long Non-Coding RNAs TUG1 and MEG3 in Patients with Type 2 Diabetes and Their Association with Endoplasmic Reticulum Stress Markers. J Endocrinol Invest 2023, 46, 1441–1448. [CrossRef]
- Meng, X.; Long, M.; Yue, N.; Li, Q.; Chen, J.; Zhao, H.; Deng, W. LncRNA MEG3 Restrains Hepatic Lipogenesis via the FOXO1 Signaling Pathway in HepG2 Cells. Cell Biochem Biophys 2024, 82, 1253–1259. [CrossRef]
- Huang, P.; Huang, F.; Liu, H.; Zhang, T.; Yang, M.; Sun, C. LncRNA MEG3 Functions as a CeRNA in Regulating Hepatic Lipogenesis by Competitively Binding to MiR-21 with LRP6. Metabolism 2019, 94, 1–8. [CrossRef]
- Lu, Y.; Qie, D.; Yang, F.; Wu, J. LncRNA MEG3 Aggravates Adipocyte Inflammation and Insulin Resistance by Targeting IGF2BP2 to Activate TLR4/NF-ΚB Signaling Pathway. Int Immunopharmacol 2023, 121, 110467. [CrossRef]
- Endy, E.J.; Yi, S.-Y.; Steffen, B.T.; Shikany, J.M.; Jacobs, D.R.; Goins, R.K.; Steffen, L.M. Added Sugar Intake Is Associated with Weight Gain and Risk of Developing Obesity over 30 Years: The CARDIA Study. Nutrition, Metabolism and Cardiovascular Diseases 2024, 34, 466–474. [CrossRef]
- Magriplis, E.; Michas, G.; Petridi, E.; Chrousos, G.P.; Roma, E.; Benetou, V.; Cholopoulos, N.; Micha, R.; Panagiotakos, D.; Zampelas, A. Dietary Sugar Intake and Its Association with Obesity in Children and Adolescents. Children 2021, 8, 676. [CrossRef]
- Zou, Y.; Guo, Q.; Chang, Y.; Zhong, Y.; Cheng, L.; Wei, W. Effects of Maternal High-Fructose Diet on Long Non-Coding RNAs and Anxiety-like Behaviors in Offspring. Int J Mol Sci 2023, 24, 4460. [CrossRef]
- Wang, C.; Huang, Z.; Du, Y.; Cheng, Y.; Chen, S.; Guo, F. ATF4 Regulates Lipid Metabolism and Thermogenesis. Cell Res 2010, 20, 174–184. [CrossRef]
- Xiao, G.; Zhang, T.; Yu, S.; Lee, S.; Calabuig-Navarro, V.; Yamauchi, J.; Ringquist, S.; Dong, H.H. ATF4 Protein Deficiency Protects against High Fructose-Induced Hypertriglyceridemia in Mice. Journal of Biological Chemistry 2013, 288, 25350–25361. [CrossRef]
- Chen, A.; Chen, X.; Cheng, S.; Shu, L.; Yan, M.; Yao, L.; Wang, B.; Huang, S.; Zhou, L.; Yang, Z.; et al. FTO Promotes SREBP1c Maturation and Enhances CIDEC Transcription during Lipid Accumulation in HepG2 Cells. Biochimica et Biophysica Acta (BBA) - Molecular and Cell Biology of Lipids 2018, 1863, 538–548. [CrossRef]
- Gaona-Pineda, E.B.; Mejía-Rodríguez, F.; Cuevas-Nasu, L.; Gómez-Acosta, L.M.; Rangel-Baltazar, E.; Flores-Aldana, M.E. Dietary Intake and Adequacy of Energy and Nutrients in Mexican Adolescents: Results from Ensanut 2012. Salud Publica Mex 2018, 60, 404–413. [CrossRef]
- Ramírez-Silva I; Barragán-Vázquez S; Mongue-Urrea A; Mejía-Rodríguez F; Rodríguez-Ramírez S; Rivera-Dommarco J Base de Alimentos de México 2012 (BAM): Compilación de La Composición de Los Alimentos Frecuentemente Consumidos En El País. Versión 18.1.2 2023 Available online: https://insp.mx/informacion-relevante/bam-bienvenida (accessed on 31 January 2024).
- Ramírez-Silva, I.; Jiménez-Aguilar, A.; Valenzuela-Bravo, D.; Martinez-Tapia, B.; Rodríguez-Ramírez, S.; Gaona-Pineda, E.B.; Angulo-Estrada, S.; Shamah-Levy, T. Methodology for Estimating Dietary Data from the Semi-Quantitative Food Frequency Questionnaire of the Mexican National Health and Nutrition Survey 2012. Salud Publica Mex 2016, 58, 629. [CrossRef]
- Luo, Y.; Wang, H.; Wang, L.; Wu, W.; Zhao, J.; Li, X.; Xiong, R.; Ding, X.; Yuan, D.; Yuan, C. LncRNA MEG3: Targeting the Molecular Mechanisms and Pathogenic Causes of Metabolic Diseases. Curr Med Chem 2024, 31, 6140–6153. [CrossRef]
- Daneshmoghadam, J.; Omidifar, A.; Akbari Dilmaghani, N.; Karimi, Z.; Emamgholipour, S.; shanaki, M. The Gene Expression of Long Non-coding RNAs (LncRNAs): MEG3 and H19 in Adipose Tissues from Obese Women and Its Association with Insulin Resistance and Obesity Indices. J Clin Lab Anal 2021, 35. [CrossRef]
- Meng, X.; Long, M.; Yue, N.; Li, Q.; Chen, J.; Zhao, H.; Deng, W. LncRNA MEG3 Restrains Hepatic Lipogenesis via the FOXO1 Signaling Pathway in HepG2 Cells. Cell Biochem Biophys 2024, 82, 1253–1259. [CrossRef]
- Zhu, X.; Li, H.; Wu, Y.; Zhou, J.; Yang, G.; Wang, W. LncRNA MEG3 Promotes Hepatic Insulin Resistance by Serving as a Competing Endogenous RNA of MiR-214 to Regulate ATF4 Expression. Int J Mol Med 2018. [CrossRef]
- Di, F.; Liu, J.; Li, S.; Hong, Y.; Chen, Z.-J.; Du, Y. Activating Transcriptional Factor 4 Correlated with Obesity and Insulin Resistance in Polycystic Ovary Syndrome. Gynecological Endocrinology 2019, 35, 351–355. [CrossRef]
- Chen, H.; Yuan, R.; Zhang, Y.; Zhang, X.; Chen, L.; Zhou, X.; Yuan, Z.; Nie, Y.; Li, M.; Mo, D.; et al. ATF4 Regulates SREBP1c Expression to Control Fatty Acids Synthesis in 3T3-L1 Adipocytes Differentiation. Biochimica et Biophysica Acta (BBA) - Gene Regulatory Mechanisms 2016, 1859, 1459–1469. [CrossRef]
- Abdul-Maksoud, R.S.; Zidan, H.E.; Saleh, H.S.; Amer, S.A. Visfatin and SREBP-1c MRNA Expressions and Serum Levels Among Egyptian Women with Polycystic Ovary Syndrome. Genet Test Mol Biomarkers 2020, 24, 409–419. [CrossRef]
- Heydari, N.; Sharifi, R.; Nourbakhsh, M.; Golpour, P.; Nourbakhsh, M. Long Non-Coding RNAs TUG1 and MEG3 in Patients with Type 2 Diabetes and Their Association with Endoplasmic Reticulum Stress Markers. J Endocrinol Invest 2023, 46, 1441–1448. [CrossRef]
- Szpigel, A.; Hainault, I.; Carlier, A.; Venteclef, N.; Batto, A.F.; Hajduch, E.; Bernard, C.; Ktorza, A.; Gautier, J.F.; Ferré, P.; et al. Lipid Environment Induces ER Stress, TXNIP Expression and Inflammation in Immune Cells of Individuals with Type 2 Diabetes. Diabetologia 2018, 61, 399–412. [CrossRef]
- Zhang, Q.; Yu, J.; Liu, B.; Lv, Z.; Xia, T.; Xiao, F.; Chen, S.; Guo, F. Central Activating Transcription Factor 4 (ATF4) Regulates Hepatic Insulin Resistance in Mice via S6K1 Signaling and the Vagus Nerve. Diabetes 2013, 62, 2230–2239. [CrossRef]
- Kitakaze, K.; Oyadomari, M.; Zhang, J.; Hamada, Y.; Takenouchi, Y.; Tsuboi, K.; Inagaki, M.; Tachikawa, M.; Fujitani, Y.; Okamoto, Y.; et al. ATF4-Mediated Transcriptional Regulation Protects against β-Cell Loss during Endoplasmic Reticulum Stress in a Mouse Model. Mol Metab 2021, 54, 101338. [CrossRef]
- Yagan, M.; Najam, S.; Hu, R.; Wang, Y.; Dickerson, M.; Dadi, P.; Xu, Y.; Simmons, A.J.; Stein, R.; Adams, C.M.; et al. Atf4 Protects Islet β-Cell Identity and Function under Acute Glucose-Induced Stress but Promotes β-Cell Failure in the Presence of Free Fatty Acid. Diabetes 2025. [CrossRef]
- Mizuno, T. Regulation of Activating Transcription Factor 4 (Atf4) Expression by Fat Mass and Obesity-Associated (Fto) in Mouse Hepatocyte Cells. Acta Endocrinologica (Bucharest) 2021, 17, 26–32. [CrossRef]
- Berulava, T.; Horsthemke, B. The Obesity-Associated SNPs in Intron 1 of the FTO Gene Affect Primary Transcript Levels. European Journal of Human Genetics 2010, 18, 1054–1056. [CrossRef]
- Doaei, S.; Kalantari, N.; Izadi, P.; Salonurmi, T.; Jarrahi, A.M.; Rafieifar, S.; Azizi Tabesh, G.; Rahimzadeh, G.; Gholamalizadeh, M.; Goodarzi, M.O. Interactions between Macro-Nutrients’ Intake, FTO and IRX3 Gene Expression, and FTO Genotype in Obese and Overweight Male Adolescents. Adipocyte 2019, 8, 386–391. [CrossRef]
- Lappalainen, T.; Kolehmainen, M.; Schwab, U.; Pulkkinen, L.; de Mello, V.D.F.; Vaittinen, M.; Laaksonen, D.E.; Poutanen, K.; Uusitupa, M.; Gylling, H. Gene Expression of FTO in Human Subcutaneous Adipose Tissue, Peripheral Blood Mononuclear Cells and Adipocyte Cell Line. Lifestyle Genom 2010, 3, 37–45. [CrossRef]
- Doaei, S.; Kalantari, N.; Keshavarz Mohammadi, N.; Izadi, P.; Gholamalizadeh, M.; Eini-Zinab, H.; Salonurmi, T.; Mosavi Jarrahi, A.; Rafieifar, S.; Najafi, R.; et al. The Role of FTO Genotype in the Association Between FTO Gene Expression and Anthropometric Measures in Obese and Overweight Adolescent Boys. Am J Mens Health 2019, 13. [CrossRef]
- Yuzbashian, E.; Asghari, G.; Hedayati, M.; Zarkesh, M.; Mirmiran, P.; Khalaj, A. The Association of Dietary Carbohydrate with FTO Gene Expression in Visceral and Subcutaneous Adipose Tissue of Adults without Diabetes. Nutrition 2019, 63–64, 92–97. [CrossRef]
- Yan, H.; Huang, W.; Rao, J.; Yan, D.; Yuan, J. Demethylase FTO-Mediated M6A Modification of LncRNA MEG3 Activates Neuronal Pyroptosis via NLRP3 Signaling in Cerebral Ischemic Stroke. Mol Neurobiol 2024, 61, 1023–1043. [CrossRef]
- Bravard, A.; Veilleux, A.; Disse, E.; Laville, M.; Vidal, H.; Tchernof, A.; Rieusset, J. The Expression of FTO in Human Adipose Tissue Is Influenced by Fat Depot, Adiposity, and Insulin Sensitivity. Obesity 2013, 21, 1165–1173. [CrossRef]
- Taneera, J.; Khalique, A.; Abdrabh, S.; Mohammed, A.K.; Bouzid, A.; El-Huneidi, W.; Bustanji, Y.; Sulaiman, N.; Albasha, S.; Saber-Ayad, M.; et al. Fat Mass and Obesity-Associated (FTO) Gene Is Essential for Insulin Secretion and β-Cell Function: In Vitro Studies Using INS-1 Cells and Human Pancreatic Islets. Life Sci 2024, 339, 122421. [CrossRef]
Figure 1.
The expression of lipid metabolism genes in children with and without obesity. Gene expression of a) SREBP1, b) FASN, c) ACACA, e) FTO, e) ATF4, and f) MEG3 expression was determined by RT-qPCR using RPLP0 as reference for the 2−ΔΔCt method. Differences were tested by the Mann-Whitney test. Data are presented as means ± SD.
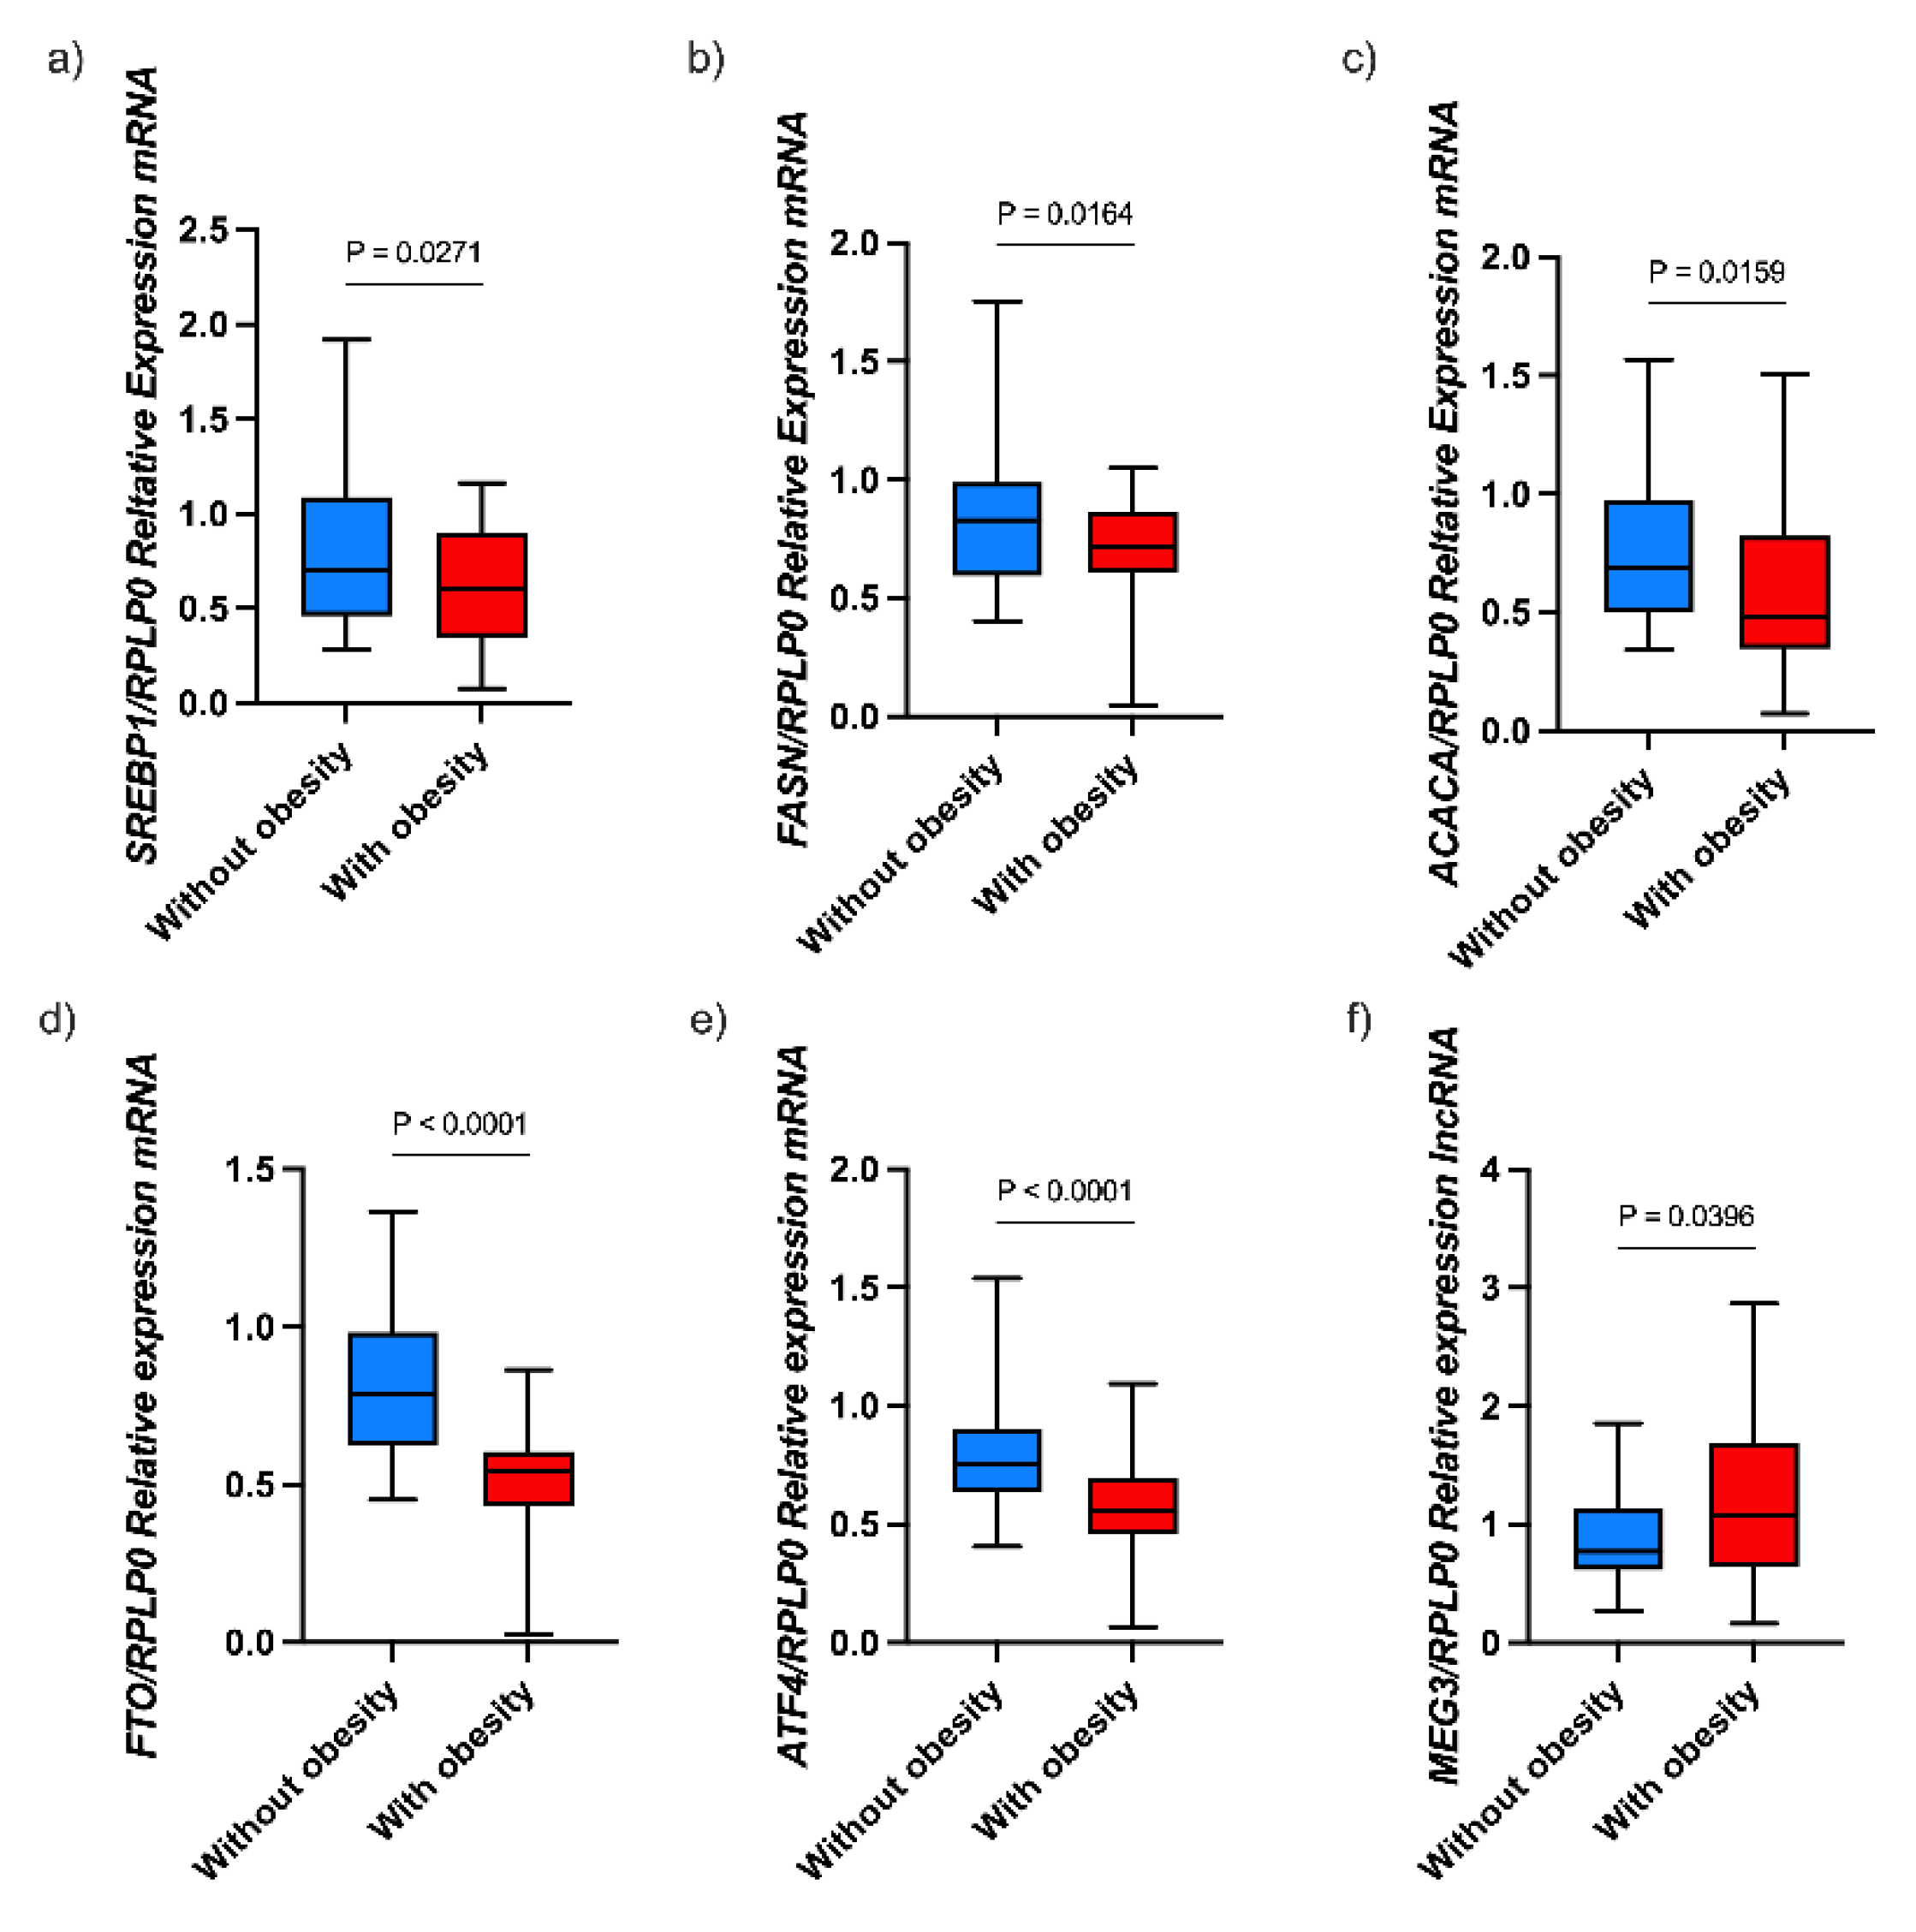
Figure 2.
The expression of lipid metabolism genes in girls and boys without obesity. Gene expression of a) SREBP1, b) FASN, c) ACACA, e) FTO, e) ATF4, and f) MEG3. mRNA expression was determined by RT-qPCR using RPLP0 as reference for the 2−ΔΔCt method. Differences were tested by the Mann-Whitney test. Data are presented as means ± SD.
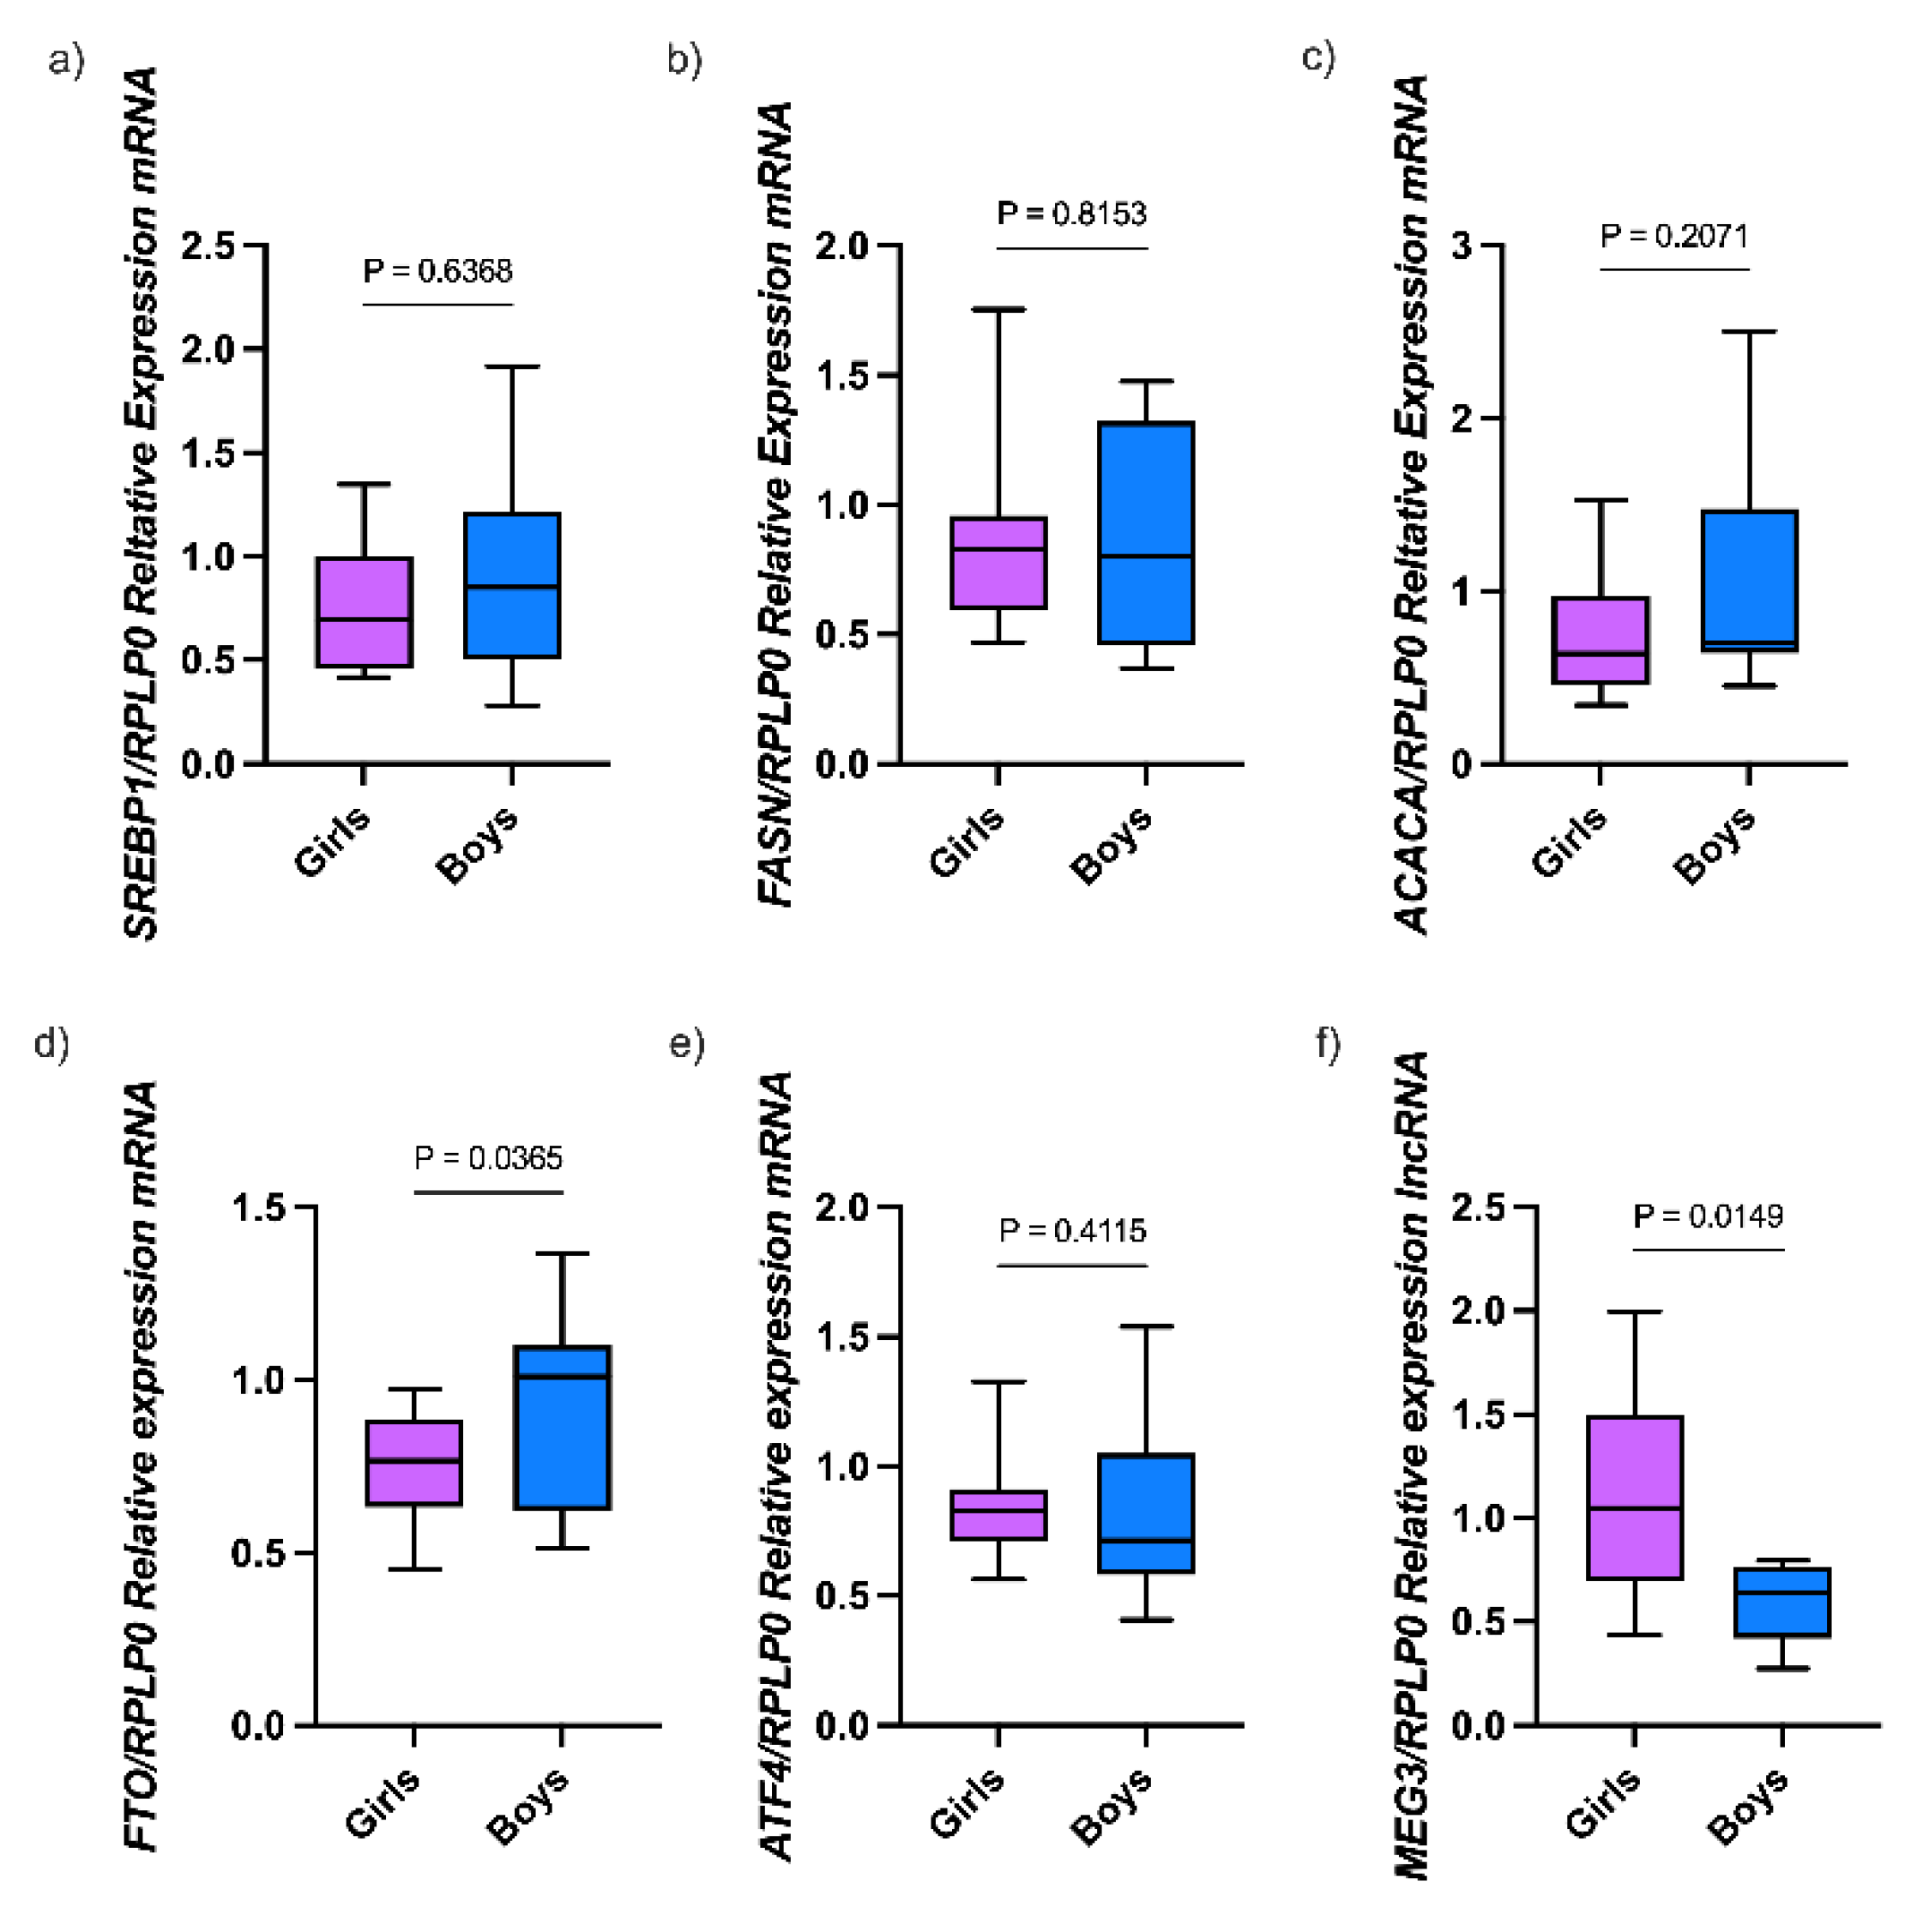
Figure 3.
The expression of lipid metabolism genes in girls and boys with obesity. Gene expression of a) SREBP1, b) FASN, c) ACACA, e) FTO, e) ATF4, and f) MEG3. mRNA expression was determined by RT-qPCR using RPLP0 as reference for the 2−ΔΔCt method. Differences were tested by the Mann-Whitney test. Data are presented as means ± SD.
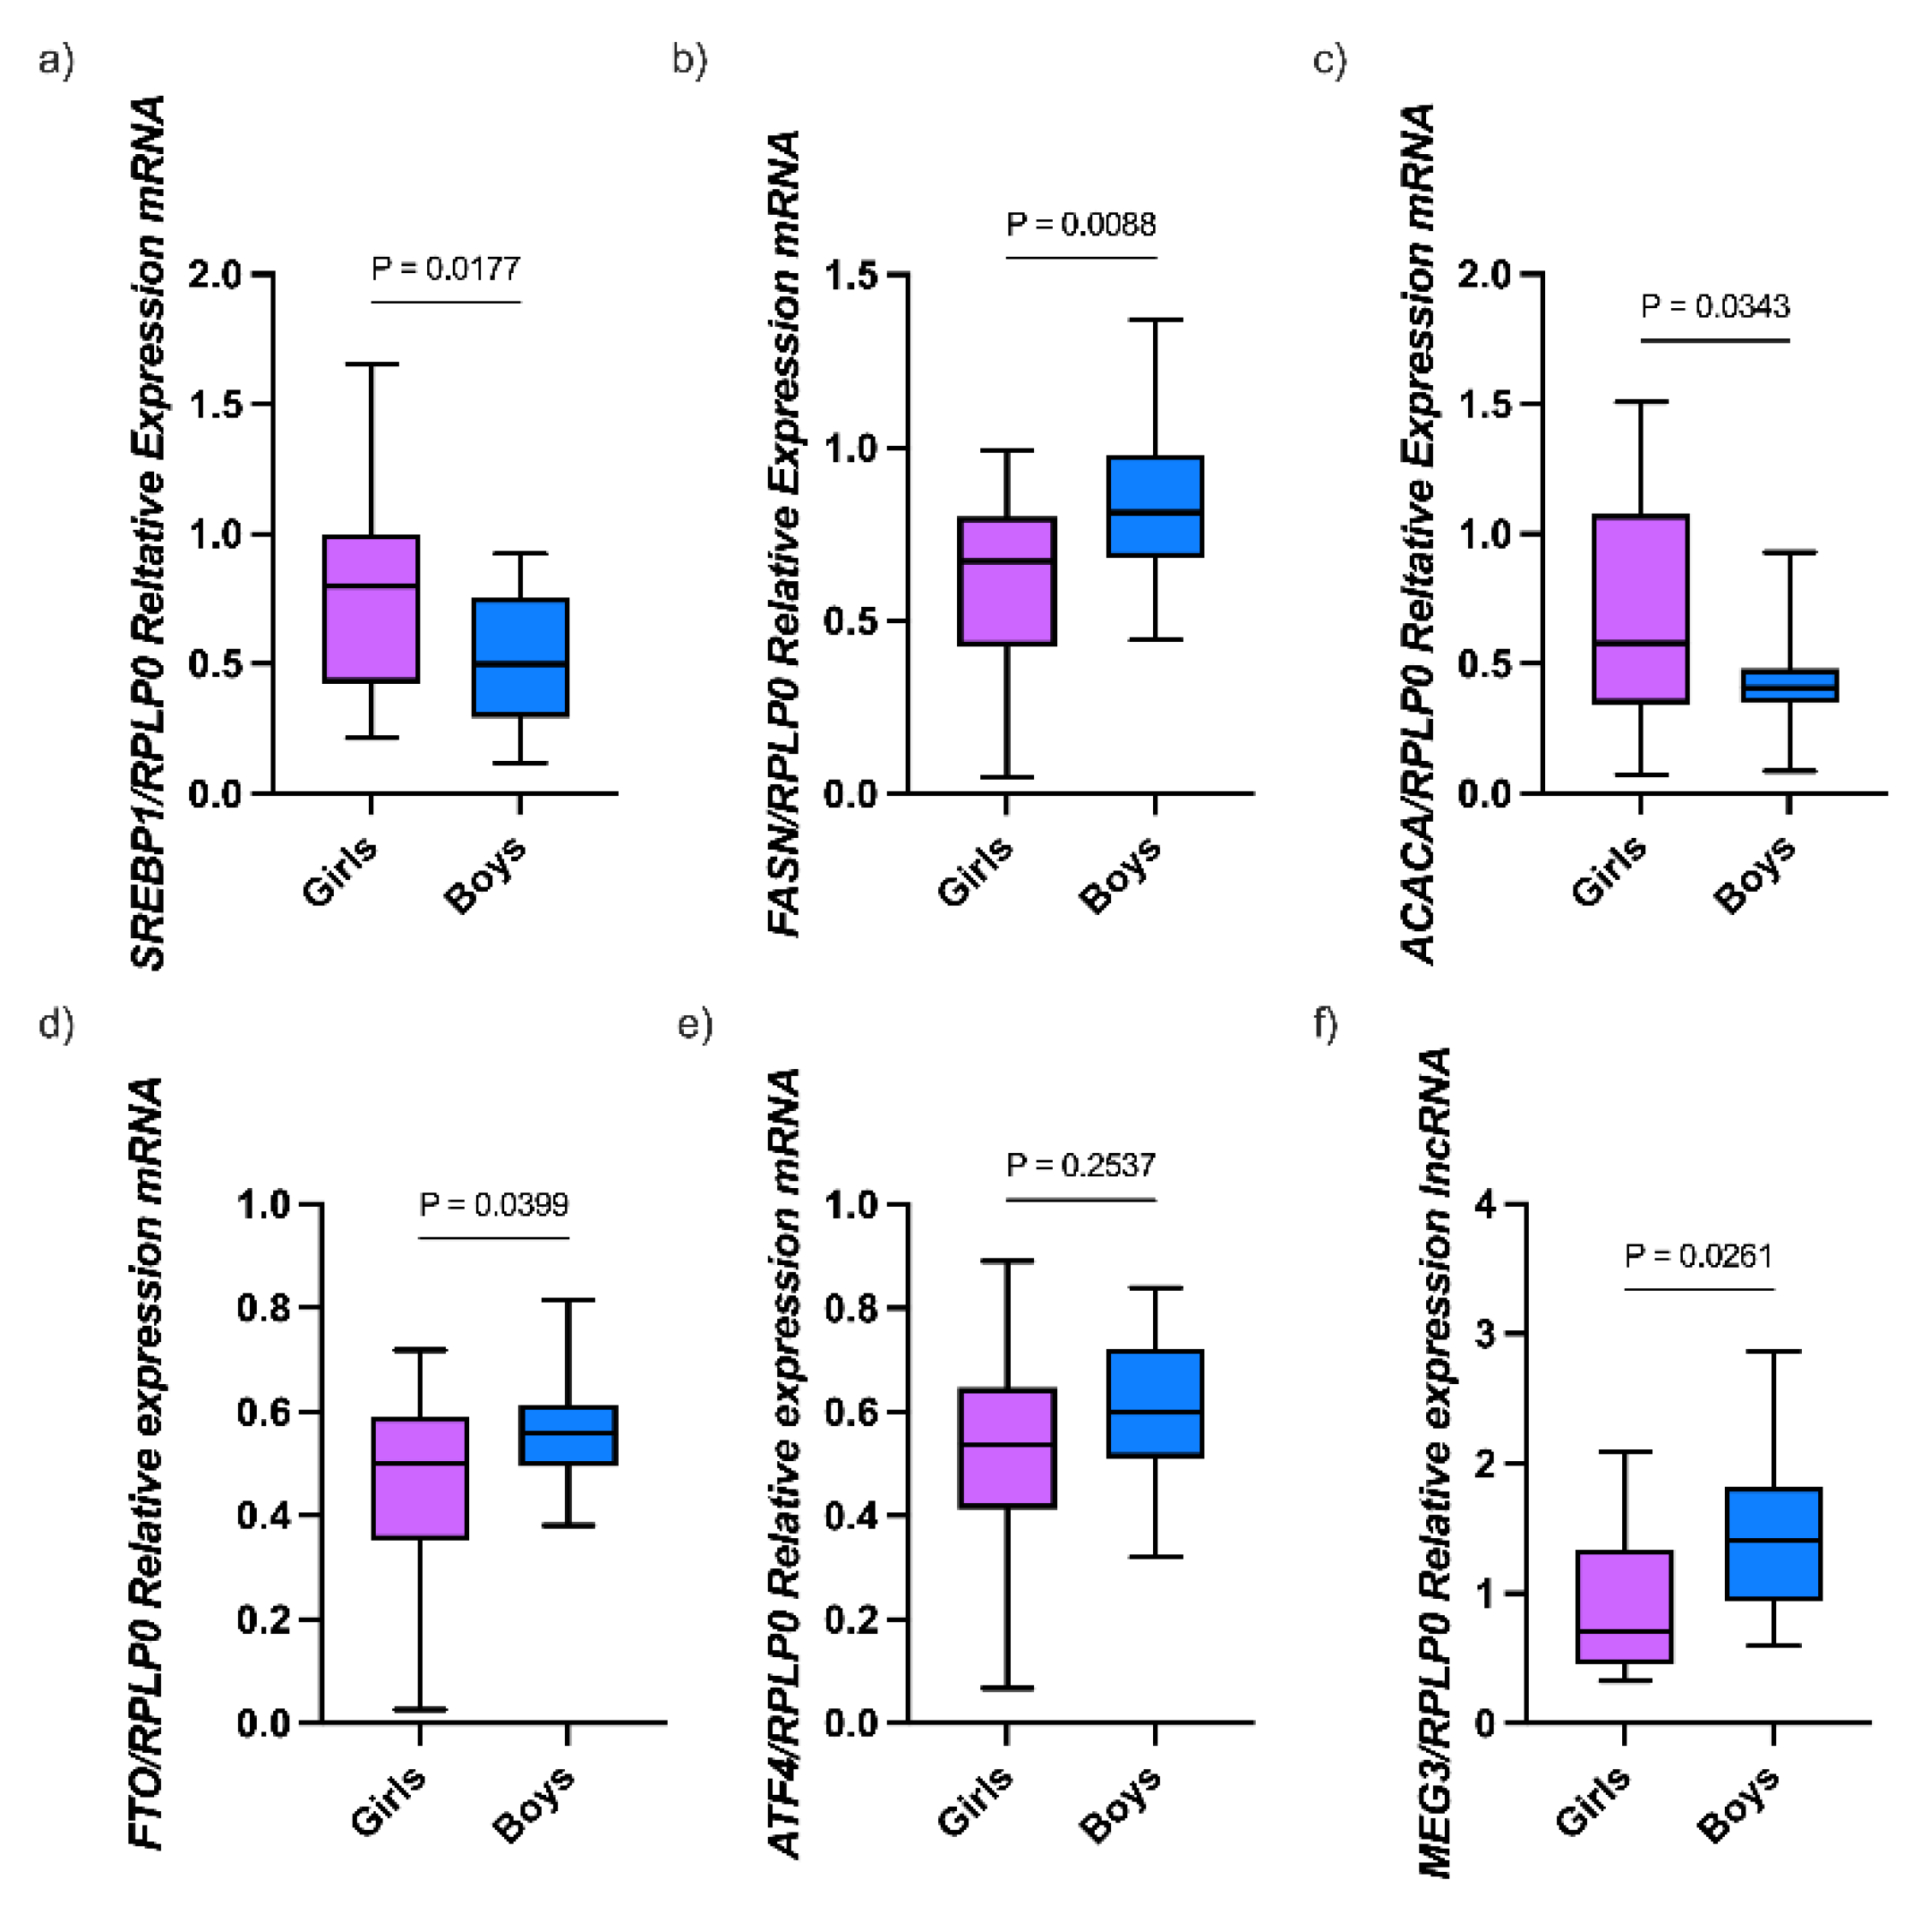
Figure 4.
The expression of lipid metabolism genes in children with and without IR. Gene expression of a) SREBP1 b) FASN c) ACACA e) FTO and f) ATF4. mRNA expression was determined by RT-qPCR using RPLP0 as reference for the 2−ΔΔCt method. Differences were tested by the Mann-Whitney test. Data are presented as means ± SD.
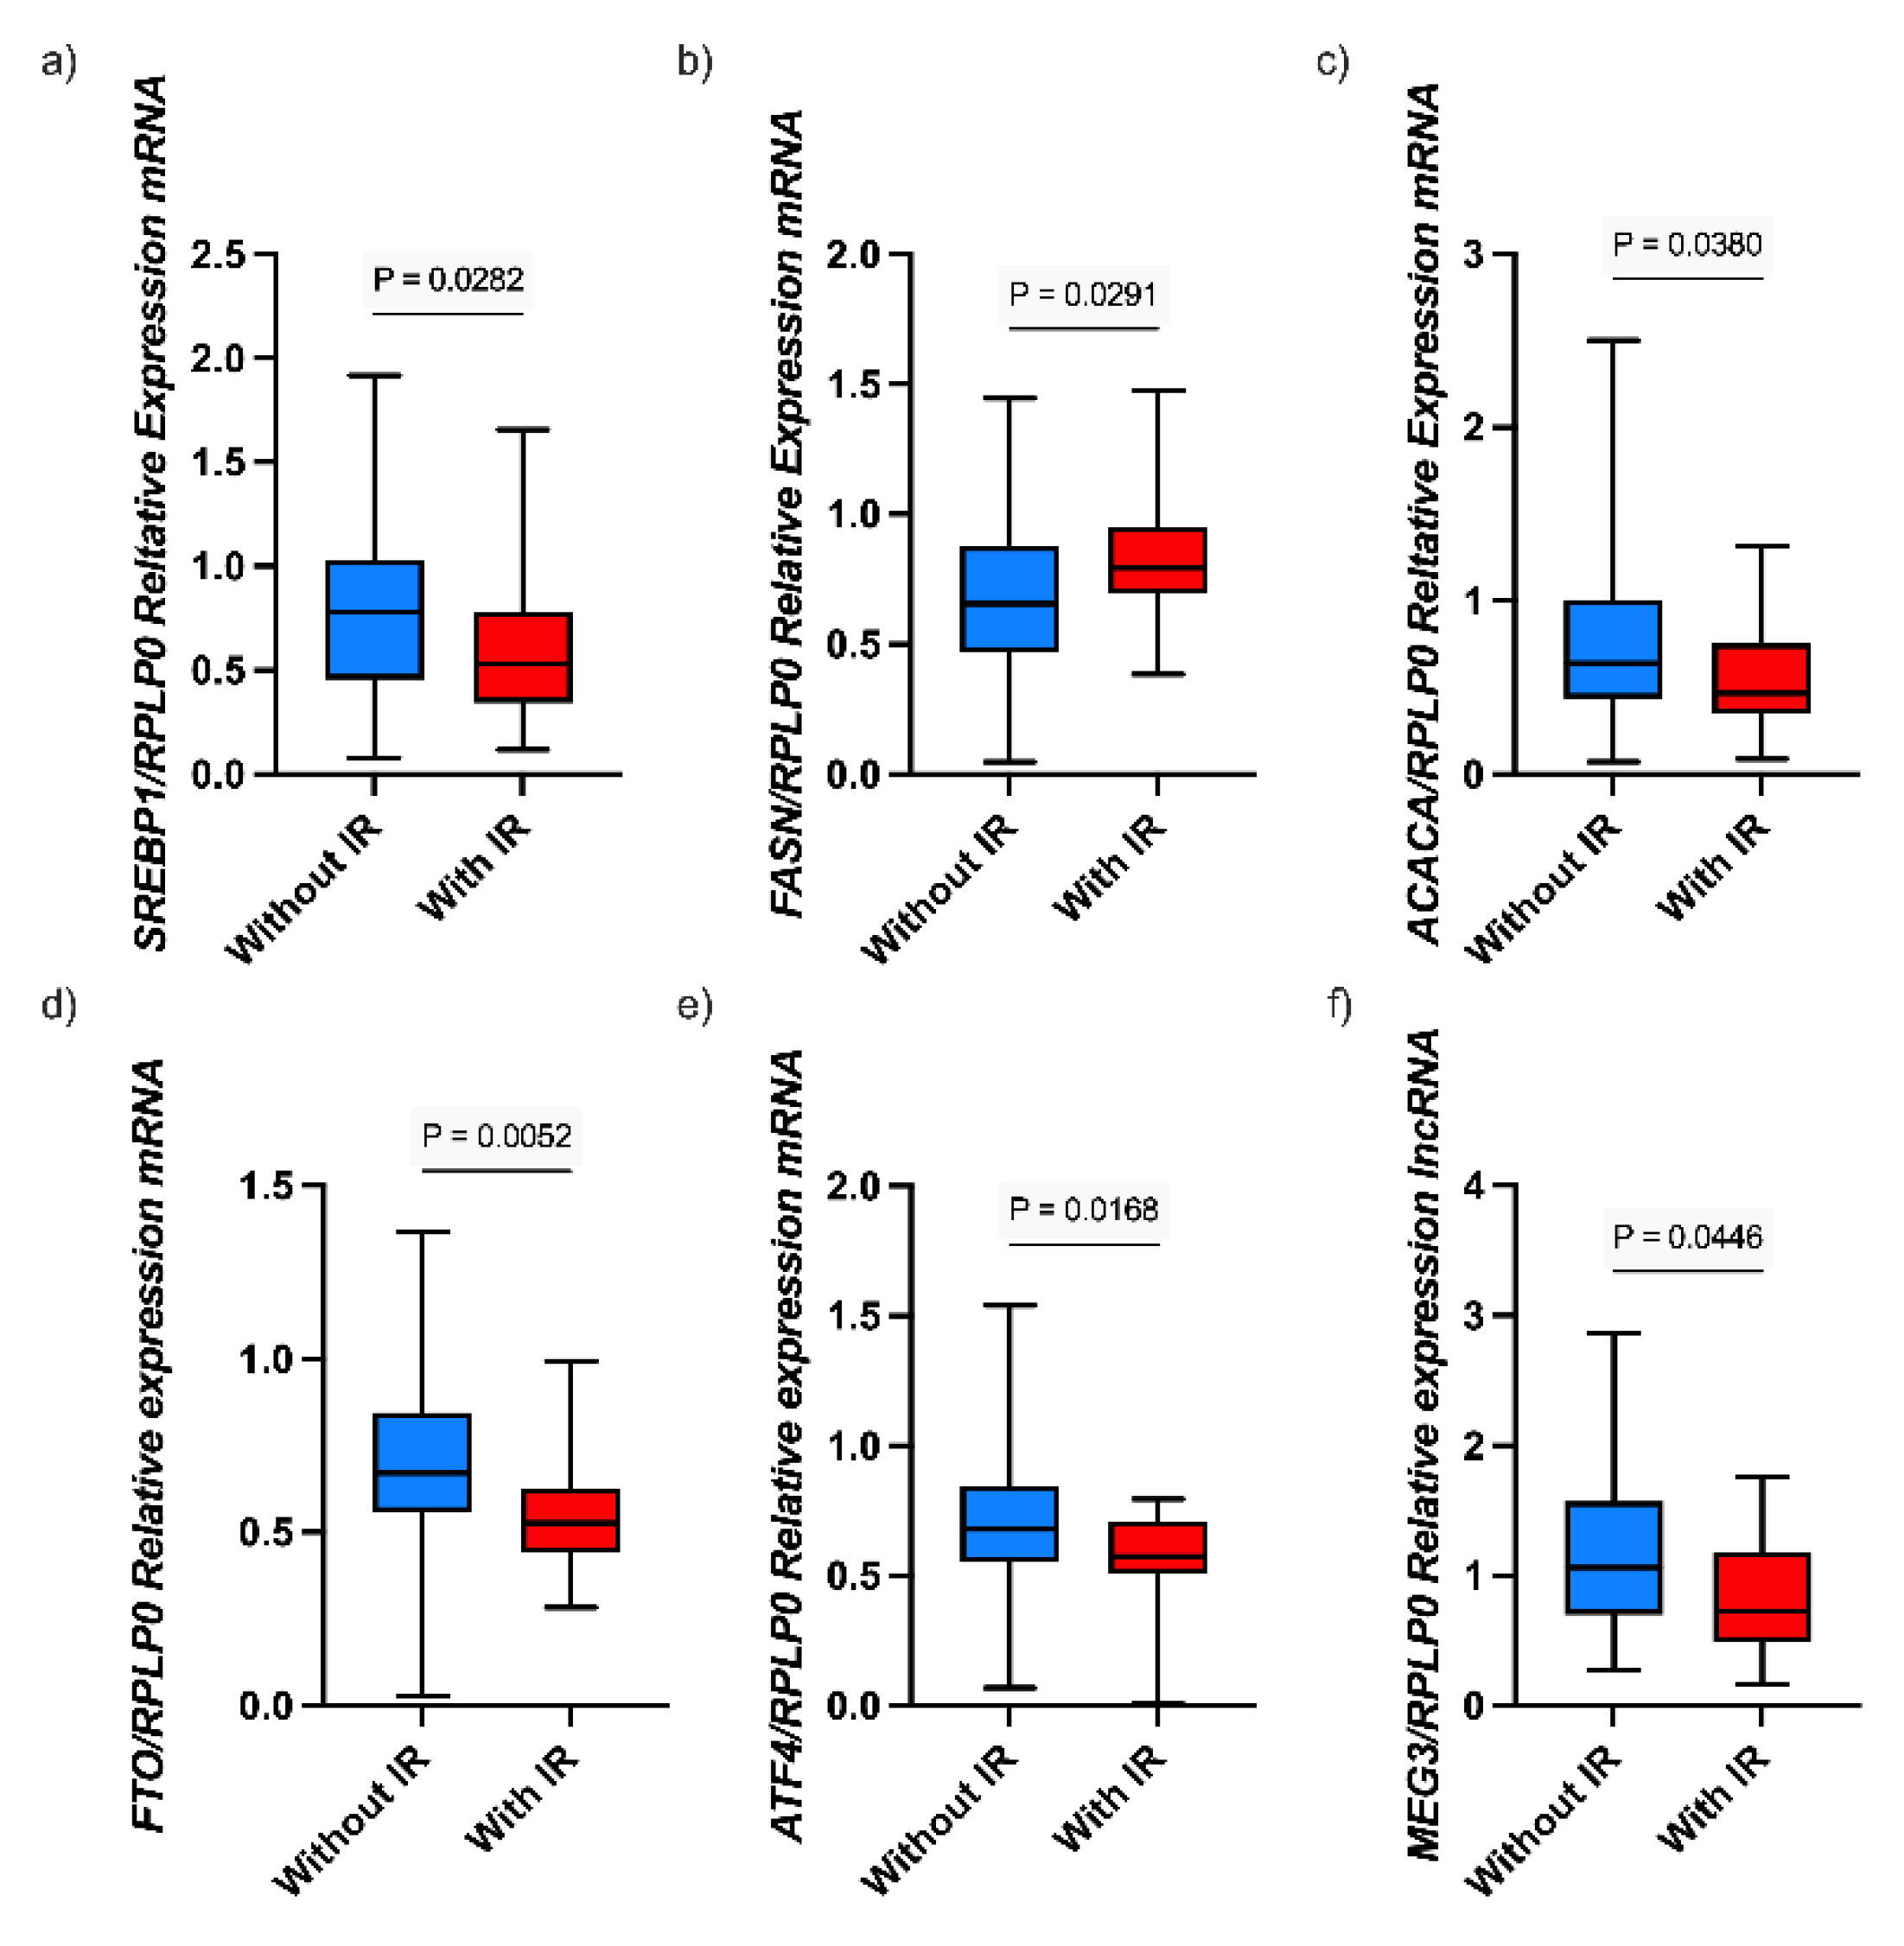

Table 1.
Demographic, clinical and metabolic parameters.
| Variable | Total (n= 71) | Without obesity (n= 27) |
With obesity (n= 44) |
P value |
|---|---|---|---|---|
| Age (y) | 8.94 ± 1.680 | 9.111 ± 1.740 | 8.84 ± 1.660 | 0.514a |
| Sex, n (%) | ||||
| Male | 28 (39.44) | 9 (32.14) | 19 (67.86) | 0.410b |
| Female | 43 (60.56) | 18 (41.86) | 25 (58.14) | |
| Waist circ (cm) | 74.338 ± 13.462 | 60.833 ± 7.302 | 82.625 ± 8.831 | < 0.001a |
| Hip circ (cm) | 82.047 ± 12.037 | 70.940 ± 6.962 | 88.863 ± 9.031 | < 0.001a |
| BMI (kg/cm2) | 22.725 (16.405— 25.184) | 16.113 (15.527—16.645) | 24.292 (23.787—25.410) | < 0.001c |
| BMI percentile | 76.352 ± 30.283 | 41.555 ± 20.905 | 97.704 ± 1.373 | < 0.001a |
| Glucose (mg/dL) | 87.288 ± 7.991 | 88.185 ± 6.314 | 86.738 ± 8.890 | 0.463a |
| Insulin (µIU/ml) | 14.430 (8.400—21.400) | 8.400 (7.200—9.550) | 17.880 (15.000—22.100) | < 0.001c |
| HOMA-IR | 3.066 (1.767—4.796) | 1.794 (1.596— 2.092) | 3.726 (3.123—4.801) | < 0.001c |
| ≥3, n (%) | 36 (50.70) | 6 (22.22) | 30 (68.18) | < 0.001b |
| Total CHO (mg/dL) | 164.253 ± 27.204 | 164.185 ± 31.027 | 164.295± 24.953 | 0.986a |
| HDL-C (mg/dL) | 47.983 ± 10.577 | 52.981 ± 8.716 | 44.915 ± 10.529 | < 0.001a |
| LDL-C (mg/dL) | 85.982 ± 25.146 | 86.937 ± 28.916 | 85.396 ± 22.866 | 0.804a |
| TG (mg/dL) | 129.7 (89.100—219.300) | 100.600 (85.345—137.136) | 157.050 (123.967—200.893) | 0.009c |
| Added sugar (g) | 73.724 ± 36.195 | 71.751 ± 44.585 | 74.934 ± 30.710 | 0.766a |
| ≥ 50 g, n (%) | 58 (81.69) | 20 (74.07) | 38 (86.36) | 0.194b |
| Total energy intake (Kcal) | 2383.5 (1983—2787) | 2340 (1908—2698) | 2490 (2085—2870) | 0.294c |
| BMI: Body mass index; HOMA-IR: Homeostatic model assessment of insulin resistance; CHO: Cholesterol; HDL-C: High-density lipoprotein cholesterol; LDL-C: Low-density lipoprotein cholesterol; TG: Triglycerides. Data are presented as the mean ± standard deviation (SD) or the median (interquartile range) for parametric and nonparametric data, respectively. aStudent’s t test; bChi-square test; cMann-Whitney test. | ||||
Table 2.
Spearman’s correlation coefficients between MEG3 and lipid metabolism genes.
| Gene | Rho | P Value |
|---|---|---|
| SREBP1 | 0.408 | 0.001 |
| FASN | 0.238 | 0.025 |
| ACACA | 0.130 | 0.307 |
| FTO | 0.389 | 0.001 |
| ATF4 | 0.422 | < 0.001 |
| SREBP1: Sterol Regulatory Element-Binding Protein 1; FASN: Fatty Acid Synthase; ACACA: Acetyl-CoA Carboxylase Alpha; FTO: Fat Mass and Obesity-Associated Gene; ATF4: Activating Transcription Factor 4. Rho values correspond to the Spearman correlation coefficients. P values < 0.05 were considered statistically significant. | ||
Table 3.
Spearman’s correlation coefficients between lncRNA MEG3, lipid metabolism genes and clinical and biochemical parameters.
Table 3.
Spearman’s correlation coefficients between lncRNA MEG3, lipid metabolism genes and clinical and biochemical parameters.
| Variable | SREBP1c | FASN | ACACA | FTO | ATF4 | MEG3 | |||||||
|---|---|---|---|---|---|---|---|---|---|---|---|---|---|
| Rho | P-value | Rho | P-value | Rho | P-value | Rho | P-value | Rho | P-value | Rho | P-value | ||
| BMI percentile | -0.194 | 0.107 | -0.084 | 0.469 | -0.347 | 0.003 | -0.452 | < 0.001 | -0.383 | < 0.001 | 0.069 | 0.585 | |
| Waist circ (cm) | -0.223 | 0.062 | -0.023 | 0.852 | -0.408 | < 0.001 | -0.497 | < 0.001 | -0.340 | 0.003 | 0.029 | 0.816 | |
| Hip circ (cm) | -0.185 | 0.124 | -0.002 | 0.981 | -0.307 | 0.009 | -0.466 | < 0.001 | -0.293 | 0.012 | 0.020 | 0.874 | |
| Glucose (mg/dL) | -0.260 | 0.029 | 0.304 | 0.012 | -0.187 | 0.117 | -0.074 | 0.536 | 0.137 | 0.253 | -0.006 | 0.956 | |
| Insulin (µIU/ml) | -0.354 | 0.003 | 0.223 | 0.073 | -0.425 | < 0.001 | -0.426 | < 0.001 | -0.267 | 0.026 | -0.168 | 0.193 | |
| HOMA-IR | -0.373 | 0.001 | 0.254 | 0.040 | -0.438 | < 0.001 | -0.419 | < 0.001 | -0.241 | 0.046 | -0.193 | 0.135 | |
| Total CHO (mg/dL) | -0.071 | 0.558 | -0.082 | 0.507 | 0.105 | 0.381 | -0.064 | 0.592 | -0.078 | 0.517 | 0.110 | 0.289 | |
| HDL-C (mg/dL) | 0.046 | 0.701 | -0.168 | 0.172 | 0.302 | 0.010 | 0.202 | 0.090 | 0.127 | 0.288 | -0.066 | 0.606 | |
| LDL-C (mg/dL) | -0.042 | 0.725 | -0.024 | 0.843 | 0.163 | 0.174 | -0.010 | 0.929 | -0.119 | 0.320 | 0.090 | 0.479 | |
| TG (mg/dL) | -0.039 | 0.743 | 0.090 | 0.465 | -0.276 | 0.019 | -0.209 | 0.079 | -0.077 | 0.518 | 0.036 | 0.774 | |
| BMI: Body Mass Index; HOMA-IR: Homeostatic Model Assessment of Insulin Resistance; CHO: Cholesterol; HDL-C: High-Density Lipoprotein Cholesterol; LDL: Low-Density Lipoprotein Cholesterol; TG: Triglycerides; SREBP1: Sterol Regulatory Element-Binding Protein 1; FASN: Fatty Acid Synthase; ACACA: Acetyl-CoA Carboxylase Alpha; FTO: Fat Mass and Obesity-Associated Gene; ATF4: Activating Transcription Factor 4; MEG3: Maternally Expressed Gene 3. Rho values correspond to the Spearman correlation coefficients. P values < 0.05 were considered statistically significant. | |||||||||||||
Table 4.
Spearman’s correlation coefficients between added sugar intake and lipid metabolism genes.
| Gene | Rho | P-value |
|---|---|---|
| SREBP1 | -0.317 | 0.026 |
| FASN | -0.003 | 0.979 |
| ACACA | -0.314 | 0.026 |
| FTO | -0.355 | 0.011 |
| ATF4 | -0.113 | 0.451 |
| MEG3 | -0.084 | 0.599 |
| SREBP1: Sterol Regulatory Element-Binding Protein 1; FASN: Fatty Acid Synthase; ACACA: Acetyl-CoA Carboxylase Alpha; FTO: Fat Mass and Obesity-Associated Gene; ATF4: Activating Transcription Factor 4; MEG3: Maternally Expressed Gene 3. Rho values correspond to the Spearman correlation coefficients. P values < 0.05 were considered statistically significant. | ||
Disclaimer/Publisher’s Note: The statements, opinions and data contained in all publications are solely those of the individual author(s) and contributor(s) and not of MDPI and/or the editor(s). MDPI and/or the editor(s) disclaim responsibility for any injury to people or property resulting from any ideas, methods, instructions or products referred to in the content. |
© 2025 by the authors. Licensee MDPI, Basel, Switzerland. This article is an open access article distributed under the terms and conditions of the Creative Commons Attribution (CC BY) license (http://creativecommons.org/licenses/by/4.0/).
Copyright: This open access article is published under a Creative Commons CC BY 4.0 license, which permit the free download, distribution, and reuse, provided that the author and preprint are cited in any reuse.


