
Submitted:
13 January 2026
Posted:
14 January 2026
You are already at the latest version
Abstract
This paper presents the implementation of an early stage fault detection and health monitoring system for electric motors and their drive units. The study focuses on developing a cost-effective system capable of identifying abnormal behavior in both drive electronics and mechanical components before a major failure occurs. The proposed design integrates multiple sensing parameters such as vibration, acoustic signals, and electrical quantities including voltage and current. These inputs are processed using data-driven techniques to assess motor condition and identify fault patterns. A microcontroller-based platform is used for real-time monitoring and signal processing, providing early warnings through an intuitive serial interface. Experimental observations confirm that this approach can effectively detect drive faults, motor imbalance, and bearing wear at an early stage, reducing downtime and maintenance costs. This work demonstrates a practical and scalable method to enhance the reliability and operational safety of motor-driven systems, contributing to improved industrial efficiency and predictive maintenance strategies.
Keywords:
drive
; motor
; early fault diagnosis
; embedded
; real time
; vibration
; acoustic
1. Introduction
Electric motors and their drive systems underpin a wide range of industrial, commercial, and mobility applications. Ensuring their reliable operation is critical because unexpected faults can lead to costly downtime, increased maintenance budgets, and even safety hazards. Review work reveals that early fault detection and health monitoring are vital for maintaining motor-driven systems, especially under continuous or high-load operation [1]. Motor faults can be broadly categorized into electrical (e.g., stator winding short-circuits, broken rotor bars), mechanical (e.g., bearing wear, imbalance, eccentricity), and drive-side or converter faults (e.g., inverter switching failures, DC-link capacitor degradation) [2].
Traditional condition-monitoring techniques, such as Motor Current Signature Analysis (MCSA), vibration analysis, and thermal imaging, provide useful diagnostics, yet each method has limitations when used alone [3].
The core concepts to be performed include: (1) the modelling of normal and faulty behaviour in motor-drive systems; (2) the acquisition of multi-sensor data (current, voltage, vibration, acoustic signatures); (3) signal processing (filtering, RMS/FFT, feature extraction) to detect anomalies; and (4) integration into a monitoring system that alerts users to health deviations and recommends inspection or maintenance. Literature review indicates that combining electrical signature analysis with vibration or acoustic monitoring significantly improves fault localization and early detection [3,4].
Data collection in this research will proceed in two parallel paths: simulation data and experimental/field-data. For simulation, a motor-drive model will be built in MATLAB/Simulink to simulate typical faults such as open phase, short circuit, bearing wear, imbalance, and inverter fault. Real-world sensor data will be captured using accelerometers for vibration, microphones or sound sensors for acoustic patterns, current/voltage sensors for electrical signatures, and temperature sensors in case of additional clarity needed. This hybrid approach is supported by surveys showing that many condition monitoring systems rely on both model-based and sensor-based data to train or validate fault detection logic.
Validation of the system will involve comparing the monitored health-index outputs and alert states with known fault incidents and healthy baseline data. Reviews of induction motor fault detection methods emphasize that early-stage detection is the most challenging and yet most valuable from an industrial perspective.
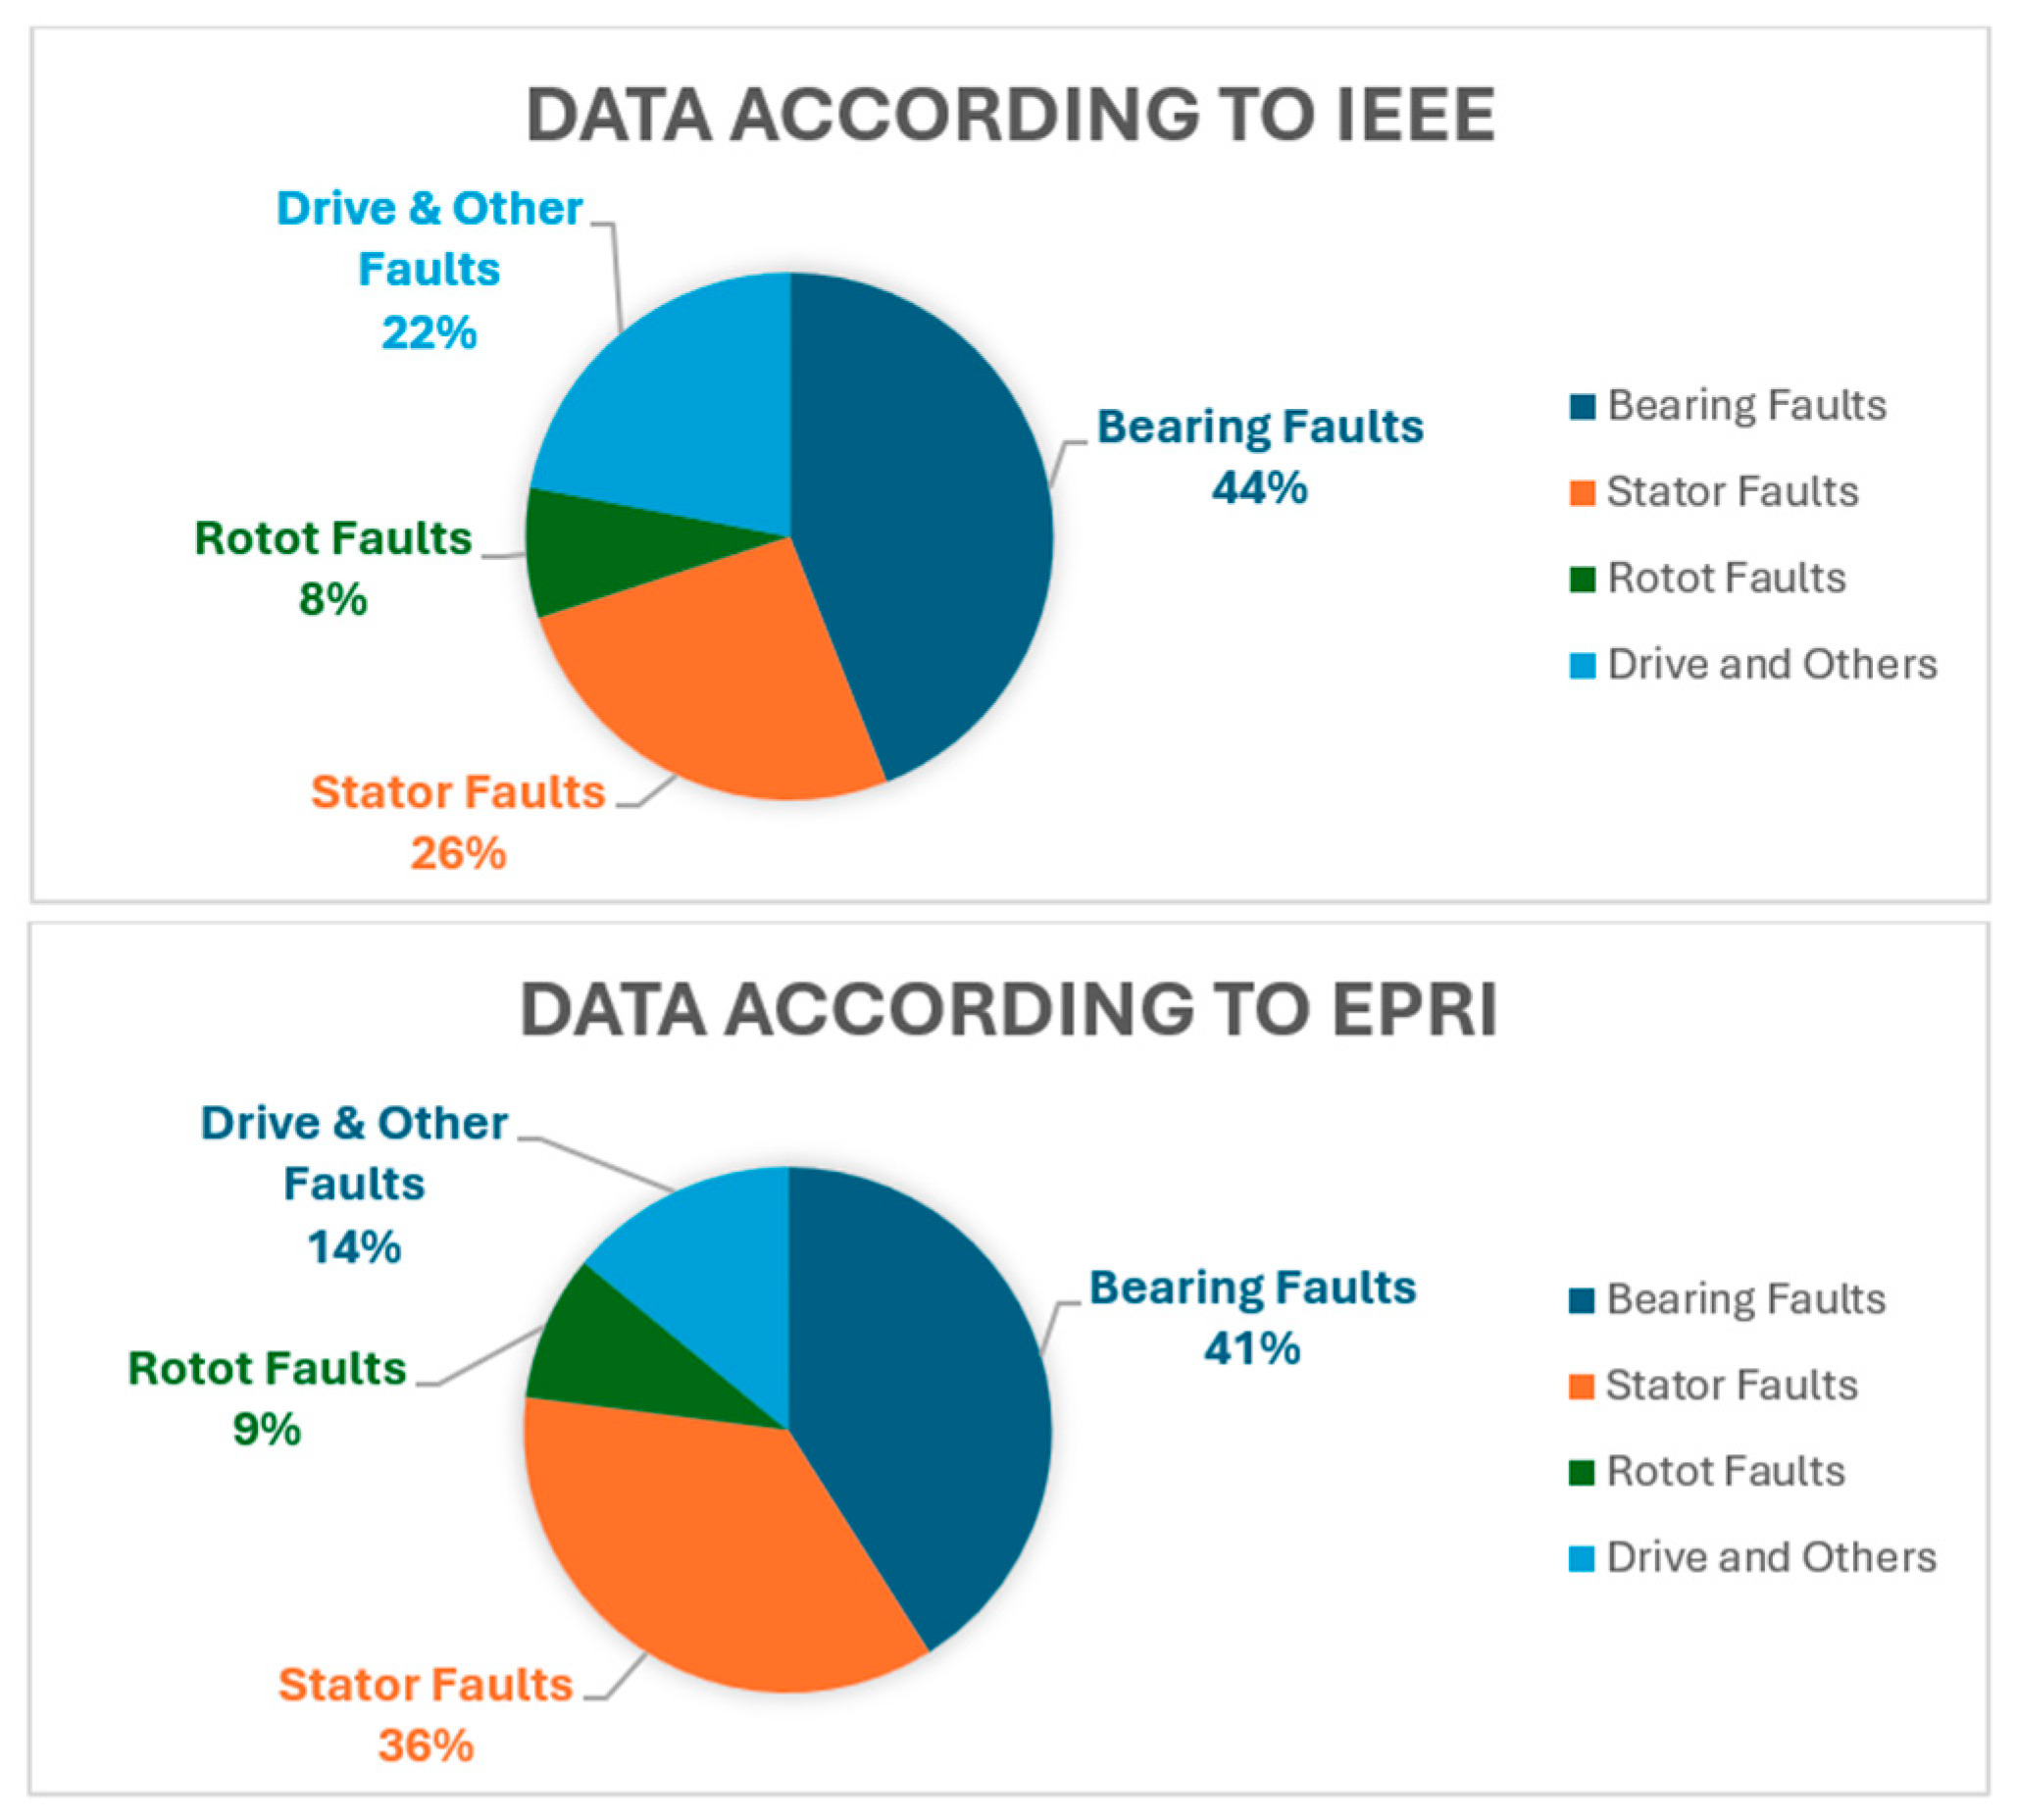
Figure 1.
Percentage distribution of fault types in AC motors based on IEEE and EPRI data.
2. Motivation
In today’s industrial environment, electric motors and drives serve as the backbone of almost every manufacturing and automation system. A single motor fault can lead to unexpected shutdowns, production losses, and expensive repair costs. Despite the availability of several monitoring methods, many industries still rely on scheduled maintenance rather than continuous condition monitoring, which often results in delayed fault detection. This gap between fault occurrence and detection time becomes critical, especially in systems that operate continuously or under variable loads. Recognizing this issue encouraged the development of an early-stage fault detection and health monitoring system that could identify abnormalities before they escalate into major failures.
Traditional maintenance systems often focus only on electrical parameters like voltage and current, which do not always provide a full picture of the machine’s health. Mechanical faults such as bearing wear, rotor imbalance, and shaft misalignment frequently go unnoticed until they become severe. The idea behind this research is to integrate multiple sensing methods—electrical, vibration, and acoustic—to create a more reliable monitoring system that can detect the earliest signs of degradation. By combining these signals and analyzing them through modern filtering and pattern-recognition techniques, it becomes possible to identify small deviations that indicate a developing fault.
Another major motivation for this work comes from the increasing demand for automation and reliability in modern industries. With the growth of electric vehicles, robotics, and smart manufacturing, the need for intelligent systems that can self-monitor and self-diagnose has become more important than ever. A robust fault detection framework not only ensures safety but also helps in energy conservation and extending the lifespan of electrical drives and motors. Through this study, the focus is on developing a cost-effective and easily implementable solution that bridges the gap between theoretical condition monitoring and its real-world industrial application.
3. Literature Review
Several researchers have investigated fault detection and condition monitoring of electrical machines, but most have focused on a single domain — either motor faults or drive converter issues. Traditional approaches such as Motor Current Signature Analysis (MCSA) and vibration analysis have been widely used to identify mechanical or electrical faults in induction motors. While these techniques are effective in detecting major anomalies, they often fail to recognize early-stage degradations or to distinguish whether a fault originates in the motor or the drive section.
Studies such as Kumar et al. [5] and Paul and Joshi [1] emphasized electrical signal-based monitoring for stator and rotor faults, whereas Bahgat et al. [2] explored mechanical vibration signatures for bearing diagnosis. Similarly, Gallo and Bagnasco [6] reviewed converter-level failures in drives, highlighting inverter switch malfunctions and DC-link capacitor degradation. However, these works addressed isolated components of the drive system, leaving a gap in unified health assessment.
In contrast, this research aims to combine both electrical and mechanical perspectives through a multi-sensor system that simultaneously monitors drive converter health and motor condition. By integrating current, voltage, vibration, and acoustic data, the proposed system provides a comprehensive evaluation of machine health and detects incipient faults earlier than conventional single-parameter methods. This dual-layer approach addresses a critical need for holistic monitoring in modern, high-reliability industrial and automotive applications.
4. Methodology
4.1. Overview
The proposed system aims to detect early-stage faults and evaluate the health condition of both the motor and the drive unit by combining multi-sensor signals and electrical measurements. The methodology integrates electrical parameters (voltage and current), vibration signatures, and acoustic patterns to form a unified monitoring framework. Compared to single-parameter methods, multi-domain analysis improves diagnostic accuracy and early fault prediction 1. The overall workflow includes data acquisition, preprocessing, feature extraction, fault detection logic, and real-time condition output.
Figure 2.
System Architecture for Motor and Drive Fault Detection.
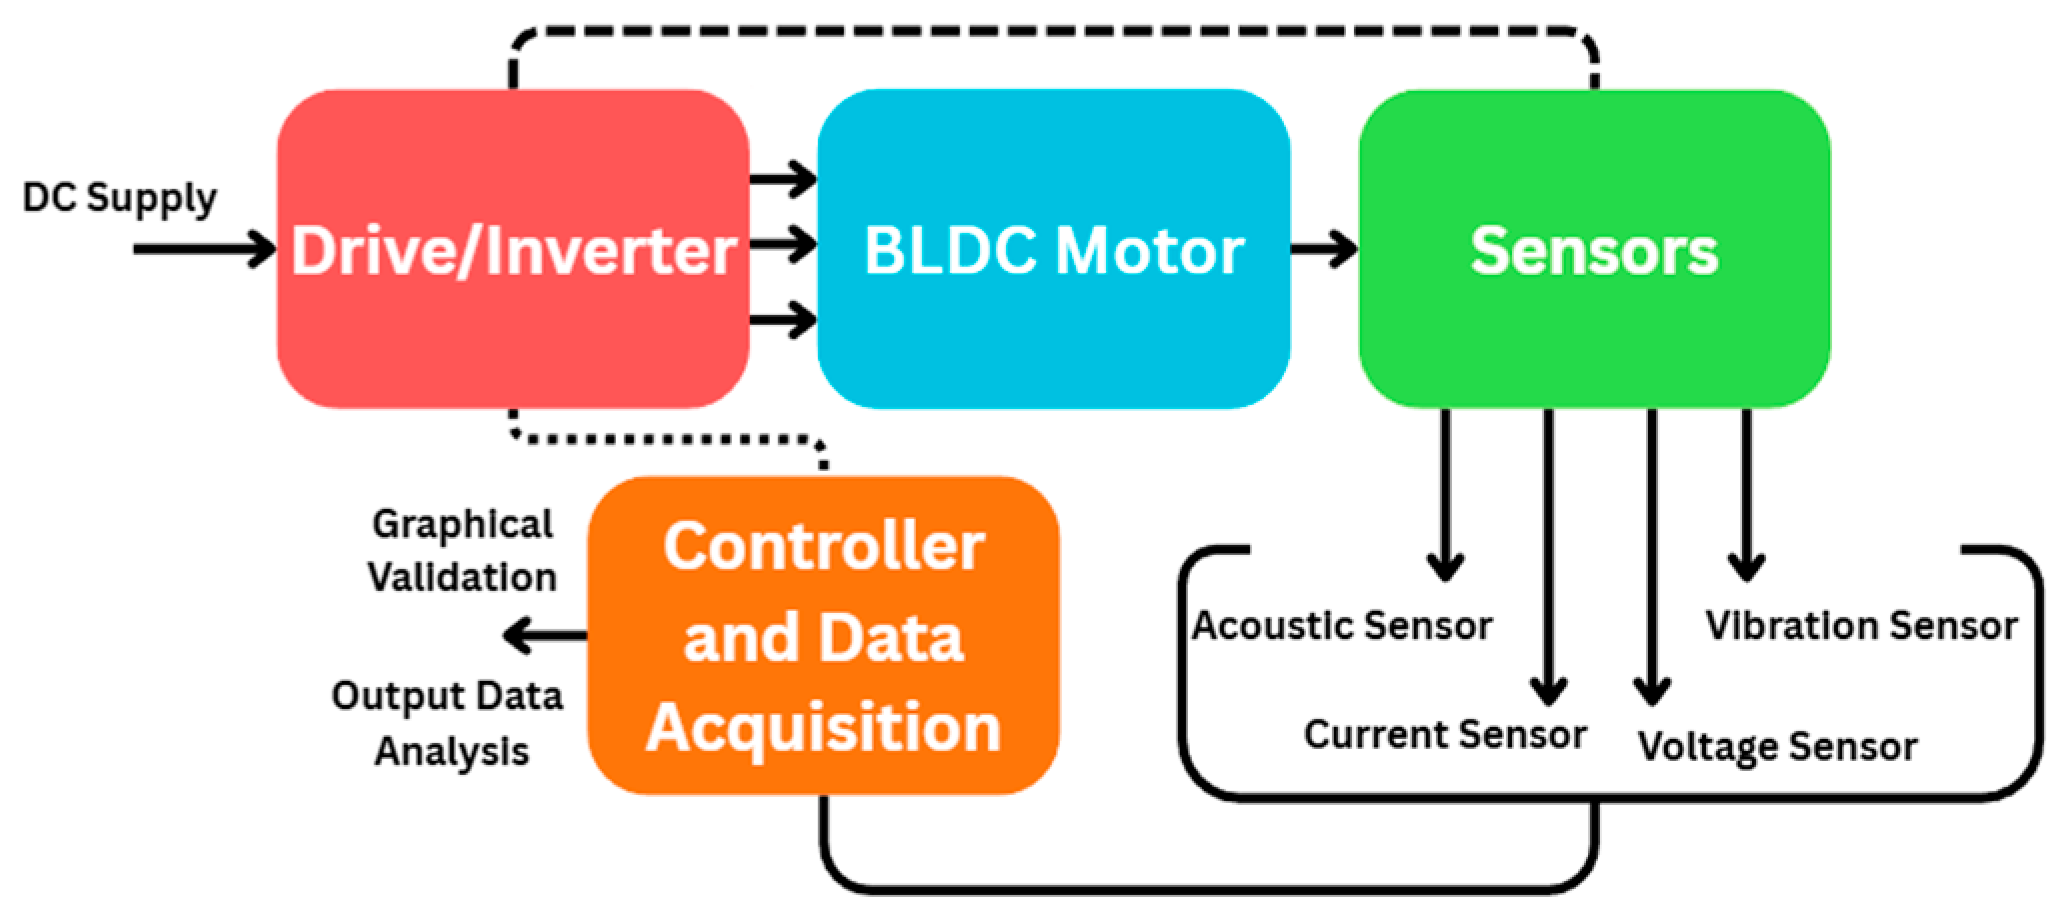
4.2. Data Acquisition
The experimental setup consists of a Brushless DC (BLDC) motor coupled with an electronic drive (ESC), supplied through a regulated DC supply. The system is operated at different speeds and load variations to observe behavior under healthy and fault-induced conditions.
Multi-domain sensor data is collected to study electrical, mechanical, and thermal characteristics:
- Current measurements using a current sensor (ACS712),
- Voltage measurements using a voltage divider system,
- Vibration signals using an accelerometer mounted on the motor casing,
- Acoustic signals via a microphone module (MAX9814),
- Temperature using LM35 sensor.
All sensor outputs are interfaced with a microcontroller for real-time sampling and logging. It transfers data over PC via serial/Wi-Fi for analysis. The multi-sensor acquisition approach helps distinguish between electrical issues from the drive and mechanical problems in the motor.,
4.3. Signal Processing and Feature Extraction
The acquired electrical and mechanical signals are first pre-processed using filtering techniques such as a moving-average filter and low-pass filtering to remove sensor noise and high-frequency disturbances. Electrical parameters such as RMS current, voltage ripple, and current waveform distortion are calculated from the measured data.
The RMS current is computed over a sampling window as:
Similarly, the voltage RMS and current ripple are obtained for evaluating variations in the ESC drive stage. Current ripple is derived as:
Mechanical vibration characteristics are extracted using the Fast Fourier Transform (FFT) to analyze frequency-domain signatures associated with imbalance, bearing degradation, and structural looseness. The FFT is calculated as:
From the vibration spectrum, feature parameters such as peak amplitude, dominant frequency, and crest factor are computed. Crest factor is defined as:
Temperature data is monitored to observe progressive thermal rise during abnormal operating conditions, which supports early diagnosis of friction or over-current effects.
4.4. Fault Detection and Health Evaluation Logic
The processed sensor features obtained from electrical, vibration, acoustic, and temperature measurements are evaluated against a reference baseline created under healthy operating conditions. The goal of this stage is to identify abnormal deviations in the BLDC motor or drive unit and determine the overall health condition of the system.
I. Baseline Comparison
A baseline dataset is recorded for the BLDC motor operating at normal speed, stable load, and healthy mechanical alignment. For each feature—such as , current ripple, vibration peak amplitude, crest factor, and temperature rise—the baseline stored.
During operation, the measured feature is compared to the baseline threshold. A deviation is computed as:
II. Threshold-Based Identification
Each feature has a threshold determined from the healthy variability and expected noise. A fault indication is triggered when:
This simple thresholding scheme is effective for early detection because it reacts instantly to changes in current distortion, sudden vibration spikes, or abnormal temperature rise. Combining electrical and mechanical parameters helps differentiate between drive-side disturbances and motor-side mechanical issues.
III. Health Index (HI) Estimation
To provide an intuitive interpretation of system condition, a Health Index (HI) is calculated. HI ranges from 0% (severely degraded) to 100% (fully healthy). It is computed as:
Values above 85% indicate normal operation, while lower values signal early degradation.
4.5. Hardware Configuration
The experimental setup consists of a motor–drive system integrated with multiple sensors for real-time condition monitoring. A BLDC motor coupled with its electronic drive is used as the primary test platform. Electrical parameters such as current and DC-link voltage are measured using current and voltage sensors, while mechanical and acoustic conditions are captured using vibration and sound sensors. These sensors are selected to ensure non-intrusive monitoring while preserving normal system operation.
All sensor outputs are interfaced to a microcontroller-based data acquisition unit, which performs synchronized sampling of electrical and mechanical signals. The microcontroller serves as the central processing unit for data collection, preliminary filtering, and communication with the host system for further analysis. This configuration allows real-time monitoring without modifying the internal structure of the motor-drive system, which is essential for practical industrial deployment.
5. Implementations and Results
This sections gives the final implementation and the observed result which is intended to achieve through this research paper. Providing actual implementation with trial and error approach and observing final data under different circumstances and variables to understand how it plays a crucial role in understanding the different aspects of a motor and drive system to avoid long term consequences.
During normal running condition, sensor parameters remain within predictable ranges with smooth transitions and minimal scatter. Current draw stays steady, drive voltage maintains stability, vibration levels show low amplitude fluctuations, acoustic readings remain uniform, and temperature rise follows a gradual slope. These characteristics form the baseline signature of a healthy motor–drive system.
When the system enters the fault-emulated condition, noticeable parameter drifts are observed. The current trend shows a consistent increase, indicating higher load or internal stress. Voltage patterns reflect a slight instability or drop, suggesting possible drive-side irregularities. Vibration signals become dispersed with higher peaks, resembling mechanical imbalance or rotor deviations. Sound readings display increased variance and amplitude, matching typical early acoustic symptoms of motor and electronic drive strain. Thermal behavior also shifts to a faster rising curve, indicating abnormal heat buildup.
Figure 3.
Real-time simulated monitoring trends of BLDC motor and drive unit. The legend labels correspond to: value 1 = current (a), value 2 = voltage (v), value 3 = vibration (units), value 4 = sound (dB), value 5 = temperature (c).
Figure 3.
Real-time simulated monitoring trends of BLDC motor and drive unit. The legend labels correspond to: value 1 = current (a), value 2 = voltage (v), value 3 = vibration (units), value 4 = sound (dB), value 5 = temperature (c).
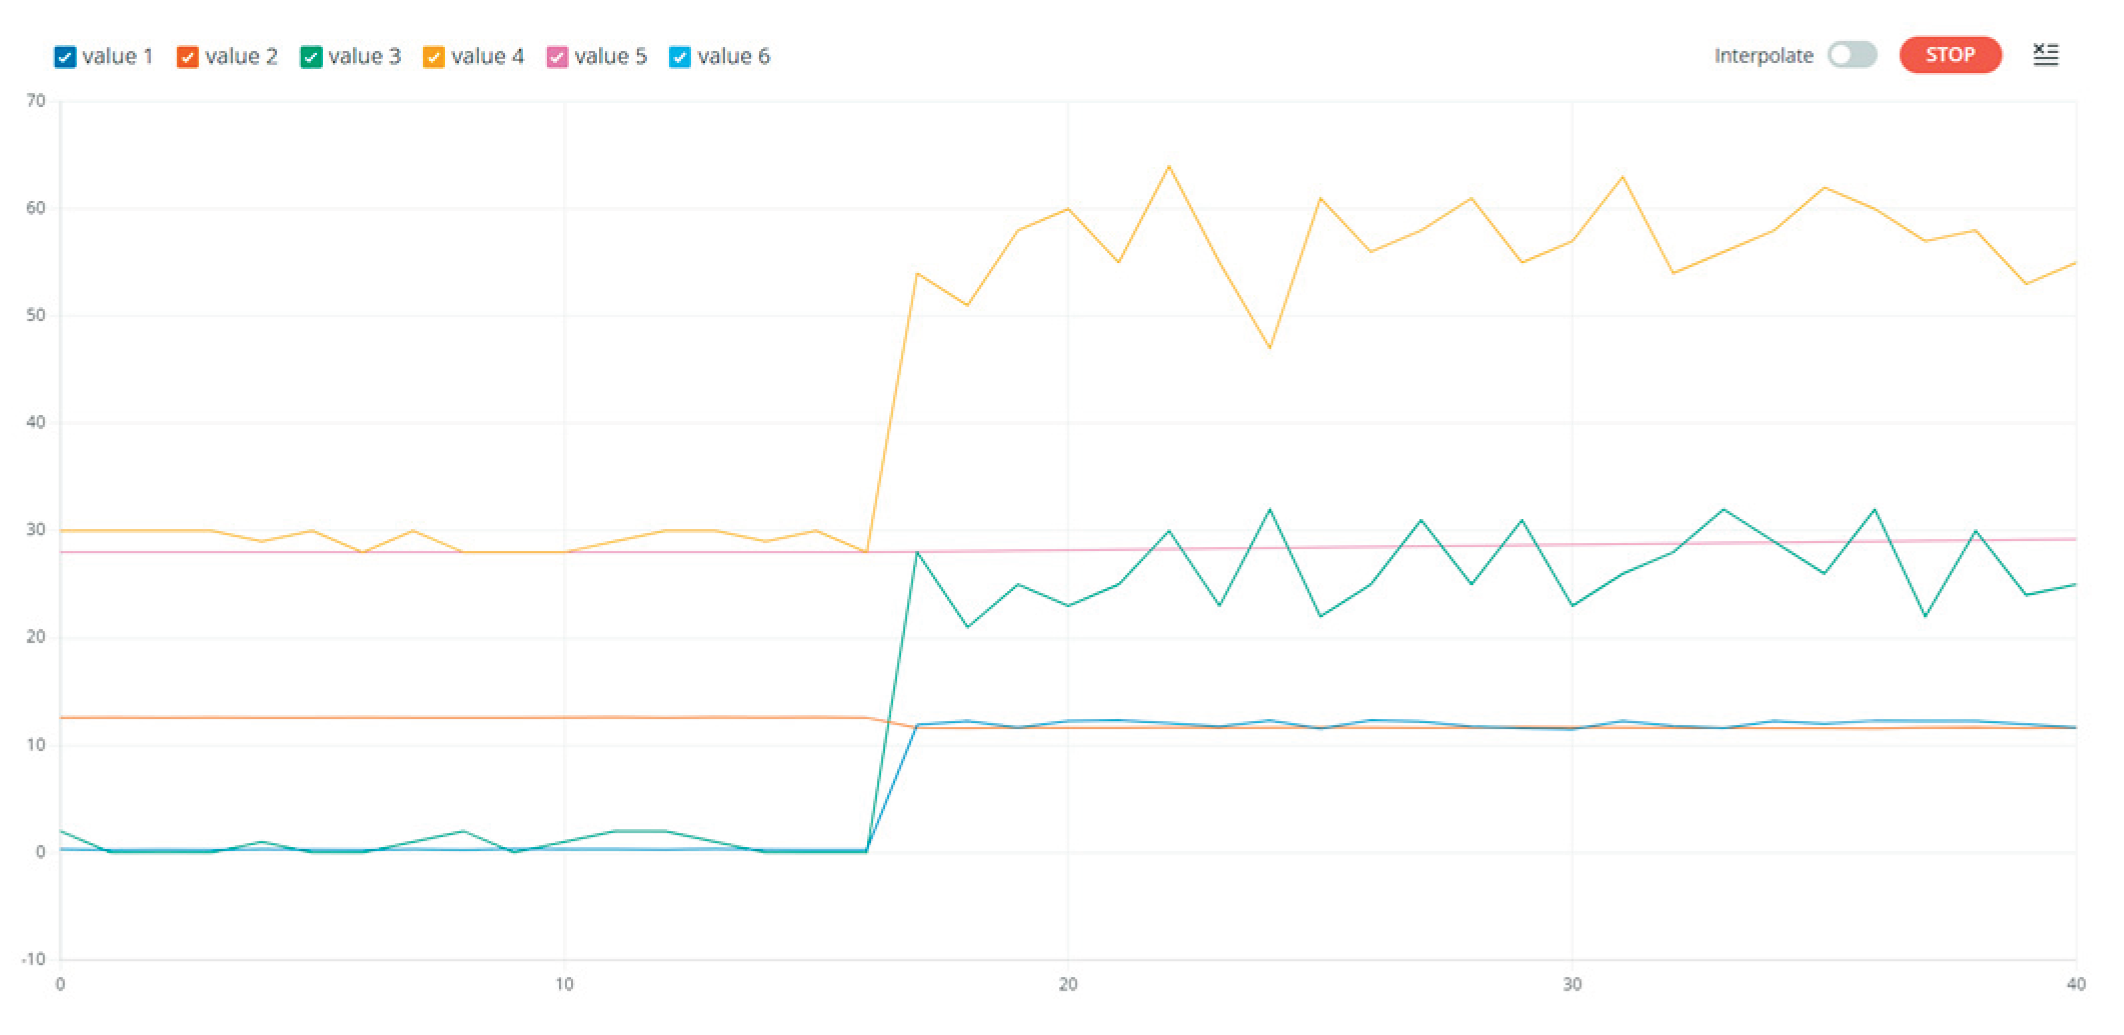
The interface shows real-like emulated sensor signals streamed through a serial port at 9600 baud. Five parameter curves are plotted on a grid to study how a motor drive system behaves across operating phases. The plot uses generic labels (value 1–5).
The monitored voltage stays steady when the motor is off and shows a slight drop as the electrical load begins to increase through the drive unit, which matches the expected battery internal resistance behavior under motor startup stress.
The current signal remains low during idle operation and shifts to a higher but stable range once the motor reaches its rated speed, reflecting the normal electrical stress caused by motor and ESC power demand.
The vibration curve shows an initial spike during the acceleration phase due to torque and inertia impact, then settles into almost constant low oscillations as the motor speed becomes uniform.
The sound pattern displays moderate scatter when the motor operates at variable speed, later becoming uniform during steady operation, whereas in the early fault stage the acoustic signature remains louder with increased variance, indicating abnormal drive or mechanical strain.
Similarly, the temperature profile follows a gradual rising slope after motor startup and reaches a thermal equilibrium state, staying nearly constant instead of increasing endlessly, which resembles real motor thermal saturation where generated heat and dissipation rate balance each other.

Table 1.
Simulated motor and drive parameter behavior under different operating states.
| Motor State | Current (a) | Voltage (v) | Vibration | Sound (dB) | Temp (c) |
| Idle | 0.2-0.5 | 12.4-12.7 | 0-3 | 26-32 | 27-30 |
| Accel | 10.5-13.5 | 11.5-12.2 | 20-35 | 50-62 | 30-38 |
| Run | 9.0-12.0 | 11.5-11.9 | 8-14 | 38-45 | 40-45 |
| Fault | 14.0-18.0 | 10.5-11.2 | 30-55 | 65-85 | 50-70 |
At this stage, the simulated results are not used to claim exact motor fault values, but to understand how a real monitoring system should behave when stress begins in the motor and its drive electronics. The interaction between electrical, mechanical, acoustic, and thermal parameters forms a clear baseline for distinguishing early fault symptoms from normal operation.
Simultaneous voltage dip and current rise confirm the load effect on the power source and drive unit, while vibration and sound stabilization indicate motor settling behavior once rated speed is achieved. The early fault curves appear as amplified yet gradual shifts of normal trends, reflecting realistic motor-drive degradation rather than sudden breakdown.
The presence of minor noise across all signals adds practical sensor uncertainty, improving the realism of the analysis. Multi-parameter observation also supports the core narrative monitoring multiple signals together reduces the chance of false fault assumptions that may occur if only one parameter is considered. These insights help the research move forward into structured documentation and prototype validation in future phases.
6. Conclusion
This stage of the research focused on understanding the signal evolution of a BLDC motor–drive system using simulated data that resembles practical operating characteristics. The results highlight that electrical parameters show the earliest sensitivity to load changes, while mechanical, acoustic, and thermal signals reflect system stability after rated speed is reached.
The study strengthens the concept that early fault identification is more effective when based on correlated parameter deviation patterns rather than isolated signal thresholds. The simulation insights now act as a baseline model for structuring documentation, designing monitoring limits, and preparing the system for real prototype validation in the next phase of the research.
7. Future Scope
The next direction of this research is to transition the simulation insights into a deployable monitoring system by implementing extended test environments outside the IDE plotter, such as standalone visualization platforms and automated data reporting modules.
Future work can include creating adaptive threshold generation for dynamic load conditions, testing digital twin behavior for different drive switching frequencies, and modeling fault progression for multiple failure categories like battery sag dominance, drive-side switching irregularities, and mechanical damping degradation. The research can also be extended into wireless sensor networks for continuous monitoring in agriculture and food-processing environments where motors run in non-uniform duty cycles.
References
- Paul, Bishakh; Joshi, V. A comprehensive survey on real-time induction motor failure diagnosis and analysis. ASEAN Engineering Journal. [CrossRef]
- Bahgat, Bahgat H.; Elhay, Enas A. Revolutionizing motor maintenance: a comprehensive survey of state-of-the-art fault detection in three-phase induction motors. Int. J. Power Electronics and Drive Systems 2024, v15. [Google Scholar] [CrossRef]
- Alshorman, Omar; Alshorman, Ahmad. A review of intelligent methods for condition monitoring and fault diagnosis of stator and rotor faults of induction machines. Int. J. Electrical & Computer Engineering (IJECE) 2020, v11(4). [Google Scholar]
- Garcia-Calva, T.; Morinigo-Sotelo, D.; Fernandez-Cavero, V.; Romero-Troncoso, R. Early Detection of Faults in Induction Motors — A Review. Energies 2022, vol. 15(no. 21), 7855. [Google Scholar] [CrossRef]
- Kumar, R. R.; Andriollo, M.; Cirrincione, G.; Cirrincione, M.; Tortella, A. A Comprehensive Review of Conventional and Intelligence-Based Approaches for the Fault Diagnosis and Condition Monitoring of Induction Motors. Energies 2022, 15(no. 23), 8938. [Google Scholar] [CrossRef]
- Gallo, M. A.; Bagnasco, A. Review of Fault Detection and Diagnosis Techniques for AC Motor Drives. Energies 2023, 16(no. 15). [Google Scholar] [CrossRef]
Disclaimer/Publisher’s Note: The statements, opinions and data contained in all publications are solely those of the individual author(s) and contributor(s) and not of MDPI and/or the editor(s). MDPI and/or the editor(s) disclaim responsibility for any injury to people or property resulting from any ideas, methods, instructions or products referred to in the content. |
© 2026 by the authors. Licensee MDPI, Basel, Switzerland. This article is an open access article distributed under the terms and conditions of the Creative Commons Attribution (CC BY) license (http://creativecommons.org/licenses/by/4.0/).
Copyright: This open access article is published under a Creative Commons CC BY 4.0 license, which permit the free download, distribution, and reuse, provided that the author and preprint are cited in any reuse.


