
Submitted:
11 January 2026
Posted:
13 January 2026
You are already at the latest version
Abstract
Faecal egg counts (FEC) are used to assess the intensity of gastrointestinal nematode (GIN) infections in herbivores. FEC distribution is aggregated, meaning that approximately 20% of animals harbour 80% of infections. In times of escalating anthelmintic resistance, it may be necessary to restrict treatment to the animals with the heaviest infections. This strategy is called targeted selective treatment (TST) and is relevant to GIN, for example. The difficulty lies in identifying which animals to treat. One solution is to select potentially at-risk animals based on age (for example, treating the young), or to perform individual faecal egg counts (though this is costly). We propose a solution for determining the suitability of selective treatment based on the level of FEC (200 or 500 eggs per gram of faeces). First, we demonstrate that the mean FEC in a group is strictly related to its variance (Taylor's power law) using published data and our own unpublished data on horses from France, Poland, and Mexico. The study will focus on small and large strongyles in horses. Taylor's power law states that sample variance (Var) and the population mean are related by a simple equation: Var = a Mean^b or log(Var) = log(a) + b log(Mean). We will then evaluate the influence of factors such as age, status (mare, stallion, yearling, etc.), day-to-day variability, and previous anthelmintic treatments on this relationship. Next, to reduce the number of FECs, we estimate the mean FEC on a composite faecal sample. We will then calculate the variability and therefore the number of horses with an FEC above the chosen acceptable level. When the mean is high, the number of horses to be treated is also high and TST is not beneficial. When the FEC is average, TST may be worthwhile, either based on the FEC of individual horses or on the horse class at risk. Based on the percentage of horses with an FEC above the acceptable level, the farmer can decide whether to treat all animals or establish a TST protocol.
Keywords:
cyathostomins
; nematode
; faecal egg count
; horse
; mean
; variance
1. Introduction
The aggregation of parasites among hosts is almost universal [1] This means that their distribution is overdispersed (or aggregated). For example, 20% of sheep concentrate 80% of gastrointestinal nematodes (GIN) ([2], and 20% of horses concentrate 80% of GIN ( [3,4]. Several measures of aggregation have been adopted, but they actually measure different things. The variance-to-mean ratio and the k index of aggregation are the most commonly used for a single host-parasite population [5]. Variance-to-mean is positively associated with mean, whereas k appears completely uncorrelated with mean; both are somewhat positively correlated with prevalence [5]. The k index of aggregation has been evaluated in GIN in sheep [6,7], among others. When considering several host-parasite populations, the Taylor power law (TPL) has been proposed [8]. The TPL states that the variance (Var) of a parameter and its mean in a population are related by a simple power law. This can be written as Var = a Mean^b or log(Var) = log(a) + b log(Mean), where b is an indicator of aggregation. This law was initially applied in agronomy ([9], but has since been extended to various biological and non-biological systems [10]. The power law and aggregation have been studied in gastrointestinal nematodes of sheep [6,7] and in sheep, cattle, goats and deer [11]. These studies were based on necropsies, with only one based on the faecal egg counts of two species of sheep gastrointestinal nematodes (GIN) [11]. To our knowledge, neither adult GIN load nor faecal egg counts (FEC) in horses have been studied. FEC is an important tool for managing GIN infections in horses. High infection rates are detrimental to horses [12,13] and repeated anthelmintic use has resulted in GIN resistance ([14,15]. As with the distribution of adult worms, the distribution of FEC is aggregated [16], and TPL could be employed. In times of escalating anthelmintic resistance, it may be necessary to restrict treatment to the most heavily infected animals. This strategy is called targeted selective treatment (TST) and applies to GIN. This approach has long been proposed for horses [17,18], recommended [19,20] and implemented [21,22,23,24]. The technical difficulty lies in identifying the animals to be treated. Horse breeders are reluctant to undertake individual faecal egg counts (FECs) since the cost of anthelmintics is relatively low [25]. Their intention to use FECs prior to deworming is not influenced by the perceived risk of anthelmintic resistance or gastrointestinal nematode infection; rather, it depends mostly on the opinion of their peers and social pressure [26]. These beliefs may reduce the use of FECs and hence the development of TST. One solution is to select animals at risk based on age (for example, treating the young), and another is to perform individual FECs, though this is costly. We propose a solution for determining the suitability of selective treatment based on the level of accepted FEC (200 or 500 eggs per gram of faeces) and TPL. First, we evaluate the relationship between the mean FEC and its variance using Taylor's Power Law. Published and unpublished data on horses from France, Poland and Mexico were used. The studies concerned populations with small and large strongyles. We then evaluate the influence of factors such as age, status (mare, stallion, yearling, etc.), day-to-day variability, and previous anthelmintic treatments on the TPL parameters. Additionally, to reduce the number of individual FECs, we estimate the mean FEC on a composite faecal sample. We then calculate the variability from the mean and therefore determine the number of horses with an FEC above the chosen acceptable level. When the mean FEC is high, the number of horses to be treated is also high and TST is not beneficial. When the FEC is average, TST may be worthwhile based either on individual FEC or on the horse class at risk.
2. Materials and Methods
2.1. Characteristics of Sampling Sites
The characteristics are presented in Table 1. Some data are extracted from pre-existing studies (Poland [27] or France 2 [28] and others are our new data.
| Country | Climate on yearly basis Rainfall in mm (temperature) |
Horse breed | Type of horse (number) | Number of farms / duration in years | Anthelmintic treatments |
Anthelminticefficacy(%) | Percentage of cyathostomins |
| Poland (South-East part) |
680 (8.7°C°) | Pure blood Arabian, Thoroughbred | Racing (12450 altogether) |
74(10) | Pyrantel, FenbendazoleIvermectin Moxidectin |
51* 23 67 100 |
99 |
| France-1 | 689 (11.8°C) | Welsh poney | Leisure (100x 10 sampling events) |
1 (3) | Ivermectin, Moxidectin Pyrantel |
90 100 90 |
98 |
| France-2 | 579 (14.8°C° | Diverse | Riding club (35x ‘4 sampling events) |
1 (0.5) | Ivermectin, Mebendazole |
96 76 |
nd |
| France-3 | 1237 (10.8°C) | Selle Français, Anglo-Arab | Racing (160x 6 sampling events) |
1 (2) | Ivermectin, Pyrantel Fenbendazole |
96 97 55 |
95 |
| Mexico-1 | 1240 (25.0°C) | American Quarter | Racing (42x4 sampling events) |
1 (0.25) | Ivermectin, Moxidectin, Febantel | 99 90 97 |
64 |
| Mexico-2 | 490 (24.0 °C) | American Quarter | Racing (54x4 sampling events) |
1 (0.25) | Ivermectin, Moxidectin, Febantel | 99 98 90 |
50 |
| Mexico 3 | 426 (22.5 °C) | American Quarter | Racing (71x4 sampling events) |
1 (0.25) | Ivermectin, Moxidectin, Febantel and Metrifonate | 100 100 93 |
30 |
| Mexico 4 | 747 (26.5 °C) | Raza Española | Racing (99 x4 sampling events) |
1 (0.25) | Ivermectin, Moxidectin, Febantel and Metrifonate | 100 100 100 |
65 |
*These efficacies were calculated in comparison with moxidectin. Others were calculated with untreated control according to [31].
2.2. Parasitological Methods
The FEC were performed with a McMaster technique using salt solution (specific gravity 1.20) with a sensitivity of 50 nematodes eggs per gramme of faeces. There were slight differences in procedure according to the sites (quantity of faeces-3 or 5 g; additional floatation for zero counts with McMaster method). The larval cultures were performed in all sites according to [29]. The identification was on morphological features (number of intestinal cells, length of the larvae) as presented in [30]. The composite faecal samples were obtained from mixing 10 faecal samples. The composite established on ground samples in the stable was established as follows: 20 fresh half faecal drop from different piles were mixed and processed as for the other composite to assess 10 FEC evaluations. The efficacy of used anthelmintics was evaluated by FEC at treatment and 14 days after on at least 10 horses or ponies in all sites except Poland according to [31].
2.3. Statistical Methods
We used a linear regression method to relate variance to mean or individual versus composite EPG (eggs of gastrointestinal nematodes per gramme of faeces) and considered statistical value of p<0.05 as significant. To evaluate the stability of the EPG in faeces, 47 adult Welsh ponies (France-1) were individually sampled and their EPG measured on two consecutive days. The EPGs of each day were bootstrapped for 10 animals and their means and variances calculated. Nonlinear fit was done when linearity was not found, and the choice of the fit was then achieved based on Akaike criterion.
3. Results
3.1. Relationship Between Average FEC and its Variance: Factors of Variation
3.1.1. Sampling Day in a Farm
There was a significant relationship between variance and mean on the two consecutive days of faecal sampling (Figure 1). The slope coefficients of the regression were highly similar: 1.43 and 1.45.
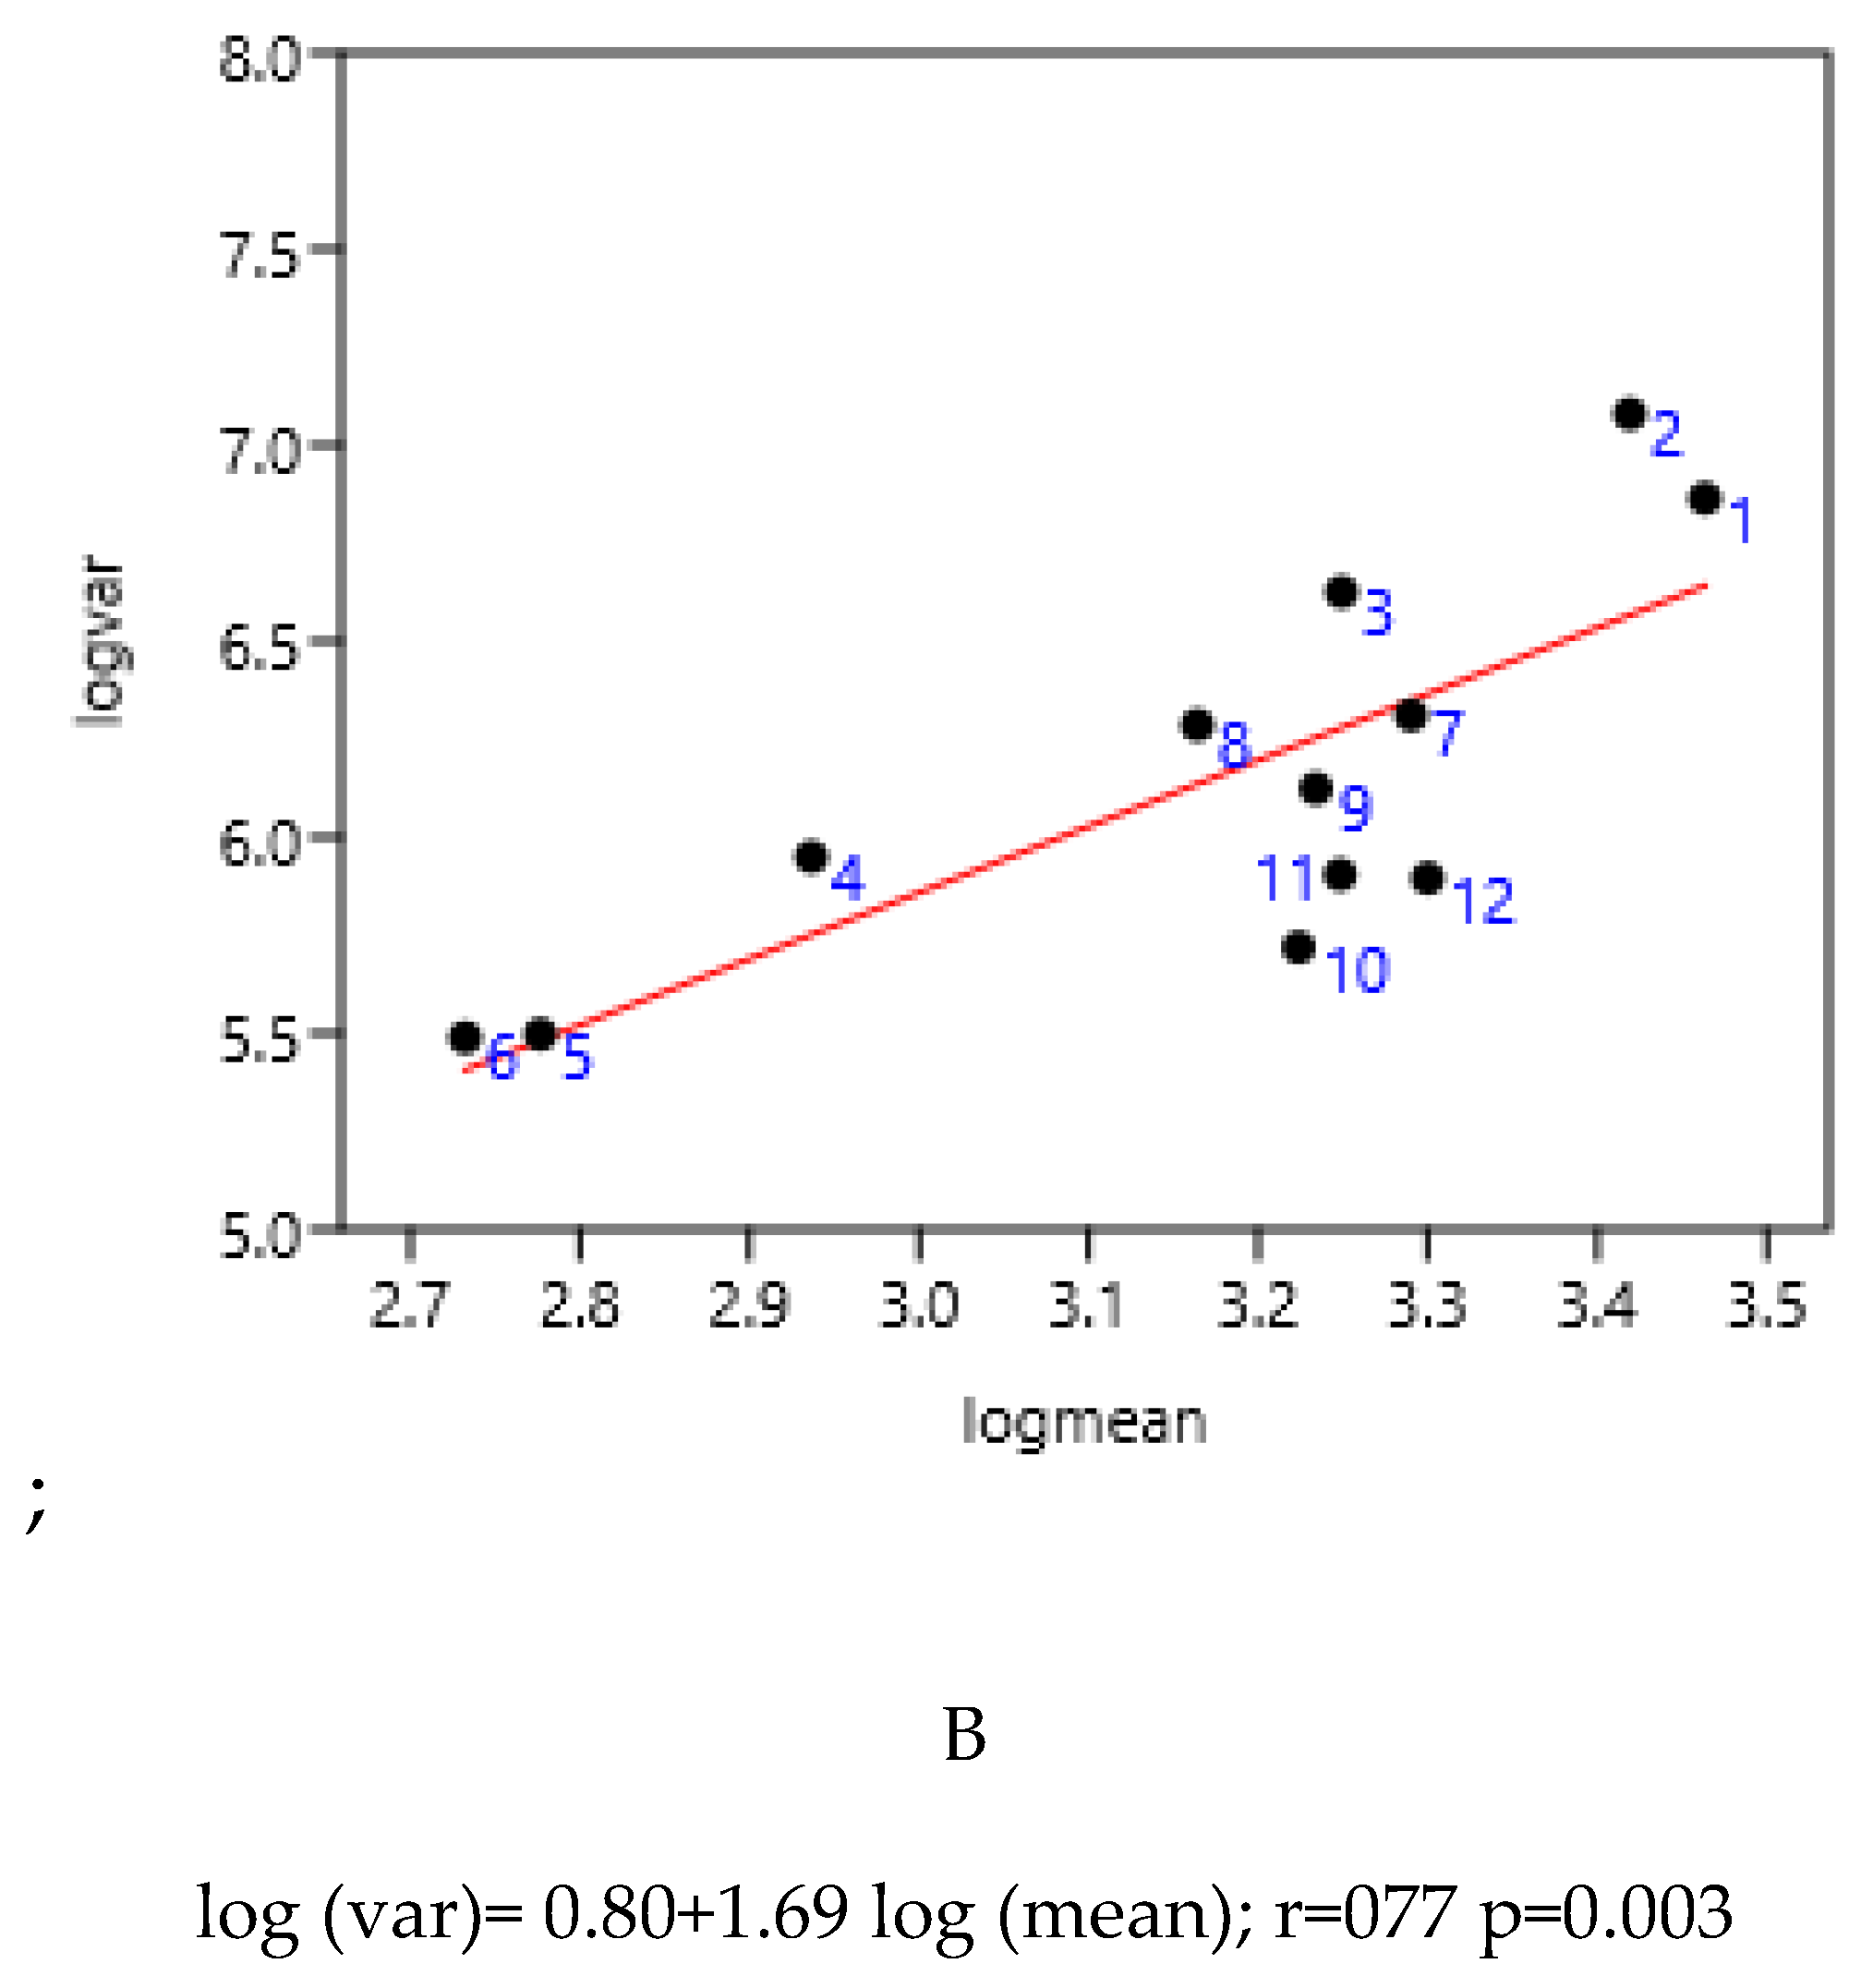
A significant relationship between FEC variance and mean was observed in four farms of Mexico sampled at seven days interval. There were slight difference between Mexico-1 and Mexico 4 compared to others, probably due to climatic conditions.
Figure.
Relationship between FEC variance and mean at seven days interval in Mexican farms of four regions (Mexico 1: 1,2,3; Mexico 2: 4,6; Mexico-3: 7,8,9; Mexico-4: 10,11,12) (261 horses).
Figure.
Relationship between FEC variance and mean at seven days interval in Mexican farms of four regions (Mexico 1: 1,2,3; Mexico 2: 4,6; Mexico-3: 7,8,9; Mexico-4: 10,11,12) (261 horses).
3.1.2. Age of Horses
A significant relationship between FEC and its variability among different ages of ponies (2 to 9 years old) did also exist in Welsh ponies of France-1 farm.
Figure 2.
Relation of FEC variance and mean in Welsh ponies from 2 to 9 years old on six occasions during two years of sampling. Each point corresponds to values concerning one age at different periods of sampling.
Figure 2.
Relation of FEC variance and mean in Welsh ponies from 2 to 9 years old on six occasions during two years of sampling. Each point corresponds to values concerning one age at different periods of sampling.
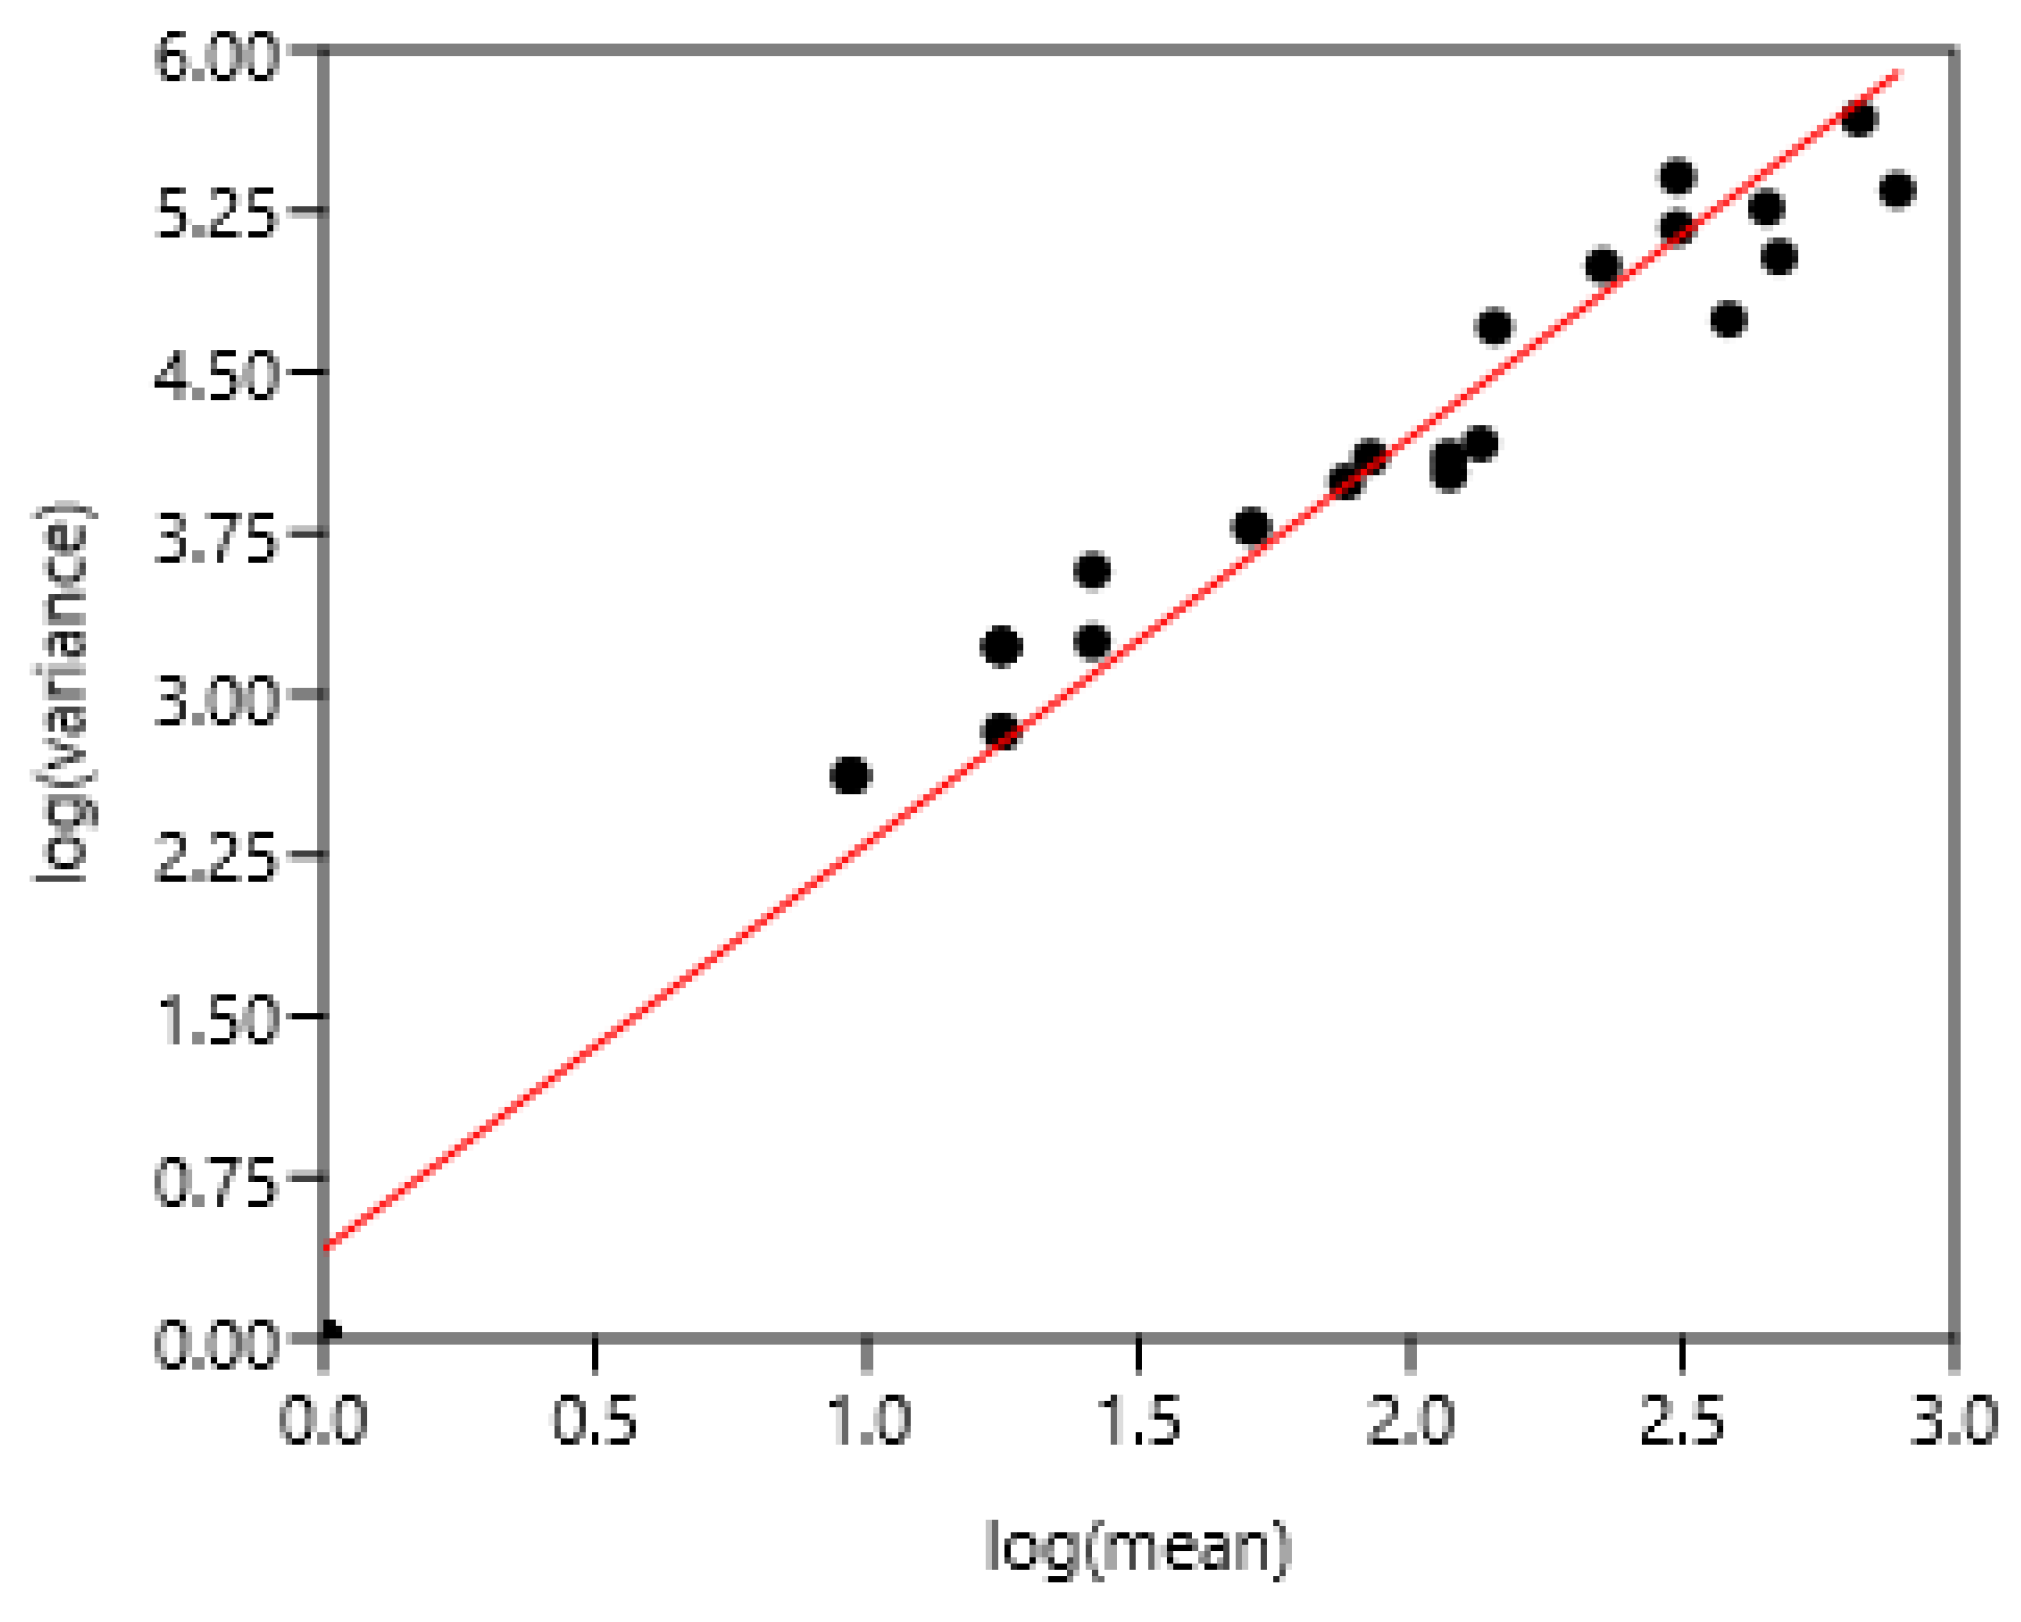
log (variance) = 0.41 +1.89 log (mean) r= 0.98, n=32, p<0.0001
3.1.3. Category of Horses
This was established on all the Poland ‘data. Geldings and stallions were the most differing from the linear regression. The geldings were rather present in riding clubs and stallions in stallion depots where grazing was reduced.
Figure 3.
Relationship between variance and mean among different categories of horses in Poland. 1-Gelding, (n=281) 2-b Stallion (n=2072), 3-Mare (n=6648), 4- Two-years (n=1379), 5- Yearling (n=1865), 6- Foal n=357).
Figure 3.
Relationship between variance and mean among different categories of horses in Poland. 1-Gelding, (n=281) 2-b Stallion (n=2072), 3-Mare (n=6648), 4- Two-years (n=1379), 5- Yearling (n=1865), 6- Foal n=357).
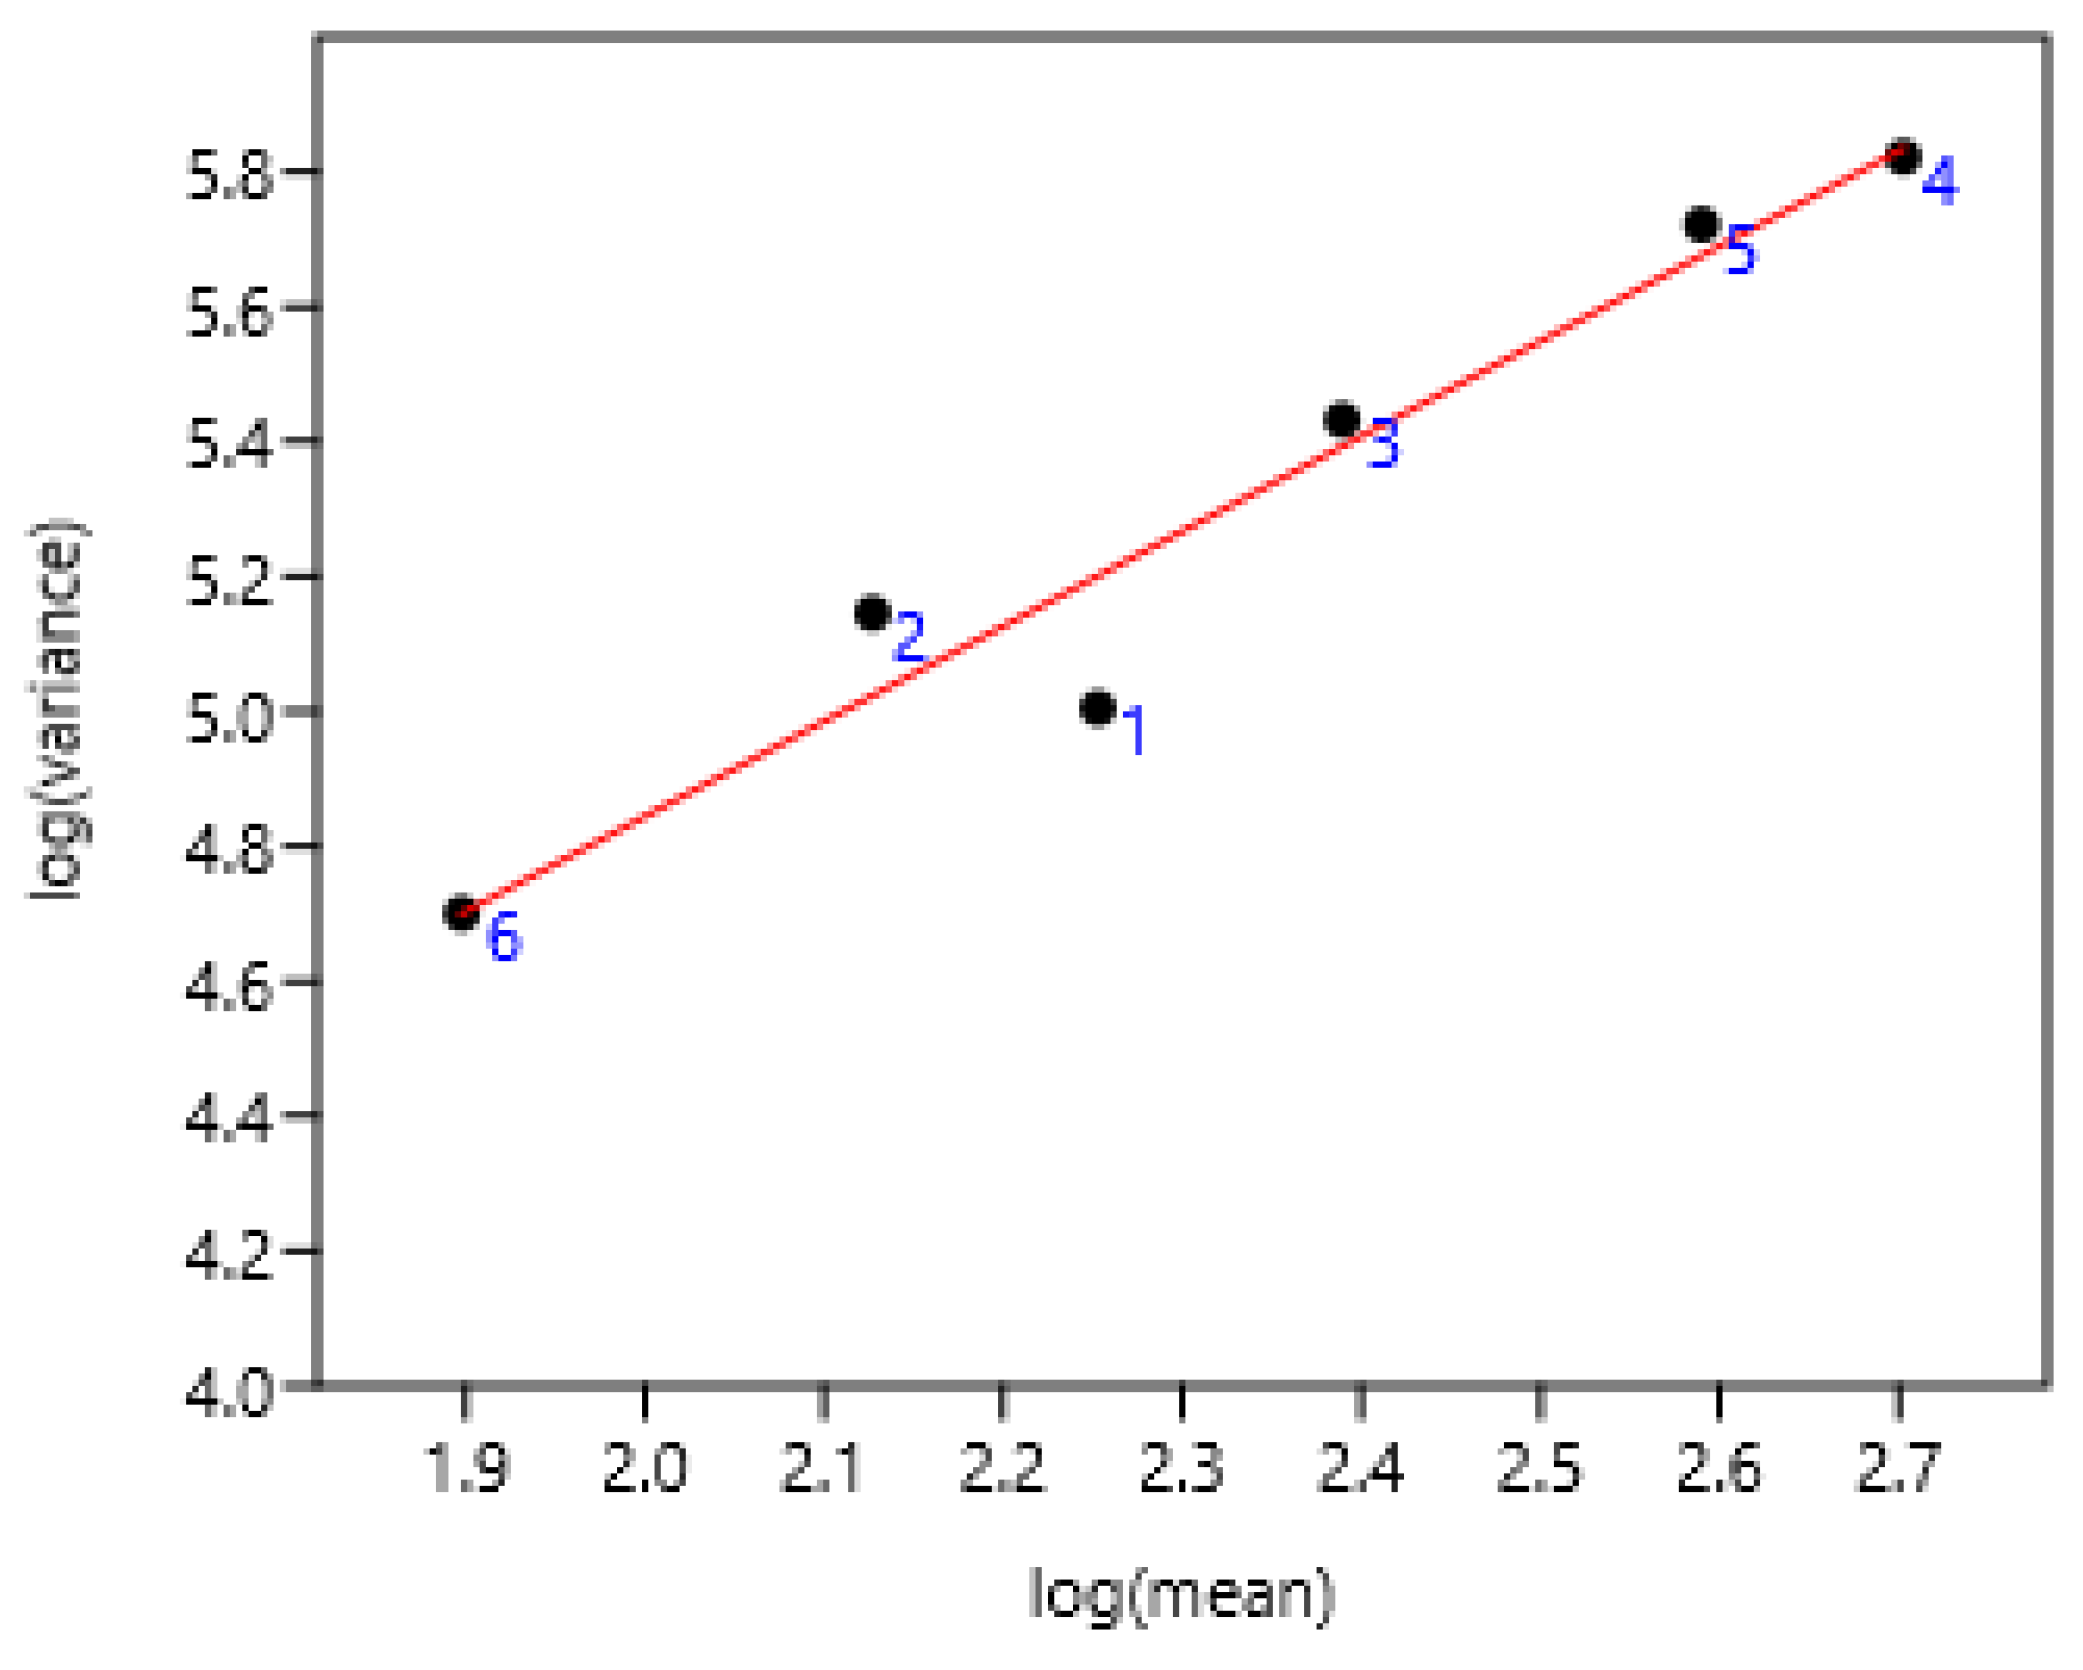
log (var)= 2.03 + 1.41 log (mean); r=0.97 n=6 p=0.001
3.1.4. Regions of Three Countries
The entire set of data was used. There was a highly significant relationship between variance and mean of FEC (Figure 3). There was no effect of region and countries.
Figure 4.
Relationship between variance and mean among horses and poneys of three countries. A: 1-8 Poland, 9-25 France, 26-37 Mexico, B: linear regression.
Figure 4.
Relationship between variance and mean among horses and poneys of three countries. A: 1-8 Poland, 9-25 France, 26-37 Mexico, B: linear regression.
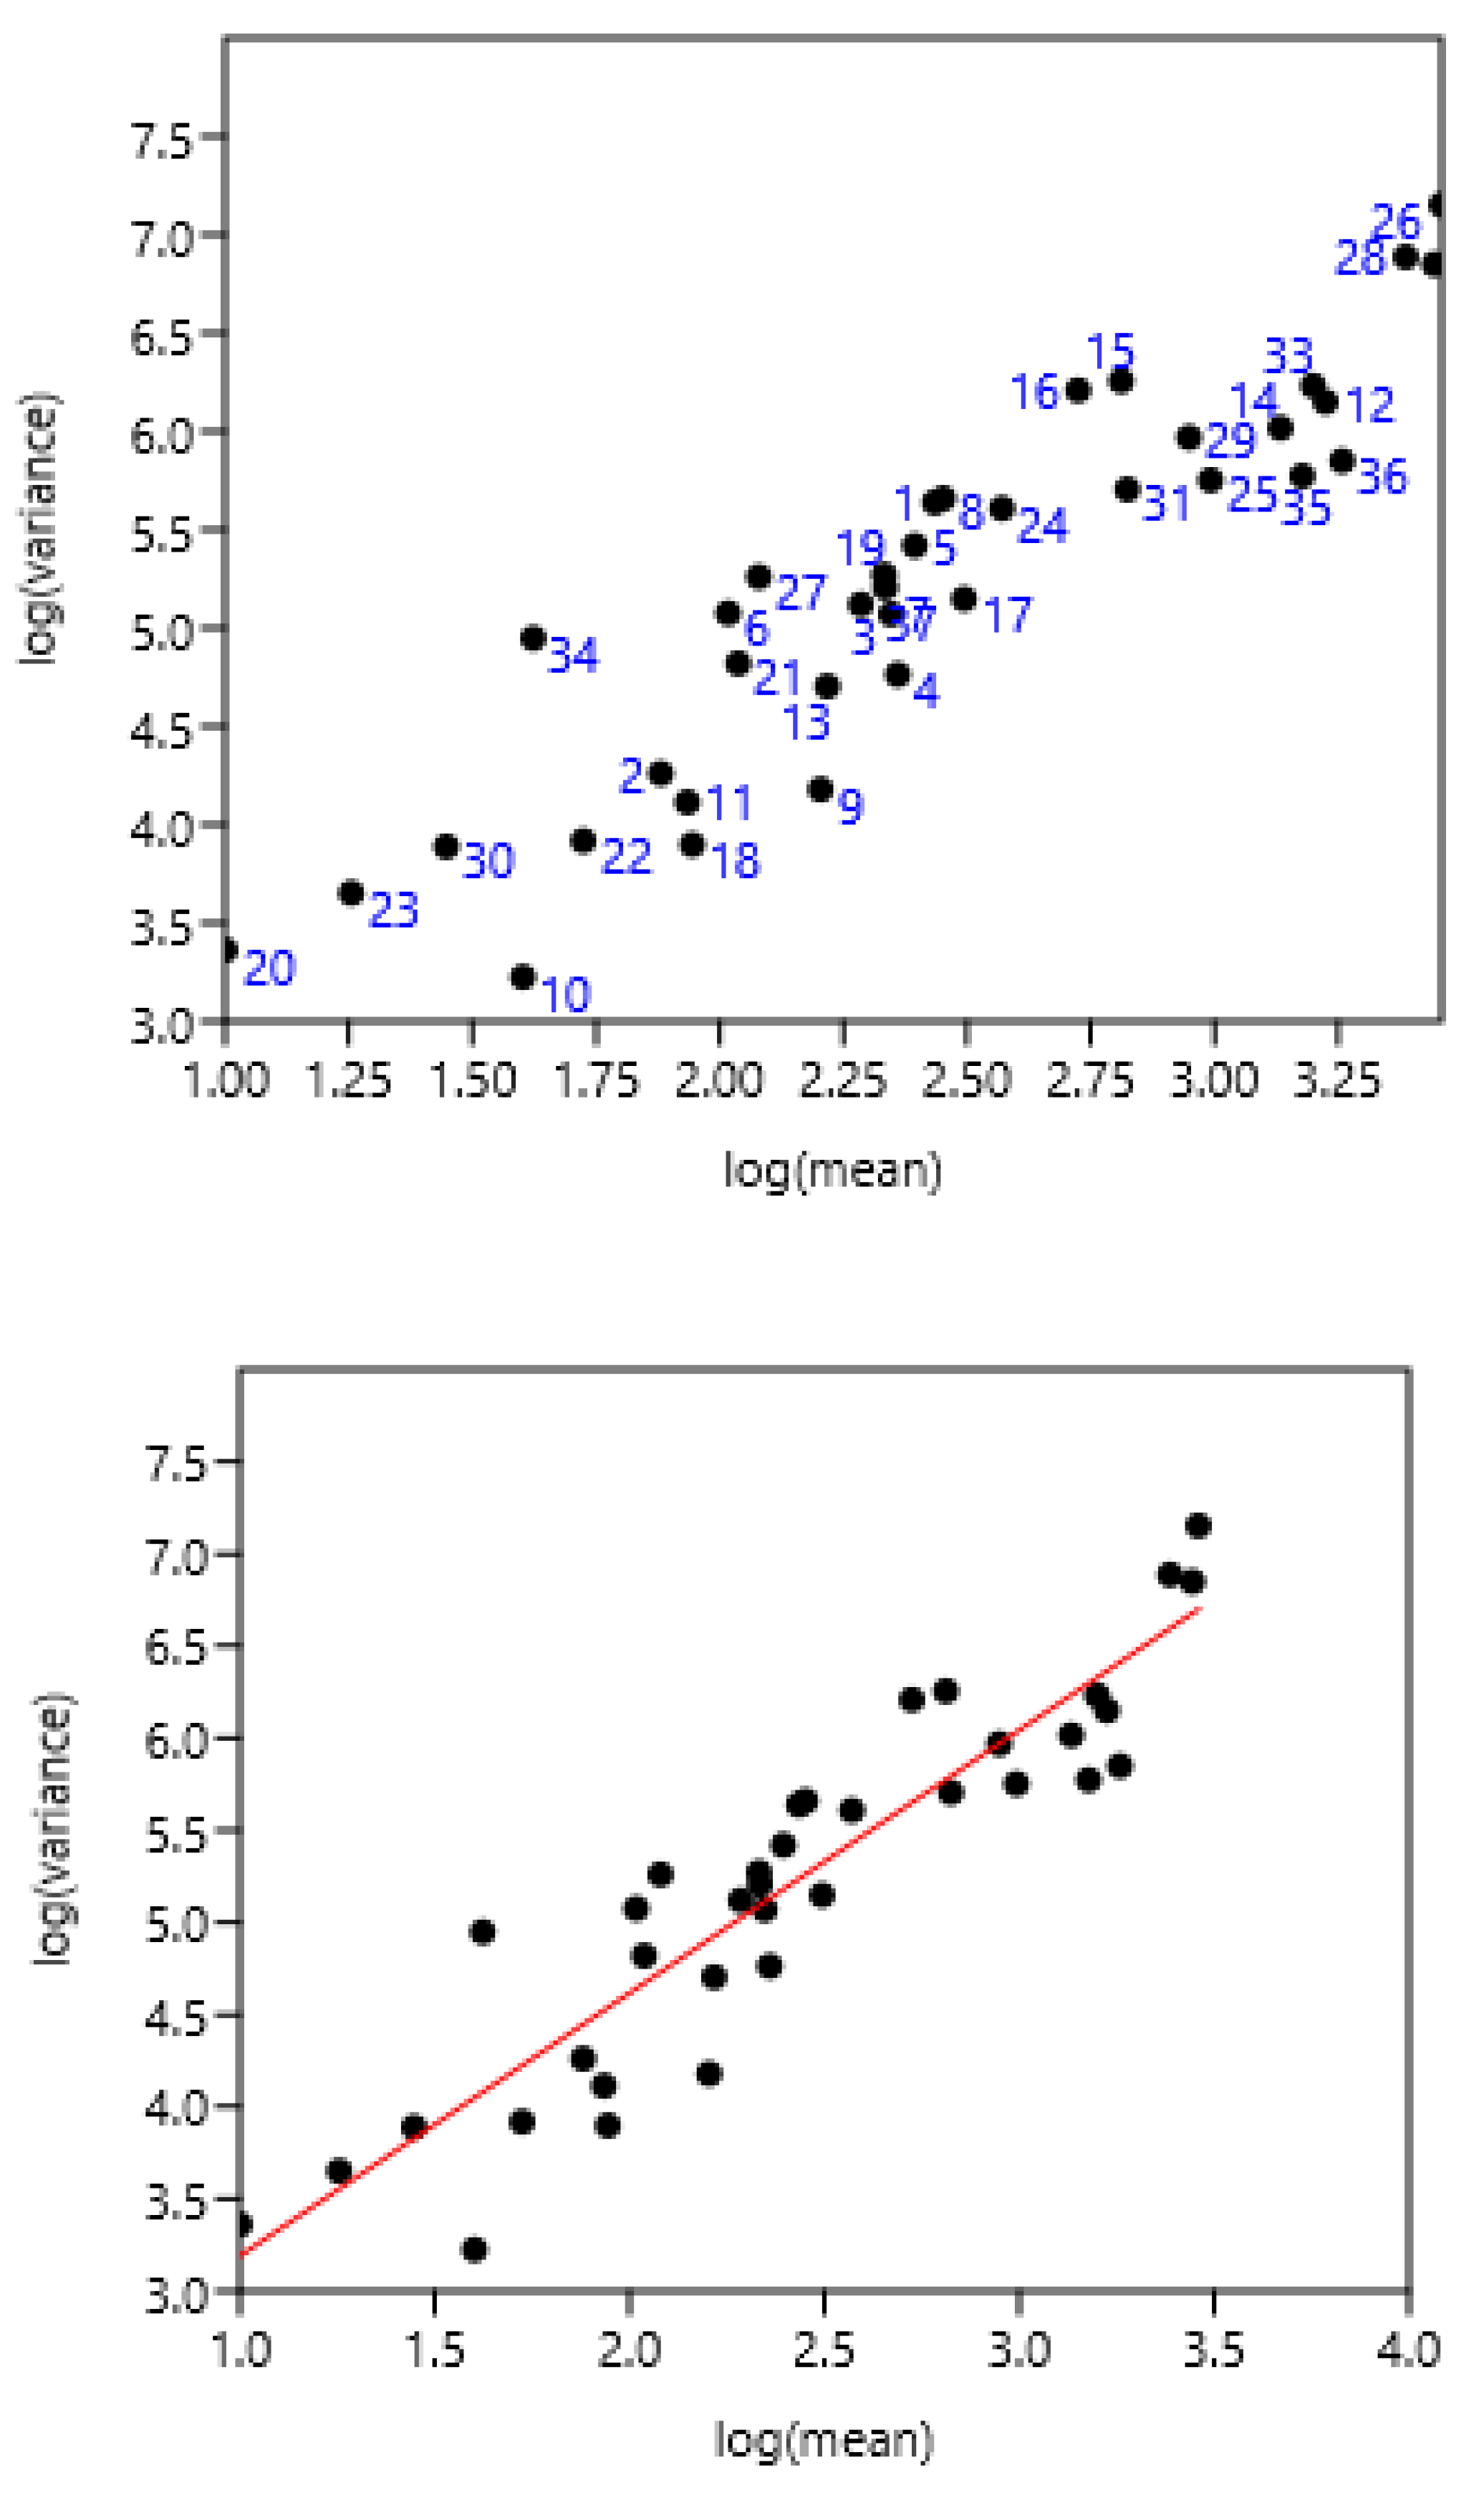
log (variance) = 1.43 +1.76 log (mean) r= 0.94, n=37, p<0.0001
3.1.5. Previous Anthelmintic Treatment
3.2. Composite Faecal Egg Count to Establish Average FEC
Composite FEC may be established from faeces collected individually from horses or sampling on the ground of the stable.
3.2.1. Composite from Faeces Collected from Horses
Ten composite samples were examined and compared to 10 individual horse samples. In France-1 and 3.
Figure 6.
Relation between mean composite and individual faecal egg counts (FEC) in France 1 and 3.
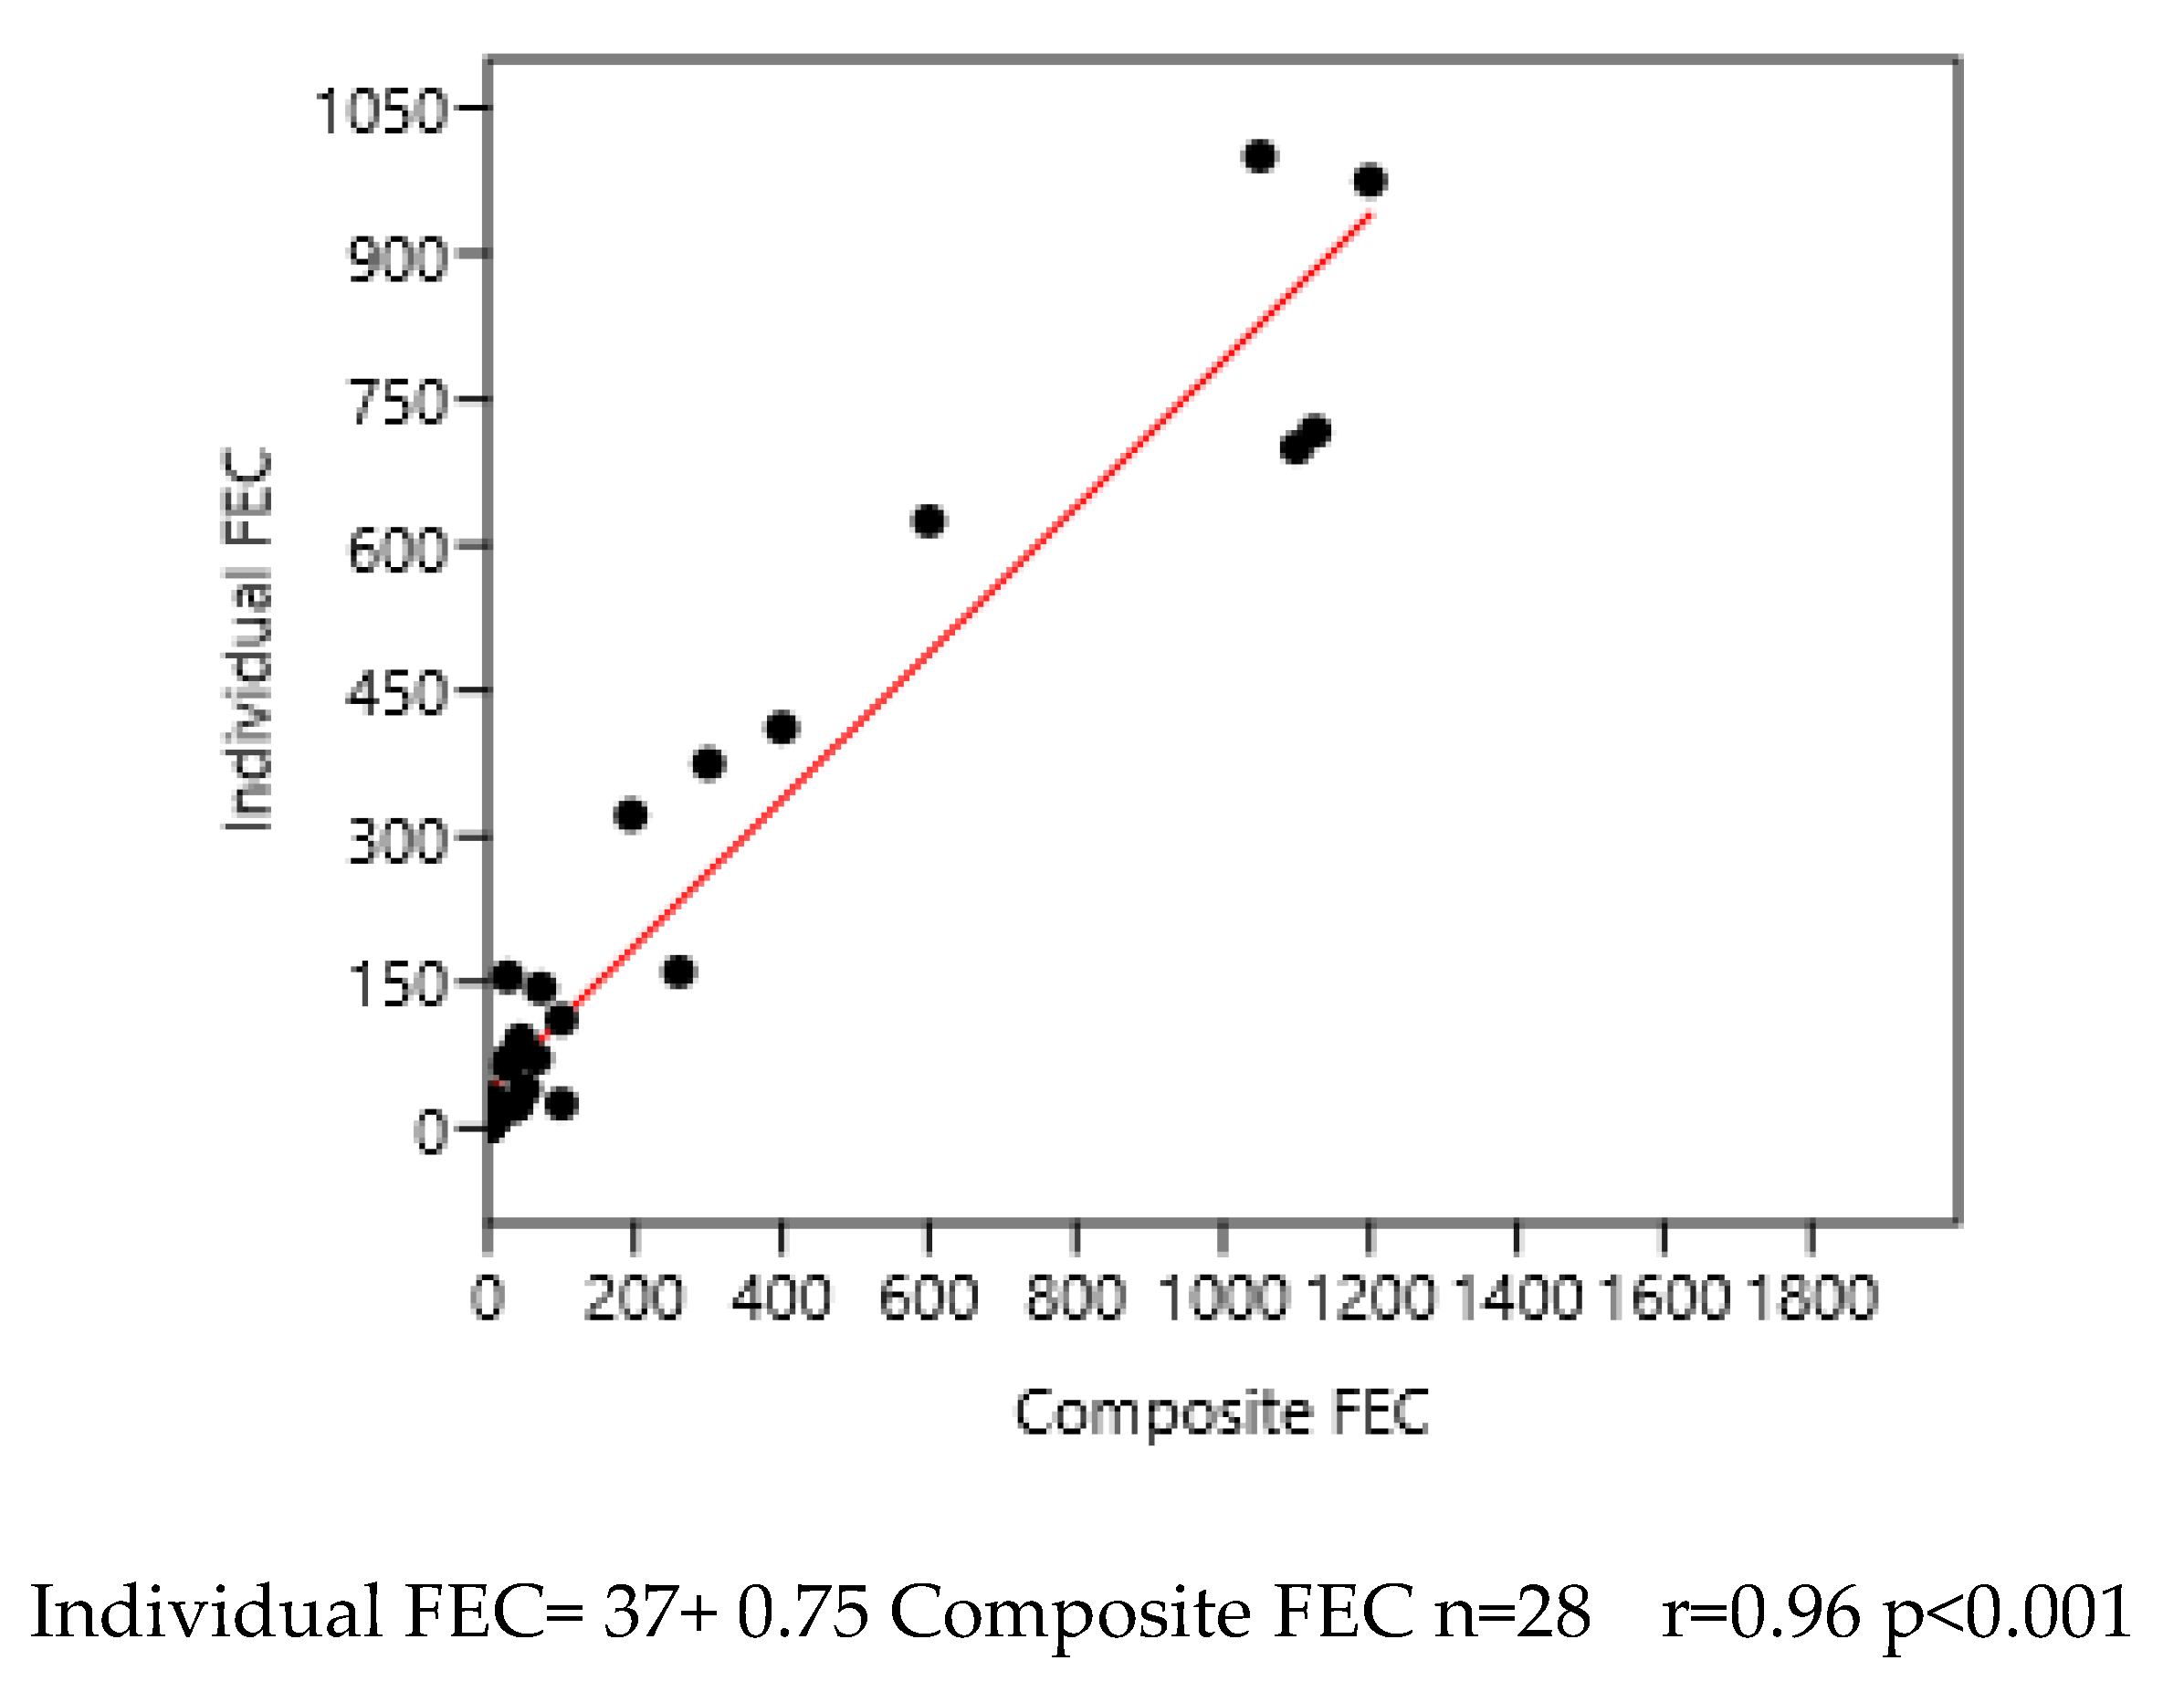
A regression on logarithm transformed data was also significant:
log (Individual FEC)= 0.82+0.42 log (Composite FEC) n=28; r=0.95; p<0.001
3.2.2. Composite from Faeces Collected from the Ground
Mean composite and individual FEC evaluations (France-1) based on 10 samples were significantly correlated (rs=0.80; p=0.001). A significant regression was established between the two evaluations of mean FEC:
log (individual FEC)= 0.75+0.72 log (composite FEC) n=12; r=0.92; p<0.001.
3.3. Relation Between Mean FEC and the Percentage of Horses with Different Indicators of FEC
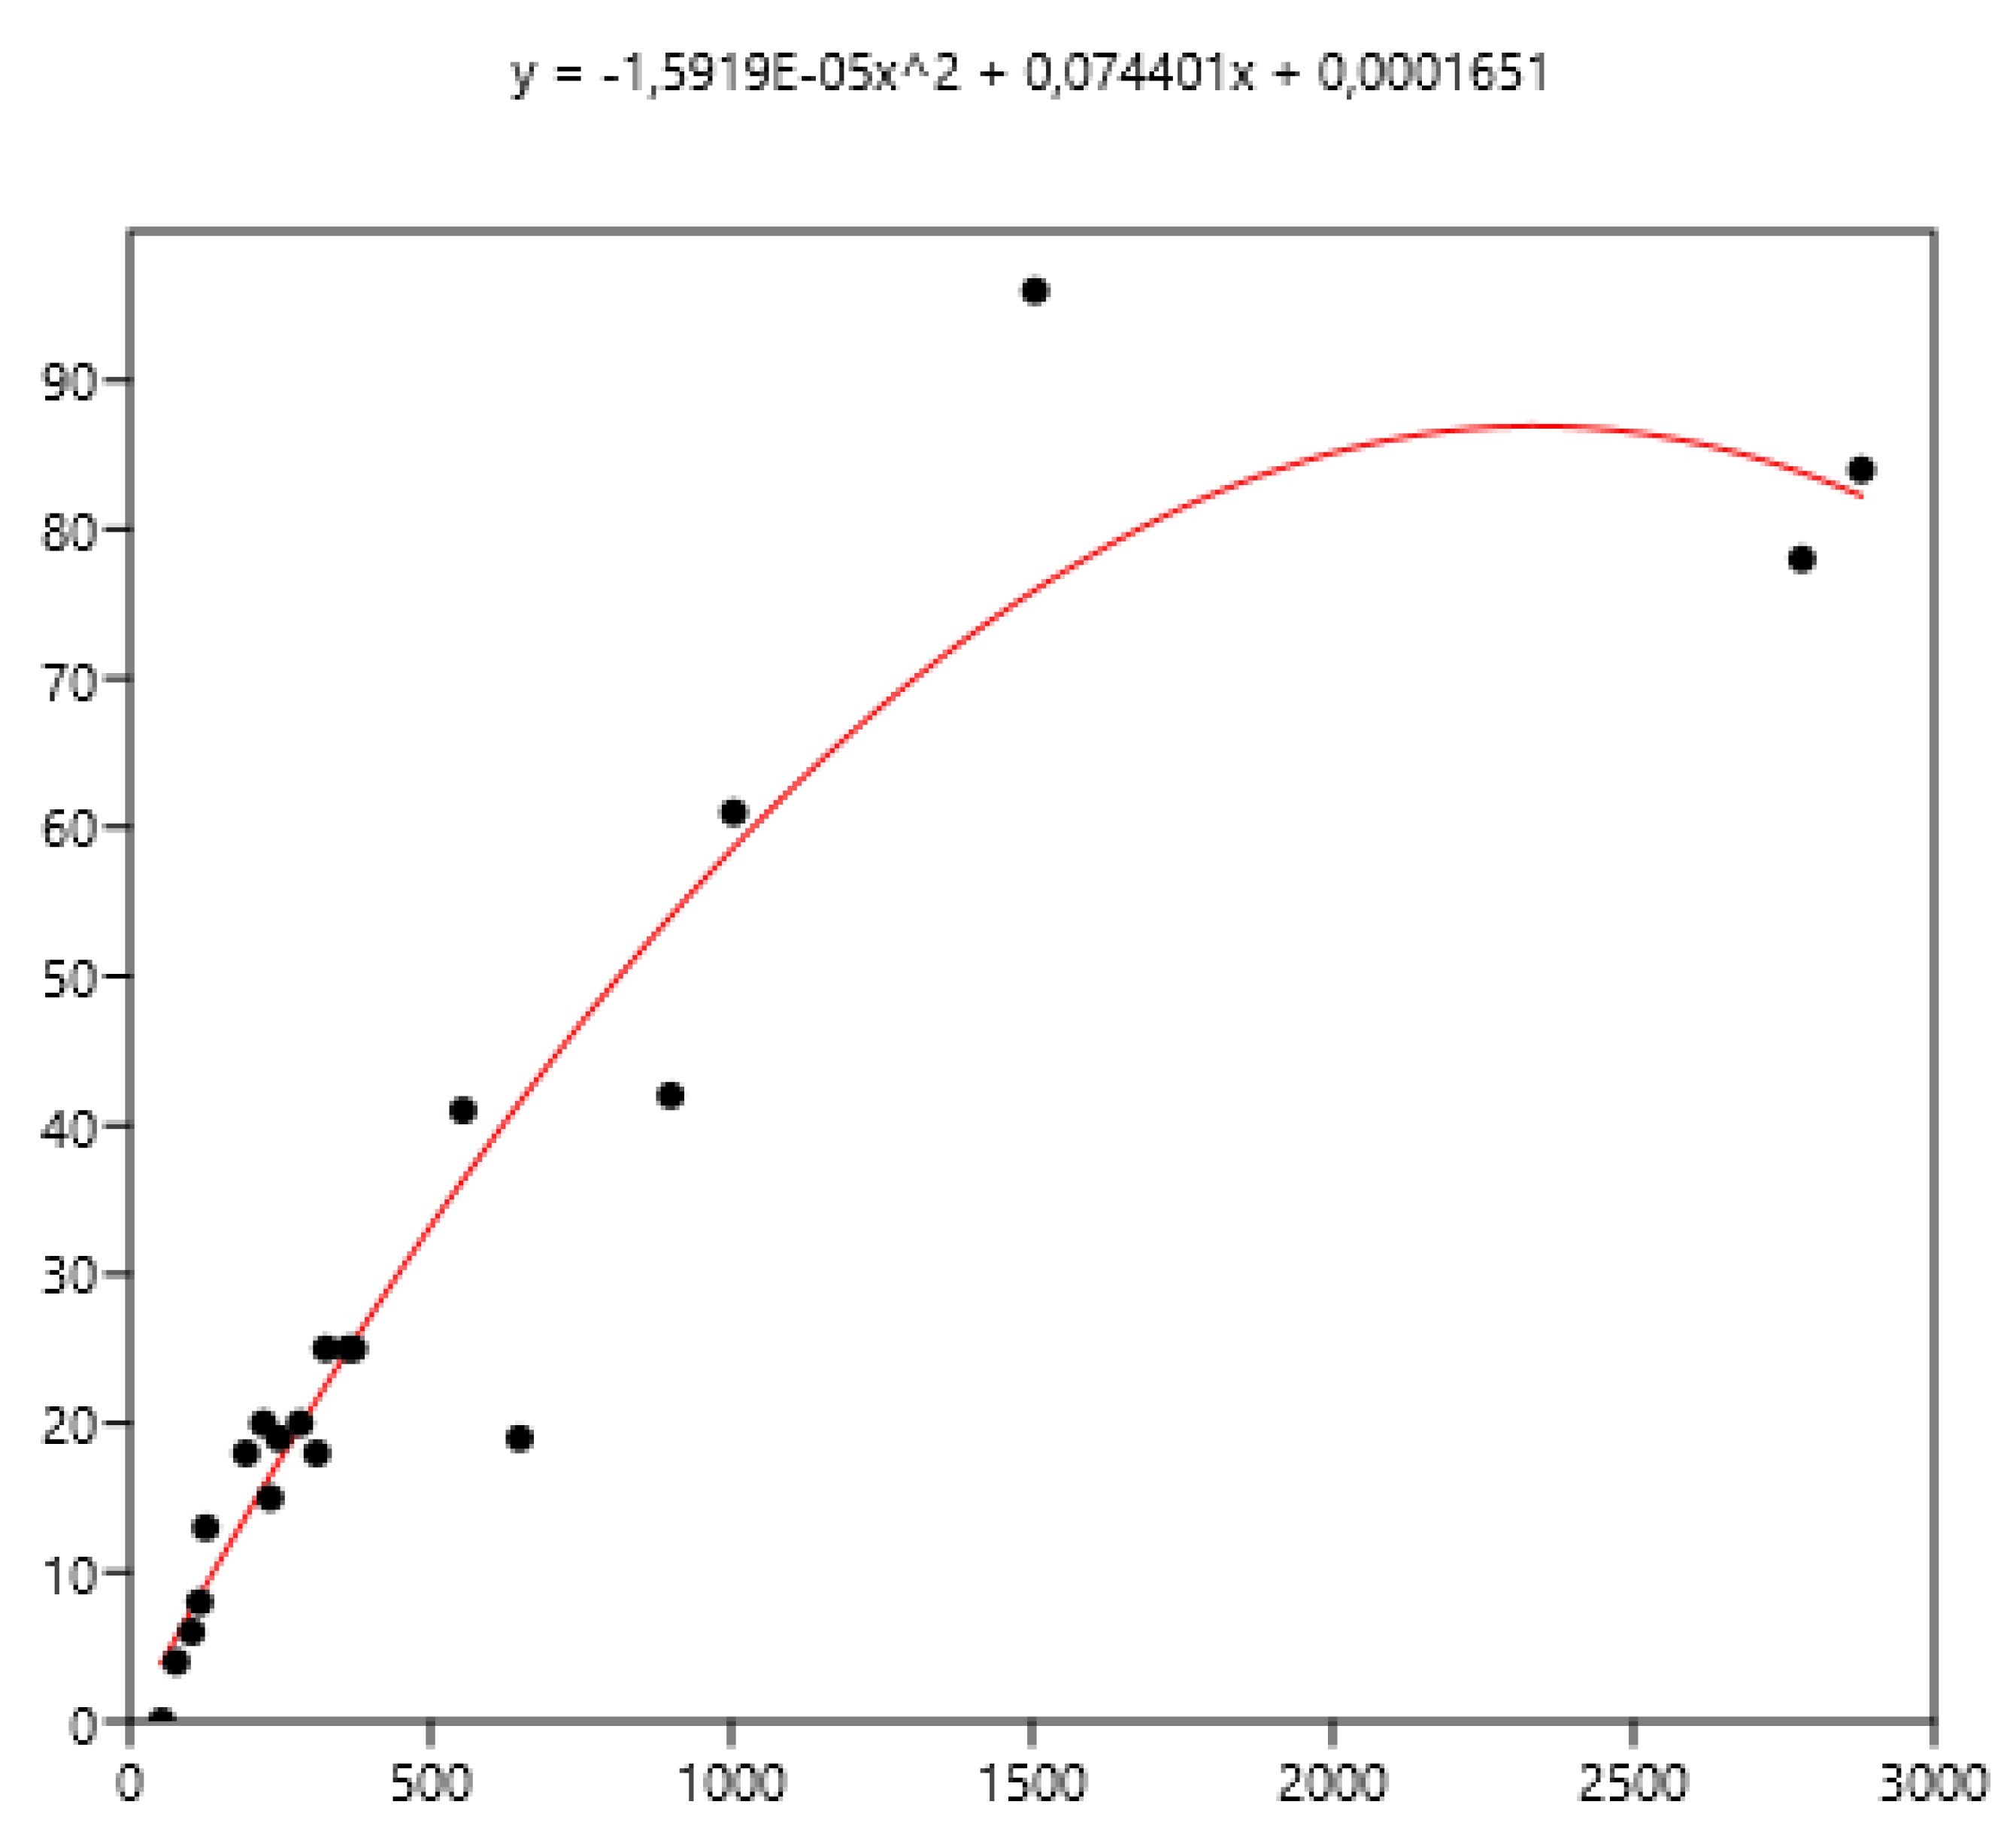
The mean FEC is related significantly (rs ) to variance (0.79), FEC=0 (-0.80), FEC<100 (- 0.86), FEC>200 (0.90), FEC>400 (0.94) using the data set of the three countries. The non-linear fit was performed between mean and the different percentages of FECs. The equations are inf Figure 7, Figure 8 and Figure 9.
The mean is the least related (and negatively) to the percentages of FEC=0. The mean is positively related to FEC over 200 or 400 and linear up to a mean FEC of 1000 EPG. Thus, in Figure 8, a mean of 1000 indicates that 65% of the horses should be treated and only 35% for a mean FEC of 250. If we choose the cut-off of 400 EPG (Figure 9), then when the mean FEC is1000, 55% of the animals should be treated, and only15% for a mean FEC of 250. When the mean FEC is over 1500, most of the horses should be treated.
4. Discussion
The tendency of population density to vary as a power function of the mean was first observed in the field of ecology [8]. Since then, this concept has been extended to all complex systems, including physics (where it is known as fluctuating scaling), climatology, the stock market, and the life sciences [32]. Adult parasite species and their propagules interact with each other and their hosts in complex ways ([33] Johnson et al., 2017). TPL has been found applicable to fecundity (FEC) in horses' GIN, as it was to adult GIN in sheep [7] and other ruminants ([11] . In the latter study, TPL was evaluated in the FEC of only two species (Nematodirus and Marshallagia), which have easily identifiable eggs). The slope of the regression of variance to mean was shown to be similar for FEC data and adult parasites with Marshallagia, but lower with Nematodirus. While there are probably some differences between FEC and adult parasite counts, these are not very significant; the slope values were close to 2 for sheep [7], 1.7 in several species of ruminant [11], and 1.76 for our current FEC in horses.
Despite there being empirical illustrations in various areas of parasitism, the biological significance of this relationship is still being debated. It is likely that the combined effects of biological and statistical processes on parasite aggregation influence the TPL [33] . The slope of the TPL clearly defines the relationship between the mean and variance. Taylor [8] suggested that it is also an index of aggregation that describes an intrinsic property of the organisms in question. However, it is unclear how the TPL slope relates to other aggregation concepts, such as k, the variance-to-mean ratio, the Gini index and the Hoover index [34]. Therefore, it is difficult to relate explanations based on aggregation indices to variations in the TPL slope. In another host-parasite model [35], the results suggested that host factors alone, operating post-infection, were sufficient to generate strong aggregation of parasite distributions rather than heterogeneity in exposure and initial invasion. General modelling also indicated that the host's immune protective response generates aggregation [36]. Boag et al. [37] also proposed that host immunity plays a significant role in determining the TPL slope in natural gastrointestinal helminth infections in rabbits. However, this was not observed in our data because the slope did not change with age (Figure 2) or the horses' status (Figure 3). The slope of TPL was not altered by the presence of large strongyles (Mexico data), even when mean FEC were higher. The lack of variability in the slope of TPL indicates that the proportion of highly excreting horses in a group can be deduced from the mean (Figure 8 and Figure 9), which is useful for deciding whether to perform TST.
However, farmers are not motivated to use FEC due to the comparative cost of treatment and FEC [25] , as well as the time required for faecal sampling. The decision to use FEC is not influenced by the perceived risk of anthelmintic resistance or GIN infection but is influenced by a negative attitude towards anthelmintics and a desire to control deworming programmes, which is associated with an increase in social pressure [26]. Using mean FEC with pooled (composite) faeces could reduce the number of laboratory FEC tests required and hence the cost. Previous studies have examined composite FEC in sheep [38] and different categories of horses [39] . In our study, composite evaluation was efficient on a sample of 10 composite FEC based on faeces from 10 individuals. Sampling from horses is time-consuming, so composite sampling based on faeces collected from the stable floor is an interesting procedure to propose to farmers as it eliminates the need for time-consuming individual sampling.
The decision to use TST depends on the type of horse; it should not be used for foals, who are sensitive to parasites [40] (Nielsen et al., 2013). The exclusion of foals is not always accepted and TST is also applied to them [41] since TST is intended to cope with anthelmintic resistance and it concerns all nematodes of all horses [42] . It also depends on the group of parasites: the use of TST favours the maintenance of large strongyles [24] (odds-ratio 4.4)., and their presence in our Mexican data may preclude its careless use. Even when all the necessary conditions are met, the chosen mean cut-off, ranging from 200 to 400 FEC [15] or even 500 FEC [40,43], may affect its effectiveness. However, when over 50% of horses need treatment, the interest in TST is limited (mean EPG 500 with a cut-off of 200, or mean EPG 750 with a cut- off 400: Figure 8 and Figure 9). When needed, the choice of animals to be treated can focus on risk groups, such as horses up to five or six years old [42,44], excluding foals according to [42] that should not be submitted to TST. This selection could also be based more accurately on individual FEC. However, it should be borne in mind that these FEC can vary [45][43, and substantial variation can be seen between samples taken from the same animal [46] (, even if 94% exhibit consistent egg shedding [47]. The main objective is to minimize the number of treatments in order to reduce the development of anthelmintic resistance while treating those with a higher level of contamination, i.e., above 200 EPG [20] . However, EPGs are not an exact reflection of actual adult infection; above 500 EPGs, the level is poorly related to the number of worms [43] . Worm fertility varies considerably (|48], which may affect interpretation for clinical use. Equines excrete 8 g of dry faecal matter per kg of body weight [49] , so the same FEC in a Welsh pony weighing 300 kg and a Thoroughbred weighing 500 kg does not have the same meaning in terms of worm infection. This could partly influence the cut-off values in relation to the possible clinical impact of GIN. Further research is needed to adapt these values according to farm structures to reduce the development of resistance and limit clinical outcomes. It should also be born in mind that anthelmintic treatment is only one means to control GIN and that good grazing management should be associated with TST [39].
Conclusion
The TPL is an efficient way of relating the mean and variation in the FEC of horses. The percentage of horses with a higher FEC than a predetermined threshold can be easily calculated from the mean FEC and used to inform selective anthelmintic treatment. The remaining technical problems are choosing a cut-off point and which horses should be treated. No treatment is required when the mean FEC is below the cut-off point If treatment is required, it may be necessary to focus on horses known to be at risk due to their age, previous identification, or clinical status, which may be associated with gastrointestinal nematodes. Repeated use of targeted selective treatment should be used with caution when large strongyles are present.
Author Contributions
Conceptualization, J.C., C.G..; methodology, J.C., C.G.,C.M.O.M. , Y.A.Z.; validation, J.C., C.G.,C.M.O.M. , Y.A.Z.; formal analysis, J.C., C.G ; investigation, J.C., C.G, C.M.O.M., Y.A.Z;.data curation, , J.C., C.G.,C.M.O.M. , Y.A.Z ; writing—original draft JC; writing—review and editing, J.C., C.G.,C.M.O.M. , Y.A.Z .; project administration, . J.C., C.G. All authors have read and agreed to the published version of the manuscript.
Funding
This research received no external funding.
Institutional Review Board Statement
Not applicable.
Data Availability Statement
Data are available within this paper.
Acknowledgements
We thank students and staff who helped us to collect data in France, either in Nouzilly experimental Welsh Ponies farm (head: Guy. Duchamp and Fabrice Reignier, INRAE) or Chamberet Stud farm (head: Laurence Wimel, IFCE). The Polish data were collected by the late Slawomir Kornas and colleagues and shared with one of us (J.C.) for different analyses and previous publications on gastrointestinal nematodes of horses.
References
- Poulin, R. Are there general laws in parasite ecology? Parasitology, 2007,134, 763–776. https://doi.org/10.1017/S0031182006002150. [CrossRef]
- Gaba, S., Ginot, V., Cabaret, J. Modelling macroparasite aggregation using a nematode-sheep system: the Weibull distribution as an alternative to the negative binomial distribution? Parasitology, 2005,131,3, 393-401. [CrossRef]
- Relf, V. E., Morgan, E. R., Hodgkinson, J. E., Matthews, J. B. Helminth egg excretion with regard to age, gender and management practices on UK Thoroughbred studs. Parasitology, 2013, 140,5, 641-652. [CrossRef]
- Kaplan, R. M., Nielsen, M. K. An evidence-based approach to equine parasite control: It ain't the 60s anymore. Equine Vety Educ.2010, 22,6, 306-316. [CrossRef]
- Morrill, A., Poulin, R., Forbes, M. R. Interrelationships a, d properties of parasite aggregation measures: a user’s guide. Int. J. for Parasitol., 2023, 53,14, 763-776. [CrossRef]
- Barger, I.A. The statistical distribution of trichostrongylid nematodes in grazing lambs. Int. J.for Parasitol.1985, 15, 645-649. [CrossRef]
- Boag, B., Hackett, C.A., Topham, P.B. The use of Taylor’s Power Law to describe the aggregated distribution of gastro-intestinal nematodes of sheep. Int. J. for Parasitol., 1992, 22, 267-270. [CrossRef]
- Taylor, L.R. Aggregation, variance, and the mean. Nature, 1961, 189,732–735.
- Smith, H. F. An empirical law describing heterogeneity in the yields of agricultural crops. The Journal of Agric. Sci., 1938, 28,1, 1-23. [CrossRef]
- Taylor, R. A.Taylor's power law: order and pattern in nature. Academic Press. London, 2019,640 p.
- Morgan, E.R.; Segonds-Pichon, A.; Ferté, H.;Duncan, P.; Cabaret, J. Anthelmintic Treatment and the Stability of Parasite Distribution in Ruminants. Animals 2023, 13, 1882. [CrossRef]
- Murphy, D., Love, S. The pathogenic effects of experimental cyathostome infections in ponies. Vet. Parasitol. 1997, 70,1-3, 99-110. [CrossRef]
- Kilani M., Chermette R., Guillot J., Polack B., Duncan J.L., Cabaret J. Gastrointestinal nematodes. p. 1481-16003. In: Infectious and parasitic diseases of Livestock. 2. Bacterial diseases, Fungal diseases, Parasitic diseases. Ed. Tec & Toc Lavoisier, 2010, Paris.
- Kaplan, R. M. Anthelmintic resistance in nematodes of horses. Vet. Res. 2002, 33,5, 491-507. [CrossRef]
- Silva, P. A., Cernea, M., Madeira de Carvalho, L. Anthelmintic Resistance in Equine Nematodes-A Review on the Current Situation, with Emphasis in Europe. Bull. of the Univ. of Agric.Sciences & Vet. Med. Cluj-Napoca, 2019, 76(2). [CrossRef]
- Uriarte, J., Cabaret, J., Tanco, J. A. The distribution and abundance of parasitic infections in sheep grazing on irrigated or on non-irrigated pastures in North-Eastern Spain. Ann. de rech. vét. 1985, 16, 4, 321-325.
- Duncan, J.L., Love, S. Preliminary observations on an alternative strategy for the control of horse strongyles. Equine Vet. J. 1991, 23, 226–228. [CrossRef]
- Gomez, H.H., Georgi, J.R. Equine helminth infections: control by selective chemotherapy. Equine Vet. J. 1991, 23, 198–200. [CrossRef]
- Nielsen MK. Sustainable equine parasite control: Perspectives and research needs. Vet.Parasitol.2012, 185,1, 32–44. [CrossRef]
- Pfister, K., van Doorn, D. New perspectives in equine intestinal parasitic disease: insights in monitoring helminth infections. Vet. Clin. of North America. Equine Practice, 2018 34,1, 141-153.
- Matthee, S., McGeoch, M. A. Helminths in horses: use of selective treatment for the control of strongyles. J. of the South African Vet. Assoc., 2004,75,3, 129-136. [CrossRef]
- Becher, A. M., Mahling, M., Nielsen, M. K., Pfister, K. (2010). Selective anthelmintic therapy of horses in the Federal states of Bavaria (Germany) and Salzburg (Austria): An investigation into strongyle egg shedding consistency. Vet. Parasitol. 2010, 171,1-2, 116-122. [CrossRef]
- Lüthin, S., Zollinger, A., Basso, W., Bisig, M., Caspari, N., Eng, V., Frey C.F., Grimm F., Igel P., Lüthi S., Regli W., Roelfstra L., Rosskopf M., Steiner B., Stöckli M.,. Waidyasekera D., Waldmeier P., Schnyder M., Torgerson P.R. Hertzberg, H. Strongyle faecal egg counts in Swiss horses: A retrospective analysis after the introduction of a selective treatment strategy. Vet. Parasitol. 2023,323, 110027.
- Jürgenschellert, L., Krücken, J., Bousquet, E., Bartz, J., Heyer, N., Nielsen, M. K., von Samson-Himmelstjerna, G. Occurrence of strongylid nematode parasites on horse farms in Berlin and Brandenburg, Germany, with high seroprevalence of Strongylus vulgaris infection. Frontiers in vet. sci.2022, 9, 892920. [CrossRef]
- Sallé, G., Cortet, J., Koch, C., Reigner, F., Cabaret, J. Economic assessment of FEC-based targeted selective drenching in horses. Vet. Parasitol.2015, 214,1-2, 159-166. [CrossRef]
- Vineer H.R., F. Vande Velde, K. Bull, E. Claerebout, E.R. Morgan. Attitudes towards worm egg counts and targeted selective treatment against equine cyathostomins. Prev. Vet. Med., 144, 66-74,. [CrossRef]
- Kornaś, S., J. Cabaret, M. Skalska et B. Nowosad. Horse infection with intestinal helminths in relation to age, sex, access to grass and farm system. Vet. Parasitol.2010, 174:.285-291. [CrossRef]
- Pagnon R. Résistance aux anthelminthiques des strongles chez les équidés : enquête dans un centre équestre du sud de la France. Thèse Doctorat Vétérinaire, Université de Toulouse,2005, 121 p.
- Henriksen,S. A., Korsholm,H. A method for culture and recovery of gastrointestinal strongyle larvae. Nordisk Vet. Med. 1983, 35, 11, 429–430.
- Amer, M. M., Desouky, A. Y., Helmy, N. M., Abdou, A. M., Sorour, S. S. Identifying 3rd larval stages of common strongylid and non-strongylid nematodes (class: Nematoda) infecting Egyptian equines based on morphometric analysis. BMC Vet. Res. 2022,18, 1, 432. [CrossRef]
- Kaplan R.K., Denwood M.J., Nielsen M.K., Thamsborg S.M., Torgerson P.R., Gilleard J.S., Dobson R.J., Vercruysse J., Levecke B. World Association for the Advancement of Veterinary Parasitology (W.A.A.V.P.) guideline for diagnosing anthelmintic resistance using the faecal egg count. reduction test in ruminants, horses and swine. Vet. ParasitoL,318,2023,109936. [CrossRef]
- Eisler, Z., Bartos, I., Kertész, J. Fluctuation scaling in complex systems: Taylor's law and beyond. Adv. in Physics, 2008, 57,1 89-142. [CrossRef]
- Johnson PTJ, Wilber MQ. Biological and statistical processes jointly drive population aggregation: using host–parasite interactions to understand T,aylor’s power law. Proc. R. Soc. B 2017, 284: 20171388. http://dx.doi.org/10.1098/rspb.2017.1388. [CrossRef]
- McVinish R, Lester RJG. Measuring aggregation in parasite populations. J. R. Soc. Interface2020, 17: 20190886. http://dx.doi.org/10.1098/rsif.2019.0886. [CrossRef]
- Tinsley, R. C., Vineer, H. R., Grainger-Wood, R., Morgan, E. R. Heterogeneity in helminth infections: factors influencing aggregation in a simple host–parasite system. Parasitology, 2020, 147, 1, 65-77. [CrossRef]
- Galvani, A. P. Immunity, antigenic heterogeneity, and aggregation of helminth parasites. Journal of Parasitol., 2003,89, 2, 232-241. [CrossRef]
- Boag, B.; Lello, J.; Fenton, A.; Tompkins, D.M.; Hudson, P.J. Patterns of parasite aggregation in the wild European rabbit (Oryctolagus cuniculus). Int. J. Parasitol. 2001, 31, 1421–1428. [CrossRef]
- Morgan, E.R., Cavill, L., Curry, G.E., Wood, R.M., Mitchell, E.S.E. Effects of aggregation and sample size on composite faecal egg counts in sheep. Vet. Parasitol.2005, 131, 79 – 87. [CrossRef]
- Eysker, M., Bakker, J., Van Den Berg, M., Van Doorn, D. C. K., & Ploeger, H. W. The use of age-clustered pooled faecal samples for monitoring worm control in horses. Vet. Parasitol. 2008,151,2-4, 249-255. [CrossRef]
- Nielsen, M. K., Baptiste, K. E., Tolliver, S. C., Collins, S. S., Lyons, E. T. Analysis of multiyear studies in horses in Kentucky to ascertain whether counts of eggs and larvae per gram of feces are reliable indicators of numbers of strongyles and ascarids present. Vet. Parasitol. 2010,174,1-2), 77-84. [CrossRef]
- Martínez-Ortiz de Montellano C., González-Reyes L., Toledo-Alvarado H.O. 2025. Epidemiological patterns of cyathostominae burden in Warmblood horses in Mexico. WAAVP 2025, 30th Conference of the World Association for the Advancements of Veterinary Parasitology. Curitiba. Proceeding p. 61-62.
- Matthews, J. B. Anthelmintic resistance in equine nematodes. Int. J. Parasitol.: Drugs and Drug Resistance, 2014, 4, 3, 310-315. [CrossRef]
- Nielsen MK., Mittel L., Grice, A., Erskine, M., Graves, E., Vaala, W., Tully, R. C., French, D. D. 2013, AAEP Parasite Control Guidelines. (Accessed on 15 th of November2025).
- Rendle D, Austin C, Bowen M, Cameron I, Furtado T, Hodgkinson J, McGorum B, Matthews J . Equine de-worming: a consensus on current best practice. UK-Vet Equine, 2019, 3, Sup1, 1–14. [CrossRef]
- Wilkes, E. J. A., Woodgate, R. G., Raidal, S. L., & Hughes, K. J. The application of faecal egg count results and statistical inference for clinical decision making in foals. Vet. Parasitol. 2019 270, 7-12. [CrossRef]
- Denwood, M. J., Love, S., Innocent, G. T., Matthews, L., McKendrick, I. J., Hillary, N., Reid, S. W. J. Quantifying the sources of variability in equine faecal egg counts: implications for improving the utility of the method. Vet. Parasitol. 2012,188,1-2, 120-126. [CrossRef]
- Lester, H. E., Morgan, E. R., Hodgkinson, J. E., Matthews, J. B. Analysis of strongyle egg shedding consistency in horses and factors that affect it. J. of Equine Vet. Sci, 2018, 60, 113-119. [CrossRef]
- Kuzmina, T. A., Lyons, E. T., Tolliver, S. C., Dzeverin, I. I., Kharchenko, V. A. Fecundity of various species of strongylids (Nematoda: Strongylidae)—parasites of domestic horses. Parasitol. Res. 2012,111,6, 2265-2271. [CrossRef]
- Fleurance G., Martin-Rosset W., Dumont B., Duncan P., Farrugia A., Lecomte T. Environmental impact of horses. p. 481-504. In: Equine nutrition, Ed. Martin-Rosset, Wageningen Academic Publishers. Wageningen, 2013.
Figure 1.
Relation between variance and mean of EPG on two consecutive days of faecal sampling in a farm (France-1) using 10 bootstrap samples each day. (43 horses).
Figure 1.
Relation between variance and mean of EPG on two consecutive days of faecal sampling in a farm (France-1) using 10 bootstrap samples each day. (43 horses).
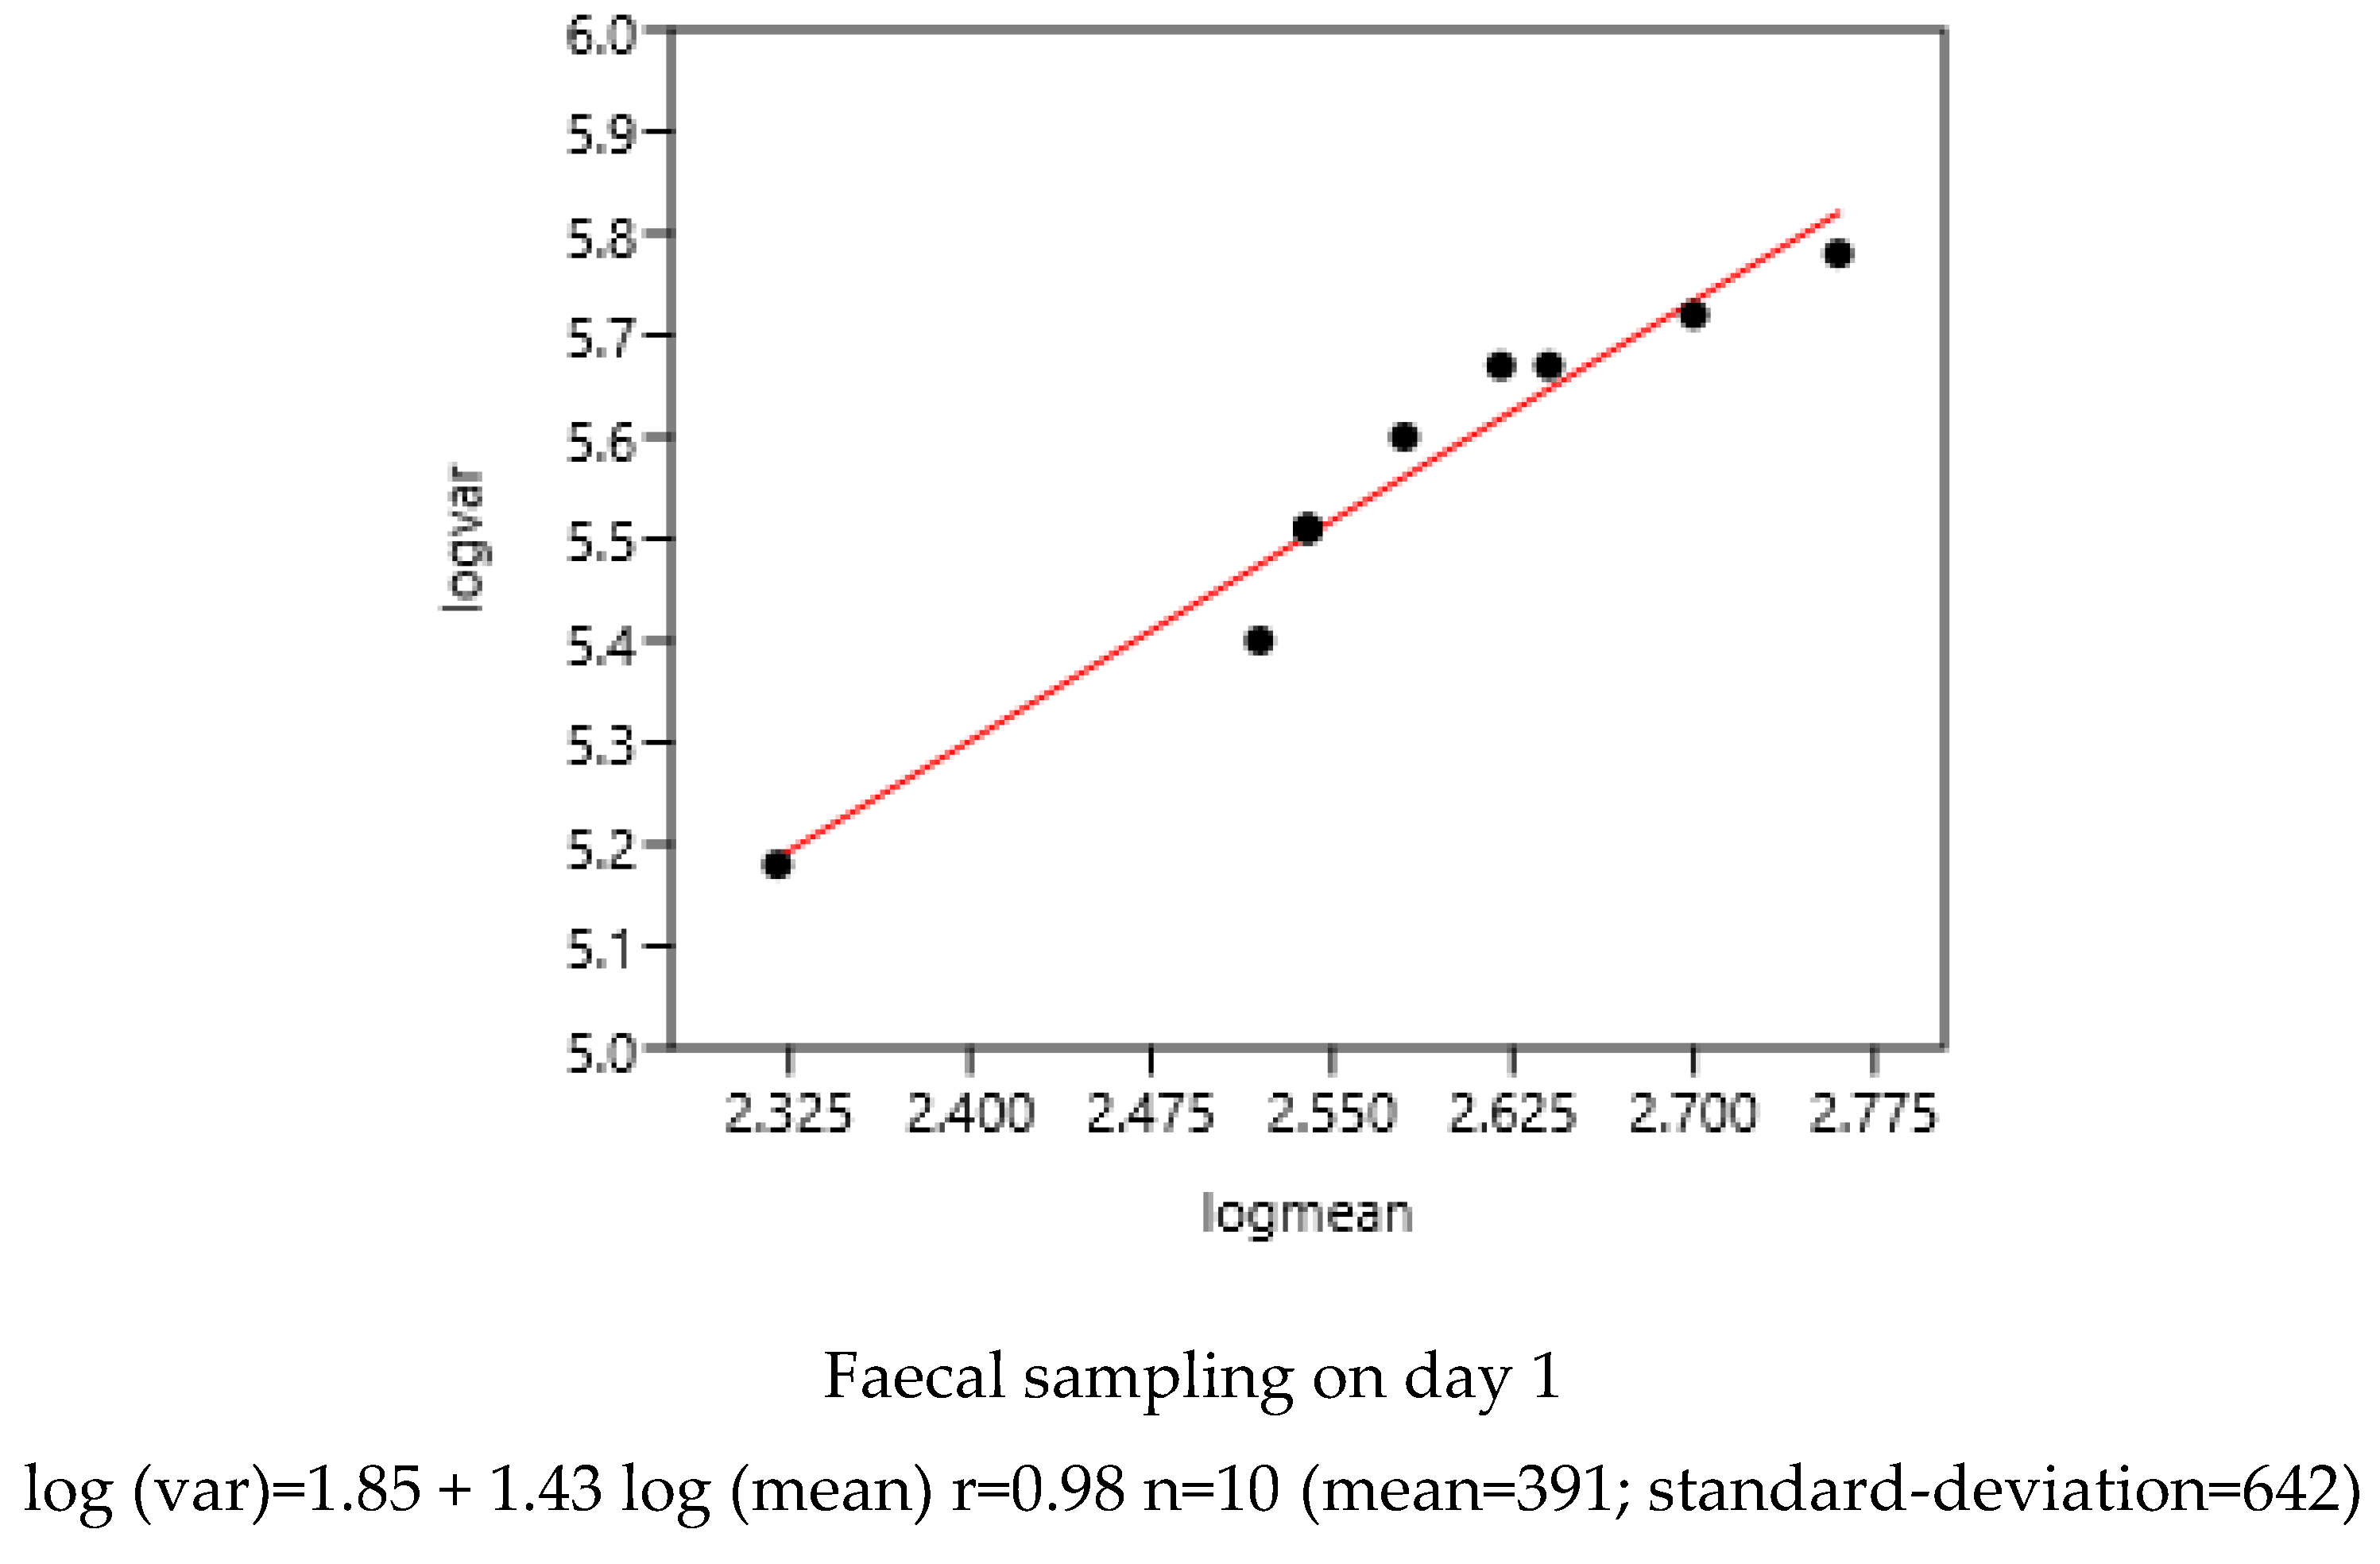
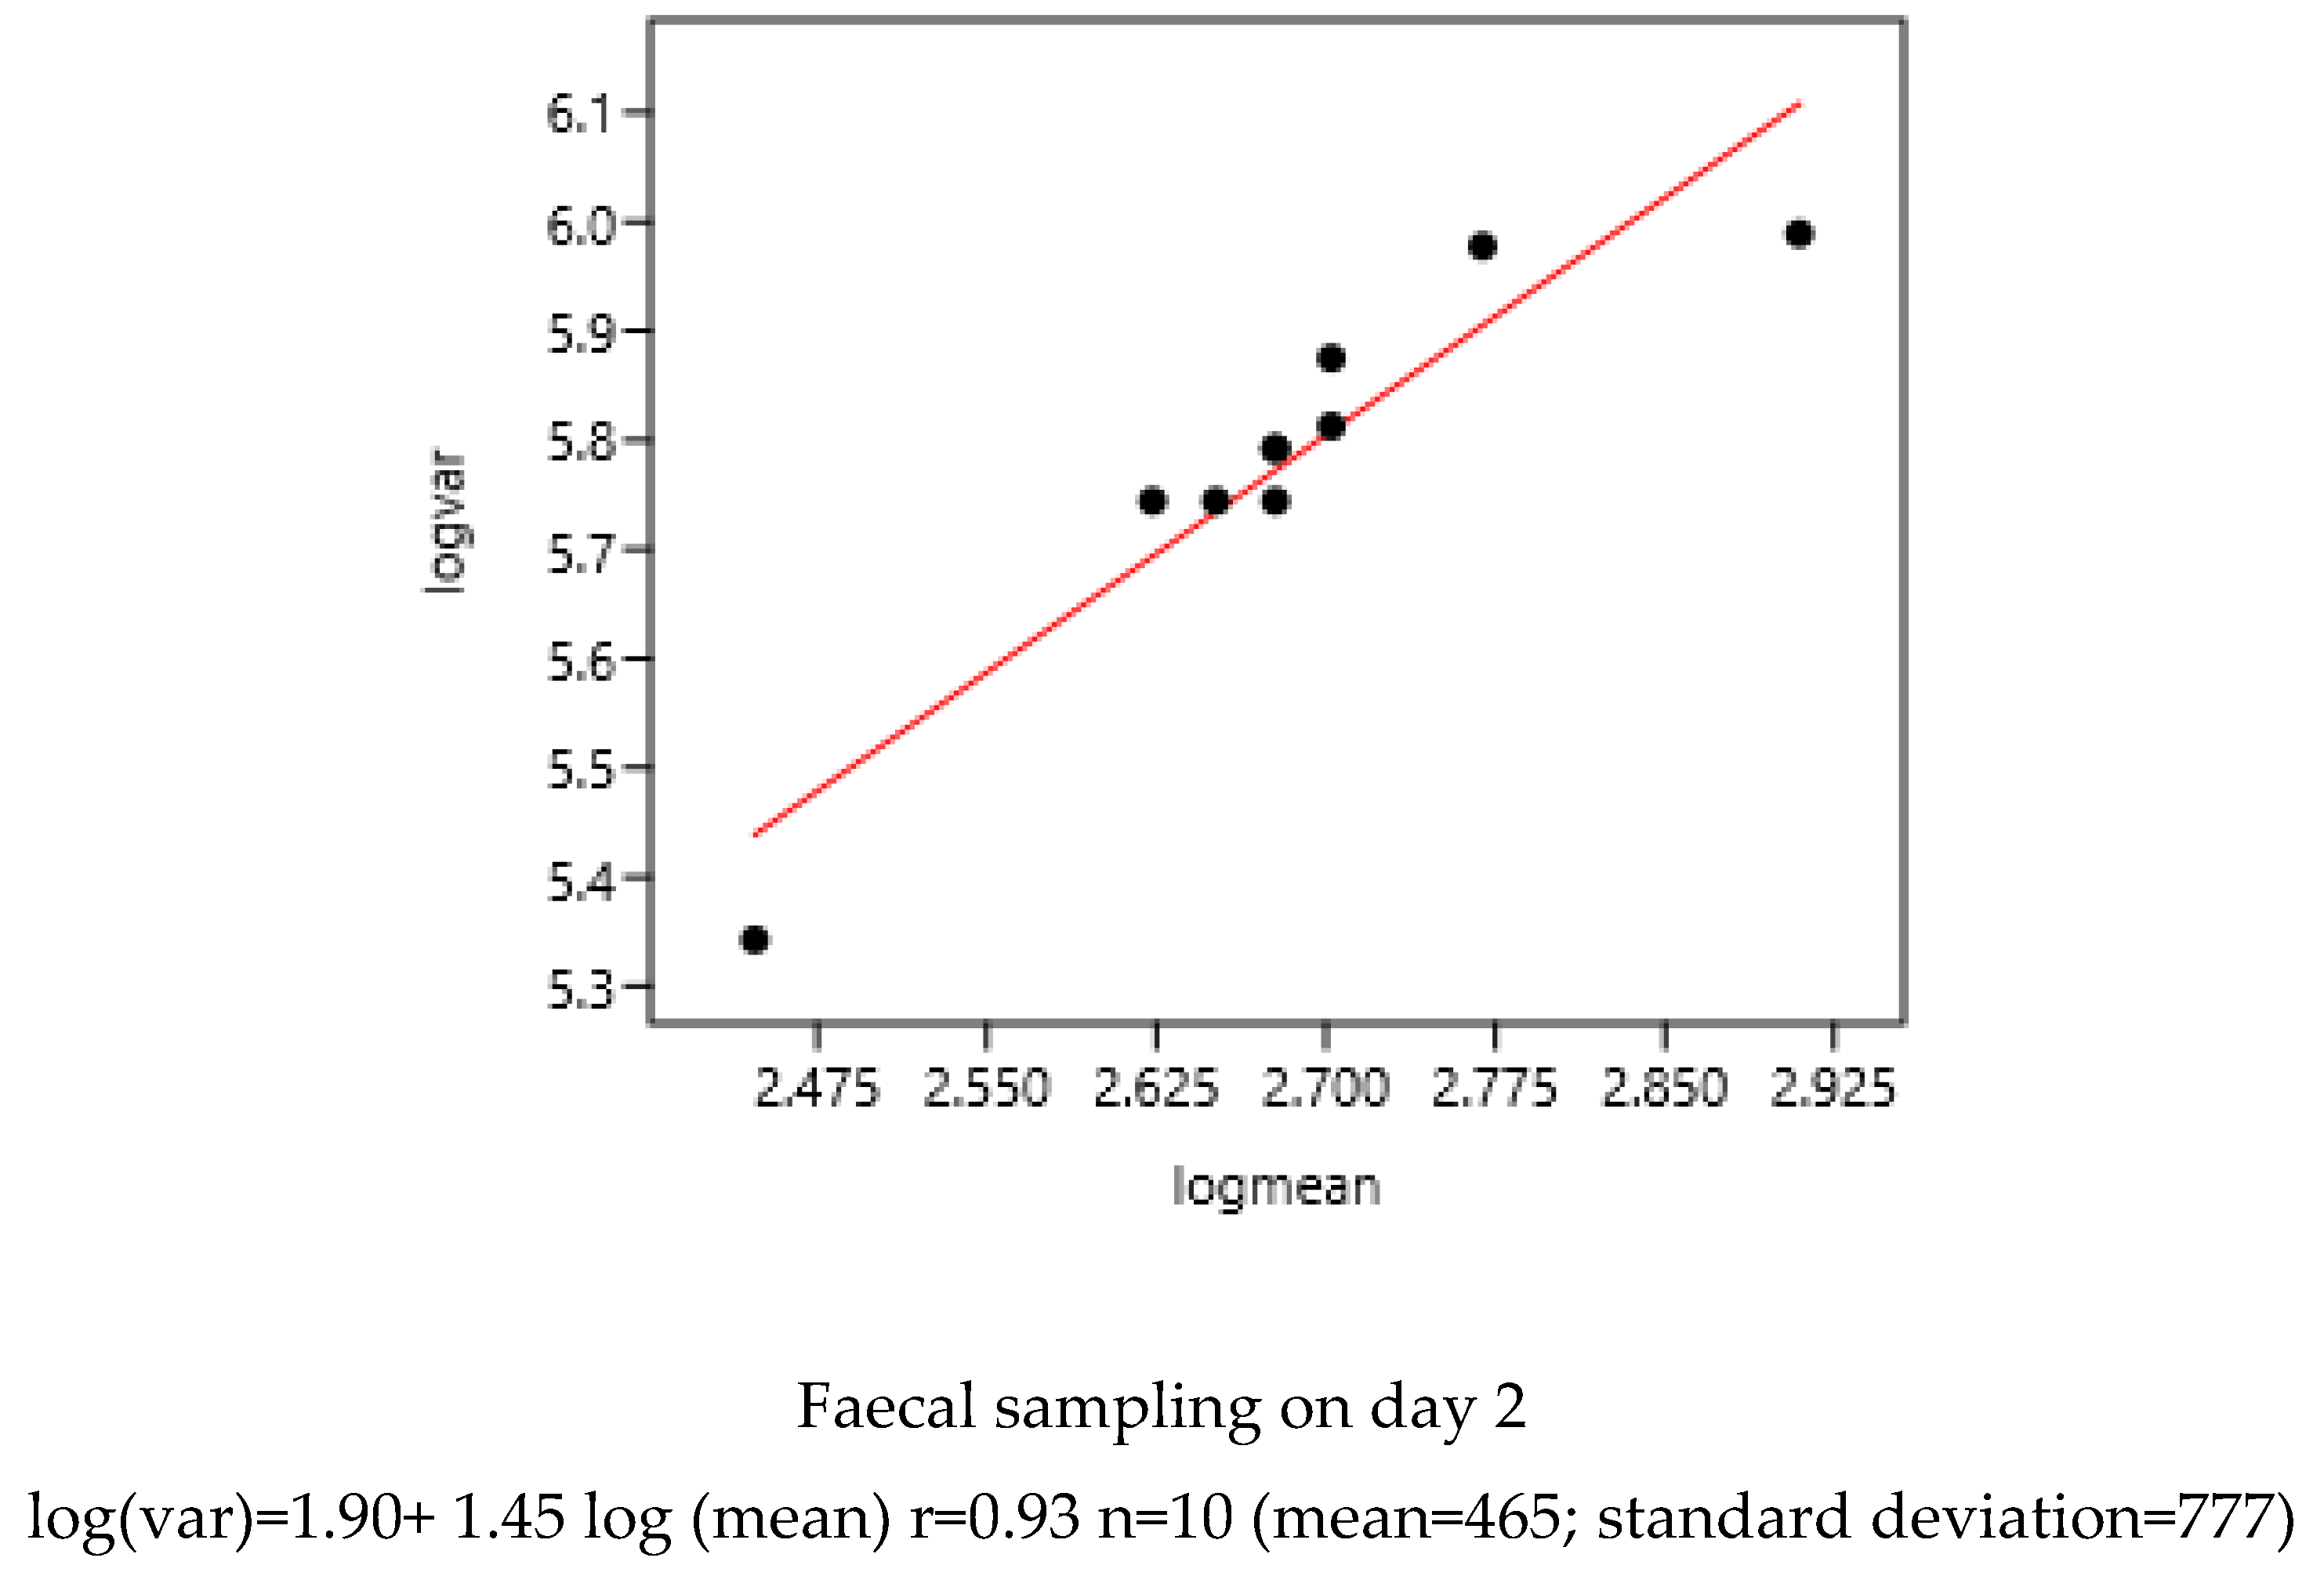
Figure 5.
Relationship between variance and mean among horses (France-2; Mexico-1, 2, 3, 4) and poneys (France-1) before (A) and 90 days after (B) anthelmintic treatment (moxidectin 1-6, ivermectin 7-11, pyrantel 12-13, benzimidazoles 14-18).
Figure 5.
Relationship between variance and mean among horses (France-2; Mexico-1, 2, 3, 4) and poneys (France-1) before (A) and 90 days after (B) anthelmintic treatment (moxidectin 1-6, ivermectin 7-11, pyrantel 12-13, benzimidazoles 14-18).
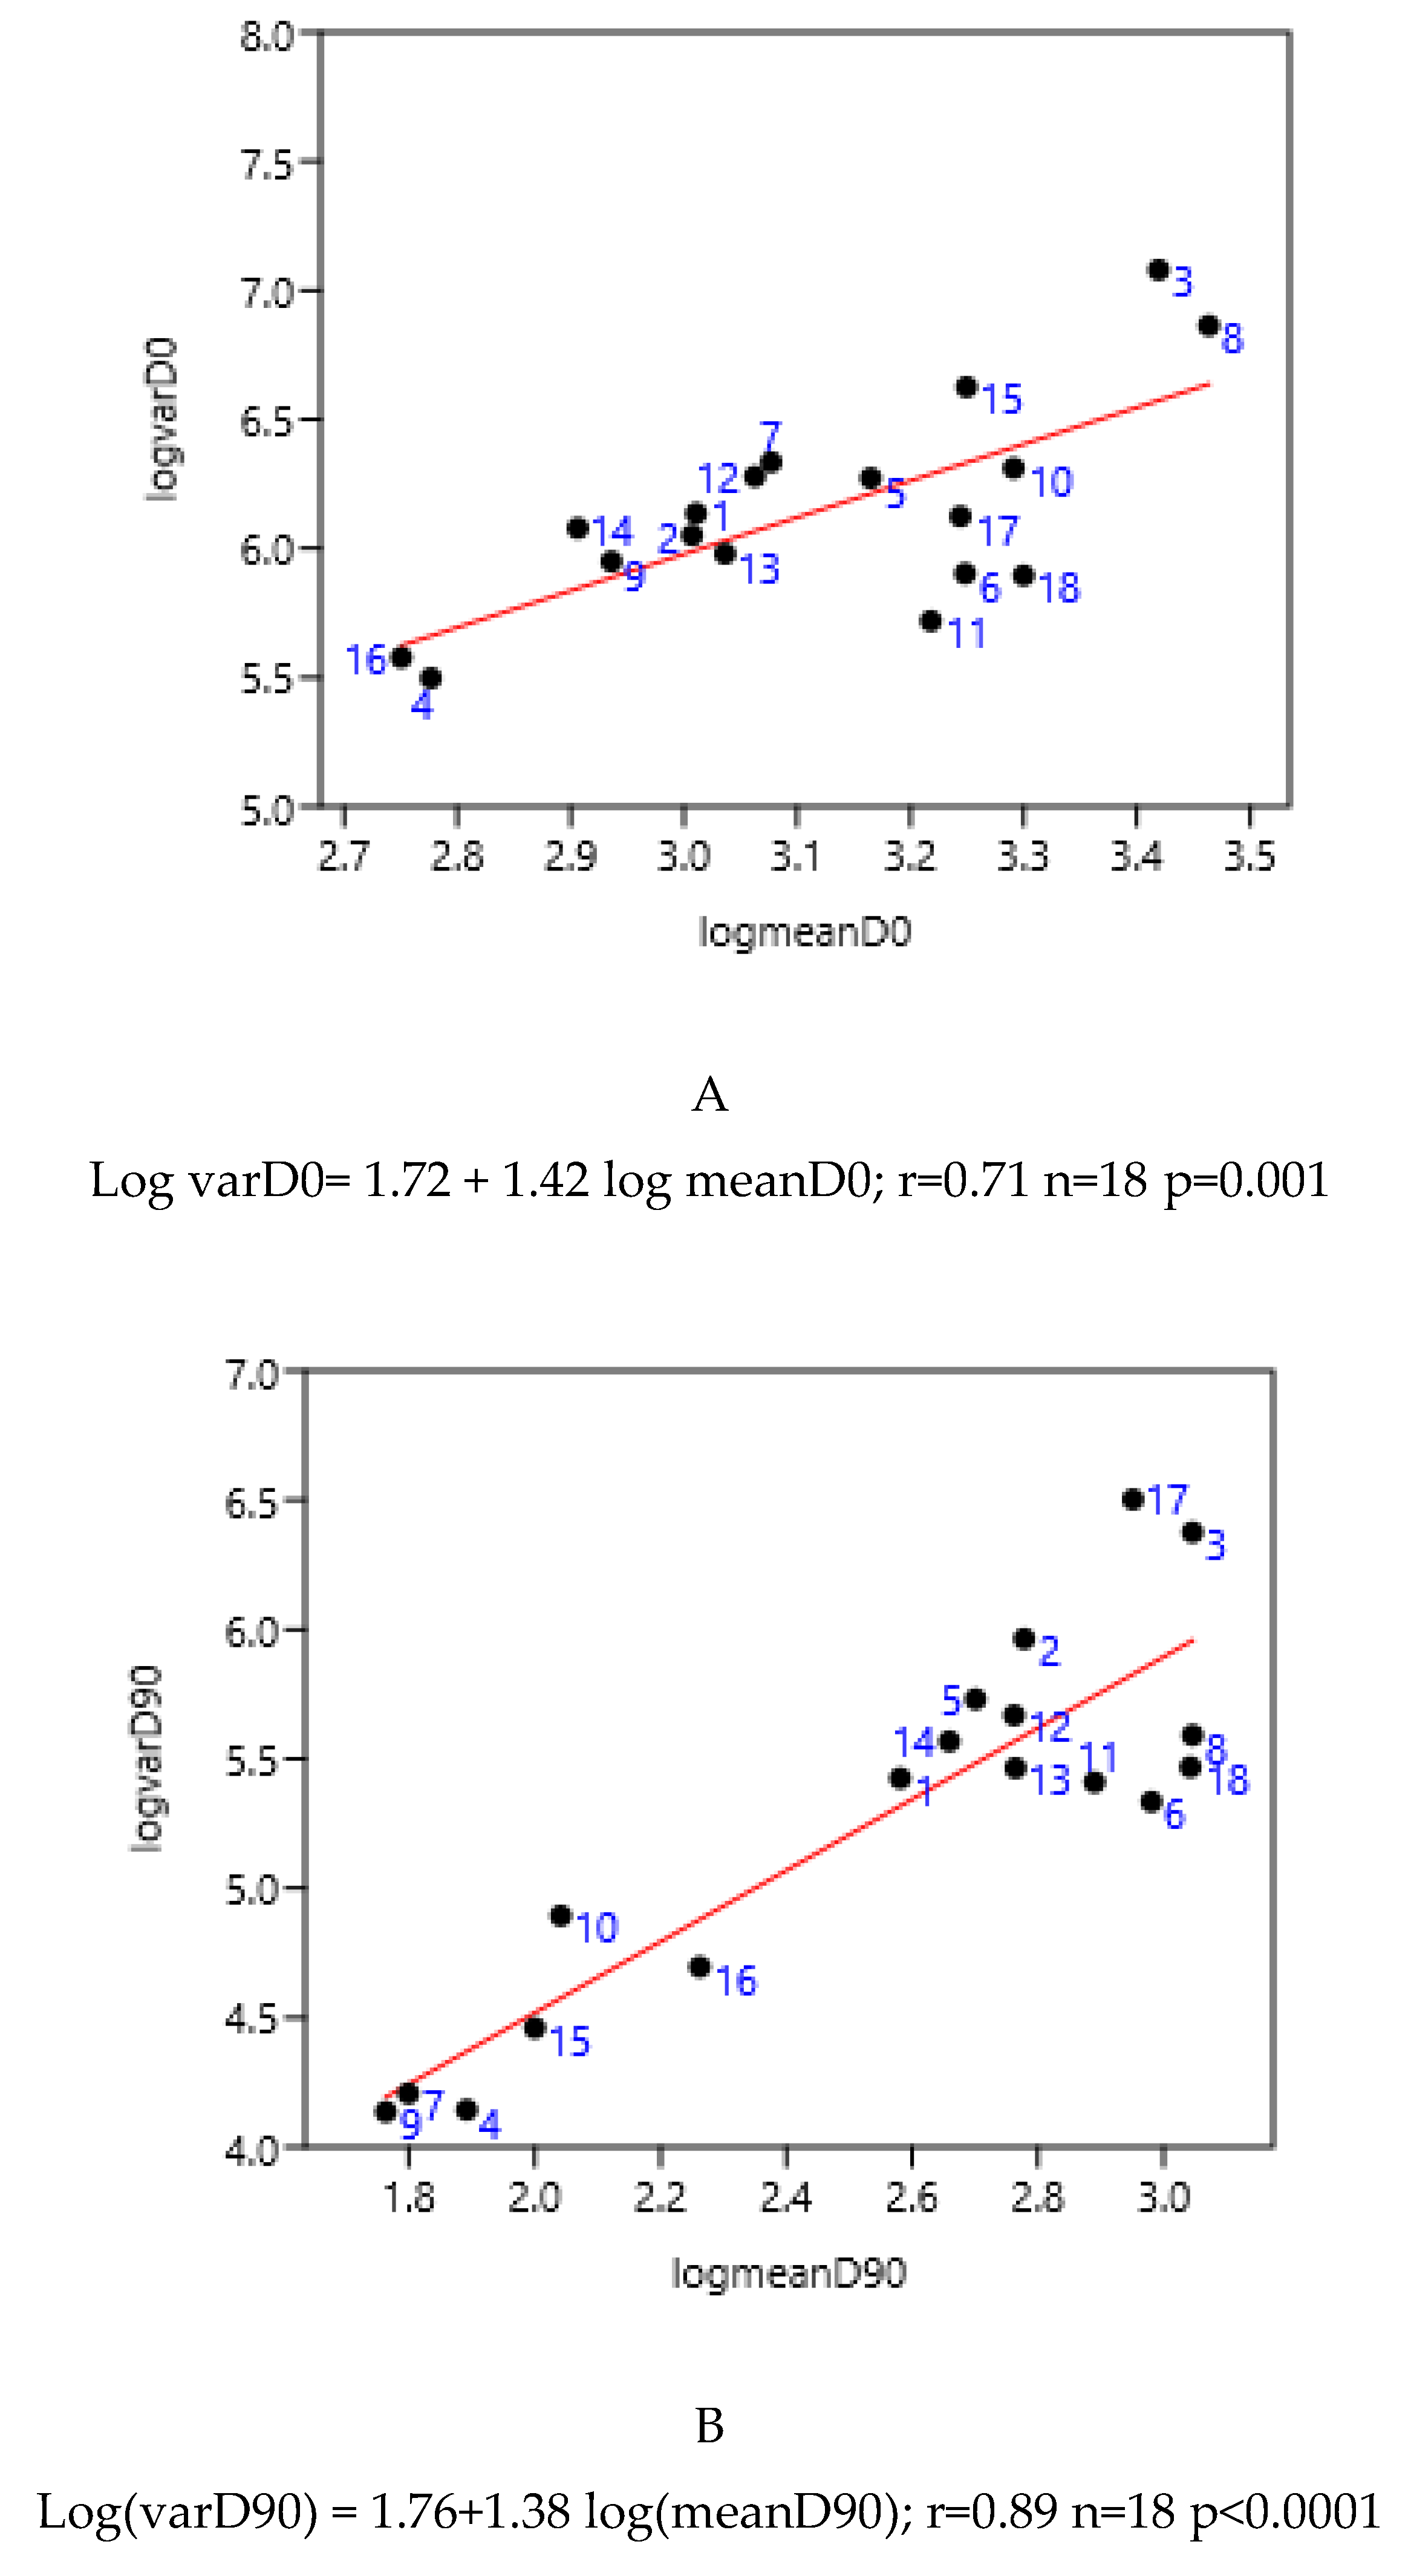
Figure 7.
Exponential relationship between FEC mean (x) of a group of horses and percentage of FEC =0 counts (y).
Figure 7.
Exponential relationship between FEC mean (x) of a group of horses and percentage of FEC =0 counts (y).
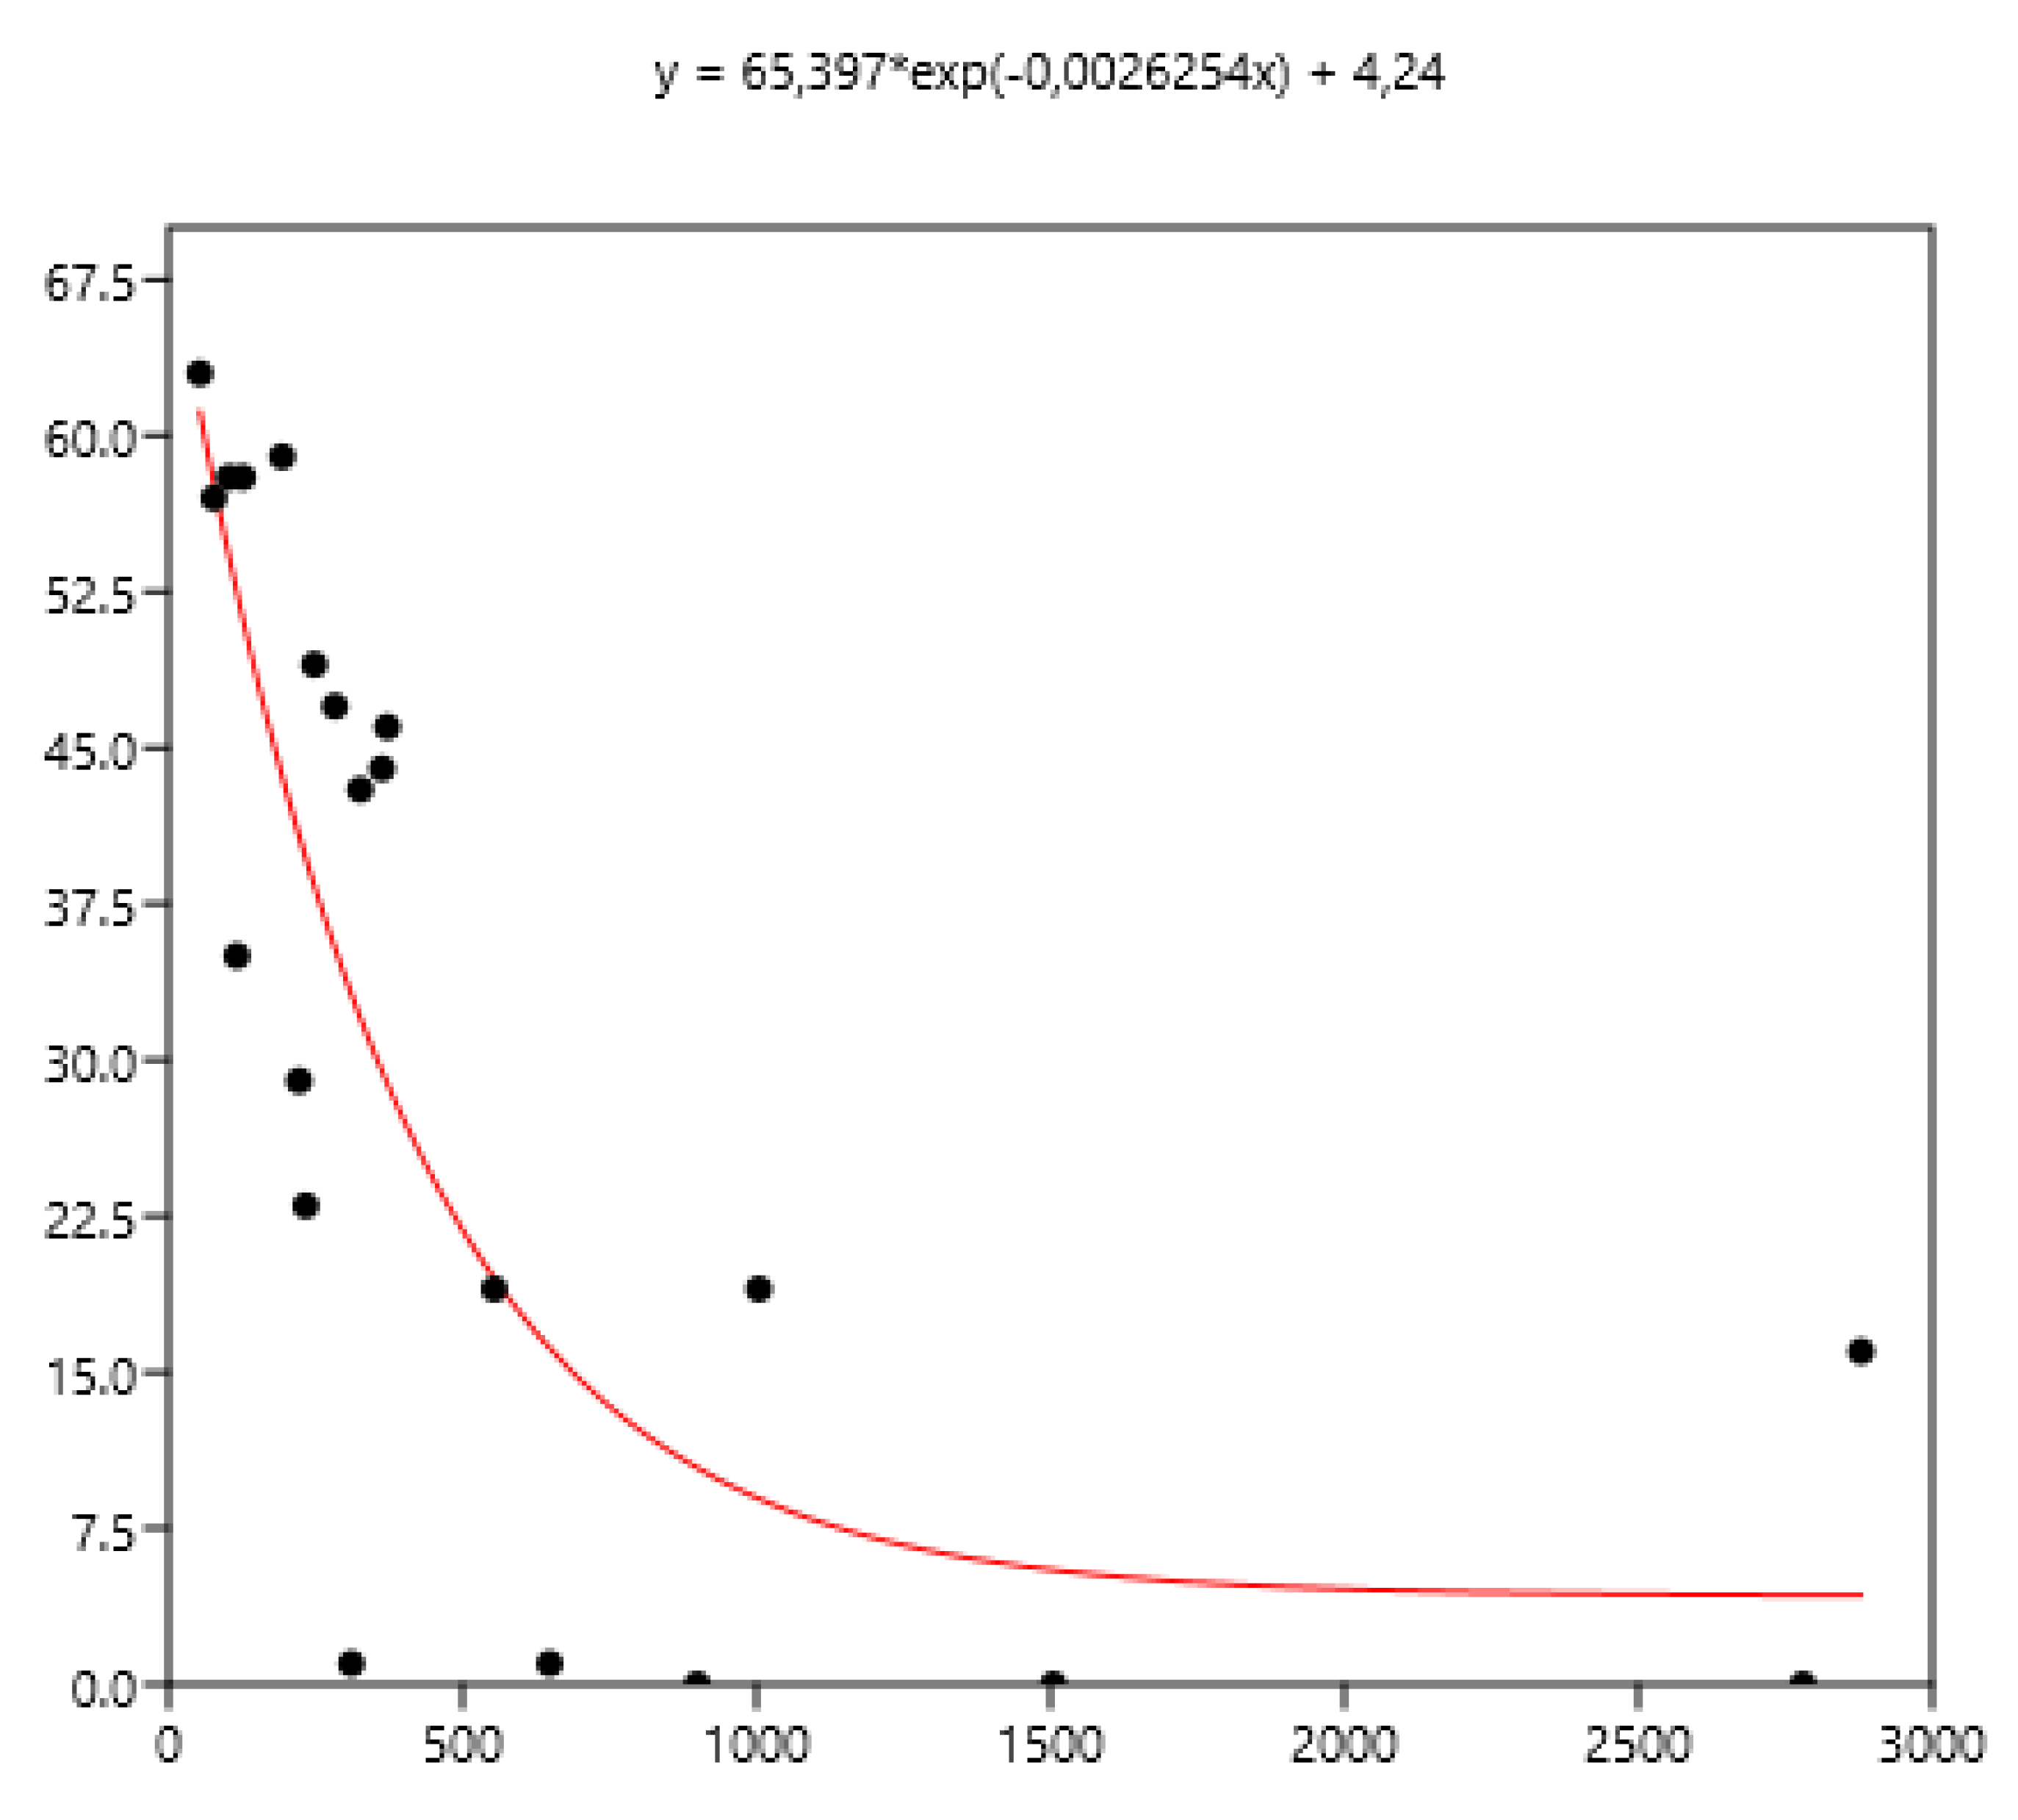
Figure 8.
Power relationship between FEC mean (x) of a group of horses and percentage of FEC counts over 200 (y).
Figure 8.
Power relationship between FEC mean (x) of a group of horses and percentage of FEC counts over 200 (y).
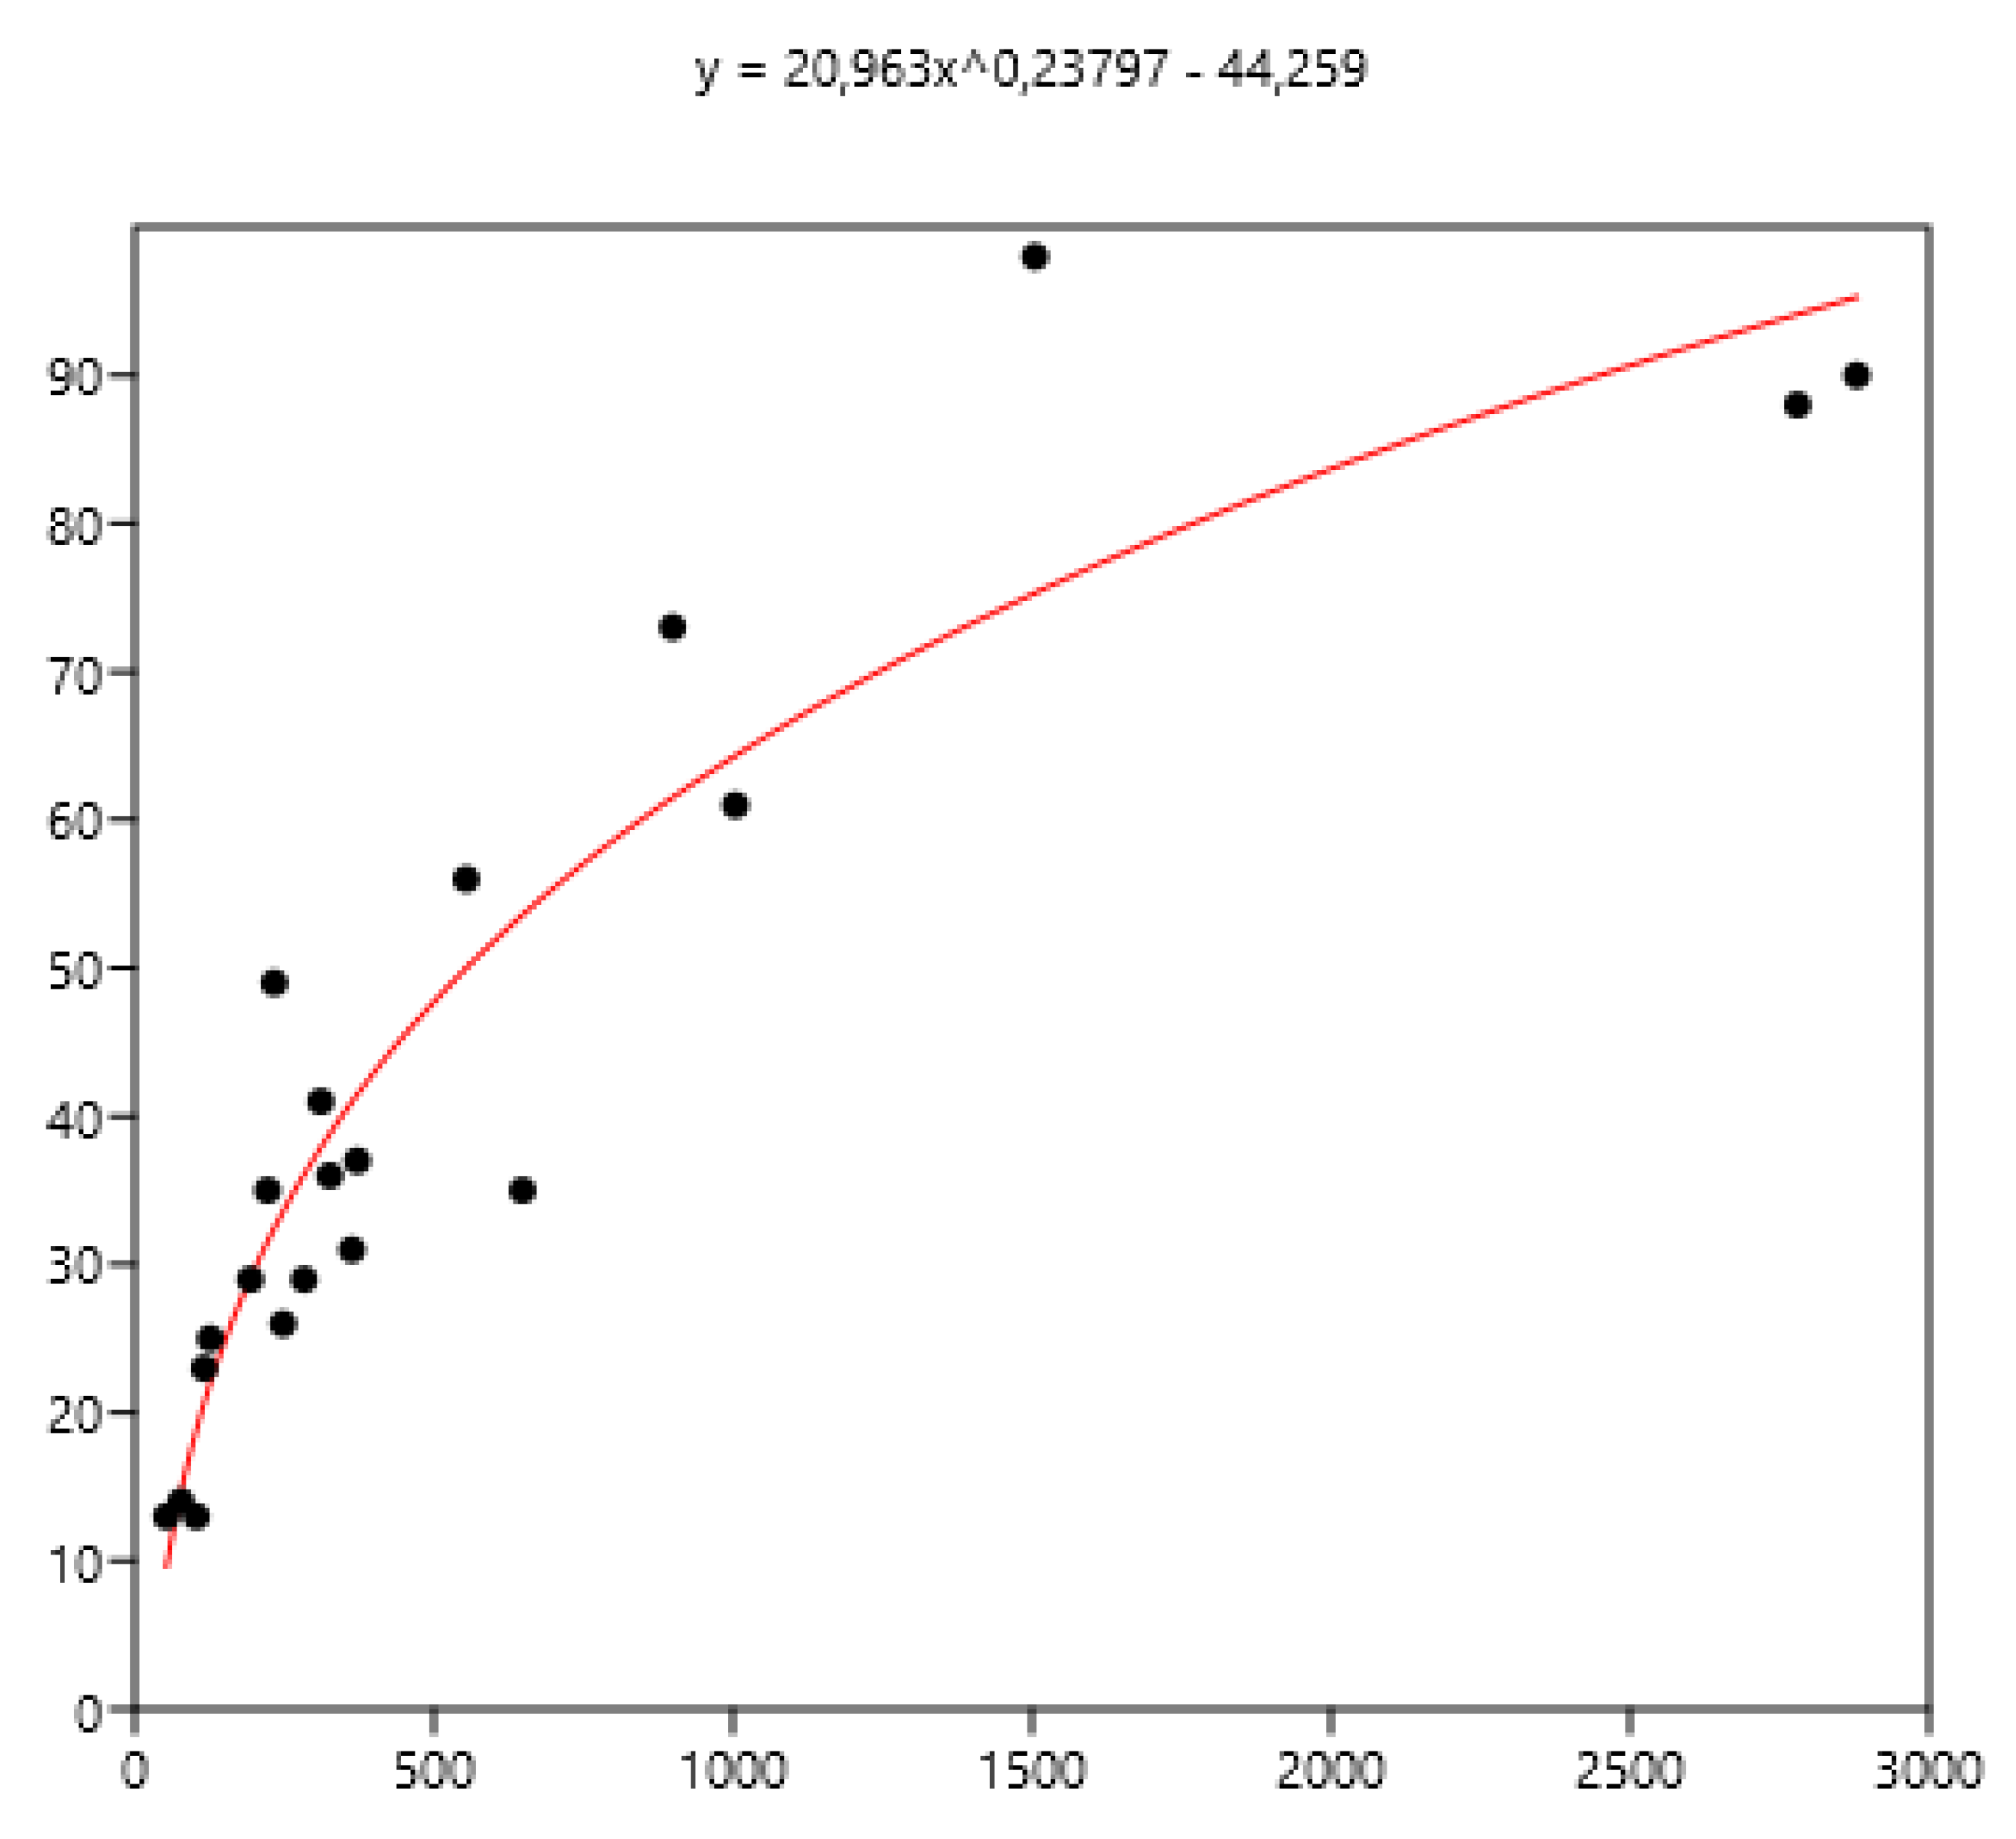
Figure 9.
Power relationship between FEC mean(x) of a group of horses and percentage of FEC counts over 400 (y).
Figure 9.
Power relationship between FEC mean(x) of a group of horses and percentage of FEC counts over 400 (y).
Disclaimer/Publisher’s Note: The statements, opinions and data contained in all publications are solely those of the individual author(s) and contributor(s) and not of MDPI and/or the editor(s). MDPI and/or the editor(s) disclaim responsibility for any injury to people or property resulting from any ideas, methods, instructions or products referred to in the content. |
© 2026 by the authors. Licensee MDPI, Basel, Switzerland. This article is an open access article distributed under the terms and conditions of the Creative Commons Attribution (CC BY) license (http://creativecommons.org/licenses/by/4.0/).
Copyright: This open access article is published under a Creative Commons CC BY 4.0 license, which permit the free download, distribution, and reuse, provided that the author and preprint are cited in any reuse.


