
Submitted:
09 January 2026
Posted:
13 January 2026
You are already at the latest version
Abstract
A flexible paper base SERS substrate with hydrophobic surface was fabricated through a simple route. The Ag nanoparticle was modified on filter paper through in situ growth method. After optimizing the condition during the growth and surface modification process, the hydrophobic filter paper-Ag was prepared via soaking in 10-8 g/ml of 1-Dodecanethiol with 12 h growth time. The flexible SERS substrate exhibit excellent hydrophobic properties, the contact angle of water could achieve 130.2 °. When the solution of analyte was dropped onto the SERS substrate, the diffusion effect was limited. After evaporation, the target analyte was concentrated within a fixed area. The hydrophobic SERS substrate could simultaneously improve the SERS signal and fluorescence of the analyte. The paper base SERS substrate with hydrophobic surface was used for detecting thiram from edible oil, and the sensitivity was down to 10-7 M. We proposed a flexible, economical and green hydrophobic SERS substrate for the detection of harmful ingredient from hydrophobic phase.
Keywords:
hydrophobic
; filter paper
; SERS
; harmful ingredients
; food
1. Introduction
Surface enhanced Raman scattering (SERS) spectroscopy is an important analytical tool [1,2]. SERS method has shown several advantages such as high sensitivity and unique molecular specificity, that was developed in recent decades as the emerged of nanotechnology SERS could provide ultrasensitive information of target down to the single-molecule level [3,4,5]. Thus, SERS was widely applied in analytical chemistry, food safety and biochemical analysis. Currently, there are two widely accepted theories regarding the SERS enhancement mechanism: electromagnetic enhancement (EM) and chemical enhancement (CE) [6,7]. Compared with the chemical enhancement mechanism, the strong electromagnetic field generated near metal nanoparticle (NP) is the fundamental reason for the generation of SERS [8,9]. Therefore, SERS performance mainly relies on ehanced substrates, that was prepared based on metallic nanometarials. The rigid SERS substrate such as glass, silicon and quartz were usually used as support in SERS substrate, that lacked flexibility in some practical applications, which poses significant limitations for analysis and detection of irregular objects [10].
Flexible SERS substrates offer benefits such as flexibility, high activity, and biodegradability, that has attracted great attention. Filter paper was widely used to construct SERS substrate due to its low cost, simplicity, and ease of production [11,12,13,14]. The filter paper was rich with hydroxyl groups because that was composed of cellulose fibers, and special molecule could be easily functionalized on the surface of filter paper. The wrinkle on filter paper enables the formation of "hot spot" for SERS as metallic NPs deposited on surface cellulose fiber [15,16,17]. At present, there are many methods for preparing paper- based SERS substrates by depositing filter paper with metallic NPs, such as in situ synthesis [18,19], inkjet printing [20,21] and self assembly [22,23]. The SERS substrates prepared by these methods exhibit high repeatability and sensitivity. However, the liquid sample was rapidly diffuse when using paper base substrate as the hydrophilicity and rich porosity of paper that would reduce the collection efficiency of the samples at a certain position and further decrease the intensity of Raman spectrum.
To address the issue of excessive hydrophilicity of filter paper SERS substrates, we introduced the concept of hydrophobicity. Recently, there have been many researches on hydrophobic SERS substrate, that have shown unique advantage in detecting low concentrations of target analyte [24,25,26,27]. The significant advantage of hydrophobic SERS substrates is that could reduce the contact area between aqueous droplet and the surface of SERS substrates. Therefore, the number of aqueous target analyte was significantly concentrated on the hydrophobic substrate during the evaporateing process. Li et al. have loaded silver nanoparticles onto a cellulose nanocrystalline skeleton by in situ growth method to prepare cellulose nanocrystalline silver (CNC-Ag) composite, which further coated on the surface of filter paper to form a flexible substrate. The dodecyl mercaptan was employed for treating the surface with hydrophobic feature, and the contact angle could reach to 105 °. The hydrophobic filter paper substrate was successfully used to detect phenylethanolamine A and metronidazole [28]. Nat rcia et al. have fabricated SERS substrate by changing the relative amount of polymer/metal colloidal nanoparticles, the number of printing layers, and the hydrophobicity ,in which the contact angle could achieve to 146 °. In SERS detection of thiram in mineral water and apple juice, the limit of detection could down to 0.024 ppm [29].
In this study, we prepared a simple, inexpensive, and easy-to-operate flexible SERS substrate with hydrophobic feature as shown in Figure 1. Firstly, the silver NPs were densely deposited on the surface of filter paper by seed-mediated in situ growth method. Then, the solution of dodecyl mercaptan were grafted onto the surface of silver NPs. The concentration and soaking time were optimized for the flexible SERS substrate with hydrophobic surface. The hydrophobic feature could effectively prevent random diffusion of the target analyte solution, which not only improve the intensity of Raman spectra but also enhance the fluorescence effect. The flexible SERS substrate with hydrophobic surface was successfully used for detecting melamine and thiram from water. Furthermore, the hydrophobic SERS substrate proposed at here shown excellent performance in detecting target from oil phase compare with the hydrophilic SERS substrate.
2. Experiment
2.1. Chemicals
Ascorbic acid (C6H8O6. AA) and hydrochloric acid (HCl) were supplied by Aladdin (Shanghai, China). Silver nitrate (AgNO3), Rhodamine6G (R6G) and thiram were purchased from Innochem (Beijing, China). Melamine was purchased from the Shanghai Reagent Company. 1-Dodecanethiol was obtained from Alfa Aesar (Shanghai, China). Edible oil was purchased from the local supermarkets.
2.2. Preparation of SERS Substrate
Silver NPs (Ag NPs) were densely deposited onto the surface of filter paper through in situ growth technology. Briefly, soaked filter paper with aqueous solution of SnCl2/HCl (20 mM: 20 mM) for 30 S, After that, the Ag seed was produced in AgNO3 (20 mM) The Ag NPs with bigger size were obtained by soaking filter papaer-Ag seed in mixture of AA and AgNO3. Finally, the filter paper was isolated from the growth media and washed..
2.3. Hydrophobic Treatment
The prepared filter paper SERS substrates were soaked in different concentrations of ethanol solution of 1-Dodecanethiol(10-4,10-6,10-8,10-10,10-12,10-14,10-16,10-18 g/ml) for 12 hours, then washed with ethanol for several times and dried at room temperature to obtain filter paper SERS substrates with hydrophobic feature.
2.4. Sample Preparation and SERS Testing
In the experimental detection, 3 microliters of target analyte solution were dropped onto the hydrophobic surface of filter SERS substrate,, the Raman spectra was measured by a portable Raman spectrometer (BWS465, B&W Tek, USA) with laser at 785 nm.
2.5. Characterization and Analysis
The UV–vis spectra of the composites were measured by Agilent UV-Vis-NIR spectrameter (Agilent USA). The surface morphology of sample were collected from SU8010 scanning electron microscope(SEM) (Hitachi, Japan). Thermo gravimetric analysis(TGA) was developed by Perkin-Elmer(PE USA). ATR-FTIR was measured on Nicolet iS50 infrared instrument. The water contact angle(WCA) test of hydrophobic surface was conducted on DSA100 instrument (KRUSS, Germany).
3. Results and Discussion
3.1. Morphology Characterization
Filter paper SERS substrate was prepared using in situ growth technology. The SEM images of the filter paper are shown in Figure 2a,b, in which the cellulose fiber was observed. When the filter paper soaked in aqueous solution of SnCl2, the Sn2+ was adsorbed onto the surface of the cellulose fiber through its affinity with hydroxyl groups. The cellulose ribon on the surface of filter paper provide the area for the uniform distribution of Ag NPs. The reduction potential value of Sn4+/Sn2+ was 0.151 V and the value is 0.80 V for Ag+/Ag0. Thus, the Ag+ was reduced to Ag and formed nanoseed as encountered with Sn2+. When immersed the filter paper with Ag seed into growth media, the Ag seed was growth to Ag NP with bigger size. SEM image of the Ag NPs distributed on the surface of filter is shown in Figure 2c, in which the size of Ag NPs is distributed within 60-80 nm. In order to obtain hydrophobic surface, the 1-Dodecanethiol was used to modify the surface of Ag NPs through chemical bond between sulfhydryl and Ag. After modified with 1-Dodecanethiol, the morphological image of filter paper substrate is shown in Figure 2d, there is no obvious change compare with the substrate before modification.
3.2. SERS Performance
The filter paper SERS substrate were immersed in ethanol solution of 1-dodecanethiol for different reaction times (6, 8, 10, 12, 14, and 16 hours). The enhancement effect of SERS substrates was evaluated by using R6G as Raman probe molecule. 3 ul R6G was dropped onto the surface of a hydrophobic filter paper-Ag. After drying at air condition the Raman spectra was collected and presented in Figure S1a. Several obvious Raman peaks were observed at 1308 cm-1, 1360 cm-1 and 1508 cm-1, these peaks were assigned to the stretching vibration mode of C-O-C and aromatic C-C groups of R6G [30]. At the initial stage, the 6 h soaking time used in the system, the weak Raman spectra of R6G was obtained, because the Ag NPs were not fully modified by 1-Dodecanethiol. The analyte would diffuse on the surface of SERS substrate with low hydrophobicity, that resulting in a low Raman signal. The Raman signal of R6G were increased as prolong the soaking time, and the soaking time of 12 h provides the highest SERS enhancement effect. From the comparison of Raman intensity of R6G of band at 1360 cm-1from different filter paper SERS substrate (Figure S1b), the substrate soaked in 1-Dodecanethiol for 12 h was observed to shown the best SERS enhancement. The further increasing of soaking time bring the decrease of the Raman signal, that maybe due to the multilayer formed as long soaking time used. The distance between analyte and Ag NPs was increased.
3.3. Hydrophobic Property
As a result of 1-Dodecanethiol is insoluble in water, the dense 1-dodecanethiol coating on the surface of Ag NPs brings a decrease in the affinity between SERS substrate with water molecules and thereby increasing hydrophobicity in comparison to filter paper SERS substrates. For demonstrate the hydrophobicity of filter paper SERS substrates with Ag NPs modified by 1-Dodecanethiol, we dropped 3μL of deionized water onto the SERS substrate. As shown in Figure 3a, the droplets appeared spherical on the surface of the SERS substrate, which is due to the hydrophobic SERS substrate could confine the water drop to minimize the contact area. When the SERS substrate is tilted to a certain angle, dropping deionized water onto its surface, it can be observed that the droplet will naturally fall after contacting the surface, rather than being absorbed or diffused on the surface.
The hydrophobicity of paper-based substrates can also assess by measuring static water contact angles. The contact angle between 90°and 150○ mean hydrophobic surface and contact angle is greater than 150 corresponding to superhydrophobic surface. As shown in Figure 3b, after decorating 1-Dodecanethiol, the filter paper-Ag exhibits the excellent hydrophobic feature with a contact angle of 130.2○. The contact angle of a common hydrophobic solid surface was from 100○ to 120○. Thus, the fabricated SERS substrate modified by 1-Dodecanethiol shows excellent hydrophobicity, which can prevent the rapid absorption and diffusion of aqueous analyte solutions.
3.4. UV-Vis Spectra Analysis of the Substrate
The significant advantage of the SERS substrate prepared through filter paper is that could be cut into any shape during the experimental process. The appearance of the untreated filter paper sample is white, while filter paper-Ag is grayish green. UV-vis spectroscopy is commonly used to study the optical properties of hydrophobic SERS substrates. Due to the localized surface plasmon resonance (LSPR) of Ag NPs, the absorption bands are mainly located between 360 and 420 nm. The size and shape of Ag NPs on the surface of hydrophobic SERS substrate determine the characteristics of LSPR. As shown in the Figure S2, the untreated filter paper sample has no absorption peak, while the hydrophobic SERS substrate has a clear broad peak at 400 nm. This result is consistent with the SEM data.
3.5. FTIR Analysis of the Substrate
As shown in the Figure S3, the surface functional groups of filter paper, filter paper-Ag before and after modified with 1-Dodecanethiol were determine d by ATR infrared spectroscopy. Several obvious absorption peaks were observed at 3332 cm-1, 2902 cm-1 and 1033 cm-1. The peak at 3332 cm-1 is assigned to the stretching vibration of OH, the peak at 2902cm-1 is the stretching vibration of C-H, and the peak at 1033cm-1 is the stretching vibration of C-O-groups [31]. After decorating Ag NPs on the surface of filter paper, there is nearly no difference in ATR spectra compare to the original filter paper. That due to the Ag NPs have no obvious adsorption in IR spectra.After modified with 1-Dodecanethiol, two obvious peaks were measured at 2850 cm-1 and 2920 cm-1. The peak at 2850 cm-1 is due to the symmetric stretching vibration of methylene, and the peak at 2920 cm-1 is due to asymmetric stretching vibration of methylene [32,33]. The obvious methylene group was originate from 1-Dodecanethiol that grafted on the surface of filter paper-Ag. The ATR result further confirm the hydrophobic feature was due to the hydrocarbon chain.
3.6. Thermogravimetric Analysis
The thermal feature of filter paper and hydrophobic filter-Ag SERS substrate were measured by thermogravimetric(TG) analysis, in which the temperature ranged from 30 ℃ to 600 ℃. The TG curves are shown in Figure S4, in which these two materials exhibit similar thermal feature. Obviously weight loss observed at 293 ℃ and 291 ℃ for filter paper and hydrophobic SERS substrate, that was because the decompose of paper. There are significant mass losses observed at 530 ℃ and 488 ℃ corresponding to filter paper and hydrophobic filter SERS substrate. The filter paper is almost complete pyrolysis, and the residual weight of hydrophobic filter-Ag is nearly 2.5 wt%, which belonging to Ag NPs.
3.7. Application of the Hydrophobic SERS Substrate
In order to evaluate the superior property of hydrophobic SERS substrate, 3uL aqueous solution of R6G(10-5 M) were dropped onto the filter paper-Ag before and after grafting 1-Dodecanethiol, respectively. As shown in Figure 4c, there are no fluorescence image observed as the liquid drop was diffused on the common filter paper-Ag. The corresponding SERS spectra as shown in Figure 4a, only weak signal of R6G observed at 10-5 M concentration. In contrast, after grafting 1-Dodecanethiol, the obvious fluorescence of R6G was obtained on the surface of hydrophobic filter paper-Ag (Figure 4d). In that case, the droplet of R6G could stay on the hydrophobic surface of substrate. And the Raman spectra of R6G (10-8 M) could be observed (Figure 4b). The hydrophobic feature of the filter SERS substrate not only enhanced the SERS spectra of target, but also improve the fluorescence visible effect.
3.8. Melamine and Thiram Detection
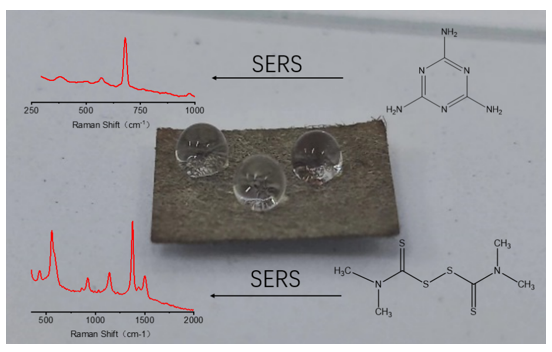
Melamine has been illegally added to dairy products, causing serious damage to the human health[34]. There are pesticide residues in food stuff during the agricultural production, which pose a serious threat to human health[35]. The hydrophobic SERS substrates were used to monitor melamine and thiram at different concentrations. The Raman spectra of melamine measured from hydrophobic SERS substrate is shown in the Figure S5a. The characteristic peak of melamine was observed at 680 cm-1 [36], that attributed to the in-plane deformation mode of triazine ring[37]. The SERS spectra of thiram was shown in Figure S5b, in which several characteristic peak were observed at 559 cm-1, 927 cm-1, 1144 cm-1, 1380 cm-1, and 1503 cm-1. The peak at 559 cm-1 is attributed to the stretching vibration of S-S, while the peak at 1144 cm-1 is attributed to the swinging vibration of CH3 and the stretching vibration of C-N. The peaks at 1380 cm-1and 1503 cm-1 are attributed to the stretching vibration of CH3 and C=N[38]. That results verified that the hydrophobic filter paper SERS substrate could sued for detecting melamine and thiram.
3.9. Sensing Pesticide from Oil Phase
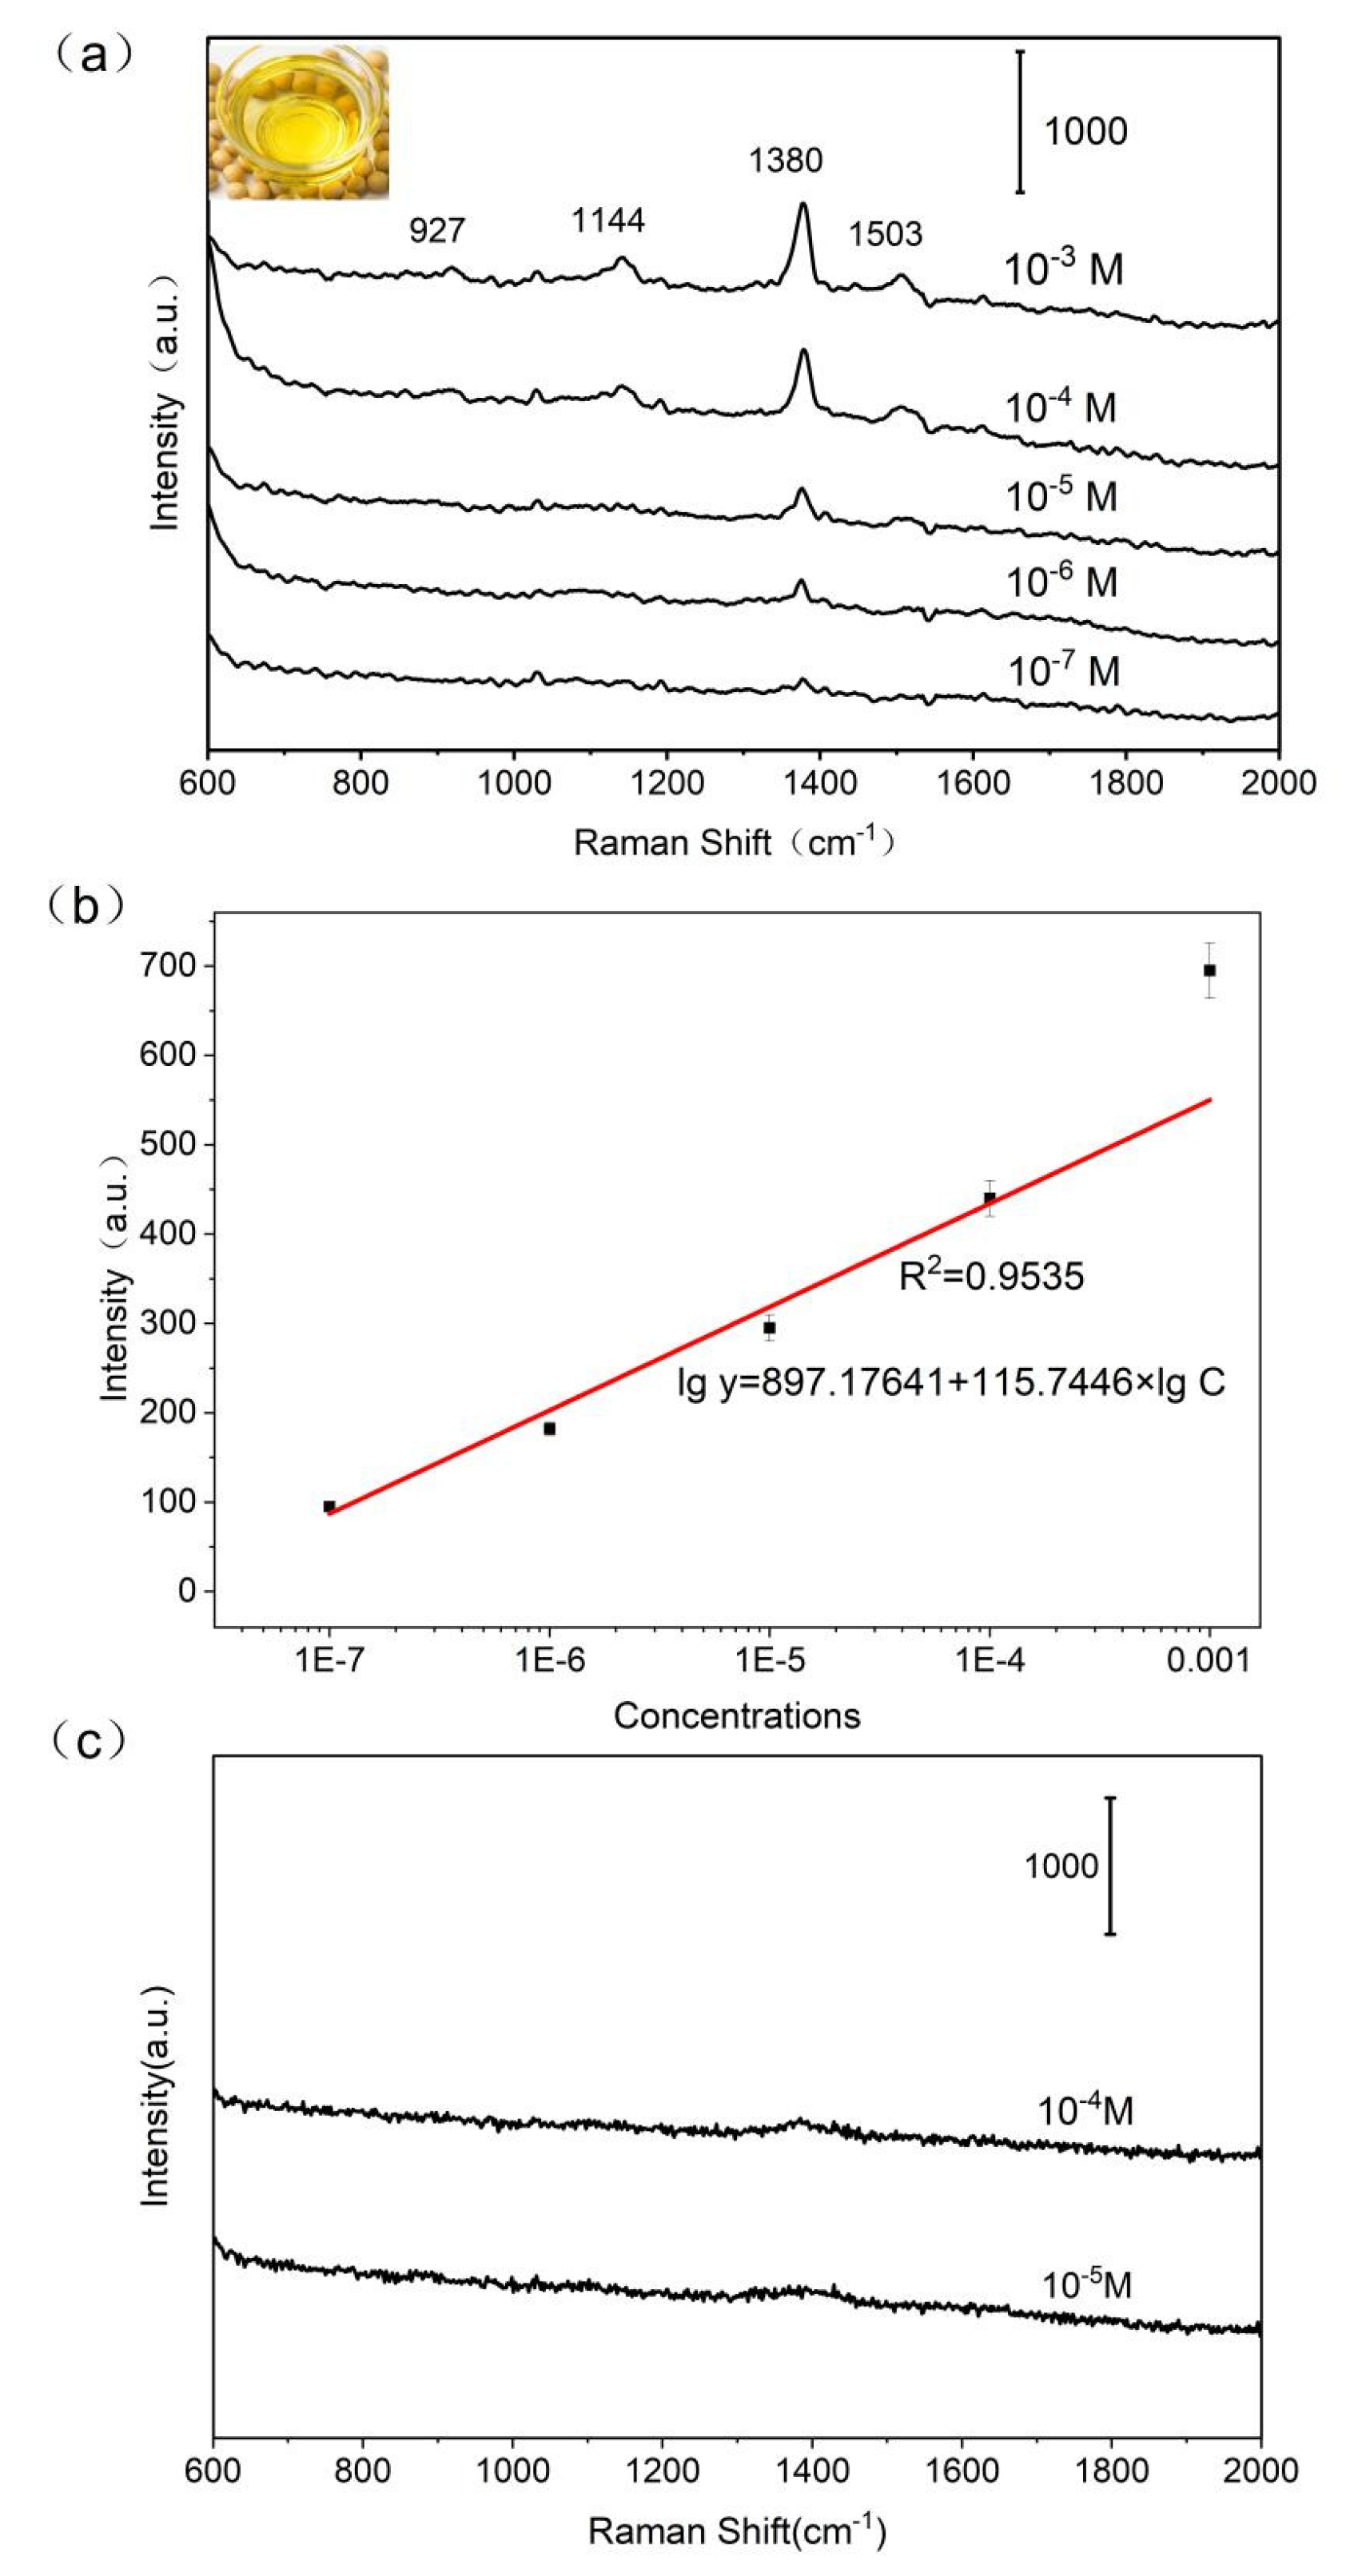
The hydrophobic filter paper-Ag were applied for monitoring pesticide in real food sample. The thiram was artificially added into edible oil, and 3 uL oil sample with different concentration of thiram were dropped onto the surface of hydrophobic filter paper-Ag. The Raman spectra of thiram measured from oil is shown in Figure 5a, in which the characteristic peak of thiram was observed. And the feature band at 1380 cm-1 could still be observed as the concentration down to 10-7 M. In order to detect thiram from oil in quantitative way through Raman spectrum, the curve was built between the concentration of thiram and peak intensity at 1380 cm−1 (Figure 5b) with coefficient of determination (R2) at 0.9535. The filter paper substrate without hydrophobic surface was also used to detect thiram from edible oil, unfortunately, there was no feature peak of thiram was obtained (Figure 5c). Because the phase separation would happen as hydrophobic oil contact with hydrophilic surface of SERS substrate. The two phase prevented the interaction between thiram and plasmonic SERS substrate.
In summary, we proposed a convenient, cost-effective and simple method for fabricating hydrophobic filter paper SERS substrate. The Ag NPs were decorated on the surface of filter paper via in situ growth process, and the 1-Dodecanethiol was grafted onto the surface of filter paper-Ag to prepare hydrophobic filter paper SERS substrate. The contact angle of the hydrophobic filter paper SERS substrate could achieve 130.2○. The hydrophobic feature of the SERS substrate could confine the aqueous sample in certain area, that not not only improve the intensity of Raman spectra but also enhance the fluorescence effect. The concept validation detection of hydrophobic SERS substrate was validated by detecting melamine and thiram in aqueous solution. Furthermore the hydrophobic filter paper SERS substrate was successfully employed for sensing thiram from edible oil, in which the superior performance was obtained compared with the filter paper SERS substrate without hydrophobic surface. The hydrophobic filter paper SERS substrate have a great potential for trace detection in SERS sensing.
Supplementary Materials
The following supporting information can be downloaded at the website of this paper posted on Preprints.org.
Acknowledgments
This study was financially support by International Science and Technology Cooperation Project of Liaoning Province (2024JH2/101900019) and Fushun Revitalization Talents Program (No. FSYC202407002).
Declarations: The authors declare that they have no conflict of interest.
References
- Zhang, S.; Fan, Q.; Guo, J.; Jiao, X.; Kong, X.; Yu, Q. Surface-enhanced Raman spectroscopy tandem with derivatized thin-layer chromatography for ultra-sensitive on-site detection of histamine from fish. Food Control 2022, 138. [Google Scholar] [CrossRef]
- Fu, Z.; Shen, Z.; Fan, Q.; Hao, S.; Wang, Y.; Liu, X.; Tong, X.; Kong, X.; Yang, Z. Preparation of multi-functional magnetic-plasmonic nanocomposite for adsorption and detection of thiram using SERS. J Hazard Mater 2020, 392, 122356. [Google Scholar] [CrossRef] [PubMed]
- Pieczonka, N.P.; Aroca, R.F. Single molecule analysis by surfaced-enhanced Raman scattering. Chem Soc Rev 2008, 37, 946–954. [Google Scholar] [CrossRef]
- Tian, X.; Fan, Q.; Guo, J.; Yu, Q.; Xu, L.; Kong, X. Surface-enhanced Raman scattering of flexible cotton fiber-Ag for rapid adsorption and detection of malachite green in fish. Spectrochim Acta A Mol Biomol Spectrosc 2021, 263, 120174. [Google Scholar] [CrossRef] [PubMed]
- Yang, X.; Gu, C.; Qian, F.; Li, Y.; Zhang, J.Z. Highly sensitive detection of proteins and bacteria in aqueous solution using surface-enhanced Raman scattering and optical fibers. Anal Chem 2011, 83, 5888–5894. [Google Scholar] [CrossRef]
- Ricci, M.; Becucci, M.; Castellucci, E.M. Chemical enhancement in the SERS spectra of indigo: DFT calculation of the Raman spectra of indigo-Ag14 complexes. Vibrational Spectroscopy 2019, 100, 159–166. [Google Scholar] [CrossRef]
- Wang, Y.; Liu, Q.; Sun, Y.; Wang, R. Magnetic field modulated SERS enhancement of CoPt hollow nanoparticles with sizes below 10 nm. Nanoscale 2018, 10, 12650–12656. [Google Scholar] [CrossRef]
- Stiles, P.L.; Dieringer, J.A.; Shah, N.C.; Van Duyne, R.P. Surface-enhanced Raman spectroscopy. Annu Rev Anal Chem (Palo Alto Calif) 2008, 1, 601–626. [Google Scholar] [CrossRef] [PubMed]
- Chen, C.; Hutchison, J.A.; Clemente, F.; Kox, R.; Uji, I.H.; Hofkens, J.; Lagae, L.; Maes, G.; Borghs, G.; Van Dorpe, P. Direct evidence of high spatial localization of hot spots in surface-enhanced Raman scattering. Angew Chem Int Ed Engl 2009, 48, 9932–9935. [Google Scholar] [CrossRef]
- Liu, S.; Cui, R.; Ma, Y.; Yu, Q.; Kannegulla, A.; Wu, B.; Fan, H.; Wang, A.X.; Kong, X. Plasmonic cellulose textile fiber from waste paper for BPA sensing by SERS. Spectrochim Acta A Mol Biomol Spectrosc 2020, 227, 117664. [Google Scholar] [CrossRef]
- Li, D.; Duan, H.; Ma, Y.; Deng, W. Headspace-Sampling Paper-Based Analytical Device for Colorimetric/Surface-Enhanced Raman Scattering Dual Sensing of Sulfur Dioxide in Wine. Analytical Chemistry 2018, 90, 5719–5727. [Google Scholar] [CrossRef]
- Li, D.; Ma, Y.; Duan, H.; Deng, W.; Li, D. Griess reaction-based paper strip for colorimetric/fluorescent/SERS triple sensing of nitrite. Biosens Bioelectron 2018, 99, 389–398. [Google Scholar] [CrossRef]
- Reokrungruang, P.; Chatnuntawech, I.; Dharakul, T.; Bamrungsap, S. A simple paper-based surface enhanced Raman scattering (SERS) platform and magnetic separation for cancer screening. Sensors and Actuators B: Chemical 2019, 285, 462–469. [Google Scholar] [CrossRef]
- Wang, J.; Huang, L.; Zhai, L.; Yuan, L.; Zhao, L.; Zhang, W.; Shan, D.; Hao, A.; Feng, X.; Zhu, J. Hot spots engineering in hierarchical silver nanocap array for surface-enhanced Raman scattering. Applied Surface Science 2012, 261, 605–609. [Google Scholar] [CrossRef]
- Luo, W.; Chen, M.; Hao, N.; Huang, X.; Zhao, X.; Zhu, Y.; Yang, H.; Chen, X. In situ synthesis of gold nanoparticles on pseudo-paper films as flexible SERS substrate for sensitive detection of surface organic residues. Talanta 2019, 197, 225–233. [Google Scholar] [CrossRef]
- Ogundare, S.A.; van Zyl, W.E. Amplification of SERS “hot spots” by silica clustering in a silver-nanoparticle/nanocrystalline-cellulose sensor applied in malachite green detection. Colloids and Surfaces A: Physicochemical and Engineering Aspects 2019, 570, 156–164. [Google Scholar] [CrossRef]
- Zong, C.; Xu, M.; Xu, L.J.; Wei, T.; Ma, X.; Zheng, X.S.; Hu, R.; Ren, B. Surface-Enhanced Raman Spectroscopy for Bioanalysis: Reliability and Challenges. Chem Rev 2018, 118, 4946–4980. [Google Scholar] [CrossRef]
- Tian, X.; Zhai, P.; Guo, J.; Yu, Q.; Xu, L.; Yu, X.; Wang, R.; Kong, X. Fabrication of plasmonic cotton gauze-Ag composite as versatile SERS substrate for detection of pesticides residue. Spectrochim Acta A Mol Biomol Spectrosc 2021, 257, 119766. [Google Scholar] [CrossRef]
- Lafuente, M.; Pellejero, I.; Clemente, A.; Urbiztondo, M.A.; Mallada, R.; Reinoso, S.; Pina, M.P.; Gandia, L.M. In Situ Synthesis of SERS-Active Au@POM Nanostructures in a Microfluidic Device for Real-Time Detection of Water Pollutants. ACS Appl Mater Interfaces 2020, 12, 36458–36467. [Google Scholar] [CrossRef]
- Weng, G.; Yang, Y.; Zhao, J.; Li, J.; Zhu, J.; Zhao, J. Improving the SERS enhancement and reproducibility of inkjet-printed Au NP paper substrates by second growth of Ag nanoparticles. Materials Chemistry and Physics 2020, 253. [Google Scholar] [CrossRef]
- Weng, G.; Yang, Y.; Zhao, J.; Zhu, J.; Li, J.; Zhao, J. Preparation and SERS performance of Au NP/paper strips based on inkjet printing and seed mediated growth: The effect of silver ions. Solid State Communications 2018, 272, 67–73. [Google Scholar] [CrossRef]
- Chao, B.-K.; Cheng, H.-H.; Nien, L.-W.; Chen, M.-J.; Nagao, T.; Li, J.-H.; Hsueh, C.-H. Anti-reflection textured structures by wet etching and island lithography for surface-enhanced Raman spectroscopy. Applied Surface Science 2015, 357, 615–621. [Google Scholar] [CrossRef]
- Sun, X.; Wang, N.; Li, H. Deep etched porous Si decorated with Au nanoparticles for surface-enhanced Raman spectroscopy (SERS). Applied Surface Science 2013, 284, 549–555. [Google Scholar] [CrossRef]
- Kim, A.; Barcelo, S.J.; Williams, R.S.; Li, Z. Melamine sensing in milk products by using surface enhanced Raman scattering. Anal Chem 2012, 84, 9303–9309. [Google Scholar] [CrossRef]
- Mulvihill, M.; Tao, A.; Benjauthrit, K.; Arnold, J.; Yang, P. Surface-enhanced Raman spectroscopy for trace arsenic detection in contaminated water. Angew Chem Int Ed Engl 2008, 47, 6456–6460. [Google Scholar] [CrossRef] [PubMed]
- Qian, X.M.; Nie, S.M. Single-molecule and single-nanoparticle SERS: from fundamental mechanisms to biomedical applications. Chem Soc Rev 2008, 37, 912–920. [Google Scholar] [CrossRef]
- Lee, H.K.; Lee, Y.H.; Zhang, Q.; Phang, I.Y.; Tan, J.M.; Cui, Y.; Ling, X.Y. Superhydrophobic surface-enhanced Raman scattering platform fabricated by assembly of Ag nanocubes for trace molecular sensing. ACS Appl Mater Interfaces 2013, 5, 11409–11418. [Google Scholar] [CrossRef]
- Xian, L.; You, R.; Lu, D.; Wu, C.; Feng, S.; Lu, Y. Surface-modified paper-based SERS substrates for direct-droplet quantitative determination of trace substances. Cellulose 2019, 27, 1483–1495. [Google Scholar] [CrossRef]
- Martins, N.C.T.; Fateixa, S.; Fernandes, T.; Nogueira, H.I.S.; Trindade, T. Inkjet Printing of Ag and Polystyrene Nanoparticle Emulsions for the One-Step Fabrication of Hydrophobic Paper-Based Surface-Enhanced Raman Scattering Substrates. ACS Applied Nano Materials 2021, 4, 4484–4495. [Google Scholar] [CrossRef]
- Kong, X.-M.; Reza, M.; Ma, Y.-B.; Hinestroza, J.-P.; Ahvenniemi, E.; Vuorinen, T. Assembly of metal nanoparticles on regenerated fibers from wood sawdust and de-inked pulp: flexible substrates for surface enhanced Raman scattering (SERS) applications. Cellulose 2015, 22, 3645–3655. [Google Scholar] [CrossRef]
- Abdelhamid, H.N.; Mathew, A.P. In-situ growth of zeolitic imidazolate frameworks into a cellulosic filter paper for the reduction of 4-nitrophenol. Carbohydr Polym 2021, 274, 118657. [Google Scholar] [CrossRef]
- Alzate-Sánchez, D.M.; Smith, B.J.; Alsbaiee, A.; Hinestroza, J.P.; Dichtel, W.R. Cotton Fabric Functionalized with a β-Cyclodextrin Polymer Captures Organic Pollutants from Contaminated Air and Water. Chemistry of Materials 2016, 28, 8340–8346. [Google Scholar] [CrossRef]
- Kong, X.; Du, X. In Situ IRRAS Studies of Molecular Recognition of Barbituric Acid Lipids to Melamine at the Air–Water Interface. The Journal of Physical Chemistry B 2011, 115, 13191–13198. [Google Scholar] [CrossRef] [PubMed]
- Sun, F.; Ma, W.; Xu, L.; Zhu, Y.; Liu, L.; Peng, C.; Wang, L.; Kuang, H.; Xu, C. Analytical methods and recent developments in the detection of melamine. TrAC Trends in Analytical Chemistry 2010, 29, 1239–1249. [Google Scholar] [CrossRef]
- Guo, P.; Sikdar, D.; Huang, X.; Si, K.J.; Xiong, W.; Gong, S.; Yap, L.W.; Premaratne, M.; Cheng, W. Plasmonic core-shell nanoparticles for SERS detection of the pesticide thiram: size- and shape-dependent Raman enhancement. Nanoscale 2015, 7, 2862–2868. [Google Scholar] [CrossRef] [PubMed]
- Zhang, C.; You, T.; Yang, N.; Gao, Y.; Jiang, L.; Yin, P. Hydrophobic paper-based SERS platform for direct-droplet quantitative determination of melamine. Food Chem 2019, 287, 363–368. [Google Scholar] [CrossRef]
- Wang, R.; Xu, Y.; Wang, R.; Wang, C.; Zhao, H.; Zheng, X.; Liao, X.; Cheng, L. A microfluidic chip based on an ITO support modified with Ag-Au nanocomposites for SERS based determination of melamine. Microchimica Acta 2016, 184, 279–287. [Google Scholar] [CrossRef]
- Zhu, Y.; Li, M.; Yu, D.; Yang, L. A novel paper rag as 'D-SERS' substrate for detection of pesticide residues at various peels. Talanta 2014, 128, 117–124. [Google Scholar] [CrossRef]
Figure 1.
Fabricating and applying the hydrophobic SERS sensor.
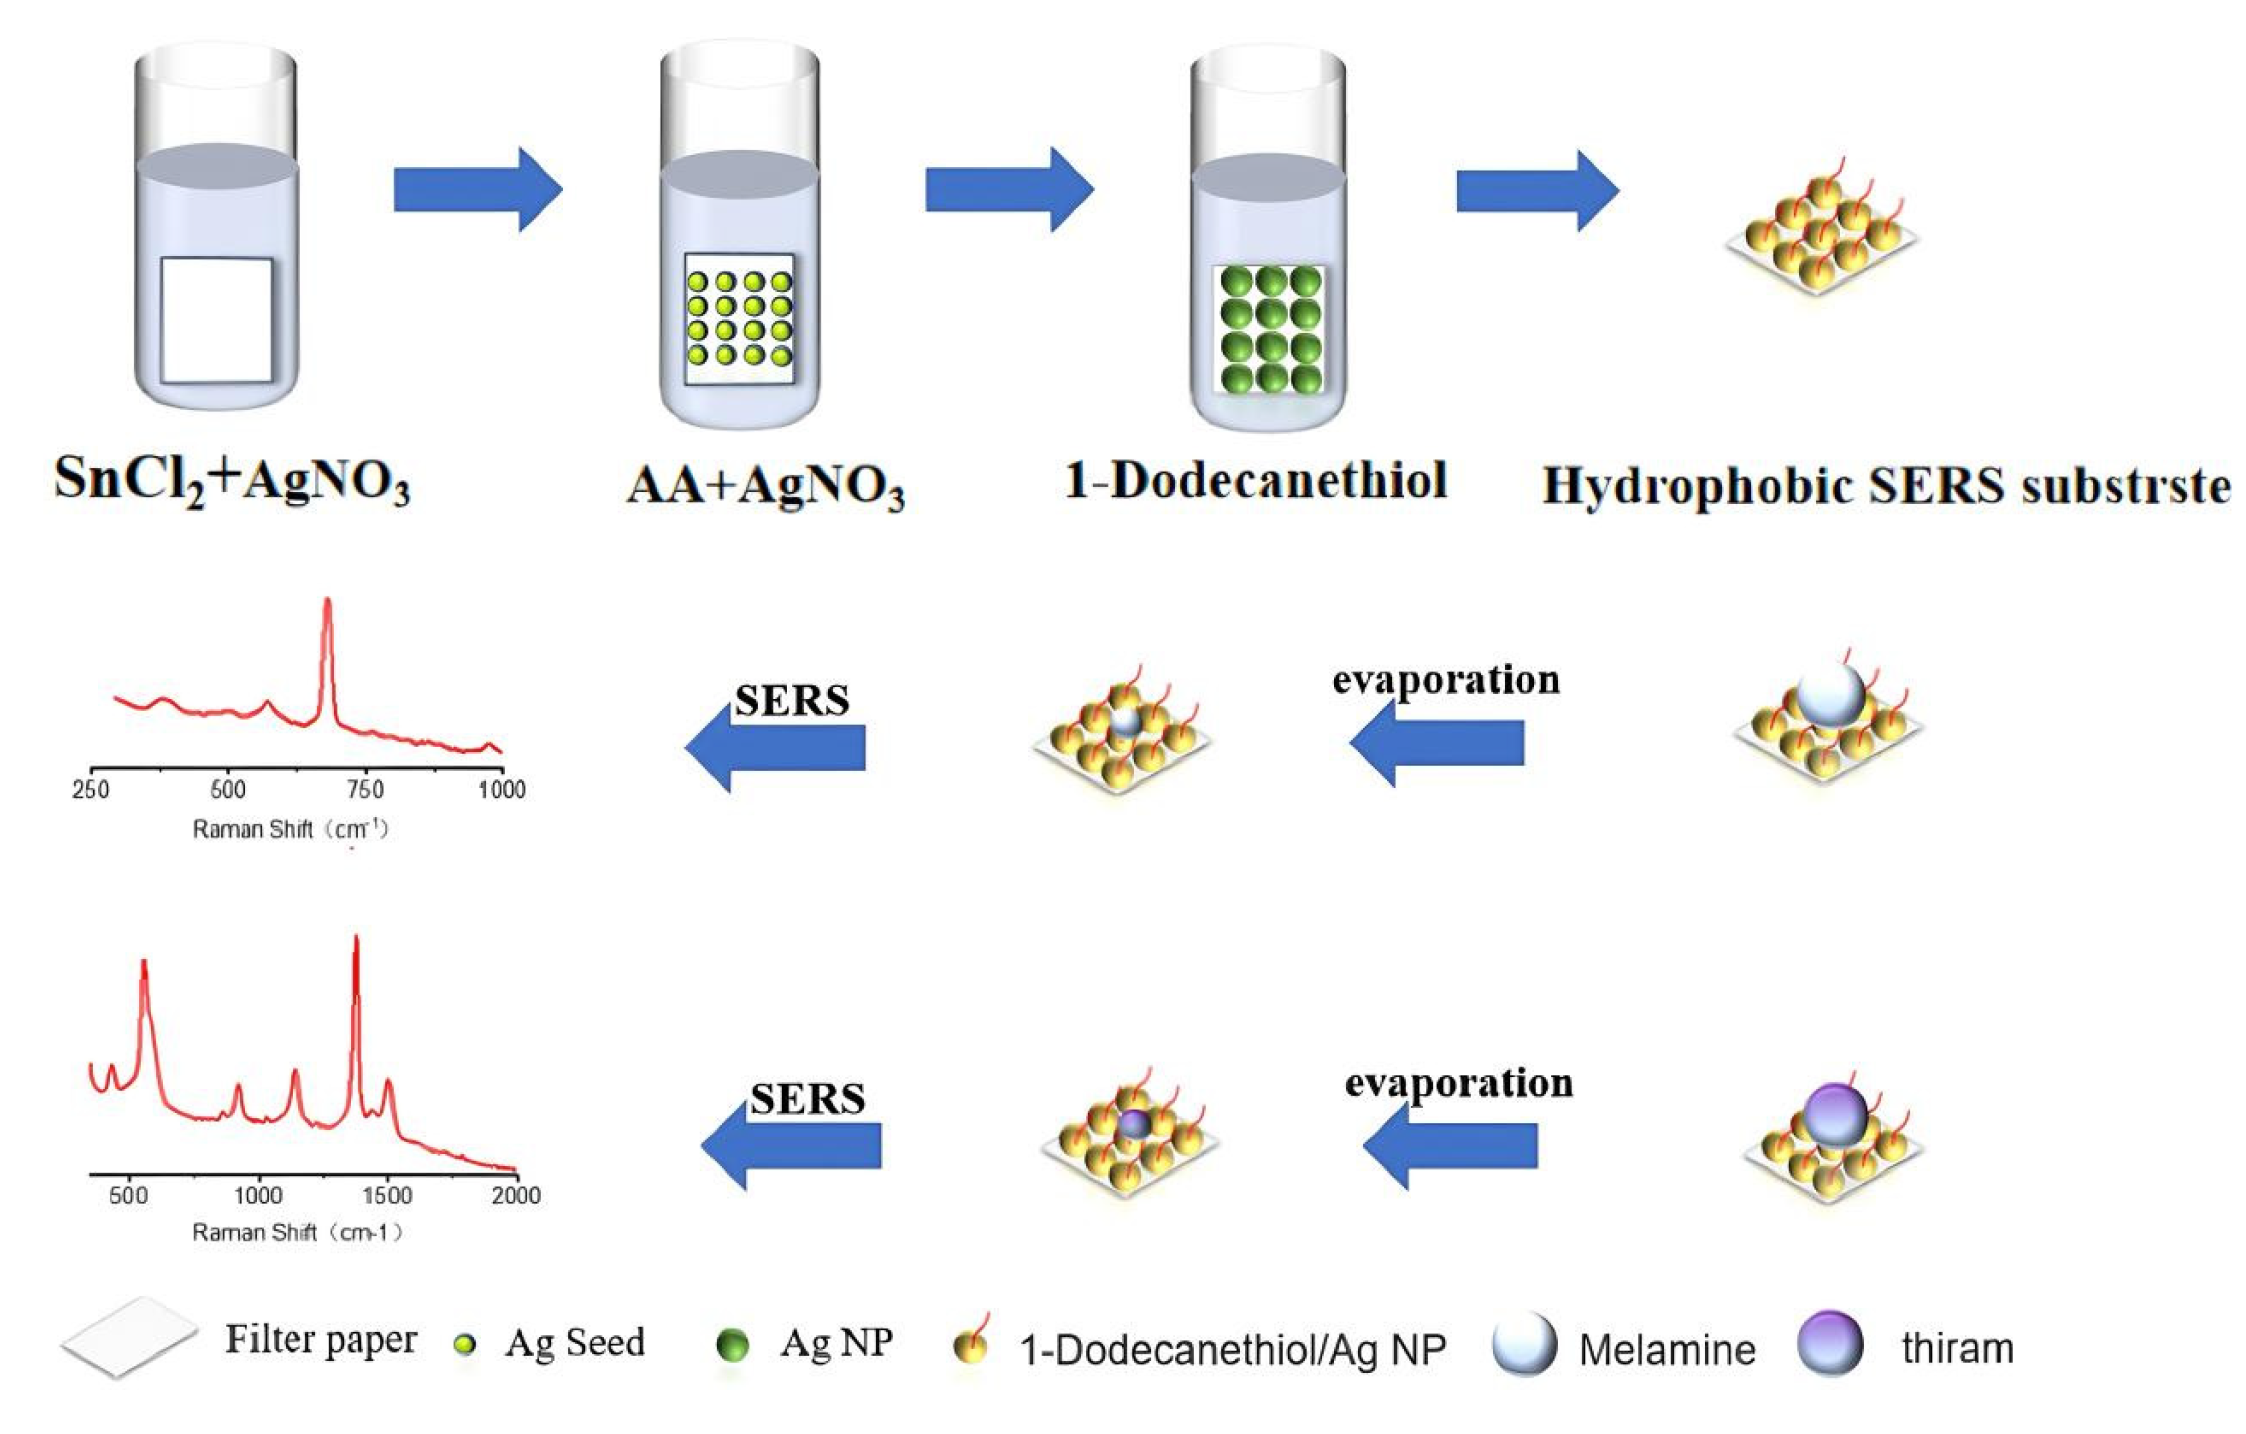
Figure 2.
SEM image of filter paper (a,b) and SERS substrate before (c) and after modification with 1-Dodecanethiol (d).
Figure 2.
SEM image of filter paper (a,b) and SERS substrate before (c) and after modification with 1-Dodecanethiol (d).
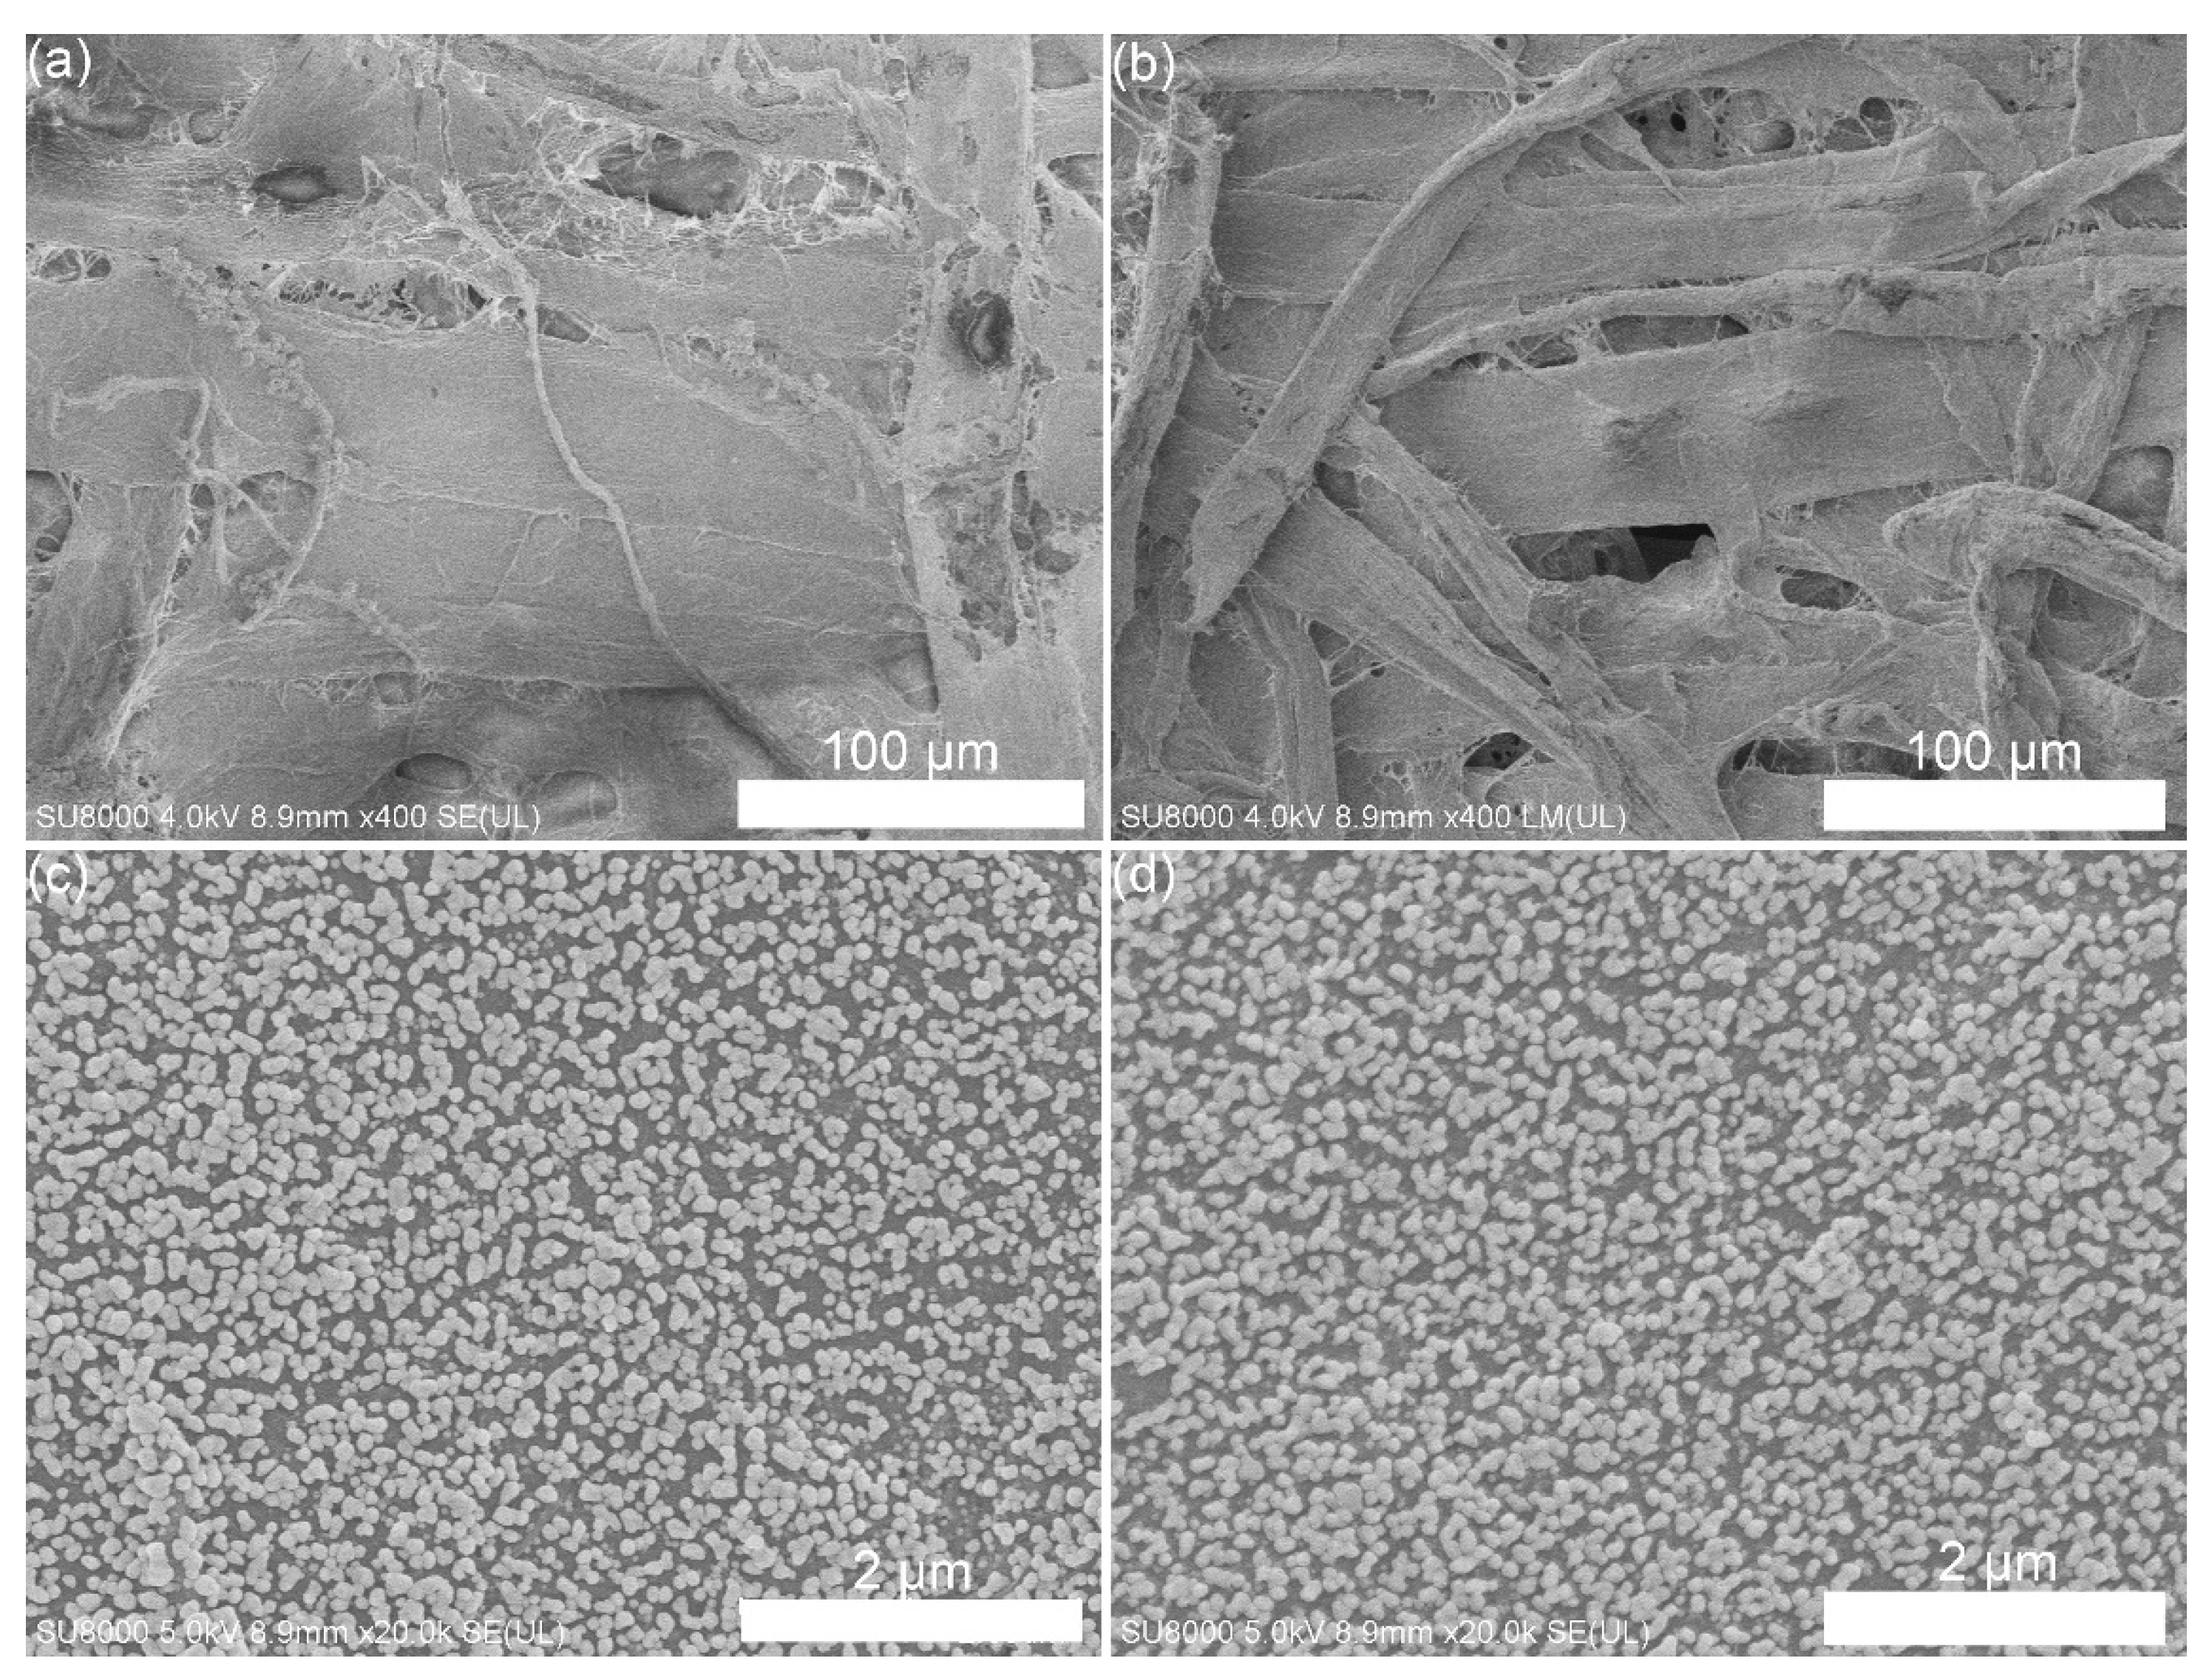
Figure 3.
(a) Water drops on hydrophobic SERS substrate, (b) Water contact angle (WCA) of hydrophobic SERS substrate.
Figure 3.
(a) Water drops on hydrophobic SERS substrate, (b) Water contact angle (WCA) of hydrophobic SERS substrate.
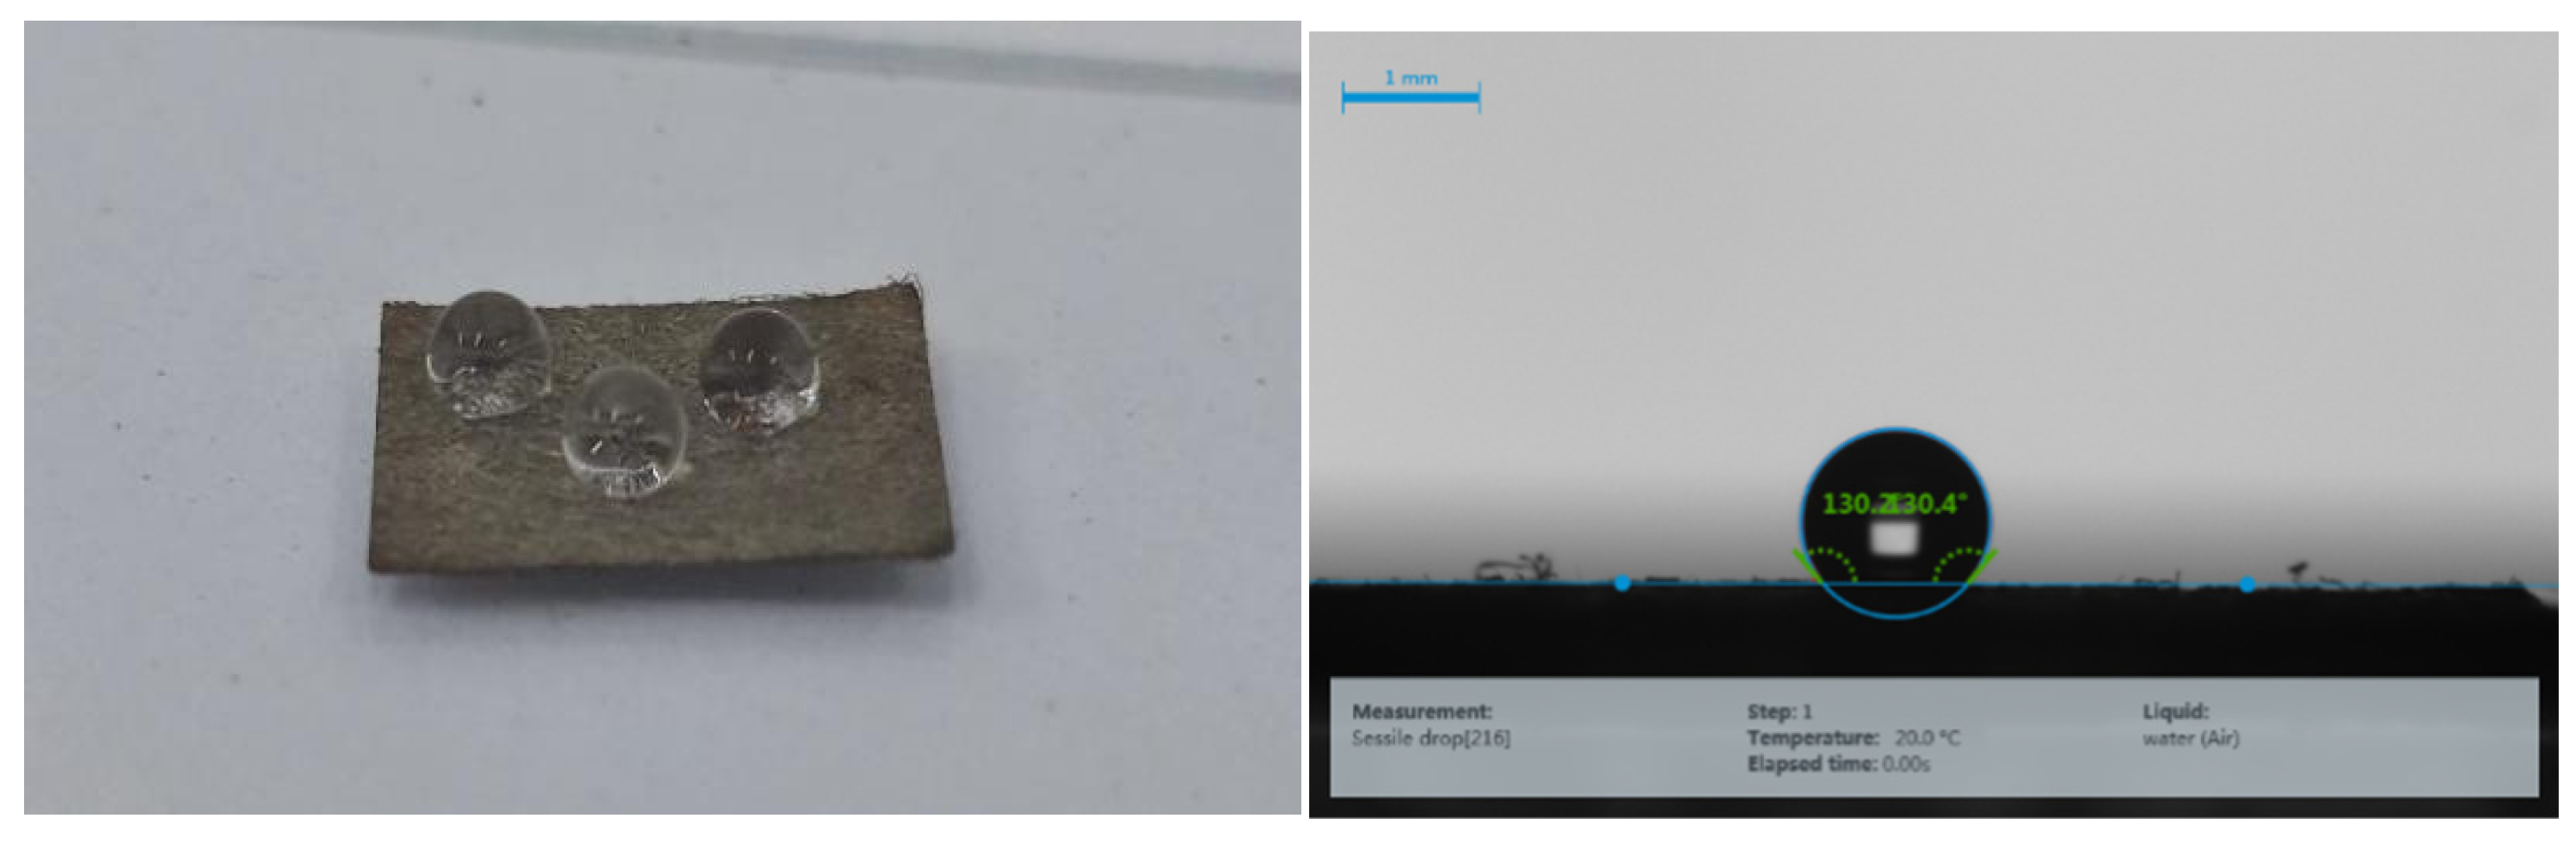
Figure 4.
Raman spectra of R6G measured from filter paper-Ag (a) and hydrophobic filter paper-Ag (b), and the corresponding images under UV light (c,d).
Figure 4.
Raman spectra of R6G measured from filter paper-Ag (a) and hydrophobic filter paper-Ag (b), and the corresponding images under UV light (c,d).
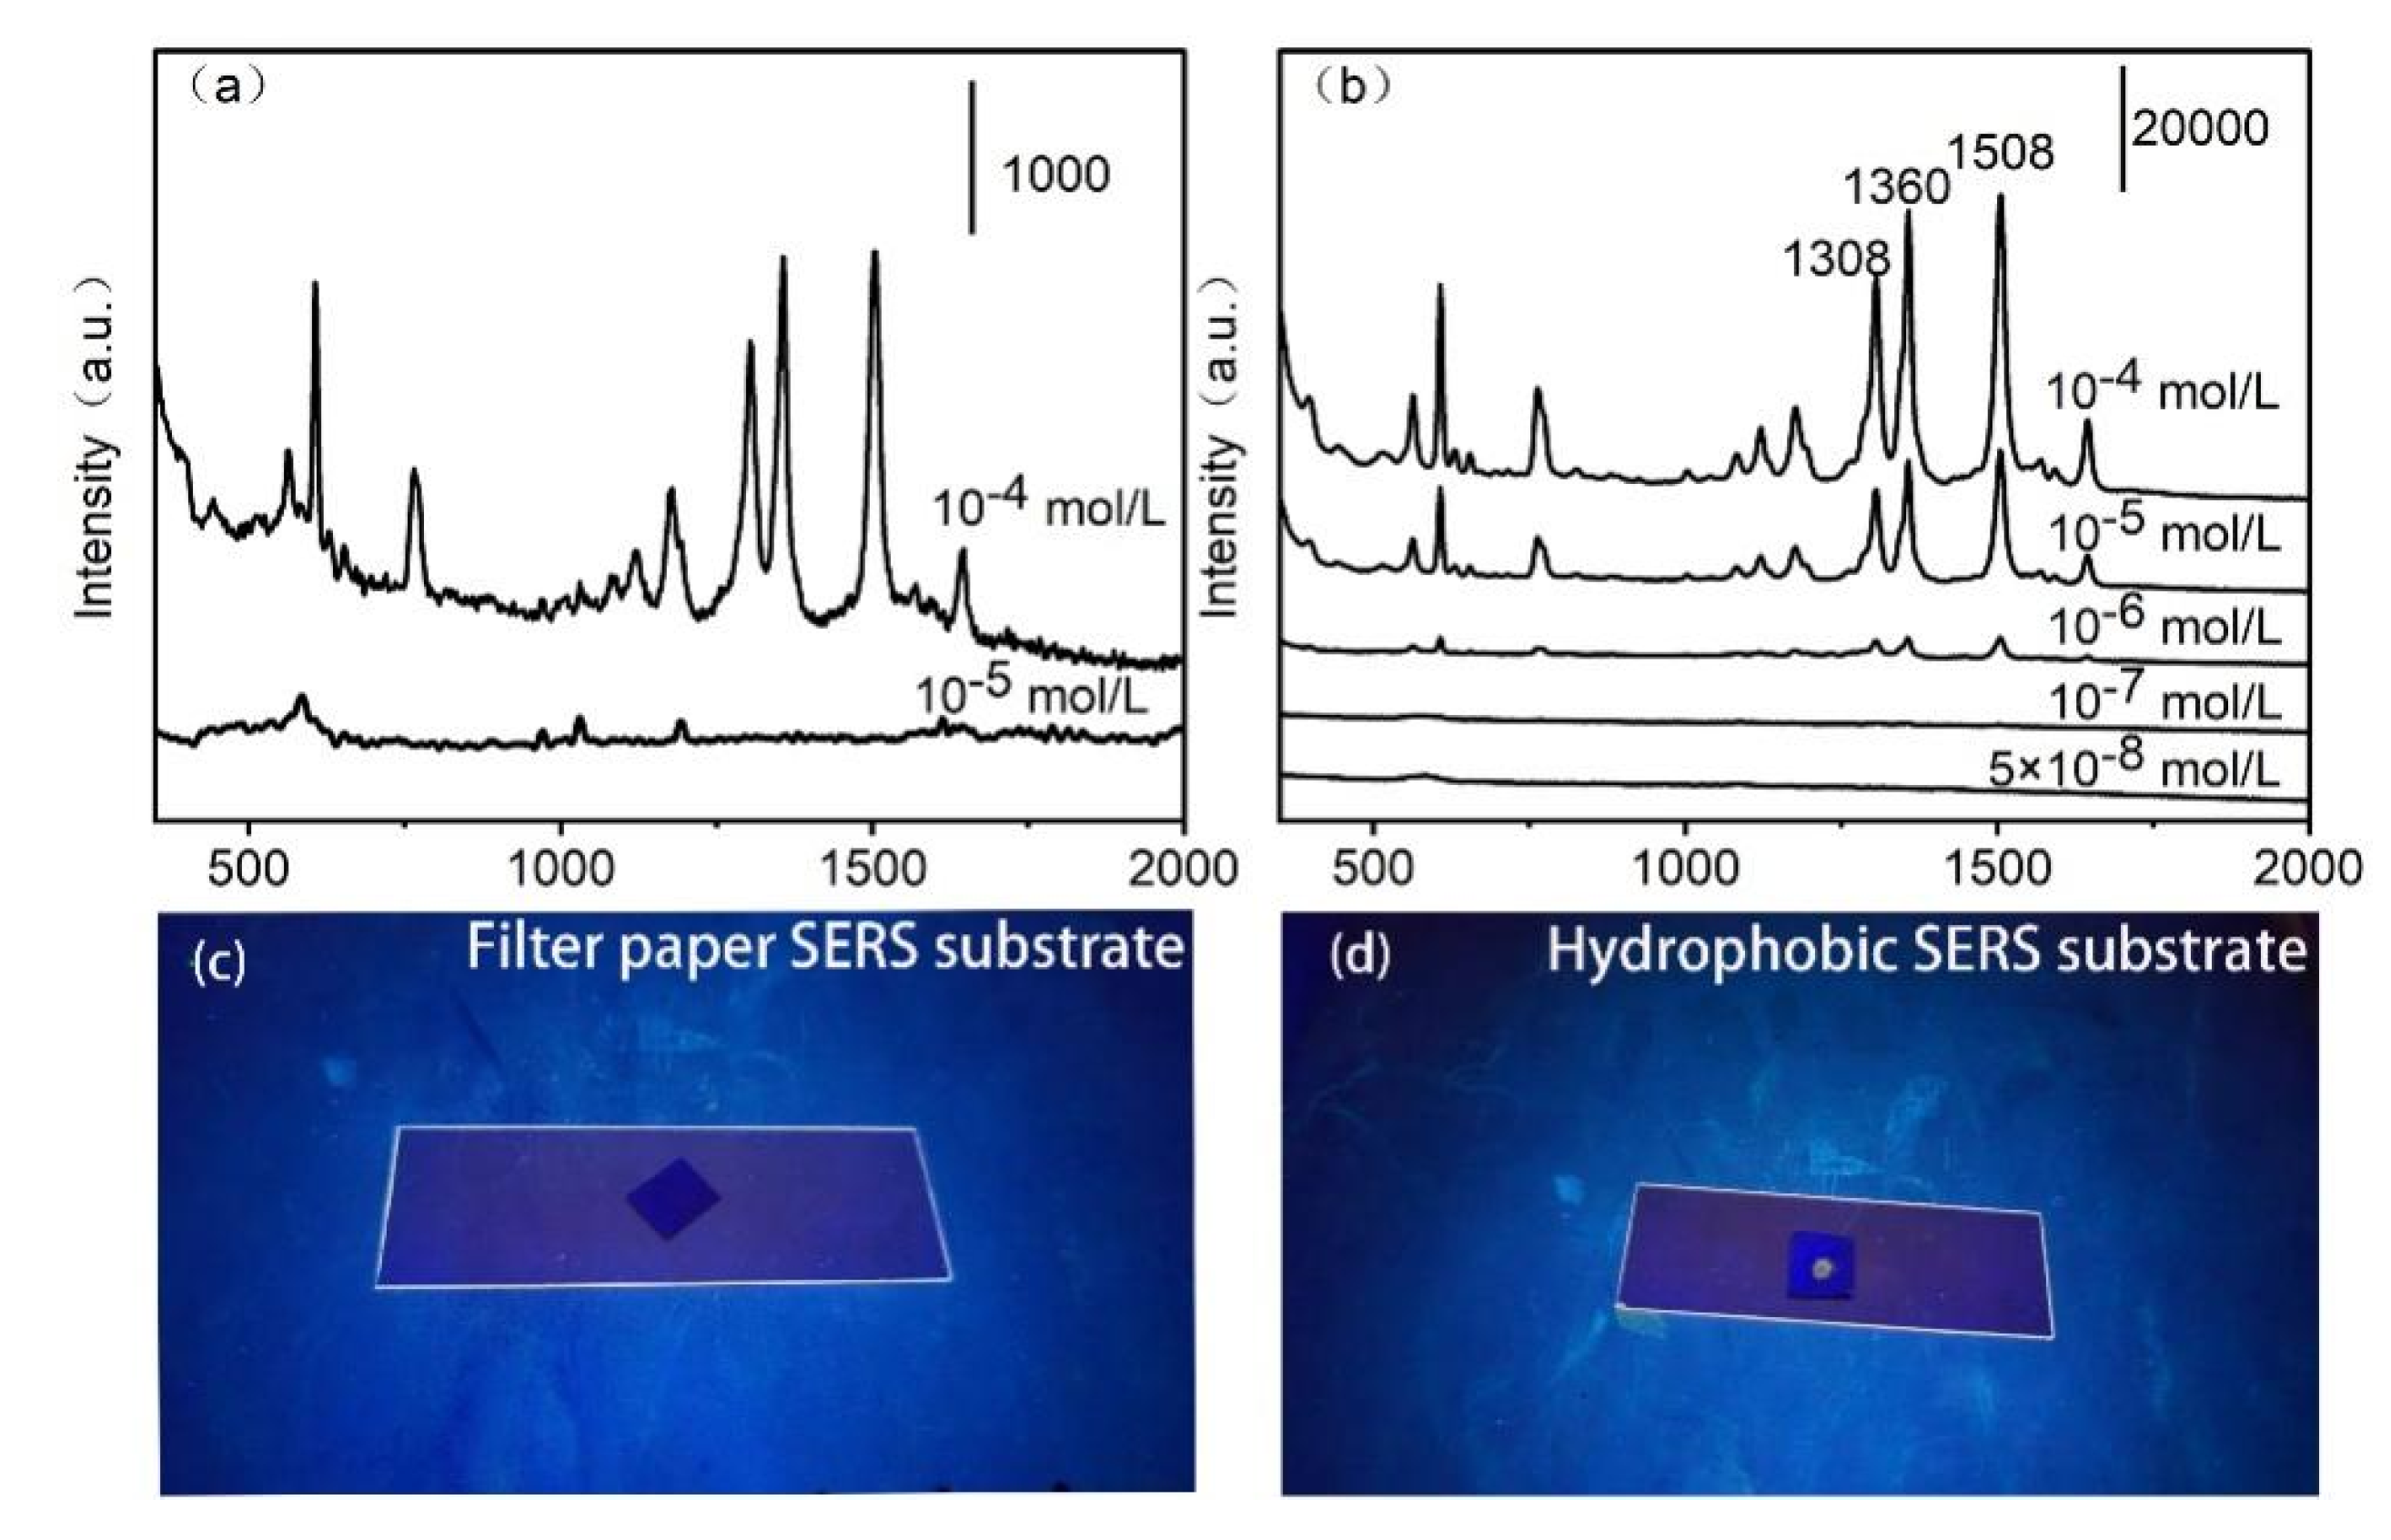
Figure 5.
The Raman spectra of thiram measured from edible oil by filter paper substrate with (a) and without (c) hydrophobic surface, and dose-response curves of the Raman peaks at 1380 cm−1 (b).
Figure 5.
The Raman spectra of thiram measured from edible oil by filter paper substrate with (a) and without (c) hydrophobic surface, and dose-response curves of the Raman peaks at 1380 cm−1 (b).
Disclaimer/Publisher’s Note: The statements, opinions and data contained in all publications are solely those of the individual author(s) and contributor(s) and not of MDPI and/or the editor(s). MDPI and/or the editor(s) disclaim responsibility for any injury to people or property resulting from any ideas, methods, instructions or products referred to in the content. |
© 2026 by the authors. Licensee MDPI, Basel, Switzerland. This article is an open access article distributed under the terms and conditions of the Creative Commons Attribution (CC BY) license.
Copyright: This open access article is published under a Creative Commons CC BY 4.0 license, which permit the free download, distribution, and reuse, provided that the author and preprint are cited in any reuse.


