Submitted:
12 January 2026
Posted:
13 January 2026
You are already at the latest version
Abstract
Objective Although the baseline Prognostic Nutritional Index (PNI) is a well known prognostic factor in lung cancer, the clinical significance of its fluctuation during treatment remains unclear. This study aimed to evaluate the prognostic value of dynamic changes in PNI and to determine whether improvement in nutritional-immune status correlates with survival outcomes. Methods A total of 478 patients diagnosed with lung cancer were retrospectively analyzed. PNI was calculated based on serum albumin and total lymphocyte counts. The baseline value was defined as PNI1, and the post treatment value as PNI2. The dynamic change in PNIΔ was categorized as increased, stable, or decreased. The relationship between these dynamic parameters and Overall Survival. and Progression Free Survival was assessed using Kaplan Meier and Cox regression analyses. Results The median follow up was 19.9 months. Patients with higher PNI1 and PNI2 scores exhibited significantly longer OS and PFS. Notably, patients who demonstrated an increase in PNIΔ during the treatment course had significantly longer overall survival compared to those with stable or decreased scores (p=0.023). In multivariate analysis, while cancer type and post treatment PNI (PNI2) were identified as independent prognostic factors (p=0.007 for PNI2), the dynamic improvement in PNI emerged as a critical indicator of better clinical trajectory in univariate analysis. Conclusion This study demonstrates that PNI is not merely a static baseline marker but a dynamic biomarker that reflects the host's response to treatment and disease. An increase in PNI values during treatment is associated with improved survival, suggesting that dynamic monitoring of nutritional and immune status provides valuable prognostic information for patient management in lung cancer.
Keywords:
lung cancer
; prognostic nutritional ındex
; dynamic biomarker
; survival
; nutritional status
; ımmunonutrition
1. Introduction
Lung cancer remains one of the most commonly diagnosed cancers worldwide and continues to be a leading cause of cancer-related mortality. According to data from 2020, over 2.2 million new cases of lung cancer were reported globally, with approximately 1.8 million deaths attributed to the disease. The overall prognosis of lung cancer is poor, with five-year survival rates generally ranging between 10% and 20%. Most patients are diagnosed at an advanced stage, which significantly limits treatment success and survival outcomes [1]. Although recent advances in targeted therapies and immunotherapy have led to improvements in survival, reliably predicting prognosis in lung cancer patients remains a critical need. In the diagnostic and treatment process, in addition to clinicopathological factors such as age, sex, performance status, weight loss, and tumor stage, laboratory-based biomarkers have also been shown to play an important role in predicting prognosis [2,3,4,5].
Common conditions in cancer patients such as anorexia, weight loss, and cachexia not only deteriorate quality of life but also negatively affect survival. These findings emphasize the critical role of nutritional status in influencing patient outcomes [6,7].
While there are complex systems for evaluating nutritional status that incorporate clinical, laboratory, and anthropometric parameters, simpler and more practical scoring systems have also been developed [8,9]. One such system is the Prognostic Nutritional Index (PNI), calculated by combining serum albumin levels and total lymphocyte count, and it serves as a practical tool reflecting a patient's nutritional and immune status. Initially developed to assess surgical risk, the PNI score has since been used as a prognostic indicator in various malignancies. However, data regarding the impact of dynamic changes in PNI during treatment on prognosis remain limited [10].
This study aims to investigate the effects of pre and post treatment PNI values on treatment response and survival in patients diagnosed with lung cancer and to evaluate the prognostic significance of dynamic PNI monitoring.
2. Materials and Methods
2.1. Patient Characteristics
This retrospective cohort study included patients diagnosed with lung cancer who were followed and treated at the Department of Medical Oncology, Dokuz Eylul University Faculty of Medicine, between January 2012 and December 2017.
The following criteria were applied for patient selection: Histopathological confirmation of lung cancer at the time of diagnosis, Availability of adequate laboratory data before and after treatment, Absence of systemic conditions that could affect the treatment process, such as severe infections, hematological malignancies, or uncontrolled autoimmune diseases.
Demographic data of the patients (age, sex, smoking status), histological type and stage of the tumor, surgical and systemic treatment details, laboratory parameters (serum albumin and total lymphocyte count), treatment response, progression, and dates of death were obtained from hospital records.
2.2. PNI Analyses
The Prognostic Nutritional Index (PNI) was calculated by multiplying the serum albumin level (g/dL) by 10 and the total lymphocyte count (per mm³) by 0.005, and then summing the two values [11].
The value calculated before treatment was termed PNI1, and the value calculated after treatment was termed PNI2. PNI1 was calculated based on laboratory results obtained within one week prior to surgery for surgical patients, or within one week before the start of chemotherapy for patients receiving systemic treatment. PNI2 was calculated using data obtained after the second postoperative week in surgical patients, or two weeks after the completion of first-line chemotherapy in those receiving systemic treatment. The change between PNI1 and PNI2 was defined as PNIΔ.
Based on the cut-off values determined by ROC analysis, PNI1 and PNI2 values were grouped as follows: Group 1 (PNI <45), Group 2 (PNI 45–50), and Group 3 (PNI> 50). Changes in PNIΔ were categorized based on the percentage of change: an increase of more than 10% was defined as "increase," a decrease of more than 10% as "decrease," and variations within this range as unchanged (stable).
2.3. Response Evaluation
Treatment responses of all patients were evaluated according to the RECIST 1.1 (Response Evaluation Criteria in Solid Tumors) protocol. Response categories included complete response, partial response, stable disease, and progressive disease [12].
2.4. Statistical and Survival Analyses
Statistical analyses were performed using SPSS version 26.0 (IBM Corp., Armonk, NY, USA). Continuous variables were expressed as mean ± standard deviation and median (25th–75th percentiles), and categorical variables as frequency and percentage. The distribution of data was assessed with the Kolmogorov-Smirnov test. The relationships between clinicopathological variables and PNI groups were analyzed using one-way ANOVA.
Survival analyses were conducted using the Kaplan-Meier method, and differences between groups were compared with the log-rank test. Overall survival (OS), disease-free survival (DFS), and progression-free survival (PFS) were defined. To identify independent prognostic factors affecting survival, multivariate analysis was performed using the Cox proportional hazards regression model (forward-conditional method). A p-value of < 0.05 was considered statistically significant.
3. Results
3.1. Patient Characteristics
A total of 478 lung cancer patients were included in the study. Among them, 382 (80%) were male and 96 (20%) were female. The mean age was 63.7 ± 10.1 years, and the median age was 64 years. Of the patients, 83.6% were diagnosed with non-small cell lung cancer (NSCLC), while 16.4% had small cell lung cancer (SCLC).
Among the NSCLC patients, the most common histological subtype was adenocarcinoma (42%), followed by squamous cell carcinoma (30%). At diagnosis, 26% of NSCLC patients were at stage I–II, 18% at stage III, and 56% at stage IV. In contrast, 28% of SCLC patients were at the limited stage, and 72% were at the extensive stage. The median follow-up duration for the entire cohort was 19.9 months, and the median overall survival was 24.3 months. Demographic and clinical characteristics of the patients are summarized in Table 1.
3.2. PNI Sonuçları
The pretreatment PNI1 values measured across all patients ranged from a minimum of 26.5 to a maximum of 111.0, with a median of 47.7. The median PNI1 value was 48.5 in patients with non-small cell lung cancer (NSCLC) and 47.9 in those with small cell lung cancer (SCLC).
Post-treatment PNI2 values ranged from a minimum of 18.5 to a maximum of 64.6, with a median value of 45.3 for the entire cohort. The median PNI2 was 45.0 in NSCLC patients and 45.7 in SCLC patients. The change between PNI1 and PNI2, referred to as PNIΔ, had a median value of 3.9 across all patients. Based on the change in PNI, patients were grouped as follows: 16% (n=54) showed an increase (PNIΔ increase), 43% (n=152) showed stability (PNIΔ stable), and 41% (n=145) showed a decrease (PNIΔ decrease). All PNI values and their distributions are presented in Table 2.
3.3. Response and Survival Outcomes
The treatment response of 297 NSCLC and 78 SCLC patients who received systemic therapy was evaluated according to RECIST 1.1 criteria. Among NSCLC patients, the overall response rate (ORR) to first-line chemotherapy was 64.6%, with a complete response (CR) rate of 2.5% and a partial response (PR) rate of 62.1%. In SCLC patients, the ORR was 39.8%, with 10.3% achieving CR and 29.5% achieving PR.
For the 103 NSCLC patients who underwent surgery at an early stage, the median disease-free survival (DFS) was 30.6 months, and the median overall survival (OS) was 36.3 months. In locally advanced or metastatic NSCLC patients, the median progression-free survival (PFS) was calculated as 7.0 months, and the median OS was 16.6 months. In SCLC patients, the median PFS was 7.8 months, while the median OS was 14.1 months. Progression-free survival analyses according to age, sex, and cancer subtype subgroups are presented in Figure 1.
3.4. Relationship Between PNI Values and Survival
In survival analyses based on PNI1, PNI2, and PNIΔ groups, no statistically significant relationship was observed between disease-free survival (DFS) and PNI scores in early-stage NSCLC patients (PNI1: p = 0.53, PNI2: p = 0.54, PNIΔ: p = 0.23). However, in locally advanced or metastatic NSCLC patients, a significant association was found between PNI1 and PNI2 values and progression-free survival (PFS) (PNI1: p = 0.027, PNI2: p = 0.006), whereas PNIΔ showed no significant relationship (p = 0.42). Among SCLC patients, no significant association was identified between PNI scores and PFS (PNI1: p = 0.27, PNI2: p = 0.54, PNIΔ: p = 0.87).
In overall survival analyses, patients with higher PNI1 and PNI2 scores had significantly longer survival durations (both p < 0.001). Additionally, patients who showed an increase in PNIΔ after treatment had significantly longer survival compared to those with stable or decreased PNIΔ (p = 0.023). Survival analyses according to PNI groups are presented in Table 3 and Table 4, and Kaplan-Meier curves are shown in Figure 2.
In the univariate analyses, significant associations were identified between overall survival and PNI1, PNI2, PNIΔ, tumor type, patient gender, and patient age. Based on these findings, a multivariate analysis covering the entire patient group was conducted using the Cox regression model. According to the results of the multivariate analysis, two independent variables were found to have a statistically significant effect on survival duration: cancer type and post-treatment PNI2 score. Patients with non-small cell lung cancer (NSCLC) histology exhibited significantly longer survival (p = 0.003). Furthermore, patients with a PNI2 score <45 had notably shorter survival times (p = 0.007). These results indicate that both the histopathological type of cancer and nutritional status are independently influential factors on prognosis. Detailed results of the multivariate Cox regression analysis are presented in Table 5.
4. Discussion
In this study, we investigated the relationship between Prognostic Nutritional Index (PNI) values calculated before and after treatment and overall survival and treatment response in patients diagnosed with lung cancer. According to our findings, high PNI1 and PNI2 values were positively associated with overall survival. Additionally, patients who exhibited an increase in their PNIΔ scores had significantly longer survival times. These results support the prognostic significance of nutritional and immune status. PNI was originally defined by Onodera et al. for the prediction of postoperative complications in patients undergoing gastrointestinal surgery [11] .
Subsequent studies have demonstrated the prognostic value of PNI in various cancer types, especially gastrointestinal, pancreatic, hepatocellular, and hematologic malignancies [13,14,15]. In a study conducted by K. Migita et al. on patients with gastric cancer, a PNI cut-off value of 48 was identified via ROC analysis [16]. Clinical studies have shown that PNI scores can be stratified based on patient population. Similarly, in our study, dynamic calculation of PNI was observed to be potentially effective in evaluating prognosis both on an individual level and in general populations. When examining the association between pre-treatment PNI1 values and overall survival, patients with higher PNI1 scores demonstrated significantly longer survival. The Log-Rank test showed a statistically significant difference (χ² = 30.7; p = 0.001). Although studies encompassing all lung cancer patients remain limited in the literature, the number of such investigations is gradually increasing. For example, a study by Oku et al. (2023) also identified pre-treatment PNI as a strong predictor of survival [17].
Higher post-treatment PNI2 scores were also associated with longer overall survival in our cohort. Moreover, multivariate analysis revealed that PNI2 is an independent prognostic factor. This finding is supported by the study conducted by Nishihara-Kato et al. [18]. Upon comparing PNI values calculated before and after treatment, 353 patients were categorized into groups based on increasing, decreasing, or stable PNIΔ scores. Kaplan-Meier analysis indicated that patients with increased PNIΔ scores had significantly longer overall survival (p = 0.023). Although PNIΔ did not emerge as an independent prognostic factor in multivariate analyses, it remained significant in univariate analyses. Similarly, Lei et al. (2024) reported that changes in PNI were associated with progression-free survival [19].
A study involving NSCLC patients treated with PD-1 inhibitors identified PNI as a predictor of early progression [20]. Likewise, a meta-analysis evaluating NSCLC patients undergoing immune checkpoint-based therapy demonstrated a significant association between pre-treatment PNI and progression-free survival [21].
Collectively, these findings highlight that PNI should not merely be considered a static measurement tool, but rather a dynamic indicator that must be assessed in the context of treatment response. As such, PNI serves as an independent prognostic marker for predicting overall survival, progression-free survival, and treatment response. Our findings are in concordance with the current literature.
5. Conclusıon and Recommendatıons
This study comprehensively assessed the relationship between Prognostic Nutritional Index (PNI) values, calculated before and after treatment, and survival and treatment response in patients with lung cancer. Our findings indicate that high PNI1 and PNI2 values are positively associated with both overall survival and progression-free survival. Furthermore, increases in PNI during the treatment course may be indicative of better prognosis, aligning with findings from contemporary literature. Nonetheless, the study has certain limitations. Its retrospective and single-center design, missing data, and small sample sizes in patient subgroups may affect the generalizability of the results. Additionally, sociodemographic variables and other factors influencing nutritional status were not included in the analysis.
In conclusion, PNI may serve as a valuable and dynamic biomarker for predicting prognosis and treatment response in patients with lung cancer, regardless of cancer subtype. The findings from this study suggest that monitoring PNI both at baseline and during treatment may provide meaningful insights for patient management. In particular, pre- and post-treatment changes in PNI could help estimate treatment response and disease trajectory. Future research should focus on larger, multi-center prospective studies to further explore the role of PNI in treatment planning and individualized oncology approaches. Furthermore, combining PNI with other biomarkers may enhance its predictive power.
Funding
This research received no external funding or financial support.
Acknowledgments
We thank the Biostatistics Department of Dokuz Eylul University for statistical guidance, and the clinical registry unit for technical support in data entry.
Presentation History: This manuscript has not been presented at any scientific meeting or conference.
References
- Sung, H; Ferlay, J; Siegel, RL; Laversanne, M; Soerjomataram, I; Jemal, A; et al. Global Cancer Statistics 2020: GLOBOCAN Estimates of Incidence and Mortality Worldwide for 36 Cancers in 185 Countries. CA Cancer J Clin [Internet] 2021, 71(3), 209–49. Available online: https://pubmed.ncbi.nlm.nih.gov/33538338/. [CrossRef]
- Addario, BJ. Lung cancer is a global epidemic and requires a global effort. Ann Transl Med [Internet] 2015, 3(2), 26. [Google Scholar] [PubMed]
- Watine, J; Paesmans, M; Sculier, JP. Prognostic factors for patients with small cell lung carcinoma [1] (multiple letters). Cancer 2002, 94(2), 576–7. [Google Scholar] [CrossRef] [PubMed]
- Dharma-Wardene, M; Au, HJ; Hanson, J; Dupere, D; Hewitt, J; Feeny, D. Baseline FACT-G score is a predictor of survival for advanced lung cancer. Quality of Life Research 2004, 13(7), 1209–16. [Google Scholar] [CrossRef]
- Smit, EF; Groen, HJM; Splinter, TAW; Ebels, T; Postmus, PE. New prognostic factors in resectable non-small cell lung cancer. Thorax [Internet] 1996, 51(6), 638. Available online: https://www.ncbi.nlm.nih.gov/pmc/articles/PMC1090499/. [CrossRef] [PubMed]
- Arthur, ST; Van Doren, BA; Roy, D; Noone, JM; Zacherle, E; Blanchette, CM. Cachexia among US cancer patients. 2016, 19(9), 874–80. [Google Scholar] [CrossRef] [PubMed]
- Stanley, KE. Prognostic Factors for Survival in Patients With Inoperable Lung Cancer. JNCI: Journal of the National Cancer Institute [Internet] 1980, 65(1), 25–32. Available online: https://academic.oup.com/jnci/article/65/1/25/910101. [PubMed]
- Rawson, NSB; Peto, J. An overview of prognostic factors in small cell lung cancer. British Journal of Cancer 1990, 61(4), 597–604. Available online: https://www.nature.com/articles/bjc1990133. [CrossRef] [PubMed]
- Jin, Y; Zhao, L; Peng, F. Prognostic impact of serum albumin levels on the recurrence of stage I non-small cell lung cancer. Clinics [Internet] 2013, 68(5), 686–93. Available online: https://www.scielo.br/j/clin/a/3bs3Tp8SS3KQDSP4TqW5LPJ/?lang=en. [CrossRef] [PubMed]
- Barrera, R. Nutritional Support in Cancer Patients. Journal of Parenteral and Enteral Nutrition [Internet] 2002, 26(5 SUPPL.), S63–71. Available online: https://onlinelibrary.wiley.com/doi/full/10.1177/014860710202600516. [CrossRef] [PubMed]
- Onodera T, Goseki N, zasshi GKN geka gakkai, 1984 undefined. Prognostic nutritional index in gastrointestinal surgery of malnourished cancer patients. europepmc.orgT Onodera, N Goseki, G KosakiNihon geka gakkai zasshi, 1984•europepmc.org [Internet]. [cited 2023 Dec 15]; Available from: https://europepmc.org/article/med/6438478.
- Eisenhauer, EA; Therasse, P; Bogaerts, J; Schwartz, LH; Sargent, D; Ford, R; et al. New response evaluation criteria in solid tumours: Revised RECIST guideline (version 1.1). Eur J Cancer [Internet] 2009, 45(2), 228–47. Available online: http://www.ejcancer.com/article/S0959804908008733/fulltext. [CrossRef] [PubMed]
- Salmerón, D; Chirlaque, MD; Isabel Izarzugaza, M; Sánchez, MJ; Marcos-Gragera, R; Ardanaz, E; et al. Lung cancer prognosis in Spain: The role of histology, age and sex. Respir Med 2012, 106(9), 1301–8. [Google Scholar] [CrossRef] [PubMed]
- Tas, F; Ciftci, R; Kilic, L; Karabulut, S. Age is a prognostic factor affecting survival in lung cancer patients. Oncol Lett [Internet] 2013, 6(5), 1507–13. Available online: http://www.spandidos-publications.com/10.3892/ol.2013.1566/abstract. [CrossRef]
- Mohri, Y; Inoue, Y; Tanaka, K; Hiro, J; Uchida, K; Kusunoki, M. Prognostic nutritional index predicts postoperative outcome in colorectal cancer. World J Surg [Internet] 2013, 37(11), 2688–92. Available online: https://link.springer.com/article/10.1007/s00268-013-2156-9. [CrossRef]
- Migita, K; Takayama, T; Saeki, K; Matsumoto, S; Wakatsuki, K; Enomoto, K; et al. The prognostic nutritional index predicts long-term outcomes of gastric cancer patients independent of tumor stage. Ann Surg Oncol [Internet] 2013, 20(8), 2647–54. Available online: https://pubmed.ncbi.nlm.nih.gov/23463091/. [CrossRef]
- Oku, Y; Toyokawa, G; Wakasu, S; Kinoshita, F; Takamori, S; Watanabe, K; et al. Impact of the pretreatment prognostic nutritional index on the survival after first-line immunotherapy in non-small-cell lung cancer patients. Cancer Med [Internet] Available from. 2023, 12(13), 14327–36. [Google Scholar] [CrossRef]
- Nishihara-Kato, F; Imai, H; Tsuda, T; Wasamoto, S; Nagai, Y; Kishikawa, T; et al. Prognostic Potential of the Prognostic Nutritional Index in Non-Small Cell Lung Cancer Patients Receiving Pembrolizumab Combination Therapy with Carboplatin and Paclitaxel/Nab-Paclitaxel. Oncology [Internet] 2024, 102(1), 30–42. [Google Scholar] [CrossRef] [PubMed]
- Lei, W; Wang, W; Qin, S; Yao, W. Predictive value of inflammation and nutritional index in immunotherapy for stage IV non-small cell lung cancer and model construction. Sci Rep [Internet] 2024, 14(1), 1–11. Available online: https://www.nature.com/articles/s41598-024-66813-4. [CrossRef] [PubMed]
- Liu, N; Jiang, A; Zheng, X; Fu, X; Zheng, H; Gao, H; et al. Prognostic Nutritional Index identifies risk of early progression and survival outcomes in Advanced Non-small Cell Lung Cancer patients treated with PD-1 inhibitors. J Cancer [Internet] 2021, 12(10), 2960. [Google Scholar] [CrossRef] [PubMed]
- Tian, T; Yu, M; Yu, Y; Wang, K; Tian, P; Luo, Z; et al. Immune checkpoint inhibitor (ICI)-based treatment beyond progression with prior immunotherapy in patients with stage IV non-small cell lung cancer: a retrospective study. Transl Lung Cancer Res [Internet] 2022, 11(6), 1027–37. Available online: https://pubmed.ncbi.nlm.nih.gov/35832458/. [CrossRef] [PubMed]
Figure 1.
Kaplan-Meier analysis of progression-free survival (PFS) based on the prognostic nutritional index (PNI). Subfigure (a) shows the PFS distribution stratified by baseline PNI scores: group 1 (PNI < 45), group 2 (PNI 45–50), and group 3 (PNI > 50).Subfigure (b) presents the PFS distribution according to follow-up PNI categories using the same cut-off values. Subfigure (c) illustrates PFS differences based on the change in PNI (ΔPNI) during follow-up, divided into three groups: increasing score, unchanging score, and decreasing score. Significant differences in progression-free survival were observed among the groups in all analyses (p < 0.05).
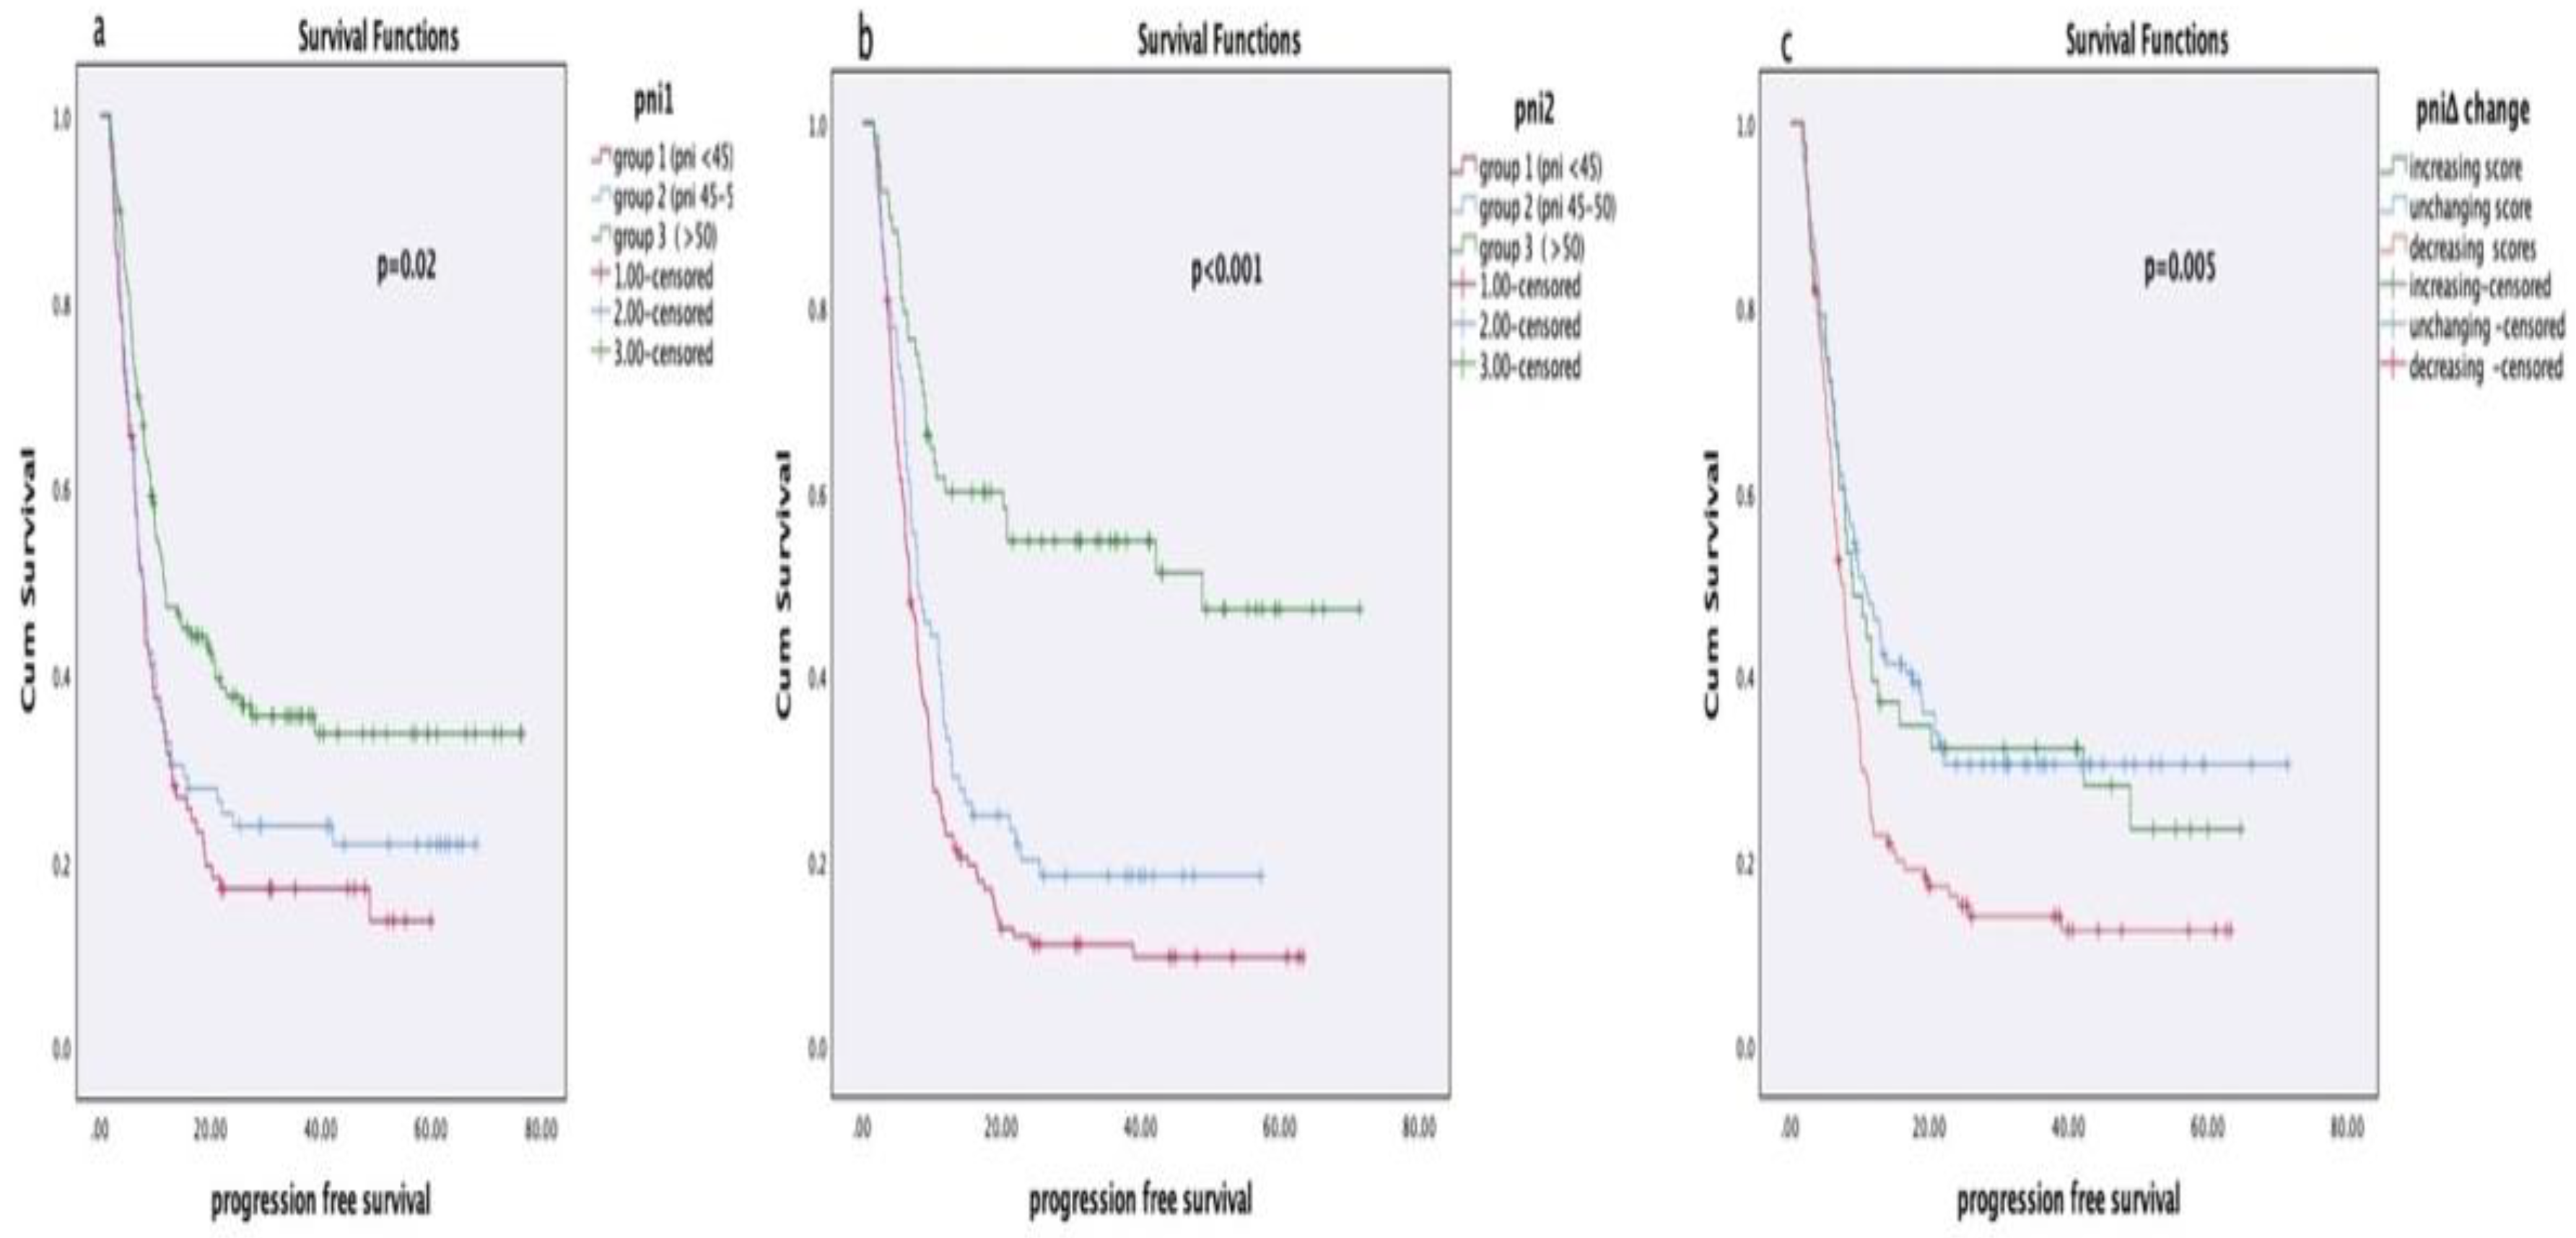
Figure 2.
This figure illustrates the Kaplan-Meier survival analysis based on the prognostic nutritional index (PNI). Subfigure (a) shows the survival distribution categorized by baseline PNI values: group 1 (PNI < 45), group 2 (PNI between 45 and 50), and group 3 (PNI > 50). Subfigure (b) presents the survival distribution according to PNI values measured during follow-up using the same group classifications. Subfigure (c) compares the survival outcomes based on the change in PNI (ΔPNI), divided into three groups: increasing score, unchanging score, and decreasing score. Statistically significant differences in survival were observed among the groups in each analysis (p < 0.05).
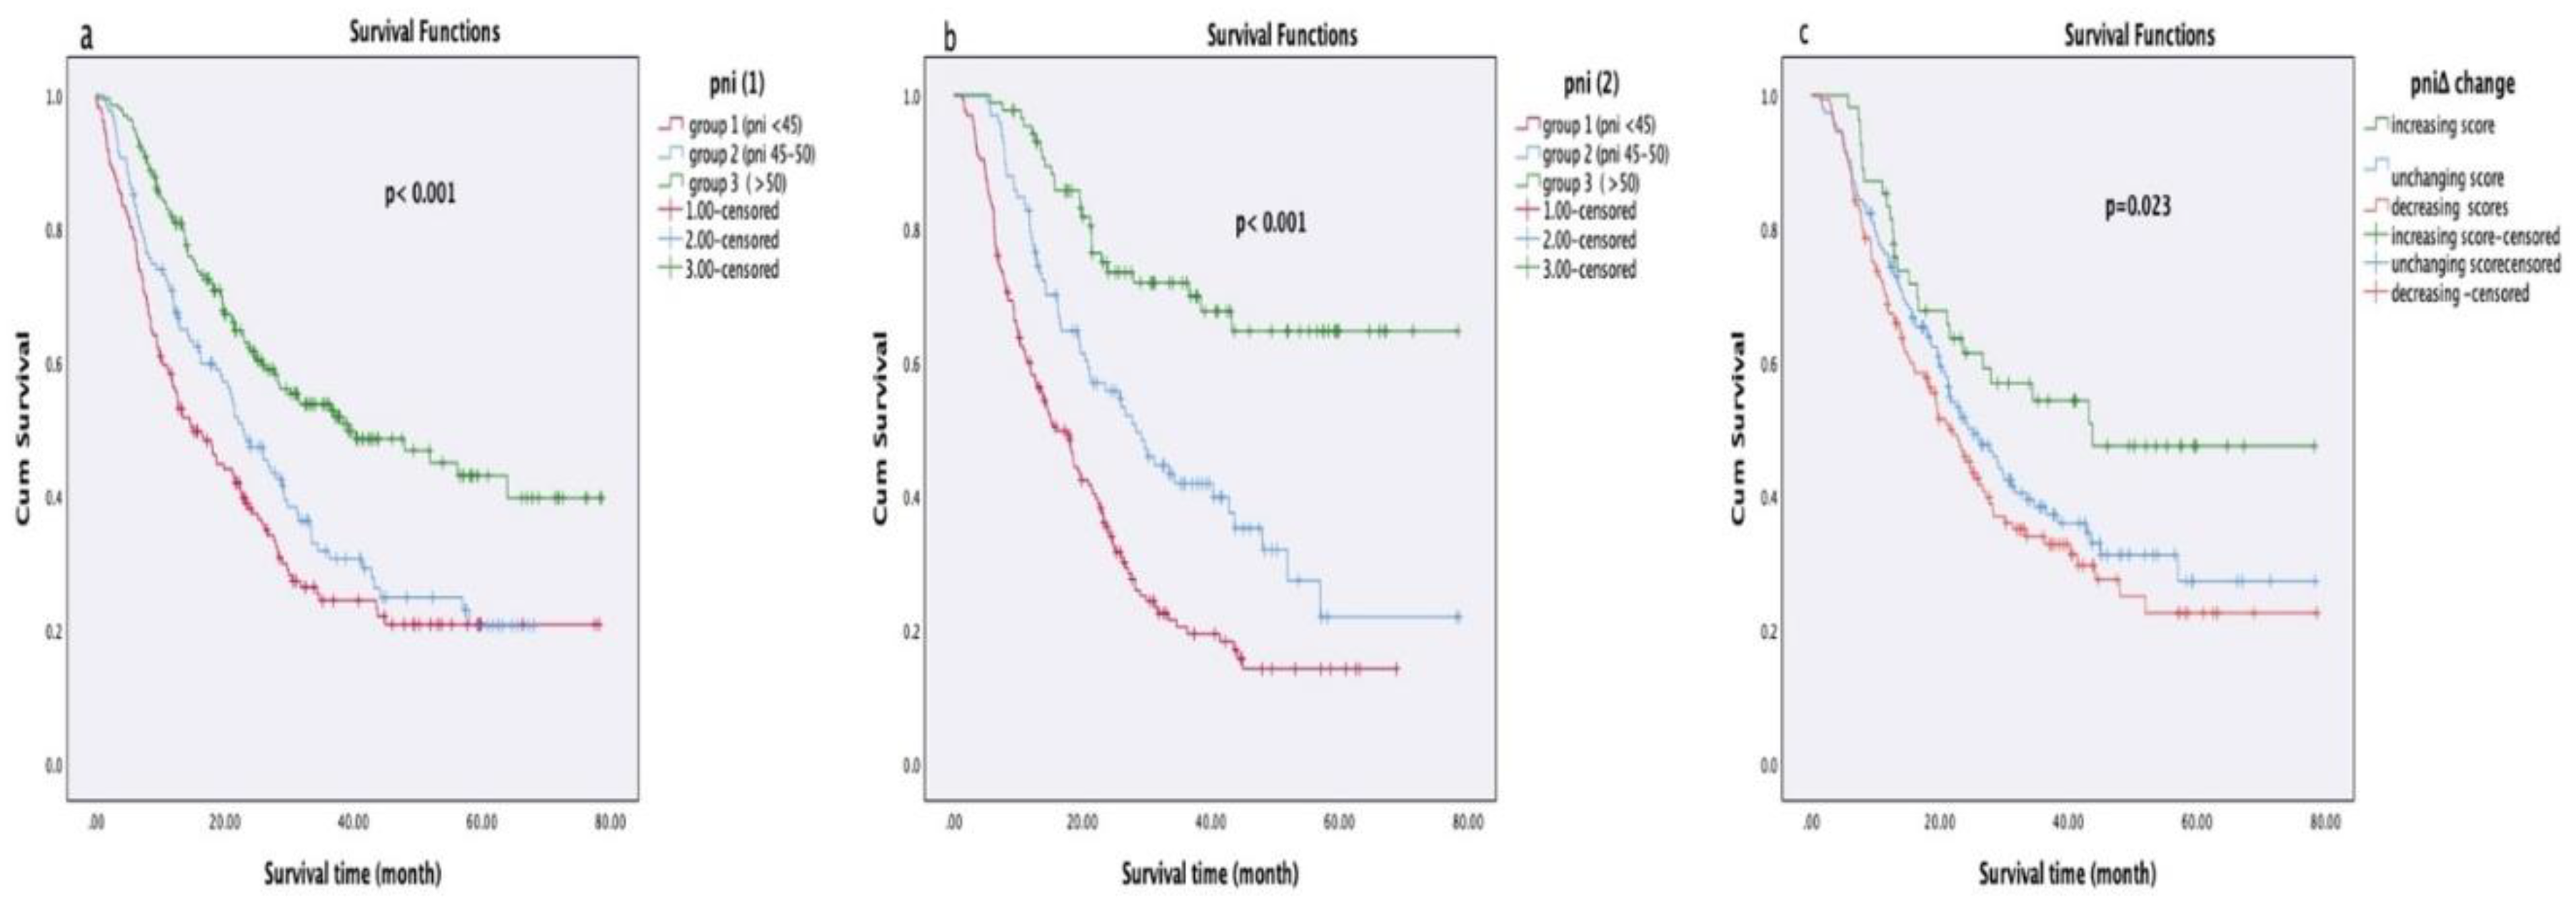

Table 1.
Lung Carcinom patient demographic data at the time of diagnosis.
| N=478 | % | Mean | Median | Std. | Minimum | Maximum | |
|---|---|---|---|---|---|---|---|
| Gender (Female/Male) | 96/382 | 20/80 | |||||
| Smoking | 360/118 | 75/25 | |||||
| Lung cancer type Small cell/ Non small cell |
|||||||
| 78/400 | 17/83 | ||||||
| Surgically operable/İnoparable | 139/339 | 29/71 | |||||
| Age | 63.7 | 64.0 | 10.1 | 20.0 | 100.0 | ||
| Budy mass index | 40.0 | 39.2 | 7.4 | 16.0 | 68.0 | ||
| Hemoglobin (gr/dl) | 12.5 | 13.0 | 2.0 | 5.7 | 17.6 | ||
| Albümin (gr/dl) | 3.7 | 3.8 | 0.4 | 2.2 | 4.9 | ||
| Lymphocyte(10³/μL) | 1.95 | 1.8 | 1.01 | 0.2 | 15.0 | ||
| Leukocite (10³/μL) | 9.5 | 9.2 | 3.4 | 1.0 | 43.1 | ||
| PNI 1 | 478 | 47.7 | 48.0 | 7.5 | 26.5 | 111.0 | |
| PNI 2 | 351 | 44.2 | 45.3 | 8.3 | 18.5 | 64.6 | |
| PNIΔ (increased/unchanged/decreased) | 54/152/145 | ||||||
| PNI 1: Prognostic Nutritional Index initial measurement , PNI 2 : Prognostic Nutritional Index second measurement, PNIΔ : Change in Prognostic Nutritional Index (increased/unchanged/decreased) | |||||||
Table 2.
PNI scores of all patients.
| Highest | Lowest | Median | |
|---|---|---|---|
| PNI1 All patients | 111.0 | 26.5 | 47.7 |
| PNI1 NSCLC | 74.0 | 26.5 | 48.5 |
| PNI1 SCLC | 111.0 | 32.5 | 47.9 |
| PNI2 All patients | 64.6 | 18.5 | 45.3 |
| PNI2 NSCLC | 63.5 | 18.5 | 45.0 |
| PNI2 SCLC | 64.6 | 19.1 | 45.7 |
| PNIΔ All patients | 80.0 | -18.0 | 3.9 |
| PNIΔ NSCLC | 33.5 | -18.0 | 4.0 |
| PNIΔ SCLC | 80.5 | -14.5 | 4.1 |
| PNI 1: Prognostic Nutritional Index initial measurement , PNI 2 : Prognostic Nutritional Index second measurement, PNIΔ : Change in Prognostic Nutritional Index (increased/unchanged/decreased) | |||
Table 3.
PNI relationship between progression-free survival in NSCLC patients.
| Mean ± (SD) months | Median months | p ( Long Rank) | |
|---|---|---|---|
| group 1 (<45) | 10.9 ± 1.5 | 6.6 | |
| group 2 (45-50) | 10.6.±1.8 | 6.4 | 0.027 |
| group 3 (>50) | 14.5± 3.1 | 7.9 | |
| PNI2 | |||
| group 1 (<45) | 9.4 ± 1.1 | 6.1 | |
| group 2 (45-50) | 14.9 ± 2.3 | 7.6 | 0.006 |
| group 3 (>50) | 20.4 ± 4.6 | 8.9 | |
| PNIΔ (score change) | |||
| decreased scores | 16.1 ±.3.6 | 6.9 | |
| unchanged score | 11.9± 1.7 | 6.8 | 0.42 |
| increased score | 11.1 ±1.5 | 6.5 | |
| PNI 1: Prognostic Nutritional Index initial measurement , PNI 2: Prognostic Nutritional Index second measurement, PNIΔ: Change in Prognostic Nutritional Index (increased/unchanged/decreased) | |||
Table 4.
Factors affecting survival in lung cancer patients.
| Mean ± (SD) months | Median months | p ( Long Rank) | |
|---|---|---|---|
| Small cell | 25 ± 2.9 | 16.7 | <0.001 |
| Non small cell | 37.9 ± 1.68 | 27.2 | |
| Age ≤ 64 | 39.38 ± 2.18 | 28.6 | 0.017 |
| Age > 64 | 32 ± 2.01 | 21.3 | |
| Male | 33.7 ± 1.6 | 22.5 | 0.001 |
| Female | 45.4 ± 3.4 | 43.7 | |
| PNI1 | |||
| group 1 (<45) | 27.5± 2.3 | 15.1 | |
| group 2 (45-50) | 29.9± 2.2 | 23 | <0.001 |
| group 3 (>50) | 45± 2.4 | 39.2 | |
| PNI2 | |||
| group 1 (<45) | 23.5± 1.7 | 16.1 | |
| group 2 (45-50) | 36.9± 3.1 | 28,3 | <0.001 |
| group 3 (>50) | 58.7±3.3 | 50 | |
| PNIΔscore change | |||
| PNIΔ decreased | 32.7±.2.6 | 21.5 | |
| PNIΔ unchanged | 36.3±2.6 | 25.2 | 0.023 |
| PNIΔ increased | 47.2±4.4 | 43.7 | |
| PNI 1: Prognostic Nutritional Index initial measurement , PNI 2 : Prognostic Nutritional Index second measurement, PNIΔ : Change in Prognostic Nutritional Index (increased/unchanged/decreased) | |||
Table 5.
Multivariate Cox regression analysis of prognostic factors affecting overall survival in patients with lung cancer. Both post-treatment PNI (PNI2) and histological cancer type (NSCLC vs. SCLC) were found to be independent predictors of survival.
Table 5.
Multivariate Cox regression analysis of prognostic factors affecting overall survival in patients with lung cancer. Both post-treatment PNI (PNI2) and histological cancer type (NSCLC vs. SCLC) were found to be independent predictors of survival.
| B | SE | Wald | df | Sig. | Exp(B) | |
|---|---|---|---|---|---|---|
| Lung cancer type | -0.517 | 0.175 | 8.757 | 1 | 0.003 | .597 |
| AGE | 0.072 | 0.143 | .254 | 1 | 0.614 | 1.075 |
| cinsiyet | -0.332 | 0.203 | 2.672 | 1 | 0.102 | .718 |
| PNI1 Group 1 | 2.674 | 2 | 0.263 | |||
| PNI1 Group 2 | 0.200 | 0.466 | .183 | 1 | 0.668 | 1.221 |
| PNI1 Group 3 | 0.322 | 0.232 | 1.930 | 1 | 0.165 | 1.380 |
| PNI2 Group 1 | 9.925 | 2 | 0.007 | |||
| PNI2 Group 2 | 1.514 | 0.483 | 9.833 | 1 | 0.002 | 4.546 |
| PNI2 Group 3 | 0.938 | 0.330 | 8.081 | 1 | 0.004 | 2.555 |
| PNIΔ increased | 0.858 | 2 | 0.651 | |||
| PNIΔ stabil | 0.101 | 0.622 | 0.026 | 1 | 0.871 | 1.106 |
| PNIΔ decreased | 0.199 | 0.351 | 0.323 | 1 | 0.570 | 1.221 |
| PNI 1: Prognostic Nutritional Index initial measurement , PNI 2 : Prognostic Nutritional Index second measurement, PNIΔ : Change in Prognostic Nutritional Index (increased/unchanged/decreased) | ||||||
Disclaimer/Publisher’s Note: The statements, opinions and data contained in all publications are solely those of the individual author(s) and contributor(s) and not of MDPI and/or the editor(s). MDPI and/or the editor(s) disclaim responsibility for any injury to people or property resulting from any ideas, methods, instructions or products referred to in the content. |
© 2026 by the authors. Licensee MDPI, Basel, Switzerland. This article is an open access article distributed under the terms and conditions of the Creative Commons Attribution (CC BY) license (http://creativecommons.org/licenses/by/4.0/).
Copyright: This open access article is published under a Creative Commons CC BY 4.0 license, which permit the free download, distribution, and reuse, provided that the author and preprint are cited in any reuse.


