
Submitted:
20 November 2023
Posted:
22 November 2023
You are already at the latest version
Abstract
Different prognostic scores have been applied to identify patients with non-small cell lung cancer who have a higher probability of poor outcome. In this study we evaluated whether Naples Prognostic Score, a novel index which considers both inflammatory and nutritional values, was associated with long-term survival. The study is a retrospective propensity score matching analysis of patients who underwent curative surgery for non-small cell lung cancer from January 2016 to December 2021. The score considered four pre-operative parameters: neutrophil to lymphocyte ratio, lymphocyte to monocyte ratio, serum albumin and total cholesterol. Kaplan-Meier method and Cox regression analysis were performed to evaluate the relation between the score and disease-free survival, overall survival and cancer-related survival. A total of 260 patients were selected for the study, reduced to 154 after propensity score matching. Post-propensity Kaplan-Meier analysis showed a significant correlation between Naples Prognostic Score and overall survival (p=0.018) and cancer-related survival (p=0.007). Multivariate Cox regression analysis further validated the score as an independent prognostic indicator for both these survivals (p=0.007 and p=0.010 respectively). Naples Prognostic Score proved to be an easily achievable prognostic factor of long-term survival in patients with non-small cell lung cancer after surgical treatment.
Keywords:
Non-small cell lung cancer
; prognosis
; Naples Prognostic Score
; thoracic surgery
; survival
; prognostic score.
1. Introduction
Lung cancer is one of the most common malignancies and the main cause of cancer death in men and women combined worldwide [1,2]. Non-small cell lung cancer (NSCLC) accounts for 84% of all lung cancers [3]. Despite the improvements in early lung cancer detection and in treatment options, about 30-50% of patients with completely surgically resected lung cancer develop recurrence [4-6] and 5-year survival ranges between 40- 90% [7].
Recently, there has been a growing interest in finding possible prognostic markers, which might impact management plans. Early identification of patients with a higher probability of a poor outcome can potentially guide an early personalized treatment. Currently, many hematological markers, which can be easily obtained in daily clinical practice, are increasingly utilized for the prognosis in several cancers, including NSCLC. In particular, systemic inflammation and nutritional status has been proven to be involved in cancer development [8,9] and related biomarkers were evaluated as possible indicators of outcome for oncologic patients [10-14].
In 2017, Galizia et al. proposed a novel score, the Naples prognostic score (NPS), based on both inflammatory and nutritional biomarkers, for patients receiving surgery for colorectal cancer [15]. The score considered pre-operative neutrophil to lymphocyte ratio (NLR), lymphocyte to monocyte ratio (LMR), serum albumin and total cholesterol and proved to have a strong association with long-term survival.
In this retrospective study we evaluated whether NPS is associated with disease recurrence and death in a group of patients with surgically resected NSCLC.
2. Materials and Methods
2.1. Patient selection
The study is a retrospective analysis of patients who underwent surgery for NSCLC confirmed by final histology from January 2016 to December 2021. All enrolled patients were discussed in a multidisciplinary team meeting and subsequently underwent pulmonary resection (pneumonectomy, bilobectomy, lobectomy, segmentectomy, wedge resection), and lymphadenectomy. All patients’ clinical pre-operative nodal and metastatic stage was N0 and M0 and clinical stage ranged from stage I to stage IIIA. Patients with a history of infection or any surgery within the previous 3 months or any malignancy within the last 5 years preceding pulmonary resection were excluded. We also excluded anyone who had a positive history for hematological, autoimmune or immunodeficiency diseases. We finally excluded patients who had incomplete pre-operative laboratory tests.
2.2. Data collection
Data about patients demographic and clinical information were collected by clinical records, including sex, age, comorbidities smoking history, type of surgery, final histology, pT and pN and pre-operative laboratory tests about neutrophils, lymphocytes, monocytes, serum albumin and total cholesterol. NPS was calculated, as stated by the original study of Galizia et al. [15] considering NLR, LMR, serum albumin and total cholesterol. According to previous studies, 1 point was assigned if NLR≤2.96, LMR≥4.44, serum albumin<4 g/dL or total cholesterol was ≤180 mg/dL. Then patients were divided into 3 groups according to their final score; group 0 for final score 0, group 1 for final score 1 or 2 and group 2 for final score 3 or 4.
Patient follow-up data were collected from outpatient clinic records, medical inpatient records or virtual consultations. We measured the disease-free survival (DFS), as the time from the day of surgery to recurrence, and the overall survival (OS) as the time from surgery to patients’ death. We also evaluated the cancer-related survival (CRS), considering only deaths due to NSCLC.
2.3. Objective
The main goal of this retrospective study was to investigate whether the NPS is related to long-term survival in operated patients with NSCLC. Particularly, we evaluated if patients within a higher Naples group presented an increased tendency to recurrence or a poorer prognosis. We also assessed if NPS has a higher prognostic value compared to its single biomarkers.
2.4. Statistics
Statistical analysis was performed using the SPSS (IBM Corp. Released 2016. IBM SPSS Statistics, Version 26.0, Armonk, NY, USA: IBM Corp.) and a p-value less than 0.050 was considered statistically significant.
Continuous variables were reported as median and interquartile range (IQR), categorical ones as whole number and percentage.
Receiver operating characteristics (ROC) curves were performed to evaluate the ability of NPS groups, NLR, LMR, serum albumin and total cholesterol to predict prognosis by comparing their Areas under curves (AUCs)
Prognostic factors evaluation was initially based on survival curves using the Kaplan-Meier method and log rank test for DFS, OS and CRS. Afterwards, univariate Cox regression was performed. The covariates taken into consideration were: age (median, ≤72 vs >72 years), gender (male vs female), smoking history (never smoked vs former or current smoker), surgical procedure (major, including pneumonectomy, bilobectomy and lobectomy, vs sublobar, including both segmentectomy and wedge resection), side of surgery (right vs left), lobe affected by malignancy (upper or middle vs lower), pT (1 vs 2, 3 or 4), pN (0 vs 1 or 2), histology (adenocarcinoma vs squamous cell carcinoma) and Naples group. Factors significantly affecting survival at univariate analysis underwent multivariate analysis.
After this preliminary analysis, we performed a propensity score matching to reduce possible selection bias. The two considered populations were Naples groups 0 and 1 vs Naples group 2 and they were selected and matched one by one. This division was made according to the results of Kaplan-Meier analysis, with similar survivals for group 0 and 1, and after taking into consideration previous studies [16-18]. The covariates considered for this model were: age (≤72 vs >72 years old), gender, smoking history, type of surgery (major vs sublobar resection), pT (T1 vs T2-3-4), pN (N0 vs N1-2) and histology. In order to verify the homogeneity between the two groups, the standardized difference was calculated for each covariate before and after matching. Subsequently, we repeated Kaplan Meier and Cox regression analysis with the new population.
3. Results
3.1. Demographic and clinical characteristics
Demographic and clinical features of the enrolled population, consisting of 260 patients, are summarized in Table 1. Median age of patients submitted to surgery was 72 (IQR 65-77) and 64.6% of them were male. Half of the population was a former smoker while only a minority (37/260, 14.2%) denied any smoking history. The most common type of surgery was lobectomy (187/260, 71.9%) followed by wedge resection (51/260, 19.6%), segmentectomy (10/260, 3.8%), pneumonectomy (8/260, 3.1%) and bilobectomy (4/260, 1.5%). Final histology showed lung adenocarcinoma in 184 patients (70.8%). With regard to pathological staging, the majority of the cases were in stage I or II; 115/260 (44.2%) patients were pT1 and 103/260 (39.6%) pT2 while 212/260 (81.5%) had no regional lymph nodes involved in the pathology review.
With reference to NPS, 86/260 patients (33.1%) had a NLR > 2.96 and 205/260 (78.8%) a LMR < 4.44. Regarding nutritional markers, serum albumin was < 4g/dL in 99/260 patients (38.1%) and half of them had total cholesterol ≤ 180 mg/dL (127/260, 48.8%). Therefore, 28/260 patients belonged to Naples group 0, 146/260 to group 1 (56/260 with a score of 1 and 90/260 with a score of 2) and 86/260 to group 2 (63/260 with a score of 3 and 23/260 with a score of 4).
3.2. Follow-up
Median follow up was 26 months (IQR 15-40 months). 93/260 patients (35.8%) presented recurrence during this period, with a median time to recurrence of 16 months (IQR 8-29 months). A total of 44/260 deaths (16.9%) occurred and more than half of them were due to lung cancer (24/44, 54.5%). Median time to death for these patients was 13 months (IQR 6-22 months).
3.3. ROC curves
NPS was found to have the largest AUC for all the considered outcomes when compared to NLR, LMR, serum albumin and total cholesterol. In particular, the AUC values were 0.58 (95% CI 0.51-0.66, p=0.025) for risk of recurrence, 0.67 (95 CI 0.59-0.76, p<0.001) for risk of death and 0.71 (95% CI 0.60-0.81, p=0.001) for risk of cancer-related death. AUCs for the other variables are reported in Figure 1.
3.4. Survival analysis
We analyzed the influence of each NPS parameter on survival with Kaplan-Meier curves. There was no statistical significance between NLR and survival while patients with LMR<4.44 showed a shorter disease-free survival (p=0.031). At the analysis of nutritional markers, both serum albumin and total cholesterol resulted in affecting OS (p=0.003 and p<0.001 respectively) and CRS (p=0.020 and p=0.004 respectively) while they had no influence on DFS.
After this preliminary analysis, we performed Kaplan-Meier curves to evaluate differences among the Naples groups on survival. A statistically significant difference was found among groups in the DFS (p=0.037), as shown in Figure 2. Recurrence occurred in 6/28 patients in group 0 (21.4%), 48/146 patients in group 1 (32.9%) and 39/86 patients in group 2 (45.3%). 5-year DFS was 55.8% for group 0, 44.4% for group 1 and 37.8% for group 2.
NPS also affected OS, as reported in Figure 3 (p<0.001). We recorded 1 case of death in group 0 (1/28, 3.6%), 17 cases in group 1 (17/146, 11.6%) and 26 cases in group 2 (26/86, 30.2%). 5-year OS was 92.9% for group 0, 83.8% for group 1 and 59.4% for group 2.
Finally, a significant difference was found in the CRS with p=0.001 (Figure 4). Deaths due to cancer were 8/146 in group 1 (5.5%) and 16/86 in group 2 (18.6%) while no cases were registered in group 0. 5-year CRS was 100.0% for group 0, 91.4% for group 1 and 72.2% for group 2.
Cox regression analysis (Table 2) showed that a higher Naples group was a predictor of shorter DFS only at univariate analysis (p=0.011). Conversely, at multivariate analysis, a higher Naples group was associated with worse OS (HR=2.5, 95% CI 1.4-4.3, p<0.001) together with a pT>1 (HR=3.5, 95% CI 1.5-7.9, p=0.003) Similarly, a decreased CRS was associated with higher Naples group (HR=3.5, 95% CI 1.6-7.9, p=0.002), pT>1 (HR=4.0, 95% CI 1.2-13.8, p=0.027), and the presence of metastatic regional lymph nodes at final histology (HR=2.8, 95% CI 1.3-6.3, p=0.015).
3.5. Propensity score matching
The standardized difference before and after matching for each covariate is reported in Table 3. Propensity score matching extrapolated a final population of 154 patients, 77 belonging to Naples group 0 or 1 and 77 to Naples group 2.
As shown in Figure 5, DFS did not present significant differences between Naples groups 0 and 1 vs group 2. In detail, Naples groups 0 and 1 had a 5-year DFS rate of 38.0%, and Naples group 2, had 41.2% (p=0.34). On the other hand, a significant difference was confirmed between group 0-1 and group 2 in OS (p=0.018), with a 5-year survival rate of 83.5% and 61.1% respectively (Figure 6), and in CRS (p=0.007), showing 5-year survival rates of 95.3% for Naples group 0 and 1 and 74.7% for Naples group 2 (Figure 7).
The Cox regression analysis (Table 4) showed that NPS did not affect DFS at univariate analysis (p=0.34). Conversely, it resulted in being a significant prognostic factor at multivariate analysis for OS (HR=2.5, 95% CI 1.2-5.2, p=0.018) together with pT (HR=5.2, 95% CI 1.6-17.0, p=0.007) and the only one for CRS (HR=5.2, 95% CI 1.5-18.2, p=0.010).
4. Discussion
Systemic inflammation has been proven to play a key role in tumorigenesis and several studies demonstrated that some inflammatory biomarkers from routinary laboratory tests could be a predictor of long-term outcome in patients with NSCLC. For example, neutrophils stimulate angiogenesis by secreting proangiogenic factors and are involved in the production of growth factors. Consequently, neutrophilia is usually related to a poorer prognosis [19]. Monocytes stimulate tumor angiogenesis by producing vascular endothelial growth factor (VEGF) and they can also differentiate into tumor-associated macrophages, thus favoring the creation of tumor micro-enviroment [20,21]. Tumor angiogenesis and growth seems to be also promoted by an increased number of platelets, which release VEGF and whose proliferation is stimulated by pro-inflammatory cytokines [22,23]. On the contrary, lymphocytes react against cancer, by inhibiting cellular proliferation and migration and their high levels may correlate with a positive prognosis [24].
Based on the above, new prognostic tools such as pre-operative NLR, LMR and platelet to lymphocyte ratio (PLR) started to be used, achieving a strong correlation with all lung and other types of cancer prognosis [8,25,26]
Systemic inflammation might be usually related to a nutritional impairment due to an increase of catabolic processes and energy consumption. Therefore, low levels of nutritional markers such as serum albumin, whose synthesis is inhibited by systemic inflammation [27], or cholesterol, which is a pivotal component of cellular membranes and is involved in cell homeostasis [28], could be considered as a bad prognosticator [29-30]. Pre-operative nutritional scores, such as the Prognostic Nutritional Index (PNI) or the Controlling Nutritional Status (CONUT) score are independent prognostic factors in lung cancer [31,32].
In 2017, Galizia et al. assessed the Naples Prognostic Score which was a new prognostic tool considering comprehensively both inflammatory (NLR and LMR) and nutritional biomarkers (serum albumin and total cholesterol) [15]. NPS proved to be a prognostic factor for colorectal cancer in terms of OS and DFS. NPS was also applied in pancreatic cancer [18], osteosarcoma [33], endometrial cancer [34], gastric [35] and esophageal cancer [36], showing a significant correlation with DFS [33,34], OS [18,33-35] or CRS [36].
To the best of our knowledge, only a few studies analyzed the role of NPS in NSCLC. Guo et al. evaluated patients with unresectable stage III NSCLC and showed NPS was an independent prognostic factor for both DFS and OS [37]. Similar results were obtained by Zou et al. who studied NPS in patients with locally advanced NSCLC following neo-adjuvant therapy [38]. To the best of our knowledge our study involved operated NSCLC patients and was the first one to show a correlation between NPS and CRS in these patients. Operated early stage NSCLC patients were also studied by Dahu Ren et al [39] who found a strong correlation of NPS with recurrence free survival (RFS) and OS while Li et al [16] found it with DFS and OS. Finally, Peng et al reported NPS as a significant prognosticator for both DFS and OS in all patients with NSCLC [40]. Our study proved a strong association between NPS groups and OS and CRS, as shown at Kaplan-Meier analysis and multivariate Cox regression. These results were confirmed after propensity score matching which balanced potential confounding factors regarding clinical and pathological features of the enrolled population between Naples group 0-1 vs 2. Regarding DFS, NPS proved to be a significant indicator of prognosis only in the pre-propensity analysis at Kaplan-Meier and univariate Cox regression. Unlike the above studies, we took into account also CRS, which evaluates only deaths due to cancer and is more specific than OS.
Our findings confirm that NPS may be a strong predictor of long-term survival outcomes in patients with NSCLC following surgical resection. NPS is simple to use in daily clinical practice as it utilizes parameters that are readily available in patients due to undergo thoracic surgery with curative intent. Following extensive validation, it may be encountered in combination with clinical and radiological aspects to inform the decision-making process with regard to treatment and interventions.
This study has some limitations. It is a single-center retrospective study, thus making possible selection bias. We addressed this by performing propensity score matching which reduced the differences in clinical and pathological features between the groups. Another limitation is the small sample, further reduced after propensity score matching, therefore reducing the possibility to generalize the results. Further larger multicentric studies are needed to validate these findings.
5. Conclusions
NPS is an easily obtainable index which considers comprehensively inflammatory and nutritional status of patients with NSCLC. It was proved to be a significant prognostic factor of long-term survival outcomes in patients with NSCLC after surgical treatment. If validated by further studies, NPS could be considered to tailor an individualized treatment in patients with a higher risk of poor outcome.
Author Contributions
Conceptualization, S.E.; methodology, S.E, A.P., A.S.; software, A.P.; validation, G.H., A.S. and E.P.; formal analysis, S.E., G.H., A.S., E.P.; investigation, S.E, A.P.; data curation, A.P., F.C.; writing—original draft preparation, S.E., A.P.; writing—review and editing, S.E., G.H., E.P.; visualization, S.E.; supervision, S.E., E.P. All authors have read and agreed to the published version of the manuscript.
Funding
This research received no external funding.
Informed Consent Statement
Informed consent for the use of personal data for scientific reasons was obtained from all subjects involved in the study.
Conflicts of Interest
The authors declare no conflict of interest.
Acknowledgments
The authors acknowledge the residency programme in Thoracic Surgery of Rome Tor Vergata University.
Presentation
This work was presented at the 2nd International Hybrid Thoracic Surgery Workshop held in Monte Porzio Catone, Rome, Italy, October 20th 2023.
References
- Bade BC, Dela Cruz CS. Lung Cancer 2020: Epidemiology, Etiology, and Prevention. Clin Chest Med. 2020 Mar;41(1):1-24. [CrossRef]
- Siegel RL, Miller KD, Fuchs HE, Jemal A. Cancer Statistics, 2021. CA Cancer J Clin. 2021 Jan;71(1):7-33. Erratum in: CA Cancer J Clin. 2021 Jul;71(4):359. [CrossRef]
- Ganti AK, Klein AB, Cotarla I, Seal B, Chou E. Update of Incidence, Prevalence, Survival, and Initial Treatment in Patients With Non-Small Cell Lung Cancer in the US. JAMA Oncol. 2021 Dec 1;7(12):1824-1832. [CrossRef] [PubMed]
- Sonoda D, Matsuura Y, Kondo Y, Ichinose J, Nakao M, Ninomiya H, Ishikawa Y, Nishio M, Okumura S, Satoh Y, Mun M. Characteristics of surgically resected non-small cell lung cancer patients with post-recurrence cure. Thorac Cancer. 2020 Nov;11(11):3280-3288. Epub 2020 Sep 22. [CrossRef] [PubMed]
- Taylor MD, Nagji AS, Bhamidipati CM, Theodosakis N, Kozower BD, Lau CL, Jones DR. Tumor recurrence after complete resection for non-small cell lung cancer. Ann Thorac Surg. 2012 Jun;93(6):1813-20; discussion 1820-1. Epub 2012 Apr 26. [CrossRef] [PubMed]
- Gourcerol D, Scherpereel A, Debeugny S, Porte H, Cortot AB, Lafitte JJ. Relevance of an extensive follow-up after surgery for nonsmall cell lung cancer. Eur Respir J. 2013 Nov;42(5):1357-64. Epub 2013 Mar 21. [CrossRef] [PubMed]
- Goldstraw P, Chansky K, Crowley J, Rami-Porta R, Asamura H, Eberhardt WE, Nicholson AG, Groome P, Mitchell A, Bolejack V; International Association for the Study of Lung Cancer Staging and Prognostic Factors Committee, Advisory Boards, and Participating Institutions; International Association for the Study of Lung Cancer Staging and Prognostic Factors Committee Advisory Boards and Participating Institutions. The IASLC Lung Cancer Staging Project: Proposals for Revision of the TNM Stage Groupings in the Forthcoming (Eighth) Edition of the TNM Classification for Lung Cancer. J Thorac Oncol. 2016 Jan;11(1):39-51. [CrossRef] [PubMed]
- Mazzella A, Maiolino E, Maisonneuve P, Loi M, Alifano M. Systemic Inflammation and Lung Cancer: Is It a Real Paradigm? Prognostic Value of Inflammatory Indexes in Patients with Resected Non-Small-Cell Lung Cancer. Cancers (Basel). 2023 Mar 20;15(6):1854. [CrossRef] [PubMed]
- Zitvogel L, Pietrocola F, Kroemer G. Nutrition, inflammation and cancer. Nat Immunol. 2017 Jul 19;18(8):843-850. [CrossRef] [PubMed]
- Bullock AF, Greenley SL, McKenzie GAG, Paton LW, Johnson MJ. Relationship between markers of malnutrition and clinical outcomes in older adults with cancer: systematic review, narrative synthesis and meta-analysis. Eur J Clin Nutr. 2020 Nov;74(11):1519-1535. Epub 2020 May 4. [CrossRef] [PubMed]
- Toyokawa T, Muguruma K, Yoshii M, Tamura T, Sakurai K, Kubo N, Tanaka H, Lee S, Yashiro M, Ohira M. Clinical significance of prognostic inflammation-based and/or nutritional markers in patients with stage III gastric cancer. BMC Cancer. 2020 Jun 3;20(1):517. [CrossRef] [PubMed]
- Yamamoto T, Kawada K, Obama K. Inflammation-Related Biomarkers for the Prediction of Prognosis in Colorectal Cancer Patients. Int J Mol Sci. 2021 Jul 27;22(15):8002. [CrossRef] [PubMed]
- Wang D, Hu X, Xiao L, Long G, Yao L, Wang Z, Zhou L. Prognostic Nutritional Index and Systemic Immune-Inflammation Index Predict the Prognosis of Patients with HCC. J Gastrointest Surg. 2021 Feb;25(2):421-427. Epub 2020 Feb 5. [CrossRef] [PubMed]
- Yildirim M, Yildiz M, Duman E, Goktas S, Kaya V. Prognostic importance of the nutritional status and systemic inflammatory response in non-small cell lung cancer. J BUON. 2013 Jul-Sep;18(3):728-32. [PubMed]
- Galizia G, Lieto E, Auricchio A, Cardella F, Mabilia A, Podzemny V, Castellano P, Orditura M, Napolitano V. Naples Prognostic Score, Based on Nutritional and Inflammatory Status, is an Independent Predictor of Long-term Outcome in Patients Undergoing Surgery for Colorectal Cancer. Dis Colon Rectum. 2017 Dec;60(12):1273-1284. [CrossRef] [PubMed]
- Li S, Wang H, Yang Z, Zhao L, Lv W, Du H, Che G, Liu L. Naples Prognostic Score as a novel prognostic prediction tool in video-assisted thoracoscopic surgery for early-stage lung cancer: a propensity score matching study. Surg Endosc. 2021 Jul;35(7):3679-3697. Epub 2020 Aug 3. [CrossRef] [PubMed]
- Miyamoto Y, Hiyoshi Y, Daitoku N, Okadome K, Sakamoto Y, Yamashita K, Kuroda D, Sawayama H, Iwatsuki M, Baba Y, Yoshida N, Baba H. Naples Prognostic Score Is a Useful Prognostic Marker in Patients With Metastatic Colorectal Cancer. Dis Colon Rectum. 2019 Dec;62(12):1485-1493. [CrossRef] [PubMed]
- Nakagawa N, Yamada S, Sonohara F, Takami H, Hayashi M, Kanda M, Kobayashi D, Tanaka C, Nakayama G, Koike M, Fujiwara M, Kodera Y. Clinical Implications of Naples Prognostic Score in Patients with Resected Pancreatic Cancer. Ann Surg Oncol. 2020 Mar;27(3):887-895. Epub 2019 Dec 17. [CrossRef] [PubMed]
- van Egmond M, Bakema JE. Neutrophils as effector cells for antibody-based immunotherapy of cancer. Semin Cancer Biol. 2013 Jun;23(3):190-9. Epub 2012 Dec 31. [CrossRef] [PubMed]
- Laviron M, Combadière C, Boissonnas A. Tracking Monocytes and Macrophages in Tumors With Live Imaging. Front Immunol. 2019 May 31;10:1201. [CrossRef] [PubMed]
- Qian BZ, Pollard JW. Macrophage diversity enhances tumor progression and metastasis. Cell. 2010 Apr 2;141(1):39-51. [CrossRef] [PubMed]
- Bambace NM, Holmes CE. The platelet contribution to cancer progression. J Thromb Haemost. 2011 Feb;9(2):237-49. [CrossRef] [PubMed]
- Wiesner T, Bugl S, Mayer F, Hartmann JT, Kopp HG. Differential changes in platelet VEGF, Tsp, CXCL12, and CXCL4 in patients with metastatic cancer. Clin Exp Metastasis. 2010 Mar;27(3):141-9. Epub 2010 Feb 25. [CrossRef] [PubMed]
- Mantovani A, Allavena P, Sica A, Balkwill F. Cancer-related inflammation. Nature. 2008 Jul 24;454(7203):436-44. [CrossRef] [PubMed]
- Nishijima TF, Muss HB, Shachar SS, Tamura K, Takamatsu Y. Prognostic value of lymphocyte-to-monocyte ratio in patients with solid tumors: A systematic review and meta-analysis. Cancer Treat Rev. 2015 Dec;41(10):971-8. Epub 2015 Oct 23. [CrossRef] [PubMed]
- Zhou X, Du Y, Huang Z, Xu J, Qiu T, Wang J, Wang T, Zhu W, Liu P. Prognostic value of PLR in various cancers: a meta-analysis. PLoS One. 2014 Jun 26;9(6):e101119. [CrossRef] [PubMed]
- Yang Z, Zheng Y, Wu Z, Wen Y, Wang G, Chen S, Tan F, Li J, Wu S, Dai M, Li N, He J. Association between pre-diagnostic serum albumin and cancer risk: Results from a prospective population-based study. Cancer Med. 2021 Jun;10(12):4054-4065. Epub 2021 May 26. [CrossRef] [PubMed]
- Kritchevsky SB, Kritchevsky D. Serum cholesterol and cancer risk: an epidemiologic perspective. Annu Rev Nutr. 1992;12:391-416. [CrossRef] [PubMed]
- Miura K, Hamanaka K, Koizumi T, Kitaguchi Y, Terada Y, Nakamura D, Kumeda H, Agatsuma H, Hyogotani A, Kawakami S, Yoshizawa A, Asaka S, Ito KI. Clinical significance of preoperative serum albumin level for prognosis in surgically resected patients with non-small cell lung cancer: Comparative study of normal lung, emphysema, and pulmonary fibrosis. Lung Cancer. 2017 Sep;111:88-95. Epub 2017 Jul 17. [CrossRef] [PubMed]
- Zhang Y, Xu J, Lou Y, Hu S, Yu K, Li R, Zhang X, Jin B, Han B. Pretreatment direct bilirubin and total cholesterol are significant predictors of overall survival in advanced non-small-cell lung cancer patients with EGFR mutations. Int J Cancer. 2017 Apr 1;140(7):1645-1652. Epub 2017 Jan 12. [CrossRef] [PubMed]
- Li D, Yuan X, Liu J, Li C, Li W. Prognostic value of prognostic nutritional index in lung cancer: a meta-analysis. J Thorac Dis. 2018 Sep;10(9):5298-5307. [CrossRef] [PubMed]
- Zhang Y, Kong FF, Zhu ZQ, Shan HX. Controlling Nutritional Status (CONUT) score is a prognostic marker in III-IV NSCLC patients receiving first-line chemotherapy. BMC Cancer. 2023 Mar 9;23(1):225. [CrossRef] [PubMed]
- Yang Q, Chen T, Yao Z, Zhang X. Prognostic value of pre-treatment Naples prognostic score (NPS) in patients with osteosarcoma. World J Surg Oncol. 2020 Jan 30;18(1):24. [CrossRef] [PubMed]
- Li Q, Cong R, Wang Y, Kong F, Ma J, Wu Q, Ma X. Naples prognostic score is an independent prognostic factor in patients with operable endometrial cancer: Results from a retrospective cohort study. Gynecol Oncol. 2021 Jan;160(1):91-98. Epub 2020 Oct 17. [CrossRef] [PubMed]
- Xiong J, Hu H, Kang W, Liu H, Ma F, Ma S, Li Y, Jin P, Tian Y. Prognostic Impact of Preoperative Naples Prognostic Score in Gastric Cancer Patients Undergoing Surgery. Front Surg. 2021 May 21;8:617744. [CrossRef] [PubMed]
- Feng JF, Zhao JM, Chen S, Chen QX. Naples Prognostic Score: A Novel Prognostic Score in Predicting Cancer-Specific Survival in Patients With Resected Esophageal Squamous Cell Carcinoma. Front Oncol. 2021 May 28;11:652537. [CrossRef] [PubMed]
- Guo D, Liu J, Li Y, Li C, Liu Q, Ji S, Zhu S. Evaluation of Predictive Values of Naples Prognostic Score in Patients with Unresectable Stage III Non-Small Cell Lung Cancer. J Inflamm Res. 2021 Nov 23;14:6129-6141. [CrossRef] [PubMed]
- Zou Z, Li J, Ji X, Wang T, Chen Q, Liu Z, Ji S. Naples Prognostic Score as an Independent Predictor of Survival Outcomes for Resected Locally Advanced Non-Small Cell Lung Cancer Patients After Neoadjuvant Treatment. J Inflamm Res. 2023 Feb 23;16:793-807. [CrossRef] [PubMed]
- Ren D, Wu W, Zhao Q, Zhang X, Duan G. Clinical Significance of Preoperative Naples Prognostic Score in Patients With Non-Small Cell Lung Cancer. Technol Cancer Res Treat. 2022 Jan-Dec;21:15330338221129447. [CrossRef] [PubMed]
- Peng SM, Ren JJ, Yu N, Xu JY, Chen GC, Li X, Li DP, Yang J, Li ZN, Zhang YS, Qin LQ. The prognostic value of the Naples prognostic score for patients with non-small-cell lung cancer. Sci Rep. 2022 Apr 6;12(1):5782. [CrossRef] [PubMed]
Figure 1.
Receiver operating characteristics (ROC) curver for Naples Prognostic Score and its variables.
Figure 1.
Receiver operating characteristics (ROC) curver for Naples Prognostic Score and its variables.
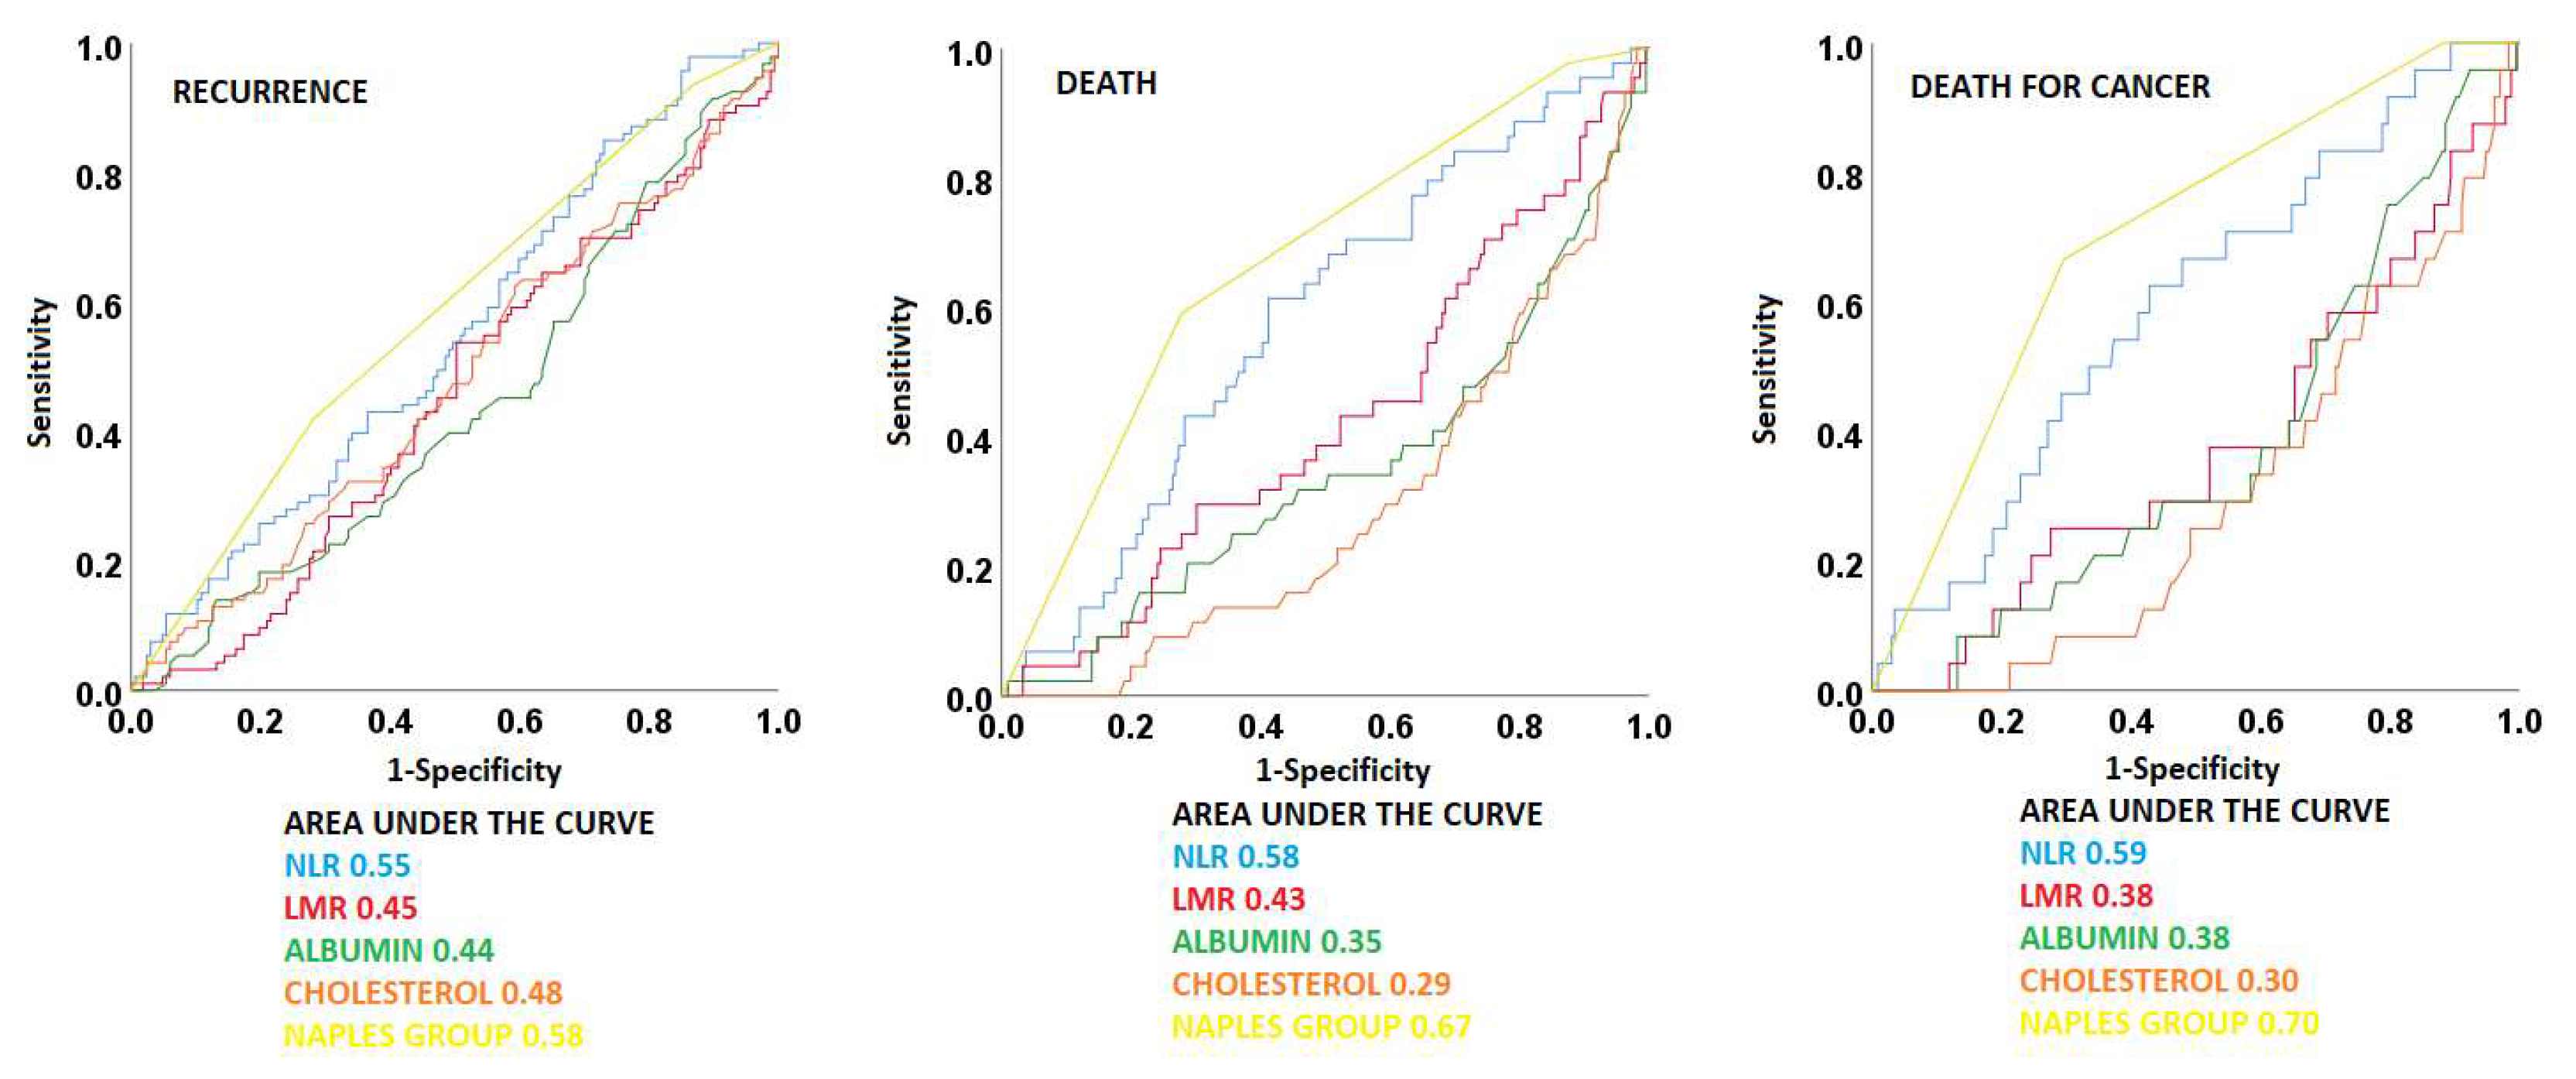
Figure 2.
Kaplan Meier curve for disease-free survival.
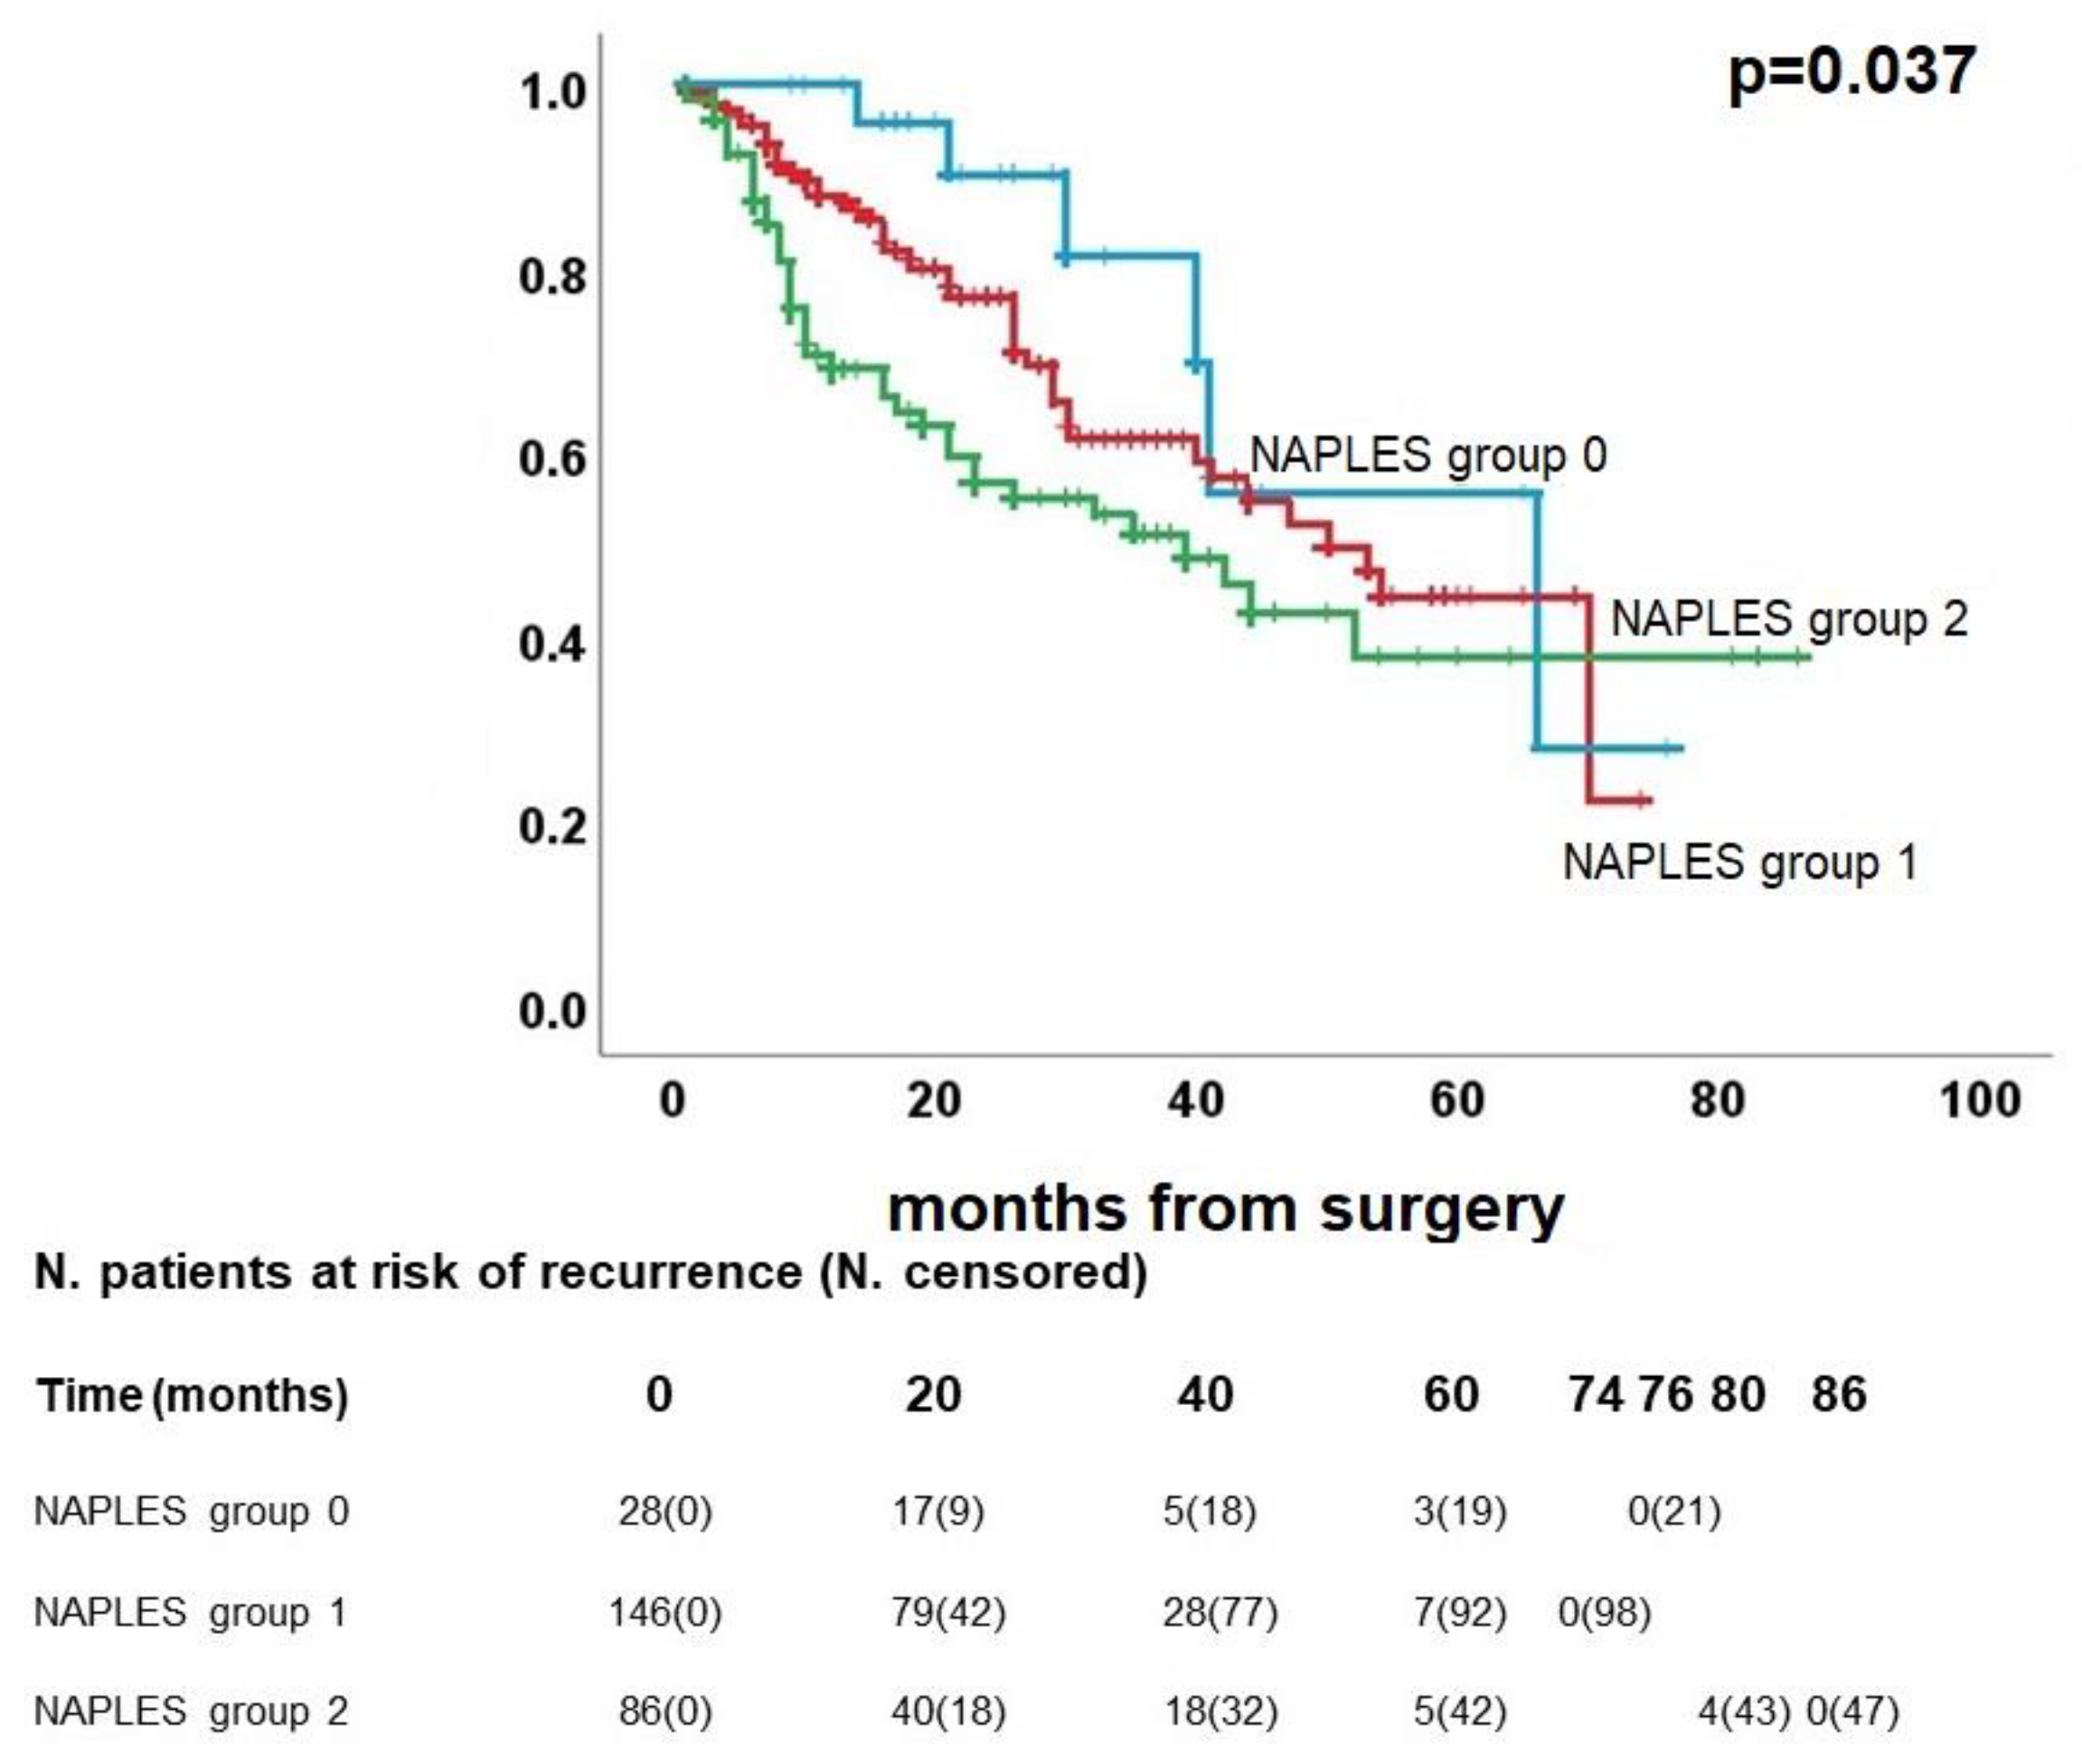
Figure 3.
Kaplan Meier curve for overall survival.
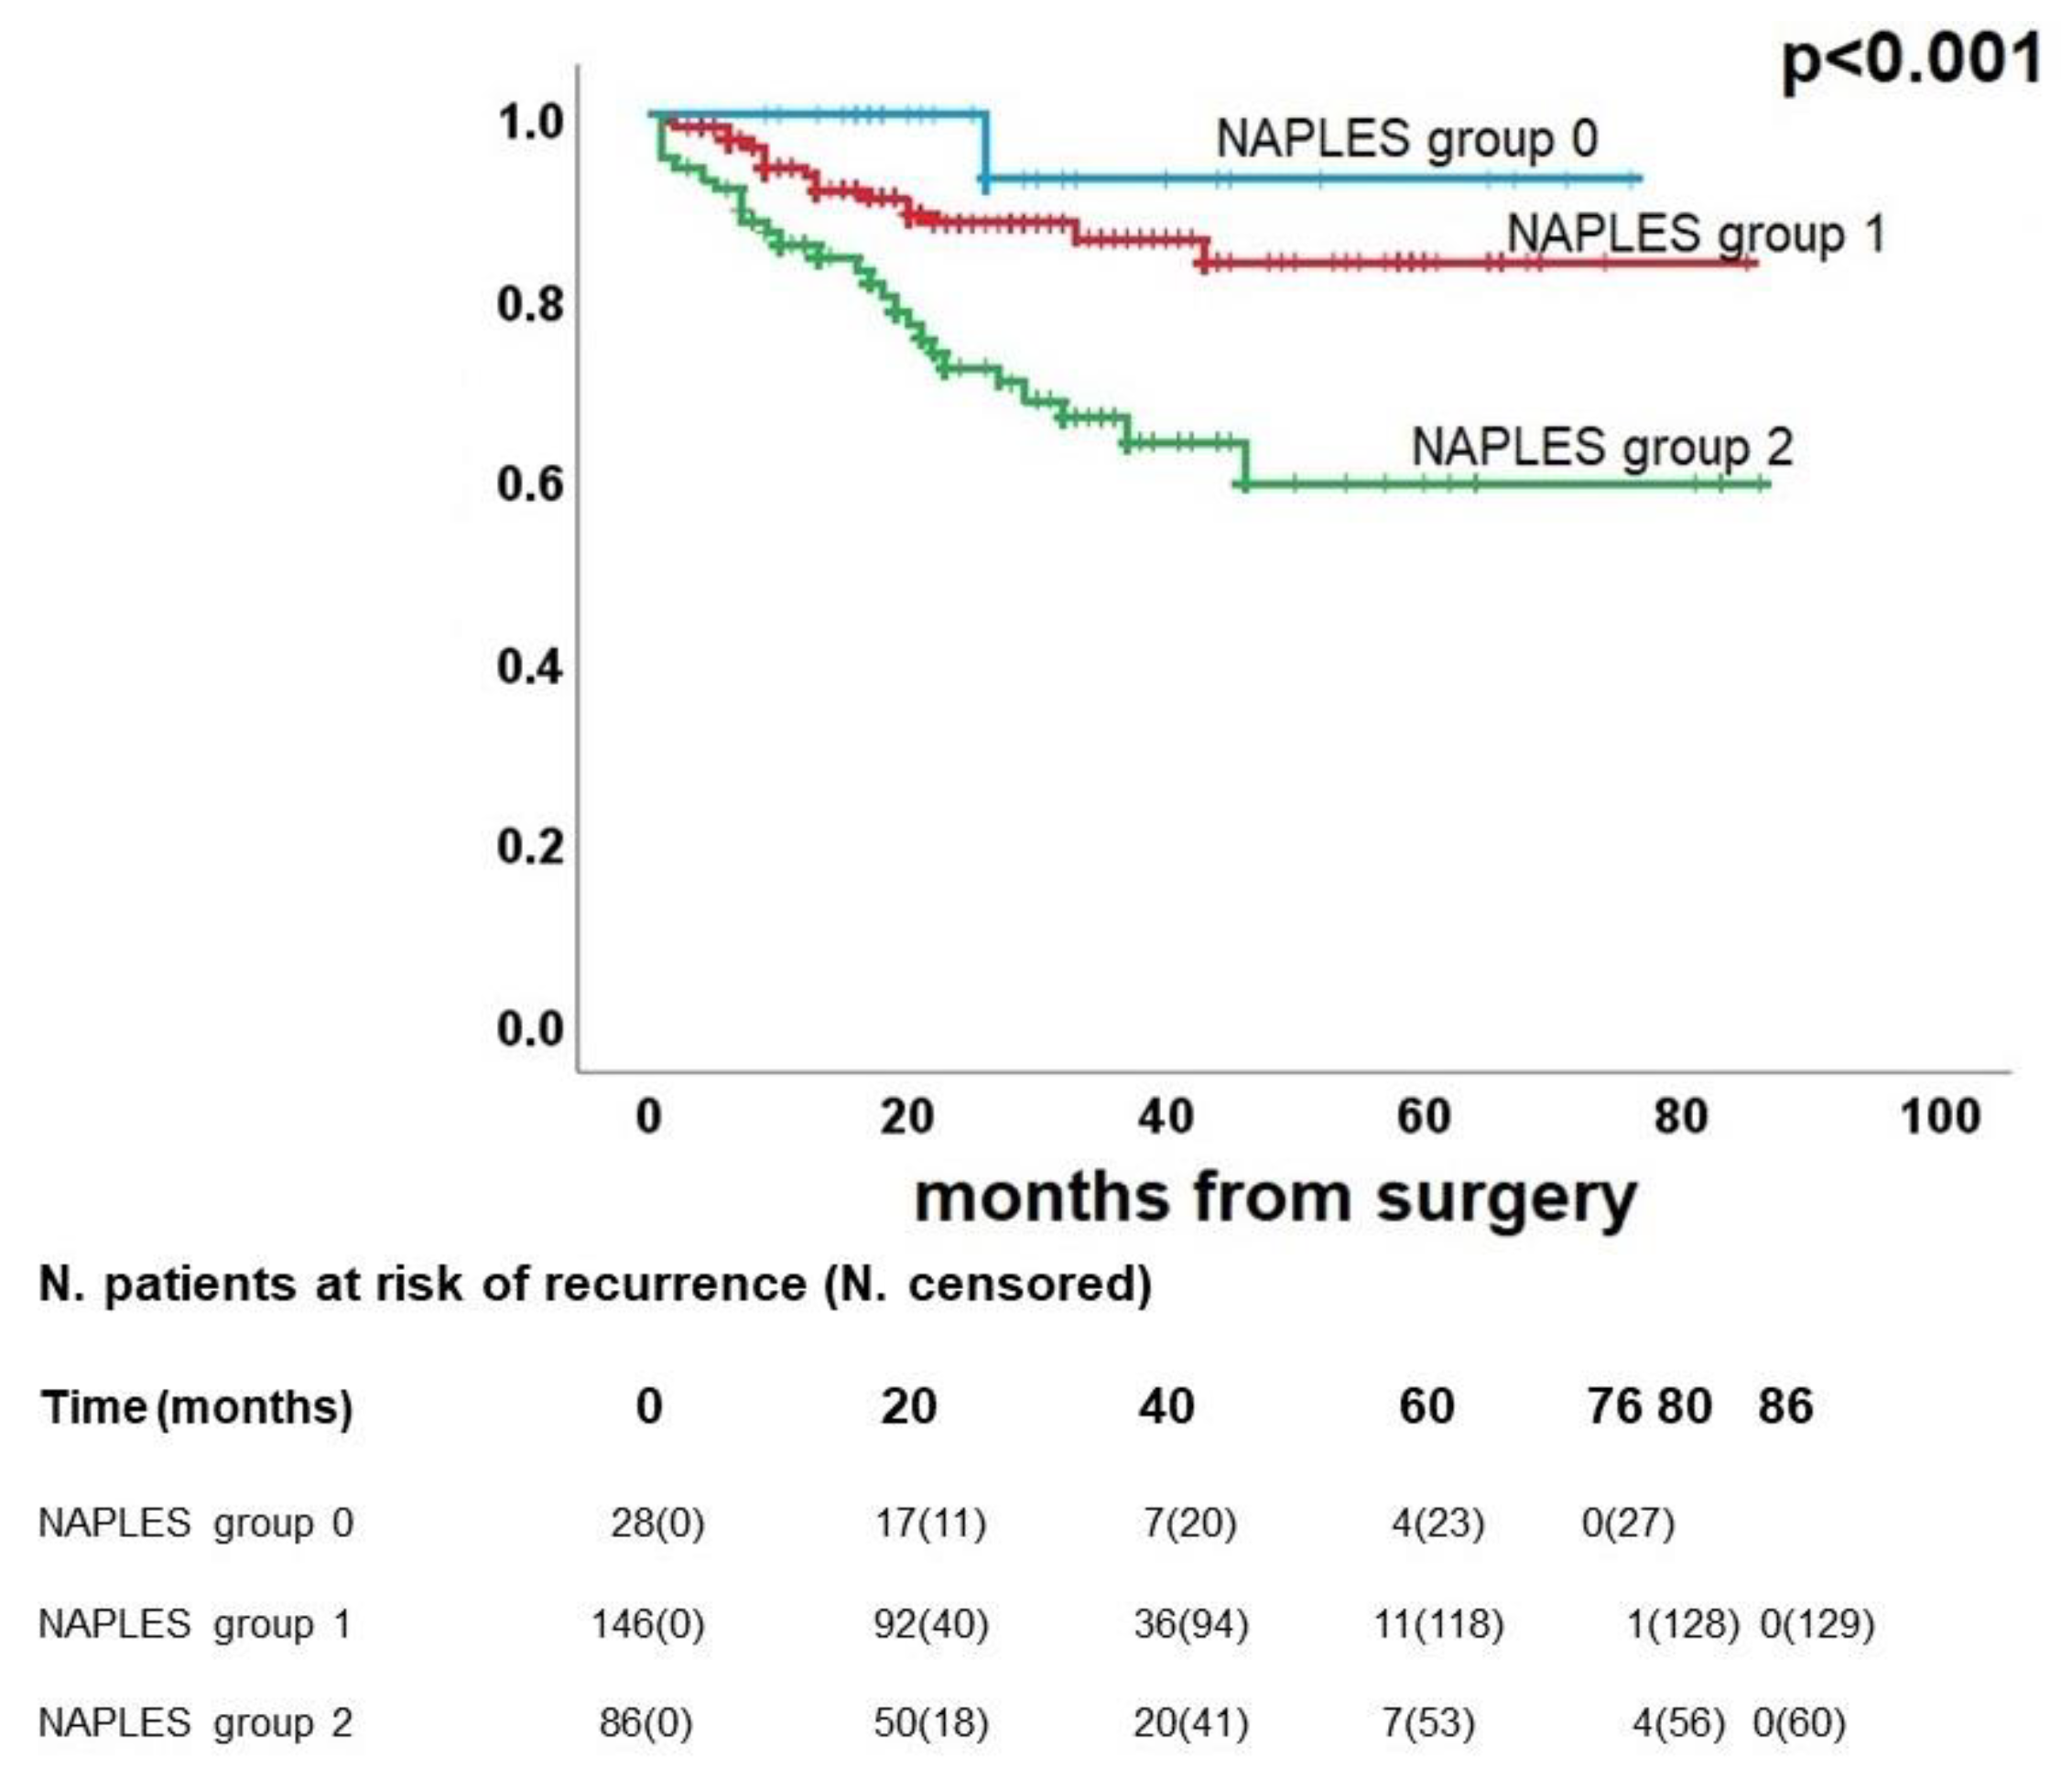
Figure 4.
Kaplan Meier curve for cancer-related survival.
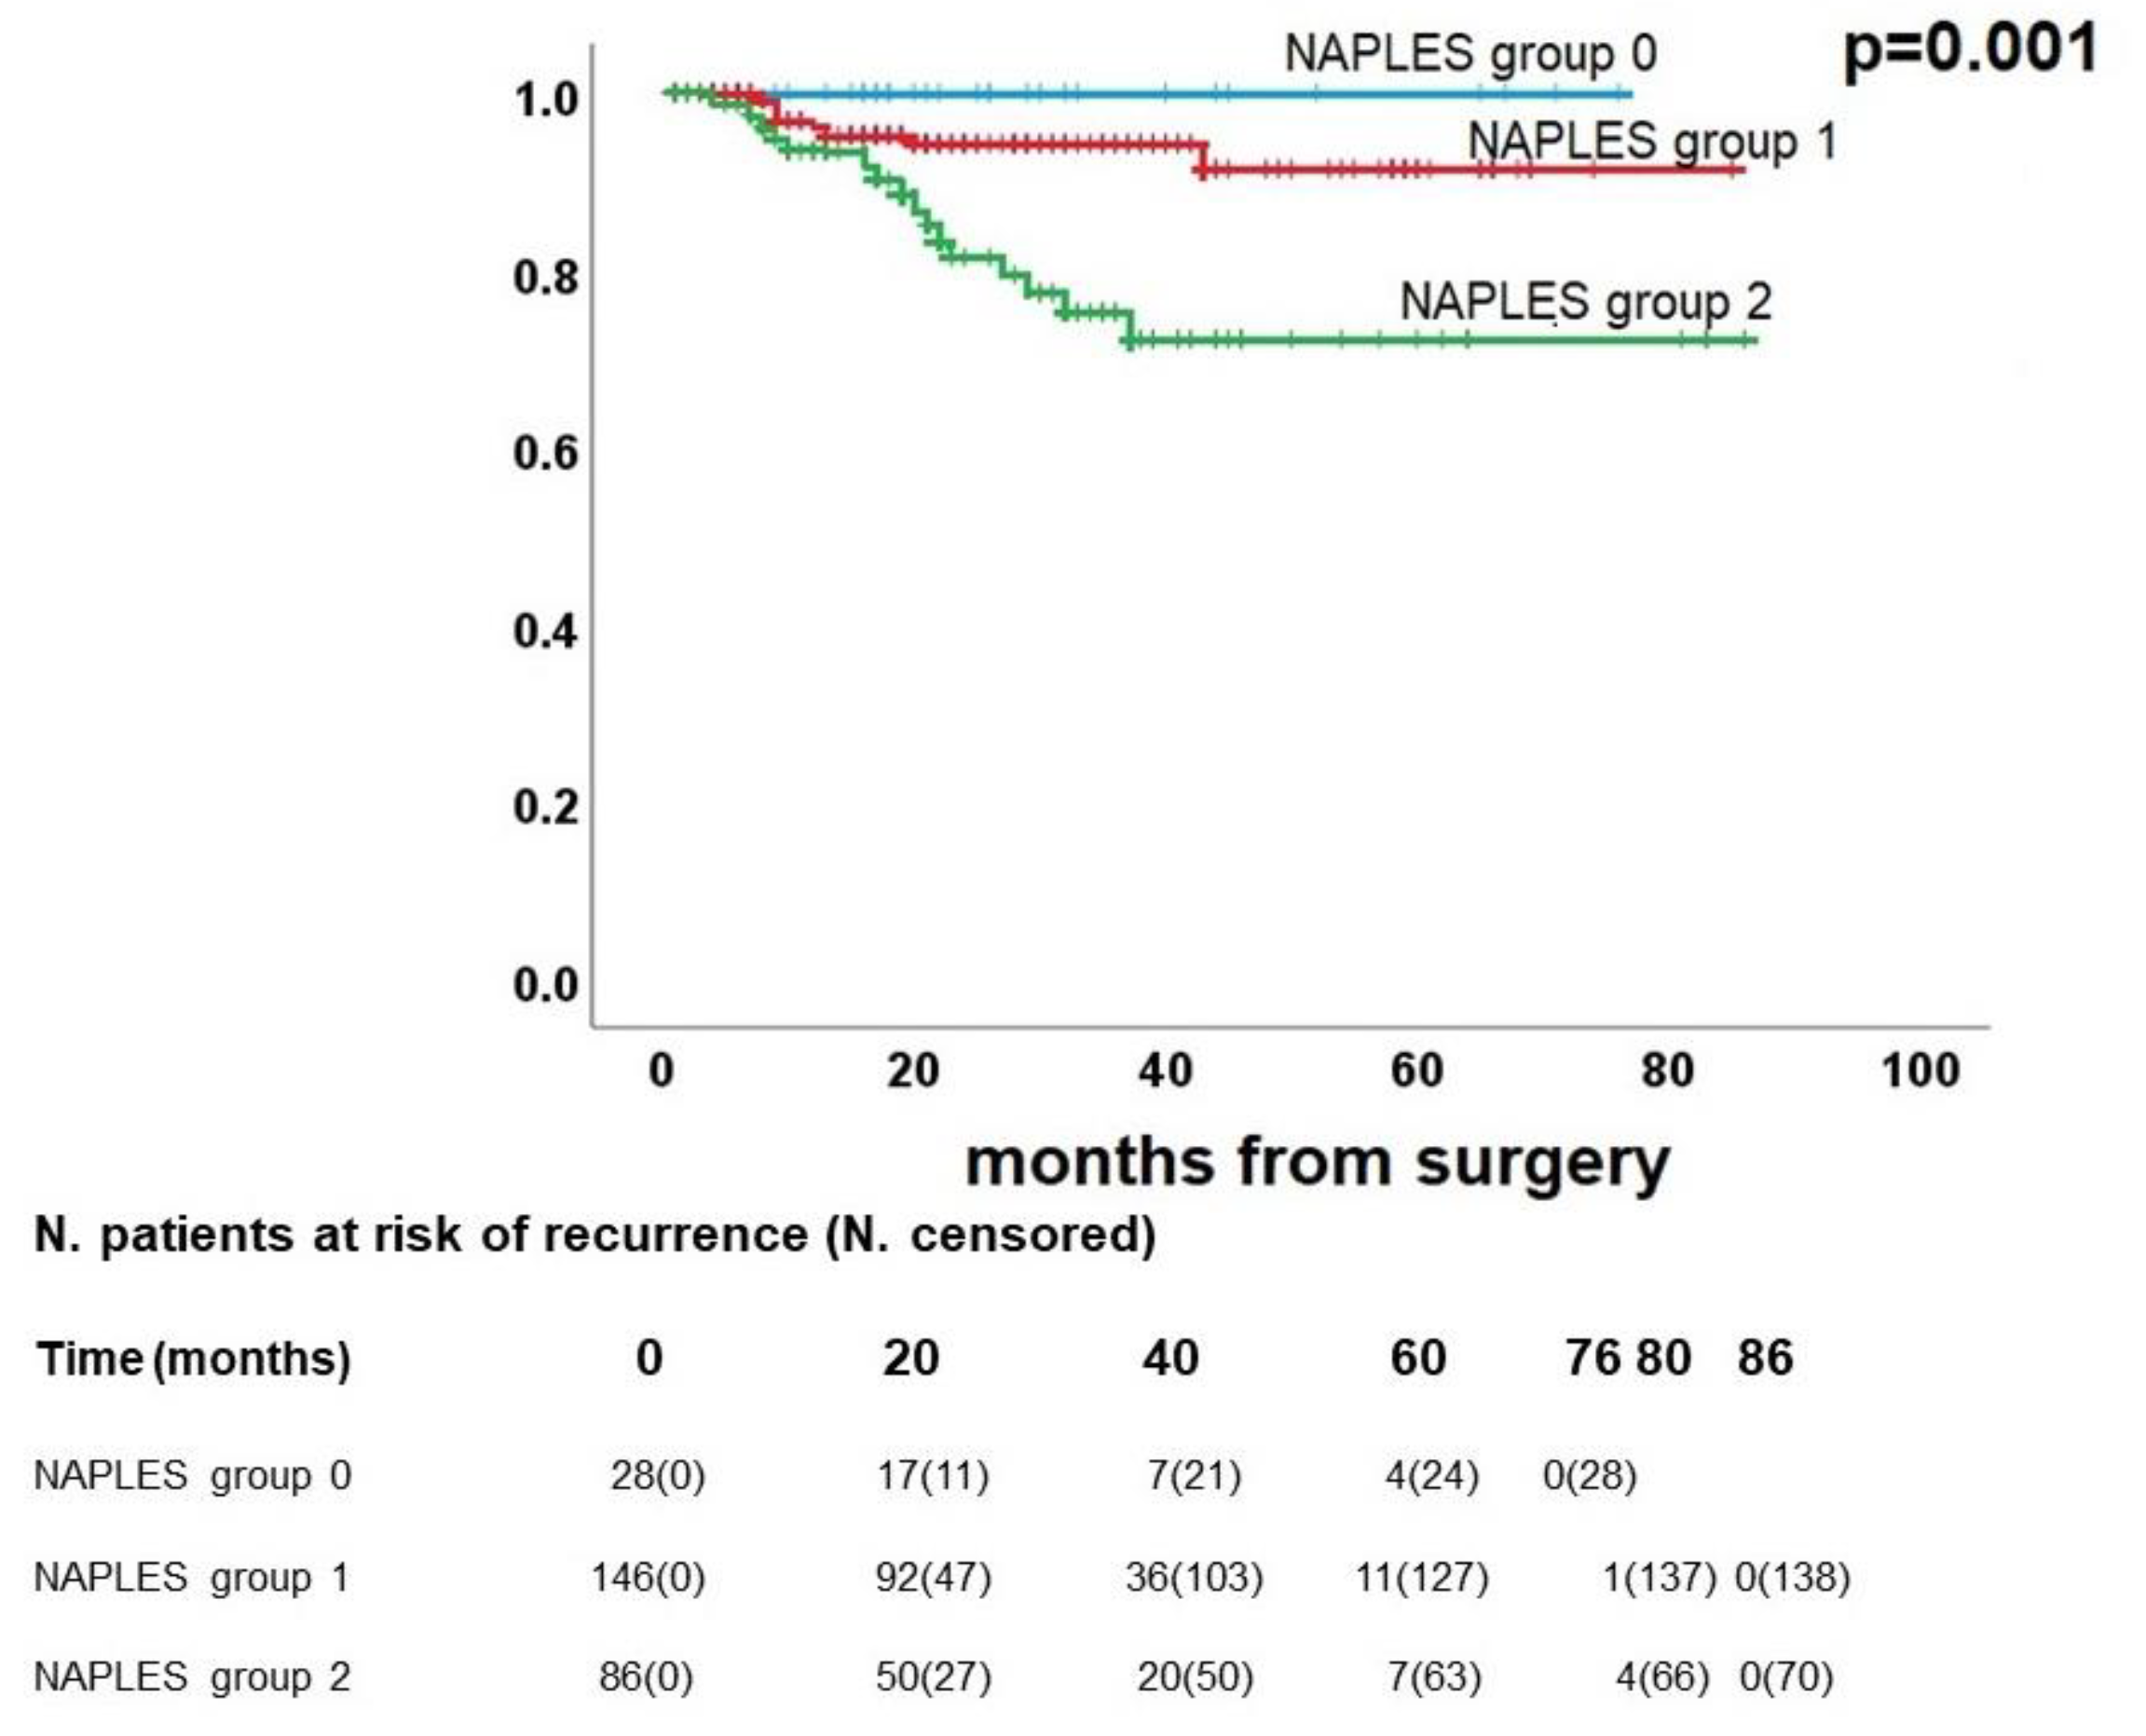
Figure 5.
Post-propensity Kaplan Meier curve for disease-free survival.
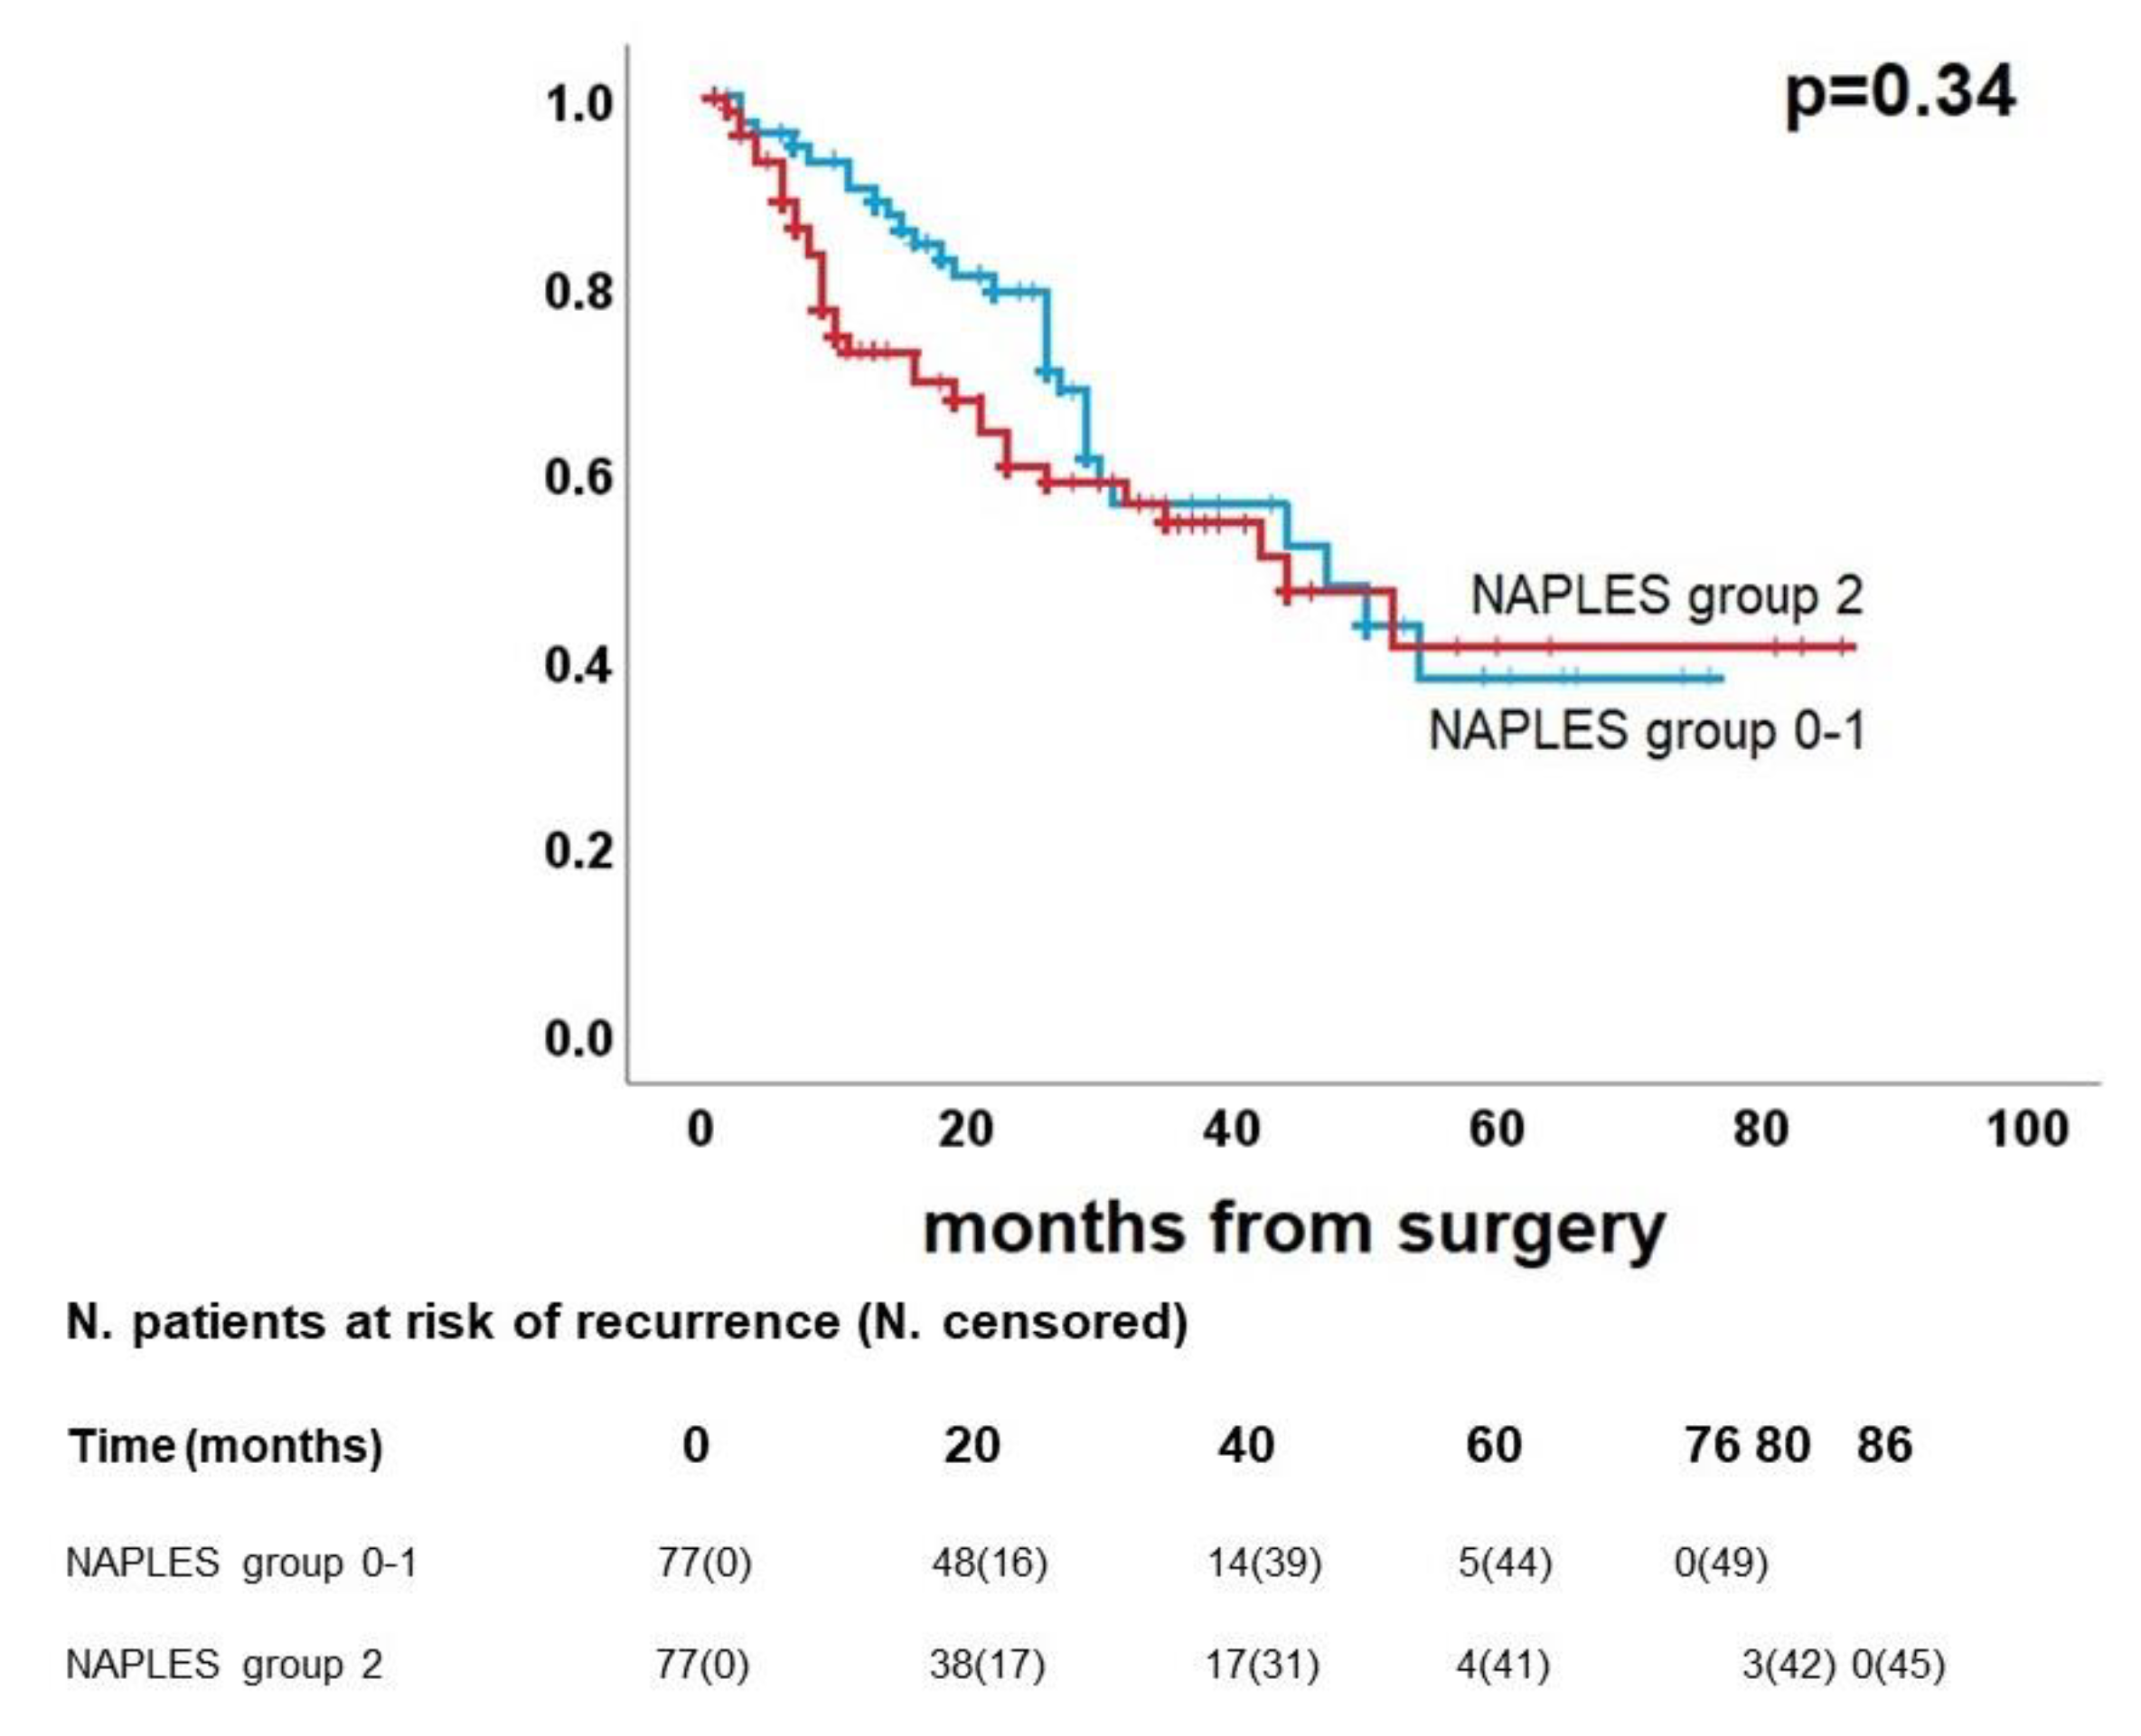
Figure 6.
Post-propensity Kaplan Meier curve for overall survival.
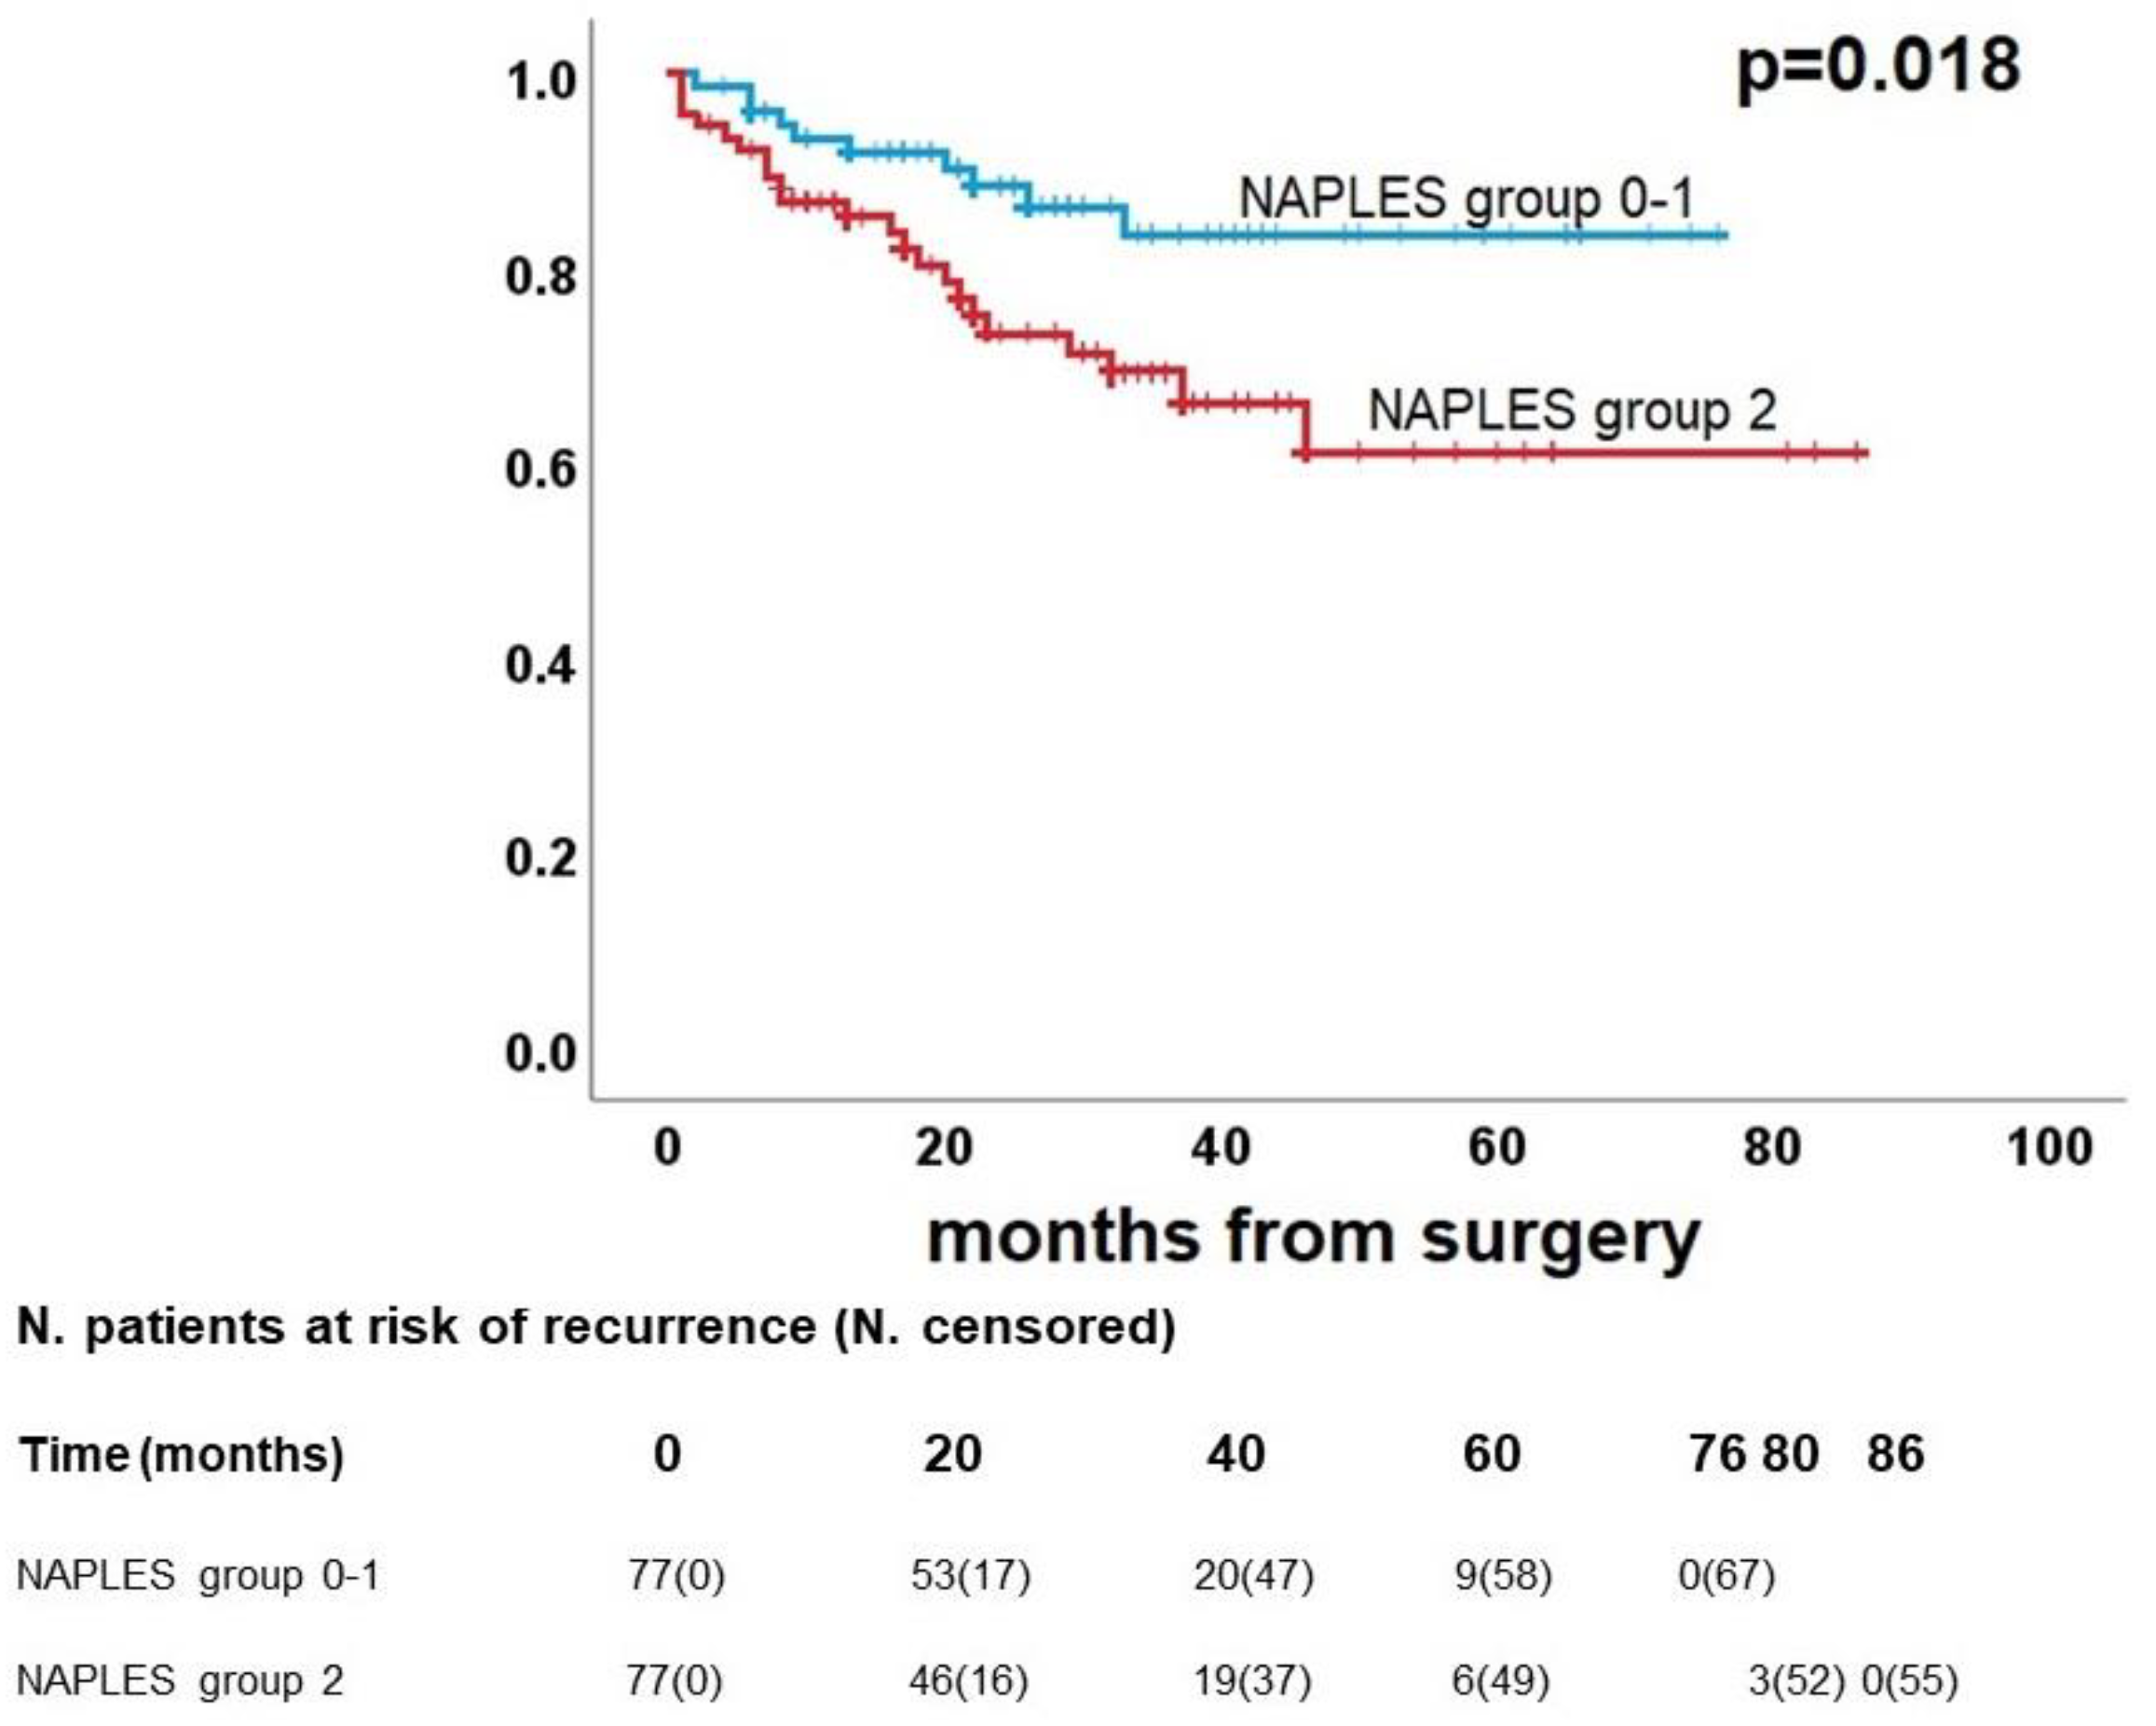
Figure 7.
Post-propensity Kaplan Meier curve for cancer-related survival.
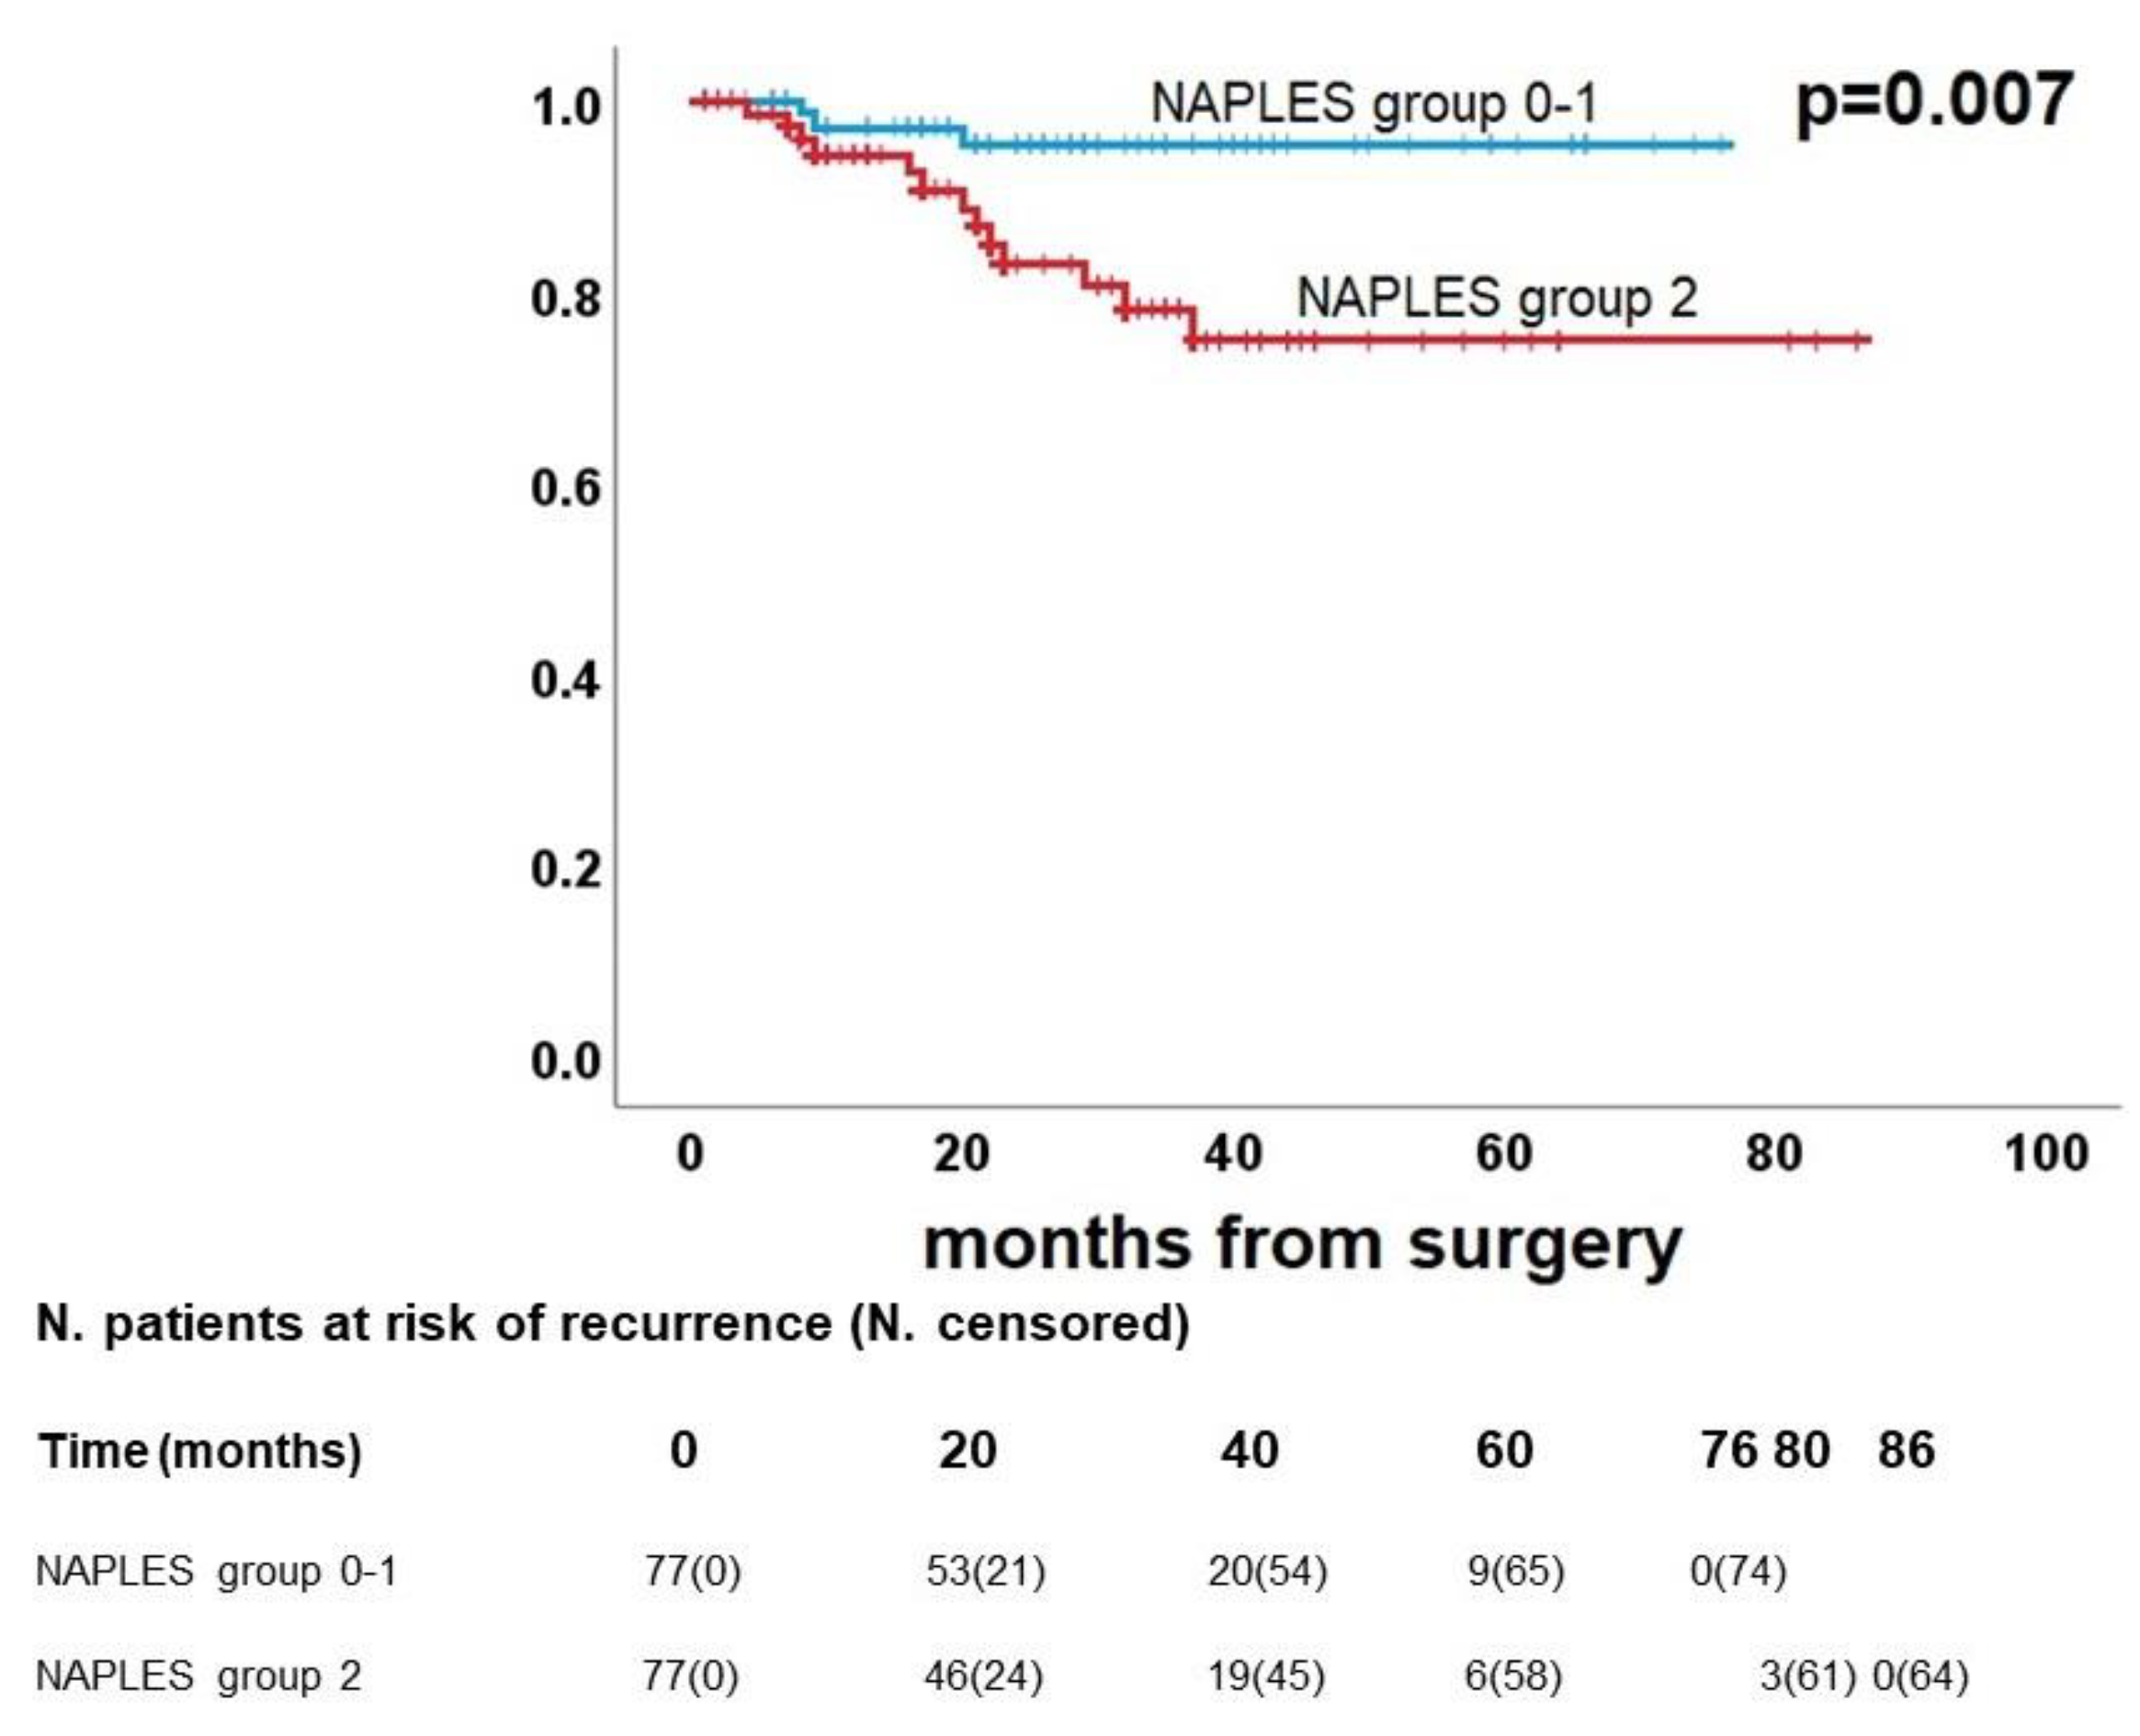

Table 1.
Demographic and clinical characteristics of the enrolled population. IQR: interquartile range.
Table 1.
Demographic and clinical characteristics of the enrolled population. IQR: interquartile range.
| Variable | |
|---|---|
| Median age, years (IQR) | 72 (65-77) |
| Gender, n (%) | |
| Male | 168 (64.6%) |
| Female | 92 (35.4%) |
| Median number of comorbidities (IQR) | 3 (IQR 2-5) |
| Smoking history, n(%) | |
| Never smoked | 37 (14.2%) |
| Former smoker | 130 (50.0%) |
| Current smoker | 93 (35.8%) |
| Surgical procedure, n(%) | |
| Pneumonectomy | 8 (3.1%) |
| Bilobectomy | 4 (1.5%) |
| Lobectomy | 187 (71.9%) |
| Segmentectomy | 10 (3.8%) |
| Wedge resection | 51 (19.6%) |
| Side of surgery, n(%) | |
| Right | 151 (58.1%) |
| Left | 109 (41.9%) |
| Lobe (pneumonectomies excluded), n(%) | |
| Upper | 151 (58.1%) |
| Middle/lingula | 11 (4.2%) |
| Lower | 90 (37.7%) |
| Final histology, n (%) | |
| Lung adenocarcinoma | 184 (70.8%) |
| Lung squamous carcinoma | 76 (29.2%) |
| pT, n(%) | |
| 1 | 115 (44.2%) |
| 2 | 103 (39.6%) |
| 3 | 29 (11.2%) |
| 4 | 13 (5.0%) |
| pN, n(%) | |
| 0 | 212 (81.5%) |
| 1 | 29 (11.2%) |
| 2 | 19 (7.3%) |
| Neutrophil/lymphocyte ratio, n(%) | |
| ≤ 2.96 | …174 (66.9%) |
| >2.96 | 86 (33.1%) |
| Lymphocyte/monocyte ratio, n(%) | |
| <4.44 | 205 (78.8%) |
| ≥4.44 | 55 (21.2%) |
| Serum albumin, n(%) | |
| <4.0 g/dL | 99 (38.1%) |
| ≥4.0 g/dL | 161 (61.9%) |
| Total cholesterol, n(%) | |
| ≤ 180 mg/dL | 127 (48.8%) |
| > 180 mg/dL | 133 (51.2%) |
| NAPLES score, n (%) | |
| 0 | 28 (10.8%) |
| 1 | 56 (21.5%) |
| 2 | 90 (34.6%) |
| 3 | 63 (24.2%) |
| 4 | 23 (8.8%) |
| NAPLES group, n(%) | |
| 0 | 28 (10.8%) |
| 1 | 146 (56.2%) |
| 2 | 86 (33.1%) |
| Median follow-up, months (IQR) | 26 (15-40) |
| Recurrence, n(%) | |
| Yes | 93 (35.8%) |
| No | 167 (64.2%) |
| Median time to recurrence, months (IQR) | 16 (8-29) |
| Status, n(%) | |
| Alive | 216 (83.1%) |
| Dead | 44 (16.9%) |
| Cancer-related death, n(%) | |
| Yes | 24 (54.5%) |
| No | 20 (45.5%) |
| Median time to death, months (IQR) | 13 (6-22) |
Table 2.
Cox regression analysis. CI: confidence interval; F: female; HR: hazard ratio; M: male.
| Disease Free Survival | Overall Survival | Cancer related Survival | |||||||
|---|---|---|---|---|---|---|---|---|---|
| Univariable | Multivariable | Univariable | Multivariable | Univariable | Multivariable | ||||
| p-value | HR (95% CI) | p-value | p-value | HR (95% CI) | p-value | p-value | HR (95% CI) | p-value | |
|
Age (≤ 72 vs > 72) years |
0.019 |
1.4 (0.9-2.1) |
0.14 | 0.057 | - |
- |
0.11 |
- |
- |
|
Gender (M vs F) |
0.13 |
- |
- | 0.10 | - |
- |
0.10 |
- |
- |
| Smoking history (never vs former/current) | 0.84 | - | - | 0.080 | - |
- |
0.41 |
- |
- |
| Surgical procedure (major vs sublobar) | 0.028 | 1.7 (1.1-2.7) | 0.020 | 0.98 | - |
- |
0.78 |
- |
- |
| Side of surgery (right vs left) | 0.057 | - | - | 0.67 | - |
- |
0.51 |
- |
- |
| Lobe (upper and middle vs lower) | 0.66 | - | - | 0.33 | - |
- |
0.25 |
- |
- |
| pT (1 vs 2-3-4) |
<0.001 |
2.2 (1.4-3.5) |
0.001 | <0.001 | 3.5 (1.5-7.9) |
0.003 |
0.003 |
4.0 (1.2-13.8) |
0.027 |
| pN (0 vs 1-2) | 0.030 | 1.4 (0.8-2.3) | 0.19 | 0.009 | 1.8 (0.9-3.4) |
0.072 |
0.002 |
2.8 (1.2-6.3) |
0.015 |
| Histology (adenocarcinoma vs squamous) | 0.013 | 1.4 (0.9-2.2) | 0.15 | 0.067 | - |
- |
0.19 |
- |
- |
| NAPLES group |
0.011 |
1.3 (0.9-1.9) | 0.13 | <0.001 | 2.5 (1.4-4.3) |
0.001 |
0.001 |
3.5 (1.6-7.9) |
0.002 |
Table 3.
Standardized differences before and after propensity score matching.
| Before matching | After matching | |||||||
|---|---|---|---|---|---|---|---|---|
| Naples group 0-1 | Naples group 2 | p-value | Standardized difference | Naples group 0-1 | Naples group 2 | p-value | Standardized difference | |
| Gender male, n(%) | 102 (58.6) | 66 (76.7) | 0.004 | 0.39 | 59 (76.6) | 57 (74.0) | 0.71 | 0.06 |
| Age>72 years, n(%) | 71 (40.8) | 47 (54.7) | 0.035 | 0.28 | 39 (50.6) | 38 (49.4) | 0.87 | 0.02 |
| Smoker (former or current), n(%) | 143 (82.2) | 80 (93.0) | 0.019 | 0.33 | 71 (92.2) | 71 (92.2) | 1.00 | 0.00 |
| Type of resection, n(%) | 0.13 | 0.19 | 0.57 | 0.09 | ||||
| Sublobar | 36 (20.7) | 25 (29.1) | 17 (22.1) | 20 (26.0) | ||||
| Major | 138 (79.3) | 61 (70.9) | 60 (77.9) | 57 (74.0) | ||||
| pT, n(%) | 0.008 | 0.36 | 1.00 | 0.00 | ||||
| T1 | 87 (50.0) | 28 (32.6) | 25 (32.5) | 25 (32.5) | ||||
| T2-T3-T4 | 87 (50.0) | 58 (67.4) | 52 (67.5) | 52 (67.5) | ||||
| pN, n(%) | 0.77 | 0.04 | 0.52 | 0.10 | ||||
| N0 | 141 (81.0) | 71 (82.6) | 62 (80.5) | 65 (84.4) | ||||
| N1-N2 | 33 (19.0) | 15 (17.4) | 15 (19.5) | 12 (15.6) | ||||
| Histology, n(%) | 0.41 | 0.11 | 0.86 | 0.02 | ||||
| Adenocarcinoma | 126 (72.4) | 58 (67.4) | 54 (70.1) | 53 (68.8) | ||||
| Squamous cell carcinoma | 48 (27.6) | 28 (32.6) | 23 (29.9) | 24 (31.2) | ||||
Table 4.
Post-propensity Cox regression analysis. CI: confidence interval; F: female; HR: hazard ratio; M: male.
Table 4.
Post-propensity Cox regression analysis. CI: confidence interval; F: female; HR: hazard ratio; M: male.
| Disease Free Survival | Overall Survival | Cancer related Survival | |||||||
|---|---|---|---|---|---|---|---|---|---|
| Univariable | Multivariable | Univariable | Multivariable | Univariable | Multivariable | ||||
| p-value | HR (95% CI) | p-value | p-value | HR (95% CI) | p-value | p-value | HR (95% CI) | p-value | |
|
Age (≤ 72 vs > 72) years |
0.11 |
- |
- | 0.78 | - |
- |
0.80 |
- |
- |
|
Gender (M vs F) |
0.42 |
- |
- | 0.77 | - |
- |
0.50 |
- |
- |
| Smoking history (never vs former/current) | 0.59 | - | - | 0.64 | - |
- |
0.60 |
- |
- |
| Surgical procedure (major vs sublobar) | 0.013 | 2.1 (1.2-3.6) | 0.006 | 0.72 | - |
- |
0.76 |
- |
- |
| Side of surgery (right vs left) | 0.53 | - | - | 0.81 | - |
- |
0.93 |
- |
- |
| Lobe (upper and middle vs lower) | 0.68 | - | - | 0.12 | - |
- |
0.24 |
- |
- |
| pT (1 vs 2-3-4) |
0.011 |
2.3 (1.3-4.4) |
0.007 | 0.008 | 5.2 (1.6-17.0) |
0.007 |
0.046 |
7.0 (0.9-53.7) |
0.061 |
| pN (0 vs 1-2) | 0.31 | - | - | 0.077 | - |
- |
0.027 |
2.7 (0.9-7.4) |
0.061 |
| Histology (adenocarcinoma vs squamous) | 0.26 | - | - | 0.99 | - |
- |
0.84 |
- |
- |
| NAPLES group (0-1 vs 2) |
0.34 |
- | - | 0.023 | 2.5 (1.2-5.2) |
0.018 |
0.015 |
5.2 (1.5-18.2) |
0.010 |
Disclaimer/Publisher’s Note: The statements, opinions and data contained in all publications are solely those of the individual author(s) and contributor(s) and not of MDPI and/or the editor(s). MDPI and/or the editor(s) disclaim responsibility for any injury to people or property resulting from any ideas, methods, instructions or products referred to in the content. |
© 2023 by the authors. Licensee MDPI, Basel, Switzerland. This article is an open access article distributed under the terms and conditions of the Creative Commons Attribution (CC BY) license (http://creativecommons.org/licenses/by/4.0/).
Copyright: This open access article is published under a Creative Commons CC BY 4.0 license, which permit the free download, distribution, and reuse, provided that the author and preprint are cited in any reuse.


