
Submitted:
18 July 2025
Posted:
18 July 2025
You are already at the latest version
Abstract
To evaluate the prognostic value of the Naples Prognostic Score (NPS)—a composite inflammation–nutrition index—in extensive-stage small cell lung cancer (ES-SCLC), a disease setting in which its application has been scarcely examined to date. A retrospective analysis was performed on 142 patients diagnosed with ES-SCLC between March 2014 and June 2024. The NPS was calculated using neutrophil-to-lymphocyte ratio (NLR), lymphocyte-to-monocyte ratio (LMR), serum albumin, and total cholesterol levels. Patients were classified into three NPS categories (0, 1–2, and 3–4), then dichotomized into low-risk (0–2) and high-risk (3–4) groups. Survival outcomes were assessed using Kaplan–Meier estimates and multivariate Cox regression models. Median overall survival (OS) was significantly longer in the low-risk group compared to the high-risk group (10.3 vs. 6.3 months; p = 0.012). High NPS remained an independent predictor of reduced OS (HR: 1.45; 95% Cl: 1.02–2.06; p = 0.041). The prognostic strength of the NPS appeared to be primarily driven by two of its components—low LMR and hypoalbuminemia—which were individually associated with worse outcomes. These findings suggest that the NPS may serve as a simple, accessible, and independent prognostic tool in ES-SCLC, potentially aiding in clinical risk stratification and treatment planning.
Keywords:
Naples prognostic score
; small cell lung cancer
; overall survival
; inflammation
; prognostic index
1. Introduction
Small cell lung cancer (SCLC) is a highly aggressive malignancy that, despite accounting for only 13–15% of all lung cancers, contributes disproportionately to global cancer-related mortality [1]. Characterized by rapid tumor proliferation, early metastasis, and high relapse rates, SCLC results in approximately 200,000 deaths annually worldwide [2]. At diagnosis, nearly 70% of patients present with extensive-stage disease (ES-SCLC), where therapeutic options remain limited and the five-year overall survival (OS) rate is estimated to be less than 5%, rarely exceeding 12% even in selected subgroups [3].
Although the incorporation of immunotherapy into systemic regimens has yielded modest survival gains, the prognosis for patients with ES-SCLC remains dismal [4,5]. In this context, accurate and practical prognostic stratification is essential—not only to guide individualized treatment decisions but also to inform clinical trial design and optimize patient selection [6]. Traditional clinical factors such as age, sex, performance status, and metastatic burden offer limited predictive precision, particularly in a disease as biologically heterogeneous as SCLC [7].
Recent attention has turned toward hematologic and biochemical biomarkers related to systemic inflammation and nutritional status [8]. Indices such as the neutrophil-to-lymphocyte ratio (NLR), lymphocyte-to-monocyte ratio (LMR), serum albumin, and total cholesterol have each demonstrated prognostic relevance in various solid tumors [9,10,11]. However, these markers in isolation often lack the robustness needed to inform clinical decisions effectively [12].
The Naples Prognostic Score (NPS), introduced by Galizia et al. in 2017 for gastrointestinal malignancies, combines these four parameters into a single composite index [13]. Its prognostic utility has since been validated across multiple solid tumors, including gastric, pancreatic, colorectal, esophageal, and hepatobiliary cancers [14,15,16]. Owing to its simplicity, accessibility, and reliance on routine laboratory values, the NPS represents a promising tool for real-world clinical application [17].
Considering the aggressive nature and narrow treatment window of ES-SCLC, user-friendly prognostic models like the NPS may hold particular clinical relevance in this population. Despite this growing evidence, data regarding the prognostic role of NPS in SCLC remain scarce [18]. Therefore, this study aimed to evaluate the prognostic utility of the NPS in patients with ES-SCLC, with the objective of determining its value as a clinically applicable tool for risk stratification in this challenging disease setting.
2. Materials and Methods
2.1. Study Design and Patient Selection
This retrospective cohort study included patients diagnosed with ES-SCLC who received first-line systemic chemotherapy at the Trakya University Department of Medical Oncology between March 2014 and June 2024. Eligibility criteria included a confirmed histopathological diagnosis of ES-SCLC and availability of complete baseline laboratory data required for the NPS calculation. Patients were excluded if they had concurrent active malignancies, uncontrolled infections, hematologic disorders, significant hepatic or renal dysfunction, or incomplete clinical records.
A total of 268 patients were initially screened. After applying exclusion criteria, 126 patients were excluded: 81 due to missing baseline laboratory data relevant to the NPS, 27 for insufficient follow-up, 7 due to comorbid conditions affecting inflammatory markers, and 11 for incomplete demographic or clinical information. The final study cohort consisted of 142 eligible patients.
2.2. Data Collection and Laboratory Measurements
Demographic, clinical, and laboratory data were extracted from electronic health records, archived patient files, and institutional databases. Baseline laboratory values were defined as the most recent measurements obtained within seven days prior to initiation of first-line therapy. Hematologic indices were analyzed using the Sysmex XN-1000™ automated analyzer, and serum albumin and total cholesterol levels were assessed via enzymatic colorimetric assays (Roche Cobas 8000™). All analyses were performed in accordance with institutional quality control protocols and within standard laboratory reference ranges.
2.3. Naples Prognostic Score Assessment
The NPS was calculated based on four parameters reflecting systemic inflammation and nutritional status, as originally defined by Galizia et al. [9]. One point was assigned for each of the following: a NLR greater than 2.96, a LMR less than 4.44, serum albumin below 40 g/L, and total cholesterol less than or equal to 180 mg/dL. Patients were initially categorized into three groups according to their total NPS score: Group 0 (NPS = 0), Group 1 (NPS = 1–2), and Group 2 (NPS = 3–4).
However, due to the limited sample size in Group 0 (n = 10), a binary classification was adopted for the primary statistical analyses to avoid group imbalance and potential model overfitting. In this binary system, patients with NPS scores of 0–2 were classified as the low-risk cohort, while those with scores of 3–4 were considered high-risk. This dichotomous stratification was used in all core analyses, whereas the original three-tier structure was retained for exploratory purposes to assess potential survival gradients.
2.4. Outcome Definition
The primary outcome was OS, defined as the time from histological diagnosis to death from any cause. As of the data cutoff date (June 30, 2024), all patients in the cohort had deceased, allowing for uncensored survival analysis.
2.5. Statistical Analysis
All statistical analyses were conducted using IBM SPSS Statistics software (version 26.0; IBM Corp., Armonk, NY, USA) and MedCalc Statistical Software (version 20.1; MedCalc Software Ltd, Ostend, Belgium). Continuous variables were summarized as medians and interquartile ranges (IQRs), while categorical variables were reported as frequencies and percentages.
Comparisons between the low-risk (NPS 0–2) and high-risk (NPS 3–4) groups were performed using the Mann–Whitney U test for continuous variables, and either the Chi-square or Fisher’s exact test for categorical variables, depending on distribution characteristics.
Overall survival was estimated using the Kaplan–Meier method, and differences between groups were assessed via the log-rank test. Univariate Cox proportional hazards regression models were used to identify potential prognostic variables. Multivariate models were built using backward stepwise elimination (removal threshold: p > 0.10), and hazard ratios (HRs) with 95% confidence intervals (CIs) were reported. Two separate multivariate models were developed: Model 1 included the binary NPS classification (low-risk vs. high-risk), while Model 2 included the individual NPS components (NLR, LMR, serum albumin, and total cholesterol). The number of metastatic sites was excluded due to collinearity with organ-specific metastases and conceptual redundancy.
Model discrimination was assessed using Harrell’s concordance index (C-index). The proportional hazards assumption was tested using Schoenfeld residuals and found to be satisfied for all final models.
3. Results
3.1. Baseline Characteristics
A total of 142 patients with ES-SCLC were included in the analysis (mean age: 60.4 ± 7.9 years), of whom 33.1% were aged ≥65 years. The cohort was predominantly male (92.3%) and composed largely of active smokers (76.1%). At diagnosis, 64.1% of patients had an ECOG performance status (ECOG PS) of 0, and 72.5% had radiologically confirmed extensive-stage disease. Comorbidities were documented in 49.3% of the cohort. Patients received a mean of 5.1 chemotherapy cycles, with 46.5% completing all six planned cycles. Treatment responses were partial in 46.5%, progressive in 30.3%, stable in 18.3%, and complete in 4.9% of cases. Prophylactic cranial irradiation (PCI) was administered to 24.6% of patients.
The most common site of metastasis was bone (50.0%), followed by brain (28.2%), liver (26.1%), adrenal glands (23.2%), and the contralateral lung (17.6%). The mean number of metastatic sites per patient was 2.2, and approximately one-third of patients exhibited single-organ dissemination.
With respect to NPS components, elevated NLR and hypoalbuminemia were present in 62.7% of patients, low LMR in 79.6%, and low total cholesterol in 20.4%. Based on the original scoring system, 7.0% of patients were classified as Group 0 (NPS = 0), 49.3% as Group 1 (NPS 1–2), and 43.7% as Group 2 (NPS 3–4). For analytical purposes, Groups 0 and 1 were merged to constitute the low-risk category, while Group 2 represented the high-risk category.
3.2. Comparison Between Risk Groups
Patients were stratified into low-risk (NPS 0–2; n = 80) and high-risk (NPS 3–4; n = 62) groups. The mean age (60.0 ± 7.5 vs. 60.9 ± 8.4 years; p = 0.526) and the proportion of patients aged ≥65 years were similar between groups. ECOG PS of 0 was significantly more common in the low-risk group (72.5% vs. 53.2%; p = 0.018). No significant intergroup differences were observed in sex, smoking history, comorbidity burden, disease stage, or treatment characteristics. Although PCI was more frequently administered in the low-risk cohort (30.0% vs. 17.7%), this difference did not reach statistical significance (p = 0.093). Objective response rates did not differ significantly (p = 0.157), nor did the number or pattern of metastatic sites (all p > 0.05). Detailed comparisons of clinical variables between the two risk groups are presented in Table 1.
3.3. Overall Survival Analysis
Kaplan–Meier analysis revealed a statistically significant difference in OS between the risk groups (log-rank χ² = 6.307; p = 0.012). The median OS was 10.3 months (95% CI: 7.5–13.0) in the low-risk group and 6.3 months (95% CI: 4.6–8.0) in the high-risk group.
All patients had died by the end of the follow-up period, eliminating censoring and allowing for complete survival analysis. The median follow-up time—corresponding to the median OS—was 8.3 months (range: 1.1–40.8; mean: 10.8 ± 8.9). The Kaplan–Meier survival curves illustrating this difference are presented in Figure 1.
3.4. Univariate Cox Regression Analysis
Univariate analysis identified several clinical and laboratory parameters significantly associated with reduced OS, including ECOG PS ≥1, bone metastasis, low serum albumin, and low LMR. Among site-specific metastases, only bone involvement reached statistical significance. The presence of multiple metastatic sites also predicted worse outcomes. In contrast, age, sex, smoking status, comorbidities, PCI administration, and the pattern of metastatic onset did not demonstrate a significant relationship with OS. Lung metastasis and NLR emerged as borderline predictors, with p-values close to the significance threshold (p = 0.061 and p = 0.098, respectively). Patients with a higher modified NPS (3–4) had significantly poorer OS compared to those with lower scores (see Table 2).
3.5. Multivariate Cox Regression Analysis
To determine independent predictors of OS, multivariate Cox models were constructed using variables with p < 0.10 in univariate analysis.
3.5.1. Model 1—Prognostic Impact of the Composite NPS
In the first model, we assessed the independent prognostic relevance of the NPS while adjusting for clinical covariates including age (≥65 years), ECOG PS , and site-specific metastases (bone, brain, lung). A higher NPS (3–4 vs. 0–2) was the only variable that retained statistical significance (see Table 3, HR = 1.45; 95% CI: 1.02–2.06; p = 0.041). None of the other covariates remained independently associated with OS. These findings underscore the robust prognostic value of the composite NPS in patients with ES-SCLC, independent of conventional clinical factors.
3.5.2. Model 2—Prognostic Role of Individual NPS Components
To evaluate the independent prognostic utility of individual NPS components, a second multivariate model excluded the composite score to avoid collinearity. Variables included serum albumin, LMR, NLR, ECOG status, age, and site-specific metastases. In this model, high serum albumin (≥40 g/L) and LMR (≥4.44) were significantly associated with prolonged OS (see Table 4, p = 0.033 and 0.034, respectively), while ECOG PS ≥1 approached statistical significance. NLR, metastatic patterns, and age were not independently associated with survival. These results suggest that serum albumin and LMR are the most robust individual predictors among the four NPS components in this population. Harrell’s C-index was calculated for both models: 0.69 for Model 1 and 0.63 for Model 2.
3.6. Exploratory Analysis Based on the Original NPS Classification
As an exploratory analysis, patients were stratified into three prognostic groups based on the original NPS: Group 0 (score 0), Group 1 (scores 1–2), and Group 2 (scores 3–4). Although Group 0 comprised only 10 patients, a clear stepwise decline in OS was observed across the groups. The median OS was 18.0, 10.2, and 6.3 months for Groups 0, 1, and 2, respectively (log-rank p = 0.002). This gradation in survival is illustrated in Figure 2.
In univariate Cox regression analysis, both Group 1 (HR = 2.52; p = 0.012) and Group 2 (HR = 3.36; p = 0.001) were significantly associated with poorer OS compared to Group 0. In the multivariate model, these associations remained significant and were even more pronounced (Group 1: HR = 3.60; Group 2: HR = 4.33). Additionally, ECOG PS ≥1 (HR = 1.53; p = 0.037) and the presence of lung metastasis (HR = 1.64; p = 0.036) emerged as independent predictors of worse outcomes. Age, bone metastases, and brain metastases did not retain statistical significance.
These findings suggest that the original NPS classification, particularly when integrated with clinical variables, provides strong prognostic stratification and may enhance individualized risk assessment in patients with ES-SCLC.
4. Discussion
Inflammatory cells within the tumor microenvironment (TME) are not passive bystanders; they actively influence tumor dynamics through sustained crosstalk with malignant and stromal elements [19]. Among these, neutrophils—once considered mere first-line defenders—have emerged as paradoxical agents. Although they constitute only 1–2% of circulating leukocytes under normal conditions, tumor-induced expansion, often mediated by TGF-β and related cytokines, transforms them into key enablers of progression [20,21].
By upregulating matrix metalloproteinases (MMPs), neutrophils disrupt extracellular matrix architecture, facilitating both angiogenesis and tissue remodeling. These alterations promote local invasion and systemic dissemination [22]. Similarly, tumor-associated macrophages (TAMs), originating from monocytes, amplify the inflammatory milieu by dampening antitumor immunity and recruiting additional immunosuppressive populations, thereby creating an environment conducive to tumor persistence and therapeutic resistance [23].
Nutritional status, beyond inflammation, exerts a decisive influence on cancer prognosis. Hypoalbuminemia, reflecting both malnutrition and systemic inflammation, has been associated with impaired immune surveillance and elevated oxidative stress [24]. Similarly, reduced serum cholesterol is increasingly recognized as an unfavorable prognostic factor across multiple solid tumors [25]. Such alterations underscore the metabolic toll of cancer and may exacerbate immunologic vulnerability. Hematologic indices like NLR and LMR have gained traction as pragmatic markers of immune imbalance. Elevated NLR indicates heightened neutrophilic inflammation and lymphocyte depletion, whereas reduced LMR signals monocytic dominance—both correlating with poor oncologic trajectories. The NPS synthesizes NLR, LMR, serum albumin, and cholesterol into a unified metric reflecting systemic inflammation and nutritional status. Its integrative design enables superior risk stratification compared to isolated parameters. Its prognostic utility has been validated across gastric, pancreatic, colorectal, gallbladder and hepatobiliary cancers, supporting its cross-tumor applicability [26,27,28,29].
The NPS demonstrated strong prognostic stratification in our ES-SCLC cohort. Patients classified as low-risk had significantly longer median OS than those in the high-risk group (10.3 vs. 6.3 months; log-rank p = 0.012). A clear stepwise decline in survival was also observed using the original three-tier model: median OS was 18.0, 10.2, and 6.3 months for scores 0, 1–2, and 3–4, respectively (log-rank p = 0.002). These results confirm the clinical relevance of NPS in advanced-stage disease and support its use as a simple yet powerful tool for initial risk stratification in SCLC.
Our results align with previous studies supporting NPS as an independent prognostic factor in SCLC. For instance, in a retrospective study by Chen et al. involving 128 patients with SCLC, those with a low NPS score (score = 0) had significantly longer OS (19.8 vs. 8.45 months), and NPS emerged as an independent prognostic factor in multivariate analysis [18]. However, although 65.6% of the cohort had extensive-stage disease, the analysis included both limited- and extensive-stage patients, limiting the ability to isolate the NPS’s prognostic impact in advanced-stage cases. Additionally, limited-stage patients were overrepresented in the low-risk group (e.g., 74.5% in Group 0), introducing potential stage-related bias.
Similarly, Liu et al. evaluated 179 SCLC patients, including both limited- and extensive-stage cases, and reported that higher NPS scores were significantly associated with shorter OS. Using a three-tier model (scores 0, 1, and 2), median OS declined progressively: 20.1 months in the NPS = 0 group, 12.6 months in the NPS = 1 group, and 8.4 months in the NPS = 2 group [30]. In multivariate analysis, an NPS of 2 was independently associated with inferior survival outcomes (HR = 5.03; p < 0.001). However, the low-risk group (NPS = 0) was disproportionately composed of limited-stage cases (48.4%), suggesting a potential stage-related bias.
In contrast, our study offers a more targeted assessment within a homogeneous ES-SCLC population, minimizing stage-related confounding and enabling a more accurate evaluation of NPS as a prognostic tool.
Beyond SCLC, the NPS has shown substantial prognostic utility in non-SCLC (NSCLC) as well. Multiple independent studies have confirmed its predictive value across various stages and treatment settings, suggesting broad applicability in lung cancer. Zou et al. analyzed 165 patients with locally advanced NSCLC undergoing surgery after neoadjuvant therapy [31]. Higher NPS scores were significantly associated with shorter OS and DFS, with hazard ratios exceeding 8.7 and 9.6, respectively . Moreover, NPS outperformed other inflammatory and nutritional indices in predictive accuracy (AUC for OS: 0.704). Ren et al. similarly reported inferior survival among 319 surgically treated NSCLC patients with elevated NPS scores [32]. In their cohort, low NPS correlated with longer median OS (~35 months), whereas high NPS was linked to poor performance status and hypoalbuminemia, reinforcing its biological relevance. A meta-analysis by Wang et al., synthesizing data from six independent cohorts, further substantiated these findings [33]. High NPS was associated with a threefold increase in mortality risk (HR: 3.21) and nearly fourfold progression risk (HR: 3.81), with a clear dose-response trend. Sensitivity analyses confirmed the robustness of these associations, supporting NPS as a stable and reproducible prognostic tool in NSCLC.
Peker et al. recently reaffirmed the prognostic significance of the NPS in NSCLC. In a cohort of 250 patients, elevated NPS scores were linked to shorter OS (10.4 vs. 18.2 months), particularly in older and advanced-stage individuals [34]. However, their multivariate analysis incorporated both the composite NPS and its individual elements—serum albumin, NLR, and LMR—raising concerns of multicollinearity. While albumin remained significant, the prognostic contributions of NLR and LMR diminished, likely due to shared variance within the composite index.
To address this, our study adopted a bifurcated modeling approach: one model assessed the composite NPS, while the other analyzed its components independently. This strategy reduced collinearity and allowed for clearer delineation of each variable’s prognostic value. While our analysis focused solely on ES-SCLC, the cumulative evidence from independent cohorts and meta-analyses suggests that NPS may offer broader prognostic utility across lung cancer subtypes.
Incorporating clinical variables remains essential in prognostic modeling. In our cohort, ECOG PS was significantly associated with the NPS; patients with an ECOG PS of 0 were more frequent in the low-risk group (72.5% vs. 53.2%; p = 0.018). Although ECOG PS ≥1 was linked to poorer OS in univariate analysis, this significance diminished in the multivariate model that included NPS, suggesting overlapping prognostic pathways. Furthermore, comparative modeling showed that the composite NPS had superior prognostic discrimination (C-index: 0.69) compared to its individual components (C-index: 0.63), underscoring the additive value of its integrative design.
A key methodological strength of our study is the use of a homogenous cohort consisting solely of patients with extensive-stage SCLC. This design minimized stage-related confounding and allowed for a focused evaluation of NPS as an independent prognostic marker in a high-risk population. Moreover, by examining the NPS as a standalone variable—without embedding it in nomograms or composite models—we underscored its direct clinical utility.
This study presents several methodological limitations. As a single-center, retrospective analysis, it is inherently susceptible to selection bias and data inaccuracies. Nonetheless, rigorous exclusion criteria—such as omitting patients with active infections, severe comorbidities, or incomplete laboratory profiles—enhanced cohort uniformity. The limited number of patients with an NPS score of 0 (n=10; 7%) weakened the statistical power of the original three-tier classification. Accordingly, an exploratory binary model (NPS 0–2 vs. 3–4) was adopted. Despite this adjustment, survival curves remained clearly stratified, with a stepwise decline across risk levels. Lastly, due to inconsistencies in follow-up data, progression-free survival (PFS) could not be reliably analyzed. Consequently, the study focused exclusively on OS, limiting insights into treatment-specific response dynamics.
5. Conclusions
The NPS demonstrated independent prognostic value in patients with ES-SCLC, outperforming individual laboratory markers in multivariate analysis. Its composite design—capturing both systemic inflammation and nutritional status—was associated with higher predictive accuracy, as reflected by a superior Harrell’s C-index.
Owing to its simplicity and availability, the NPS may serve as a practical tool for baseline risk stratification. Its integration into routine clinical assessment could aid treatment planning and support patient selection in clinical trials. Further prospective studies are needed to confirm its utility and generalizability.
Author Contributions
Conceptualization: F.A. and İ.G.; Data curation: F.A., G.B.K., D.D., T.İ.A., İ.B., and A.F.A.; Formal analysis: F.A., İ.G., and B.E.; Investigation and methodology: F.A. and İ.G.; Project administration: F.A. and İ.G.; Software: F.A., İ.G., and B.E.; Supervision: İ.G., and B.E.; Validation: F.A., İ.G., and B.E.; Writing—original draft preparation: F.A.; Editing and revisions: F.A. and İ.G.; Writing—review and editing: F.A., İ.G., and B.E. Fahri Akgül is the first author and led the study design, data collection, and manuscript drafting. İvo Gökmen is the corresponding author and supervised the project, contributed to writing and revision, and is responsible for manuscript submission and editorial correspondence. All authors have read and agreed to the published version of the manuscript.
Funding
This research received no external funding.
Institutional Review Board Statement
The study protocol was approved by the Non-Interventional Research Ethics Committee of Trakya University Faculty of Medicine (Protocol No: TÜTF-GOBAEK 2024/456, Decision No: 2024/24, Approval Date: June 12, 2024). All procedures conformed to the ethical principles outlined in the Declaration of Helsinki and complied with relevant national and institutional regulations.
Informed Consent Statement
Written informed consent was waived due to the retrospective design, and all procedures conformed to the Declaration of Helsinki.
Data Availability Statement
Data supporting the findings of this study are available from the corresponding author upon reasonable request.
Acknowledgments
We thank all co-authors for their contributions to this work.
Conflicts of Interest
The authors declare no conflicts of interest.
Abbreviations
| SCLC | Small Cell Lung Cancer |
| ES-SCLC | Extensive-Stage Small Cell Lung Cancer |
| NSCLC | Non-Small Cell Lung Cancer |
| NPS | Naples Prognostic Score |
| OS | Overall Survival |
| PFS | Progression-Free Survival |
| NLR | Neutrophil-to-Lymphocyte Ratio |
| LMR | Lymphocyte-to-Monocyte Ratio |
| ECOG PS | Eastern Cooperative Oncology Group performance status |
| PCI | Prophylactic Cranial Irradiation |
| TME | Tumor Microenvironment |
| MMP | Matrix Metalloproteinase |
| TAM | Tumor-Associated Macrophages |
| CI | Confidence Interval |
| HR | Hazard Ratio |
| IQR | Interquartile Range |
| SPSS | Statistical Package for the Social Sciences |
| ORCID | Open Researcher and Contributor ID |
| SD | Standard Deviation |
| MD | Medical Doctor |
| Ass. Prof. Dr. | Associate Professor Doctor |
| Prof. Dr. | Professor Doctor |
References
- Matera, R.; Chiang, A. What Is New in Small Cell Lung Cancer. Hematol Oncol Clin North Am. 2023, 37, 595–607. [Google Scholar] [CrossRef]
- Zhang, Y.; Shi, Y.; Yu, Y.; et al. Global variations in lung cancer incidence by histological subtype in 2020: a population-based study. Lancet Oncol. 2023, 24, 1206–1218. [Google Scholar] [CrossRef]
- Kim, S.Y.; Park, H.S.; Chiang, A.C. Small Cell Lung Cancer: A Review. JAMA. 2025, 333, 1906–1917. [Google Scholar] [CrossRef] [PubMed]
- Reck, M.; Liu, S.V.; Mansfield, A.S.; et al. Five-year survival in patients with extensive-stage small cell lung cancer treated with atezolizumab in the Phase III IMpower133 study and the Phase III IMbrella A extension study. Lung Cancer. 2024, 196, 107924. [Google Scholar] [CrossRef] [PubMed]
- Misawa, K.; Miura, K.; Nakajima, M.; et al. Durvalumab plus platinum-etoposide chemotherapy for extensive-stage small cell lung cancer: a retrospective real-world study. Transl Lung Cancer Res. 2024, 13, 1585–1594. [Google Scholar] [CrossRef]
- Hamakawa, Y.; Kamimaki, I.; Tanaka, M.; et al. Prognostic value of systemic immune-inflammation index in patients with small-cell lung cancer treated with immune checkpoint inhibitors. BMC Cancer. 2025, 25, 17. [Google Scholar] [CrossRef]
- Farris, M.K.; Mitra, N.; Sun, Y.; et al. Prognostic Factors in Limited-Stage Small Cell Lung Cancer: A Secondary Analysis of CALGB 30610-RTOG 0538. JAMA Netw Open. 2024, 7, e2440673. [Google Scholar] [CrossRef]
- Kang, L.; Li, M.; Tang, X.; et al. Association of Neutrophil-to-Lymphocyte Ratio with Nutrition in Patients with Various Types of Malignant Tumors: A Multicenter Cross-Sectional Study. J Inflamm Res. 2023, 16, 1419–1429. [Google Scholar] [CrossRef]
- Templeton, A.J.; McNamara, M.G.; Šeruga, B.; et al. Prognostic role of neutrophil-to-lymphocyte ratio in solid tumors: a systematic review and meta-analysis. J Natl Cancer Inst. 2014, 106, dju124. [Google Scholar] [CrossRef]
- Yamamoto, T.; Kawada, K.; Obama, K. Inflammation-Related Biomarkers for the Prediction of Prognosis in Colorectal Cancer Patients. Int J Mol Sci. 2021, 22, 8182. [Google Scholar] [CrossRef]
- Tan, S.; Wei, Y.; Huang, J.; et al. Prognostic value of inflammatory markers NLR, PLR, and LMR in gastric cancer patients treated with immune checkpoint inhibitors: a meta-analysis and systematic review. Front Immunol. 2024, 15, 1408700. [Google Scholar] [CrossRef]
- Proctor, M.J.; Talwar, D.; Balmar, S.M.; et al. A comparison of inflammation-based prognostic scores in patients with cancer. A Glasgow Inflammation Outcome Study. Eur J Cancer. 2011, 47, 2633–2641. [Google Scholar] [CrossRef]
- Galizia, G.; Lieto, E.; Auricchio, A.; et al. Naples Prognostic Score, Based on Nutritional and Inflammatory Status, is an Independent Predictor of Long-term Outcome in Patients Undergoing Surgery for Colorectal Cancer. Dis Colon Rectum. 2017, 60, 1273–1284. [Google Scholar] [CrossRef]
- Peng, S.M.; Zhang, J.J.; Wang, Z.H.; et al. The prognostic value of the Naples prognostic score for patients with non-small-cell lung cancer. Sci Rep. 2022, 12, 5782. [Google Scholar] [CrossRef]
- Gulturk, I.; Kaplan, M.A.; Genc, A.B.; et al. Naples prognostic score may predict overall survival in metastatic pancreatic cancer. J Cancer Res Ther. 2024, 20, 249–254. [Google Scholar] [CrossRef]
- Chen, W.; Zhang, J.; Yang, H.; et al. Naples Prognostic Score as a Novel Prognostic Prediction Tool for Resectable Locally Advanced Esophageal Squamous Cell Carcinoma After Neoadjuvant Therapy. J Inflamm Res. 2025, 18, 4843–4856. [Google Scholar] [CrossRef]
- Gitmez, M.; Ekingen, E.; Zaman, S. Predictive Value of the Naples Prognostic Score for One-Year Mortality in NSTEMI Patients Undergoing Selective PCI. Diagnostics 2025, 15, 608. [Google Scholar] [CrossRef]
- Chen, S.; Liu, X.; Wang, L.; et al. Naples Prognostic Score is an Independent Prognostic Factor in Patients with Small Cell Lung Cancer and Nomogram Predictive Model Established. J Inflamm Res. 2022, 15, 3719–3731. [Google Scholar] [CrossRef]
- Shaul, M.E.; Fridlender, Z.G. Tumour-associated neutrophils in patients with cancer. Nat Rev Clin Oncol. 2019, 16, 601–620. [Google Scholar] [CrossRef]
- Coffelt, S.B.; Wellenstein, M.D.; de Visser, K.E. Neutrophils in cancer: neutral no more. Nat Rev Cancer. 2016, 16, 431–446. [Google Scholar] [CrossRef]
- Yang, Q.; Ye, Z.; Zhang, L.; et al. Prognostic value of pre-treatment Naples prognostic score (NPS) in patients with osteosarcoma. World J Surg Oncol. 2020, 18, 24. [Google Scholar] [CrossRef]
- Bekes, E.M.; Schweighofer, B.; Kupriyanova, T.A.; et al. Tumor-recruited neutrophils and neutrophil TIMP-free MMP-9 regulate coordinately the levels of tumor angiogenesis and efficiency of malignant cell intravasation. Am J Pathol. 2011, 179, 1455–1470. [Google Scholar] [CrossRef]
- Kumari, N.; Choi, S.H. Tumor-associated macrophages in cancer: recent advancements in cancer nanoimmunotherapies. J Exp Clin Cancer Res. 2022, 41, 68. [Google Scholar] [CrossRef]
- Almasaudi, A.S.; McSorley, S.T.; Edwards, C.A.; et al. Hypoalbuminemia Reflects Nutritional Risk, Body Composition and Systemic Inflammation and Is Independently Associated with Survival in Patients with Colorectal Cancer. Cancers 2020, 12, 1868. [Google Scholar] [CrossRef]
- Pecci, F.; Scotto, G.; Bacigalupo, B.; et al. Prognostic Impact of Blood Lipid Profile in Patients With Advanced Solid Tumors Treated With Immune Checkpoint Inhibitors: A Multicenter Cohort Study. Oncologist. 2024, 29, e372–e81. [Google Scholar] [CrossRef]
- Xie, Y.M.; Zhang, W.; Wang, H.X.; et al. Naples Prognostic Score is an Independent Prognostic Factor in Patients Undergoing Hepatectomy for Hepatocellular Carcinoma. J Hepatocell Carcinoma. 2023, 10, 1423–1433. [Google Scholar] [CrossRef]
- Gu, J.; Wang, Z.; Tian, Y.; et al. Modified Naples prognostic score for evaluating the prognosis of patients with obstructive colorectal cancer. BMC Cancer. 2023, 23, 941. [Google Scholar] [CrossRef]
- Yang, J.; Wu, Y.; Tang, L.; et al. The value of the preoperative Naples prognostic score in predicting prognosis in gallbladder cancer surgery patients. World J Surg Oncol. 2023, 21, 303. [Google Scholar] [CrossRef]
- Zhang, X.; Liu, H.; Wang, Q.; et al. Prognostic value of Naples Prognostic Score in locally advanced cervical cancer patients undergoing concurrent chemoradiotherapy. Biomol Biomed. 2025, 25, 986–999. [Google Scholar] [CrossRef]
- Liu, J.; Zhou, L.; Liang, R.; et al. Assessment of Naples prognostic score in predicting survival for small cell lung cancer patients treated with chemoradiotherapy. Ann Med. 2023, 55, 2242254. [Google Scholar] [CrossRef]
- Zou, Z.; Shen, L.; Huang, Y.; et al. Naples Prognostic Score as an Independent Predictor of Survival Outcomes for Resected Locally Advanced Non-Small Cell Lung Cancer Patients After Neoadjuvant Treatment. J Inflamm Res. 2023, 16, 793–807. [Google Scholar] [CrossRef] [PubMed]
- Ren, D.; Wu, Q.; Wang, H.; et al. Clinical Significance of Preoperative Naples Prognostic Score in Patients With Non-Small Cell Lung Cancer. Technol Cancer Res Treat. 2022, 21, 15330338221129447. [Google Scholar] [CrossRef]
- Wang, Y.S.; Li, Y.; Zhang, W.; et al. Naples prognostic score as a predictor of outcomes in lung cancer: a systematic review and meta-analysis. Eur Rev Med Pharmacol Sci. 2023, 27, 8144–8153. [Google Scholar]
- Peker, P.; Alacacıoğlu, A.; Karcı, E.; et al. Prognostic Power of the Naples Score in Non-Small Cell Lung Cancer: Can Inflammation and Nutrition Predict Survival? J Clin Med. 2025, 14, 3715. [Google Scholar] [CrossRef] [PubMed]
Figure 1.
Kaplan–Meier curves for OS in patients with ES-SCLC, stratified by NPS-defined risk groups (low vs. high).
Figure 1.
Kaplan–Meier curves for OS in patients with ES-SCLC, stratified by NPS-defined risk groups (low vs. high).
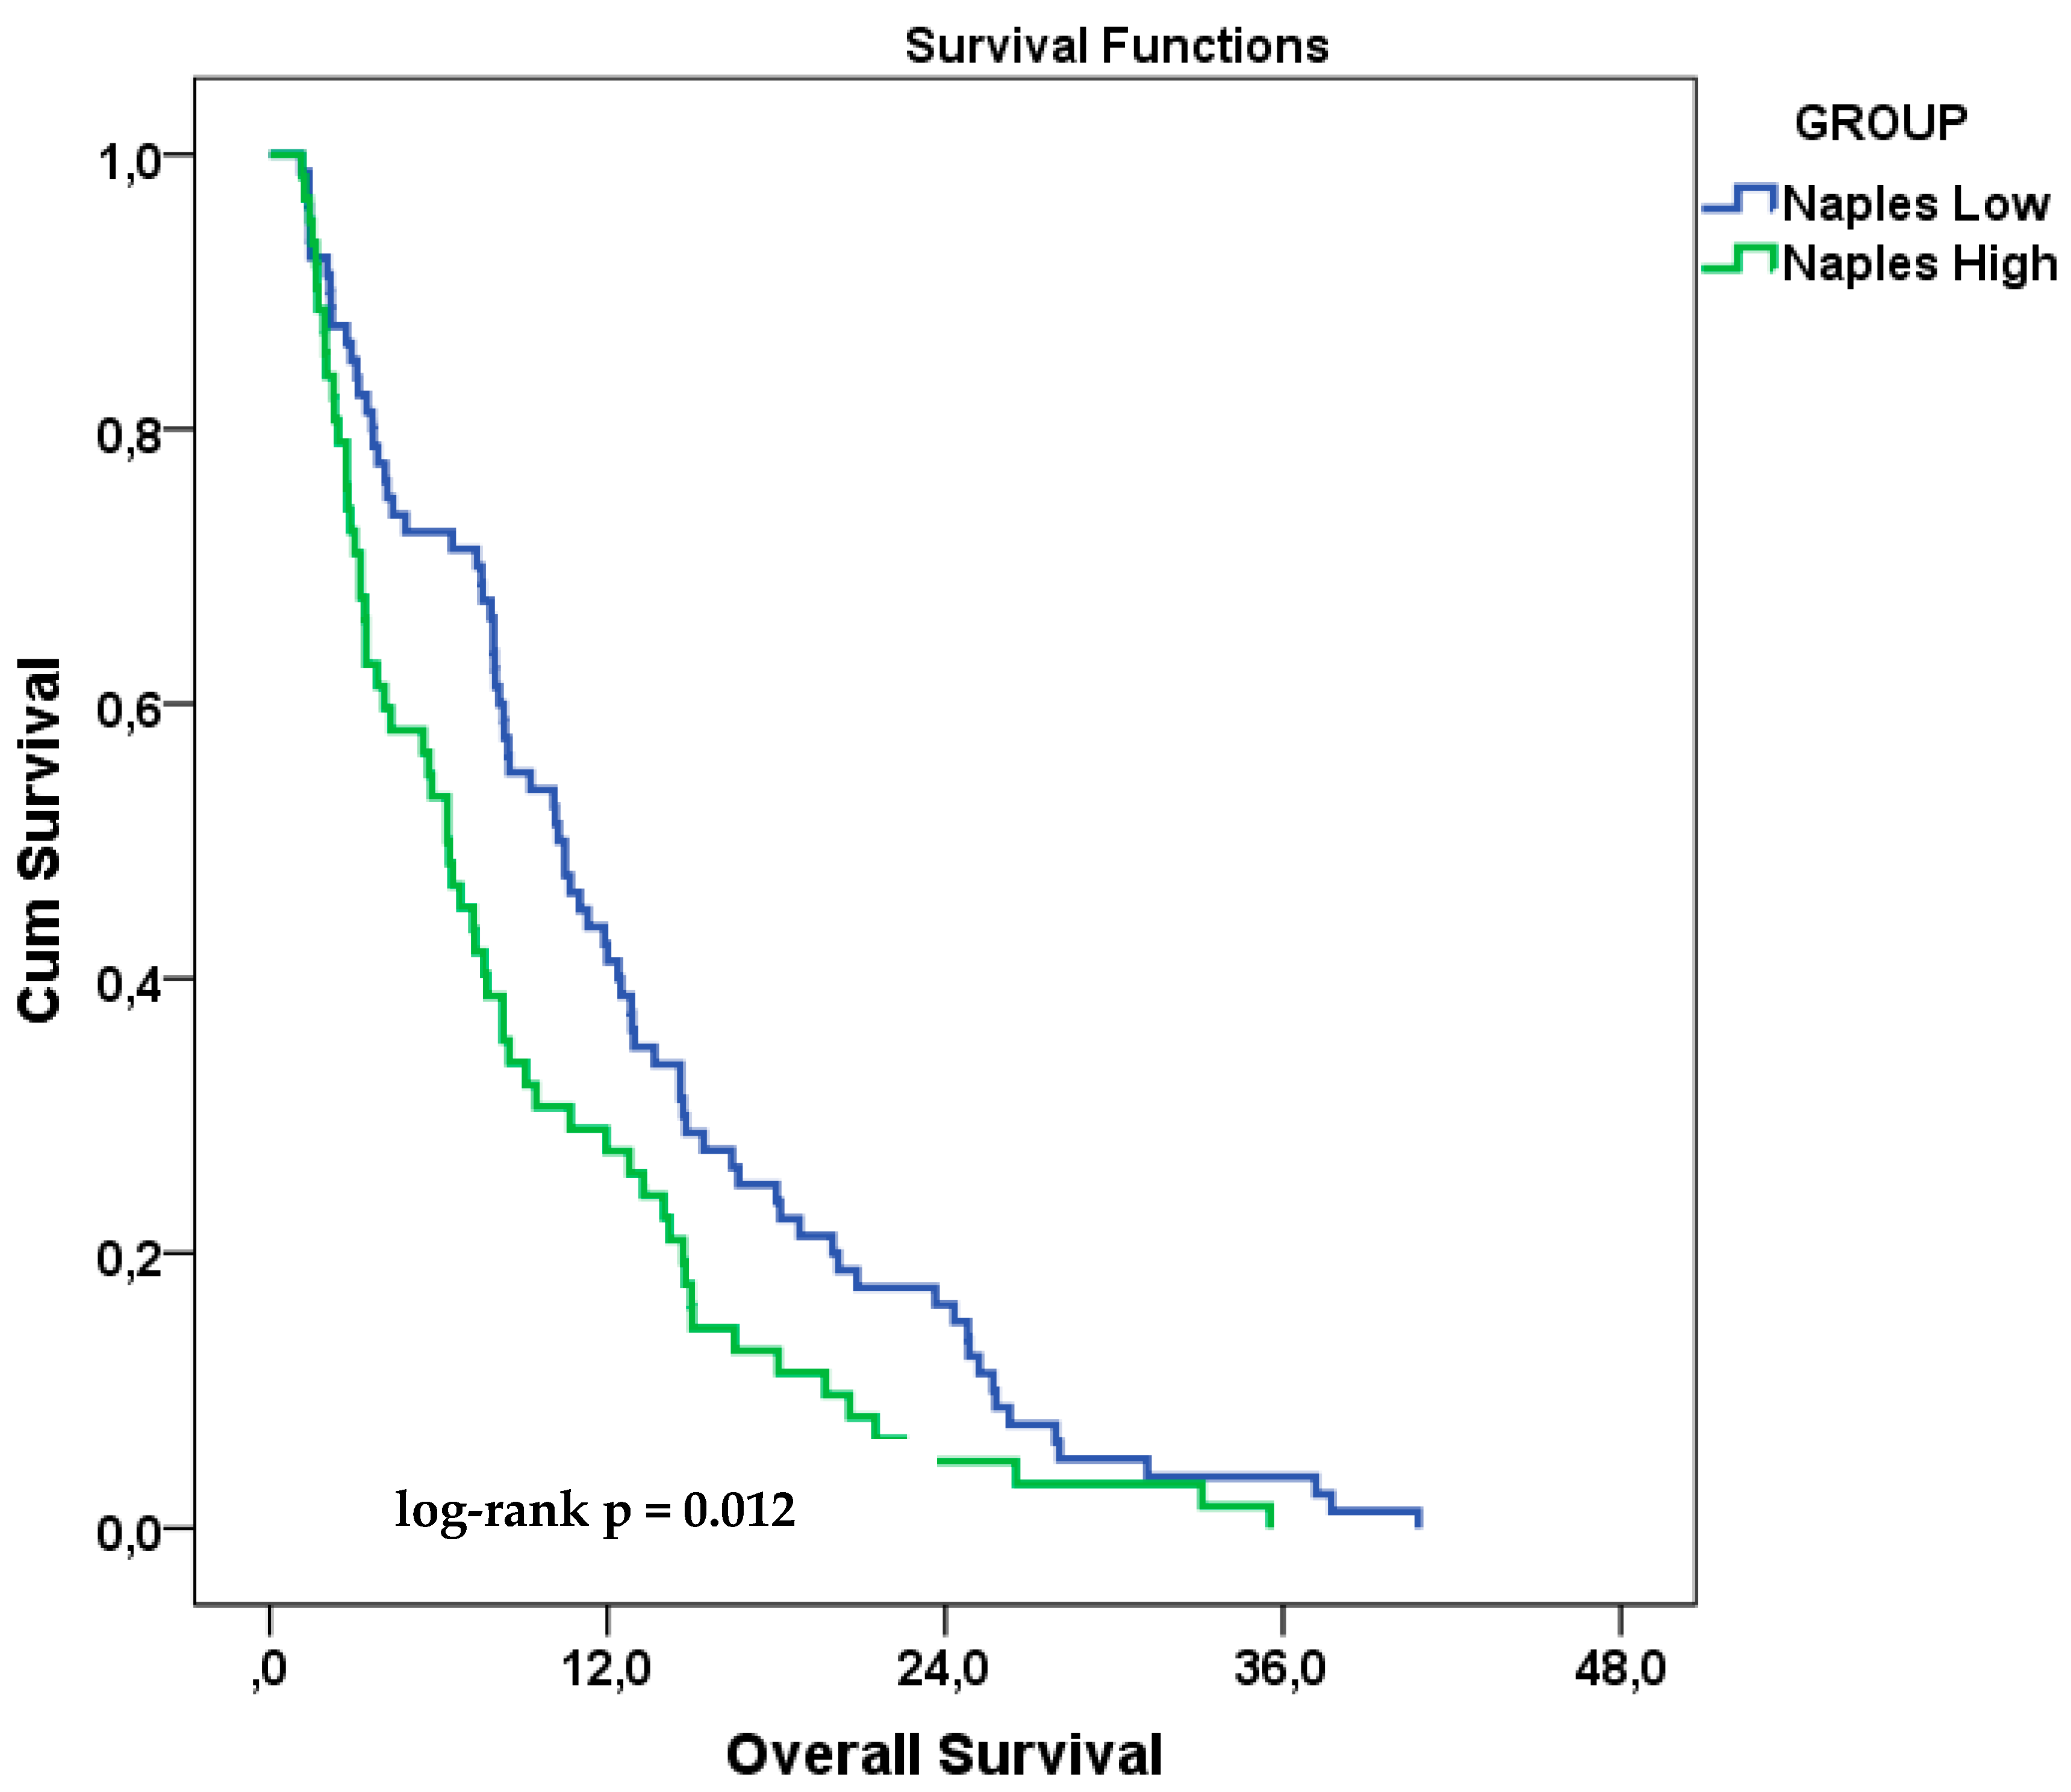
Figure 2.
Kaplan–Meier curves for OS in patients with ES-SCLC, stratified by original NPS groups (0 vs. 1–2 vs. 3–4).
Figure 2.
Kaplan–Meier curves for OS in patients with ES-SCLC, stratified by original NPS groups (0 vs. 1–2 vs. 3–4).
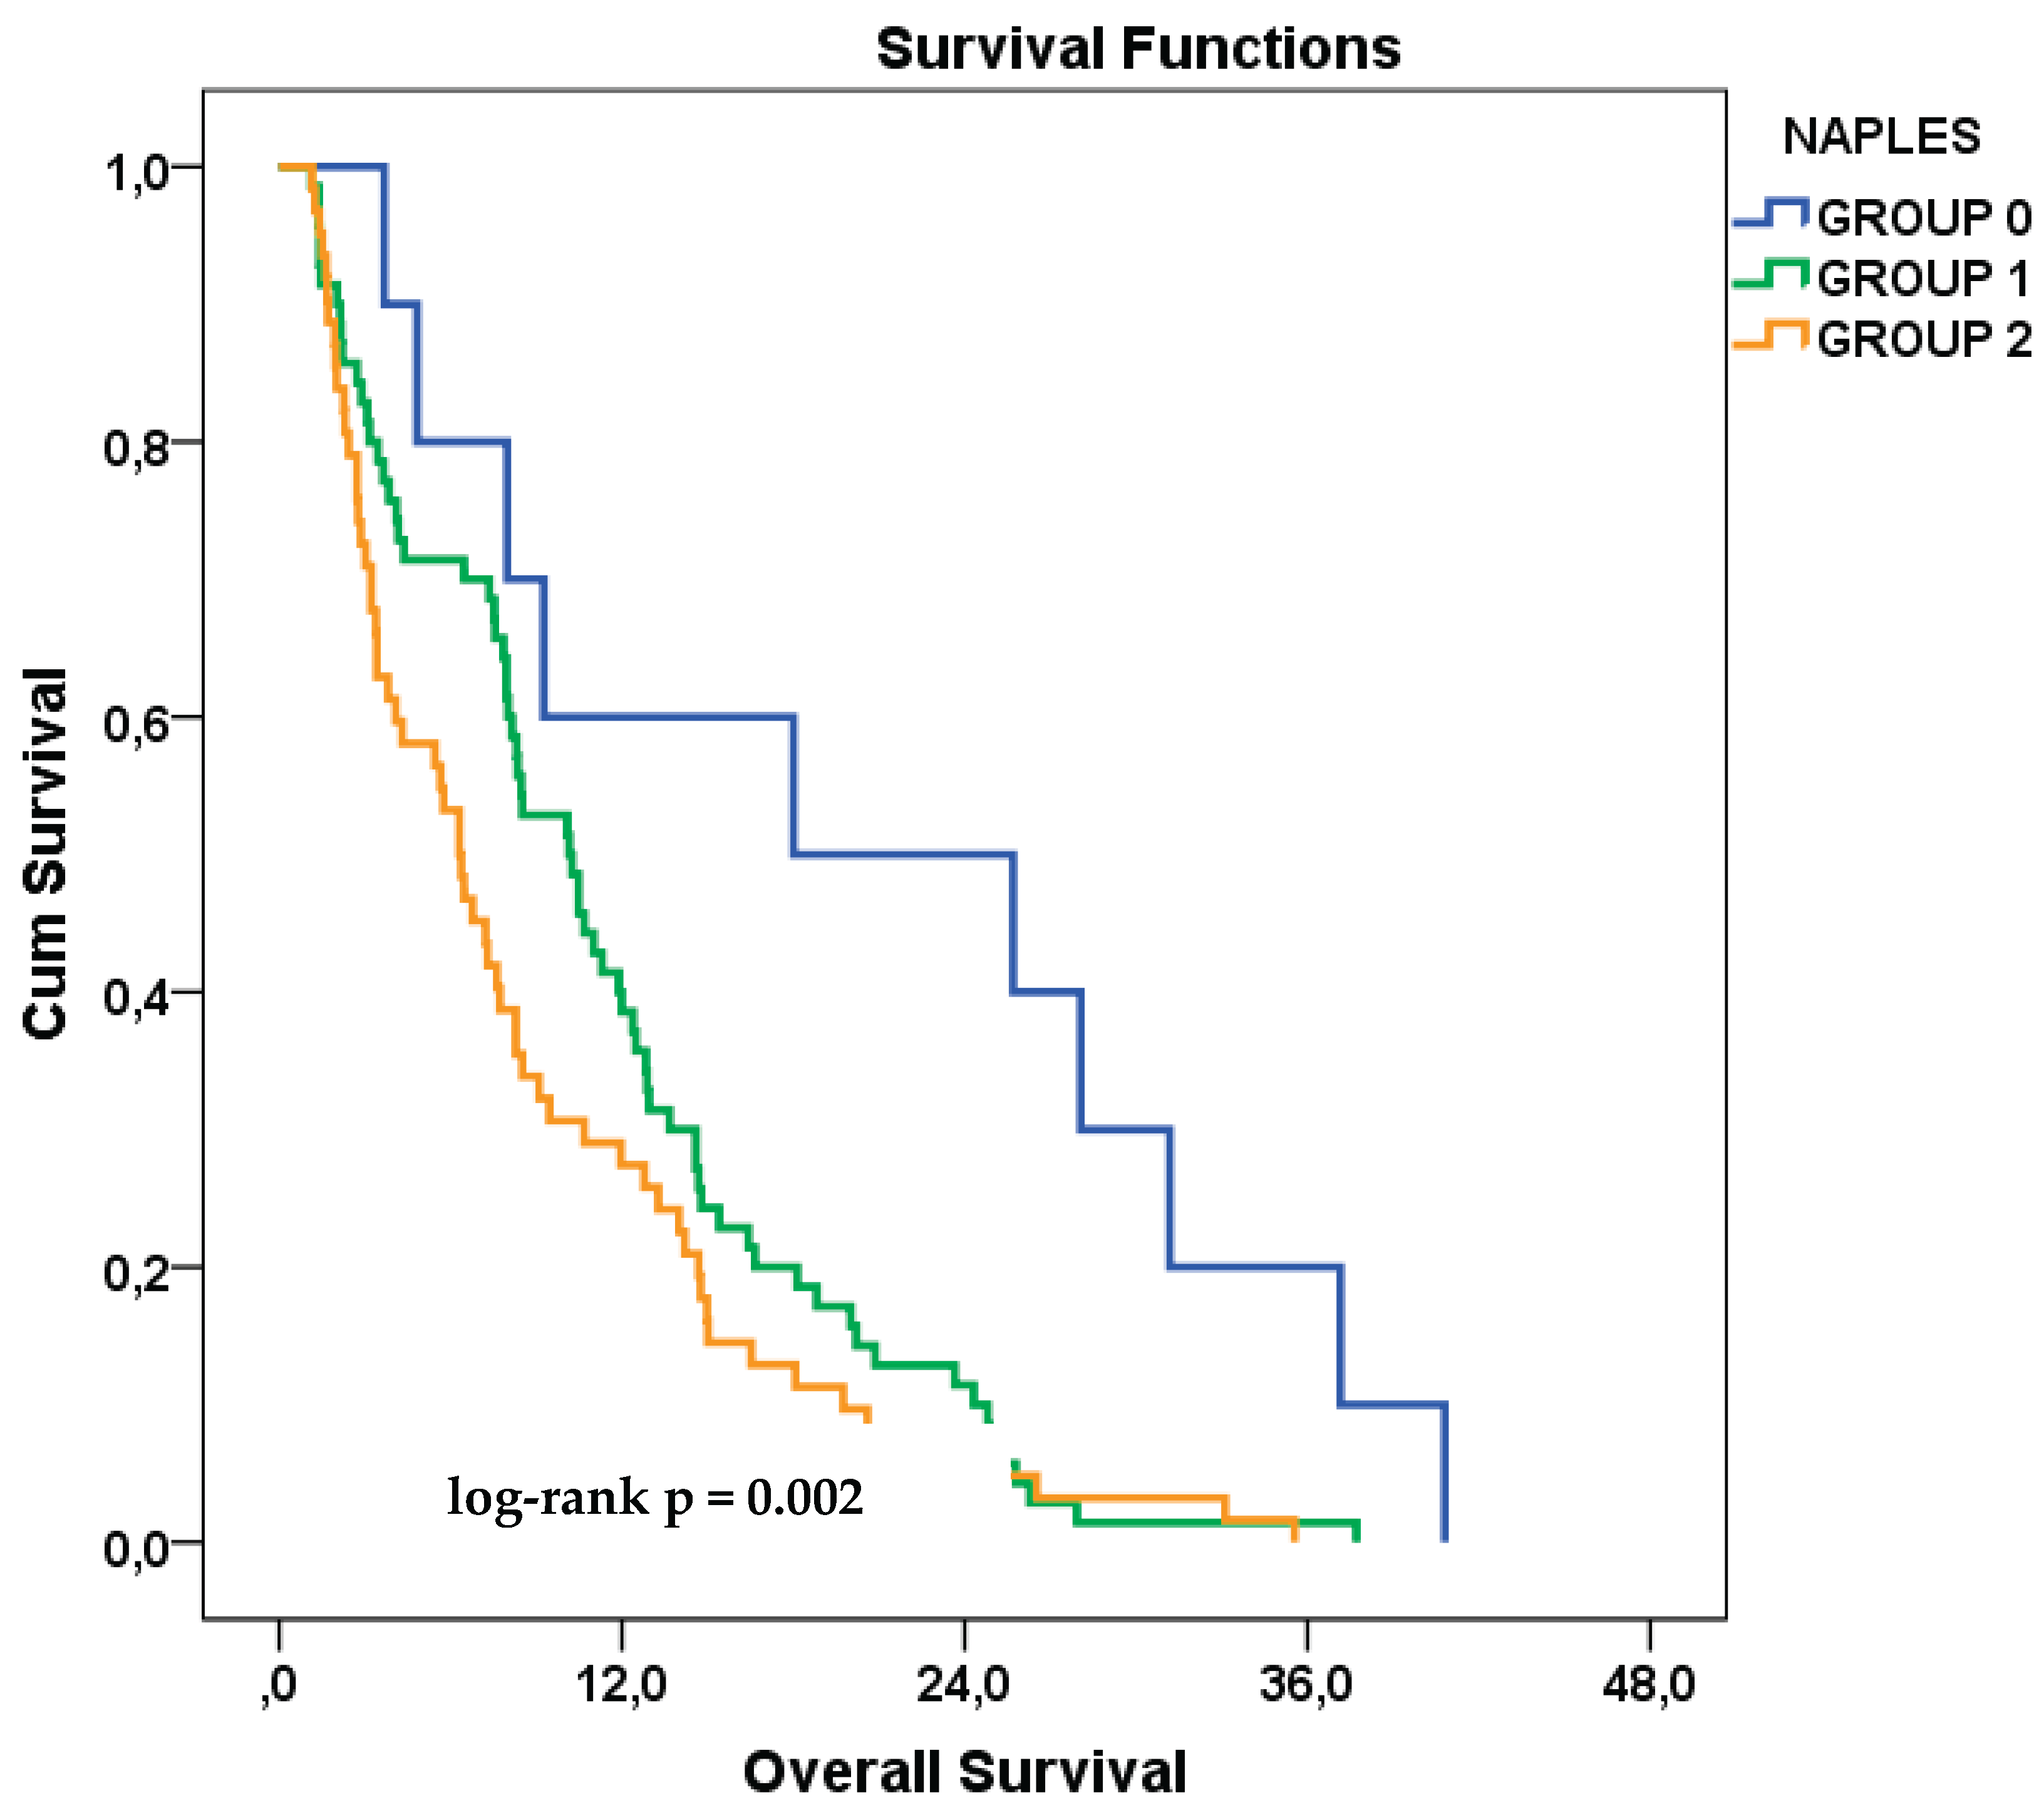

Table 1.
Baseline Demographic and Clinical Characteristics Stratified by NPS Risk Groups.
| Clinical Variable | Category | Total (n, %) | Low-Risk Group | High-Risk Group | p-value |
|---|---|---|---|---|---|
| Age | <65 years | 95 (66.9%) | 56 (70.0%) | 39 (62.9%) | 0.472 |
| ≥65 years | 47 (33.1%) | 24 (30.0%) | 23 (37.1%) | ||
| ECOG PS | 0 | 91 (64.1%) | 58 (72.5%) | 33 (53.2%) | 0.018 |
| ≥1 | 51 (35.9%) | 22 (27.5%) | 29 (46.8%) | ||
| Sex | Female | 11 (7.7%) | 5 (6.3%) | 6 (9.7%) | 0.449 |
| Male | 131 (92.3%) | 75 (93.8%) | 56 (90.3%) | ||
| Smoking Status | Non-current smoker | 34 (23.9%) | 17 (21.3%) | 17 (27.4%) | 0.393 |
| Current smoker | 108 (76.1%) | 63 (78.8%) | 45 (72.6%) | ||
| Comorbidity | Absent | 72 (50.7%) | 41 (51.2%) | 31 (50.0%) | 0.883 |
| Present | 70 (49.3%) | 39 (48.8%) | 31 (50.0%) | ||
| Stage at Diagnosis | Limited disease | 39 (27.5%) | 23 (28.7%) | 16 (25.8%) | 0.697 |
| Extensive disease | 103 (72.5%) | 57 (71.3%) | 46 (74.2%) | ||
| PCI | Not administered | 107 (75.4%) | 56 (70.0%) | 51 (82.3%) | 0.093 |
| Administered | 35 (24.6%) | 24 (30.0%) | 11 (17.7%) | ||
| Number of Metastatic Sites | Single site | 45 (31.7%) | 25 (31.3%) | 20 (32.3%) | 0.898 |
| ≥2 sites | 97 (68.3%) | 55 (68.8%) | 42 (67.7%) | ||
| Brain Metastasis | Absent | 102 (71.8%) | 57 (71.3%) | 45 (72.6%) | 0.861 |
| Present | 40 (28.2%) | 23 (28.7%) | 17 (27.4%) | ||
| Bone Metastasis | Absent | 71 (50.0%) | 44 (55.0%) | 27 (43.5%) | 0.176 |
| Present | 71 (50.0%) | 36 (45.0%) | 35 (56.5%) | ||
| Liver Metastasis | Absent | 105 (73.9%) | 61 (76.3%) | 44 (71.0%) | 0.477 |
| Present | 37 (26.1%) | 19 (23.8%) | 18 (29.0%) | ||
| Lung Metastasis | Absent | 117 (82.4%) | 67 (83.8%) | 50 (80.6%) | 0.630 |
| Present | 25 (17.6%) | 13 (16.3%) | 12 (19.4%) | ||
| Adrenal Metastasis | Absent | 109 (76.8%) | 61 (76.3%) | 48 (77.4%) | 0.870 |
| Present | 33 (23.2%) | 19 (23.8%) | 14 (22.6%) |
Abbreviations: NPS, Naples Prognostic Score; ECOG PS, Eastern Cooperative Oncology Group Performance Status; PCI, Prophylactic Cranial Irradiation. Statistical analysis: P-values were calculated using the Pearson chi-square test. A p-value <0.05 was considered statistically significant.
Table 2.
Univariate Cox Regression Analysis of Overall Survival According to Baseline Clinical and Laboratory Variables.
Table 2.
Univariate Cox Regression Analysis of Overall Survival According to Baseline Clinical and Laboratory Variables.
| Clinical Variable | Category | HR (95% CI) | p-value | Reference Category |
|---|---|---|---|---|
| Age | ≥65 years | 1.35 (0.94–1.92) | 0.101 | <65 years |
| ECOG PS | ECOG ≥1 | 1.43 (1.01–2.03) | 0.047 | ECOG 0 |
| Sex | Male | 0.98 (0.53–1.83) | 0.957 | Female |
| Smoking Status | Current smoker | 1.05 (0.71–1.55) | 0.809 | Non-current smoker |
| Comorbidity | Present | 1.26 (0.91–1.76) | 0.168 | Absent |
| Stage at Diagnosis | De novo | 0.93 (0.65–1.34) | 0.681 | Relapsed |
| PCI | Yes | 0.98 (0.67–1.45) | 0.935 | No PCI |
| Number of Metastatic Sites | ≥2 sites | 1.59 (1.11–2.29) | 0.012 | Single site |
| Brain Metastasis | Present | 1.38 (0.95–2.00) | 0.088 | Absent |
| Bone Metastasis | Present | 1.41 (1.01–1.98) | 0.044 | Absent |
| Liver Metastasis | Present | 1.08 (0.74–1.58) | 0.691 | Absent |
| Lung Metastasis | Present | 1.52 (0.98–2.33) | 0.061 | Absent |
| Adrenal Metastasis | Present | 0.97 (0.65–1.44) | 0.868 | Absent |
| NLR | High (≥ cutoff) | 1.34 (0.95–1.89) | 0.098 | Low (< cutoff) |
| LMR | High (≥ cutoff) | 1.62 (1.06–2.47) | 0.027 | Low (< cutoff) |
| Serum Cholesterol | High (≥ cutoff) | 0.86 (0.57–1.30) | 0.475 | Low (< cutoff) |
| Serum Albumin | High (≥ cutoff) | 1.44 (1.02–2.03) | 0.040 | Low (< cutoff) |
| NPS | High (3–4) | 1.54 (1.10–2.15) | 0.013 | Low (0–2) |
Abbreviations: NPS, Naples Prognostic Score; ECOG PS, Eastern Cooperative Oncology Group Performance Status; PCI, Prophylactic Cranial Irradiation; HR, Hazard Ratio; CI, Confidence Interval; NLR, Neutrophil-to-Lymphocyte Ratio; LMR, Lymphocyte-to-Monocyte Ratio. Statistical analysis: Hazard ratios (HRs) and 95% confidence intervals (CIs) were calculated using univariate Cox proportional hazards regression. A p-value <0.05 was considered statistically significant.
Table 3.
Multivariate Cox Regression Analysis for Overall Survival – Model 1 (Composite NPS Score).
| Variable | HR (95% CI) | p-value |
|---|---|---|
| High NPS (3–4) | 1.45 (1.02–2.06) | 0.041 |
| Bone metastasis | 1.27 (0.88–1.82) | 0.203 |
| Brain metastasis | 1.23 (0.84–1.78) | 0.290 |
| Lung metastasis | 0.68 (0.43–1.08) | 0.100 |
| ECOG PS ≥1 | 1.19 (0.82–1.73) | 0.367 |
| Age ≥65 | 1.20 (0.83–1.73) | 0.329 |
Abbreviations: NPS, Naples Prognostic Score; ECOG, Eastern Cooperative Oncology Group; HR, Hazard Ratio; CI, Confidence Interval. Statistical analysis: Multivariate Cox proportional hazards regression was performed using the composite NPS classification (low vs. high) along with clinical covariates. Hazard ratios (HRs) and 95% confidence intervals (CIs) are reported. A p-value <0.05 was considered statistically significant.
Table 4.
Multivariate Cox Regression Analysis for Overall Survival – Model 2 (Individual NPS Components).
Table 4.
Multivariate Cox Regression Analysis for Overall Survival – Model 2 (Individual NPS Components).
| Variable | HR (95% CI) | p-value |
|---|---|---|
| LMR (High) | 1.65 (1.04–2.61) | 0.034 |
| Serum albumin (High) | 1.48 (1.03–2.11) | 0.033 |
| NLR (High) | 1.01 (0.69–1.49) | 0.954 |
| Bone metastasis | 1.30 (0.89–1.88) | 0.164 |
| Brain metastasis | 1.18 (0.80–1.73) | 0.408 |
| Lung metastasis | 0.71 (0.45–1.12) | 0.139 |
| ECOG PS ≥1 | 1.43 (0.97–2.11) | 0.068 |
| Age ≥65 | 1.11 (0.77–1.60) | 0.591 |
Abbreviations: NLR, Neutrophil-to-Lymphocyte Ratio; LMR, Lymphocyte-to-Monocyte Ratio; ECOG, Eastern Cooperative Oncology Group; HR, Hazard Ratio; CI, Confidence Interval. Statistical analysis: Multivariate Cox regression analysis was conducted using the individual NPS components (NLR, LMR, serum albumin, and cholesterol) along with clinical variables. Hazard ratios (HRs) and 95% confidence intervals (CIs) are shown. Statistical significance was defined as p <0.05.
Disclaimer/Publisher’s Note: The statements, opinions and data contained in all publications are solely those of the individual author(s) and contributor(s) and not of MDPI and/or the editor(s). MDPI and/or the editor(s) disclaim responsibility for any injury to people or property resulting from any ideas, methods, instructions or products referred to in the content. |
© 2025 by the authors. Licensee MDPI, Basel, Switzerland. This article is an open access article distributed under the terms and conditions of the Creative Commons Attribution (CC BY) license (http://creativecommons.org/licenses/by/4.0/).
Copyright: This open access article is published under a Creative Commons CC BY 4.0 license, which permit the free download, distribution, and reuse, provided that the author and preprint are cited in any reuse.


