Submitted:
04 August 2025
Posted:
06 August 2025
You are already at the latest version
Abstract
Background: This study attempted to combine Serum Metabolic Biomarkers with clinical factors to construct nomograms to predict outcomes of patients with advanced non-small cell lung cancer( NSCLC) receiving first-line chemoimmunotherapy (CIT). Methods: A retrospective analysis was conducted on 112 patients with stage IIIC–IVB NSCLC receiving first-line CIT between January 2019 and January 2022.The Serum Metabolic Biomarker including lactate dehydrogenase (LDH), lactate (LAC), uric acid (UA), albumin (ALB), triglycerides (TG) and total cholesterol (TC) were examined at baseline. Patients were stratified into responders (R)and non-responders(NR) based on treatment efficacy. Progression-free survival (PFS) and overall survival (OS) were assessed via Kaplan-Meier analysis. Nomograms was created based on the multivariate Cox regression analysis to predict OS and PFS. The nomogram was internally validated using bootstrap resampling. Nomogram was assessed using the concordance index (C-index), the time-dependent area under the receiver operating curves(ROC), calibration curves, and decision curve analysis (DCA). Results: Non-diabetic status, PD-L1 expression≥50%, low LDH, LAC, UA, TC and high ALB correlated with better response (all P<0.05). Multivariate analysis revealed that stage IV , LDH ≥193 U/L, LAC ≥2.5 mmol/L, UA ≥430 μmol/L, and TG ≥3.5 mmol/L independently predicted worse PFS, while distant metastases, stage IV , BMI <21 kg/m², LDH ≥208 U/L, LAC ≥2.5 mmol/L, UA ≥430 μmol/L, TG ≥3.5 mmol/L and ALB <36 g/L independently predicted inferior OS (all P<0.05). The C-indexes of the nomogram for predicting PFS and OS were 0.759 (95% CI: 0.705–0.803) and 0.729 (95% CI: 0.723–0.783), respectively. Time-dependent Area Under the Curve( AUCs)for 12-,24-,36-month PFS (0.810,0.800,0.860) and OS (0.870,0.820,0.780) confirmed reliability. Calibration curves demonstrated a good agreement between predictions and actual observations. DCA indicated that the nomograms had good net benefits. Conclusion: Serum metabolic biomarkers (LDH, LAC, UA, ALB, TG) hold significant value in predicting outcomes of chemoimmunotherapy in advanced NSCLC. The nomograms provide accurate and practical tools to guide personalized treatment decisions.
Keywords:
advanced NSCLC
; serum metabolic biomarkers
; chemoimmunotherapy
; prognosis
; efficacy
; nomogram
1. Introduction
Lung cancer remains the most common diagnosed cancers and the leading cause of cancer-related mortality worldwide. According to 2022 global cancer statistics, approximately 2.48 million new lung cancer cases were diagnosed, accounting for 12.4% of all malignancies, with about 1.80 million deaths representing 18.7% of total cancer mortality [1]. More than 85% of cases are classified as NSCLC, with nearly 70% of patients presenting advanced-stage disease at diagnosis, rendering them ineligible for curative surgery. The 5-year overall survival (OS) rate for these patients remains below 20%[2]. Recent advances in immune checkpoint inhibitors (ICIs) targeting programmed death-1 (PD-1) and programmed death ligand-1 (PD-L1), in combination with platinum-based chemotherapy, have significantly improved survival outcomes in patients with advanced NSCLC. Chemoimmunotherapy (CIT)has become the standard first-line treatment for advanced NSCLC [3,4].
Despite the survival benefits achieved with chemoimmunotherapy, Only a small proportion of patients responded to the treatment, with objective response rate (ORR) ranging from 40% to 50% and 5-year OS rates between 18% and 32%. Additionally, treatment-related adverse events can negatively impact quality of life in some patients [5,6]. Therefore, identifying reliable predictive biomarkers to guide personalized treatment decisions is an urgent clinical need. While PD-L1 expression and tumor mutational burden (TMB) are the most commonly used biomarkers for predicting response to immunotherapy in NSCLC, their clinical utility is limited by technical complexities, high cost, and the difficulty of obtaining tumor tissue samples [7]. Emerging evidence highlights the crucial role of metabolic reprogramming in modulating the efficacy of immune checkpoint inhibitors (ICIs) [8]. Metabolic reprogramming affects the treatment response through various pathways: (1) uric acid activates the NLRP3 inflammasome, impairing CD8+ T cell; (2) Lactate accumulation promotes M2 macrophage polarization, fostering an immunosuppressive microenvironment; (3) Amino acid metabolites,such as serum N-(3-indolylacetyl)-L-alanine, demonstrate significant correlations with ICI response; (4) Lactate modulates Treg activity, suppressing effector T cell function [9,10].Zheng et al. reported that lower levels of N-(3-indolylacetyl)-L-alanine were associated with better outcomes in patients with advanced NSCLC receiving chemoimmunotherapy [11]. Therefore, serum metabolic biomarkers, as noninvasive “liquid biopsy” tools reflecting the tumor microenvironment, hold promise as predictive indicators of treatment response in NSCLC.
Compared to tissue-based biomarkers, serum metabolic biomarkers offers advantages including technical simplicity, cost-effectiveness, and repeatability, facilitating clinical implementation. However, there is a lack of systematic evaluation of the predictive value of serum metabolic markers in NSCLC patients undergoing chemoimmunotherapy. Moreover, no prognostic models based on such markers have been established.
This study aimed to integrate metabolic indicators across multiple domains—lactate (glucose metabolism), triglycerides and cholesterol (lipid metabolism), uric acid (nucleotide metabolism), and albumin (protein metabolism)—to develop a comprehensive, metabolically-informed nomogram. The goal was to predict treatment efficacy and survival in advanced NSCLC patients undergoing chemoimmunotherapy, providing a basis for early identification of potential beneficiaries, optimizing therapeutic decisions, and exploring novel metabolic intervention targets.
2. Materials and Methods
2.1. Patients
This was a single-center retrospective cohort study. Patients with advanced NSCLC who received first-line chemoimmunotherapy at our institution between January 2019 and January 2022 were included. The inclusion criteria were as follows:(1) patients aged 18–80 years; (2) with a baseline Eastern Cooperative Oncology Group performance status(ECOG ps) score ≤2;(3) pathologically diagnosed with NSCLC;(4) with clinical stage IIIC-IVB; (5) at least two cycles of first-line chemoimmunotherapy; (6) Complete baseline imaging and serum metabolic biomarker data available; (7) at least one measurable tumor lesion according to response evaluation criteria in solid tumors (RECIST) version 1.1.The exclusion criteria were as follows:(1) small-cell lung cancer or other histologic types; (2)had EGFR/ALK/ROS1 mutations; (3)combined with other malignant tumors; (4) previously received other antitumor treatments;(5) concomitant radiotherapy;(6)underlying conditions such as acute infection, hematological disorders, autoimmune diseases, pregnancy or lactation;(7) had missing clinical data;(8)Follow-up <6 months.
2.2. Data Collection
The clinical information was obtained from electronic medical record system and experiment data was collected from laboratory information system. The demographic data included the age, sex, body mass index (BMI),ECOG and smoking status. Comorbidities included hypertension and diabetes mellitus. Tumor characteristics included histological type, lymphatic metastasis, TNM stage, PD-L1 expression, metastatic sites and number, treatment regimens and cycles. Hematological Parameters included neutrophils, lymphocytes, monocytes(MONO), hemoglobin(Hb), LDH, LAC, UA, TG, TC, ALB. NLR = neutrophil count (109/L) / lymphocyte count (109/L)
2.3. Treatment Regimens and Efficacy Assessment
All patients received first-line chemoimmunotherapy. The PD-1 inhibitors included pembrolizumab, sintilimab or tislelizumab. Tislelizumab and sintilimab were administered intravenously at a dose of 200 mg every 3 weeks. Pembrolizumab was administered intravenously at a dose of 2 mg/kg every 3 weeks. Chemotherapy regimens consisted of pemetrexed plus platinum for adenocarcinoma, and paclitaxel plus platinum for squamous cell carcinoma. Given the retrospective nature of the study, not all patients received standard-dose regimens.Treatment response after three cycles was assessed based on radiographic evidence following the RECIST 1.1 criteria [12].Responders (R) identified patients with a complete or partial response or stable disease after 3 months of treatment, while non-responders (NR) represented patients who progressed within 3 months.
2.4. Follow-up and Endpoints
All Patients were followed through outpatient visits or telephone interviews, with the follow-up period ending on June 30, 2025. PFS was the time from chemoimmunotherapy initiation to disease progression or death from any cause. OS was the time from disease onset to death from any cause or the last follow-up, whichever came first. Patients lost to follow-up were treated as censored data.
2.5. Statistical Analysis
Categorical variables were expressed as percentages and compared using the chi-square test or Fisher’s test. Continuous variables with a normal distribution were expressed as mean ± standard deviation(±s) and compared by the Students’ test. Non-normally distributed data were presented as medians (range) and compared using the Kruskal–Wallis rank-sum test. The predictive performance of serum metabolic biomarkers for efficacy was assessed using receiver operating characteristic (ROC) curve analysis. The X-tile (Yale University, version 3.6.1) software was used to determine the optimal cutoff values of blood biomarkers based on PFS and OS. We utilized the Kaplan-Meier method along with the log-rank test to compare the survival curves. Furthermore, univariate cox proportional hazard regression analysis was performed to explore significant factors associated with PFS and OS. Variables with a P<0.1 in the univariate analysis and other clinically relevant high-risk factors were entered into multivariate cox proportional hazard regression analysis. variables with a P<0.05 in the multivariate Cox regression analysis were ultimately included in the development of the nomogram for predicting PFS and OS. Then, the nomograms were validated internally by using bootstrap method with 1000 resamples. we utilized the C-index), ROC curves, calibration curves, and DCA to assess the performance of the nomogram model.
Statistical analyses and graphing were carried out using the packages of“survival”,“survminer”,“ggsurvfit”,“rms”,“survival ROC”,“dcurves”,“ggplot2” in R version 4.3.1 for Cox regression, survival analysis, nomogram generation, ROC curve analysis, C-index assessment, calibration curve and DCA generation. The rest of the statistical analyses were performed by SPSS version 26.0 (IBM Corporation, Armonk, NY) and graphing using Graphpad Prism 10.1.2 (San Diego, USA). All statistical tests were two-tailed, and P<0.05 was considered statistically significant.
3. Results
3.1. Clinical Characteristics and Efficacy
A total of 112 patients with advanced NSCLC receiving first-line chemoimmunotherapy were enrolled in this study. The baseline clinical characteristics of responders and non-responders are listed in Table 1. The analysis demonstrated that responders exhibited lower levels of LDH, LAC, UA, and TG, and higher level of ALB compared to non-responders(all P<0.005, Figure 1A–E). ROCs showed that the level of LDH predicted treatment efficacy(AUC=0.659, Figure 1F),as did the level of ALB (AUC = 0.626, Figure 1J). Patients with PD-L1 expression ≥50% achieved significantly higher ORR than those with PD-L1 <50% (82.35% vs 35.53%, P<0.001),patients with diabete exhibited a lower ORR than those without diabetes (32.14% vs 54.76%, P=0.038).
3.2. Optimal Cutoff
X-tile software was used to determine the optimal cutoff values for BMI,NL, MONO, Hb, LDH, LAC,UA, TG and ALB in predicting PFS and OS. The optimal cutoff values were 21Kg/m2 for BMI, 3.2 for NLR, 0.7ⅹ109/L for MONO, 112g/L for Hb, 193U/L for LDH, 2.5 mmol/L for LAC, 430umol/L for UA, 3.5mmol/L for TG and 36g/L for ALB in predicting PFS. The optimal cutoff values were 21Kg/m2 for BMI, 2.9 for NLR, 0.7ⅹ109/L for MONO, 114g/L for Hb, 208U/L for LDH, 2.5 mmol/L for LAC, 430umol/L for UA, 3.5mmol/L for TG and 36g/L for ALB in predicting OS. Patients were subsequently stratified into high- and low-level groups based on these cut-offs for further survival analysis.
3.3. Survival Analysis
As of the follow-up cut-off date (June 30, 2025), the median follow-up duration was 25 months (range: 6–60 months), with 3 cases (2.68%) lost to follow-up. Kaplan–Meier survival analysis and log-rank tests showed that high levels of LDH, LAC, UA, and TG were associated with shorter PFS(all P < 0.05; Figure 2),while high levels of LDH, LAC, UA, TG and lower levels of BMI,ALB were associated with shorter OS( all P < 0.05; Figure 3). Univariate Cox regression identified BMI, MONO, Hb, LDH, LAC, UA, TG, and ALB as significant predictors for PFS (P<0.05, Table 2), and PD-L1 expression, BMI, NLR, MONO, Hb, LDH, LAC, UA, TG, and ALB for OS (P<0.05, Table 3). Multivariate analysis showed that stage IV disease( HR = 0.574, 95% CI: 0.336–0.981, P =0.042), LDH ≥193 U/L(HR = 0.418, 95% CI: 0.259–0.674, P =0.000)), UA ≥430 μmol/L (HR = 0.471, 95% CI: 0.286–0.774, P =0.003), LAC ≥2.5 mmol/L (HR = 0.434, 95% CI: 0.259–0.725, P =0.001), and TG ≥3.5 mmol/L(HR = 0.552, 95% CI: 0.331–0.921, P =0.023) as independent poor prognostic factors for PFS (P<0.05), while stage IV disease(HR = 0.449, 95% CI: 0.240–0.840, P =0.012), distant metastases(HR = 2.564, 95% CI:1.069–6.154, P =0.035), BMI <21 kg/m²(HR = 1.656, 95% CI: 1.048-2.617, P =0.031), LDH ≥208 U/L(HR = 0.579, 95% CI: 0.366–0.917, P =0.020), LAC ≥2.5 mmol/L(HR = 0.504, 95% CI: 0.310–0.820, P =0.006), UA ≥430 μmol/L(HR = 0.442, 95% CI: 0.264–0.737, P =0.002), TG ≥3.5 mmol/L(HR = 0.540, 95% CI: 0.320–0.912, P =0.021), and ALB <36 g/L(HR = 0.449, 95% CI: 0.240–0.840, P =0.039) were independent predictors for worse OS.
3.4. Development and Validation of Nomogram Prediction Models
Based on the results of the Cox multivariate analysis, two
nomogram were constructed to predict PFS and OS(Figure 4A,C). The C-index of the PFS prediction
model was 0.759 (95% CI: 0.705-0.803), and
it was 0.729 (95% CI: 0.723-0.783) for the OS model, indicating high predictive accuracy. Time-dependent
receiver operating characteristic (ROC) analysis revealed area under the curve
(AUC) values of 0.810, 0.800, and 0.860 for 12-, 24-, and 36-month PFS
predictions, respectively (Figure 5A), and corresponding AUC values of 0.870, 0.820, and
0.780 for OS predictions (Figure 5C).Calibration curves demonstrated good agreement
between predicted and actual outcomes(Figure 4B,D). Furthermore, DCA confirmed the clinical utility
of both models, demonstrating favorable net benefits across a wide range of
threshold probabilities(Fig.5B,5D).
4. Discussion
Chemoimmunotherapy has become the standard first-line treatment for driver-negative advanced NSCLC, significantly improving the prognosis for patients [13]. However, substantial heterogeneity in treatment response persists, some patients don’t respond beneficially to chemoimmunotherapy [14]. Current biomarkers predictiving the efficacy of immunotherapy, such as PD-L1 expression, TMB, MSI, rely on tumor tissue samples, while a peripheral blood-based predictive system remains underdeveloped. This study innovatively integrated serum metabolic biomarkers (LDH, LAC, UA, ALB, TC, TG) with clinical characteristics to construct a prognostic nomogram for advanced NSCLC patients receiving chemoimmunotherapy, demonstrating the significant value of serum metabolic markers in outcome prediction. The model exhibited excellent discriminative ability and clinical utility, providing a quantifiable tool for clinical decision-making. These findings align with metabolic reprogramming theory, suggesting that serum metabolic biomarkers can reflect the immune status and energy metabolism characteristics of the tumor microenvironment.
Metabolic reprogramming represents a hallmark of various malignancies and involves dysregulation across multiple pathways, including glucose, lipid, nucleotide, and amino acid metabolism, which collectively regulate tumor growth, immune escape, and Immune response [15]. High levels of glucose, LDH, and LAC contribute to the establishment of an immunosuppressive tumor microenvironment through multifaceted mechanisms,such as g glucose competition-mediated impairment of T cell function, and acidic metabolites impairing antigen presentation and T cell activity [8]. Hyperglycemia suppresses antitumor immunity via dual mechanisms: (1) upregulation of glucose transporter 1 (GLUT1) expression on tumor cells, exacerbating glucose competition and leading to CD8+ T cell energy deprivation; (2) activation of the mammalian target of rapamycin complex 1 (mTORC1) pathway, promoting immune evasion [16]. Clinical observations by Osataphan et al. demonstrated significantly worse overall survival (OS) in diabetic non-small cell lung cancer (NSCLC) patients following immunotherapy((HR: 1.53; 95% CI: 1.08 -2.15; p= 0.016) [17]. Consistent with these findings, non-diabetic patients showed a higher ORR(54.76% vs 32.14%, P=0.038), suggesting a detrimental impact of hyperglycemia on treatment efficacy. However, the lack of significant association between diabetic status and PFS or OS in our cohort may be attributable to limited sample size or relatively short follow-up duration.
Lactate, a key metabolic byproduct of glycolysis, plays a crucial role in tumor progression through multiple mechanisms: (1) The acidic microenvironment generated by lactate accumulation promotes tumor angiogenesis, invasion, metastasis, drug resistance, and immune evasion; (2) it induces the polarization of tumor-associated macrophages (TAMs), promoting immune suppression; (3) it upregulates PD-1 expression on Tregs and downregulates PD-1 on effector T cells, contributing to immune tolerance; (4) it inhibits monocyte differentiation into dendritic cells (DCs), weakening antigen presentation capacity [18,19]. Chen et al. demonstrated that lactate accumulation in tumor metabolism enables cancer cells to evade chemotherapeutic cytotoxicity, thereby indirectly promoting chemoresistance [20]. In line with previous studies, our data revealed significantly higher lactate levels in non-responders compared to responders. Importantly, elevated lactate levels (≥2.5 mmol/L) were significantly associated with both shorter PFS and OS, emerging as an independent prognostic factor for poor outcomes. These results further underscore the pivotal role of lactate in mediating immune resistance and tumor progression.
LDH, a key enzyme in glycolysis, is widely used as an inflammatory and metabolic biomarker and reflects tumor burden and metabolic status. Substantial evidence indicates that elevated LDH levels correlate strongly with poor prognosis in various malignancies, potentially through multiple mechanisms: (1) LDH-mediated lactate production modulates immune system function; (2) promotion of epithelial–mesenchymal transition (EMT); (3) enhancement of angiogenesis; and (4) LDH-mediated lactate production modulates immune system function [21,22]. Clinical studies have reported that high level of LDH correlate with poor prognosis in advanced NSCLC, the combination of LDH with C-reactive protein (CRP) and albumin (ALB) has emerged as a potential prognostic biomarker panel for advanced NSCLC [23]. Some studies suggest LDH is prognostic but not predictive of treatment response, Angelina et al. proposed that high level of LDH is an independent negative prognostic factor in advanced NSCLC, though its predictive value for treatment response remains insufficient [24]. Our findings suggest that LDH not only predicts prognosis but also correlates with therapeutic response (AUC = 0.659), with lower LDH levels observed in responders. Multivariate analysis further confirmed that high LDH is an independent risk factor for both poor PFS and OS, supporting its role in prognosis and treatment stratification.
UA, the terminal product of purine metabolism, has been increasingly recognized as a significant biomarker associated with therapeutic efficacy and prognosis in various malignancies, with elevated levels frequently indicating poor clinical outcomes [25]. UA regulates antitumor immunity through complex mechanisms: (1) it promotes tumor progression through pro-inflammatory mechanisms; (2) modulates immune cell function via the adenosine pathway; (3) Impairs immunotherapy response by downregulating CD8+ T cell activity;(4) facilitates tumor immune escape by enhancing regulatory T cell (Treg) proliferation while suppressing effector T cell function [26]. Clinical investigations have established hyperuricemia as an adverse predictive factor for immunotherapy outcomes in multiple cancers including bladder carcinoma, hepatocellular carcinoma, and colorectal cancer [10,27,28]. Wang et al. also reported that in small cell lung cancer, high level of UA (≥296.45 µmol/L) was associated with shorter PFS and OS [29]. Our study further validates this finding in advanced NSCLC patients receiving chemoimmunotherapy, showing that UA ≥430 µmol/L was independently associated with worse PFS and OS. These results strongly suggest that serum UA levels may serve as a valuable peripheral blood biomarker for assessing immunosuppressive tumor microenvironment status in NSCLC patients receiving chemoimmunotherapy.
The role of lipid metabolism in the tumor microenvironment is gaining increasing attention. Lipid metabolic reprogramming contributes to immune evasion and may influence treatment response [30]. However, the impact of lipid metabolism on cancer treatment outcomes remains controversial. Jiang et al. analyzed plasma lipidomics in NSCLC and found that increased phosphatidylcholine (PC) and cholesterol ester (CE), along with decreased triacylglycerol (TAG), were associated with progressive disease [31]. In contrast, Li et al. found that a lower triglyceride to HDL cholesterol ratio predicted better OS in NSCLC [32]. Our study further revealed that high serum TG levels were independently associated with inferior PFS and OS, as well as poorer treatment response. Although the predictive performance of TG was moderate (AUC = 0.686), it remained a significant factor in our prognostic model. While total cholesterol levels were lower in responders compared to non-responders, this difference did not reach statistical significance, possibly due to limited sample size. Consequently, we did not further analyze the association between cholesterol levels and survival outcomes.
Mounting evidence underscores the critical association between nutritional status and clinical outcomes in NSCLC,low BMI and ALB levels reflect insufficient energy reserves and synthetic capacity, indicating poor immune function and treatment tolerance. ALB is often used in combination with other markers to predict prognosis in NSCLC. Yildirim et al. reported that low lymphocyte-to-albumin (LA) ratio was associated with shorter PFS and OS in metastatic NSCLC patients receiving immunotherapy [33]. Similarly, Madeline et al. reported that stage IV NSCLC patients with BMI <22 kg/m² and ALB <3.5 g/dL had inferior OS following immunotherapy [34].In line with these findings, our study found that BMI <21 kg/m² and ALB <36 g/L were independent predictors of poor PFS and OS, and low ALB was also associated with poor treatment response, underscoring the importance of nutritional assessment in clinical practice.
This study has several limitations: (1) it is a retrospective, single-center study and may have selection bias; (2) the sample size is relatively small, and follow-up time is limited, which may not fully represent the broader population; (3) the optimal cut-off values for metabolic markers have not been standardized and may vary across populations; (4) only baseline metabolic status was assessed, without evaluating dynamic changes during treatment.
5. Conclusions
In summary, this study systematically evaluated the predictive value of multiple serum metabolic biomarkers for treatment response and prognosis in advanced NSCLC patients undergoing chemoimmunotherapy, and successfully established a well-performing nomogram model. Our findings demonstrate that serum metabolic biomarkers holds significant potential for clinical risk stratification and treatment decision optimization, thereby providing novel insights for personalized therapy in advanced NSCLC. Further prospective multicenter studies are warranted to validate the clinical applicability of these findings and to guide the development of metabolism-targeted therapeutic strategies.
Author Contributions
T.Z.: Writing—original draft, data curation, investigation, formal analysis, methodology; W.H.:Investigation, formal analysis, validation; L.W.: Data curation, visualization; Z.Y.: Writing—review and editing, project administration, conceptualization, supervision,resources. All authors have read and agreed to the published version of the manuscript.
Funding
This research received no external funding
Institutional Review Board Statement
Institutional review board exemption was granted due to the innocuousness of the review study.
Informed Consent Statement
As the research was a retrospective study, the informed consents were waived off according to the Medical Ethics Committee of the First People’s Hospital of Yibin
Data Availability Statement
All data generated or analyzed during this study are available from the corresponding author on reasonable request.
Acknowledgments
Thank you to all the friends who provided help and support during the data collection process of the thesis.
Conflicts of Interest
The authors declare that they have no known competing financial interests or personal relationships that could have appeared to influence the work reported in this paper.
Abbreviations
| NSCLC Non-small cell lung cancer |
| CIT Chemoimmunotherapy |
| LDH Lactate Dehydrogenase |
| LAC Lactate |
| UA Uric acid |
| ALB Albumin |
| TG Triglycerides |
| TC Total cholesterol |
| BMI Body Mass Index |
| R Responders |
| NR Non-responder |
| PFS Progression-free survival |
| OS Overall survival |
| C-index Concordance index |
| DCA Decision curve analysis |
| AUC Area Under the Curve |
| RECIST Response evaluation criteria in solid tumors |
References
- Bray F, Laversanne M, Sung H et al. Global cancer statistics 2022: GLOBOCAN estimates of incidence and mortality worldwide for 36 cancers in 185 countries. CA Cancer J Clin 2024; 74: 229-263. [CrossRef]
- Herbst RS, Morgensztern D, Boshoff C. The biology and management of non-small cell lung cancer. Nature 2018; 553: 446-454. [CrossRef]
- Zhou C, Wang Z, Sun Y et al. Sugemalimab versus placebo, in combination with platinum-based chemotherapy, as first-line treatment of metastatic non-small-cell lung cancer (GEMSTONE-302): interim and final analyses of a double-blind, randomised, phase 3 clinical trial. Lancet Oncol 2022; 23: 220-233. [CrossRef]
- Garassino MC, Gadgeel S, Speranza G et al. Pembrolizumab Plus Pemetrexed and Platinum in Nonsquamous Non-Small-Cell Lung Cancer: 5-Year Outcomes From the Phase 3 KEYNOTE-189 Study. J Clin Oncol 2023; 41: 1992-1998. [CrossRef]
- Zhou C, Chen G, Huang Y et al. Camrelizumab plus carboplatin and pemetrexed versus chemotherapy alone in chemotherapy-naive patients with advanced non-squamous non-small-cell lung cancer (CameL): a randomised, open-label, multicentre, phase 3 trial. Lancet Respir Med 2021; 9: 305-314. [CrossRef]
- Ren S, Chen J, Xu X et al. Camrelizumab Plus Carboplatin and Paclitaxel as First-Line Treatment for Advanced Squamous NSCLC (CameL-Sq): A Phase 3 Trial. J Thorac Oncol 2022; 17: 544-557. [CrossRef]
- Holder AM, Dedeilia A, Sierra-Davidson K et al. Defining clinically useful biomarkers of immune checkpoint inhibitors in solid tumours. Nat Rev Cancer 2024; 24: 498-512. [CrossRef]
- De Martino M, Rathmell JC, Galluzzi L, Vanpouille-Box C. Cancer cell metabolism and antitumour immunity. Nat Rev Immunol 2024; 24: 654-669. [CrossRef]
- Chen D, Liu P, Lu X et al. Pan-cancer analysis implicates novel insights of lactate metabolism into immunotherapy response prediction and survival prognostication. J Exp Clin Cancer Res 2024; 43: 125. [CrossRef]
- Chen H, Shi D, Guo C et al. Can uric acid affect the immune microenvironment in bladder cancer? A single-center multi-omics study. Mol Carcinog 2024; 63: 461-478. [CrossRef]
- Zheng L, Hu F, Huang L et al. Association of metabolomics with PD-1 inhibitor plus chemotherapy outcomes in patients with advanced non-small-cell lung cancer. J Immunother Cancer 2024; 12. [CrossRef]
- Eisenhauer EA, Therasse P, Bogaerts J et al. New response evaluation criteria in solid tumours: revised RECIST guideline (version 1.1). Eur J Cancer 2009; 45: 228-247. [CrossRef]
- Gandhi L, Rodríguez-Abreu D, Gadgeel S et al. Pembrolizumab plus Chemotherapy in Metastatic Non-Small-Cell Lung Cancer. N Engl J Med 2018; 378: 2078-2092. [CrossRef]
- Liu L, Bai H, Wang C et al. Efficacy and Safety of First-Line Immunotherapy Combinations for Advanced NSCLC: A Systematic Review and Network Meta-Analysis. J Thorac Oncol 2021; 16: 1099-1117. [CrossRef]
- Trefny MP, Kroemer G, Zitvogel L, Kobold S. Metabolites as agents and targets for cancer immunotherapy. Nature Reviews Drug Discovery 2025. [CrossRef]
- Chang CH, Qiu J, O’Sullivan D et al. Metabolic Competition in the Tumor Microenvironment Is a Driver of Cancer Progression. Cell 2015; 162: 1229-1241. [CrossRef]
- Osataphan S, Awidi M, Jan YJ et al. Association between higher glucose levels and reduced survival in patients with non-small cell lung cancer treated with immune checkpoint inhibitors. Lung Cancer 2024; 198: 108023. [CrossRef]
- Kumagai S, Koyama S, Itahashi K et al. Lactic acid promotes PD-1 expression in regulatory T cells in highly glycolytic tumor microenvironments. Cancer Cell 2022; 40: 201-218.e209. [CrossRef]
- Wang JX, Choi SYC, Niu X et al. Lactic Acid and an Acidic Tumor Microenvironment suppress Anticancer Immunity. Int J Mol Sci 2020; 21. [CrossRef]
- Chen Y, Wu J, Zhai L et al. Metabolic regulation of homologous recombination repair by MRE11 lactylation. Cell 2024; 187: 294-311.e221. [CrossRef]
- Claps G, Faouzi S, Quidville V et al. The multiple roles of LDH in cancer. Nat Rev Clin Oncol 2022; 19: 749-762.
- Hanahan, D. Hallmarks of Cancer: New Dimensions. Cancer Discov 2022; 12: 31-46.
- Sung M, Jang WS, Kim HR et al. Prognostic value of baseline and early treatment response of neutrophil-lymphocyte ratio, C-reactive protein, and lactate dehydrogenase in non-small cell lung cancer patients undergoing immunotherapy. Transl Lung Cancer Res 2023; 12: 1506-1516. [CrossRef]
- Tjokrowidjaja A, Lord SJ, John T et al. Pre- and on-treatment lactate dehydrogenase as a prognostic and predictive biomarker in advanced non–small cell lung cancer. Cancer 2022; 128: 1574-1583. [CrossRef]
- Allegrini S, Garcia-Gil M, Pesi R et al. The Good, the Bad and the New about Uric Acid in Cancer. Cancers (Basel) 2022; 14. [CrossRef]
- Mi S, Gong L, Sui Z. Friend or Foe? An Unrecognized Role of Uric Acid in Cancer Development and the Potential Anticancer Effects of Uric Acid-lowering Drugs. J Cancer 2020; 11: 5236-5244. [CrossRef]
- Rao H, Wang Q, Zeng X et al. Analysis of the prognostic value of uric acid on the efficacy of immunotherapy in patients with primary liver cancer. Clin Transl Oncol 2024; 26: 774-785. [CrossRef]
- Shao Z, Xu Y, Zhang X et al. Changes in serum uric acid, serum uric acid/serum creatinine ratio, and gamma-glutamyltransferase might predict the efficacy of neoadjuvant chemoradiotherapy in patients with locally advanced rectal cancer. Strahlenther Onkol 2024; 200: 523-534. [CrossRef]
- Wang H, Shan D, Dong Y et al. Correlation analysis of serum cystatin C, uric acid and lactate dehydrogenase levels before chemotherapy on the prognosis of small-cell lung cancer. Oncol Lett 2021; 21: 73.
- Jin HR, Wang J, Wang ZJ et al. Lipid metabolic reprogramming in tumor microenvironment: from mechanisms to therapeutics. J Hematol Oncol 2023; 16: 103. [CrossRef]
- Jiang H, Li XS, Yang Y, Qi RX. Plasma lipidomics profiling in predicting the chemo-immunotherapy response in advanced non-small cell lung cancer. Front Oncol 2024; 14: 1348164. [CrossRef]
- Li J, Ma C, Yuan X et al. Preoperative Serum Triglyceride to High-Density Lipoprotein Cholesterol Ratio Can Predict Prognosis in Non-Small Cell Lung Cancer: A Multicenter Retrospective Cohort Study. Curr Oncol 2022; 29: 6125-6136. [CrossRef]
- Yildirim S, Dogan A, Akdag G et al. A Novel Prognostic Indicator for Immunotherapy Response: Lymphocyte-to-Albumin (LA) Ratio Predicts Survival in Metastatic NSCLC Patients. Cancers (Basel) 2024; 16. [CrossRef]
- MacDonald M, Poei D, Leyba A et al. Real world prognostic utility of platelet lymphocyte ratio and nutritional status in first-line immunotherapy response in stage IV non-small cell lung cancer. Cancer Treat Res Commun 2023; 36: 100752. [CrossRef]
Figure 1.
Metabolic biomarkers were associated with response to CIT in Advanced NSCLC patients. (A) The scattered dot plots display the values of LDH in responders and non-responders;(B) The scattered dot plots display the values of LAC in in responders and non-responders;(C)The scattered dot plots display the values of UA in responders and non-responders; (D)The scattered dot plots display the values of TG in responders and non-responders; (E)The scattered dot plots display the values of ALB in responders and non-responders;(F)The ROC curves of LDH in NSCLC;(G)The ROC curves of LAC levels in NSCLC;(H)The ROC curves of UA in NSCLC;( I)The ROC curves of TG in NSCLC; (J)The ROC curves of ALB in NSCLC.
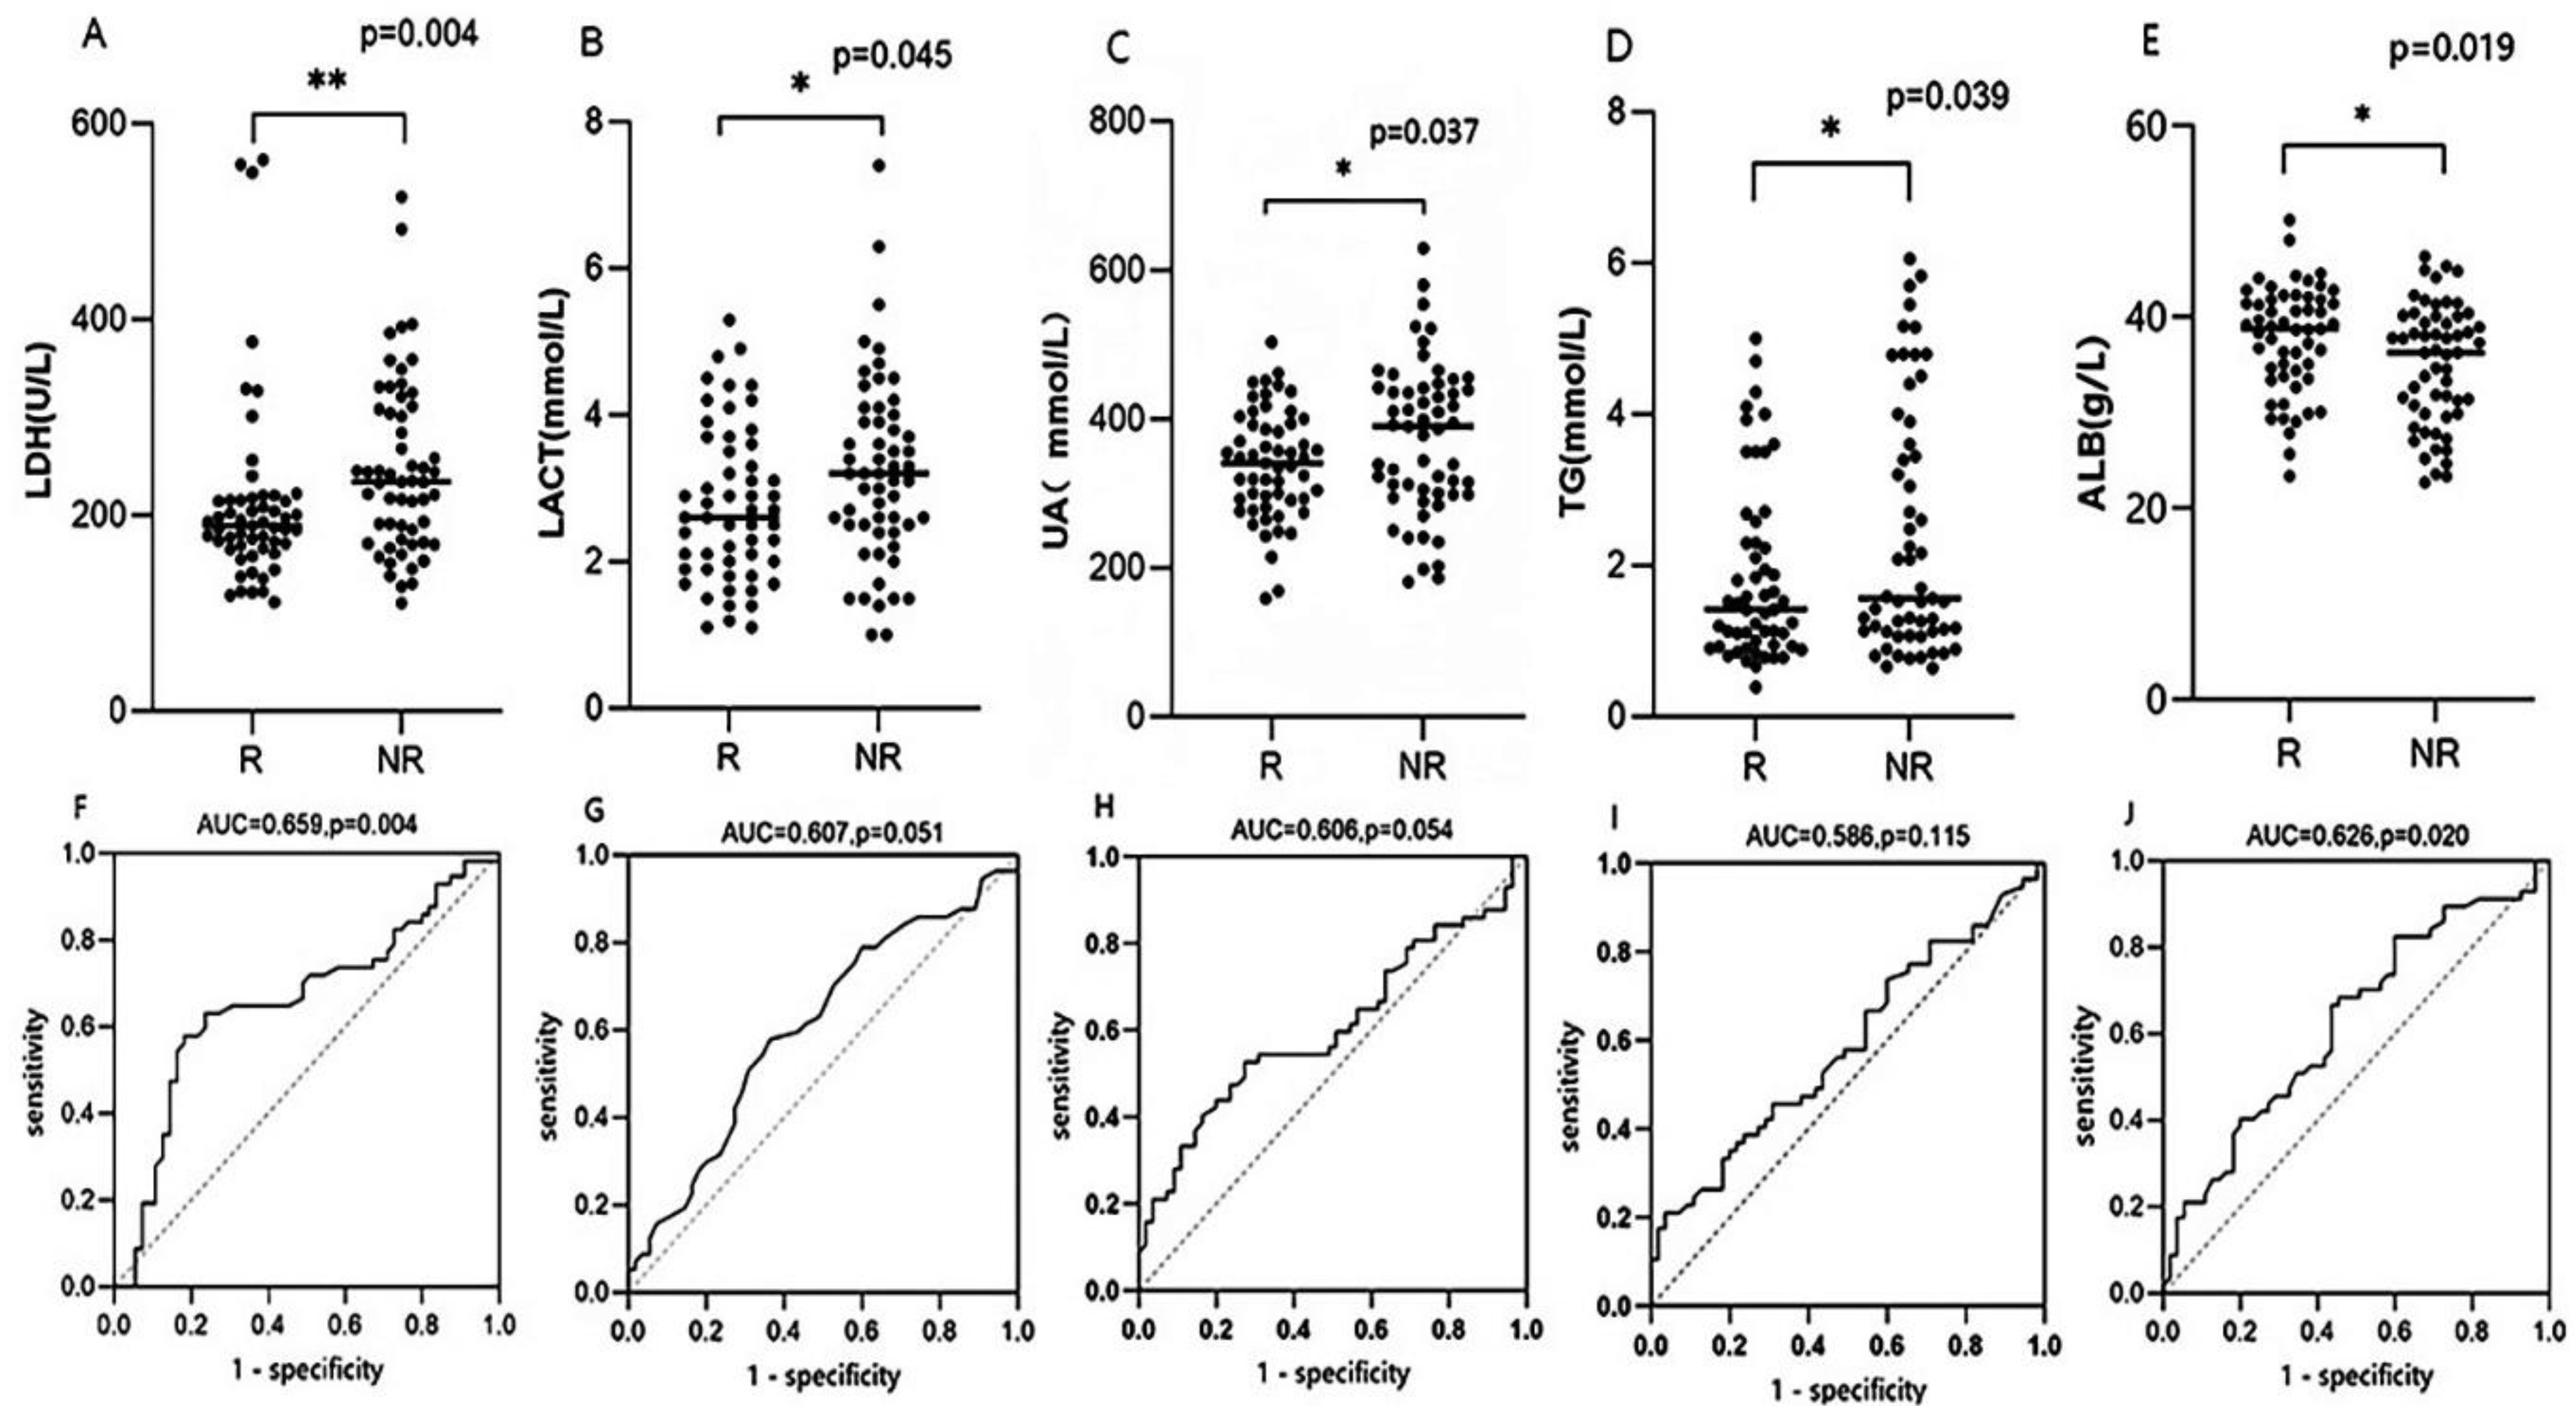
Figure 2.
Kaplan-Meier curves for PFS stratified based on Serum metabolic biomarkers. PFS stratified by LAC(A),LDH(B),TG(C) and UA(D).
Figure 2.
Kaplan-Meier curves for PFS stratified based on Serum metabolic biomarkers. PFS stratified by LAC(A),LDH(B),TG(C) and UA(D).
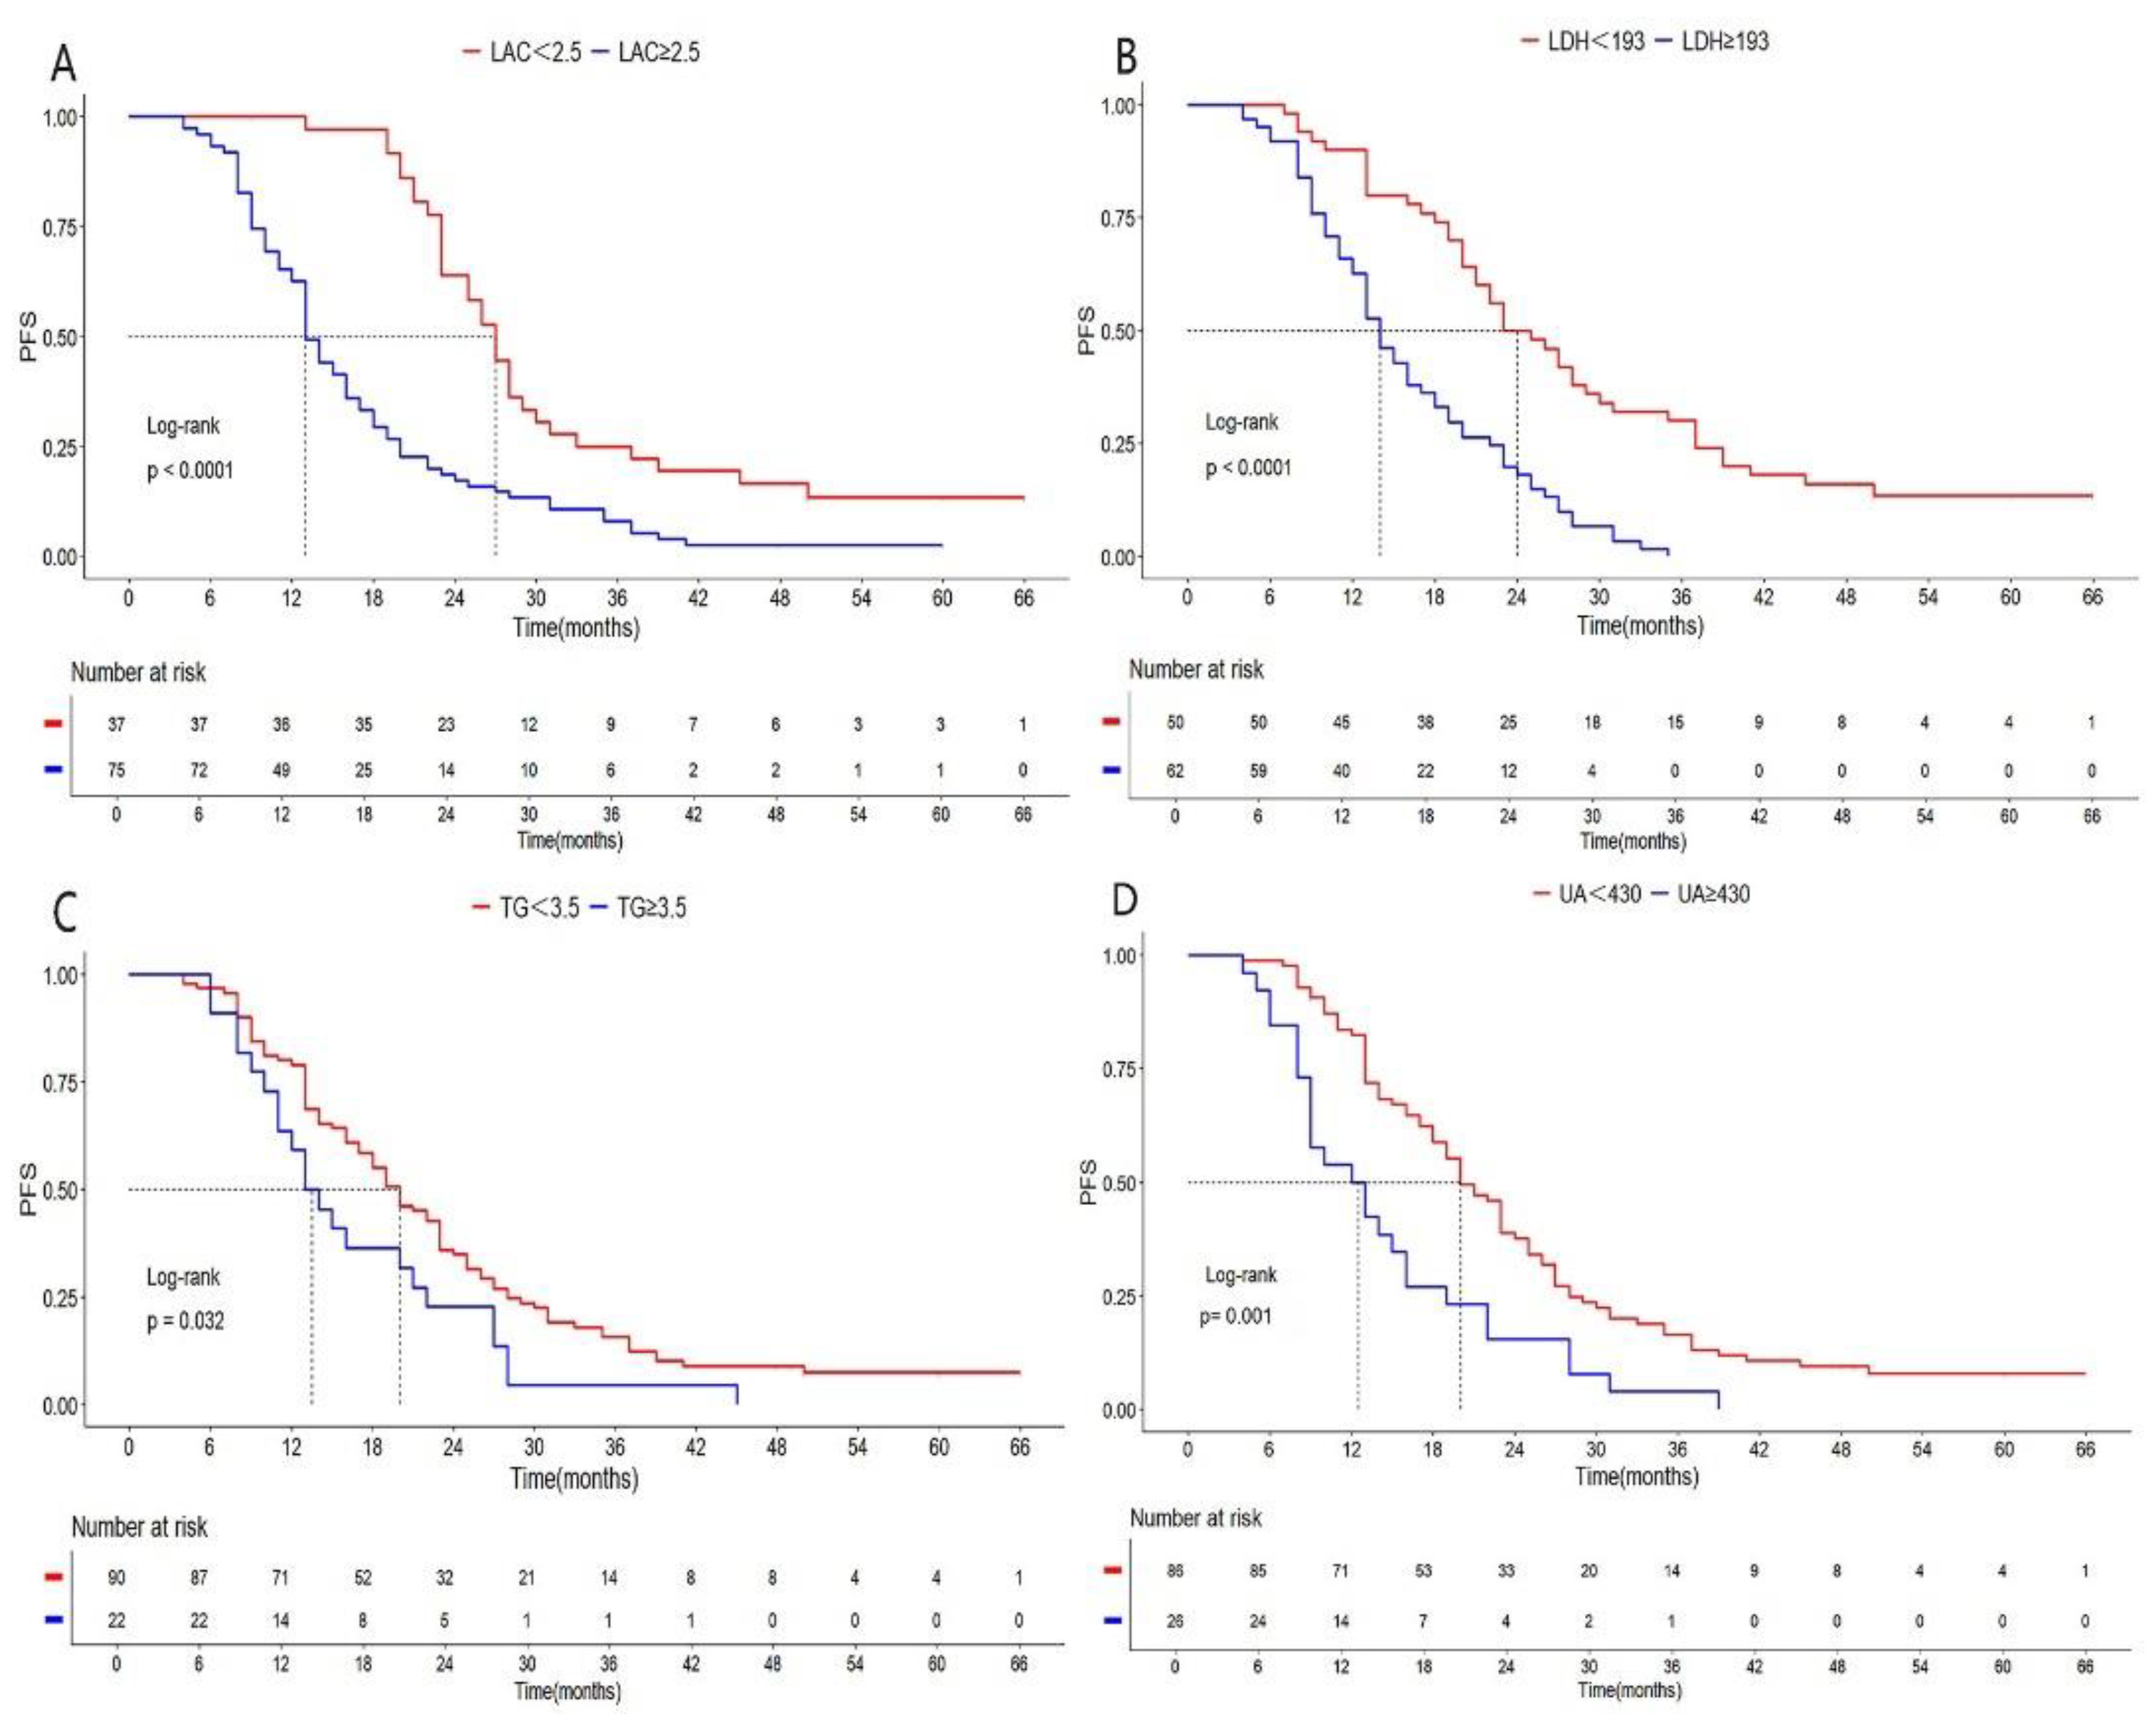
Figure 3.
Kaplan-Meier curves for OS stratified based on metabolic biomarkers. OS stratified by BMI(A),LAC(B),LDH(C), TG(D),UA(E) and ALB(F).
Figure 3.
Kaplan-Meier curves for OS stratified based on metabolic biomarkers. OS stratified by BMI(A),LAC(B),LDH(C), TG(D),UA(E) and ALB(F).
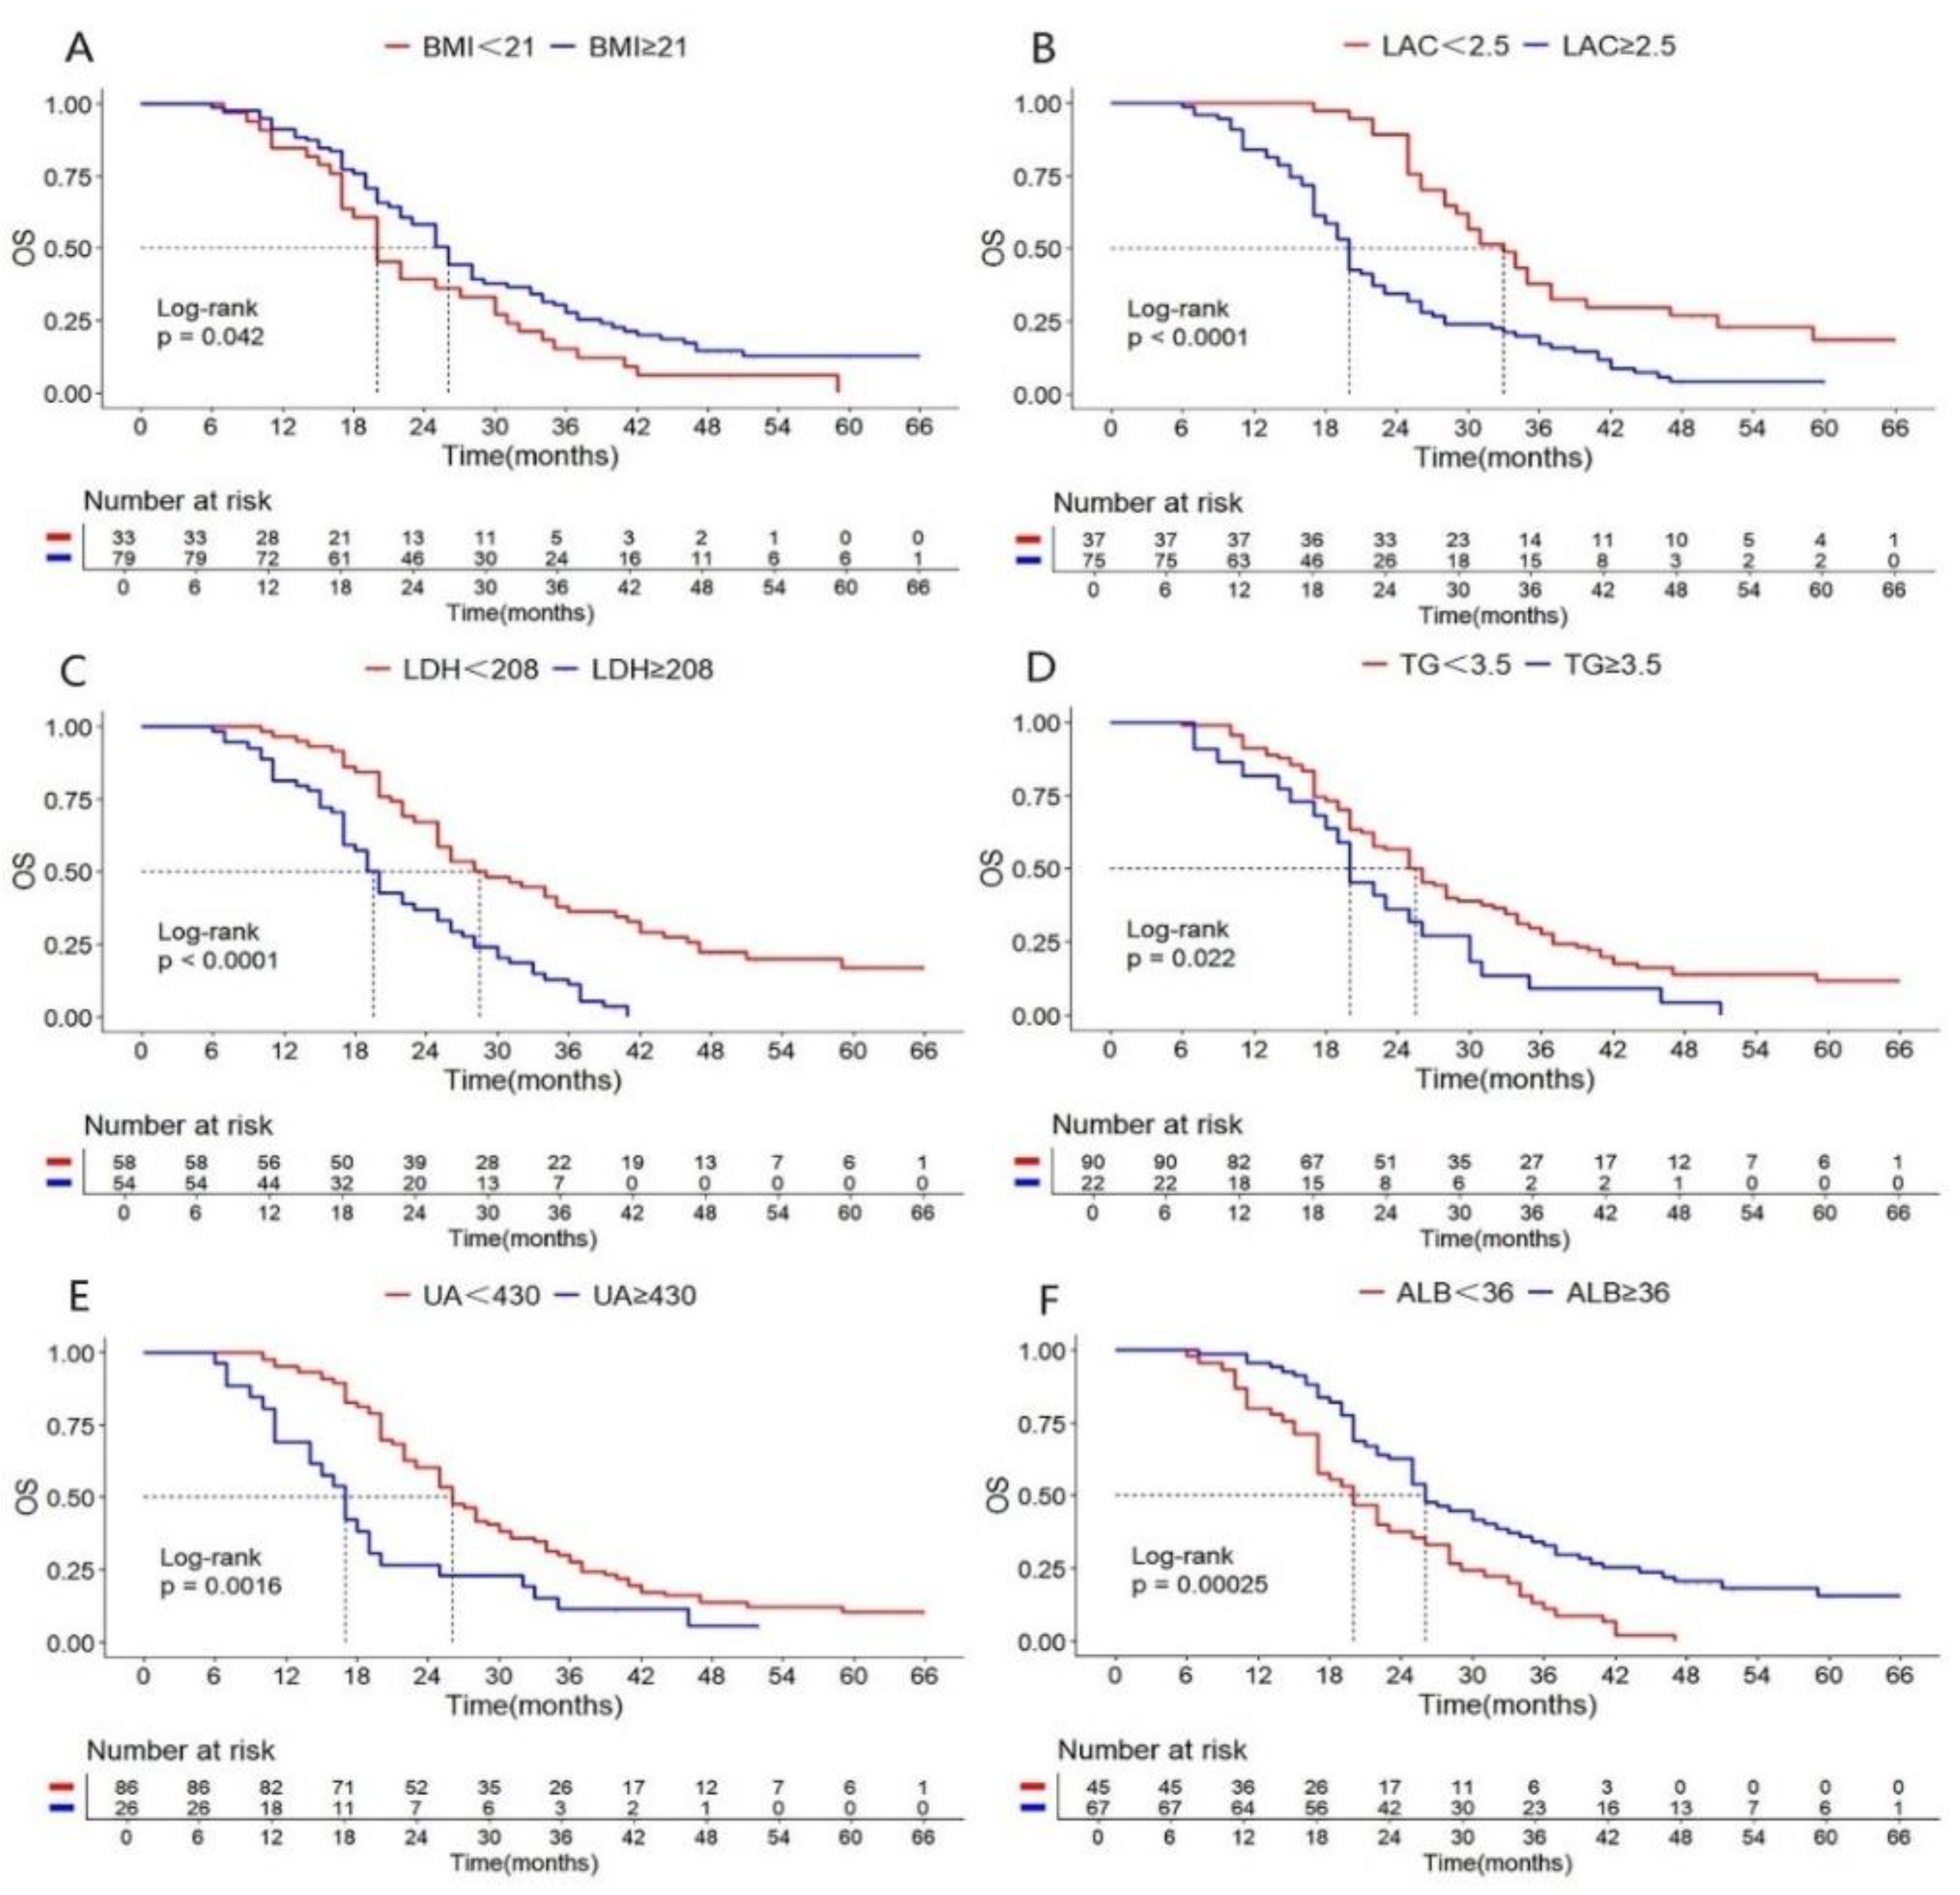
Figure 4.
Nomogram and calibration plots. (A) Nomogram for predicting the PFS; (B) Calibration curve for PFS; (C) Nomogram for predicting the OS; (D) Calibration curve for OS.
Figure 4.
Nomogram and calibration plots. (A) Nomogram for predicting the PFS; (B) Calibration curve for PFS; (C) Nomogram for predicting the OS; (D) Calibration curve for OS.
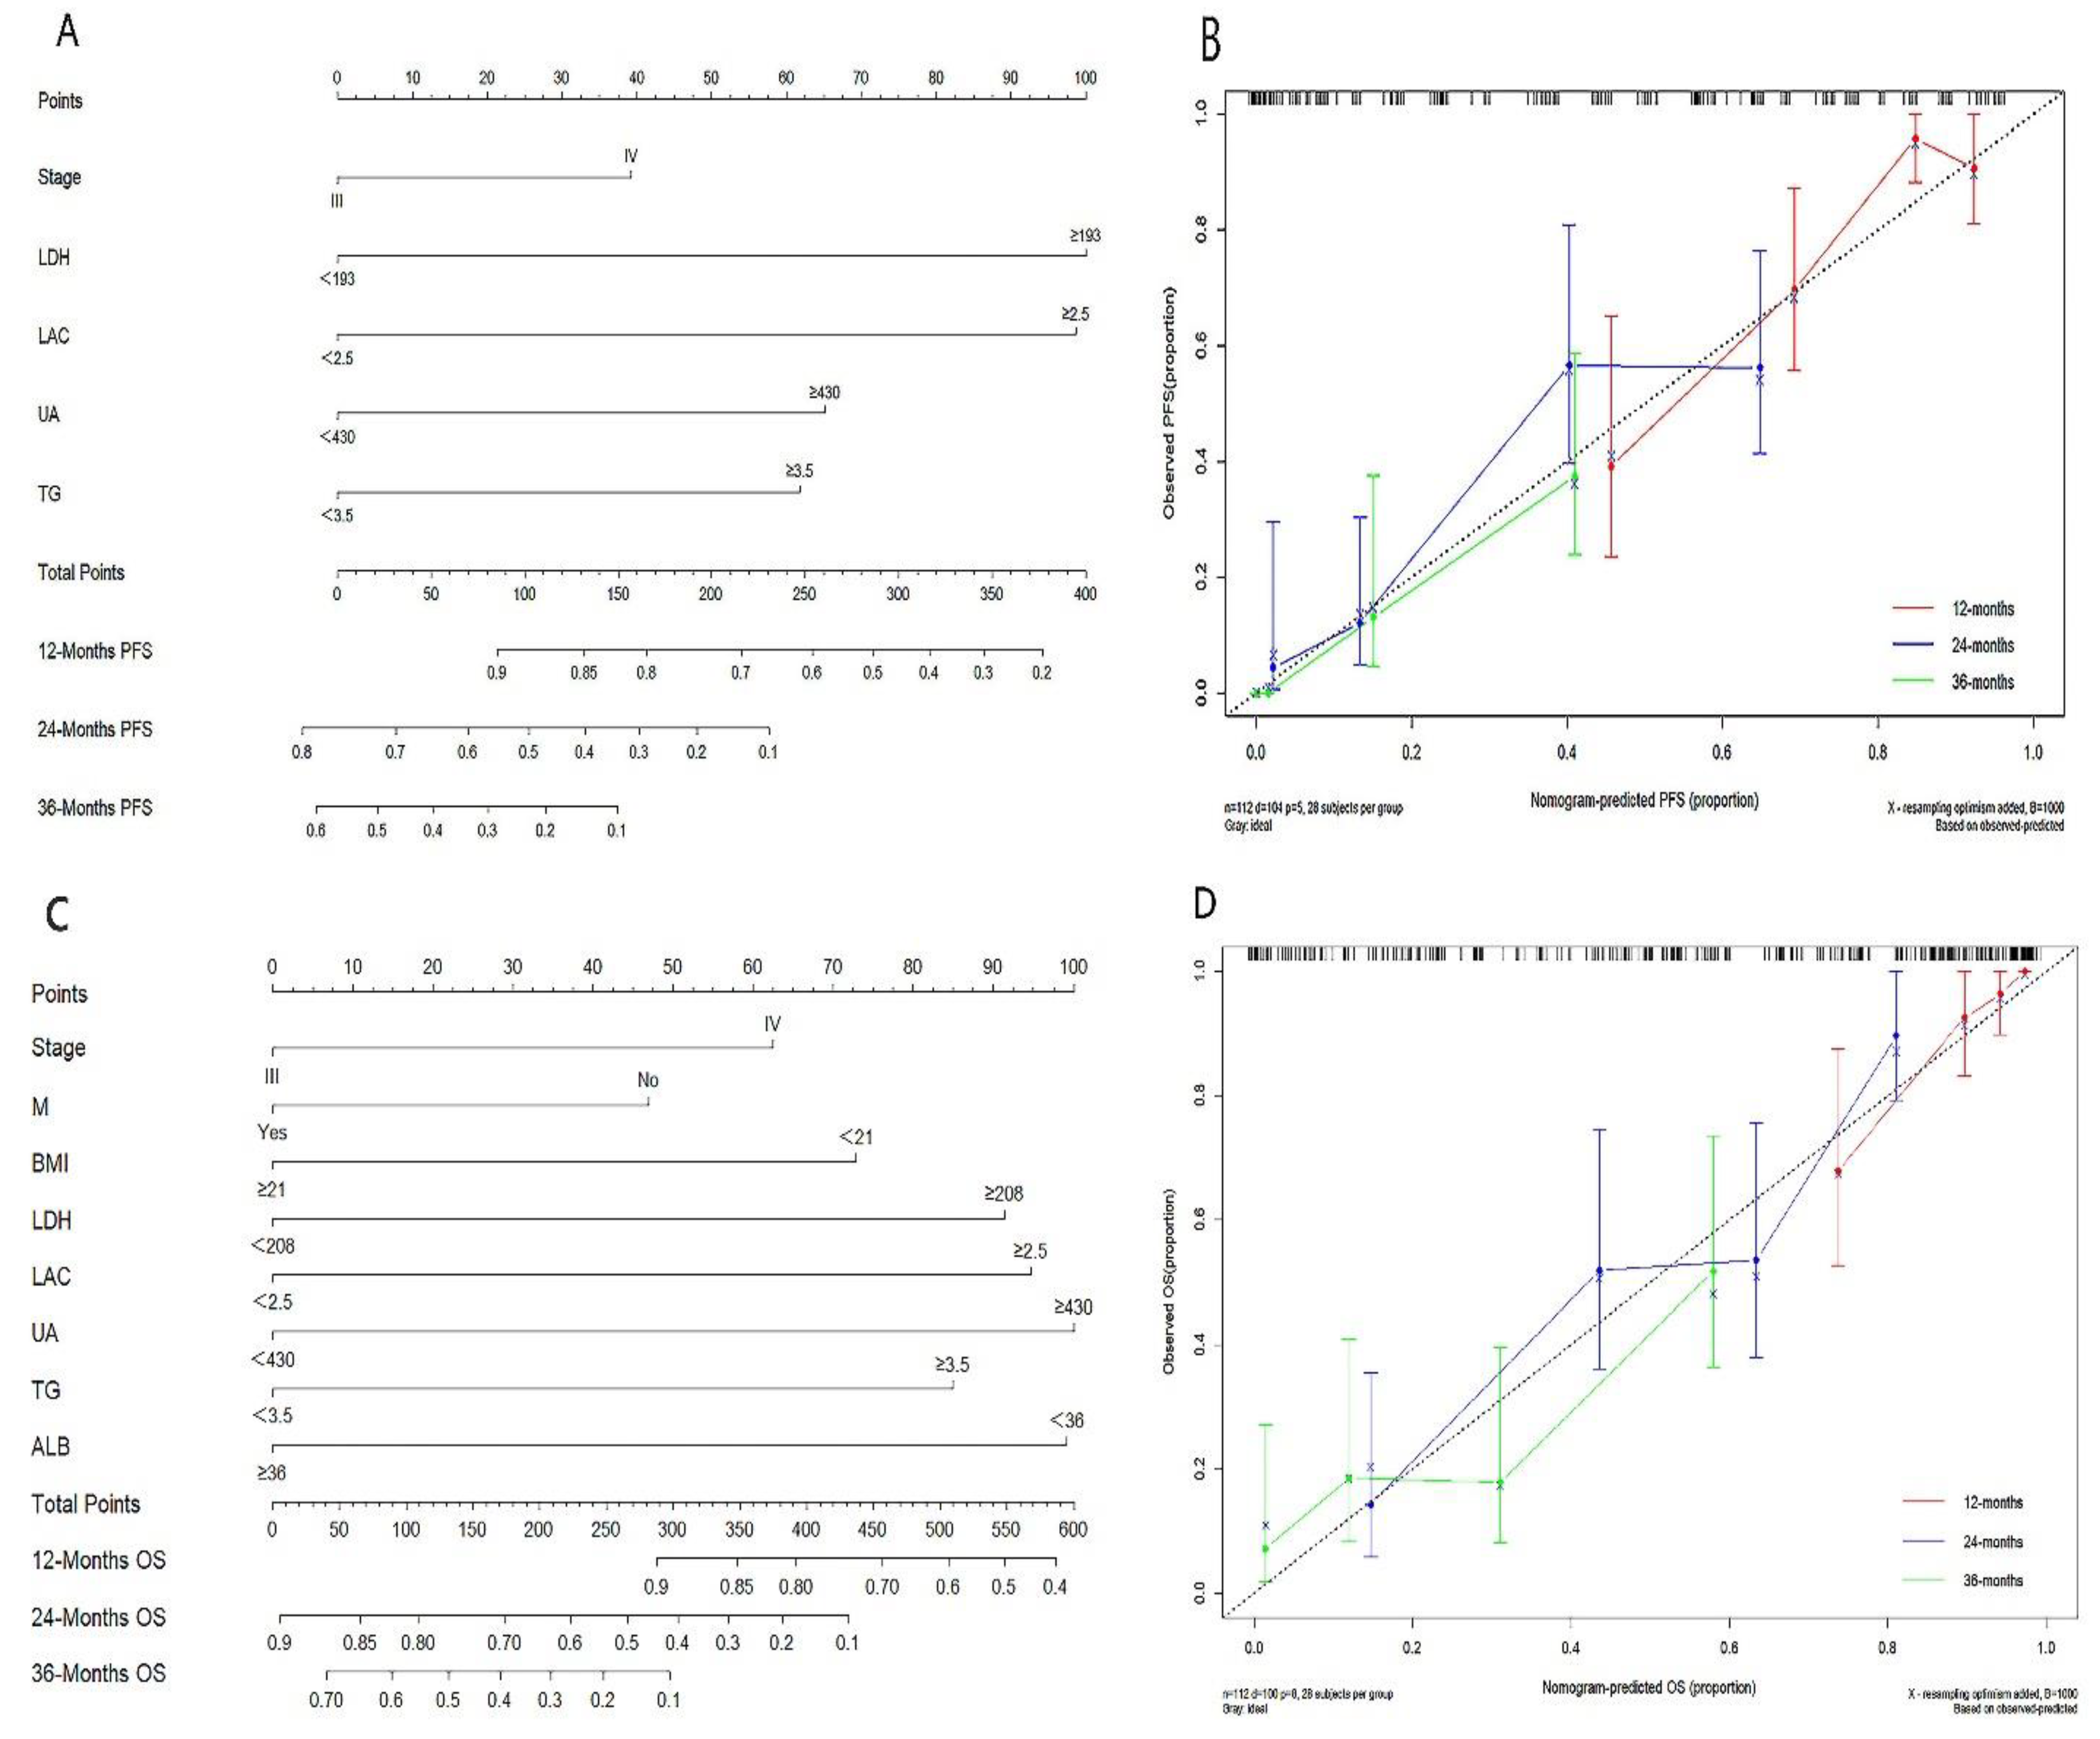
Figure 5.
Figure 5. ROC and decision curve analysis for nomogram models. A: ROC curves for 12-month, 24-month, and 36-month PFS; B: Decision curve analysis for PFS; C: ROC curves for 12-month, 24-month, and 36-month OS; D: Decision curve analysis for OS.
Figure 5.
Figure 5. ROC and decision curve analysis for nomogram models. A: ROC curves for 12-month, 24-month, and 36-month PFS; B: Decision curve analysis for PFS; C: ROC curves for 12-month, 24-month, and 36-month OS; D: Decision curve analysis for OS.
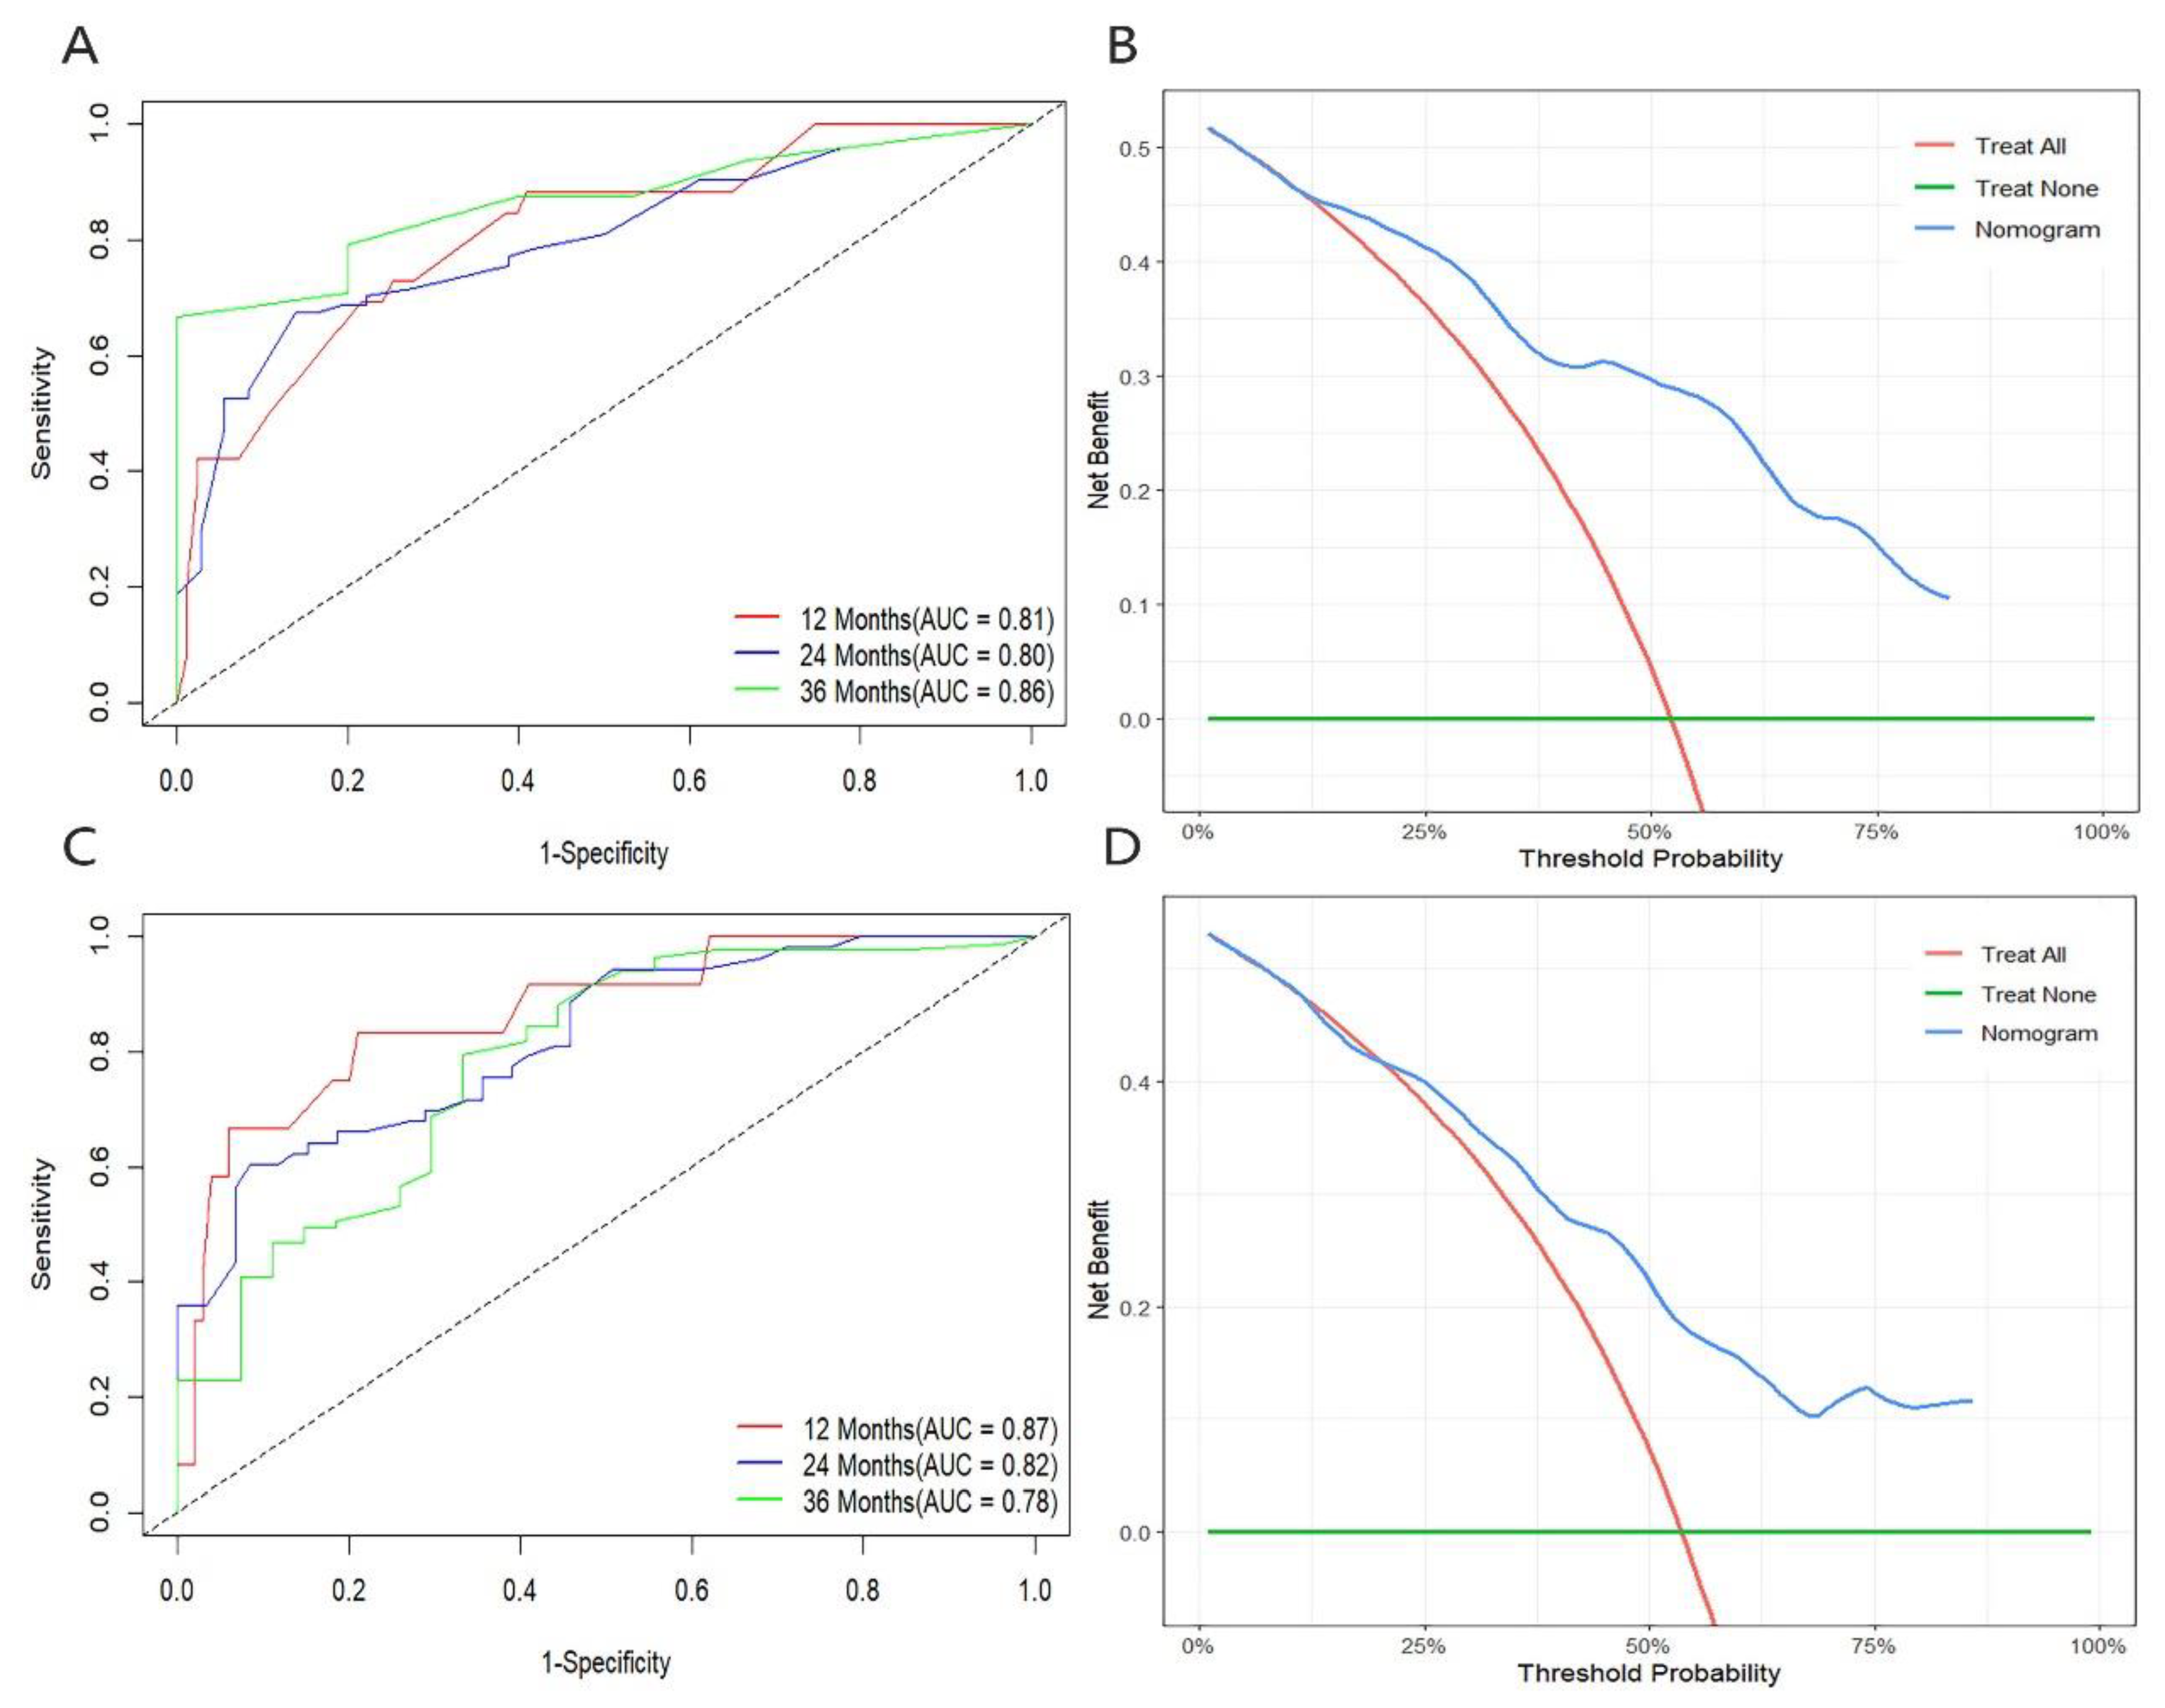

Table 1.
Comparison of clinical characteristics and blood biomarkers of Responders and Non- Responders.
Table 1.
Comparison of clinical characteristics and blood biomarkers of Responders and Non- Responders.
| Characteristics | Total n(%) /?x±s |
R n(%) /?x±s |
NR n(%) /?x±s |
P value |
|---|---|---|---|---|
| Age(years) | 0.588 | |||
| <60 | 46(41.07) | 24(43.60) | 22(38.60) | |
| ≥60 | 66(58.93) | 31(56.40) | 35(61.40) | |
| Sex | 0.643 | |||
| Male | 96(85.71) | 48(87.30) | 48(84.20) | |
| Female | 16(14.29) | 7(12.70) | 9(15.80) | |
| ECOG PS | 0.159 | |||
| 1 | 55(49.11) | 31(56.40) | 24(42.10) | |
| 2 | 57(50.89) | 24(43.60) | 33(57.90) | |
| Diabetes | 0.038 | |||
| No | 84(75.00) | 46(83.60) | 38(66.70) | |
| Yes | 28(25.00) | 9(26.40) | 19(33.30) | |
| Hypertension | 0.917 | |||
| No | 83(74.11) | 41(74.50) | 42(73.70) | |
| Yes | 29(25.89) | 14(25.50) | 15(26.30) | |
| Smoking status | 0.656 | |||
| Non-smoker | 41(36.61) | 19(34.50) | 22(38.60) | |
| Smoker | 71(63.39) | 36(65.50) | 35(61.40) | |
| Histology | 0.183 | |||
| Adenocarcinoma | 54(48.21) | 23(41.80) | 31(54.40) | |
| Squamous carcinoma | 58(51.79) | 32(58.20) | 26(45.60) | |
| T stage | 0.925 | |||
| T1-2 | 31(27.68) | 15(27.30) | 16(28.10) | |
| T3-4 | 81(72.32) | 40(72.70) | 41(71.90) | |
| Lymphatic metastasis | 0.144 | |||
| No | 18(16.07) | 6(10.90) | 12(21.10) | |
| Yes | 94(83.93) | 49(89.10) | 45(78.90) | |
| Metastatic sites | 0.281 | |||
| No | 32(28.57) | 17(30.90) | 15(26.30) | |
| Viscera | 51(45.54) | 21(38.20) | 30(52.60) | |
| Bone | 29(25.89) | 17(30.90) | 12(21.10) | |
| TNM stage | 0.862 | |||
| ШC | 32(28.57) | 17(30.90) | 15(26.30) | |
| ⅣA | 27(24.11) | 13(23.60) | 14(24.60) | |
| ⅣB | 53(47.32) | 25(45.50) | 28(49.10) | |
| PD-L1 (%) | 0.000 | |||
| <1 | 31(27.68) | 9(16.40) | 22(40.00) | |
| 1-49 | 45 (40.08) | 18(32.70) | 27(49.10) | |
| ≥50 | 34(32.14) | 28(50.90) | 6(10.90) | |
| PD-1 inhibitor | 0.897 | |||
| Pembrolizumab | 29(25.89) | 15(27.30) | 14(24.60) | |
| Sintilimab | 41(36.61) | 19(34.50) | 22(38.60) | |
| Tisleizumab | 42(37.50) | 21(38.20) | 21(36.80) | |
| BMI(Kg/m2) | 23.22±3.51 | 23.66±3.89 | 22.79±3.06 | 0.189 |
| NLR | 6.67±6.95 | 6.25±6.88 | 7.066±7.06 | 0.682 |
| MONO(109/L) | 0.61±0.27 | 0.57±0.26 | 0.65±0.28 | 0.140 |
| Hb(g/L) | 121.12±18.95 | 123.36±22.27 | 118.95±14.96 | 0.219 |
| LDH(U/L) | 230.66±94.74 | 212.69±97.88 | 248.01±89.05 | 0.048 |
| LAC(mmol/L) | 2.99±1.19 | 2.77±1.06 | 3.22±1.26 | 0.045 |
| UA(umol/L) | 356.93±90.15 | 338.85±73.52 | 374.37±101.33 | 0.037 |
| TG(mmol/L) | 2.14±1.46 | 1.85±1.18 | 2.41±1.66 | 0.039 |
| TC(mmol/L) | 4.65±1.35 | 4.55±1.32 | 4.75±1.38 | 0.435 |
| ALB(g/L) | 37.75±6.12 | 37.67±5.65 | 34.99±6.31 | 0.019 |
Note: In order to highlight the clinical significance characteristics (P < 0.05). Abbreviations: ECOG-PS: Eastern Cooperative Oncology Group Performance Status; TNM stage: Tumor node metastasis stage; BMI: Body Mass Index; NLR:Neutrophil-to-Lymphocyte Ratio; MONO: Monocyte; Hb: Hemoglobin; LDH: Lactate Dehydrogenase; LAC: Lactate; UA: Uric Acid; TG: Triglyceride; TC: Cholesterol; ALB: Albumin.
Table 2.
Univariate and Multivariate Cox Regression Analysis for PFS.
|
Variables |
Univariate | Multivariate | ||||||
| HR | 95%CI | P | HR | 95%CI | P | |||
| Age(years) <60 vs ≥60 |
0.872 | 0.592-1.284 | 0.487 | |||||
| Sex Male vs Female |
1.097 | 0.634-1.897 | 0.742 | |||||
| ECOG PS 1 vs 2 |
0.972 | 0.661-1.428 | 0.883 | |||||
| Smoking status Non-smoker vs smoker |
1.113 | 0.748-1.657 | 0.596 | |||||
| Diabetes No vs Yes |
0.793 | 0.507-1.239 | 0.309 | 0.785 | 0.462-1.333 | 0.370 | ||
| Hypertension No vs Yes |
0.781 | 0.503-1.213 | 0.271 | |||||
| Histology Adeno vs Squamous |
0.978 | 0.665-1.437 | 0.909 | |||||
| PD-L1(%) <50 vs ≥50 |
1.338 | 0.902-1.985 | 0.148 | 1.355 | 0.859-2.139 | 0.192 | ||
| TNM stage Ⅲ vs Ⅳ |
0.771 | 0.524-1.135 | 0.187 | 0.574 | 0.336-0.981 | 0.042 | ||
| Metastasis No vs Yes |
0.922 | 0.545-1. 561 | 0.907 | 1.541 | 0.862-2.753 | 0.145 | ||
| BMI(Kg/m2) <21 vs ≥21 |
1.532 | 1.004-2.338 | 0.048 | 1.385 | 0.896-2.140 | 0.143 | ||
| NL <3.2 vs ≥3.2 |
0.678 | 0.449-1.024 | 0.065 | 0.800 | 0.517-1.237 | 0.316 | ||
| MONO(109/L) <0.7 vs ≥0.7 |
0.609 | 0.398-0.931 | 0.022 | 0.673 | 0.424-1.070 | 0.094 | ||
| Hb(g/L) <112 vs ≥112 |
1.582 | 1.043-2.400 | 0.031 | 1.477 | 0.912-2.391 | 0.113 | ||
| LDH(U/L) <193 vs ≥193 |
0.340 | 0.221-0.524 | 0.000 | 0.418 | 0.259-0.674 | 0.000 | ||
| LAC(mmol/L) <2.5 vs ≥2.5 |
0.372 | 0.242-0.571 | 0.000 | 0.434 | 0.259-0.725 | 0.001 | ||
| UA(umol/L) <430 vs ≥430 |
0.465 | 0.296-0.731 | 0.001 | 0.471 | 0.286-0.774 | 0.003 | ||
| TG(mmol/L) <3.5 vs ≥3.5 |
0.606 | 0.377-0.976 | 0.032 | 0.552 | 0.331-0.921 | 0.023 | ||
| ALB(g/L) <36 vs ≥36 |
1.670 | 1.122-2.486 | 0.012 | 1.124 | 0.709-1.781 | 0.145 | ||
Note: In order to highlight the clinical significance characteristics (P < 0.05). Abbreviations: Adeno: Adenocarcinoma; Squamous: Squamous carcinoma.
Table 3.
Univariate and Multivariate Cox Regression Analysis for OS.
| Variables | Univariate | Multivariate | |||||
| HR | 95%CI | P | HR | 95%CI | P | ||
| Age(years) <60 vs ≥60 |
0;682 | 0.458-1.016 | 0.060 | ||||
| Sex Male vs Female |
1.094 | 0.631-1.896 | 0.749 | ||||
| ECOG PS 1 vs 2 |
0.109 | 0.490-1.075 | 0.109 | ||||
| Smoking status No vs Yes |
0.880 | 0.584-1.326 | 0.542 | ||||
| Diabetes No vs Yes |
1.034 | 0.647-1.651 | 0.890 | ||||
| Hypertension No vs Yes |
0.695 | 0.445-1.087 | 0.111 | ||||
| Histology Adeno vs Squamous |
0.939 | 0.686-1.504 | 0.939 | ||||
| PD-L1(%) <50 vs ≥50 |
1.561 | 1.038-2.345 | 0.032 | 1.442 | 0.911-2.283 | 0.118 | |
| Clinical stage Ⅲ vs Ⅳ |
0.806 | 0.544-1.184 | 0.283 | 0.449 | 0.240-0.840 | 0.012 | |
| Metastasis No vs Yes |
1.042 | 0.603-1.798 | 0.301 | 2.564 | 1.069-6.154 | 0.035 | |
| BMI(Kg/m2) <21 vs ≥21 |
1.530 | 1.002-2.335 | 0.042 | 1.656 | 1.048-2.617 | 0.031 | |
| NL <2.9 vs ≥2.9 |
0.577 | 0.360-0.927 | 0.023 | 0.699 | 0.424-1.151 | 0.159 | |
| MONO(109/L) <0.7 vs ≥0.7 |
0.570 | 0.370-0.880 | 0.011 | 0.643 | 0.398-1.037 | 0.070 | |
| Hb(g/L) <114 vs ≥114 |
1.777 | 1.183-2.668 | 0.006 | 1.450 | 0.922-2.281 | 0.107 | |
| LDH(U/L) <208 vs ≥208 |
0.380 | 0.249-0.582 | 0.000 | 0.579 | 0.366-0.917 | 0.020 | |
| LAC(mmol/L) <2.5 vs ≥2.5 |
0.415 | 0.267-0.643 | 0.000 | 0.504 | 0.310-0.820 | 0.006 | |
| UA(umol/L) <430 vs ≥430 |
0.491 | 0.309-0.781 | 0.002 | 0.442 | 0.264-0.737 | 0.002 | |
| TG(mmol/L) <3.5 vs ≥3.5 |
0.584 | 0.362-0.941 | 0.022 | 0.540 | 0.320-0.912 | 0.021 | |
| ALB(g/L) <36 vs ≥36 |
2.060 | 1.374-3.090 | 0.000 | 0.449 | 0.240-0.840 | 0.039 | |
Note: In order to highlight the clinical significance characteristics (P < 0.05). Abbreviations: Adeno: Adenocarcinoma; Squamous: Squamous carcinoma.
Disclaimer/Publisher’s Note: The statements, opinions and data contained in all publications are solely those of the individual author(s) and contributor(s) and not of MDPI and/or the editor(s). MDPI and/or the editor(s) disclaim responsibility for any injury to people or property resulting from any ideas, methods, instructions or products referred to in the content. |
© 2025 by the authors. Licensee MDPI, Basel, Switzerland. This article is an open access article distributed under the terms and conditions of the Creative Commons Attribution (CC BY) license (http://creativecommons.org/licenses/by/4.0/).
Copyright: This open access article is published under a Creative Commons CC BY 4.0 license, which permit the free download, distribution, and reuse, provided that the author and preprint are cited in any reuse.


