
Submitted:
03 September 2025
Posted:
05 September 2025
You are already at the latest version
Abstract
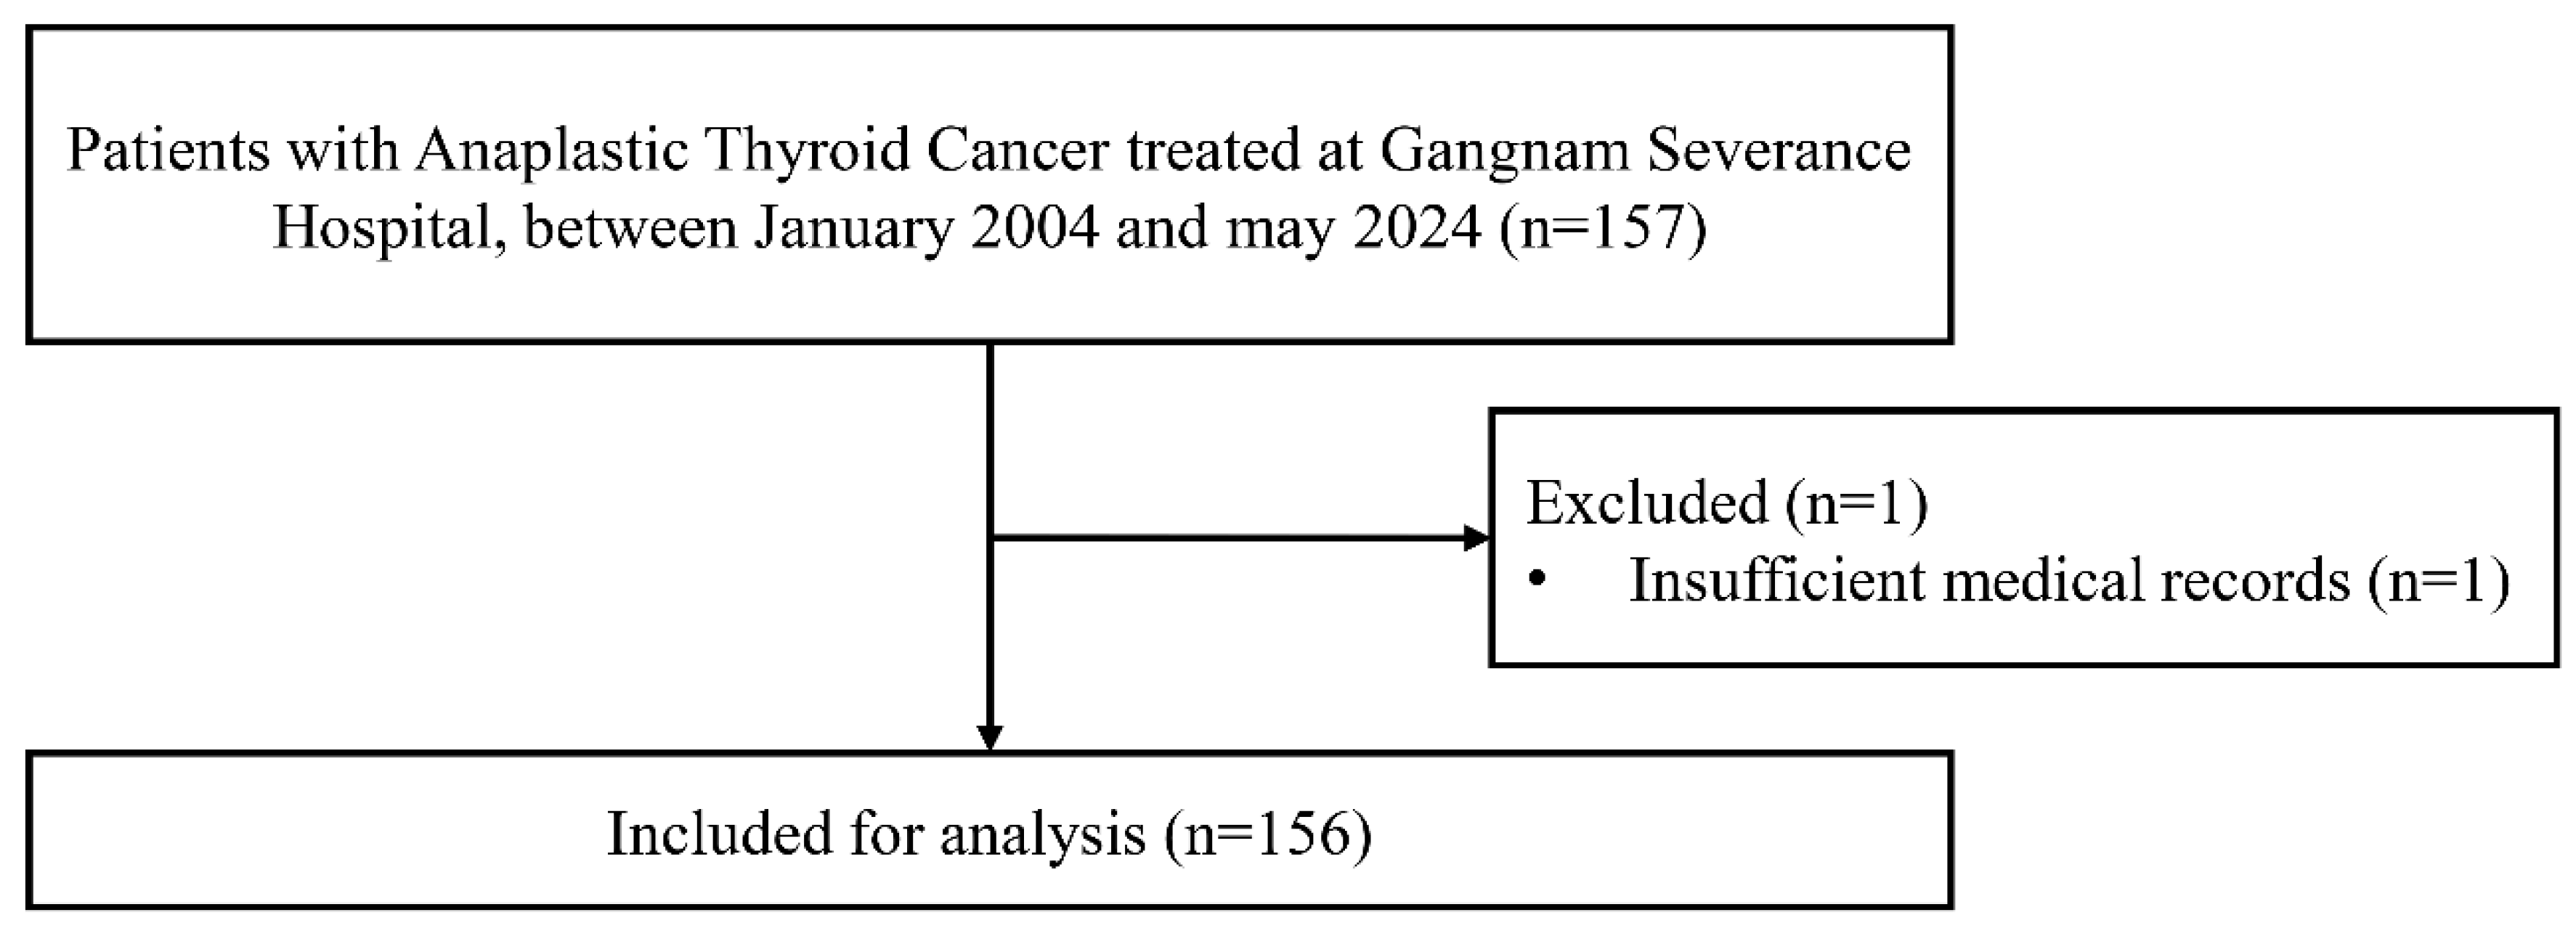
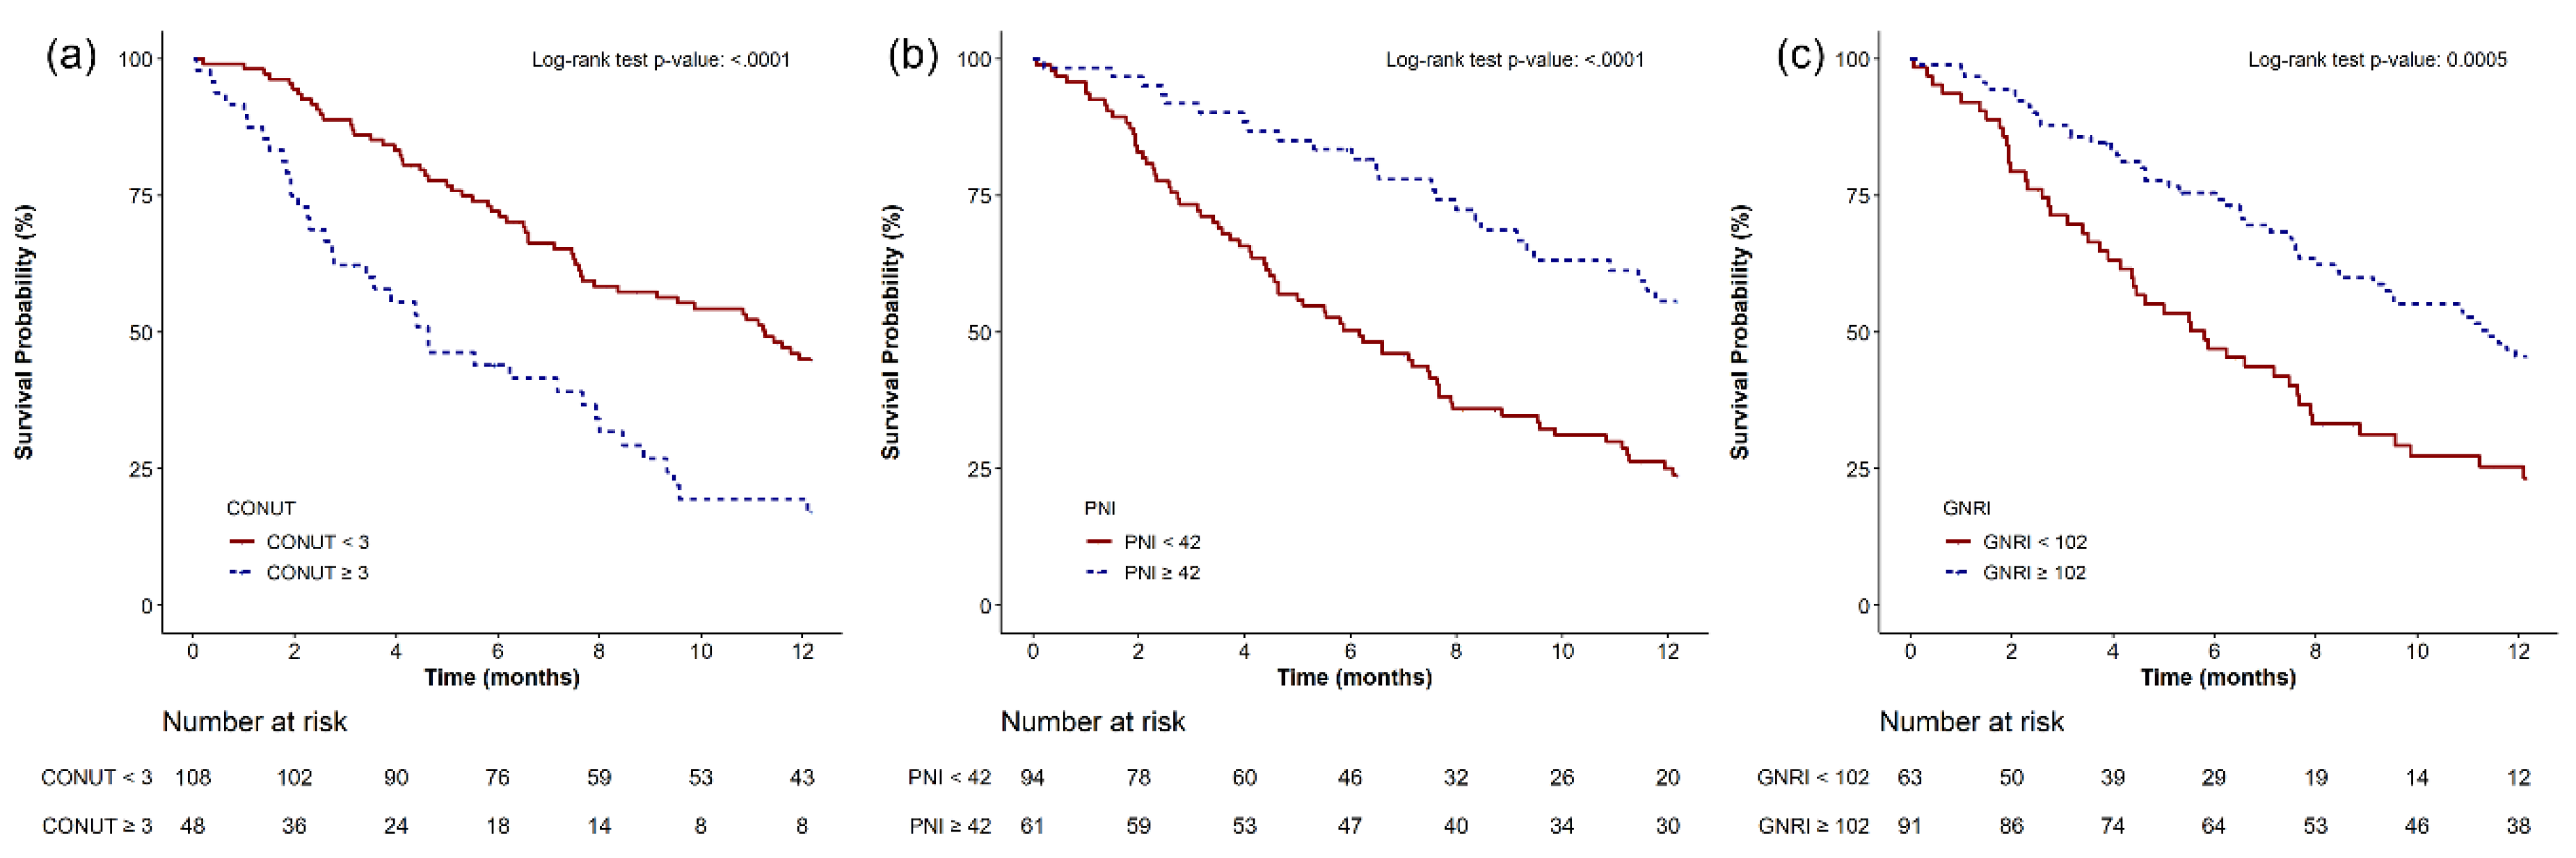
Background/Objectives: Anaplastic thyroid cancer (ATC) is an aggressive thyroid cancer subtype with a poor prognosis. The Controlling Nutritional Status (CONUT) score, reflecting both immune and nutritional status, is a prognostic marker in several malignancies; however, its utility in ATC has not been established. We aimed to evaluate the predictive value of the pretreatment CONUT score in ATC and compare its prognostic utility with that of other nutritional indices, including the Prognostic Nutritional Index (PNI) and Geriatric Nutritional Risk Index (GNRI). Methods: We retrospectively reviewed clinical characteristics, laboratory parameters, and survival outcomes of 156 patients with ATC at our institution between January 2004 and May 2024. Based on survival analysis, patients were categorized into low- and high-risk groups based on each nutritional index (CONUT score, PNI, GNRI) using optimal cut-off values. One-year survival differences were evaluated using Kaplan–Meier curves and log-rank test. Independent predictors of 1-year mortality were identified using multivariable Cox proportional hazards regression. Results: Optimal thresholds were 3, 42, and 102 for the CONUT score, PNI, and GNRI, respectively. Patients with CONUT scores ≥3 exhibited significantly higher 1-year mortality, compared with those with scores <3. Multivariable analysis revealed that CONUT score ≥3, PNI ≤42, and GNRI ≤102 were independently associated with increased 1-year mortality risk. Incorporation of CONUT score ≥3 into the baseline prediction model significantly enhanced its discriminatory performance. Conclusions: These findings underscore the prognostic value of pretreatment immuno-nutritional assessment and support the integration of the CONUT score into early risk stratification strategies for patients with ATC.
Keywords:
1. Introduction
2. Materials and Methods
2.1. Study Design
2.2. Study Population and Treatment Protocol
2.3. Data Collection and Definitions
2.4. Study Endpoints
2.5. Statistical Analysis
3. Results
3.1. Patient Characteristics and Survival Outcomes
3.2. Nutritional and Laboratory Parameters Associated with Survival
3.3. Cut-Off Point Estimation for Nutritional Markers
3.4. Kaplan–Meier Survival Analysis
3.5. Independent Prognostic Indicators Associated with One-Year Mortality
3.6. Predictive Performance of Nutritional Indices
3.7. Added Predictive Value Beyond the Baseline Model
4. Discussion
5. Conclusions
Supplementary Materials
Author Contributions
Funding
Institutional Review Board Statement
Informed Consent Statement
Data Availability Statement
Acknowledgments
Conflicts of Interest
Abbreviations
| ATC | Anaplastic thyroid cancer |
| CONUT | Controlling Nutritional Status |
| PNI | Prognostic Nutritional Index |
| GNRI | Geriatric Nutritional Risk Index |
| BMI | Body mass index |
| TNM | Tumor-Node-Metastasis |
| WBC | White blood cell |
| RDW | Red cell distribution width |
| CRP | C-reactive protein |
| ESR | Erythrocyte sedimentation rate |
| AST | Aspartate aminotransferase |
| ALT | Alanine aminotransferase |
| BUN | Blood urea nitrogen |
| eGFR | Estimated glomerular filtration rate |
| HbA1c | Glycated hemoglobin |
| HDL | High-density lipoprotein |
| LDL | Low-density lipoprotein |
| C-index | Concordance index |
| IDI | Integrated discrimination improvement |
| NRI | Net reclassification improvement |
| CI | Confidence interval |
| ROC | Receiver operating characteristic |
References
- Yu, Y.; Ning, K.; Liu, X.; et al. Effectiveness of prognostic nutritional index in predicting overall survival and evaluating immunotherapy response in anaplastic thyroid carcinoma. Endocrine 2024, 86, 246–254. [Google Scholar] [CrossRef]
- Bible, K.C.; Kebebew, E.; Brierley, J.; et al. 2021 American Thyroid Association Guidelines for Management of Patients with Anaplastic Thyroid Cancer. Thyroid 2021, 31, 337–386. [Google Scholar] [CrossRef]
- Lee, J.S.; Lee, J.S.; Yun, H.J.; et al. Prognosis of Anaplastic Thyroid Cancer with Distant Metastasis. Cancers (Basel) 2022, 14. [Google Scholar] [CrossRef]
- Glaser, S.M.; Mandish, S.F.; Gill, B.S.; Balasubramani, G.K.; Clump, D.A.; Beriwal, S. Anaplastic thyroid cancer: Prognostic factors, patterns of care, and overall survival. Head Neck 2016, 38 Suppl 1, E2083–90. [Google Scholar] [CrossRef] [PubMed]
- Maniakas, A.; Dadu, R.; Busaidy, N.L.; et al. Evaluation of Overall Survival in Patients With Anaplastic Thyroid Carcinoma, 2000-2019. JAMA Oncol 2020, 6, 1397–1404. [Google Scholar] [CrossRef]
- Chen, J.; Song, P.; Peng, Z.; et al. The Controlling Nutritional Status (CONUT) Score and Prognosis in Malignant Tumors: A Systematic Review and Meta-Analysis. Nutr Cancer 2022, 74, 3146–3163. [Google Scholar] [CrossRef] [PubMed]
- Dalmiglio, C.; Brilli, L.; Campanile, M.; Ciuoli, C.; Cartocci, A.; Castagna, M.G. CONUT Score: A New Tool for Predicting Prognosis in Patients with Advanced Thyroid Cancer Treated with TKI. Cancers (Basel) 2022, 14. [Google Scholar] [CrossRef] [PubMed]
- Ignacio de Ulíbarri, J.; González-Madroño, A.; de Villar, N.G.; et al. CONUT: a tool for controlling nutritional status. First validation in a hospital population. Nutr Hosp 2005, 20, 38–45. [Google Scholar]
- Cho, J.S.; Shim, J.K.; Kim, K.S.; Lee, S.; Kwak, Y.L. Impact of preoperative nutritional scores on 1-year postoperative mortality in patients undergoing valvular heart surgery. J Thorac Cardiovasc Surg 2022, 164, 1140–1149.e3. [Google Scholar] [CrossRef]
- Kuwabara, A.; Inage, K.; Yamashita, M.; et al. Predictive Factors for Increased Bone Density Following Romosozumab Administration Based on Pre-Administration Blood Test Results. Yonsei Med J 2025, 66, 226–232. [Google Scholar] [CrossRef]
- Bae, M.I.; Jung, H.; Park, E.J.; Kwak, Y.L.; Song, Y. Prognostic Value of the Controlling Nutritional Status (CONUT) Score in Patients Who Underwent Cytoreductive Surgery Combined with Hyperthermic Intraperitoneal Chemotherapy. Cancers (Basel) 2024, 16. [Google Scholar] [CrossRef]
- Zhang, Y.; Kong, F.F.; Zhu, Z.Q.; Shan, H.X. Controlling Nutritional Status (CONUT) score is a prognostic marker in III-IV NSCLC patients receiving first-line chemotherapy. BMC Cancer 2023, 23, 225. [Google Scholar] [CrossRef]
- Ishiguro, T.; Aoyama, T.; Ju, M.; et al. Prognostic Nutritional Index as a Predictor of Prognosis in Postoperative Patients With Gastric Cancer. In Vivo 2023, 37, 1290–1296. [Google Scholar] [CrossRef]
- Li, H.; Cen, K.; Sun, W.; Feng, B. Prognostic value of geriatric nutritional risk index in elderly patients with heart failure: a meta-analysis. Aging Clin Exp Res 2021, 33, 1477–1486. [Google Scholar] [CrossRef]
- von Elm, E.; Altman, D.G.; Egger, M.; Pocock, S.J.; Gøtzsche, P.C.; Vandenbroucke, JP. The Strengthening the Reporting of Observational Studies in Epidemiology (STROBE) statement: guidelines for reporting observational studies. Lancet 2007, 370, 1453–1457. [Google Scholar] [CrossRef] [PubMed]
- Kim, S.Y.; Kim, S.M.; Kim, J.W.; et al. Survival With Lenvatinib for the Treatment of Progressive Anaplastic Thyroid Cancer: A Single-Center, Retrospective Analysis. Front Endocrinol (Lausanne) 2020, 11, 599. [Google Scholar] [CrossRef] [PubMed]
- Yoshihisa, A.; Kanno, Y.; Watanabe, S.; et al. Impact of nutritional indices on mortality in patients with heart failure. Open Heart 2018, 5, e000730. [Google Scholar] [CrossRef] [PubMed]
- Alvares-da-Silva, M.R.; Reverbel da Silveira, T. Comparison between handgrip strength, subjective global assessment, and prognostic nutritional index in assessing malnutrition and predicting clinical outcome in cirrhotic outpatients. Nutrition 2005, 21, 113–117. [Google Scholar] [CrossRef]
- Bae, H.W.; Lee, Y.J.; Park, M.Y.; et al. Clinical Significance of Prognostic Nutrition Index in Patients with Crohn’s Disease after Primary Bowel Resection. Yonsei Med J 2024, 65, 380–388. [Google Scholar] [CrossRef]
- Bouillanne, O.; Morineau, G.; Dupont, C.; et al. Geriatric Nutritional Risk Index: a new index for evaluating at-risk elderly medical patients. Am J Clin Nutr 2005, 82, 777–783. [Google Scholar] [CrossRef]
- Lentner, C. Geigy Scientific Tables. Volume 2, Introduction to Statistics, Statistical Tables, Mathematical Formulae, 8th edn. Basle: Ciba-Geigy Limited, 1982.
- Chen, X.; Chen, C.; Huang, L.; Wu, P. Pretreatment controlling nutritional status (CONUT) score and carcinoembryonic antigen level provide tumor progression and prognostic information in gastric cancer: A retrospective study. Medicine (Baltimore) 2023, 102, e36535. [Google Scholar] [CrossRef]
- Takagi, K.; Buettner, S.; Ijzermans, J.N.M. Prognostic significance of the controlling nutritional status (CONUT) score in patients with colorectal cancer: A systematic review and meta-analysis. Int J Surg 2020, 78, 91–96. [Google Scholar] [CrossRef] [PubMed]
- Niu, Z.; Yan, B. Prognostic and clinicopathological impacts of Controlling Nutritional Status (CONUT) score on patients with gynecological cancer: a meta-analysis. Nutr J 2023, 22, 33. [Google Scholar] [CrossRef] [PubMed]
- Wang, Y.; Qian, C. Prognostic and clinicopathological value of the controlling nutritional status (CONUT) score in patients with head and neck cancer: a meta-analysis. World J Surg Oncol 2024, 22, 223. [Google Scholar] [CrossRef]
- Sherwin, R.W.; Wentworth, D.N.; Cutler, J.A.; Hulley, S.B.; Kuller, L.H.; Stamler, J. Serum cholesterol levels and cancer mortality in 361,662 men screened for the Multiple Risk Factor Intervention Trial. Jama 1987, 257, 943–948. [Google Scholar] [CrossRef] [PubMed]
- Nago, N.; Ishikawa, S.; Goto, T.; Kayaba, K. Low cholesterol is associated with mortality from stroke, heart disease, and cancer: the Jichi Medical School Cohort Study. J Epidemiol 2011, 21, 67–74. [Google Scholar] [CrossRef]
- Ding, X.; Zhang, W.; Li, S.; Yang, H. The role of cholesterol metabolism in cancer. Am J Cancer Res 2019, 9, 219–227. [Google Scholar]
- Halimi, H.; Farjadian, S. Cholesterol: An important actor on the cancer immune scene. Front Immunol 2022, 13, 1057546. [Google Scholar] [CrossRef] [PubMed]
- Mayengbam, S.S.; Singh, A.; Pillai, A.D.; Bhat, M.K. Influence of cholesterol on cancer progression and therapy. Transl Oncol 2021, 14, 101043. [Google Scholar] [CrossRef]
- Yan, C.; Zheng, L.; Jiang, S.; et al. Exhaustion-associated cholesterol deficiency dampens the cytotoxic arm of antitumor immunity. Cancer Cell 2023, 41, 1276–1293.e11. [Google Scholar] [CrossRef]
- Bae, M.I.; Shim, J.K.; Lee, H.S.; Jeon, S.; Kwak, Y.L. Predictive value of postoperative prognostic nutritional index trajectory for mortality outcomes after off-pump coronary artery bypass surgery: a retrospective cohort study. Front Nutr 2025, 12, 1530651. [Google Scholar] [CrossRef] [PubMed]
- Lamartina, L.; Jannin, A.; Decaussin-Petrucci, M.; et al. ENDOCAN TUTHYREF network consensus recommendations: Anaplastic thyroid cancer. Ann Endocrinol (Paris) 2025, 86, 101788. [Google Scholar] [CrossRef] [PubMed]

| Characteristics | Overall (n = 156) | 1-Year Survival Status | P value | |
|---|---|---|---|---|
| Non-deceased (n=62) | Deceased (n=94) | |||
| Age (yr) | 64.2 (11.3) | 60.3 (11.8) | 66.8 (10.2) | <0.001 |
| Male sex | 69 (44.2%) | 31 (50.0%) | 38 (40.4%) | 0.239 |
| BMI (kg/m2) | 23.6 (3.2) | 24.1 (3.6) | 23.4 (2.9) | 0.188 |
| Tumor size (cm) | 5.0 (2.3) | 4.6 (2.2) | 5.3 (2.4) | 0.049 |
| T stage | 0.249 | |||
| T2 | 11 (7.1%) | 6 (9.7%) | 5 (5.3%) | |
| T3a | 5 (3.2%) | 3 (4.8%) | 2 (2.15) | |
| T3b | 17 (10.9%) | 9 (14.5%) | 8 (8.5%) | |
| T4 | 123 (78.9%) | 44 (71.0%) | 79 (84.0%) | |
| N stage | ||||
| N1 | 131 (84.0%) | 47 (75.8%) | 84 (89.4%) | 0.024 |
| M stage | ||||
| M1 | 104 (66.7%) | 29 (46.8%) | 75 (79.8%) | <0.001 |
| TNM Staging | <0.001 | |||
| TNM stage IVa | 11 (7.1%) | 9 (14.5%) | 2 (2.1%) | |
| TNM stage IVb | 41 (26.3%) | 24 (38.7%) | 17 (18.1%) | |
| TNM stage IVc | 104 (66.7%) | 29 (46.8%) | 75 (79.8%) | |
| Metastasis | ||||
| Lung | 93 (59.6%) | 25 (40.3%) | 68 (72.3%) | <0.001 |
| Bone | 31 (19.9%) | 8 (12.9%) | 23 (24.5%) | 0.077 |
| Brain | 17 (10.9%) | 5 (8.1%) | 12 (12.8%) | 0.356 |
| Pancreas | 3 (1.9%) | 0 (0) | 3 (3.2%) | 0.277 |
| Adrenal gland | 3 (1.9%) | 0 (0) | 3 (3.2%) | 0.277 |
| Liver | 6 (3.9%) | 2 (3.2%) | 4 (4.3%) | >0.999 |
| Mediastinum | 10 (6.4%) | 3 (4.8%) | 7 (7.5%) | 0.741 |
| Surgery | 110 (70.5%) | 55 (88.7%) | 55 (58.5%) | <0.001 |
| Type of Surgery | 0.111 | |||
| Excisional biopsy | 22 (19.3%) | 7 (12.7%) | 15 (25.4%) | |
| Debulking | 40 (35.1%) | 18 (32.7%) | 22 (37.3%) | |
| Complete resection | 52 (45.6%) | 30 (54.6%) | 22 (37.3%) | |
| Chemotherapy | 130 (83.3%) | 51 (82.3%) | 79 (84.0%) | 0.907 |
| First-line chemotherapy regimen | ||||
| Adriamycin | 15 (11.5%) | 5 (9.8%) | 10 (12.7%) | |
| Cisplatin | 4 (3.1%) | 2 (3.9%) | 2 (2.5%) | |
| Epirubicin | 1 (0.8%) | 0 (0) | 1 (1.3%) | |
| Paclitaxel | 111 (85.4%) | 44 (86.3%) | 67 (84.8%) | |
| Second-line chemotherapy regimen | ||||
| Adriamycin | 3 (2.3%) | 1 (2.0%) | 2 (2.5%) | |
| Carboplatin | 2 (1.5%) | 1 (2.0%) | 1 (1.3%) | |
| Paclitaxel | 9 (6.9%) | 4 (7.8%) | 5 (6.3%) | |
| Targeted therapy | 75 (48.1%) | 28 (45.2%) | 47 (50.0%) | 0.554 |
| First-line targeted therapy regimen, Lenvima | 61 (81.3%) | 24 (85.7%) | 37 (78.7%) | |
| First-line targeted therapy regimen, Nexavar | 14 (18.7%) | 4 (14.3%) | 10 (21.3%) | |
| Second-line targeted therapy regimen, Lenvima | 3 (4.0%) | 1 (3.6%) | 2 (4.3%) | |
| Radiation therapy | 129 (82.7%) | 54 (87.1%) | 75 (79.8%) | 0.238 |
| Neck radiation dose (Gy) | 4287.8 (2955.5) | 5044.9 (3302.3) | 3785.8 (2600.3) | 0.014 |
| Radiation therapy, bone | 4 (3.1%) | 1 (1.9%) | 3 (4.0%) | |
| Radiation therapy, brain | 6 (4.7%) | 2 (3.7%) | 4 (5.3%) | |
| Radiation therapy, lung | 4 (3.1%) | 2 (3.7%) | 2 (2.7%) | |
| Radiation therapy, iliac | 1 (0.8%) | 1 (1.9%) | 0 (0) | |
| Radiation therapy, spine | 6 (4.7%) | 1 (1.9%) | 5 (6.7%) | |
| Other site radiation dose (Gy) | 4434.2 (1842.5) | 4292.9 (1772.6) | 4516.7 (1954.8) | 0.807 |
| Characteristics | Overall (n = 156) | 1-Year Survival Status | P value | |
|---|---|---|---|---|
| Non-deceased (n=62) | Deceased (n=94) | |||
| Controlling Nutritional Status (CONUT) score | 2.1 (2.0) | 1.5 (1.5) | 2.5 (2.3) | 0.001 |
| CONUT < 3 | 108 (69.2) | 51 (82.3) | 57 (60.6) | 0.004 |
| CONUT ≥ 3 | 48 (30.8) | 11 (17.7) | 37 (39.4) | |
| Prognostic nutritional index (PNI) | 39.3 (5.4) | 41.4 (4.4) | 38.0 (5.6) | <0.001 |
| PNI > 42 | 61 (39.4) | 36 (59.0) | 25 (26.6) | <0.001 |
| PNI ≤ 42 | 94 (60.7) | 25 (41.0) | 69 (73.4) | |
| Geriatric Nutritional Risk Index (GNRI) | 103.9 (10.8) | 107.1 (9.8) | 101.8 (11.0) | 0.003 |
| GNRI > 102 | 91 (59.1) | 44 (72.1) | 47 (50.5) | 0.008 |
| GNRI ≤ 102 | 63 (40.9) | 17 (27.9) | 46 (49.5) | |
| Albumin (g/dL) | 3.9 (0.5) | 4.1 (0.4) | 3.8 (0.6) | <0.001 |
| Total cholesterol (mg/dL) | 170.3 (42.6) | 175.4 (43.5) | 166.9 (41.9) | 0.221 |
| Lymphocyte (10³/μL) | 1.7 (0.6) | 1.8 (0.5) | 1.7 (0.7) | 0.454 |
| Calcium (mg/dL) | 8.8 (0.8) | 8.8 (0.7) | 8.8 (0.8) | 0.985 |
| Inorganic Phosphorus (mg/dL) | 3.7 (0.7) | 3.9 (0.7) | 3.6 (0.6) | 0.022 |
| Glucose (mg/dL) | 124.2 (35.5) | 122.3 (30.8) | 125.5 (38.4) | 0.585 |
| BUN (mg/dL) | 15.5 (5.8) | 14.2 (5.0) | 16.3 (6.2) | 0.028 |
| Creatinine (mg/dL) | 0.7 (0.4) | 0.7 (0.2) | 0.8 (0.5) | 0.810 |
| Uric acid (mg/dL) | 4.5 (1.5) | 4.6 (1.5) | 4.4 (1.5) | 0.346 |
| Total protein (g/dL) | 6.9 (0.7) | 7.1 (0.6) | 6.8 (0.7) | 0.025 |
| Total bilirubin (mg/dL) | 0.6 (0.2) | 0.6 (0.2) | 0.6 (0.2) | 0.266 |
| Alkaline phosphatase (IU/L) | 92.8 (44.5) | 81.2 (22.9) | 100.4 (53.1) | 0.002 |
| Aspartate aminotransferase (IU/L) | 22.0 (8.3) | 24.1 (9.3) | 20.6 (7.4) | 0.015 |
| Alanine aminotransferase (IU/L) | 18.9 (12.3) | 22.3 (15.8) | 16.6 (8.6) | 0.011 |
| Triglyceride (mg/dL) | 126.8 (76.9) | 119.7 (75.7) | 135.8 (78.5) | 0.329 |
| HDL-cholesterol (mg/dL) | 45.1 (12.7) | 46.6 (10.6) | 42.8 (15.2) | 0.218 |
| LDL-cholesterol (mg/dL) | 109.2 (31.1) | 108.8 (32.1) | 109.9 (30.0) | 0.880 |
| HbA1c (%) | 6.6 (1.1) | 6.4 (1.0) | 6.7 (1.1) | 0.469 |
| White blood cell (10³/μL) | 10.3 (8.0) | 7.7 (2.6) | 12.0 (9.7) | <0.001 |
| Hemoglobin (g/dL) | 12.7 (1.7) | 13.2 (1.5) | 12.4 (1.8) | 0.009 |
| Hematocrit (%) | 38.3 (4.9) | 39.6 (4.2) | 37.4 (5.1) | 0.007 |
| Red cell distribution width (%) | 13.0 (1.2) | 12.8 (1.1) | 13.2 (1.2) | 0.049 |
| Platelet (10³/μL) | 288.5 (117.7) | 277.9 (96.9) | 295.4 (129.6) | 0.338 |
| Neutrophil (10³/μL) | 7.5 (7.4) | 5.1 (2.4) | 9.1 (8.9) | <0.001 |
| Erythrocyte Sedimentation Rate (mm/hr) | 44.6 (29.4) | 42.0 (28.5) | 46.3 (30.2) | 0.472 |
| C-Reactive Protein (mg/L) | 30.1 (44.1) | 14.9 (28.1) | 39.8 (49.6) | <0.001 |
| eGFR (mL/min/1.73m2) | 101.9 (30.6) | 100.2 (25.1) | 103.0 (33.9) | 0.545 |
| Variable | 1-year mortality | 2-year mortality | ||
|---|---|---|---|---|
| HR (95% CI) | P value | HR (95% CI) | P value | |
| CONUT | ||||
| < 3 | ref | ref | ||
| ≥ 3 | 2.071 (1.345–3.187) | <0.001 | 2.040 (1.356–3.068) | 0.001 |
| PNI | ||||
| > 42 | ref | ref | ||
| ≤ 42 | 1.788 (1.092–2.928) | 0.021 | 1.779 (1.135–2.788) | 0.0121 |
| GNRI | ||||
| > 102 | ref | ref | ||
| ≤ 102 | 1.630 (1.075–2.472) | 0.022 | 1.528 (1.034–2.259) | 0.034 |
| Albumin (per g/dL) | 0.436 (0.288–0.660) | <0.001 | 0.477 (0.323–0.702) | <0.001 |
| Variable | Harrell’s C-index (95% CI) | P value | ||
|---|---|---|---|---|
| Classification by the optimal cut-off values | vs CONUT≥ 3 | vs PNI≤ 42 | vs GNRI≤ 102 | |
| CONUT≥ 3 | 0.602 (0.554–0.65) | Ref | 0.6714 | 0.8756 |
| PNI≤ 42 | 0.617 (0.568–0.666) | 0.6714 | Ref | 0.5563 |
| GNRI≤ 102 | 0.596 (0.544–0.647) | 0.8756 | 0.5563 | Ref |
| Continuous variable | vs CONUT | vs PNI | vs GNRI | |
| CONUT | 0.617 (0.558–0.675) | Ref | 0.251 | 0.795 |
| PNI | 0.666 (0.605–0.726) | 0.251 | Ref | 0.410 |
| GNRI | 0.629 (0.565–0.693) | 0.795 | 0.410 | Ref |
| Albumin (g/dL) | 0.665 (0.606–0.724) | 0.090 | 0.991 | 0.423 |
| CONUT (cut-off) | CONUT (continuous) | |||||
|---|---|---|---|---|---|---|
| Null model | Null model + CONUT≥ 3 | Pvalue | Null model | Null model + CONUT (continuous) | Pvalue | |
| Predictive ability (95% CI) | Predictive ability (95% CI) | Predictive ability (95% CI) | Predictive ability (95% CI) | |||
| Harrell’s c index | 0.671 (0.612-0.729) | 0.703 (0.648-0.757) | 0.100 | 0.671 (0.612-0.729) | 0.698 (0.645-0.752) | 0.146 |
| NRI | - | 0.160 (-0.045–0.321) | 0.100 | - | 0.165 (-0.105–0.323) | 0.194 |
| IDI | - | 0.035 (0.003–0.087) | 0.032 | - | 0.027 (-0.003–0.068) | 0.074 |
| PNI (cut-off) | PNI (continuous) | |||||
| Null model | Null model + PNI≤ 42 | Pvalue | Null model | Null model + PNI (continuous) | Pvalue | |
| Predictive ability (95% CI) | Predictive ability (95% CI) | Predictive ability (95% CI) | Predictive ability (95% CI) | |||
| Harrell’s c index | 0.671 (0.612-0.729) | 0.691 (0.634–0.748) | 0.633 | 0.671 (0.612-0.729) | 0.707 (0.651-0.762) | 0.402 |
| NRI | - | 0.291 (-0.024–0.459) | 0.074 | - | 0.138 (-0.059–0.336) | 0.126 |
| IDI | - | 0.025 (-0.002–0.083) | 0.090 | - | 0.036 (-0.002–0.101) | 0.076 |
| GNRI (cut-off) | GNRI (continuous) | |||||
| Null model | Null model + GNRI≤ 102 | Pvalue | Null model | Null model + GNRI (continuous) | Pvalue | |
| Predictive ability (95% CI) | Predictive ability (95% CI) | Predictive ability (95% CI) | Predictive ability (95% CI) | |||
| Harrell’s c index | 0.671 (0.612-0.729) | 0.695 (0.64-0.75) | 0.547 | 0.671 (0.612-0.729) | 0.711 (0.656-0.766) | 0.312 |
| NRI | - | 0.244 (-0.109–0.396) | 0.132 | - | 0.123 (-0.109–0.321) | 0.234 |
| IDI | - | 0.020 (-0.004–0.071) | 0.136 | - | 0.034 (-0.003–0.096) | 0.082 |
Disclaimer/Publisher’s Note: The statements, opinions and data contained in all publications are solely those of the individual author(s) and contributor(s) and not of MDPI and/or the editor(s). MDPI and/or the editor(s) disclaim responsibility for any injury to people or property resulting from any ideas, methods, instructions or products referred to in the content. |
© 2025 by the authors. Licensee MDPI, Basel, Switzerland. This article is an open access article distributed under the terms and conditions of the Creative Commons Attribution (CC BY) license (http://creativecommons.org/licenses/by/4.0/).


