
Submitted:
10 January 2026
Posted:
12 January 2026
You are already at the latest version
Abstract
Contemporary physiotherapy requires technological tools to provide effective therapy to the increasing group of patients, neurological, among others. This can be achieved with rehabilitation robots, which can also be exoskeletons - wearable devices mobilizing multiple joints with complex motions representing activities of daily living. To perform the kinesiotherapy conveniently in home-like environments, the exoskeletons need to be relatively lightweight. The paper presents the methodology of decreasing the mass of the exoskeleton design with the human-in-the-loop simulations of motions, followed by multibody dynamics simulations, and finite element method (FEM) multistep optimization. The process includes sequential initial parametric optimization, topology optimization, and final parametric optimization. The steps are used to set initial dimensional and material parameters, extract new geometrical features, and adjust the final geometry dimensions of a new design. The presented case of the SmartEx-Home exoskeleton resulted in a total mass reduction of almost 50% while meeting the criteria of the minimum safety factor and maximum internal stress and strain for all the components. The final design is being manufactured and will be used within the tests with humans, reflecting almost fully automatic passive and active therapy.
Keywords:
exoskeleton
; digital shadow
; finite element method
; human-in-the-loop
; multibody system dynamics
; parametric optimization
; rehabilitation robotics
; simulation-based design
; topology optimization
1. Introduction
Impaired upper limb function greatly affects activities of daily living, which are the basis for independent functioning [1,2]. Upper limb disability resulting from musculoskeletal system dysfunction constitutes a significant health issue both in the general population and among patients receiving primary healthcare services. The prevalence of upper limb disorders varies considerably, ranging from 2% to 53%, according to studies, with higher incidence rates observed among students and professionally active individuals. Musculoskeletal complaints affecting the upper limb are associated with specific pathological conditions, such as rotator cuff tendinitis, adhesive capsulitis, lateral epicondylitis, carpal tunnel syndrome, and De Quervain’s disease. In some cases, these disorders present with nonspecific symptoms, making their classification and diagnosis more challenging [3].
It is not only orthopedic conditions that cause upper limb impairment. Many neurological diseases can cause upper limb impairment [4]. For example, stroke, in the United States of America alone, more than 795,000 people per year have a stroke [4,5]. Stroke-related costs in the United States came to nearly $56.2 billion between 2019 and 2020. Costs include the cost of health care services, medicines to treat stroke, and missed days of work [6]. Among the numerous neurological deficits that occur in post-stroke patients, loss of upper limb motor function is the most common, affecting 77.4% of patients. This impairment persists for more than six months in 89% of those who have experienced loss of upper limb function, significantly affecting their quality of life. The process of neuroplasticity enables partial or full recovery of function, and its effectiveness can be enhanced by intensive and repetitive motor activity as part of rehabilitation therapy [7]. The next disease we can mention is multiple sclerosis. The number of people affected by multiple sclerosis worldwide was estimated to rise to 2.8 million in 2020. Using the same methodology as in 2013, this number was estimated to be 30% higher than in 2013. The global prevalence in 2020 was 35.9 cases per 100,000 people [8], 60% of people with multiple sclerosis have impaired hand function. Upper limb dysfunction in activities of daily living is greater than in stroke, as both sides are often affected [4]. In neurological diseases, impairment of the upper limbs may result from various causes. In neuromuscular diseases such as spinal muscular atrophy, there are also disorders of the upper limbs resulting from muscle weakness [9]. The above examples are selected neurological diseases causing impairment of the upper limb, but there are more [2,4,10]
One of the tools significantly supporting the physiotherapy process, considering medical staff shortages, is robots [11]. The ones used in the home environment must be placed at the forefront of many challenges, including safety, cost, environmental requirements, and use-independent behavior [12]. Many patients need constant continuous therapy at home after returning from the hospital, which can bring additional benefits. Post-stroke individuals feel comfortable in a home environment (it is an environment closer to them, familiar, closer to family and friends). Providing home therapy results in a lower likelihood of the patient’s re-hospitalization, which relieves the burden on the healthcare system. Home rehabilitation removes access barriers for people who have problems with mobility and travel; in addition, it allows work during pandemic conditions when restrictions on physical contact are imposed, especially proven here are robots for home rehabilitation. Home rehabilitation requires a high degree of repetition of the activities that are taught to be effective. Automated therapy sessions can enable increased repetitions of rehabilitation exercises without the need to intensify in-person visits while providing patients with engaging and goal-oriented activities to support the therapy process.[7]
Rehabilitation robots are either end-effector type or exoskeletons [13]. The former enable only point interaction between the device and a human. However, it makes use of such robots more universal and easier in terms of safety [13]. On the contrary, the latter provides more complex interaction, including mobilization of particular joints [14,15]. However, it is significantly susceptible to mechanical differences between the exoskeleton’s kinematics chain and the anatomy of an individual user. Due to the advantages of controlling every degree of freedom precisely by exoskeletons, these structures can be particularly useful for telerehabilitation [12,16].
As at least partially wearable structures, exoskeletons benefit from lightweight construction [11,17]. To achieve the lowest mass possible while preserving the right durability and strength, optimization methods are utilized during the design process.
One of the commonly used methods is Parametric Optimization (PO). It requires defying all possible parameters and their range and is often quite complicated to perform. However, it allows for a more thorough overview of the process and leaves more decisions to the user. The PO process is commonly reinforced by the Sensitivity Analysis (SA) and the Response Surface Method (RSM) to help in reducing the overall time of the optimization [18].
SA is a method used to determine how changes in each output of a mathematical model or function are affected by changes in each input [19]. It’s a common practice to use it for determining the most suitable parameter configuration and reducing the number of input parameters, hence reducing the overall time of the whole optimization process.
Another tool used to optimize designs is Topology Optimization (TO) [20]. It is a mathematical method that spatially optimizes the distribution of material within a defined domain while maintaining previously set constraints and looking for a minimal value of the predefined objective function [21]. It is used in the structural optimization of various parts, from mechanical parts such as gears or wheels to smaller, more precise objects such as ferrite plates [22]. The method was used in the literature to optimize rehabilitation exoskeletons [23]. Such an approach may utilize different methods like Solid Isotropic Material with Penalization (SIMP) method [24], evolutionary structural optimization (ESO)[25], genetic algorithms [26], or others. The SIMP method is based on the Finite Element Method (FEM) analysis and is commonly applied in stress and structure durability research [24].
The presented methods are based on different approaches but can be used for the same aim. They are also applicable to additively manufactured components [27]. Moreover, they can be used sequentially to obtain even higher mass reduction [28]. For this reason, the paper focuses on combining PO and TO techniques for a specific application in rehabilitation exoskeleton design, as an example of a series robot.
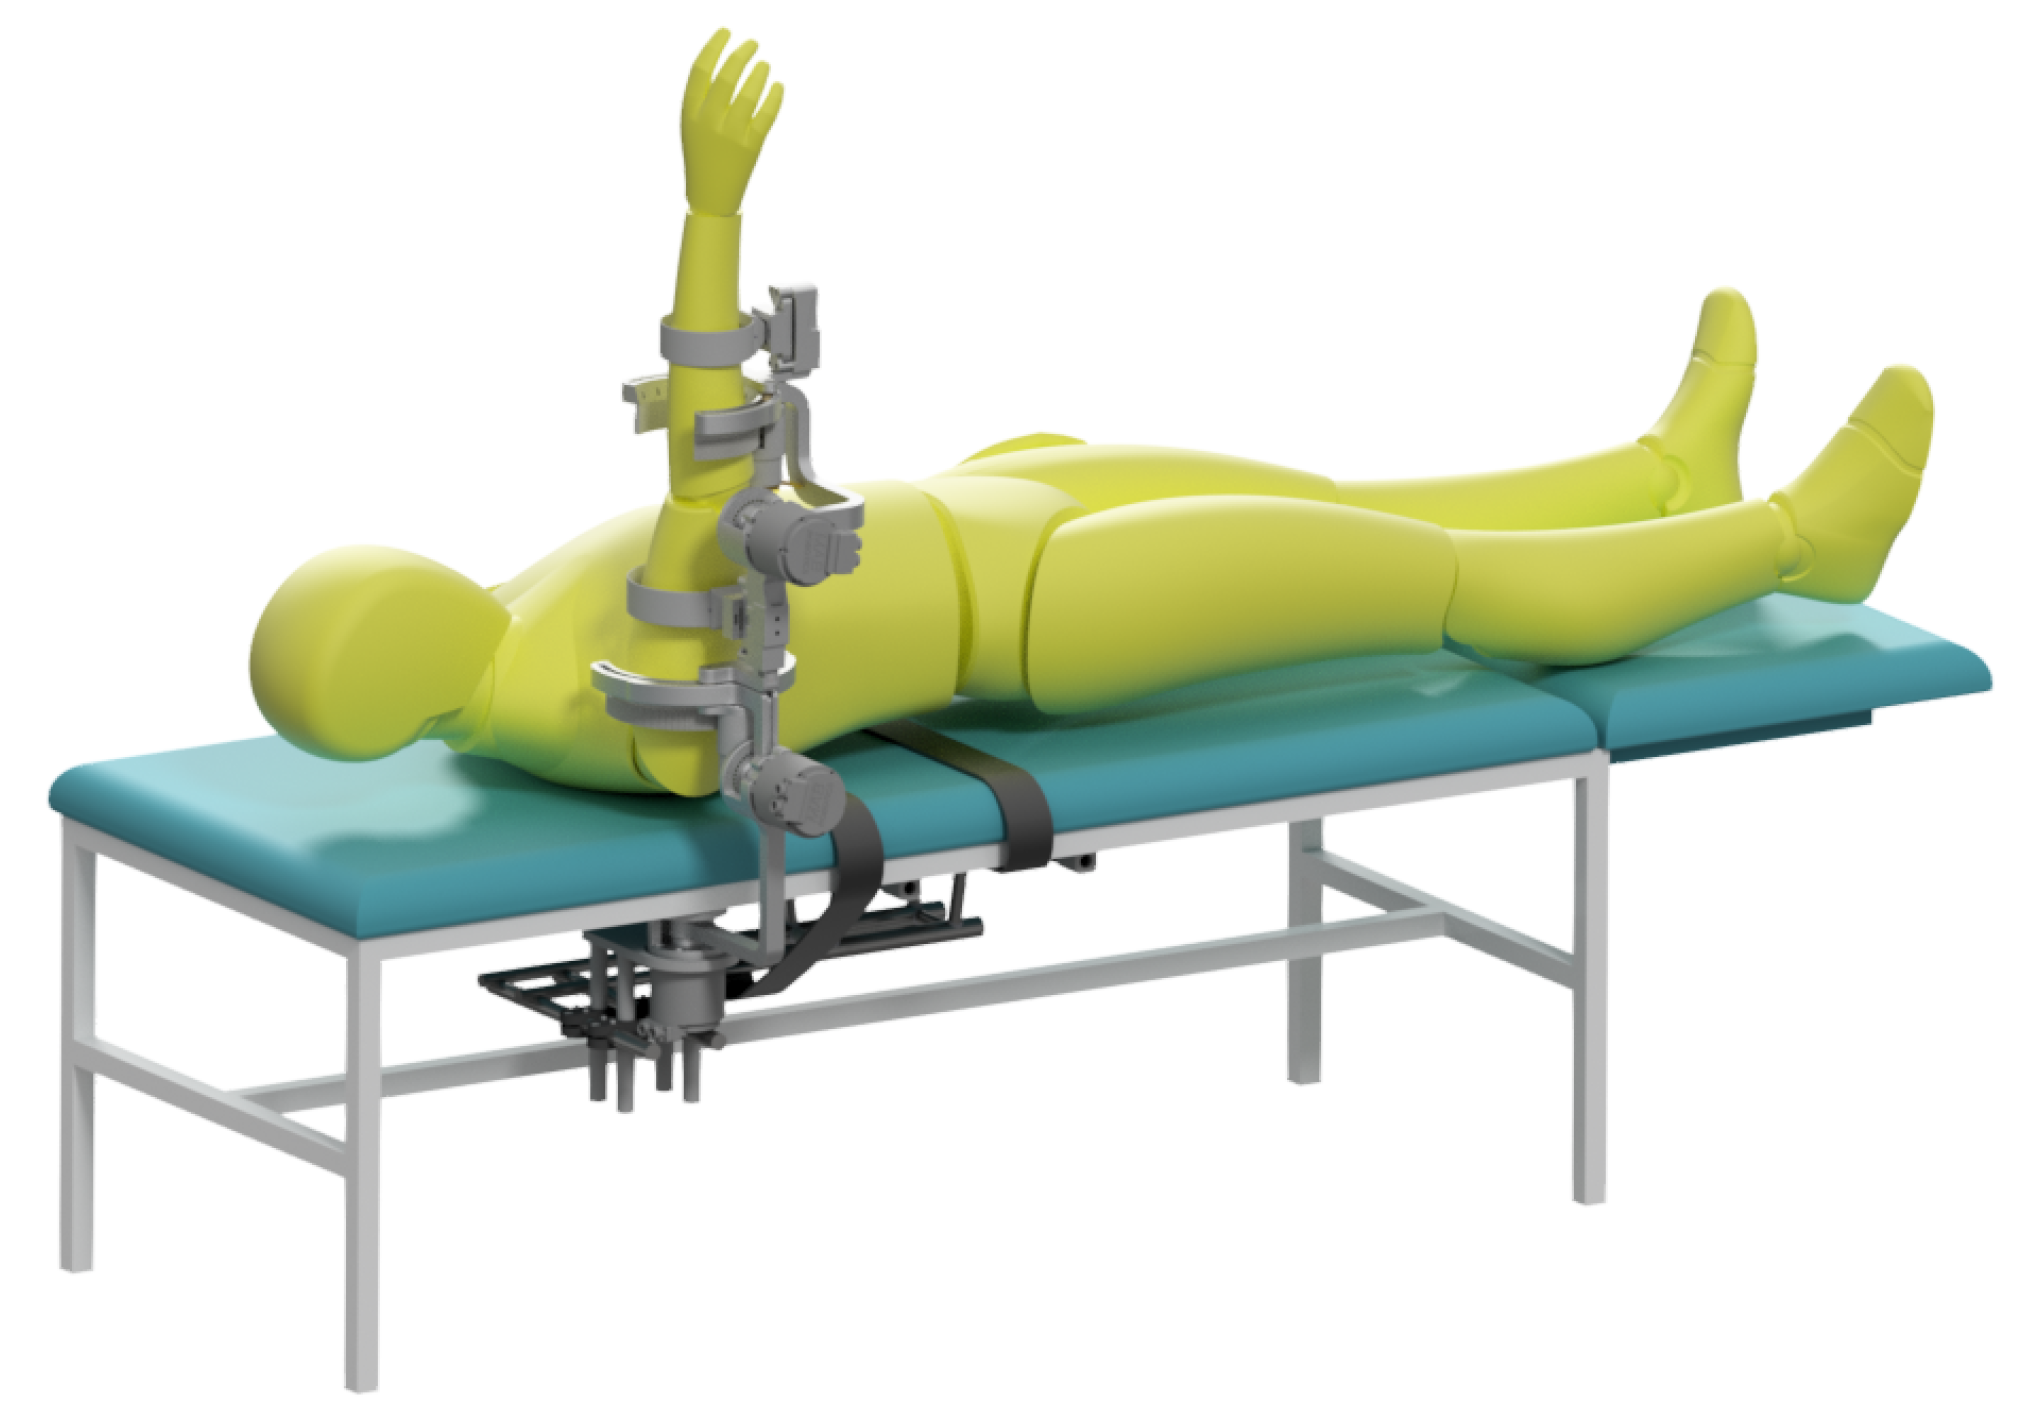
The exoskeleton, which is an object of optimization in this paper, is SmartEx-Home, the device for task-oriented kinesiotherapy of the upper extremity. It can be attached to a chair or a bed or used on a dedicated frame with a lifting column. Therefore, physiotherapy can be performed in a sitting, lying, or standing position (see Figure A1–Figure A3). The device enables motion in five degrees of freedom of the shoulder and elbow joints. Therefore, it is suitable for task-oriented exercises. Shoulder abduction/adduction and flexion/extension, as well as elbow flexion/extension, are driven by electric motors. On the contrary, shoulder and ulnar-radial rotations correspond to the passive joints of the exoskeleton. The construction is adjustable to the lengths of arm and forearm segments corresponding to the Polish population from 5th women to 95th men percentile [29]. Therefore, all of the joints rotation axes can be aligned with the modeled rotation axes of human joints. The main segments are attached to the arm and forearm through 3-axis force sensors with elastic braces. Patients can also be placed for exercise with wheelchair belts. Exercises with the device are performed in either passive or active mode. Their trajectories correspond to the activities of daily living modeled and recorded at the previous stage by physiotherapists [30]. The visual of the exoskeleton placed at the chair was presented in Figure 1.
Based on the analysis of recent research papers regarding designs of rehabilitation devices, combining topology optimization with parametric optimization has not been investigated and applied yet [16]. Therefore, there is a research gap in the field of optimizing rehabilitation or assistive robots, which have complex loads resulting from human-machine physical interactions and dynamic motions. The focus of the study is to apply the methodology in the field of biorobotics and validate possible mass minimization while modeling reactions with the real-life motion recordings.
The aim of the study is to minimize the mass of the SmartEx-Home exoskeleton [30,31] with the numerical methods. These include combined multibody dynamics simulations and multistep FEM optimization. The process is based on real-life measured motions used in planned robot-aided physiotherapy. Therefore, the optimization process is dedicated to the specific application of the device. Currently, methods that are used tend to involve only a single type of optimization and are based on generalized loads, not specific therapy motions. Therefore, the resultant designs cannot be treated as optimal. The presented methodology will fill this gap. Moreover, this paper will present the complex simulation-based design and discuss the effects obtained at every stage.
2. General Methodology
Optimization was divided into six main stages presented in Table 1. The initial design presented in Figure 1 was created based on the anthropometric modeling of human extremity to suit people between 5th female and 95th male percentile of the Polish population [29]. Then, the set of motions useful for task-oriented kinesiotherapy was defined, extending sets previously used in analogical studies [32,33]. These motions were recorded with the use of five inertial measurement units (IMUs; one reference and four attached to the body) and computed to represent joint variables for the exoskeleton model [31]. These were then used as inputs for the inverse dynamics simulation to calculate resultant forces and torques at the characteristic points of the exoskeleton. This includes interfaces between moving segments of the device and attachments of the exoskeleton acting upon the extremity. The parameters obtained at this stage were used for further finite-element-method simulations.
The finite element computations consisted of initial strength validation with potential improvements of the design, initial parametric optimization to adjust overall dimension before main mass reduction, following topology optimization to extract new features reducing total mass, and final parametric optimization for the last fine-tuning of the finally extracted features. All the stages but the last one were based on an isotropic material model sufficient at these stages for components manufactured with the selective laser sintering (SLS) method [34]. However, the last stage was performed with the orthotropic model for the most accurate results.
Every specific stage of the optimization is described precisely in the following sections (4-6) of the paper.
3. Multibody Analysis
The rigid multibody simulation (MBS) model enabled dynamic testing based on recorded motion trajectories, resulting in valuable insights into motors’ torque requirements and internal loads. These supported strength simulations are described in sections 4-6. The model was based on real-life measured trajectories and enabled the simulation of the construction behavior during motion. Figure 2 shows the MBS model in graphical form within the simulation environment, in its initial configuration - starting each trajectory recording.
The simulation model was primarily developed using the Simulink package, along with Simscape and Simscape Multibody. The exoskeleton bodies used in the simulation were designed in Autodesk Inventor 2021 and integrated with the Simscape Multibody environment. This integration allows for the direct import of 3D models, automatically incorporating physical properties such as density, geometry, and moments of inertia, streamlining the model-building process. Moreover, the modified bodies were automatically updated.
The Robotic System Toolbox was used to generate and adapt polynomial motion trajectories for the simulation based on the recorded discrete real-life trajectories.
Upon completion of the MBS simulation, the recorded trajectories and other resultant data are exported to the Workspace for further analysis, particularly to identify critical structural loads.
3.1. Motion Modeling
Four IMUs from the Movella DOT system were used to record upper extremity motion reflecting activities of daily living (ADLs). Each sensor, recording at 120 Hz, contains a 3-axis gyroscope, accelerometer, and magnetometer, with orientation data delivered as ZYX Euler angles. While most analyzed ADLs primarily involved the upper limb with minimal body motion, one IMU was placed on the trunk to account for natural position changes. Sensors were also placed on the arm and forearm to track these segments’ movements. A fourth IMU was attached to the palm, which was crucial in measuring forearm supination and pronation. This IMU also enabled the recording of wrist motion across two degrees of freedom (radial/ulnar deviation and flexion/extension), which allows for precise modeling of the distal characteristic point of an exoskeleton. The attachment scheme is presented in the complementary paper [30].
To ensure consistency, data were recorded following a standardized procedure [30]: (1) performing a heading reset, (2) holding the extremity in a neutral position, (3) conducting ten repetitions of the activity, and (4) transferring the data. Besides aligning the axes of the IMUs in the same direction, the heading reset minimizes issues with proper recognition of the axes. The initialization phase requires the subject to maintain a neutral position for at least 5 seconds.
Each session included ten repetitions per activity and was completed within five minutes to minimize sensor drift. The recorded data was then transferred from the Movella DOT sensors to mobile storage and stored in a database. A total of 38 recordings, representing 19 ADLs from two subjects (physiotherapists), were selected for further multibody analysis. They were repeating the motions multiple times each with the different motion patterns. These ADLs are in-depth described in the complementary paper [30]. Further experiments with multiple participants confirmed that the motions included in this investigation cover a wide range of potential motions of users.
The stored data were further processed with proprietary scripted software in MATLAB 2024a. This resulted in the time series for rotations in the MBS model’s joints. This procedure consisted of the following steps: (1) loading data and removing measurement value range limits, (2) computing the initial orientations of the IMUs, (3) assuming default orientation of the body segments’ frames, (4) computing the motion of the body segments’ frames, (5) computing the rotation history in the joints, extensively described in a complementary research paper from the series [30].
3.2. Model Construction
This subsection is dedicated to the model description, precisely described in a complementary research paper from the series [31].
The input values consist of angular trajectories at the following joints of the structure, defining the planned motion of the system. The output values provide critical insights into the system’s performance and include:
- Required drive torques required in the active degrees of freedom to achieve the desired motion.
- Mechanical loads acting on individual components, represented as force and moment vectors reflecting real-life conditions.
The environment has been configured to reflect real-world conditions, such as the gravitational field. A common global reference frame has been established.
The solid subbodies were represented by "File Solid" blocks, which import geometry, material properties, and visuals from files modeled in Autodesk Inventor 2021. However, a manual definition of mechanical parameters was also possible. The position of individual mechanical parts in the model was manipulated using "Rigid Transform" blocks, which defined a fixed 3D transformation between two frames of reference.
Rotational degrees of freedom between frames of reference were implemented using Revolute Joint blocks. The stiffness and damping coefficients of the internal spring-damper force law were experimentally chosen to ensure realistic motion, accounting for inaccuracies and energy losses due to friction.
Linear adjustments were implemented with the Prismatic Joint block. These enabled transformation along the Z-axis of the base coordinate system. The Welded Joint block was used to restrict movement while providing access to reaction load data, permanently linking the base and following frames of reference. The fixed joint’s mounting point corresponded to the actual attachment location of the upper extremity to the structure.
As a part of the project, a pin curve slot mechanism was simulated to accurately determine and measure loads in the free (passive) degrees of freedom. Since none of the available blocks was suitable for simulating passive joints, the mechanism was modeled by applying motion constraints and using a 6-DOF joint. Thanks to this, a required angular trajectory was set.
Rotational degrees of freedom and pin curve slot joints were configured to export the required data during the simulation. For each active DOF, motor torque, and constraint forces and torques were recorded as outputs. In passive joints, constraint forces and torques on each shaft were also recorded. Within the simulation, maximum torques needed for the motions were considered (as for passive therapy).
3.3. Selection of Critical Cases
The selection of critical force sets was used in further stages of the project for structural analysis and optimization. The selection was simplified - critical sets were selected based solely on force and torque magnitudes without considering strain or stress values. Consequently, an appropriate safety factor must be applied to ensure the assumptions’ validity, even in cases where the applied force set could generate higher stresses than those selected as critical.
The analysis consists of independently reviewing the reaction (force and torque) trajectories in the joints for each segment and selecting the critical set of reactions. The critical set for one segment may originate from a different recording than that for another segment. The procedure is divided into the following five steps, as described.
The first step involves identifying the maximum component values of forces in joints. Absolute maximum values of vector components in the coordinate systems related to definitions of joints in the multibody model are recorded. These maxima are marked on an exemplary plot (Figure 3) with vertical solid lines color-coded according to the respective component (blue for x, red for y, and orange for z).
The next step is determining each joint’s maximum forces and torque norms. Norm profiles are smoothed using a one-second moving average to eliminate artifacts from recordings and spikes generated in simulations. This smoothing allows for identifying a one-second interval where the average force norm reaches the maximum norm. These intervals are selected independently for forces and torques, for different joints and motions, and are marked on the plot with two solid vertical grey lines (Figure 3).
The selected critical force and torque intervals are normalized to the range to remove the unit dependency. This facilitates the computation of a new index according to formula 1, where represents the normalized, averaged force , and torque norm ratio relative to their maximum values (for the i-th joint in the given body).
The goal is to determine the time interval within which both forces and torques are simultaneously as close as possible to their peaks. This interval is selected for a particular joint and motion combination (marked on the plot with two vertical dashed gray lines in Figure 3). Ideally, theoretical maximum appear when . The MATLAB 2024a script assists in identifying these regions, but a final engineering review is necessary to ensure their validity.
The final processing step selects the critical reaction force set for the entire multibody segment. This involves identifying a time interval when force and torque norms across all joints within the body are simultaneously near their maximum values. The computation is performed according to formula 2, where represents a new non-physical index for the j-th body, while n is the number of joints within the body.
The interpretation follows that of (the identified interval is marked on the plot with a vertical dotted-dashed grey line in Figure 3). Selecting such an interval ensures that the applied forces are consistent and originate from a single timeframe, making them representative of actual loading conditions.
Forces and torques are selected to yield the highest possible norm values within the proposed interval to ensure a conservative approach. Consequently, the chosen force value may originate from the beginning of the one-second interval, while the torque value may be taken from its end independently for each joint in the body.
The final selection of critical forces and torques involves reviewing average values from the identified intervals (where all joint values come from the same time window) and their corresponding maximum values. Standard deviations were analyzed, and movements with values deviating significantly (more than one standard deviation) were removed. The goal was to find intervals where the mean remained within the upper boundary of a two-standard deviation range and where maximum values were among the highest recorded.
These initially proposed values were further verified by considering intervals for individual joints, forces, and torques separately. The final decision was cross-checked against the force and torque history to eliminate artifacts, measurement errors, or other non-physical simulation results by reviewing the plotted time history of these values. The outcome – selected critical forces and torques for each body – is presented in Table 2.
4. Initial Parametric Optimization
4.1. FEM Models
To adjust the overall dimension of the designed exoskeleton, the initial parametric optimization of the robot’s geometric structure was conducted. Five main bodies (assemblies of components; connected with joints) were chosen, and their digital models were imported into the ANSYS environment. Before any computations, the models were preprocessed to simplify their geometry in order to achieve higher-quality mesh elements in the following stages. This included operations such as simplifying geometry features with negligible influence on the general durability or splitting bodies with complex structures into smaller, less advanced segments with shared topology. Preprocessed models were then transmitted to the FEM analysis module.
The materials used for analyses are similar between the parts and consist of four main isotropic material models: Aluminum (; ), Polymer Material (SLS-printed Nylon; ), Structural Steel (), and Brass () - all for additive manufacturing. While the material models of brass and steel are a part of ANSYS Granta Library, the models of Aluminum and Polymer Material were imported from external libraries. These were assigned to the main, optimized components since they are used as additive manufacturing technology materials.
Each of the analyzed exoskeleton bodies consisted of subbodies that were assembled by varying connection types (full assembly is visualized in Figure 2). Interactions between those parts were modeled by contacts. Frictionless contacts were introduced to represent surface-to-surface interaction between main elements (e.g., regulation part and regulation lock in body 3; see Figure 4), while bond contacts were introduced to model bolt connections.
Loads and constraints were applied based on the results derived from Table 2. They are presented in Figure A4 - Figure A8. Remote points were introduced to represent points of load application for each body.
4.1.1. Mesh Summary
The mesh grids were generated with a priority to contain hexahedral elements only. Element quality and element skewness were automatically determined by ANSYS. The former is related to the volumes of the model before and after division. The latter describes how close to equilateral the faces of created elements are. Their values were used as the main indicator of the mesh quality.
The grid of each part was built so that it did not exceed the average element skewness of 0.25 and exceeded the average element quality of 0.80. Their resulting mesh parameters are presented in the Table 3.
The discrepancies in the nodes-to-elements ratio in Bodies 1 and 5 compared to others were caused by the usage of the quadratic element order option in ANSYS’ mesh tool. Contrary to the linear element order, the deformation of a single element is then approximated by a quadratic function, which requires additional nodes in the middle of each of the elements’ edges.
Moreover, a higher number of elements within finite element models of Body 1 and Body 5 resulted from the presence of bolt representations to attach the motors.
4.2. Initial Changes to the Design
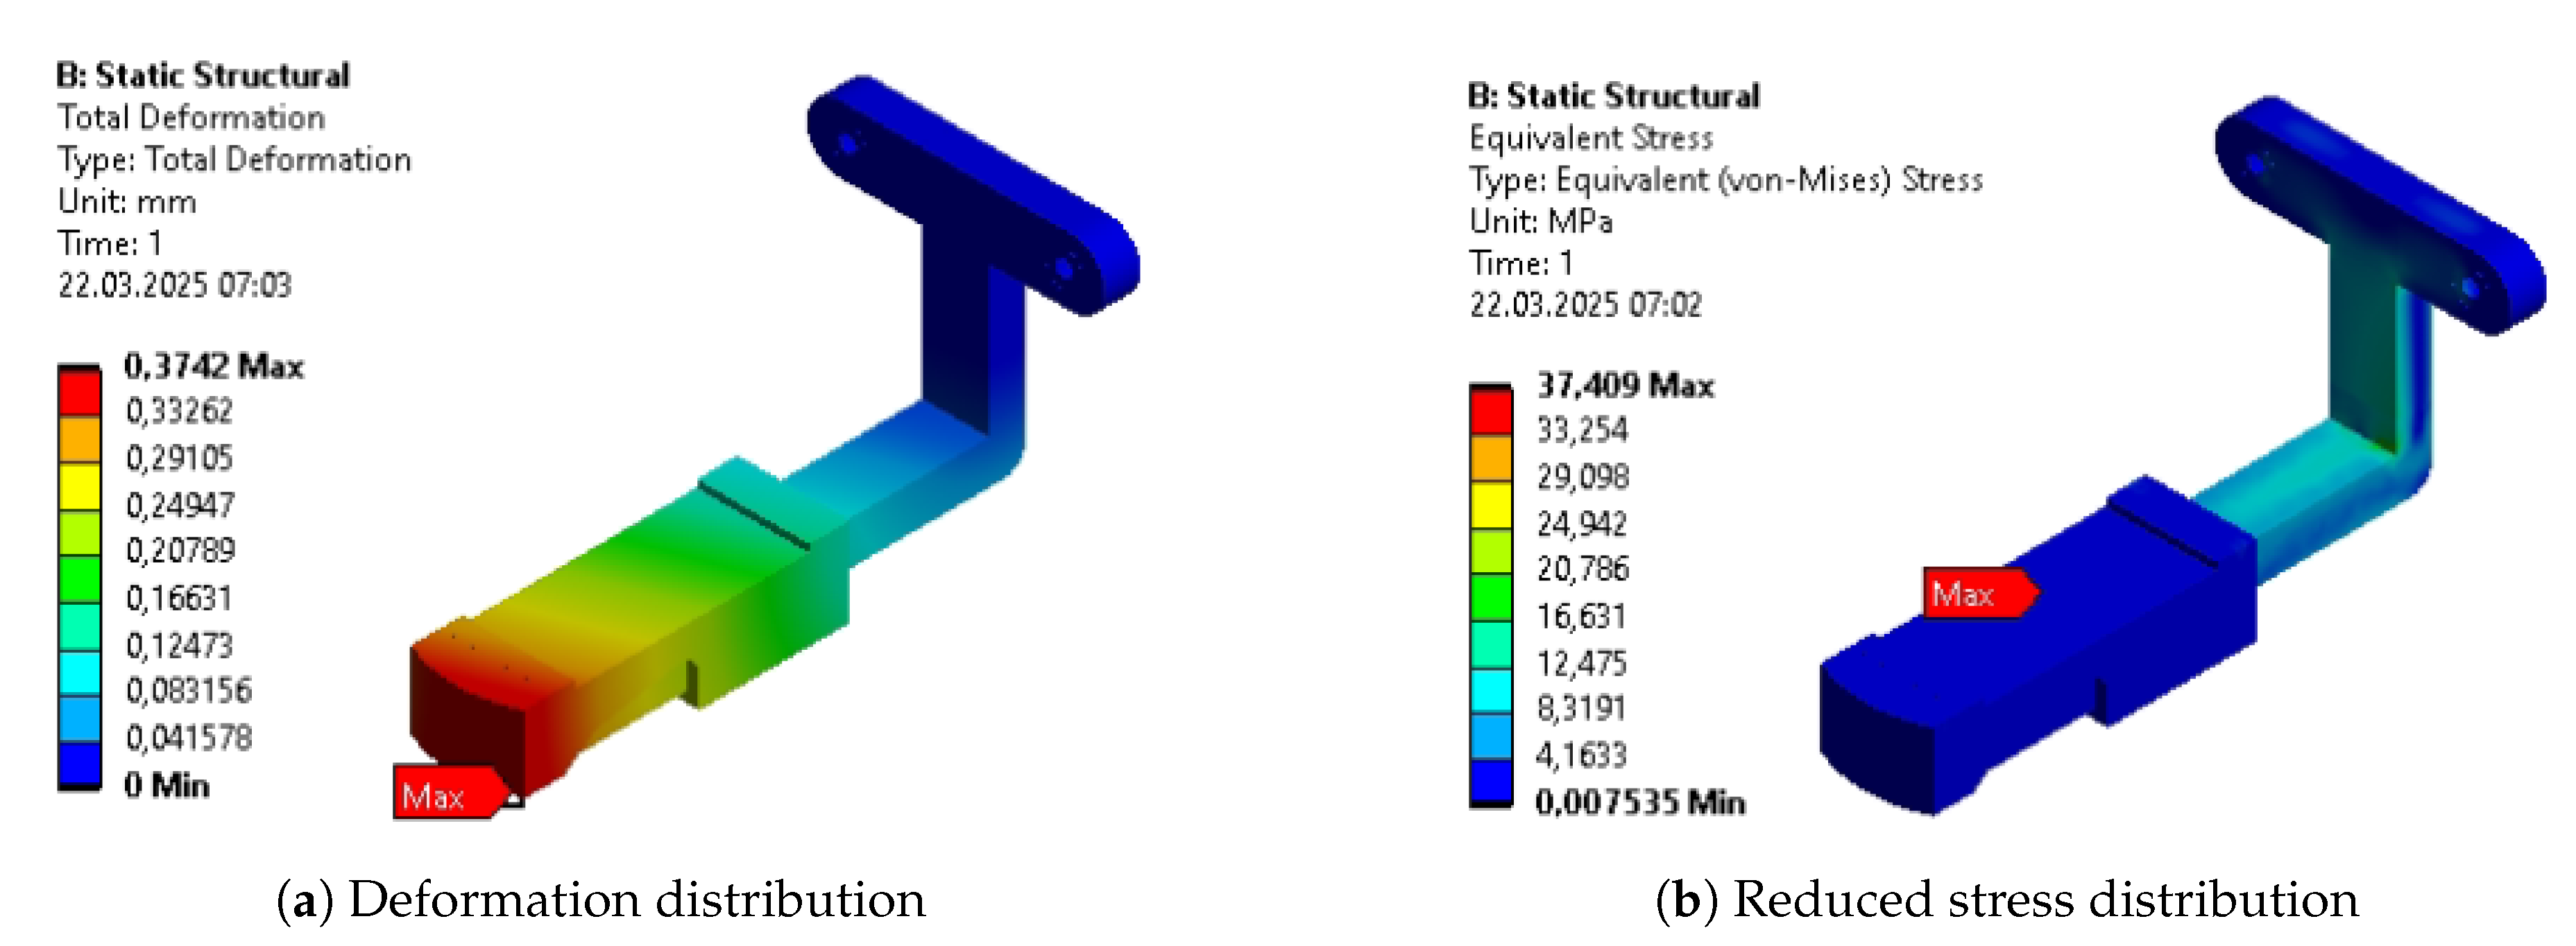
Initial strength analyses were performed repeatedly due to a variety of explored design adjustments. Similar initial errors have been encountered across different bodies. These included the four-bolt connections for revolving joints, as shown by the example in Figure 5. The geometry was modified to prevent exceeding the material’s tensile ultimate strength by internal stress.
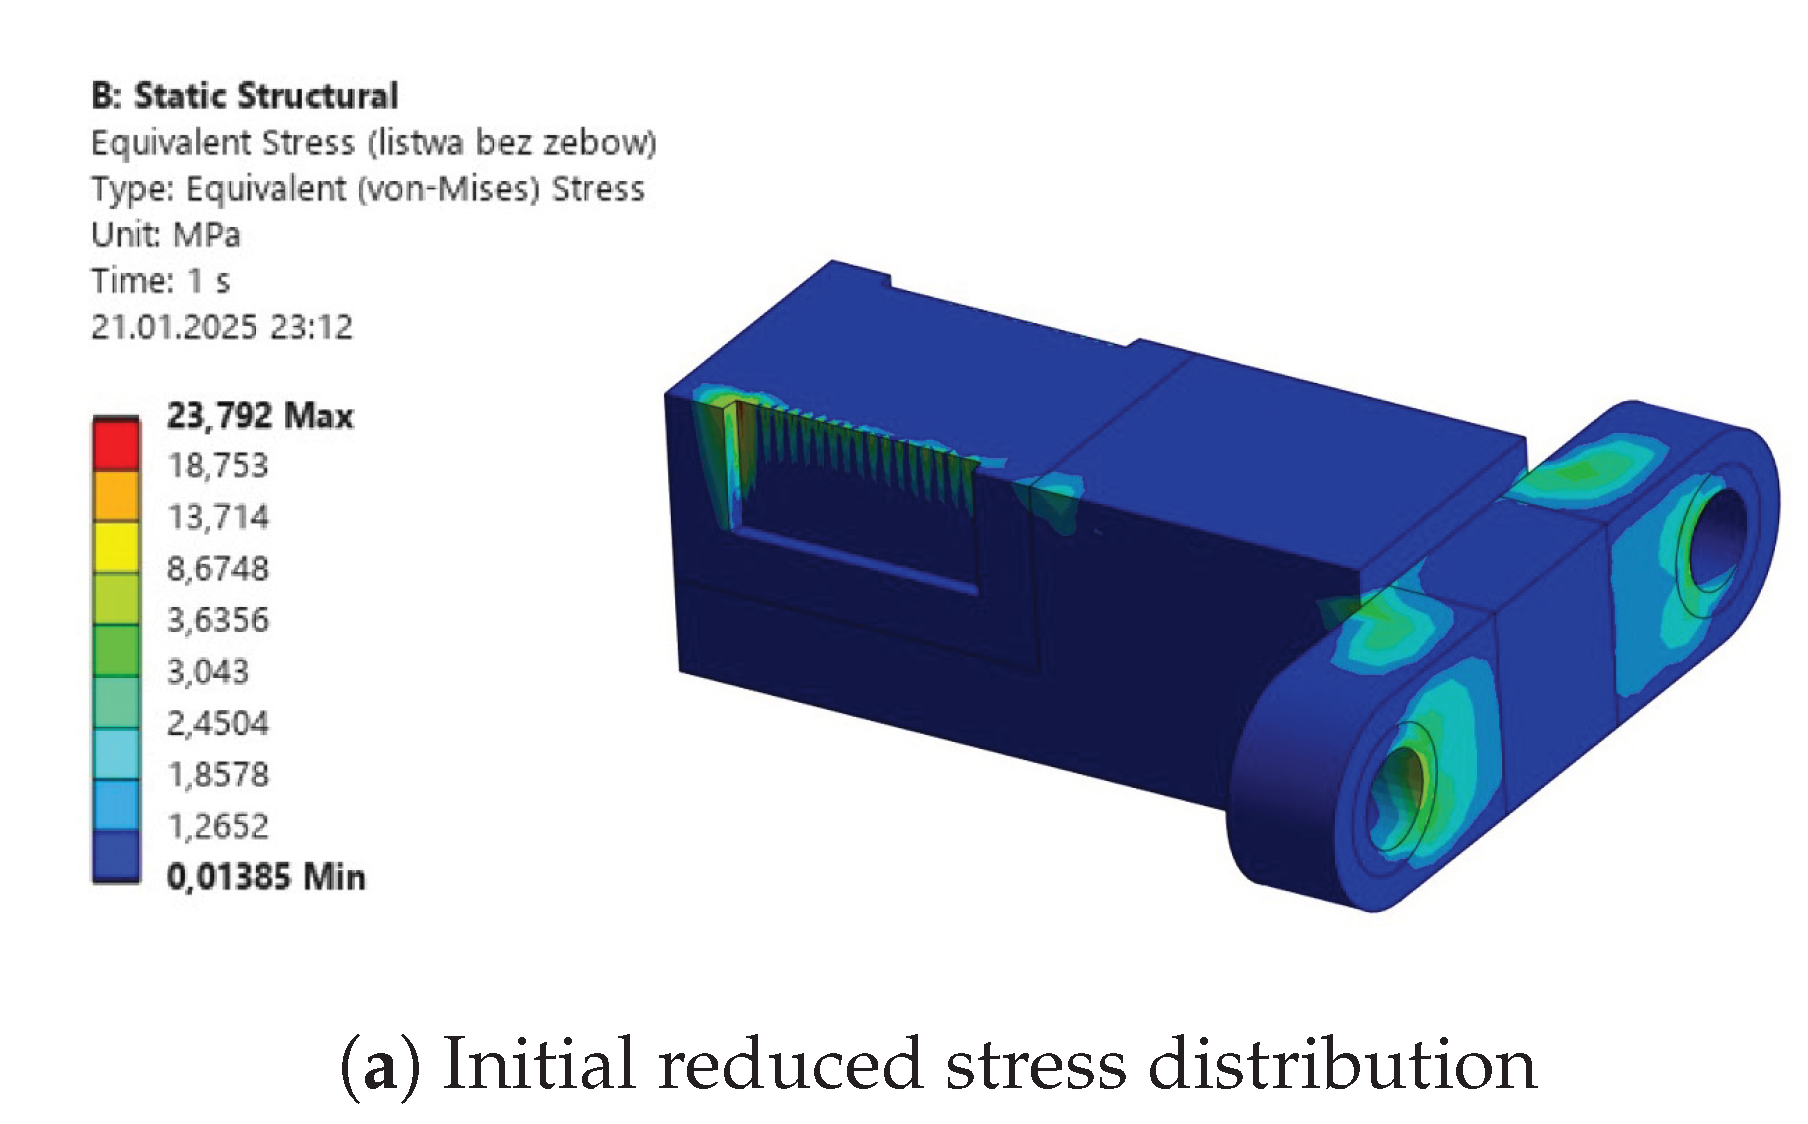
Another considered design utilized a key connection. It was tested during the initial phases of the project. However, the analysis also resulted in excessive stress values across the key and surrounding areas of the optimized part Figute 6. Furthermore, due to the size of the shaft, a multi-slot connection was difficult to implement.
The final connection designed and tested for the part was a hexagon shaft-based, fitted connection. The analysis of this design brought satisfactory results in terms of stress.
Apart from the bodies used for power transmission, the deformation of the overall initial design was also problematic. Only after a change of material from polymer to aluminum was the expected design intent met. Before the adjustment of material, a high value of initial deformation (above 10 mm) was observed in the model (see Figure 7).
4.3. Strength Analysis
The results of the initial strength analysis are presented in Table 4 and Figure A18 - Figure A22. As mentioned before, these were assigned with an aluminum isotropic material for the main constructional bodies of the exoskeleton. However, some elements such as sliding bearings were assigned with nylon or brass, and the rotational shafts were assigned with structural steel. The analysis has been repeated to explore alternative designs and ensure the feasibility of the proposed designs. In general, these maintained satisfying safety factor values, enabling further reliable parametric modification during the optimization process.
4.4. Parametrization
The first process of parametrization was based on setting dimensional parameters of critical segments of each body. They are illustrated along with their names and initial values in Figure A9. Their considered ranges are presented in Table A1.
Most of the ranges were chosen based on constraints from the close geometries and overall dimensions. Some of the parameters (e.g., P5) turned out to be more difficult to implement due to their significant impact on the element constraints, and affected the output parameters minimally. Therefore, they were considered constant for the optimization (their ranges were not presented in Table A1).
4.5. Parametric Optimization Method
Parametric optimization was based on a single objective function consisting of the strength analysis output parameters determined beforehand as the most important in terms of the parts’ feasibility. Function 3 considers mass being minimized, but also deformation to guarantee sufficient stiffness of the device, and stress to guarantee sufficient strength. Additionally, optimization constraints regarding maximum deformations and reduced stress are considered. A single goal function comprising three independent parameters was built to exclude human decision-making on the selected trade-off from parametric optimization. Therefore, the whole process can be run automatically.
The parameters in the formula stand for:
- m - Geometry Mass
- - Total Deformation Maximum
- - Maximum Stress
- a, b, c - Constant parameters determined for each part individually, based on initial relations between stress, mass, and deformation
The constant parameters selected for optimization may differ depending on the designer’s intentions. The values selected within this investigation experimentally to give the mass reduction a significant impact, while maintaining internal stress and displacements at approximately 10% of the total impact each.
Nonlinear Programming by Quadratic Lagrangian Algorithm (NLPQL) is a gradient-based optimization method chosen for the optimization process. Since a global scan of the design space was previously done using Sensitivity Analysis, there was virtually no risk of being subject to a local minimum, and NLPQL could be chosen as the most suitable method for tackling these particular cases. The NLPQL’s desired accuracy was set to 0.005, differential scheme was set to central, and the differentiation step size was set to 0.001. Maximum number of solver runs was limited to 1000.
Additionally, some constraints were added to the optimization process, such as the minimum acceptable value of the safety factor or correlations between some of the parameters, which ensure the integrity of the design.
4.6. Results
The resultant parameters of the initial parametric optimization were assigned to the design and validated with repeated static structural analysis. The results of this validation are presented in Table 5 and Figure A23 - Figure A26. The average values of stress and deformation are much lower than allowed for the design. Moreover, within the whole volume of the exoskeleton, the safety factor remains above 5.
5. Topology Optimization
The exported models were transferred to new projects, and the static structural analysis was repeated. The greatest difference between this and the previous stage was the requirements for the mesh. This time, tetrahedral elements were prioritized, since they are more suitable for topology optimization (TO). The mesh was also denser, so the optimization tool was allowed to remove the material in smaller portions. This leads the resulting geometry to be smoother and more relevant to reality.
The raw .stl files, regardless of their quality, were not suitable input for the static structural analysis. Therefore, to perform validation calculations, the resulting models were used as a reference while recreating geometries and extracting features acquired by the parts to incorporate them into the original models.
5.1. FEM Models
The models were meshed into smaller elements as described before. The parameters of the obtained result are summarized in the Table 6.
One of the main concerns of topological optimization is retaining previously established functionality in the resulting model. Hence, some regions of the parts are excluded from the analysis. In figure A11, all excluded areas are marked red, while regions undergoing the process are blue. Some geometric features, such as teeth in the fifth body in subfigure A11(f), were excluded and treated as separate bodies. Therefore, they were not colored red or blue but remained with default coloring (grey).
As aforementioned, most of the excluded regions were dictated by the goal of retaining the
original functionality of the parts. Those regions can be seen in subfigures A11(b) and A11(e), where
the inner faces of the ring segment were marked because they are working in contact with sliding
sleeves and have to provide constant support. Since its geometry is necessary for the connection, the
slots for the shaft in the upper segment of the first, second, and fourth parts (subfigures A11(a), A11(b),
and A11(e)) had to be excluded as well.
The main objective of the whole process is to reduce the mass of the segments. However, additional, less prioritized objectives of compliance and maximal accepted stress were added to the simulations. This ensures that a certain strength threshold is not exceeded for the parts. Another additional constraint regarding manufacturing was added to guarantee the part’s symmetry along the central plane for some regions of the parts, such as the lower round plains in subfigure A11(b) and A11(e). This restricts the possibility of removing half of the existing geometry, jeopardizing its ultimate functionality due to the asymmetrical loads. This assumes that the device can be used for both extremities.
Moreover, as the parts were manufactured with selective laser sintering additive technology [35], minimal wall widths of 1.5 mm were required. Such a manufacturing constraint was added to this optimization stage, with the exception of accepting 0.6 mm at the locking teeth edges. At the later stages, this criterion was also validated during manual post-processing of the design.
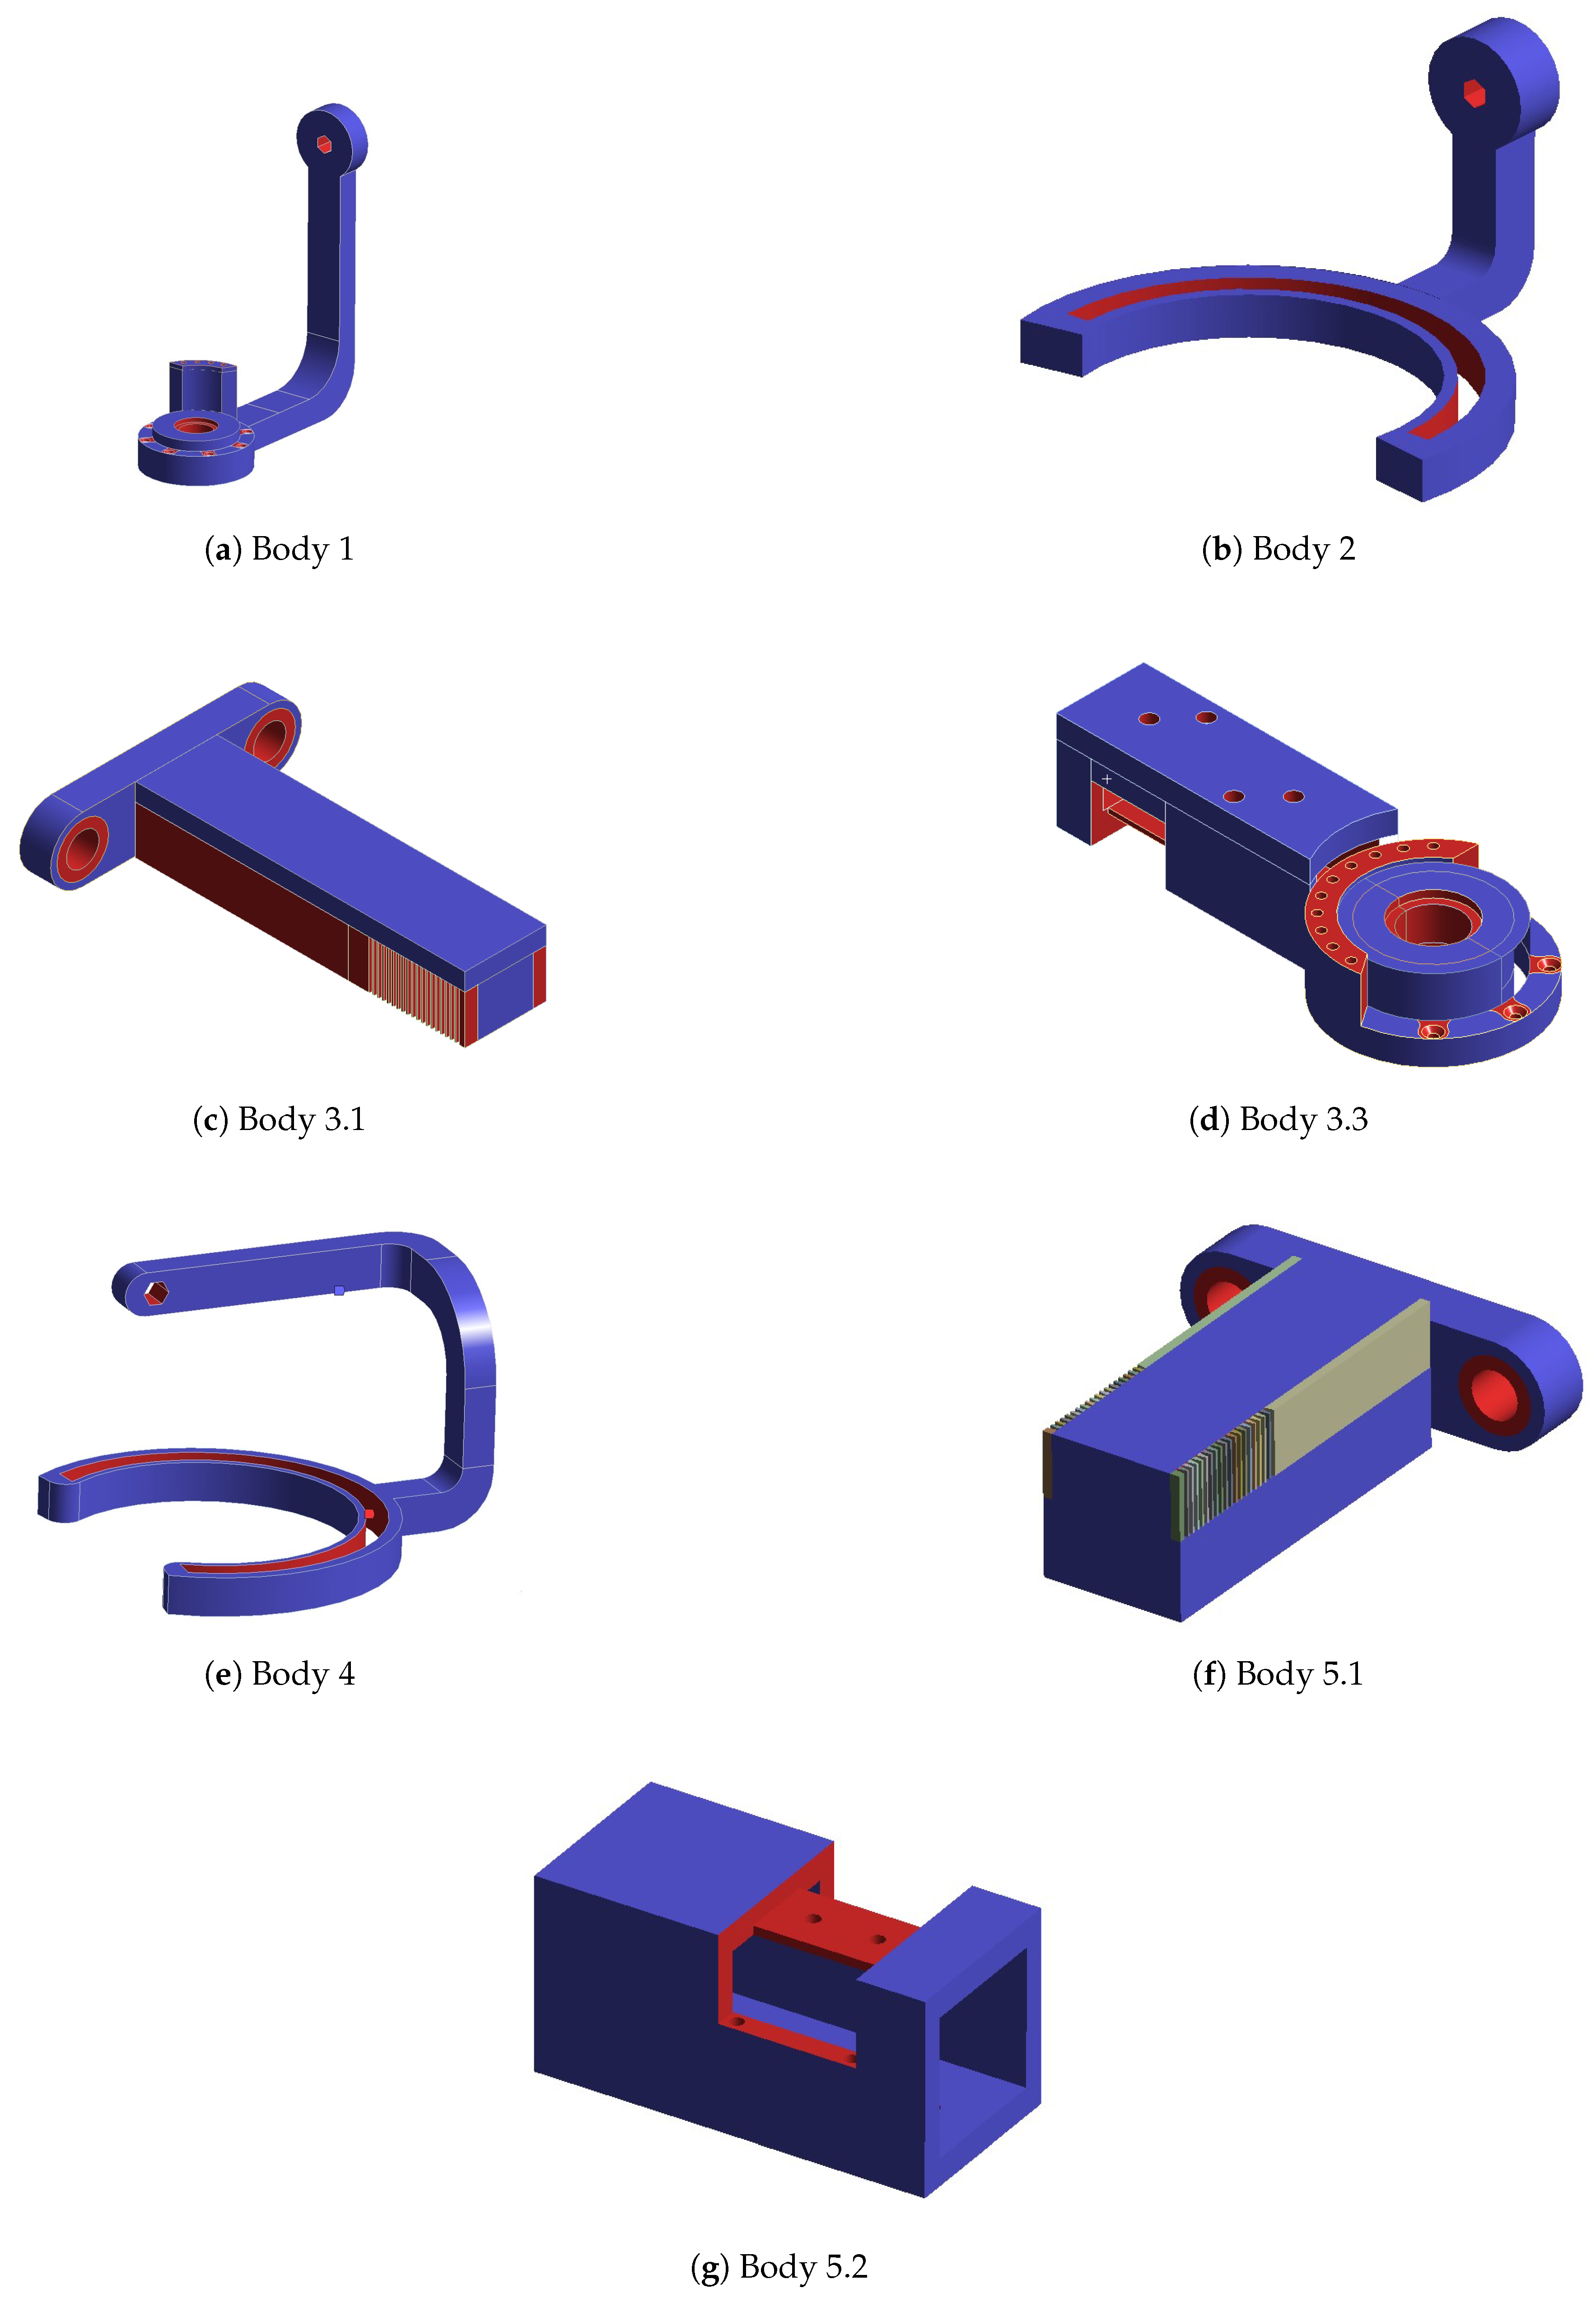
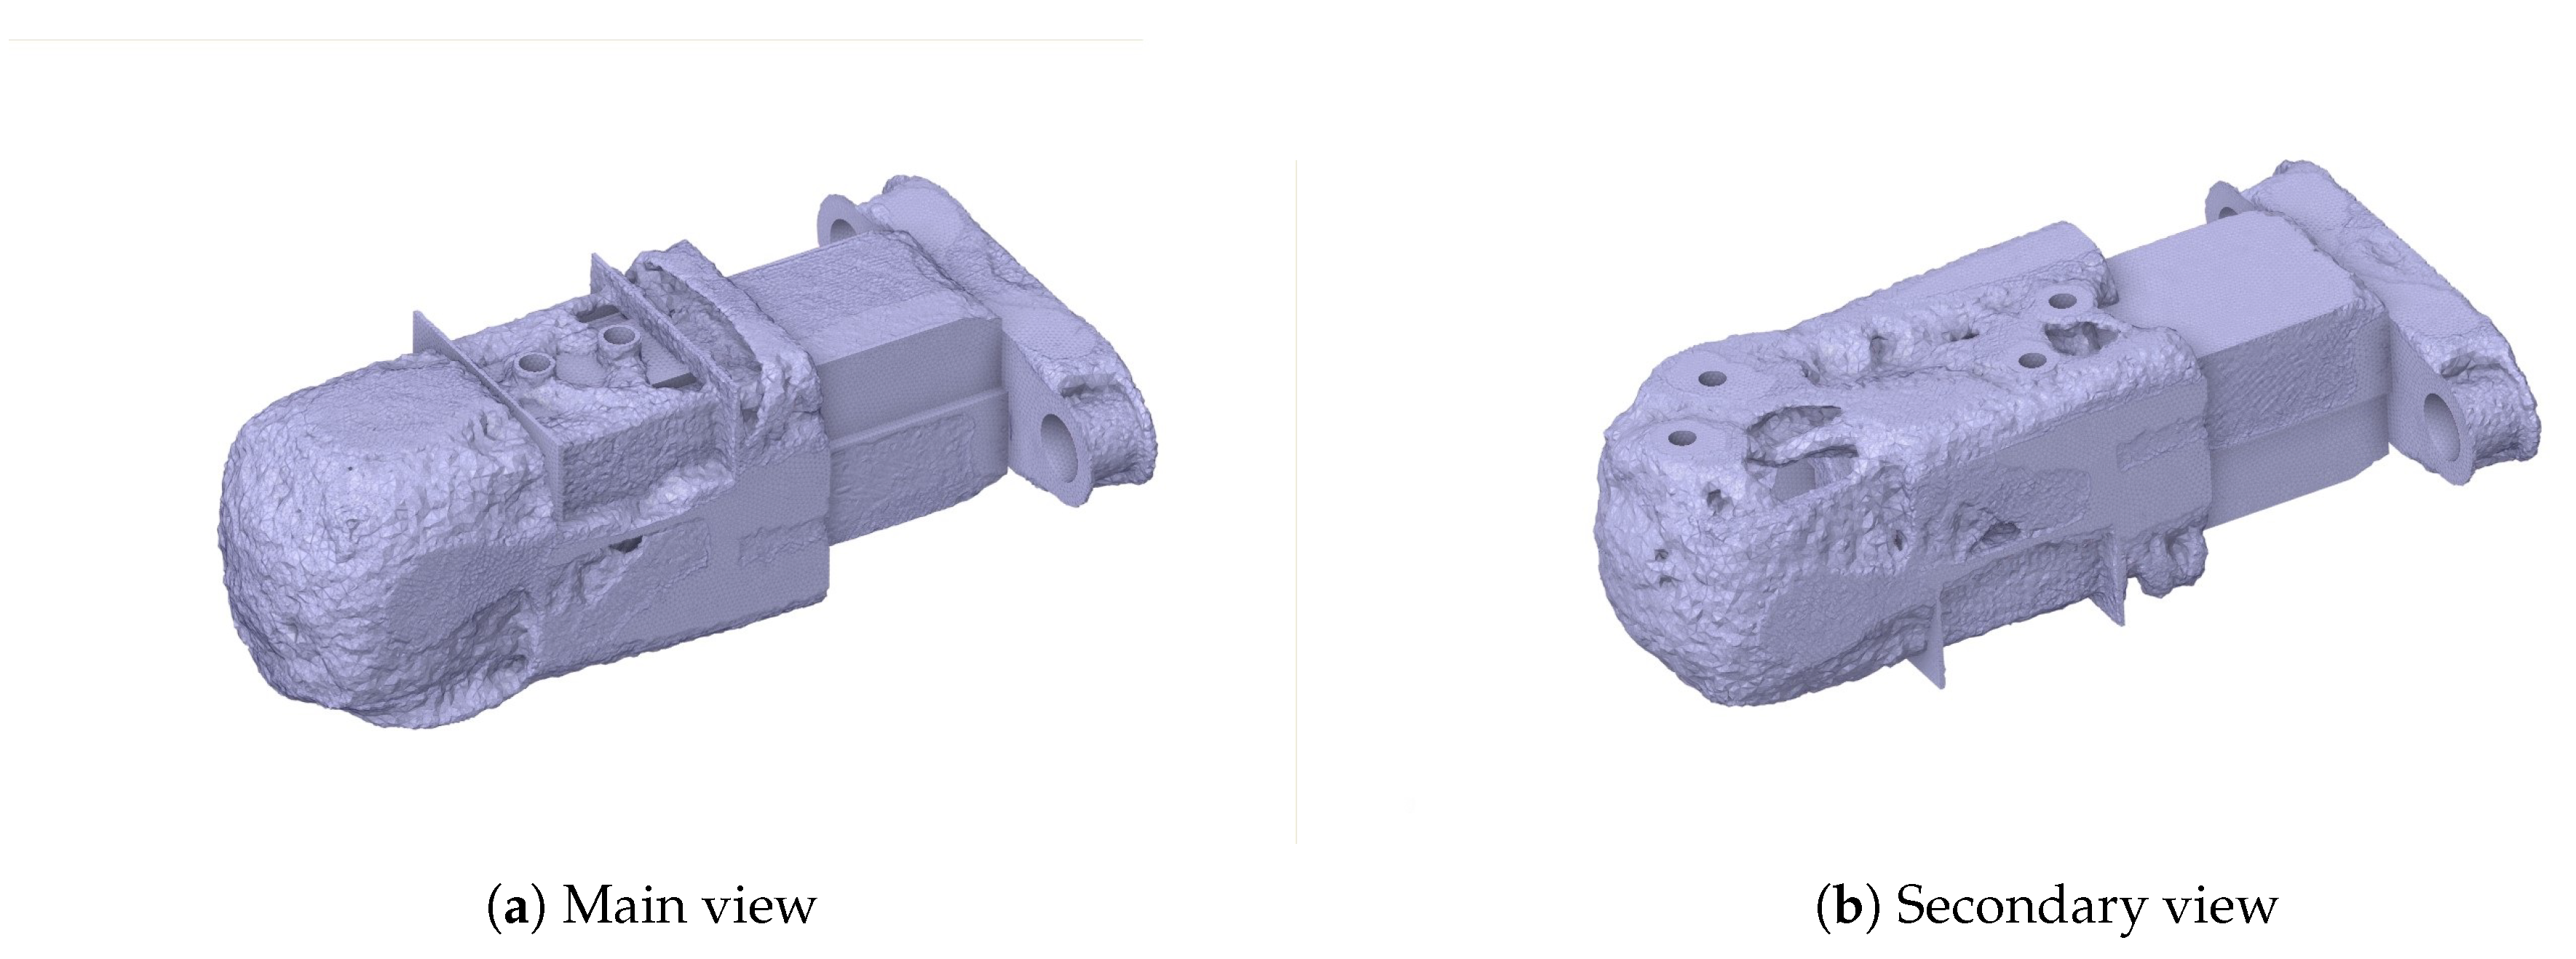
After optimization was performed, all results were exported as raw .stl files. They were then processed using SpaceClaim tools to repair corrupted regions to acquire results depicted in Figure A12 - Figure A17. Those were used as model geometries during the creation of succeeding solids.
5.2. Extracted Features
The mesh grids resulting from topology optimization formed the basis for extracting new features for parts’ designs. These were added to the designs, modified according to small functional modifications (including aligning bodies’ external surfaces in the base position of the exoskeleton or adjusting to assembling rotary encoders). These features are described below with the graphical representation compared with the results from Figure A12-Figure A17.
Body 1 was modified only in the area near the distal joint (see Figure 8a and compare with Figure A12). The joint plate was shaped in a way that reflected the shape of a motor attachment surface (A). Moreover, the inner slot for a bearing was surrounded by the constructional slot (B), reducing mass.
Body 2 had significant modifications in two regions (see Figure 8(b) and compare with Figure A13). A longitudinal slot (A) was placed along the link, and the topology changes were applied in the region of a free-rotation sliding flange. These changes include thinning the internal cylindrical surface (B) combined with adding a full-width chamfer (C) and removing material from the external area within the set angular range (D). Even though a small material removal appeared in topology optimization next to the connection of a link with a flange (see Figure A13), this feature was omitted in the adjusted design (E) as not change mass significantly and made the potential design harder to keep clean.
Body 3 was the most modified part of the design. The body 3.1 (see Figure 8(c) and compare with Figure A14) was changed in shape due to the functional requirement (A). Then, a hole (B) was added along its long axis according to the material removal tendency from the optimization. The material reduction from the top face (C) was not considered in the feature extraction process, as it could have hindered placing body 3.1 within a slot of body 3.2.
Nevertheless, body 3.2 (see Figure 8(d) and compare with Figure A15) has undergone even more modifications. Alike body 1, its distal joint plate was modified with fitting to the motor shape (A) and a cylindrical slot (B. However, it was strengthened with a rib (C) in its main plane. The external faces of the sleeve for body 3.1 were significantly thinned (D) - only the areas for attaching the extremity brace (E) and two constructional ribs (F) next to the blockade slot remained. Furthermore, the placement of the brace was slightly moved to enable the attachment of a three-axis force sensor to detect the intentions of a user for active therapy. Also, rectangular slots (G) were added symmetrically on the sides next to the blockade placement.
Analogically, body 2 and body 4 (see Figure 8(e) and compare with Figure A16) had the same modifications in the area of a flange (A-C). However, it had significantly more modifications along the bent link. This resulted in three cavities (D-F), making the segment similar to the thin-wall profile with the full cross-section in the bending corners. One of them (D is a slot starting from the corner and reaching to the next bending corner. The other two (E, F) were fully closed, as the removal of some mesh elements from the link edges (G) was ignored. Nevertheless, technological holes (H were added to enable the metal powder to be emptied after the SLS manufacturing of this component.
In the last part, body 5 had features similar to those extracted from body 3. The rod element (body 5.1, see Figure 8(f) and compare with Figure A17) was also prolonged and L-shaped (A), and the thru-hole (B) was added to its main part. The sleeve’s (body 5.2, see Figure 8(g) and compare with Figure A17) walls were thinned (A), besides the regions attached to the brace (B), which were also moved. Additionally, the distal face was rounded (C), and the additional slots (D) were added symmetrically on the sides to minimize the mass.
This stage was critical for adjusting the results of topology optimization for manufacturing while keeping them safe and functional.
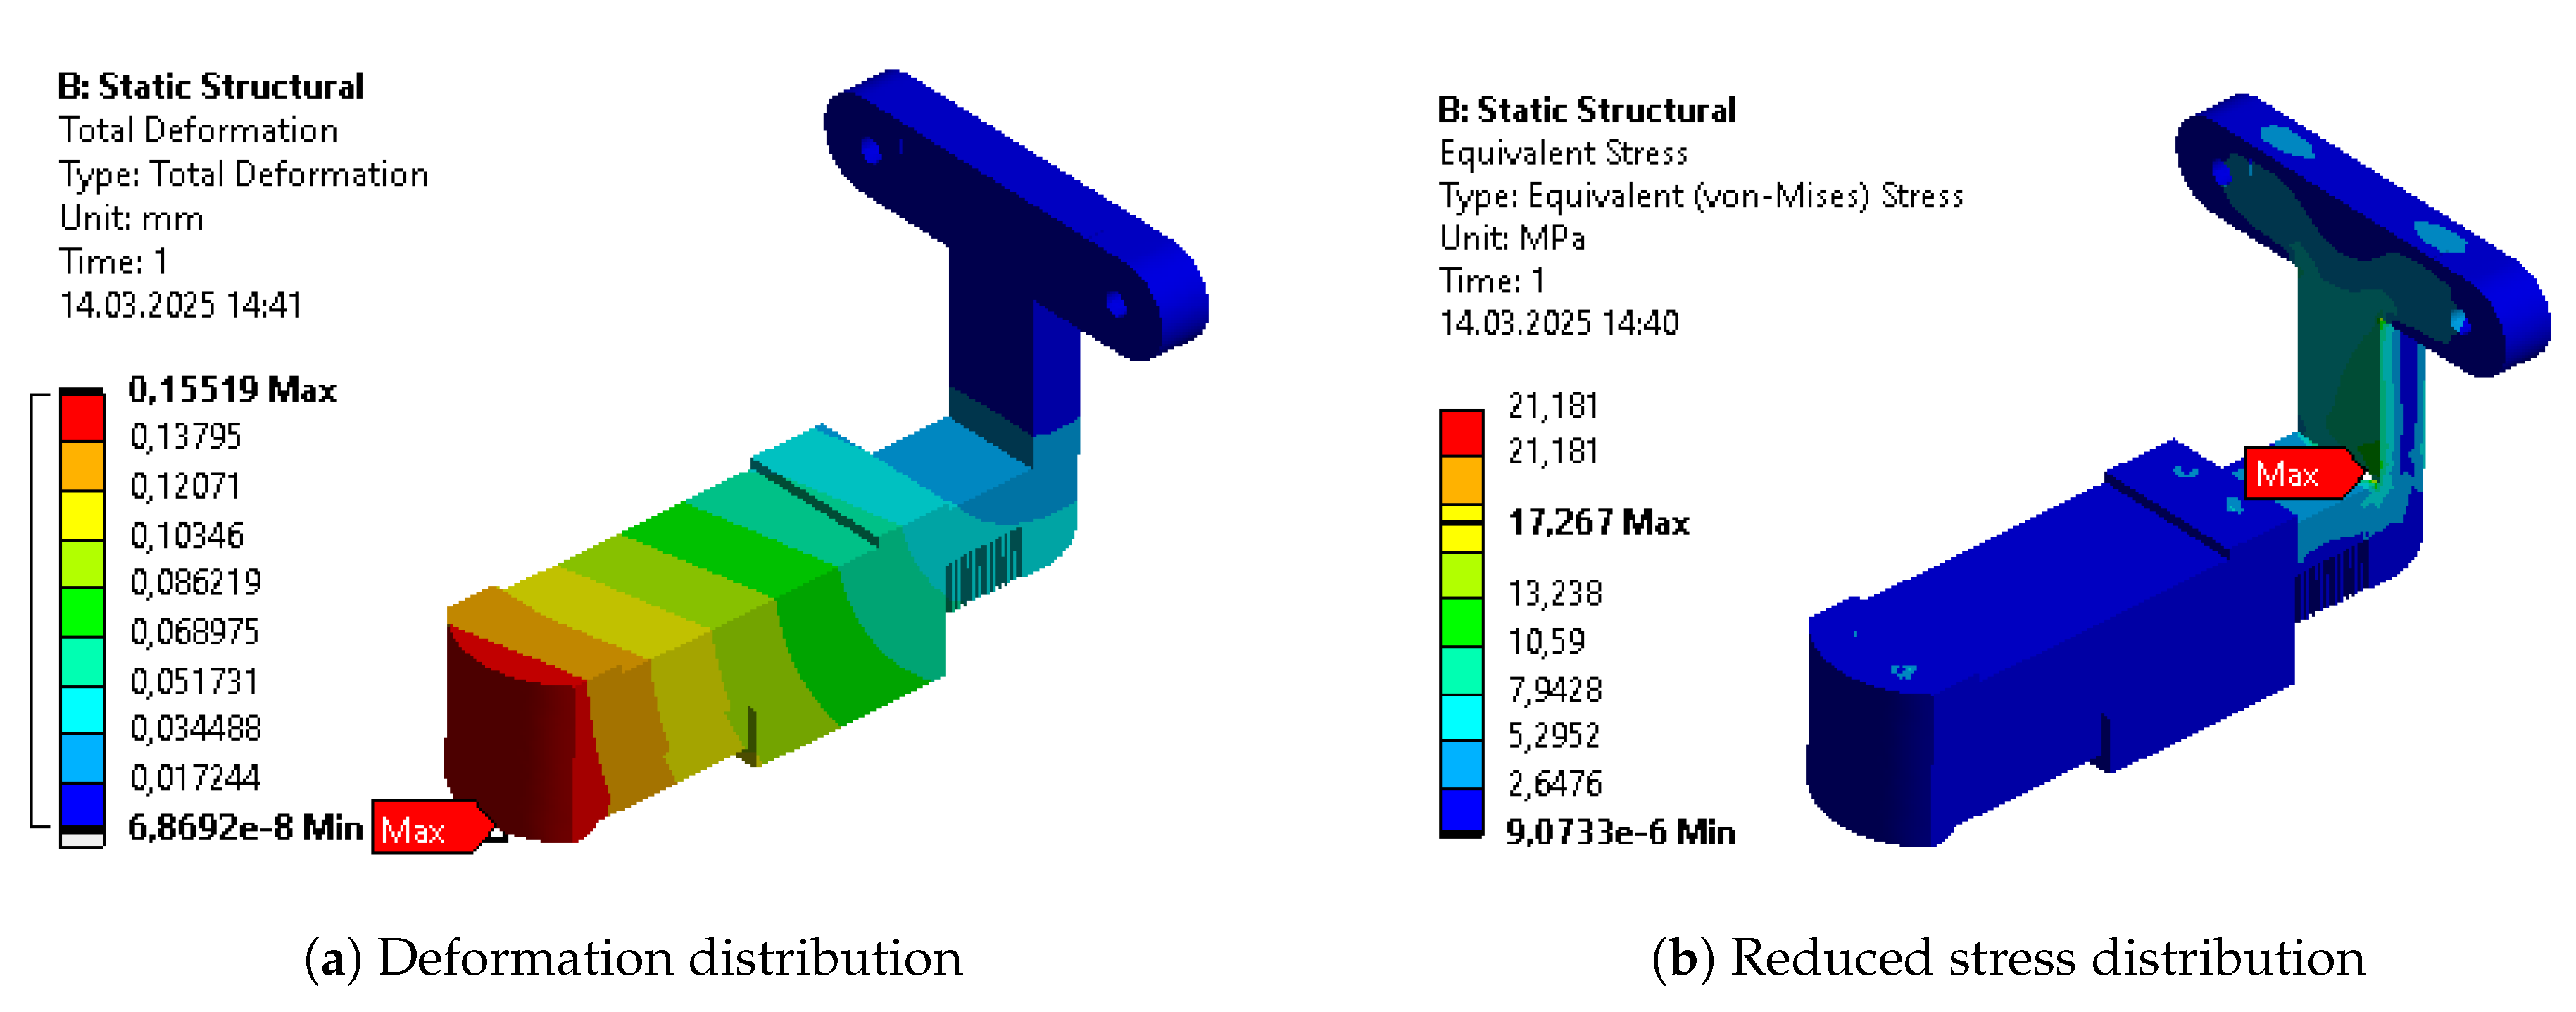
5.3. Results
The design after features extraction was validated in terms of its internal stresses, strains, deformation, and the minimal safety factor in the whole structure. They had the same constraints and loads applied to them as in previous versions and were validated before proceeding to the final optimization. Due to some functionality issues with Body 4 (see Figure A31), its geometry was additionally modified in terms of functionality, which required adding material in the process. As a result, its mass is slightly greater than in the previous step, despite being subjected to the optimization process.
The design met the predefined success criteria. Therefore, it was further parametrically optimized with a strong focus on new topologies.

Table 7.
Validation of topology optimization resultant geometries.
| Parameter | Body 1 | Body 2 | Body 3 | Body 4 | Body 5 |
|---|---|---|---|---|---|
| Mass [kg] | 0.469 | 0.443 | 0.552 | 0.483 | 0.252 |
| Max. Deformation [mm] | 1.82 | 0.69 | 0.95 | 1.99 | 0.15 |
| Avg. Deformation [mm] | 0.94 | 0.28 | 0.39 | 0.70 | 0.07 |
| Max. Stress [MPa] | 86.04 | 36.96 | 107.55 | 28.78 | 17.27 |
| Avg. Stress [MPa] | 6.78 | 3.69 | 3.67 | 4.52 | 0.70 |
| Max. Strain [‰] | 2.5290 | 0.5303 | 1.8078 | 0.4113 | 0.2502 |
| Avg. Strain [‰] | 0.1102 | 0.0540 | 0.0554 | 0.0655 | 0.0113 |
| Min. Safety Factor | 2.67 | 6.22 | 2.60 | 7.98 | 15.0 |
6. Final Parametric Optimization
6.1. FEM Models
For the final parametric optimization, the mesh grid for each of the parts has again been generated. The focus was similar to the first parametric optimization - to obtain as many hexagonal elements as possible while maintaining the acceptable quality of the mesh. The latter part proved problematic since geometry, previously simple and lacking in any distinguishing features, turned into more complicated and non-smooth. The parameters of the final mesh for each part are presented in Table 8.
6.2. Parametrization
Table A2 presents the parameters introduced to the models after the extraction of features. They were depicted in figures A10(a)-A32(b).. The majority of them are directly connected to those new features, while some are analogous to the ones from initial parametric optimization. Nevertheless, dependencies between dimensional and feature-related parameters were additionally considered.
6.3. Results
The whole optimization process was performed with the same methodology (including constraints, contacts, loads, and solver settings) as within the initial parametric optimization. Figures
A33(a)-A37(b) show the resulting deformation and reduced stress distribution in the analyzed parts. Table 9 presents the actual values of the output parameters analyzed in the simulation. In some cases, due to additional functionality requirements, minor modifications were added to the dimensions/topology of the elements. Those changes affected the masses of the models.
7. Discussion
The optimization cycle consisted of three main steps. Within all of them, the optimal result was being find between 199 and 1000 iterations, more correlating to the component’s geometry than the step of optimization. Initial parametric optimization was intended to find the general quasi-optimal dimensions and materials. It resulted in the most significant mass reduction among all of the analyzed bodies. Along with this, it increased the average internal stress, strain, and deformation of the objects. Nevertheless, their values remained significantly below limits for selected materials and even increased a minimal safety factor to 4.94. The following topology optimization targeted changes in the components’ dimensions. Thanks to this, the most loaded regions remained solid, while the material was removed from the others. This brought further mass reduction. Nevertheless, the safety factor still remained above the acceptable 1.3 threshold and got a value of 2.6. The last parametric optimization enabled the final fine mass reduction by adjusting the parameters of new features of the design. The other parameters did not vary significantly, and the final safety factor reached a level of 2.52. The total mass of the design of main constructional bodies decreased by almost 50%, even though the functional modifications increasing the components’ volume were applied before the last parametric optimization. The total mass of the exoskeleton, including motors, mounting components, and sensors was reduced by 29%.
The results are slightly favorable compared to the single-method optimization presented in the literature for similar devices. Studies typically remain a safety factor at the level 1.1-1.33 to reach 28-49% mass reduction of constructional elements [23,36,37]. This includes topology optimization only or parametric lattice optimization. On the contrary, the study that reaches the highest safety level (5.9), important for the medical devices, results in a 43% mass decrease[38].
The optimization results at every stage are presented for separate bodies in Table A3-Table A7, while the results for the whole assembly are in Table 10. The columns represent results for the initial design (INITIAL), after initial parametric optimization (PO 1), after topology optimization (TO), and after second parametric optimization (PO 2), respectively. Internal stress values are presented for the reduced Von-Mises’ average stress.
As aforementioned, the first parametric optimization had the greatest contribution to the overall mass reduction. The reduction of each individual segment varied from 10% to 50%, while the whole design weight decreased by more than 30% in the complete process. The average values of stress, strain, and deformation increased as expected. Each of these average outputs experienced growth that exceeded 30% of their initial values, with the average deformation almost doubling. The reduction of the mass was the most significant at the stage of initial parametric optimization. However, the stages of a complete process affected the parts unevenly. Some benefited greatly, while others experienced only minor changes.
The topological optimization has reduced the total mass by a little over 11% compared to its initial value and 17% compared to the mass from the previous step. The individual mass reduction of each of the segments varied from -15% to 35 % compared to the previous iteration. The negative reduction is caused by the addition of functional features, which required slightly more material than in previous iterations. It is worth noticing that the distribution of stress, deformation, and strain, measured by their average values, progressed almost as much as after the first parametric optimization.
The final design, determined by the second parametric optimization, has brought the total mass down by only about 5% compared to its initial value and a little under 10% compared to its mass after the topological optimization. Although contributing very little, compared to the previous stages, it is important to remember that the lower the mass of the exoskeleton, the harder it is to further optimize. The highest percentage of mass any individual segment lost in the entire process is almost 60%, while the lowest is around 40%.
Some of the most vulnerable points in newly acquired geometries are, naturally, regions around the bends of the links. They are highlighted in the initial strength analysis and remain as regions of stress concentration throughout the whole optimization process. Other regions, visible as the most vulnerable across the validation results, are fitted connections to the polygonal shaft of the rotational joints and the bolted connections to the motor mount in Bodies 1 and 3. Moreover, the features introduced based on topological optimization created additional areas of high accumulated stress. Finally, Body 1 has relatively high stress across the whole length of its arm, similar to the newly hollow upper part of Body 4.
The multistep optimization process with hybrid methods enabled significant mass reduction while meeting the strength criteria under real-life loads. However, the presented methods could still have been improved. These could involve different material models, optimization methods, or different orders from the methodology just presented. The parametric optimization process, although enforced by sensitivity analysis, might benefit from trying multiobjective optimization to better control the increased maximum values of stress and deformation. Different orders of the optimization types might result in a greater reduction of the mass or a more even influence over it between individual stages.
The changes in the design lowered its total mass and moments of inertia. These did not affect the device’s stiffness significantly, nor did they reach the elastic deformation region. Therefore, the therapy will be realized safely for the patients, and it is not expected to result in visible vibrations.
As assumed, modifications of the exoskeleton bodies brought a need for additive manufacturing. Within the research project, it was intended. However, for practical hospital use, the SLS-manufactured surfaces have high roughness. Therefore, they may not comply with hygienic standards and can be more difficult to clean after contamination. Moreover, especially in Body 4, the internal cavities brought technological holes that needed to be enclosed for use. The situation is similar in the regions next to the rotation joints - the removals similar to the motors’ mounting plate shape hindered the potential enclosure of the joint required by the medical devices’ standards. However, all of the removed aluminum geometries can be easily filled with lightweight polymers.
On the contrary, material removal in the mentioned regions also introduced a positive impact on the cost of manufacturing. The costs of 3D-printing technologies strongly correlate with the amount of material used. After the procedure, the cost of laser sintering of aluminum is lower than the initial costs of the design manufactured subtractively. Moreover, the additive technology design does not require additional technological divisions of the links.
The presented technology can be used to personalize components easily. It focuses on a combination of strength analysis with motion dynamics simulations. Therefore, every component can be directly modified and validated in terms of its strength. Once it is done, it can be manufactured with the process obtainable in many cities without the need to prepare technical documentation for milling. For this reason, the robot designed to support different individuals can be individualized without constantly engaging professional mechanical designers.
Reducing the mass and inertia of the main construction parts is expected to directly decrease the joint torques that actuators must generate to track a given rehabilitation trajectory. This can improve actuation efficiency and reduce energy consumption for comparable assistance levels [39]. Moreover, studies on upper-body exoskeletons show that lightweight designs are perceived as more comfortable, enabling longer usage times, which are critical for effective neurorehabilitation [40].
The designed elements were manufactured from Aluminum in the SLS technique. The tests on the sintered material samples from the set printer proved the tensile properties corresponding to the ones known from literature [41]. Therefore, it was assumed that the simulation results reflect real-life parts.
The assembled device was then used for tests of intelligent algorithms controlling rehabilitation exoskeletons with participants. A group of 22 participants has undergone experimental trials of active therapy with both intelligent assist-as-needed support and active therapy with constant admittance of the system. The motions performed in the experiments reflected 12 activities of daily living, covering the entire range of participants’ joint motions and the possible joint velocities assumed to be performed by the system. Within the experiments, none of the 3D-printed parts were deformed plastically. Moreover, none of the rotary joint motions was hindered by excessive deformations within the experiments. Considering these, the design intents of the exoskeleton can be assumed to be met.
8. Conclusions
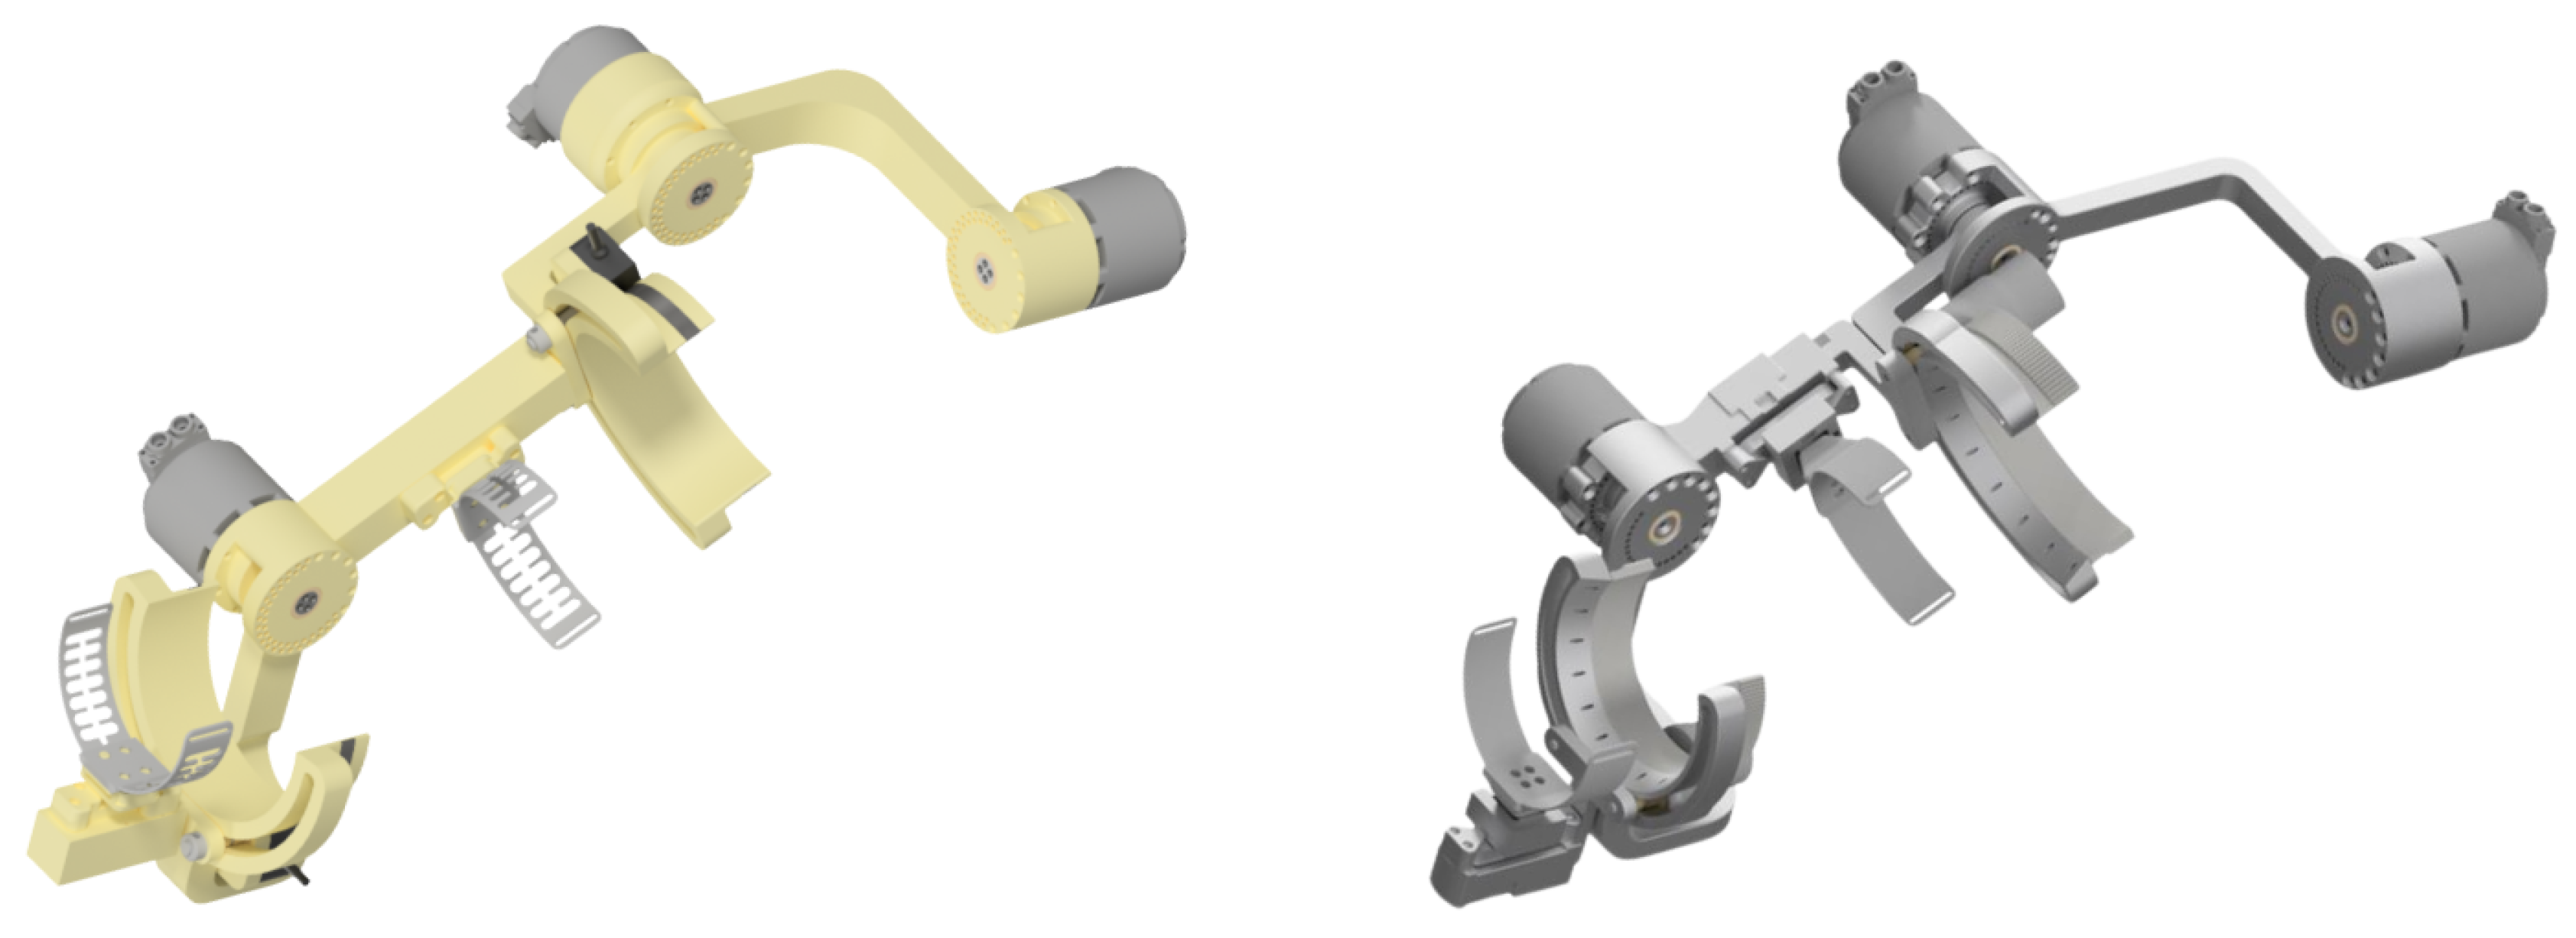
The declared study aims were fulfilled. The mass of the SmartEx-Home exoskeleton was minimized with the multistep FEM optimization. The procedure presented in this paper consisted of three subsequent optimization stages (parametric, topology, and parametric). Thanks to their application, the dimensional and material parameters were adjusted, new features were extracted, and the final design of the device was set. With the developed strategy, the total mass of the main components decreased by 49.1% (see comparison in Figure A38).
Combining real-life measured data with digital representations of the modeled objects resulted in lightweight and load-resistant structures for specific applications. This remained in line with the digital shadow technology (replicating real-life as a digital model) and the human-in-the-loop (involving measured human parameters in the engineering process - motions in this case) concept [42]. The use of such an approach allowed the design of the device to be durable to expected real-life use cases while not overly increasing its mass by assuming too high safety factors.
The novelty of the investigation lies in the application to devices that remain in physical contact with humans, based on measured real-life motions. Therefore, the methodology developed is applicable to all of the robot-aided systems for physiotherapy. The methodology of registering real-life motions of interaction with humans, designing multibody models for conducting dynamics simulations, and performing multistep FEM optimization can be used for any device collaborating with a human. These can include physiotherapy robots, assistive devices, or even cobots [43,44,45].
The design of the SmartEx-Home exoskeleton, presented as a case study for the developed methodology, was manufactured as a part of the research project. It is going to be adjusted for use while attached to the objects of daily living (e.g., a chair or a bed) or a dedicated movable platform. The exoskeleton will then be tested with human participants in terms of muscular activations within passive and active minimally supervised kinesiotherapy. Already, the functionality of the design has been validated functionally in terms of motion ranges and adjustment capabilities with a group of ten participants with different anatomy.
Acknowledgments
The paper is based on the results of the “Development of a universal and lightweight construction of rehabilitation exoskeleton with a control algorithm dedicated to remote, home and task-oriented rehabilitation” – SmartEx-Home project, financed in 2024-2026 (1,793,900 PLN), in the scope of scientific research and development works by the National Center for Research and Development (LIDER XIV, contract number LIDER14/0196/2023). The experiments were held within the KB/132/2024 approval of the Bioethical Committee of the Medical University of Warsaw.
Appendix A. Visuals of the Device Used in Different Positions
Figure A1.
Visual of using the exoskeleton in standing position.
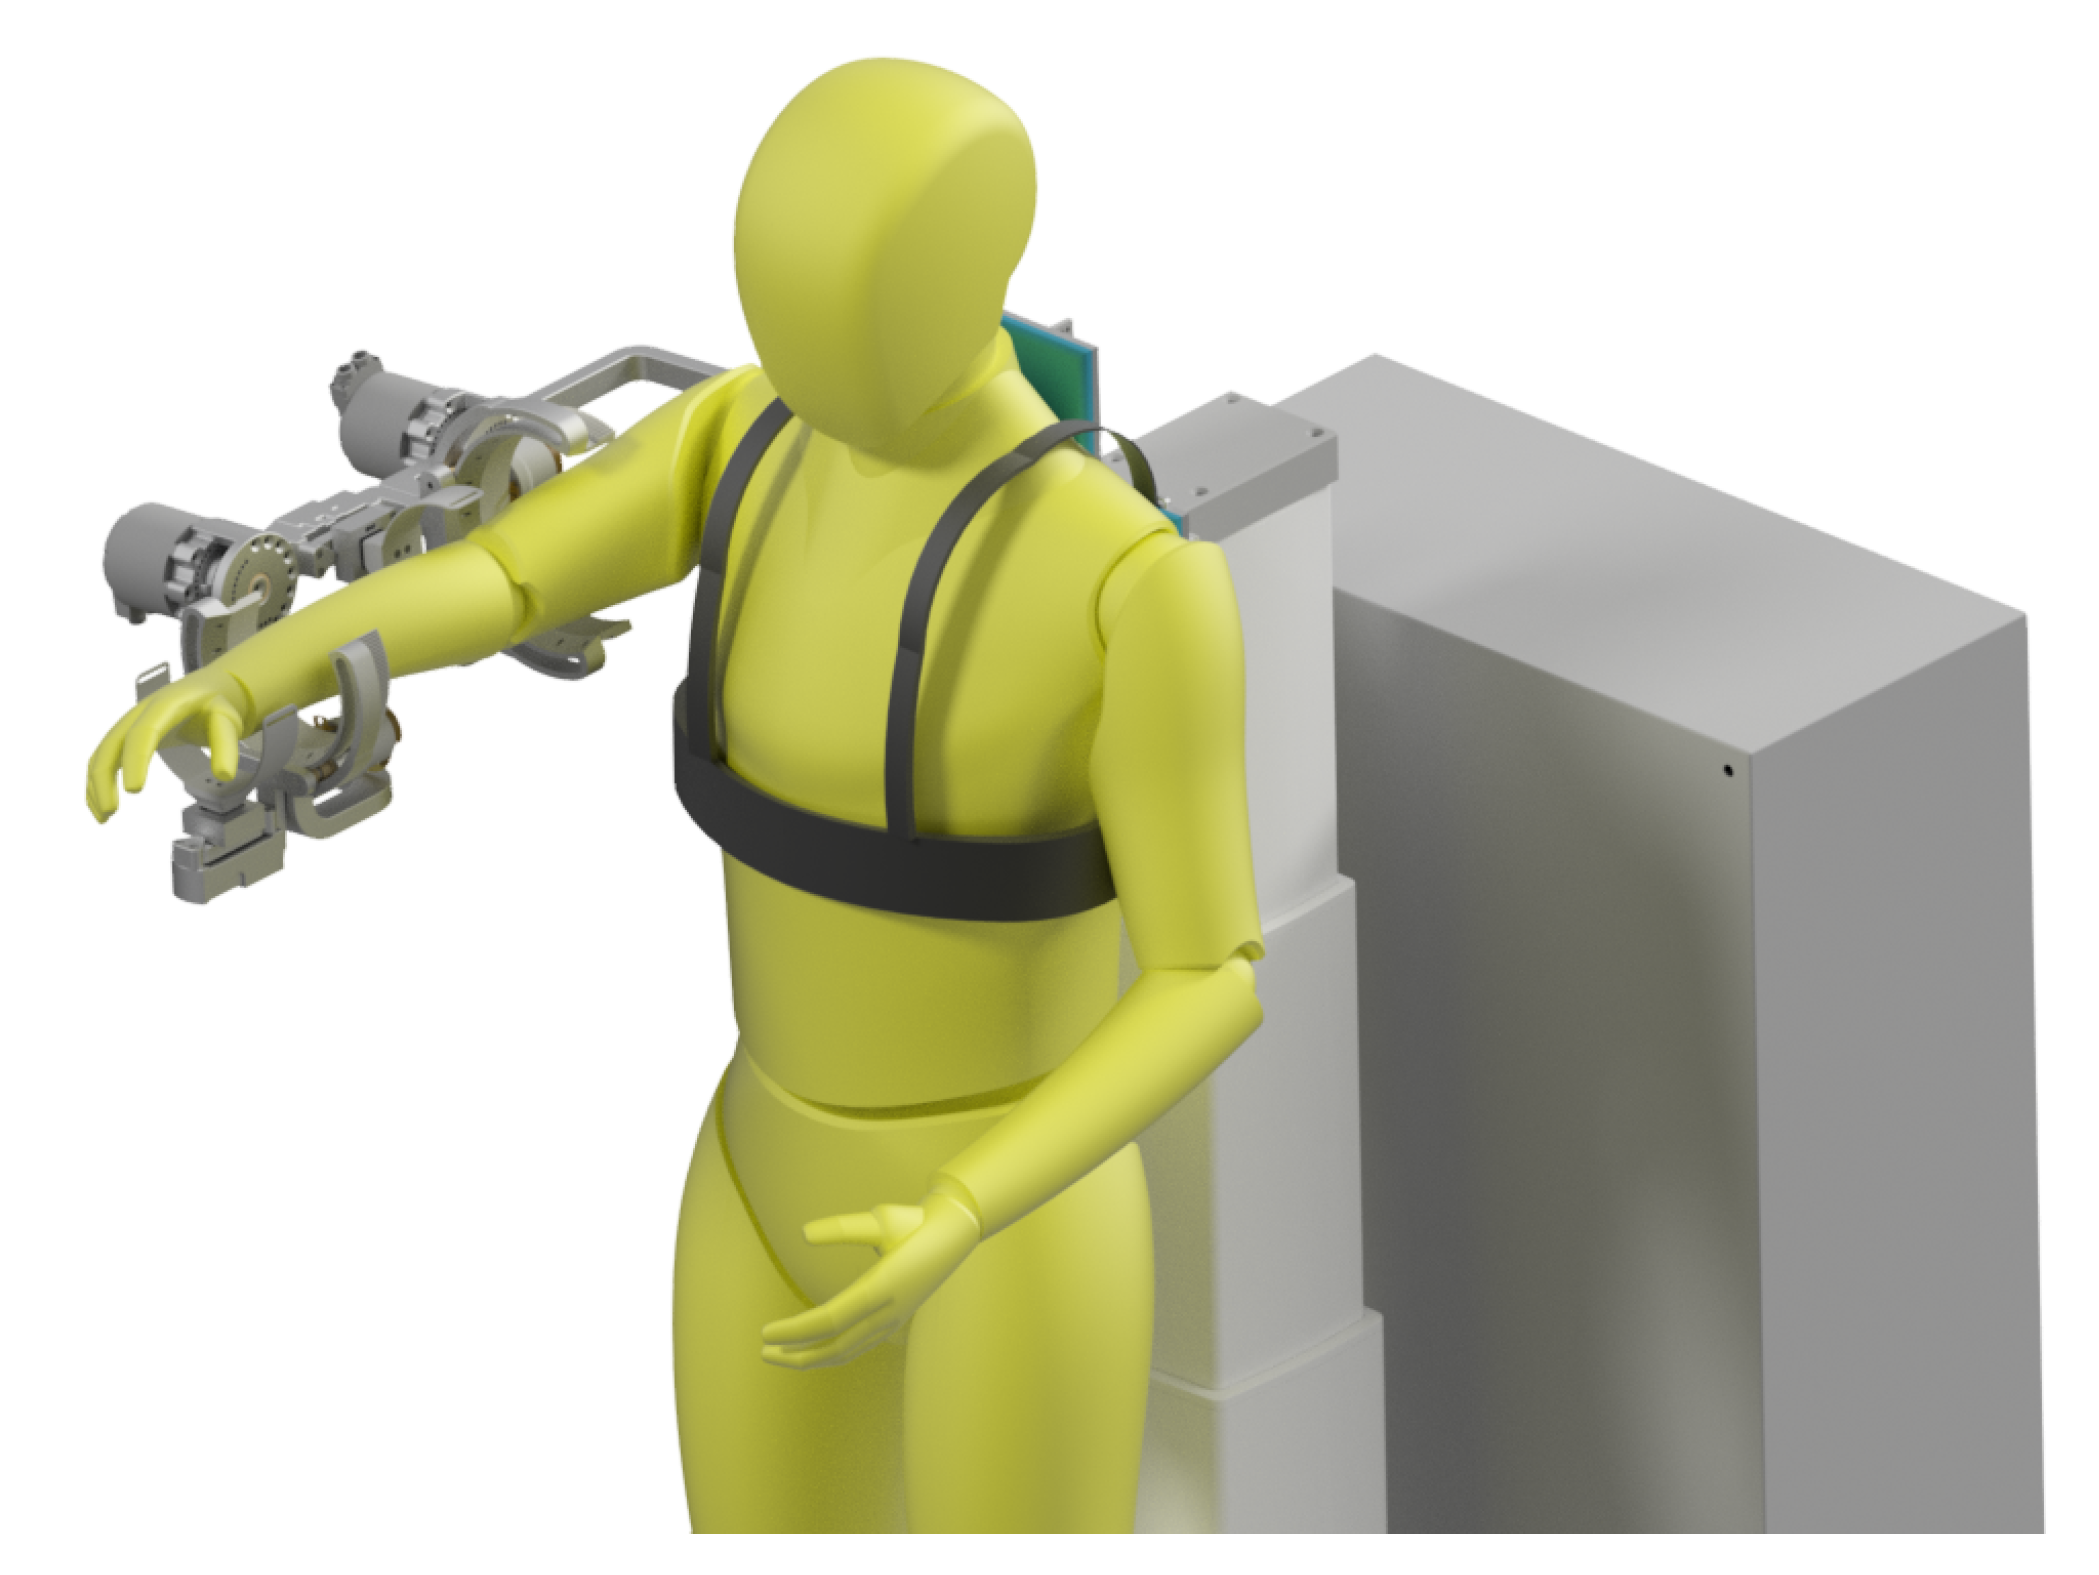
Figure A2.
Visual of using the exoskeleton in sitting position.
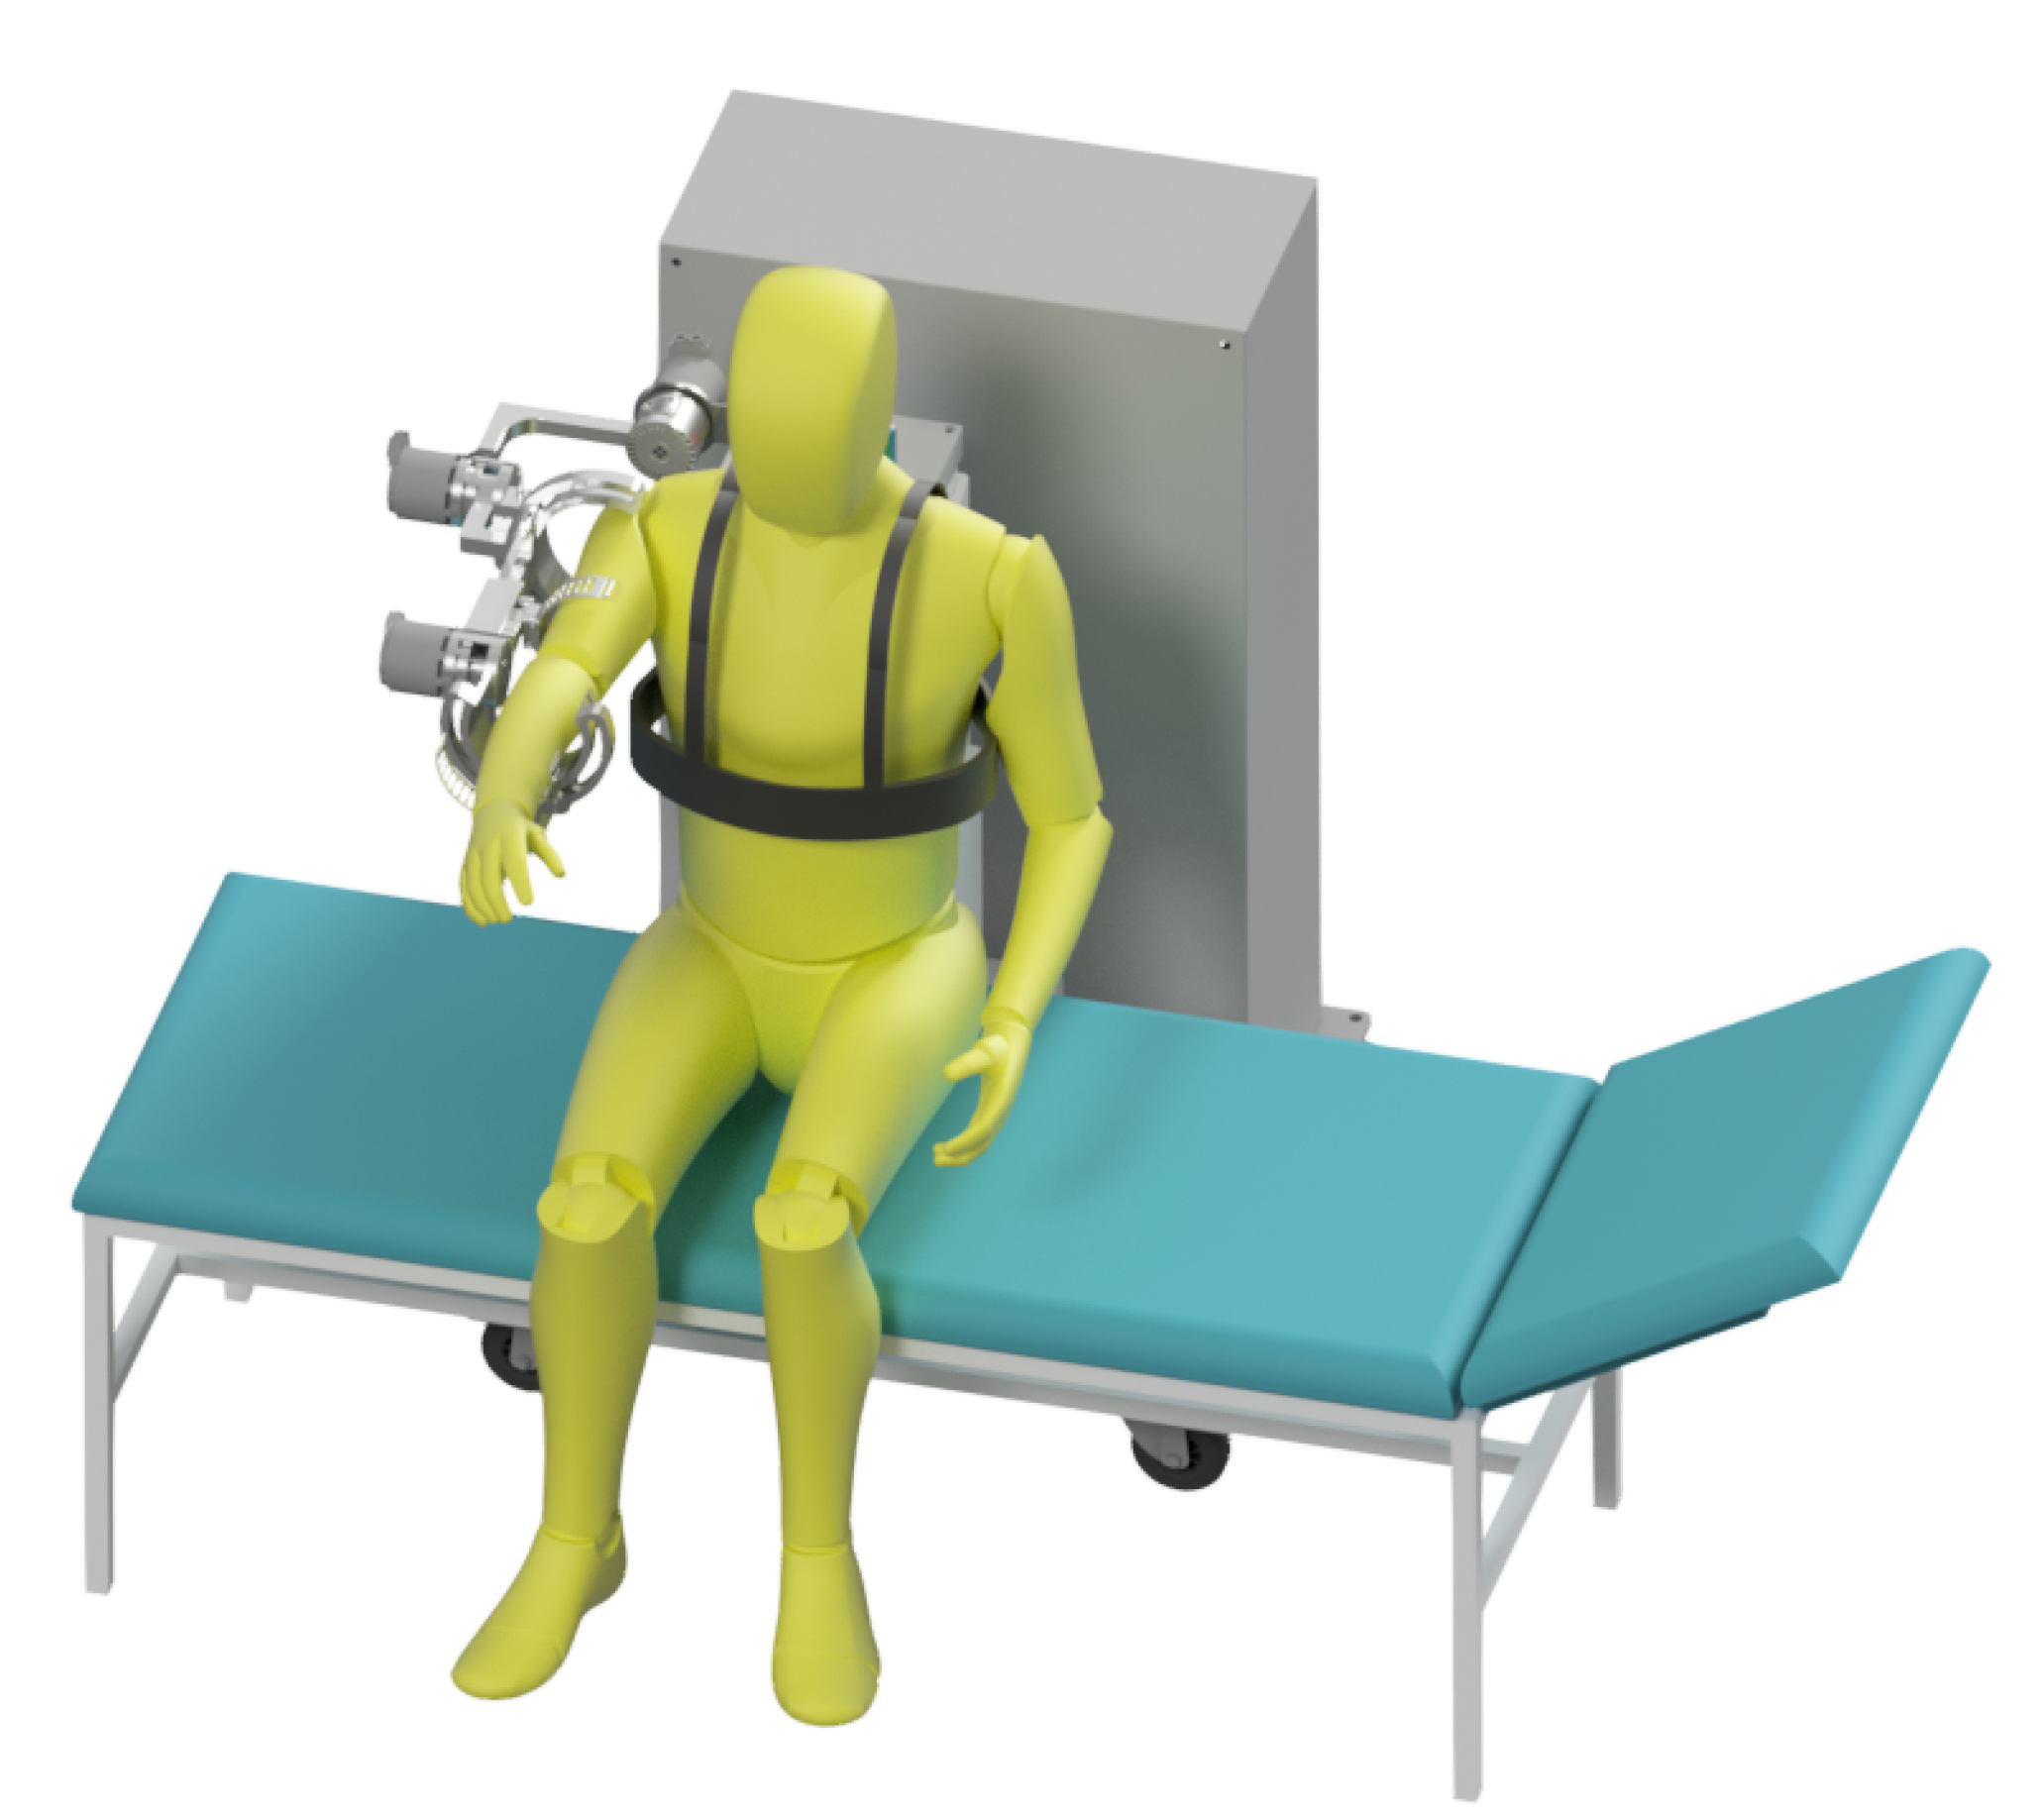
Figure A3.
Visual of using the exoskeleton in lying position.
Appendix B. Modeled Connections in FEM Model
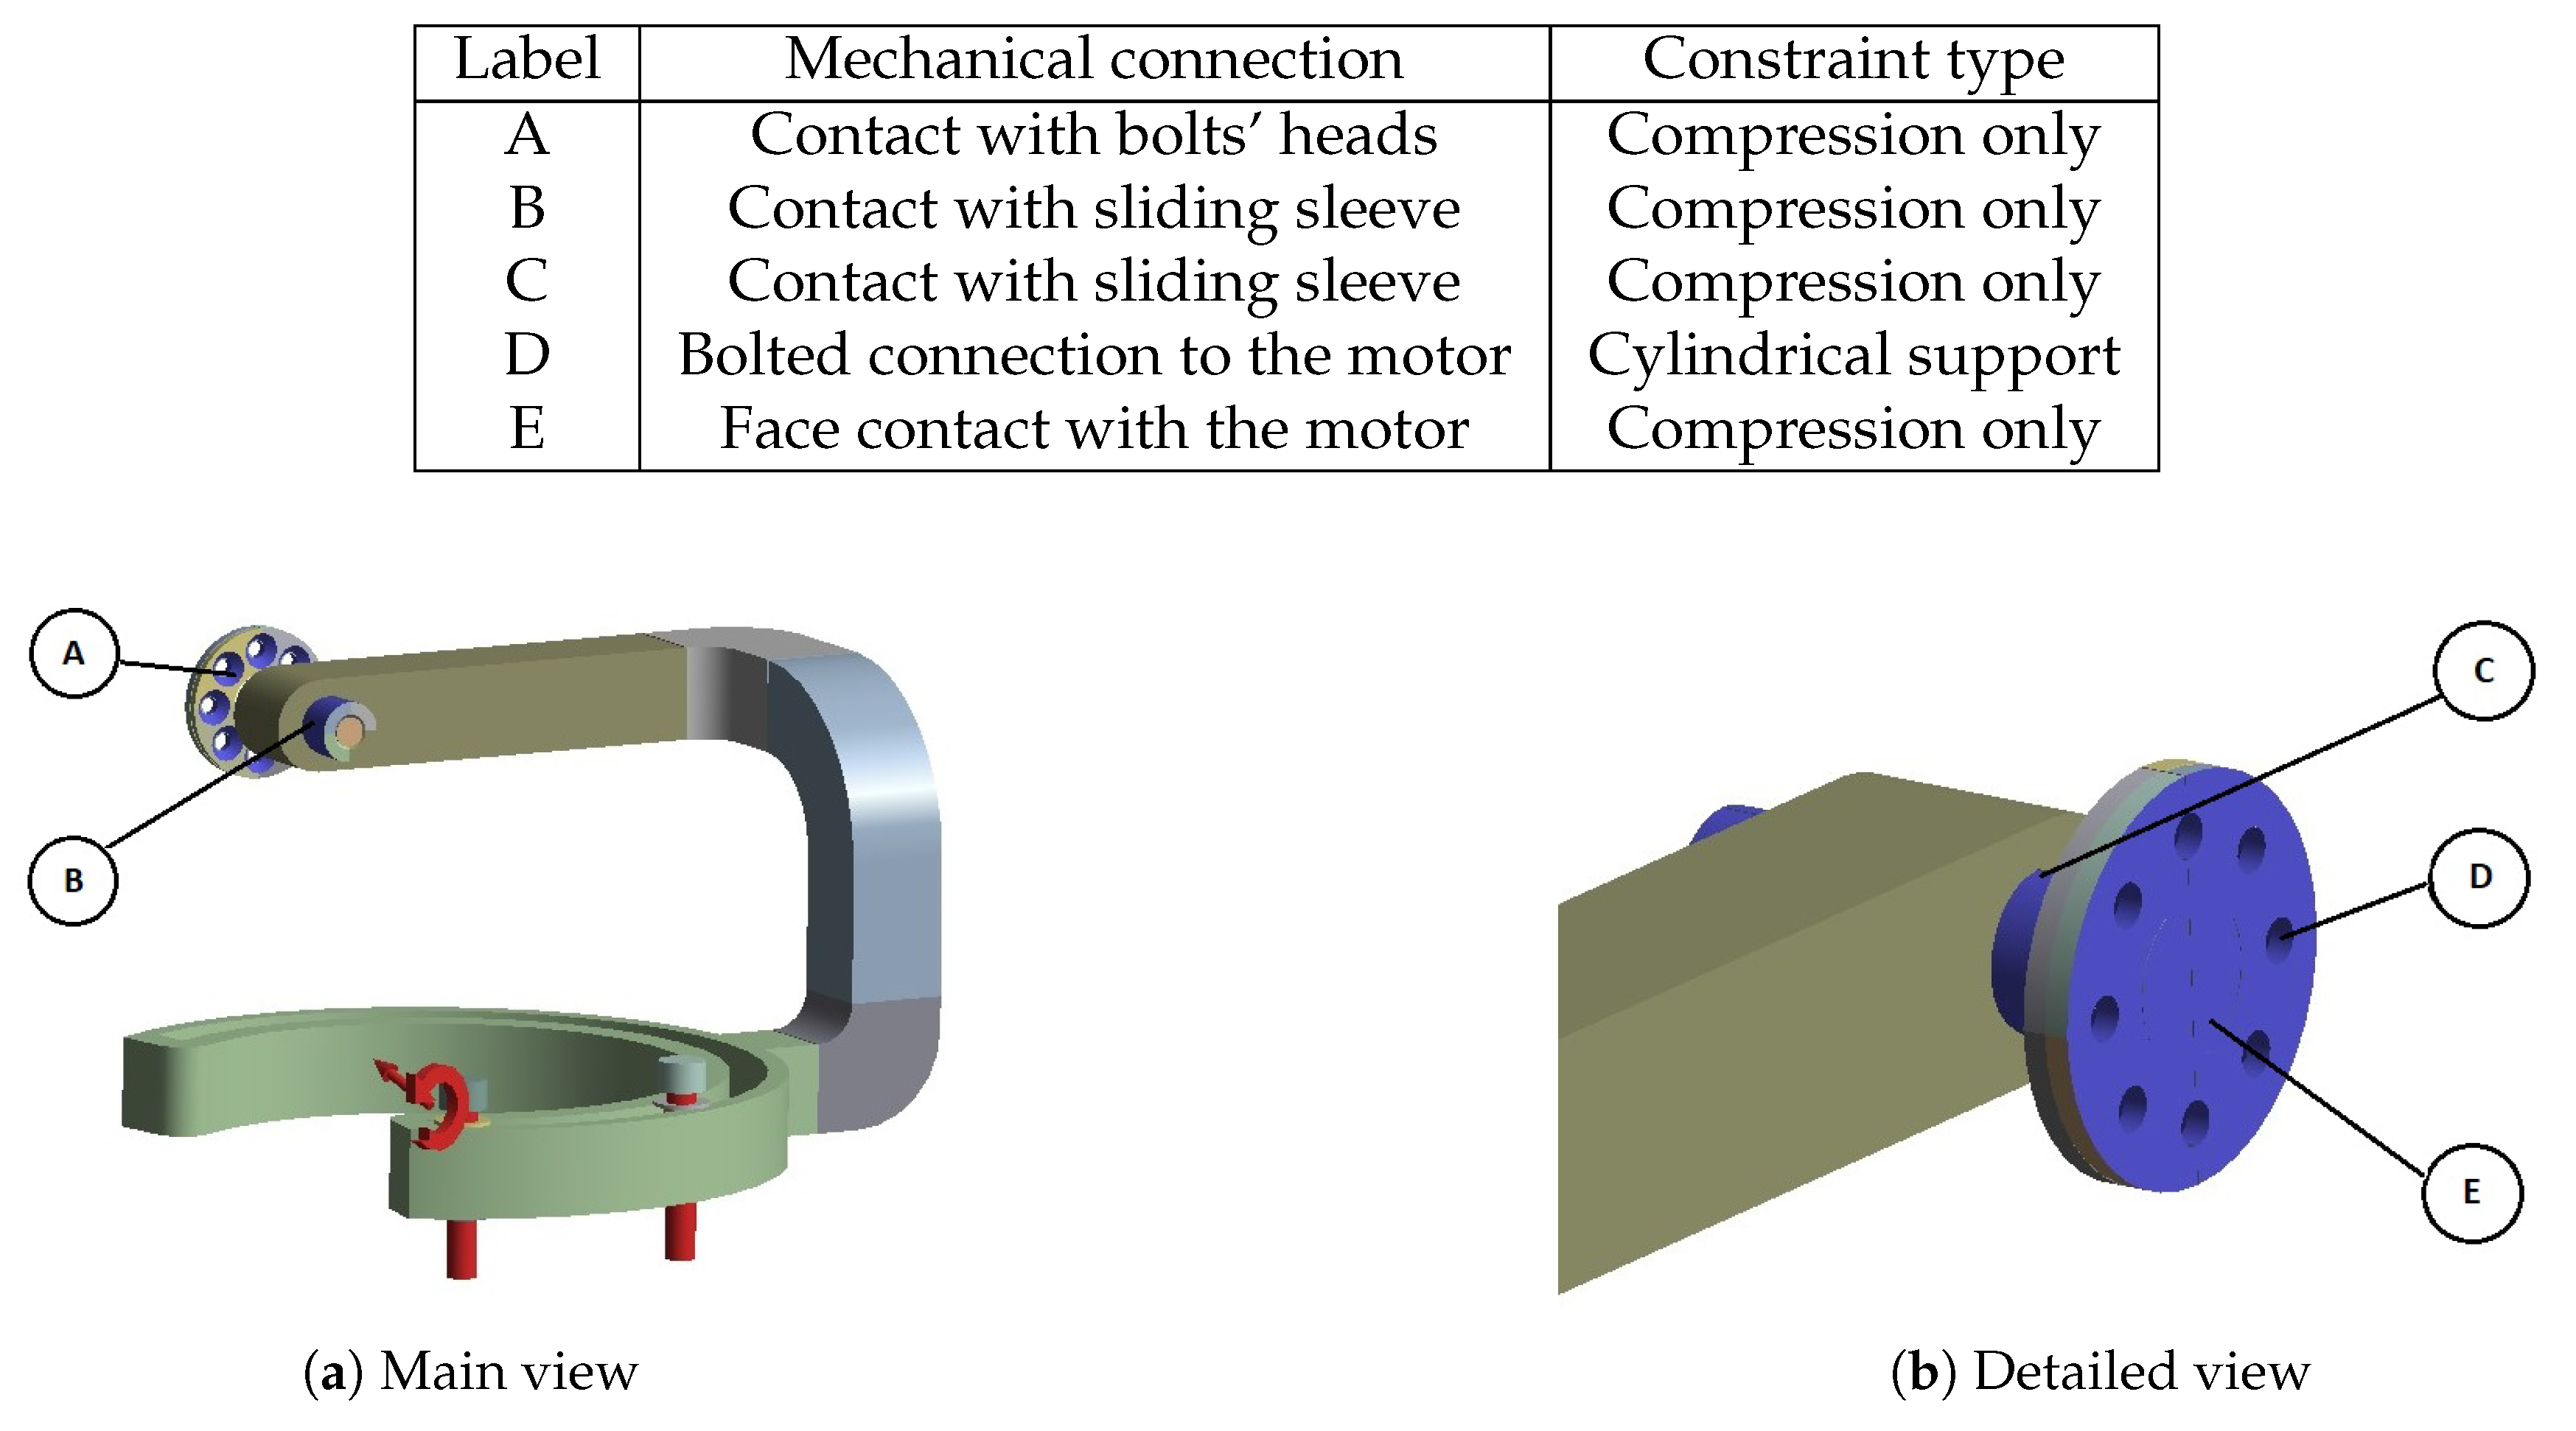
Figure A4.
Constraints and loads applied to Body 1.
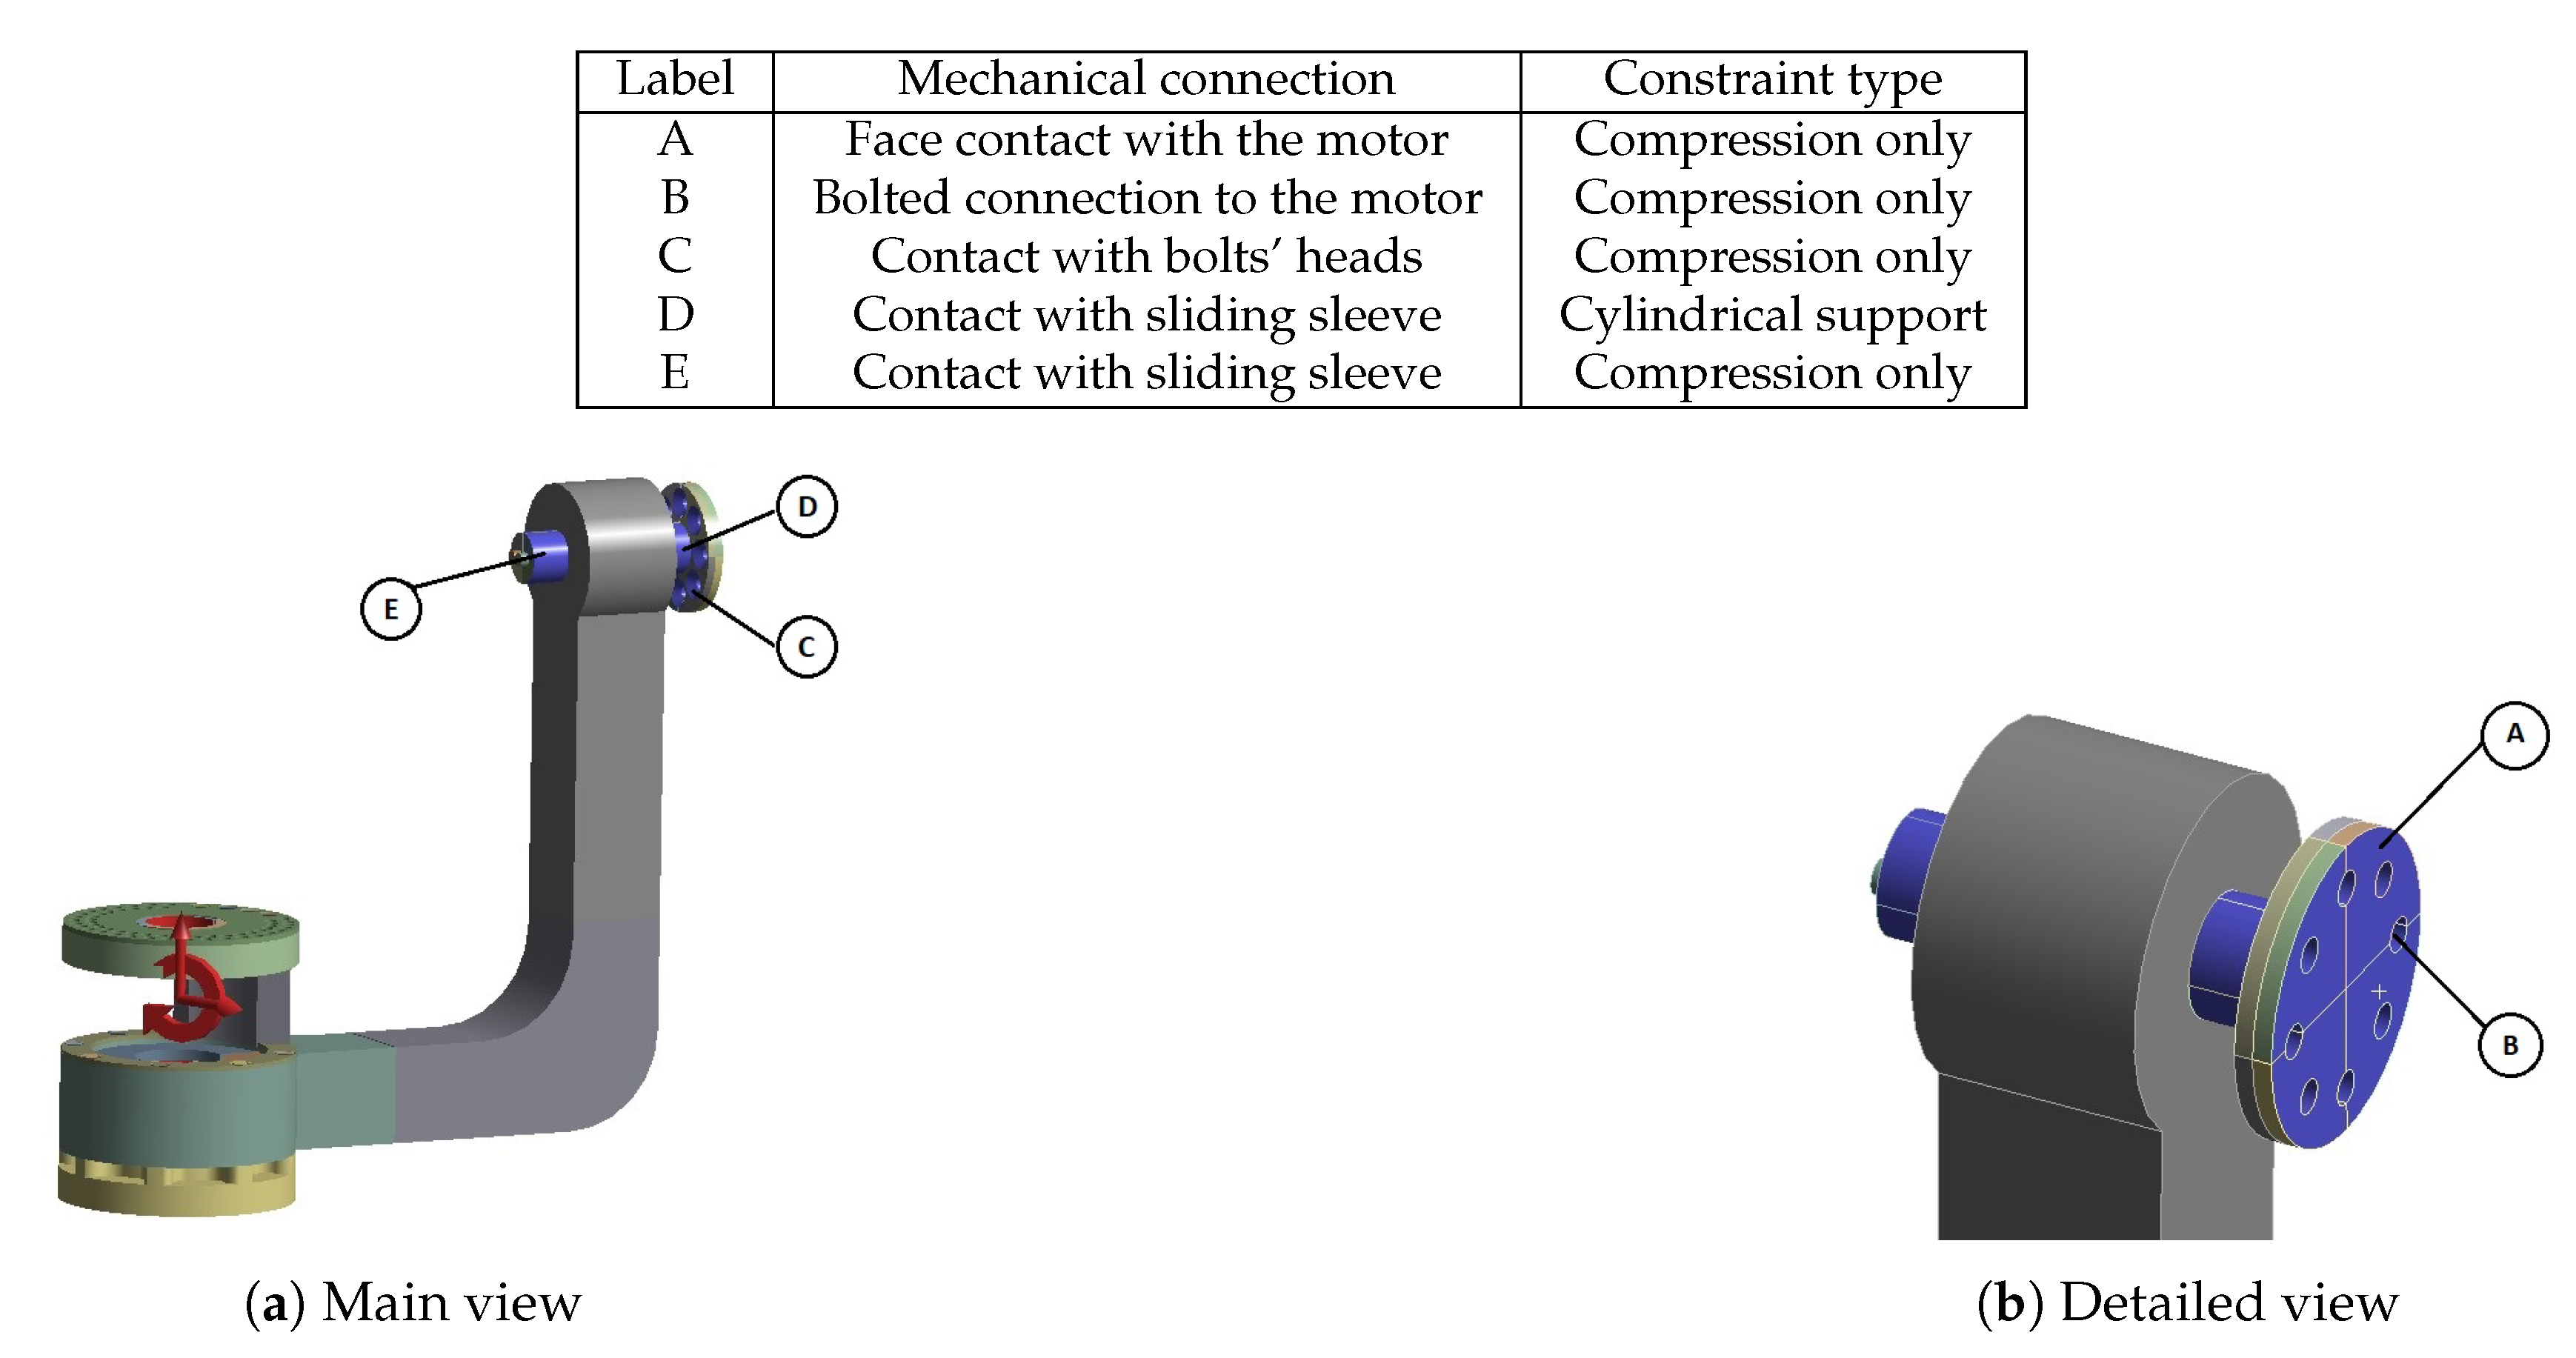
| Label | Mechanical connection | Constraint type |
| A | Face contact with the motor | Compression only |
| B | Bolted connection to the motor | Compression only |
| C | Contact with bolts’ heads | Compression only |
| D | Contact with sliding sleeve | Cylindrical support |
| E | Contact with sliding sleeve | Compression only |
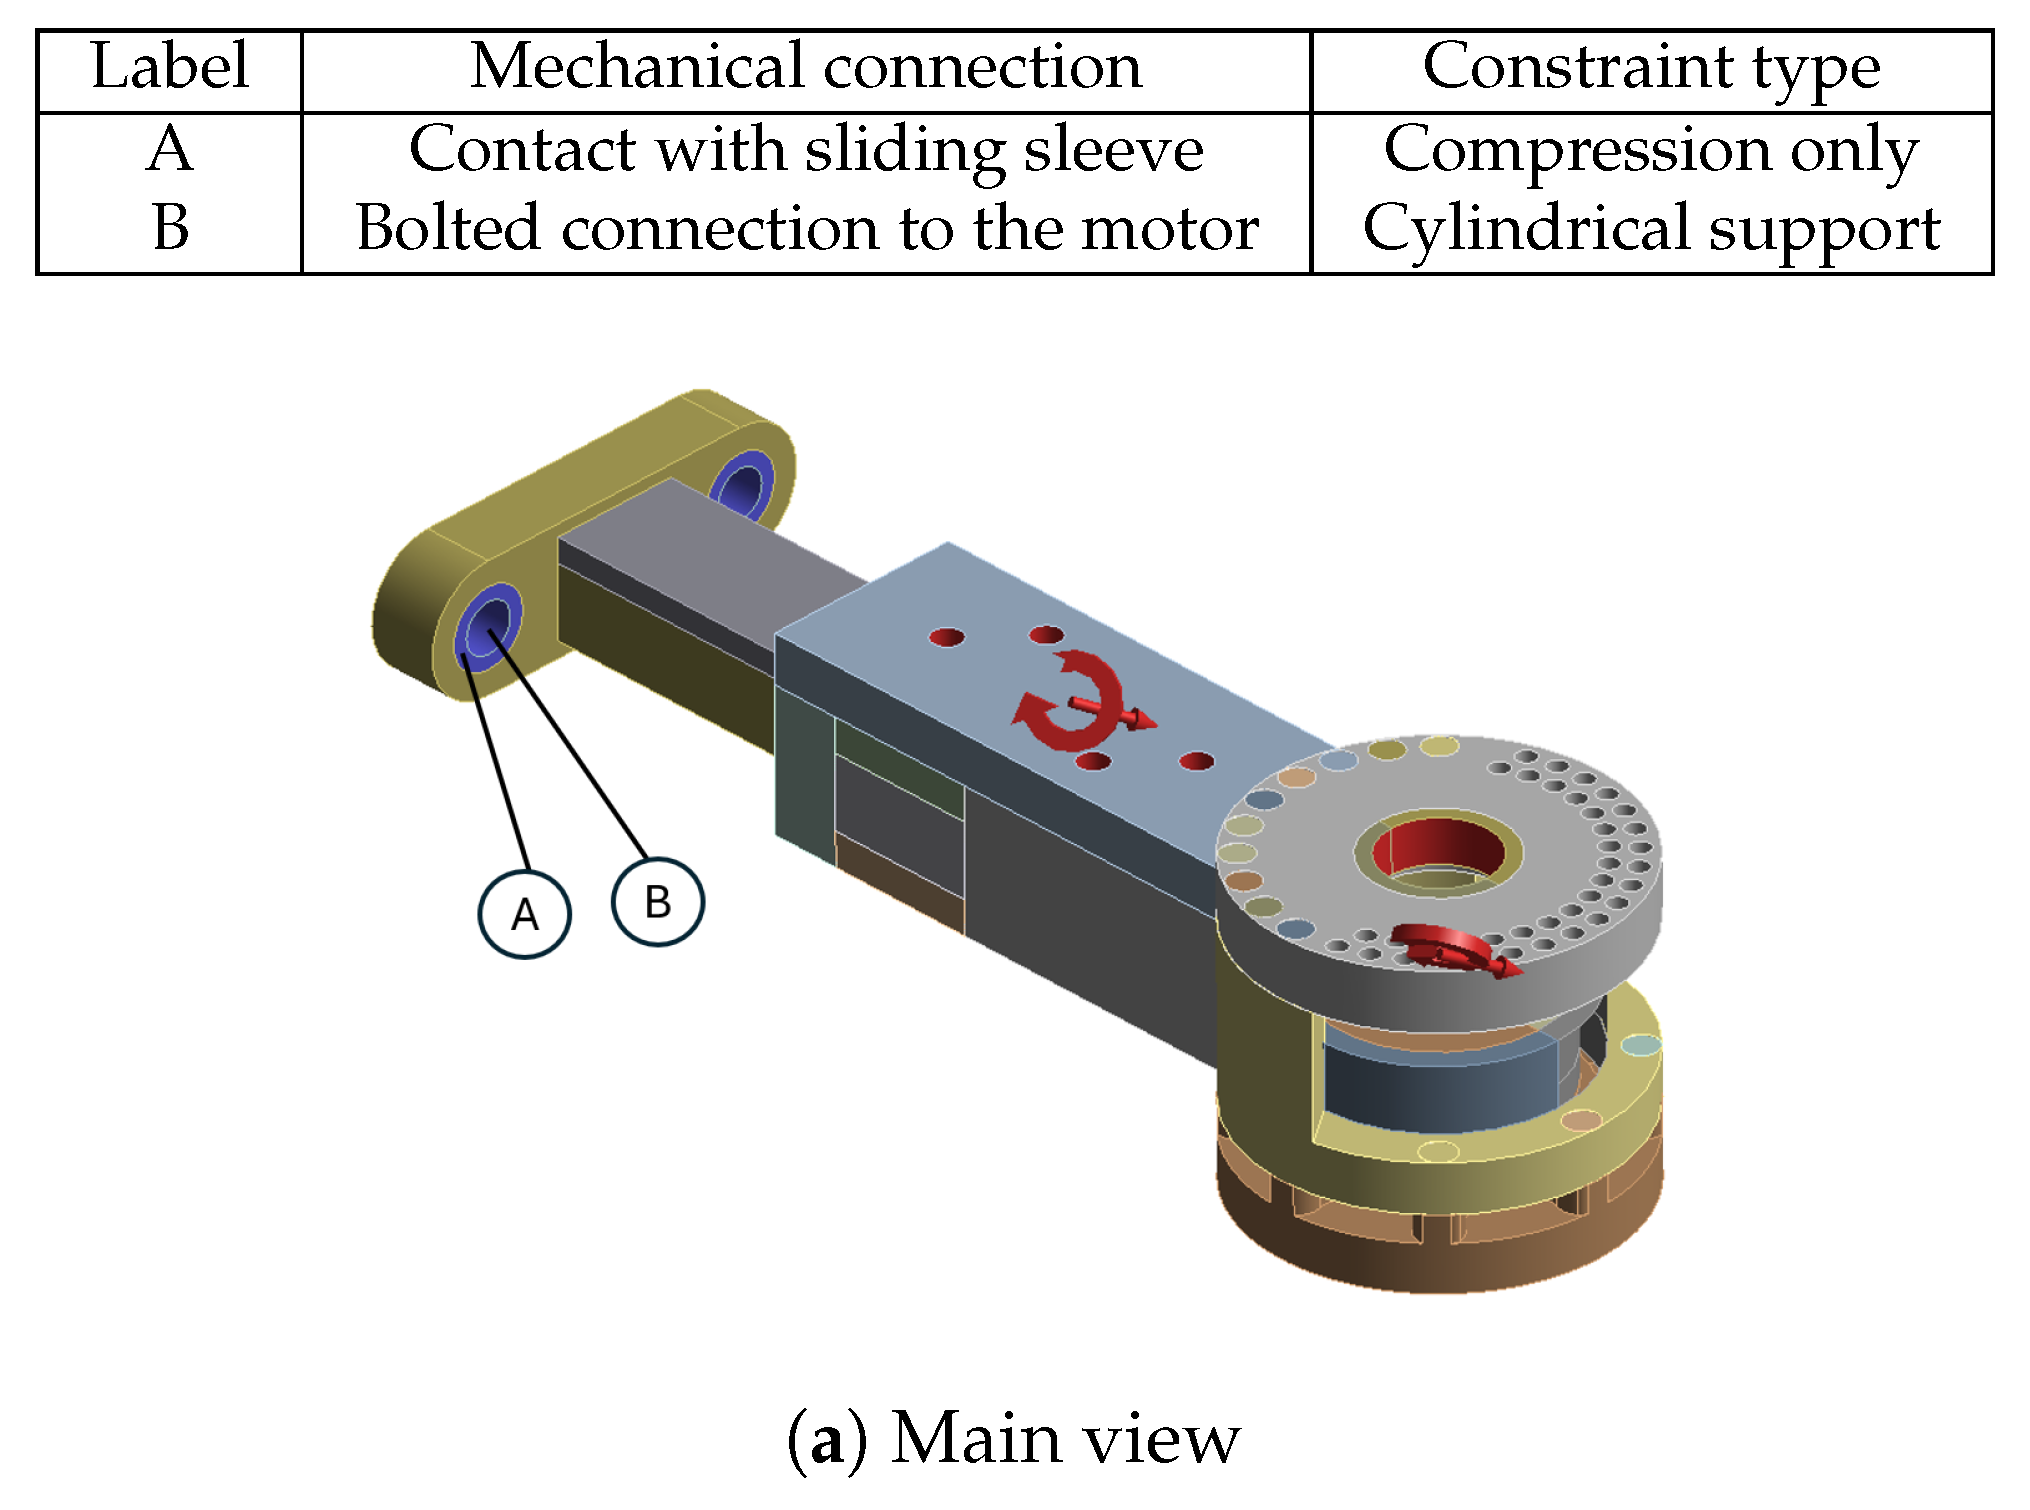
Figure A5.
Constraints and loads applied to Body 2.
| Label | Mechanical connection | Constraint type |
| A | Contact with sliding sleeve | Compression only |
| B | Bolted connection to the motor | Cylindrical support |
| C | Contact with sliding sleeve | Compression only |
| D | Contact with bolts’ heads | Compression only |
| E | Face contact with the motor | Compression only |
Figure A6.
Constraints and loads applied to Body 3.
| Label | Mechanical connection | Constraint type |
| A | Contact with sliding sleeve | Compression only |
| B | Bolted connection to the motor | Cylindrical support |
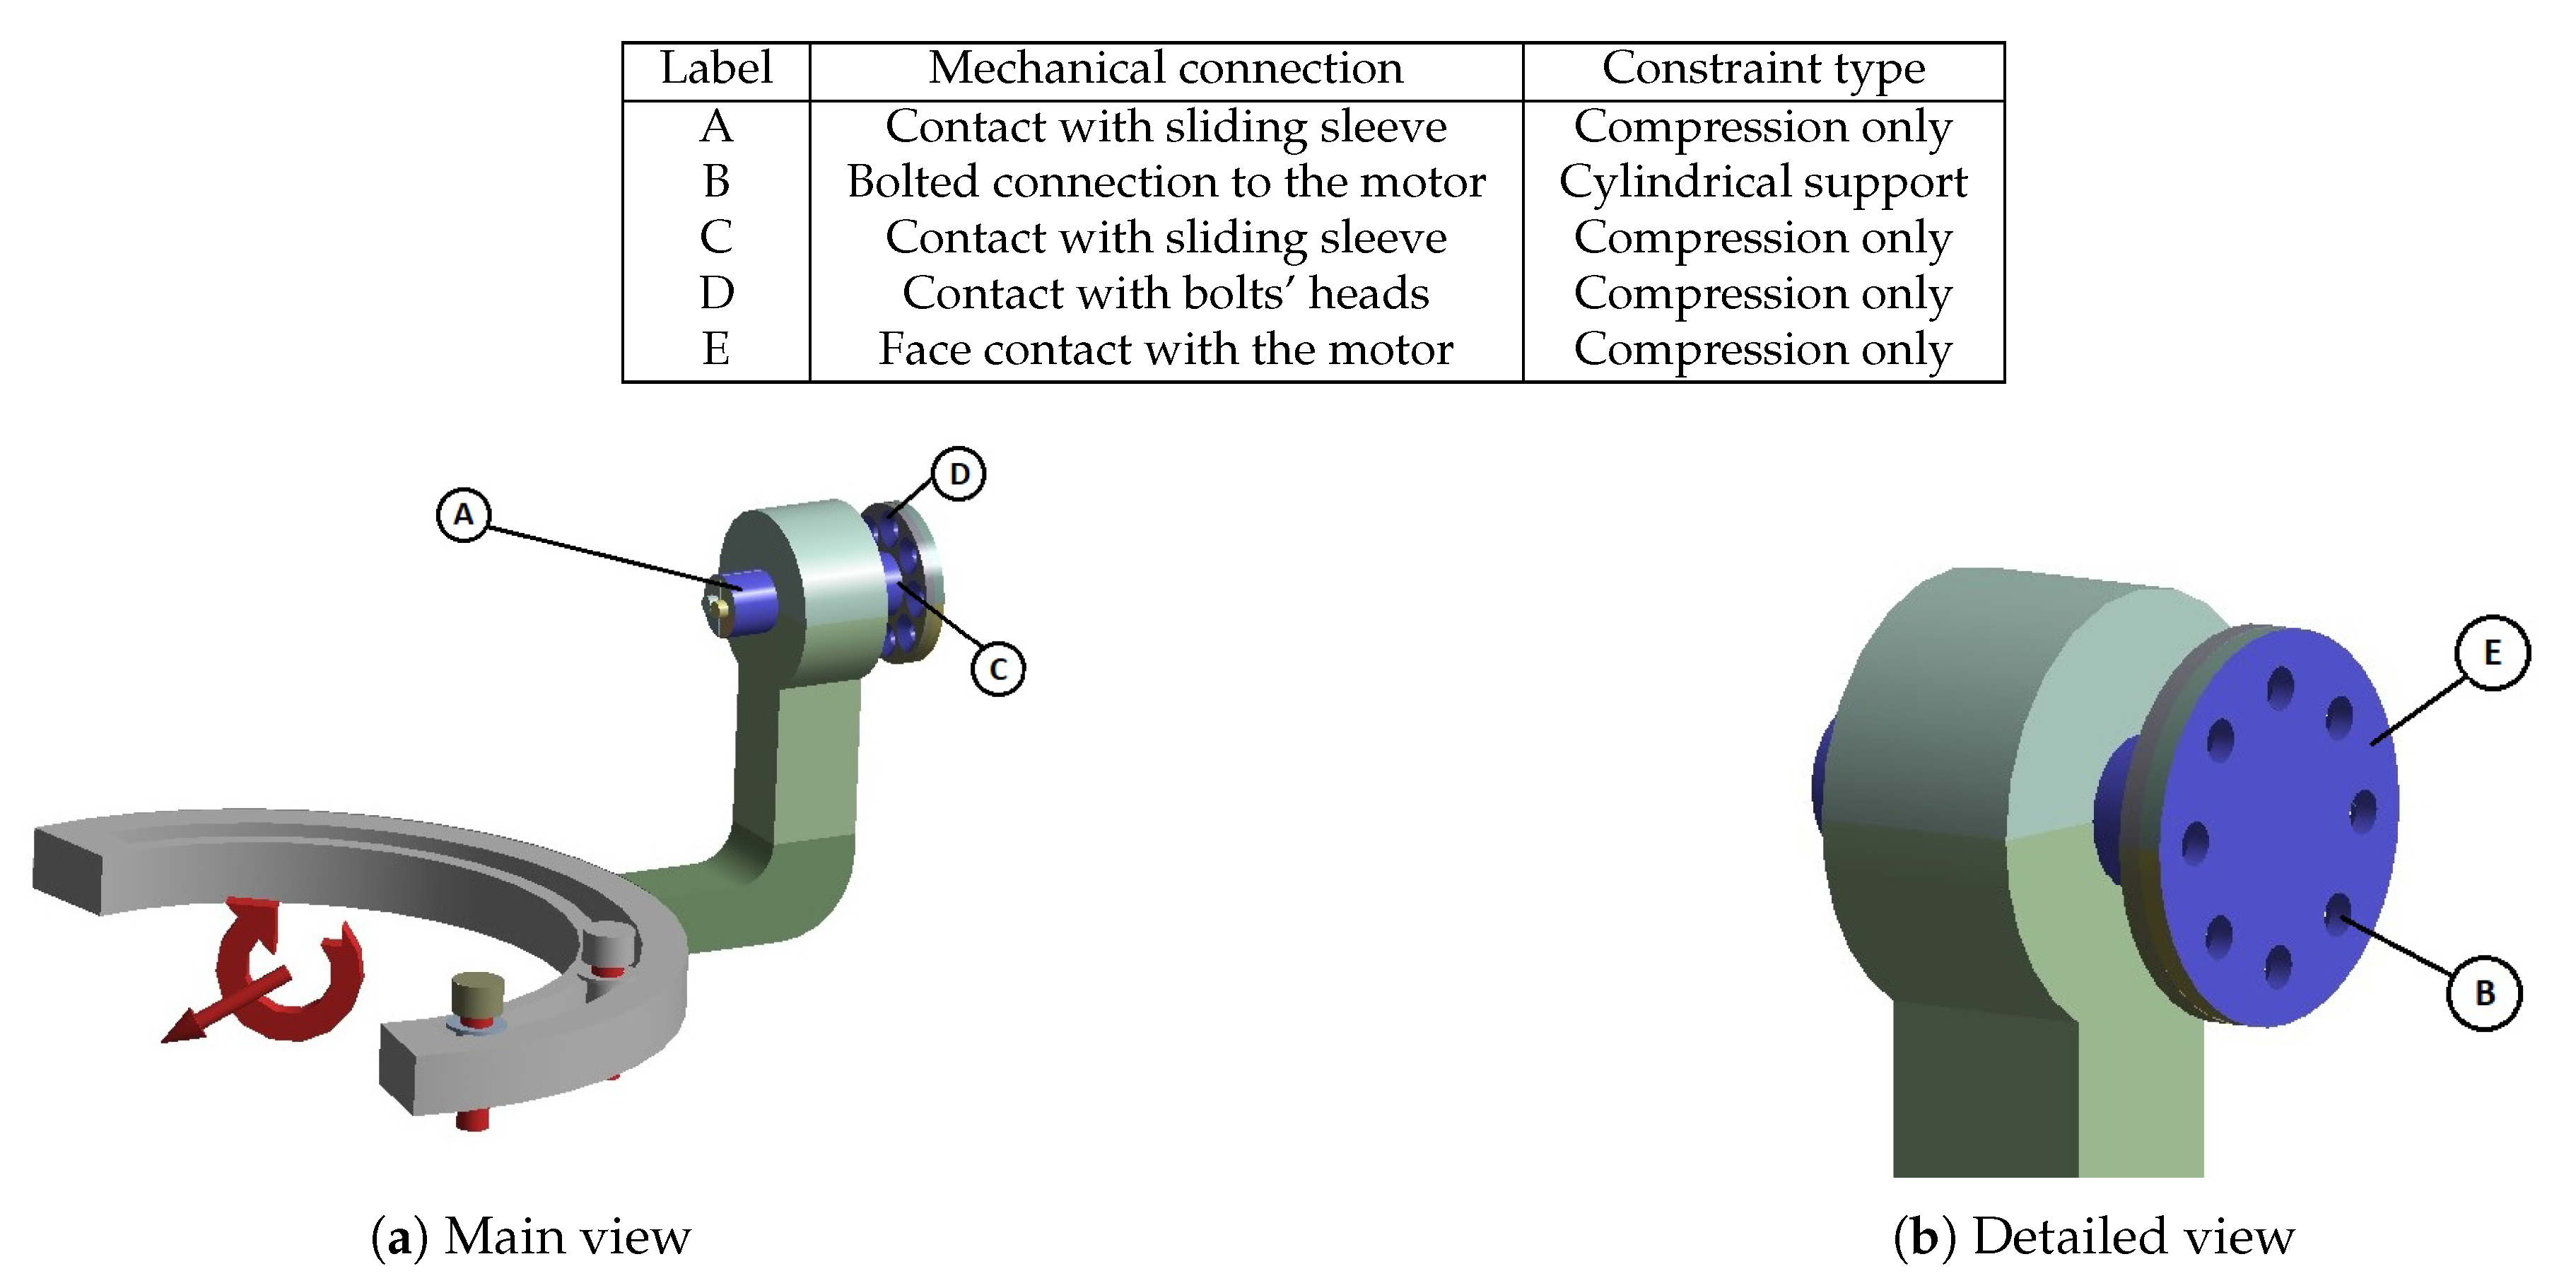
Figure A7.
Constraints and loads applied to Body 4.
| Label | Mechanical connection | Constraint type |
| A | Contact with bolts’ heads | Compression only |
| B | Contact with sliding sleeve | Compression only |
| C | Contact with sliding sleeve | Compression only |
| D | Bolted connection to the motor | Cylindrical support |
| E | Face contact with the motor | Compression only |
Figure A8.
Constraints and loads applied to Body 5.
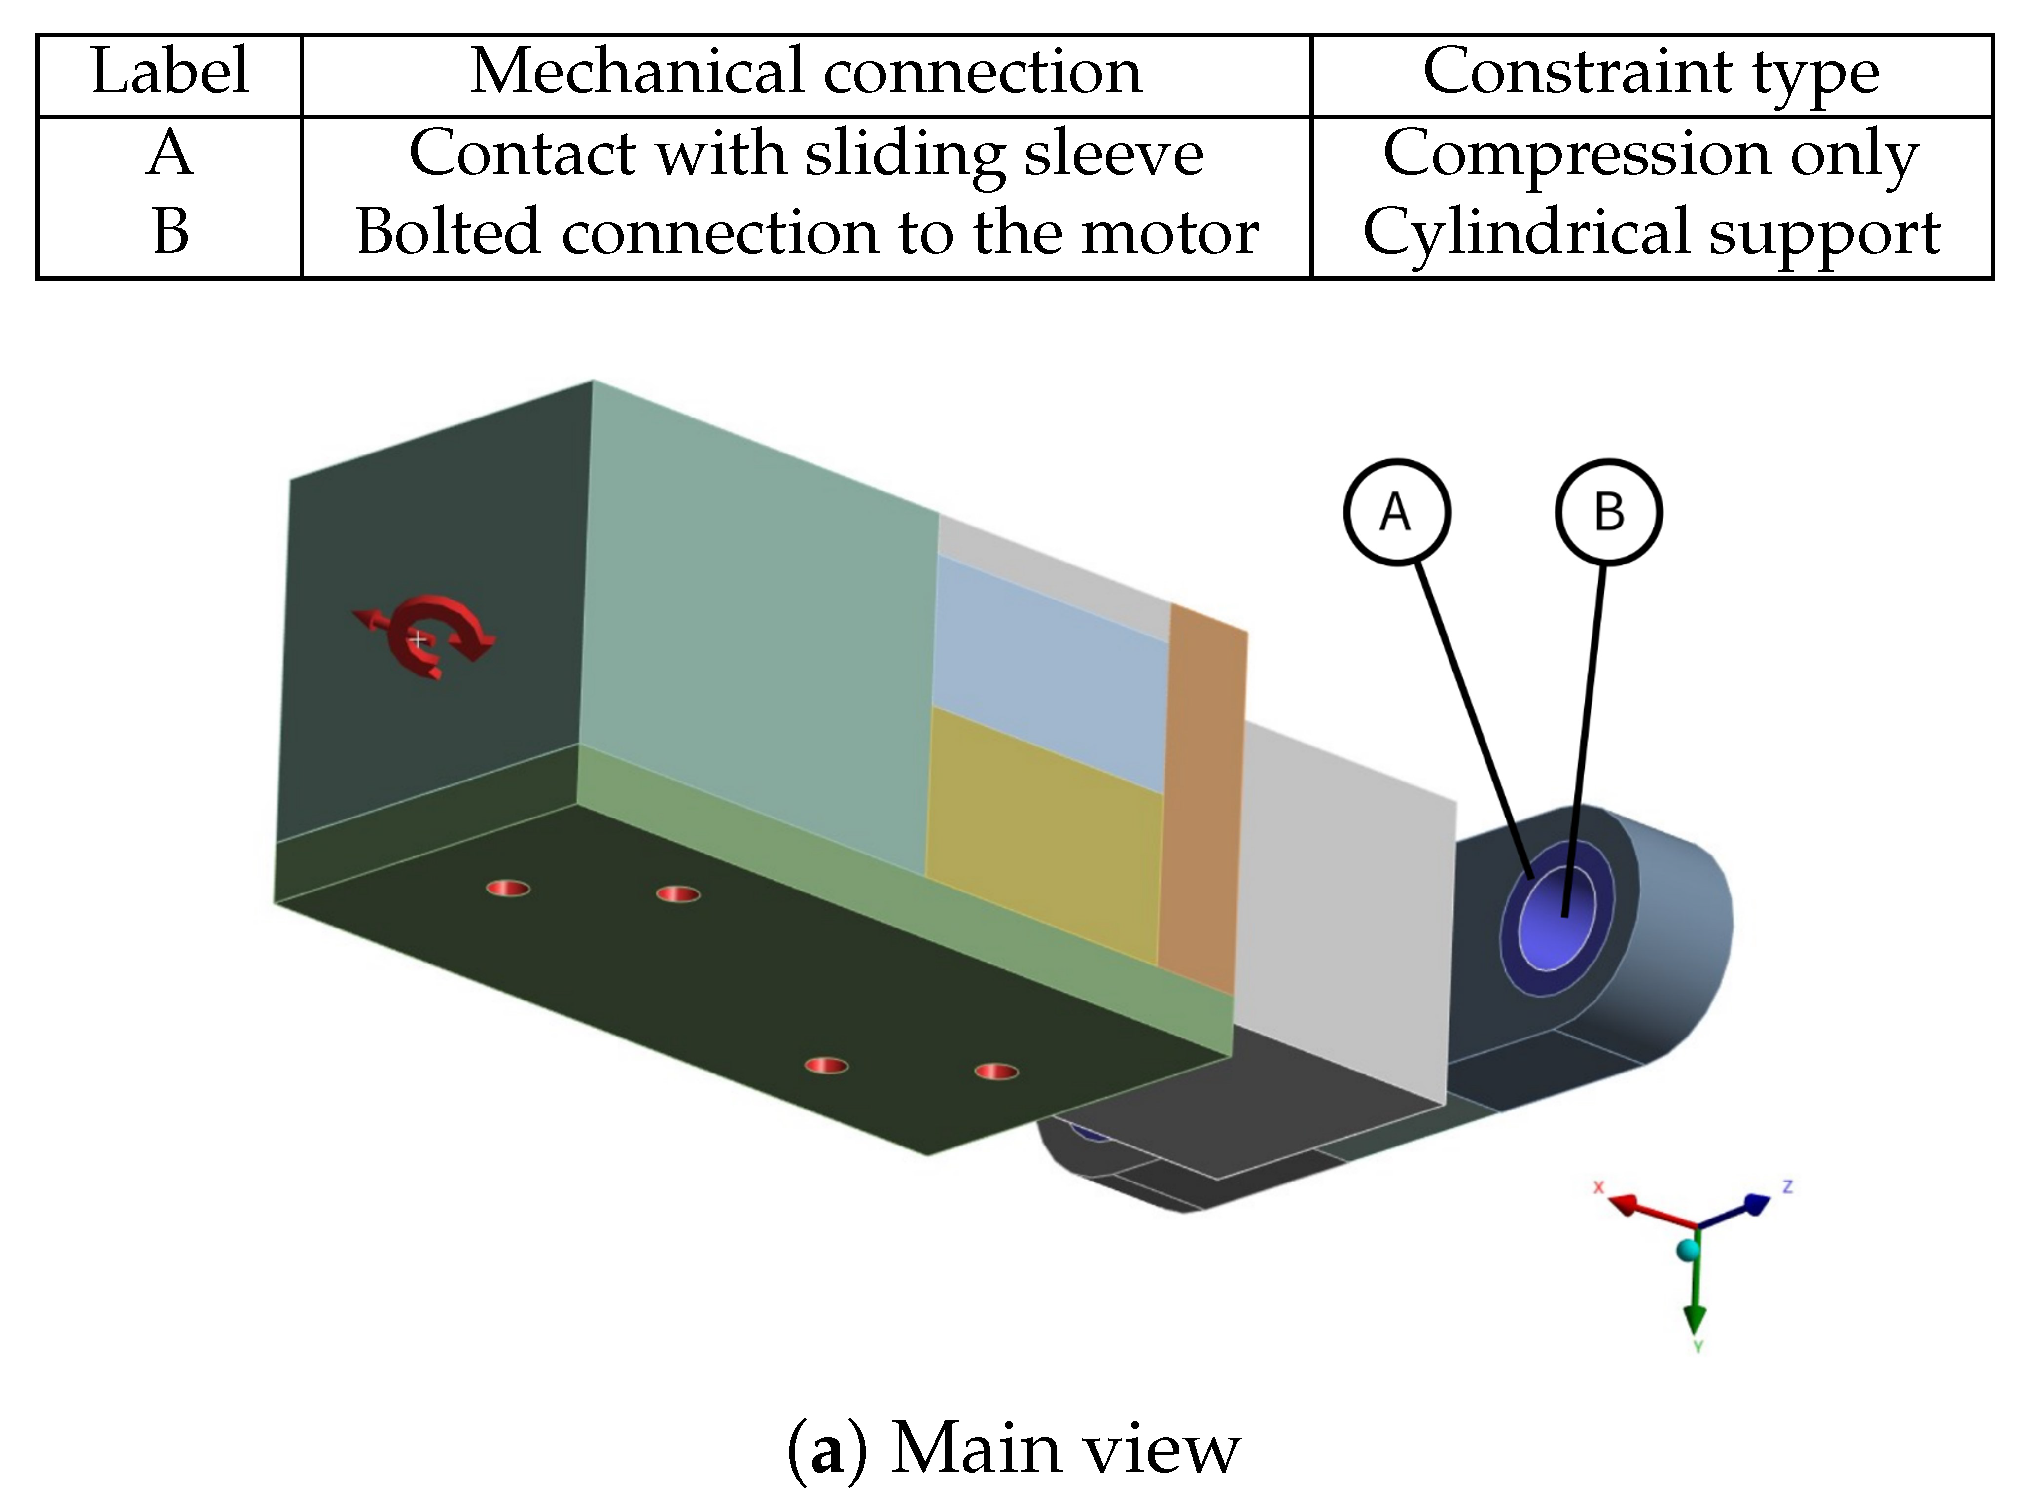
| Label | Mechanical connection | Constraint type |
| A | Contact with sliding sleeve | Compression only |
| B | Bolted connection to the motor | Cylindrical support |
Appendix C. Parametrization
Appendix C.1. Initial Parametric Optimization
Figure A9.
Parameters used for initial parametric optimization.
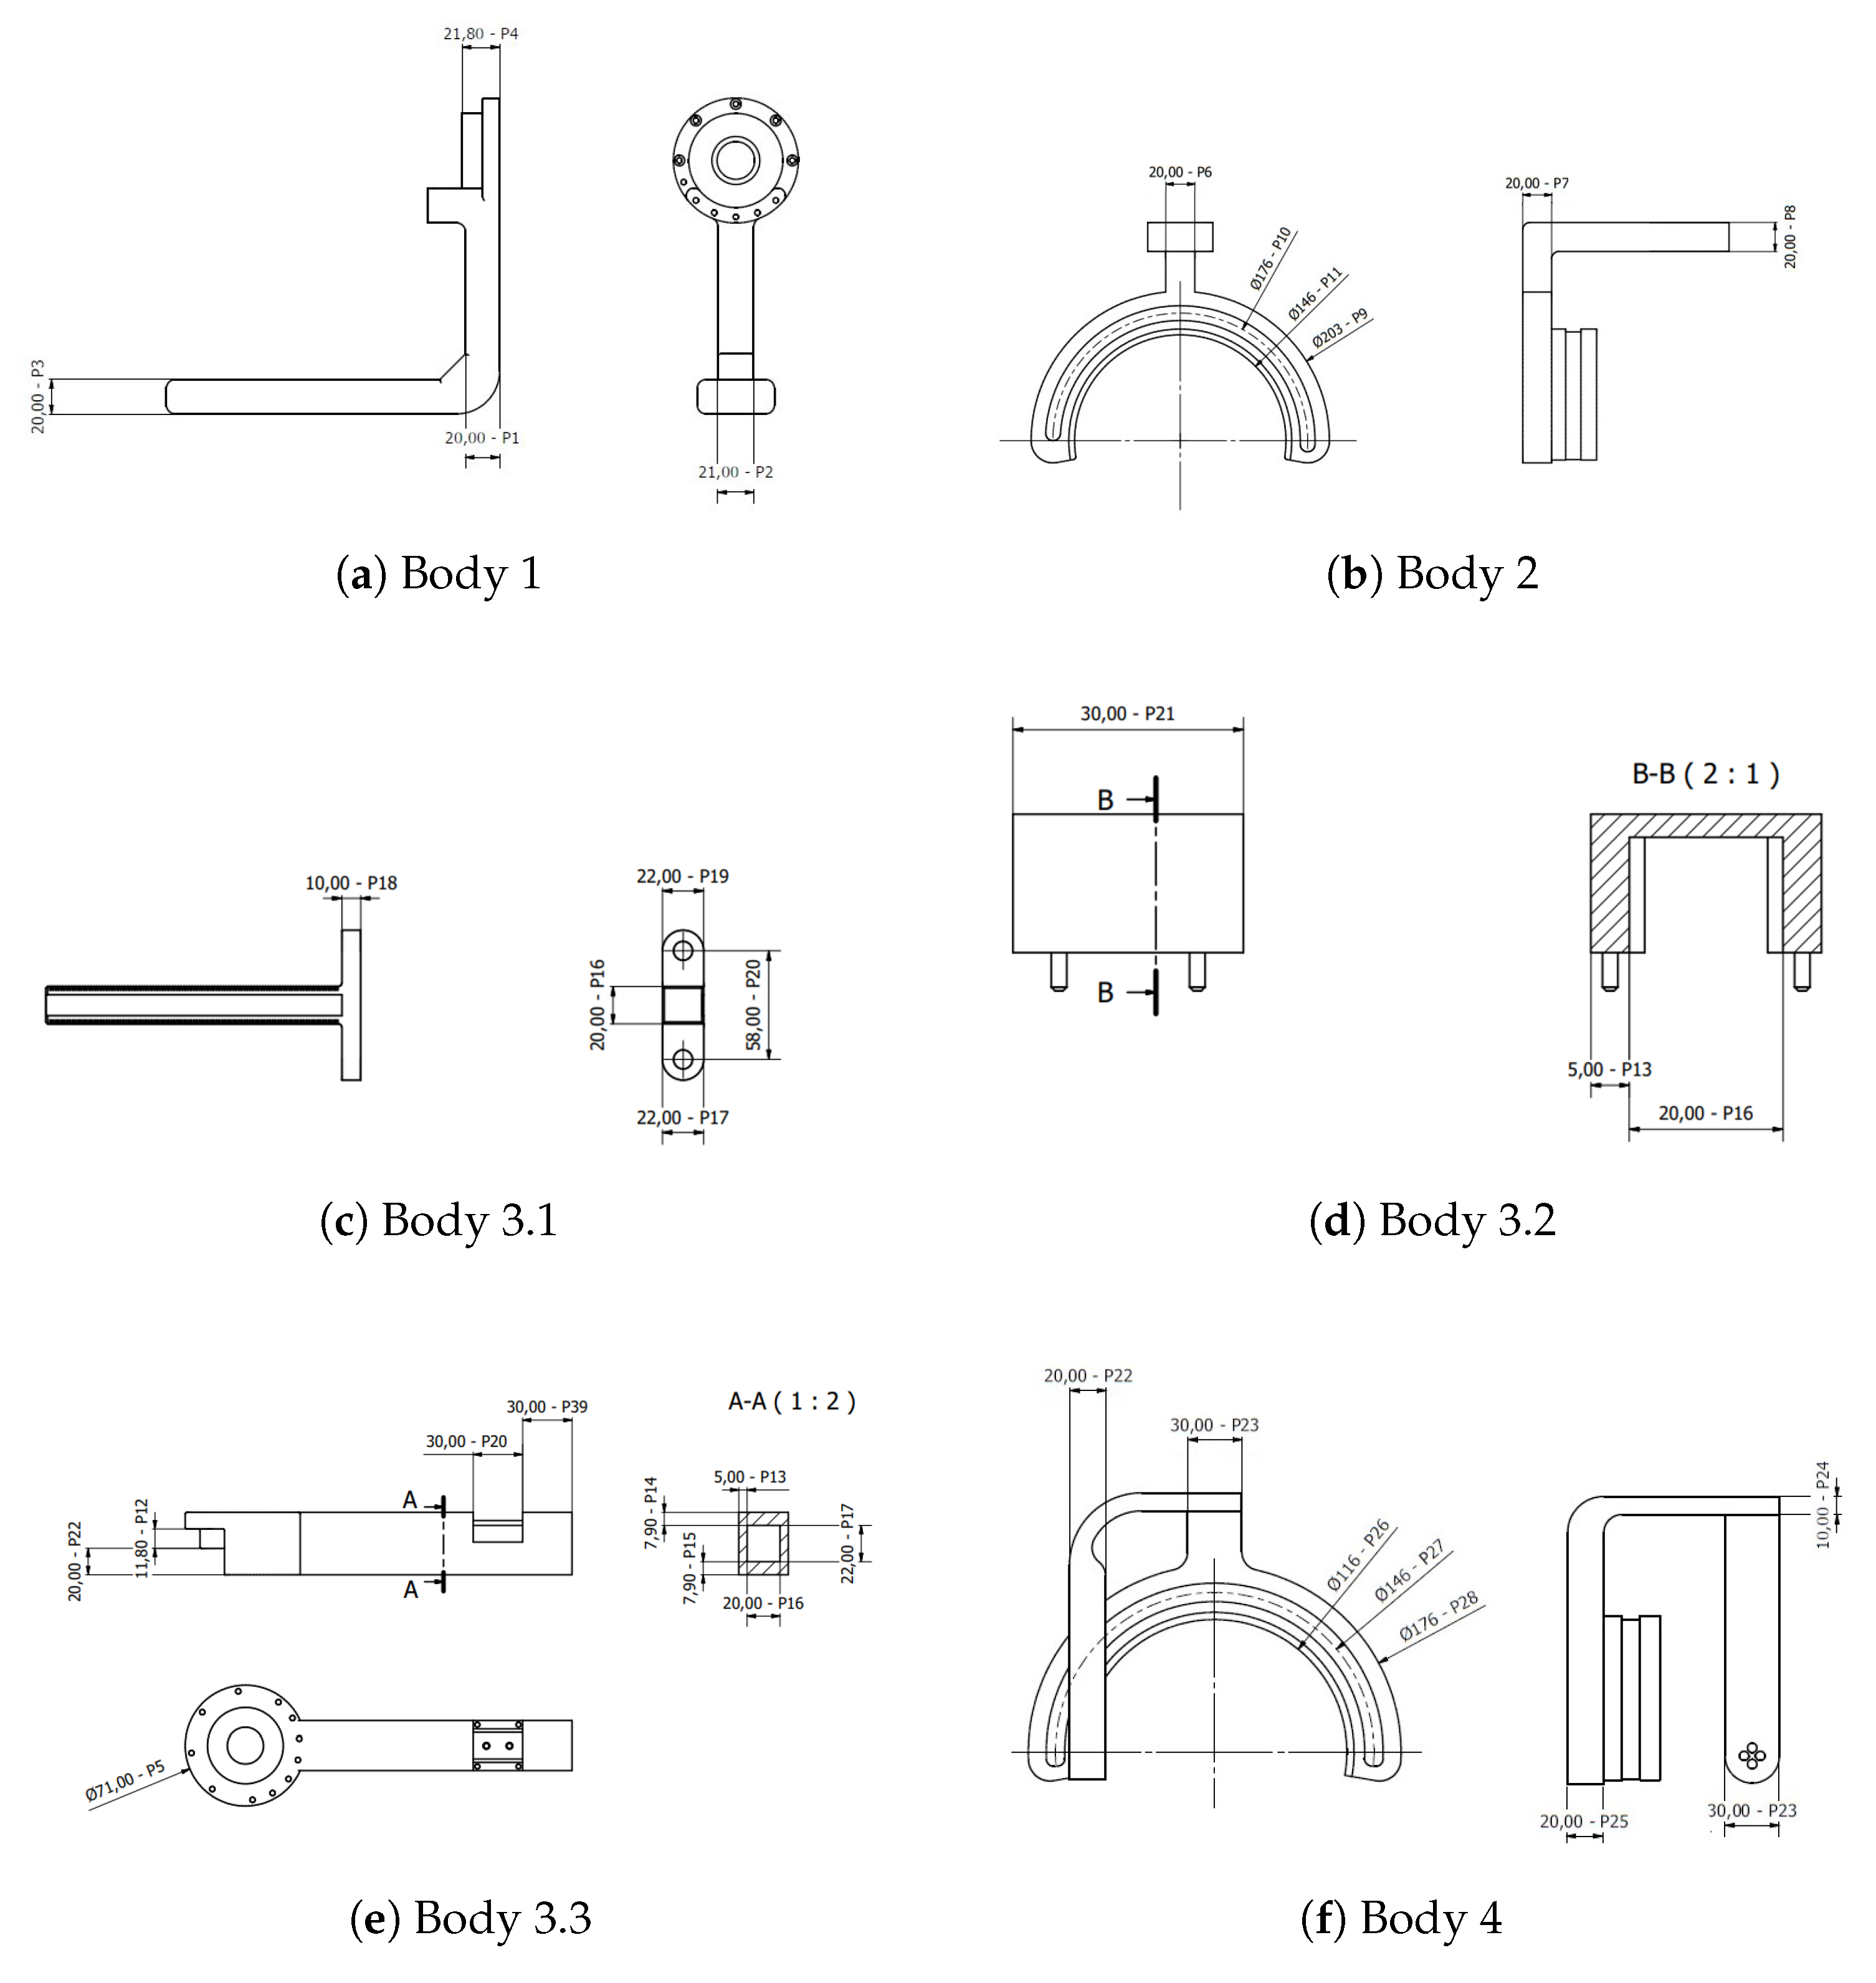
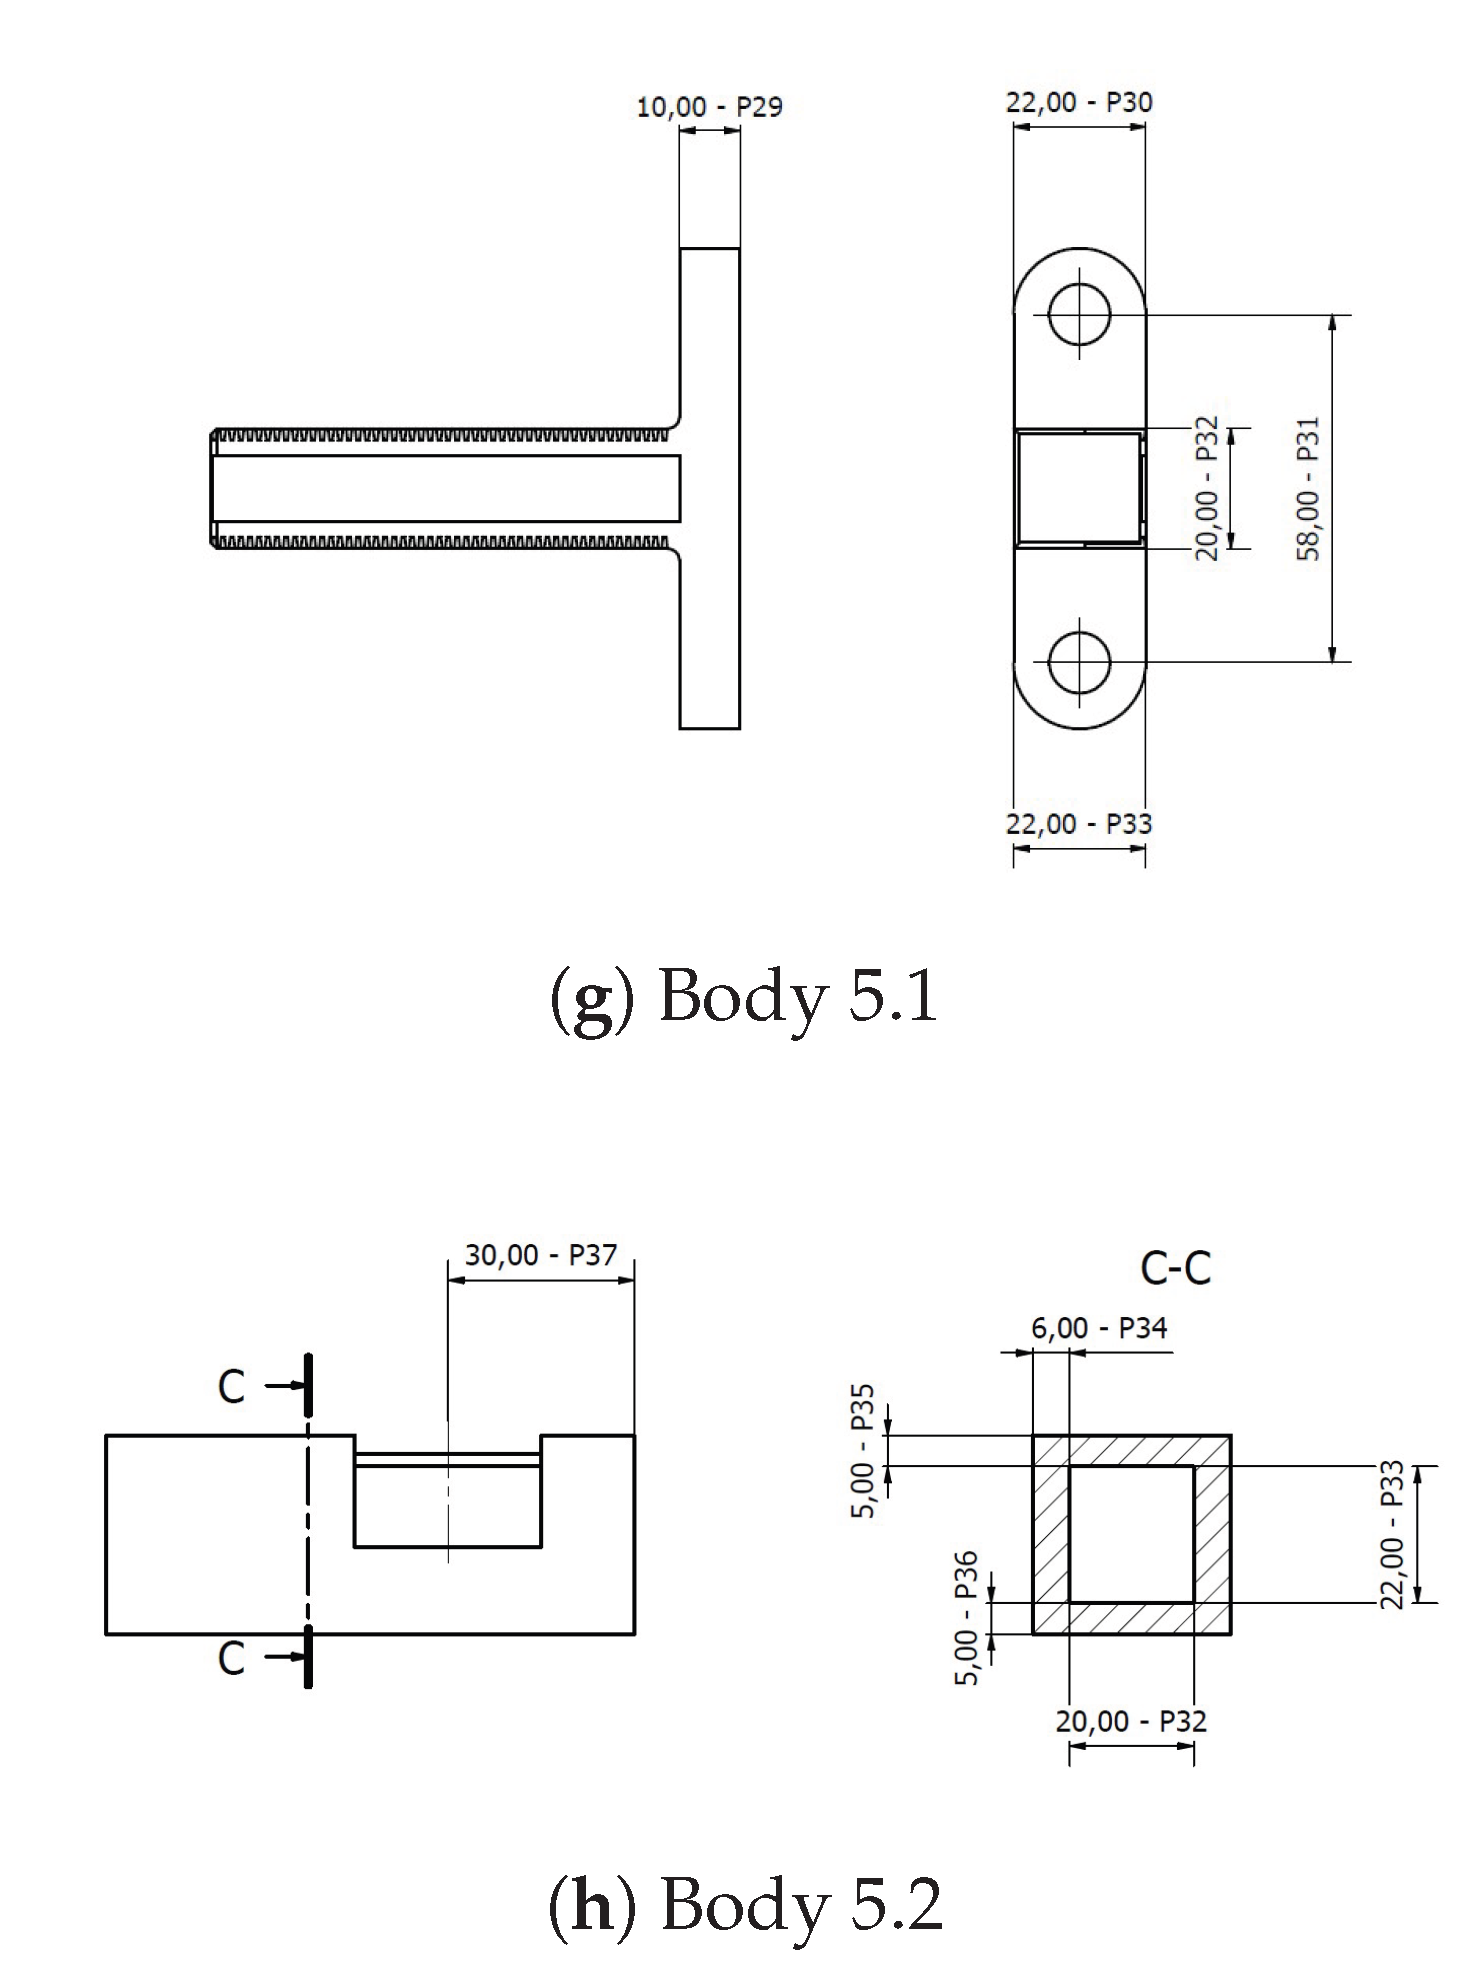
Table A1.
Ranges of the parameters used for initial parametric optimization.
| Number | Initial Value [mm] | Minimum [mm] | Maximum [mm] |
|---|---|---|---|
| Body 1 | |||
| 1 | 20.0 | 15.0 | 35.8 |
| 2 | 31.0 | 20.0 | 40.0 |
| 3 | 20.0 | 15.0 | 30.0 |
| 4 | 11.8 | 7.8 | 21.8 |
| 5 | 71.0 | - | - |
| Body 2 | |||
| 6 | 11.8 | 7.8 | 26.8 |
| 7 | 20.0 | 15.0 | 40.0 |
| 8 | 20.0 | 20.0 | 35.0 |
| 9 | 206.0 | 180.0 | 230.0 |
| 10 | 176.0 | 150.0 | 190.0 |
| 11 | 146.0 | 120.0 | 170.0 |
| Body 3 | |||
| 12 | 11.8 | 7.8 | 21.8 |
| 13 | 5.0 | 4.0 | 10.0 |
| 14 | 7.9 | 5.0 | 10.0 |
| 15 | 7.9 | 5.0 | 10.0 |
| 16 | 20.0 | 15.0 | 30.0 |
| 17 | 22.0 | 15.0 | 30.0 |
| 18 | 10.0 | 8.0 | 15.0 |
| 19 | 22.0 | 16.0 | 30.0 |
| 20 | 58.0 | - | - |
| 21 | 30.0 | - | - |
| 22 | 20.0 | 15.0 | 30.0 |
| Body 4 | |||
| 22 | 20.0 | 15.0 | 30.0 |
| 23 | 30.0 | 20.0 | 30.0 |
| 24 | 10.0 | 10.0 | 30.0 |
| 25 | 20.0 | 18.0 | 35.0 |
| 26 | 116.0 | 110.0 | 140.0 |
| 27 | 146.0 | 130.0 | 170.0 |
| 28 | 176.0 | 160.0 | 200.0 |
| Body 5 | |||
| 29 | 10.0 | 8.0 | 15.0 |
| 30 | 22.0 | 15.0 | 30.0 |
| 31 | 58.0 | - | - |
| 32 | 20.0 | 15.0 | 30.0 |
| 33 | 22.0 | 15.0 | 30.0 |
| 34 | 6.0 | 5.0 | 10.0 |
Appendix C.2. Final Parametric Optimization
Figure A10.
Parameters used in the final parametric optimization (part 3).
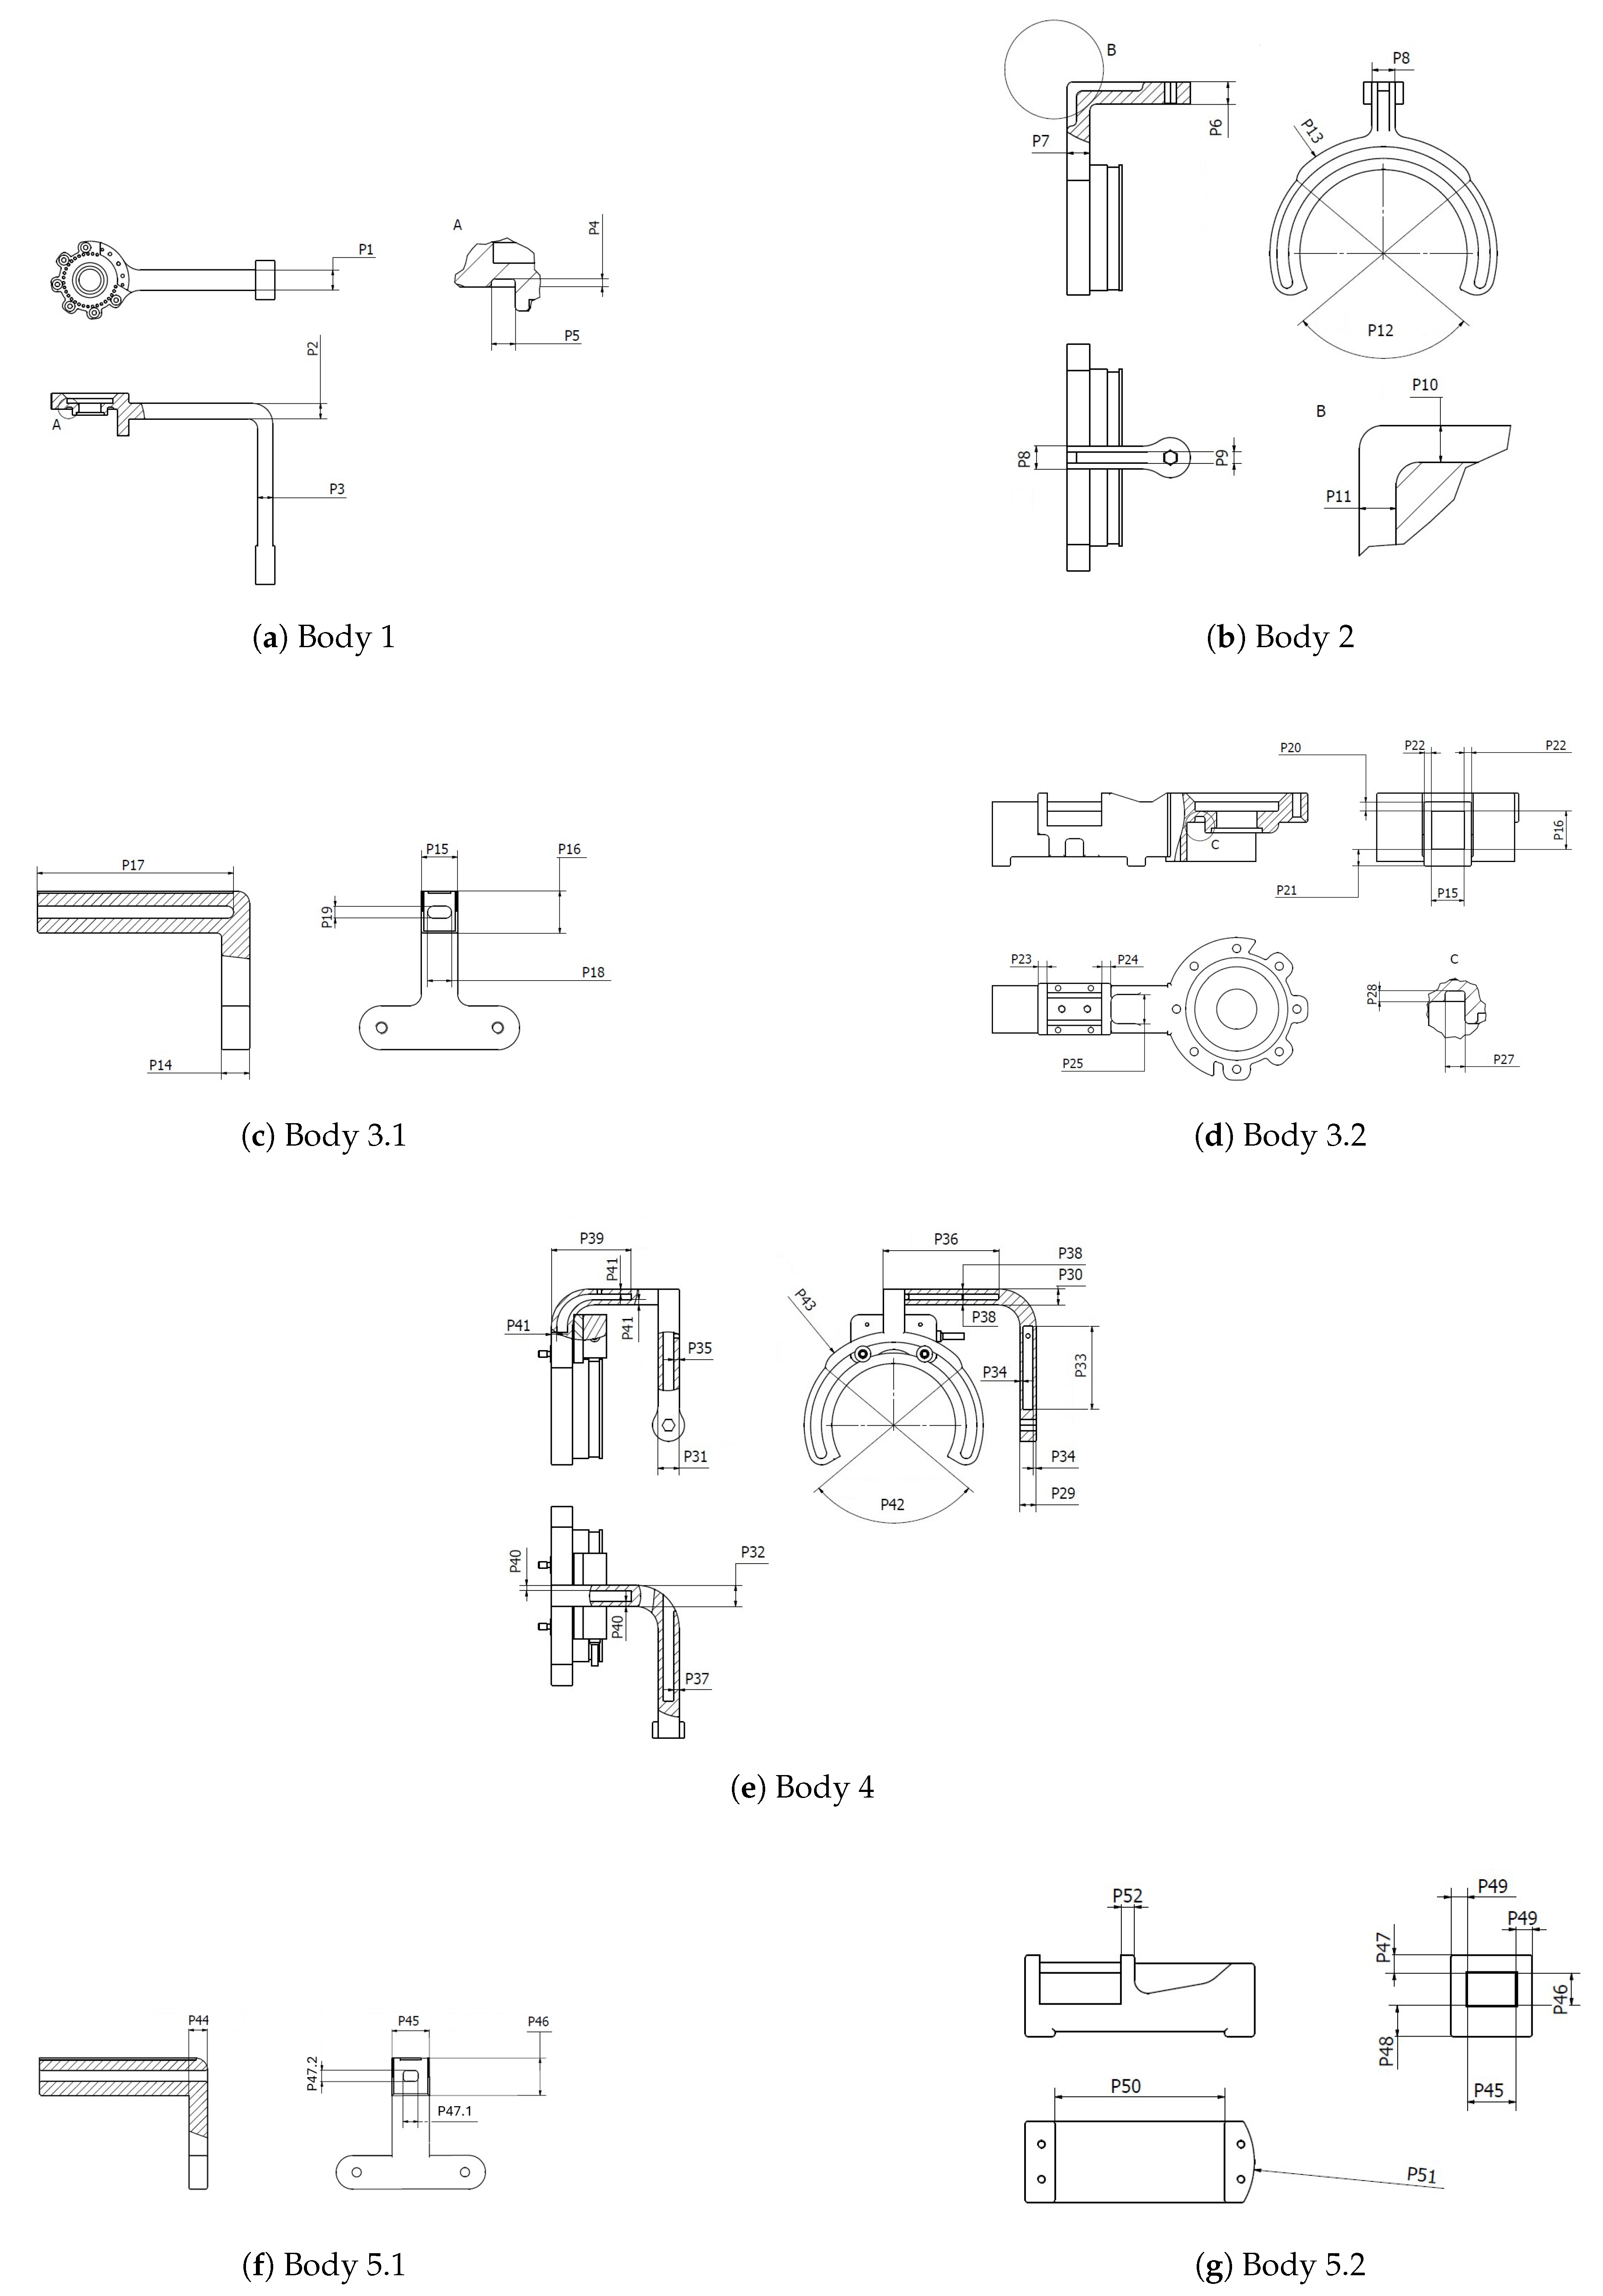
Table A2.
Considered ranges of parameters used in the final parametric optimization.
| Number | Initial Value [mm] | Lower range [mm] | Upper range [mm] |
|---|---|---|---|
| Body 1 | |||
| 1 | 20.0 | 10.0 | 40.0 |
| 2 | 15.0 | 10.0 | 40.0 |
| 3 | 15.0 | 10.0 | 20.0 |
| 4 | 1.0 | 0.2 | 2.0 |
| 5 | 10.0 | 0.2 | 24.0 |
| Body 2 | |||
| 6 | 15.0 | 10.0 | 20.0 |
| 7 | 11.0 | 10.0 | 20.0 |
| 8 | 20.0 | 10.0 | 30.0 |
| 9 | 8.0 | 0.2 | (P8 - 6.0) |
| 10 | 5.0 | 0.2 | (P6 - 4.0) |
| 11 | 5.0 | 0.2 | (P7 - 4.0) |
| Body 3 | |||
| 14 | 14. | 11.0 | 14.0 |
| 15 | 18. | 18.0 | 63.0 |
| 16 | 21.0 | 10.0 | 29.7 |
| 17 | 98.0 | 0.0 | 105.0 |
| 18 | 8.0 | 0.0 | (P15 - 10.0) |
| 19 | 6.0 | 0.0 | (P16 - 10.0) |
| 20 | 5.0 | 3.0 | (37.7 - P16)/2 |
| 21 | 9.1 | 8.1 | (42.8 - P16)/2 |
| 22 | 5.0 | .0 | (73.0 - P15)/2 |
| 23 | 5.0 | 3.0 | 30.0 |
| 24 | 5.0 | 3.0 | 13.0 |
| 25 | 16.0 | 0.0 | (P15 + 2 · P22) |
| 27 | 5.5 | 0.0 | 8.0 |
| 28 | 3.0 | 0.0 | 3.0 |
| Body 4 | |||
| 29 | 20.0 | 15.0 | 30.0 |
| 30 | 20.0 | 15.0 | 30.0 |
| 31 | 20.0 | 14.0 | 30.0 |
| 32 | 20.0 | 14.0 | 30.0 |
| 33 | 78.0 | 22.0 | 98.0 |
| 34 | 4.0 | 3.0 | (P29/2 - 2.0) |
| 35 | 5.0 | 3.0 | (P31/2 - 2.0) |
| 36 | 80.0 | 45.0 | 100.0 |
| 37 | 5.0 | 3.0 | (P31/2 - 2.0) |
| 38 | 4.0 | 3.0 | (P30/2 - 2.0) |
| 39 | 80.0 | 40.0 | 100.0 |
| 40 | 5.0 | 3.0 | (P32/2 - 2.0) |
| 41 | 4.0 | 3.0 | (P30/2 - 2.0) |
| 42 | 100.0 | 30.0 | 150.0 |
| 43 | 180.0 | 170.0 | 200.0 |
| Body 5 | |||
| 44 | 10.0 | 8.0 | 10.0 |
| 45 | 20.0 | 18.0 | 63.0 |
| 46 | 20.0 | 10.0 | 29.7 |
| 47.1 | 8.0 | 0.0 | (P15 - 10.0) |
| 47.2 | 6.0 | 0.0 | (P16 - 10.0) |
| 47.3 | 7.0 | 6.0 | 8.0 |
| 48 | 6.0 | 5.0 | 7.0 |
| 49 | 5.0 | 5.0 | 8.0 |
| 50 | 55.0 | 0.0 | 65.0 |
| 51 | 20.0 | (P45 + 2 · P49)/2 | 100.0 |
| 52 | 5.0 | 3.0 | 7.0 |
Appendix D. Topology Optimization
Appendix D.1. Inclusion/Exclusion Regions
Figure A11.
Exclusion (red) and inclusion (blue) regions for topology optimization.
Appendix D.2. Raw Geometrical Results
Figure A12.
Results of topology optimization for Body 1.
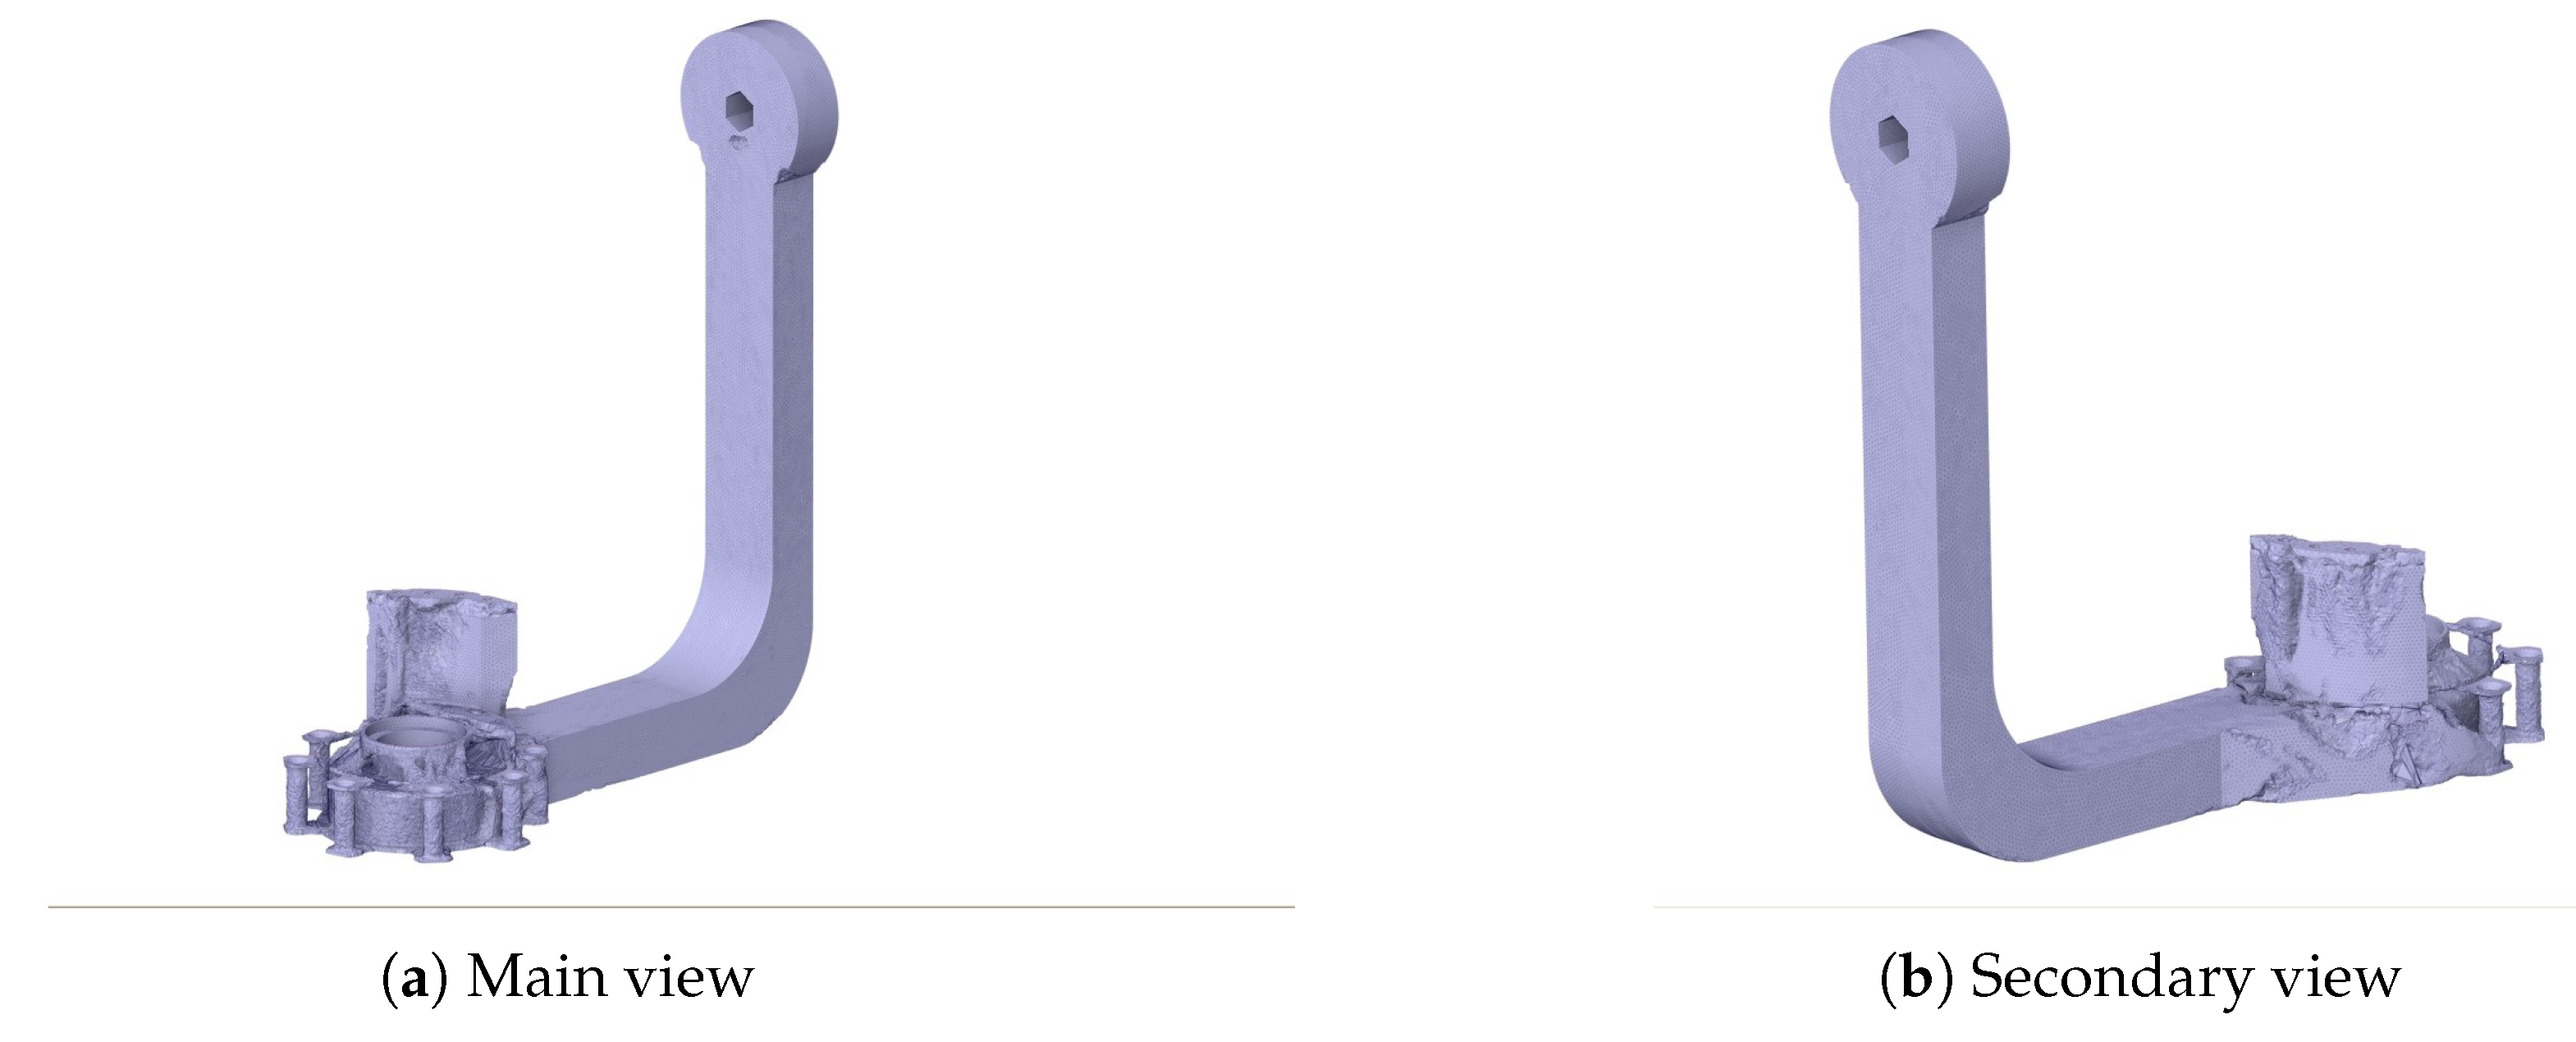
Figure A13.
Results of topology optimization for Body 2.
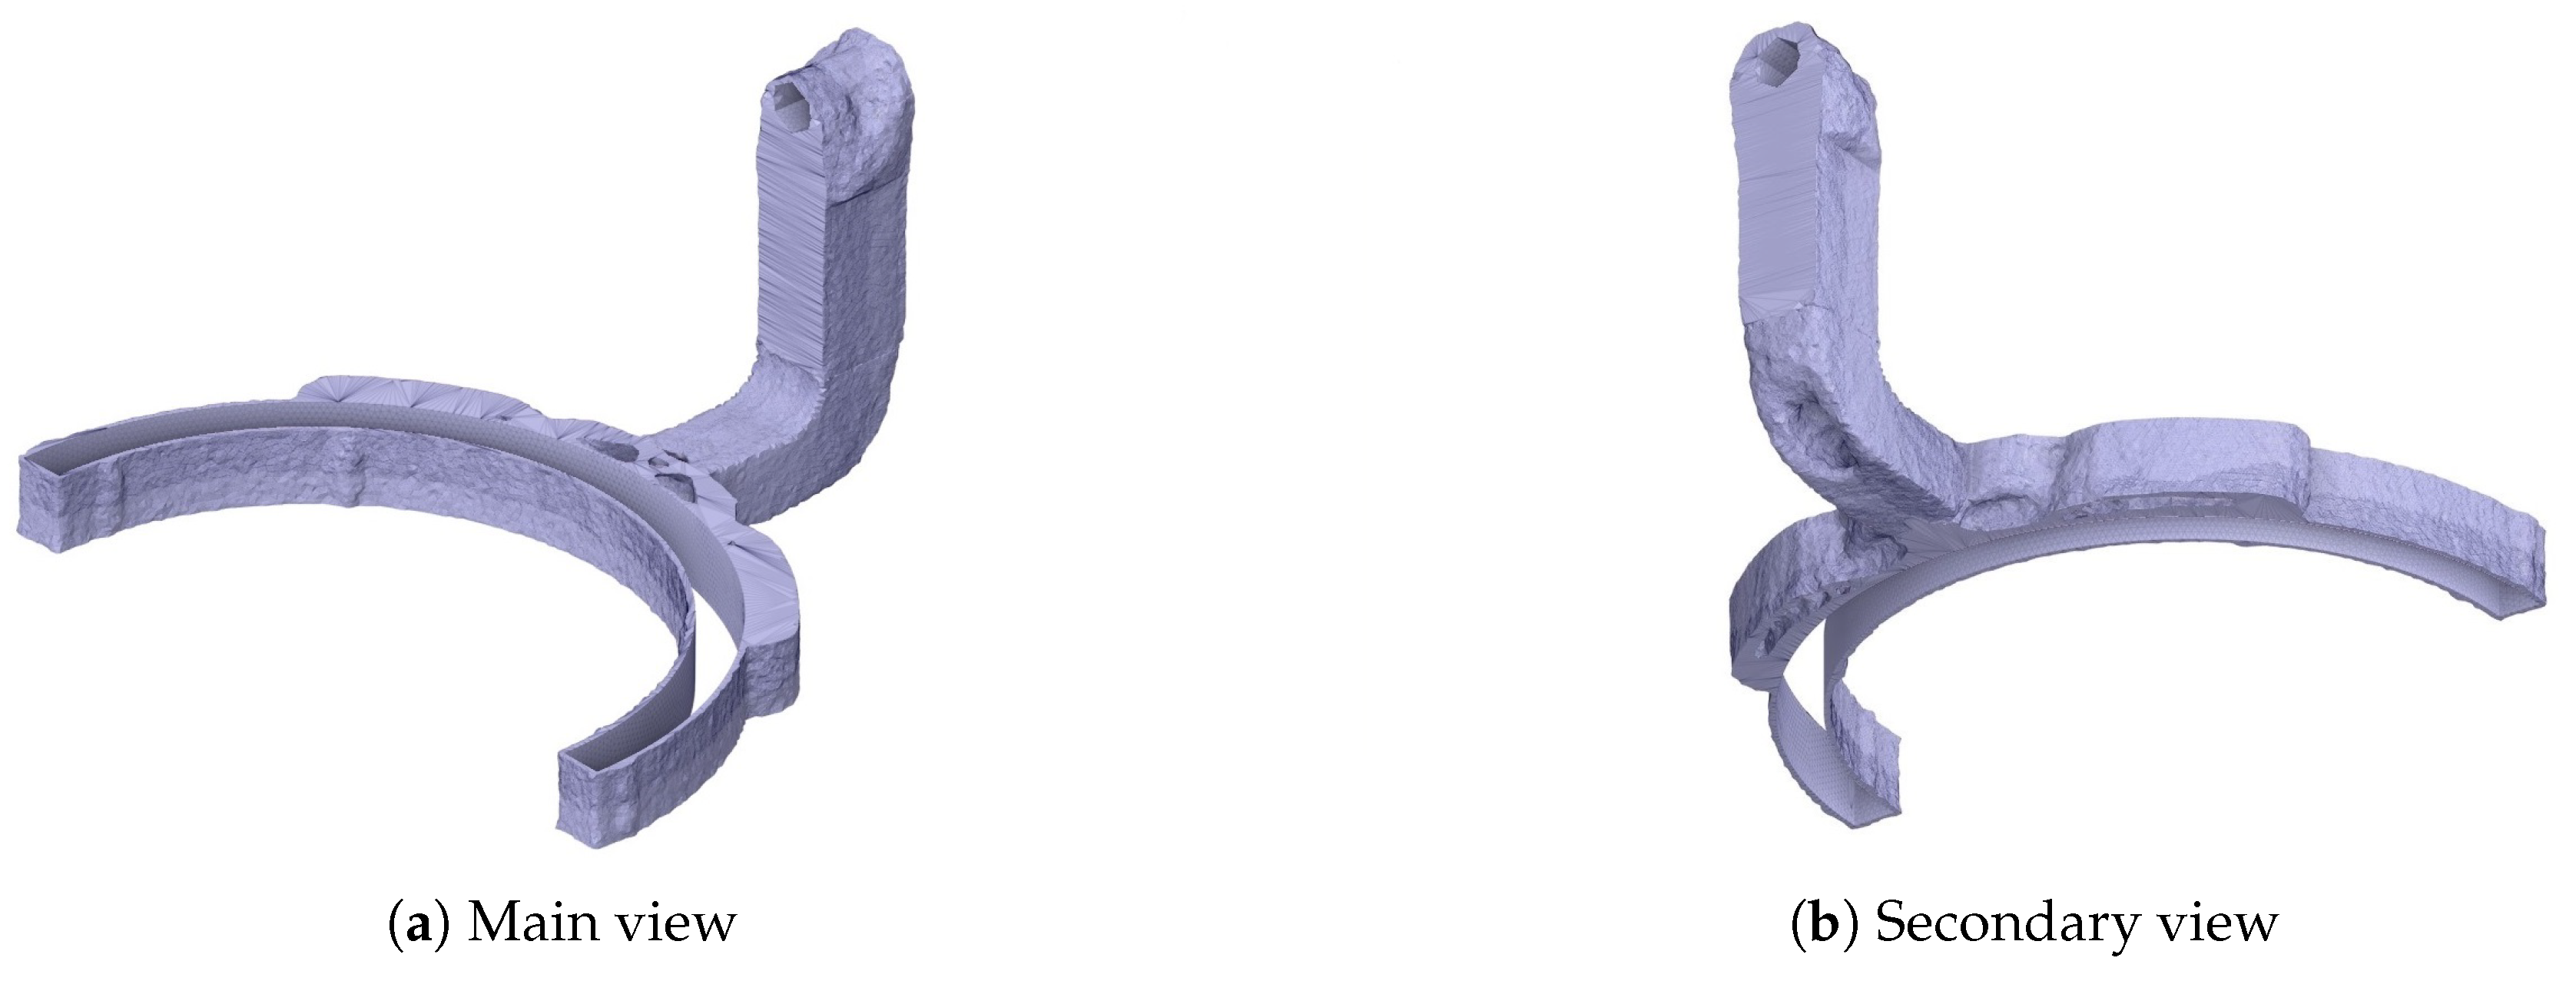
Figure A14.
Results of topology optimization for Body 3.1.
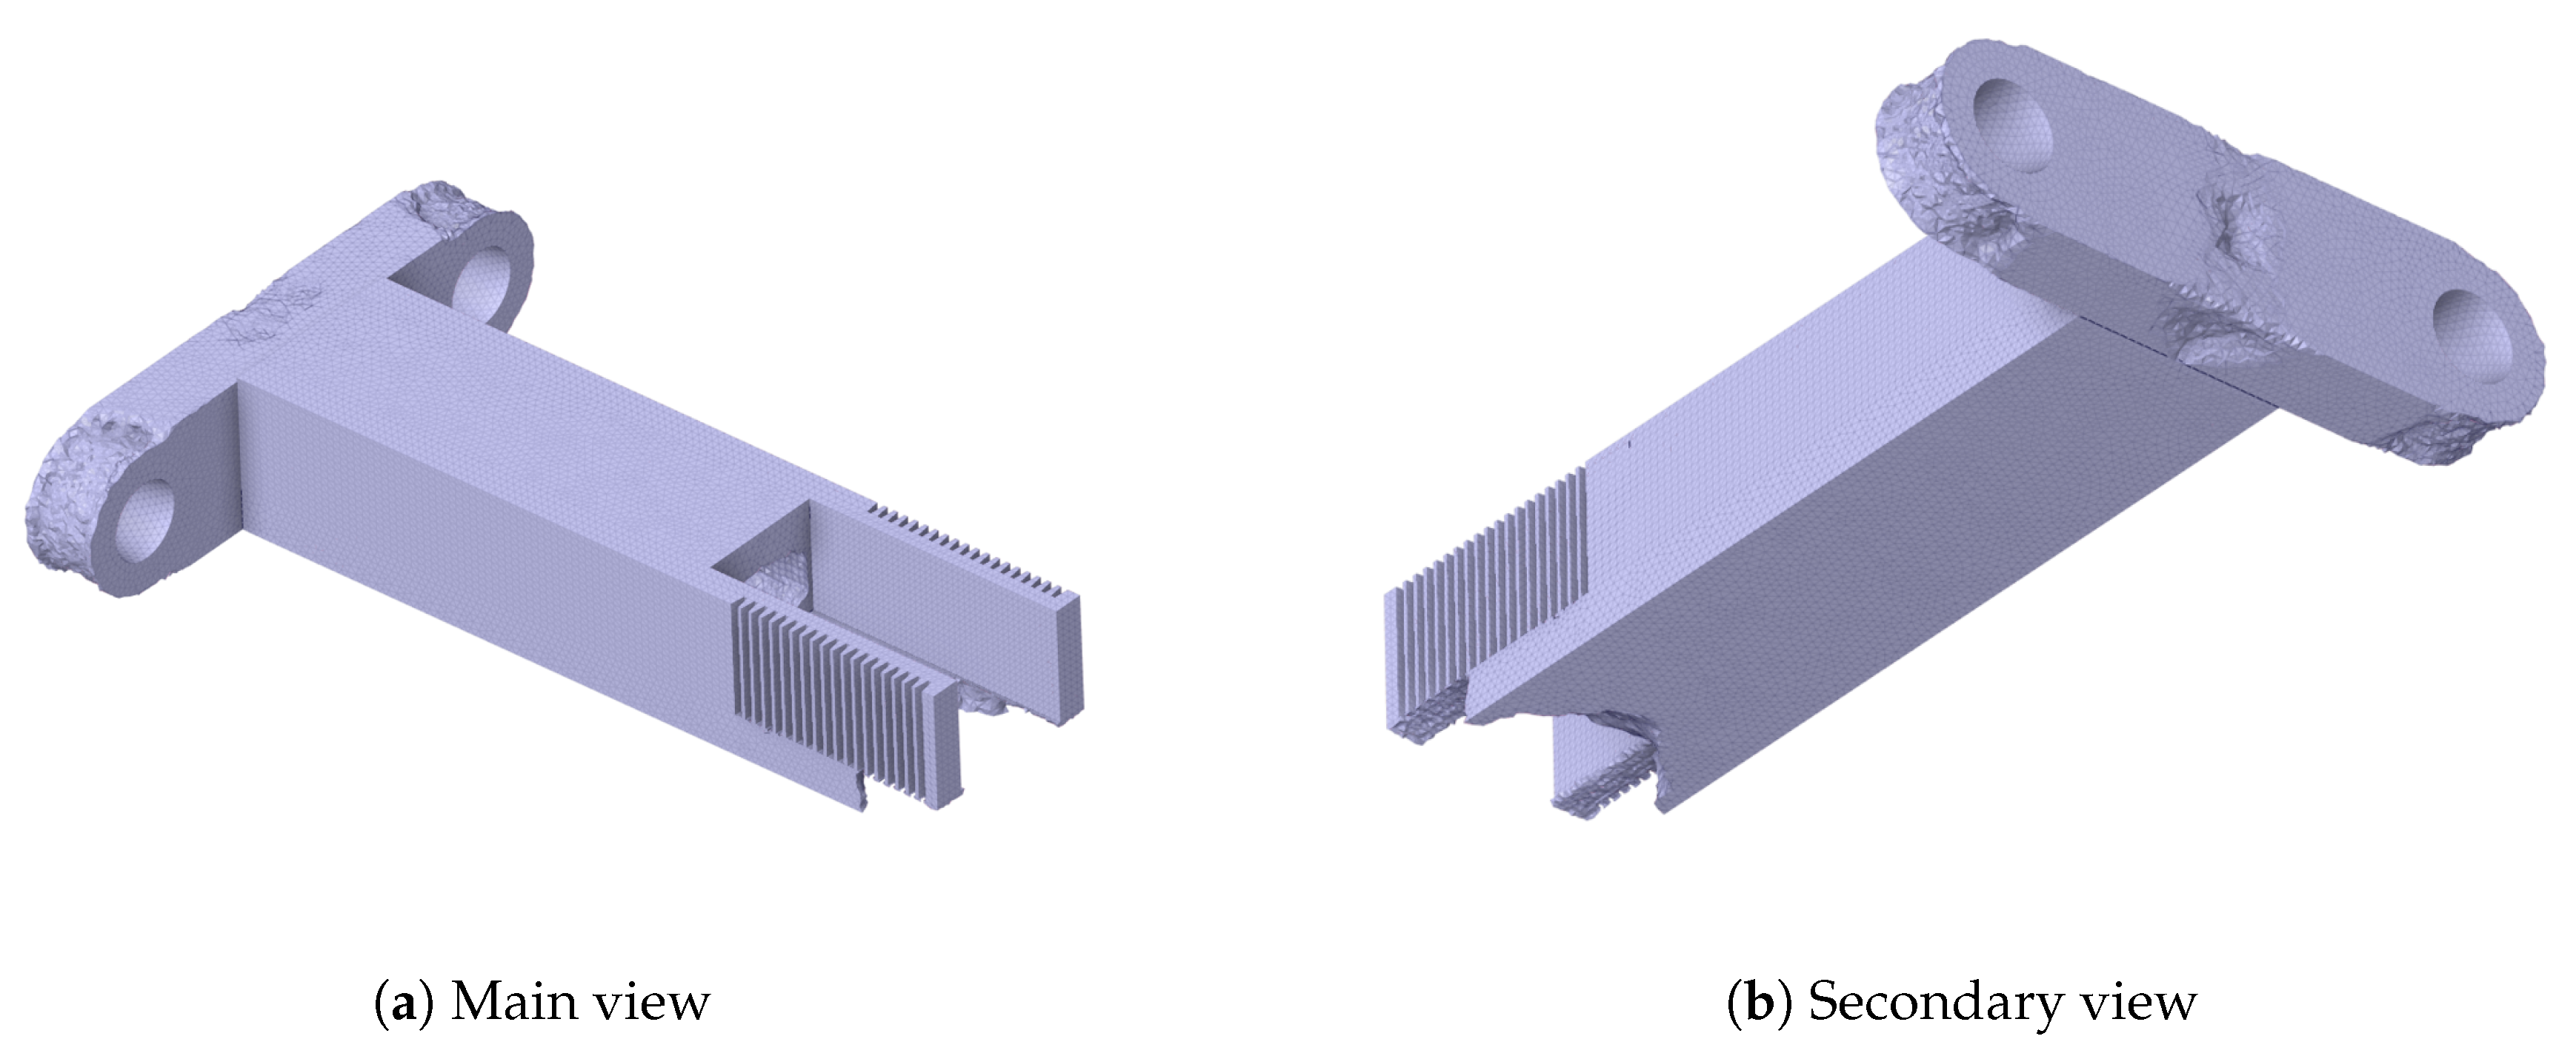
Figure A15.
Results of topology optimization for Body 3.2.
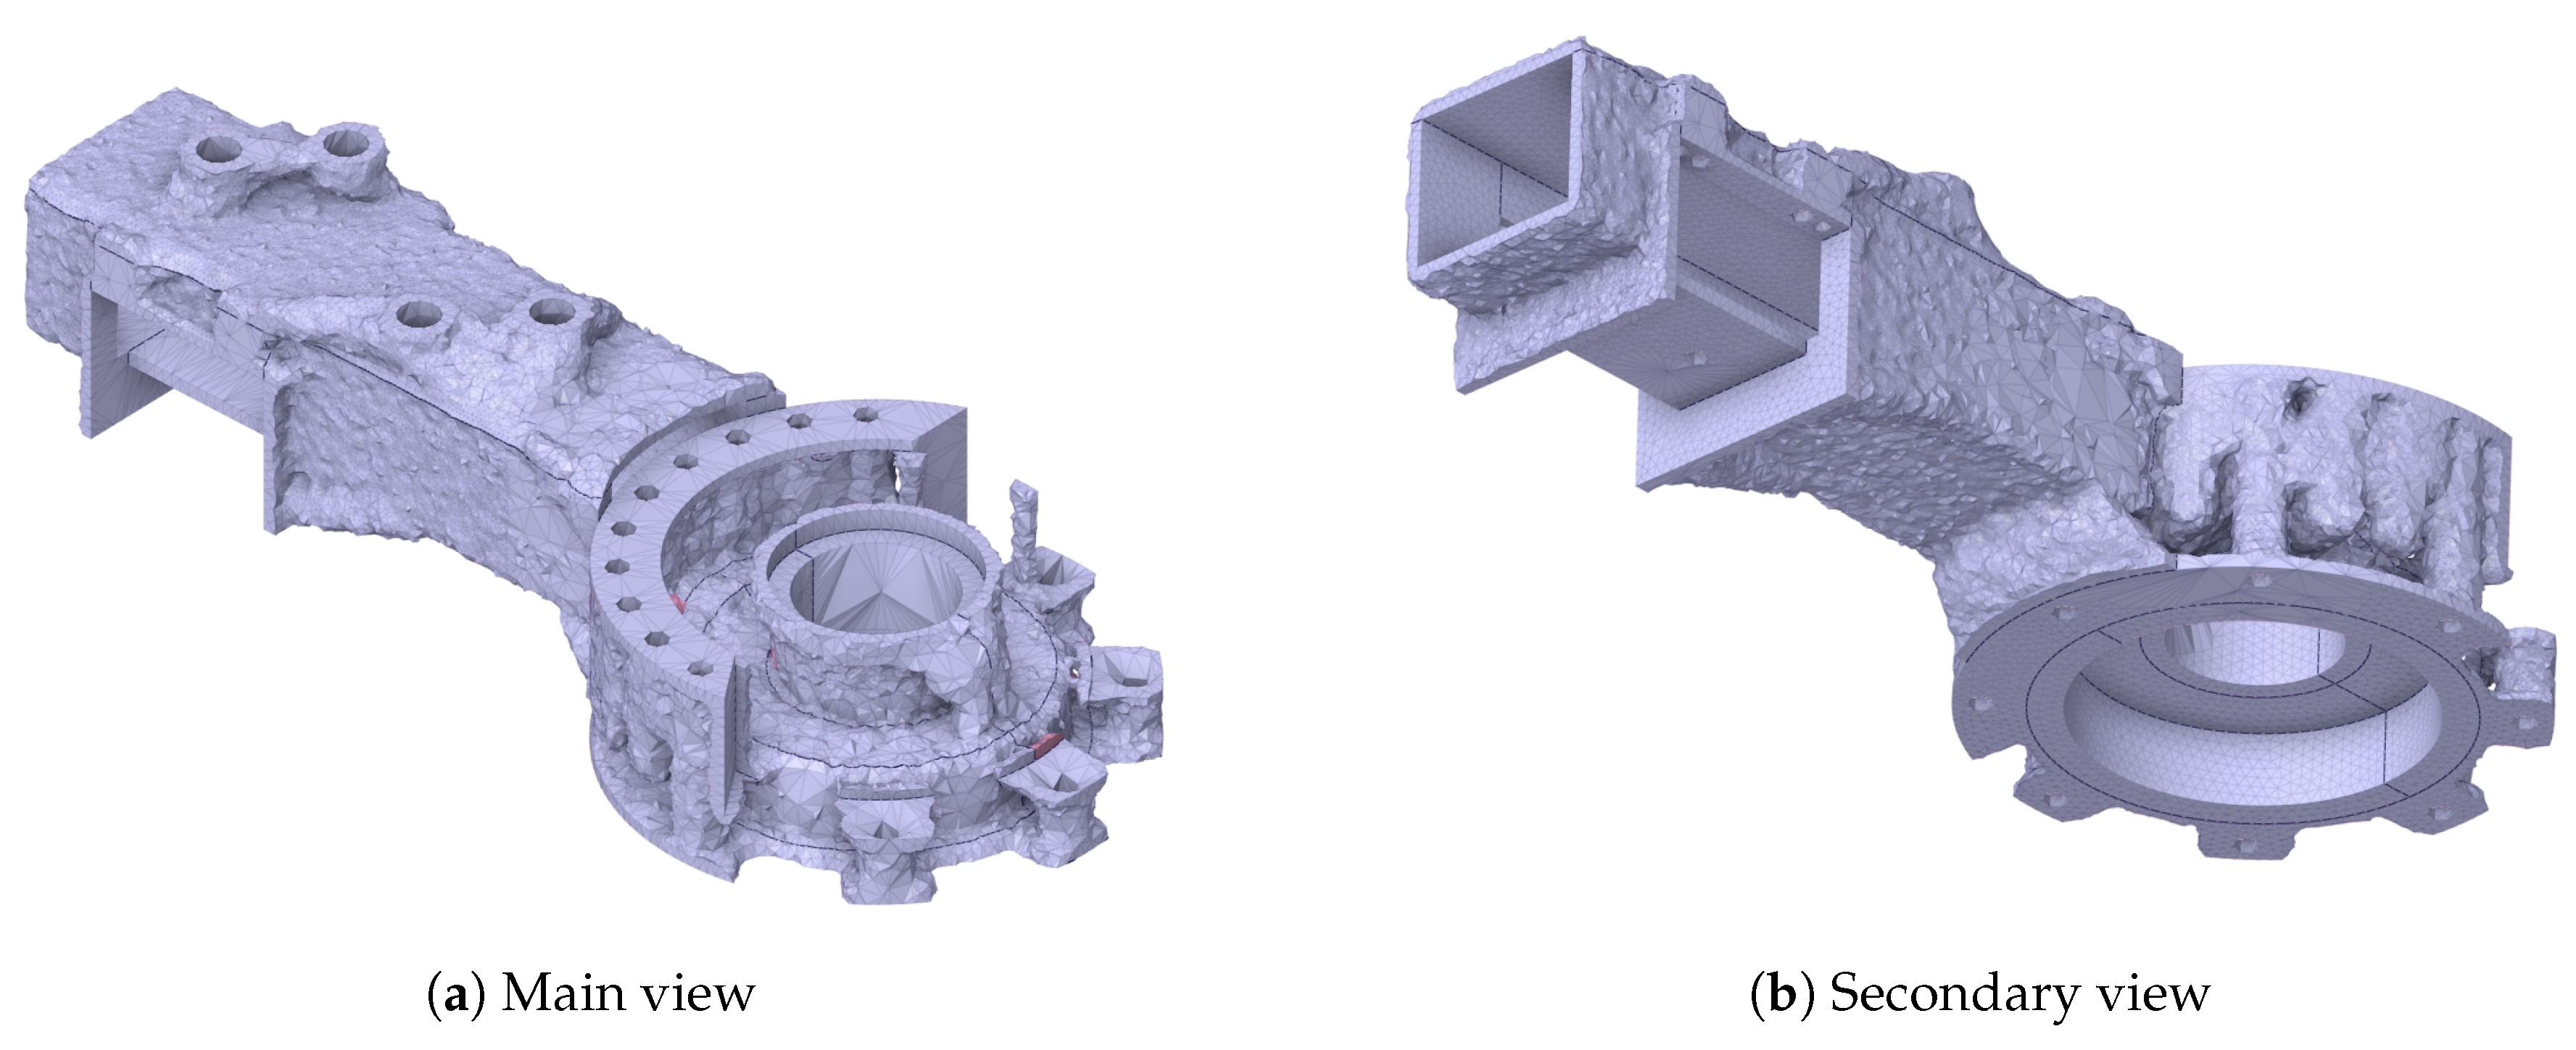
Figure A16.
Results of topology optimization for Body 4.
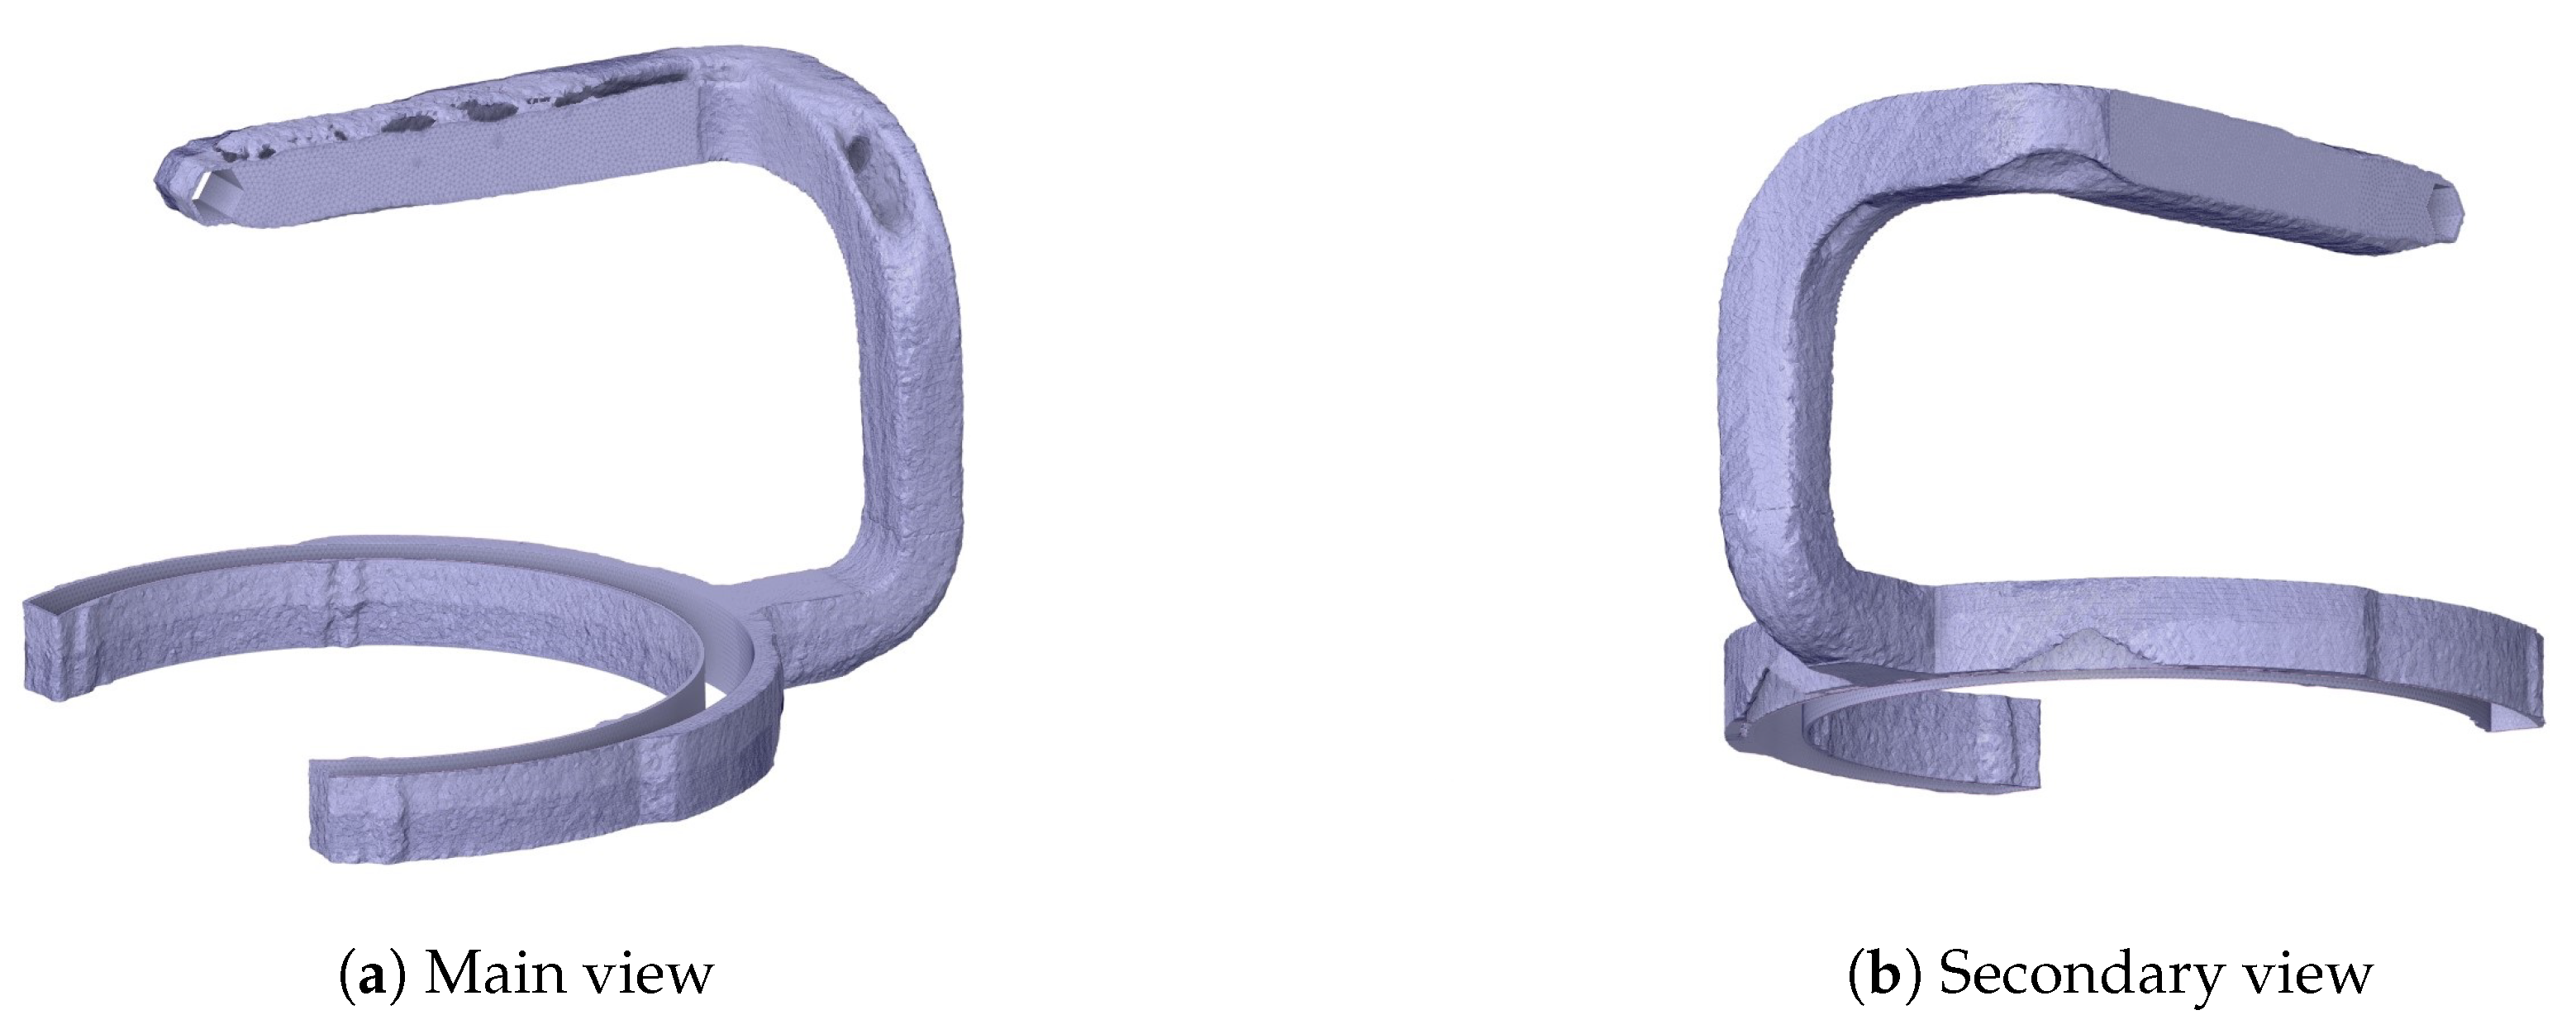
Figure A17.
Results of topology optimization for Body 5.
Appendix E. Results - Deformation and Stress Distribution
Appendix E.1. Initial Strength Analysis
Figure A18.
Results of static analysis for Body 1.
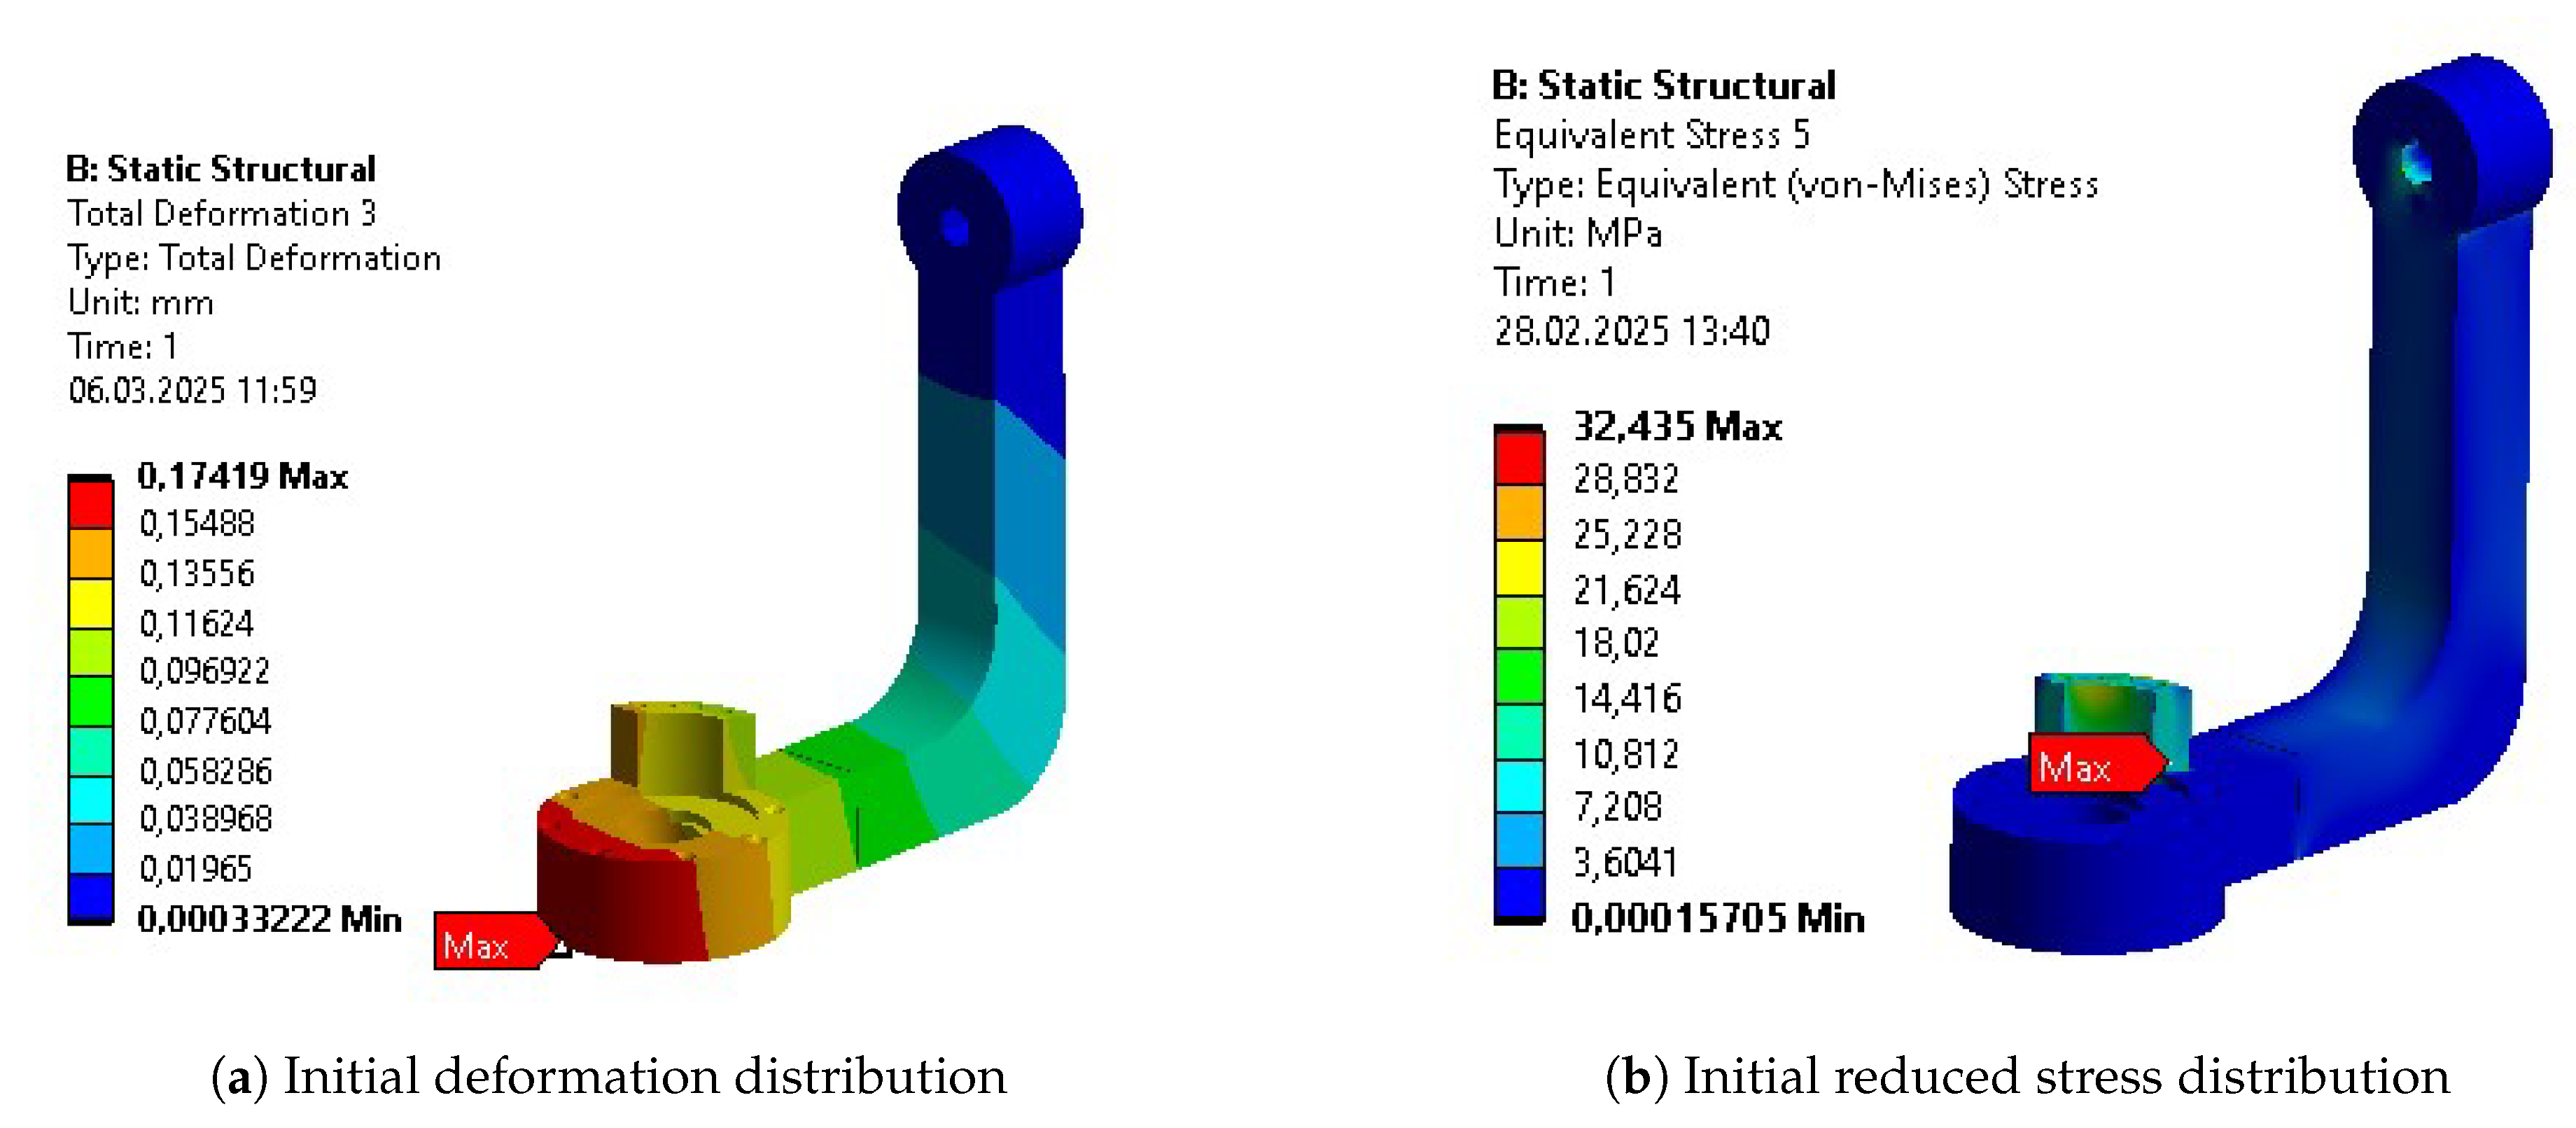
Figure A19.
Results of static analysis for Body 2.
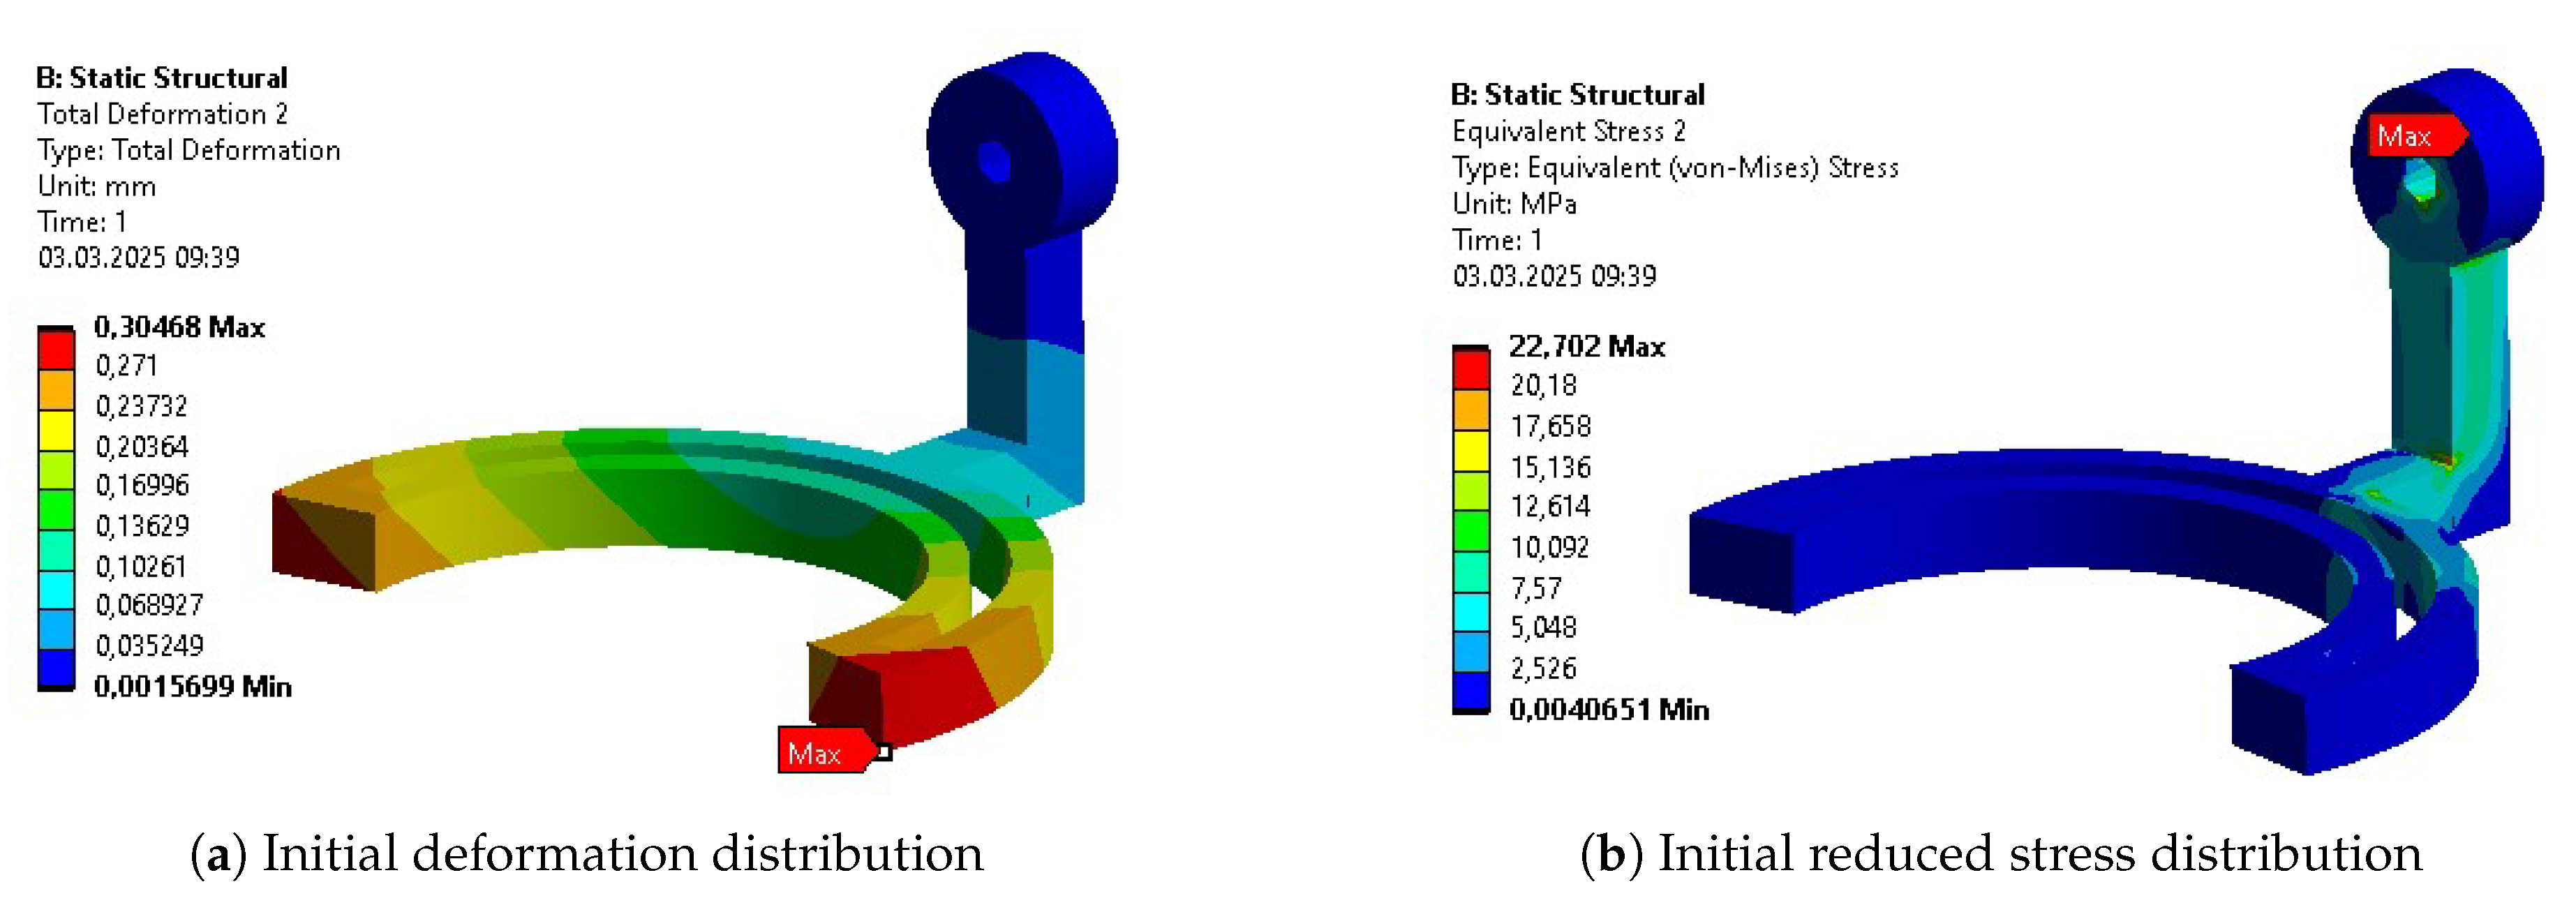
Figure A20.
Results of static analysis for Body 3.
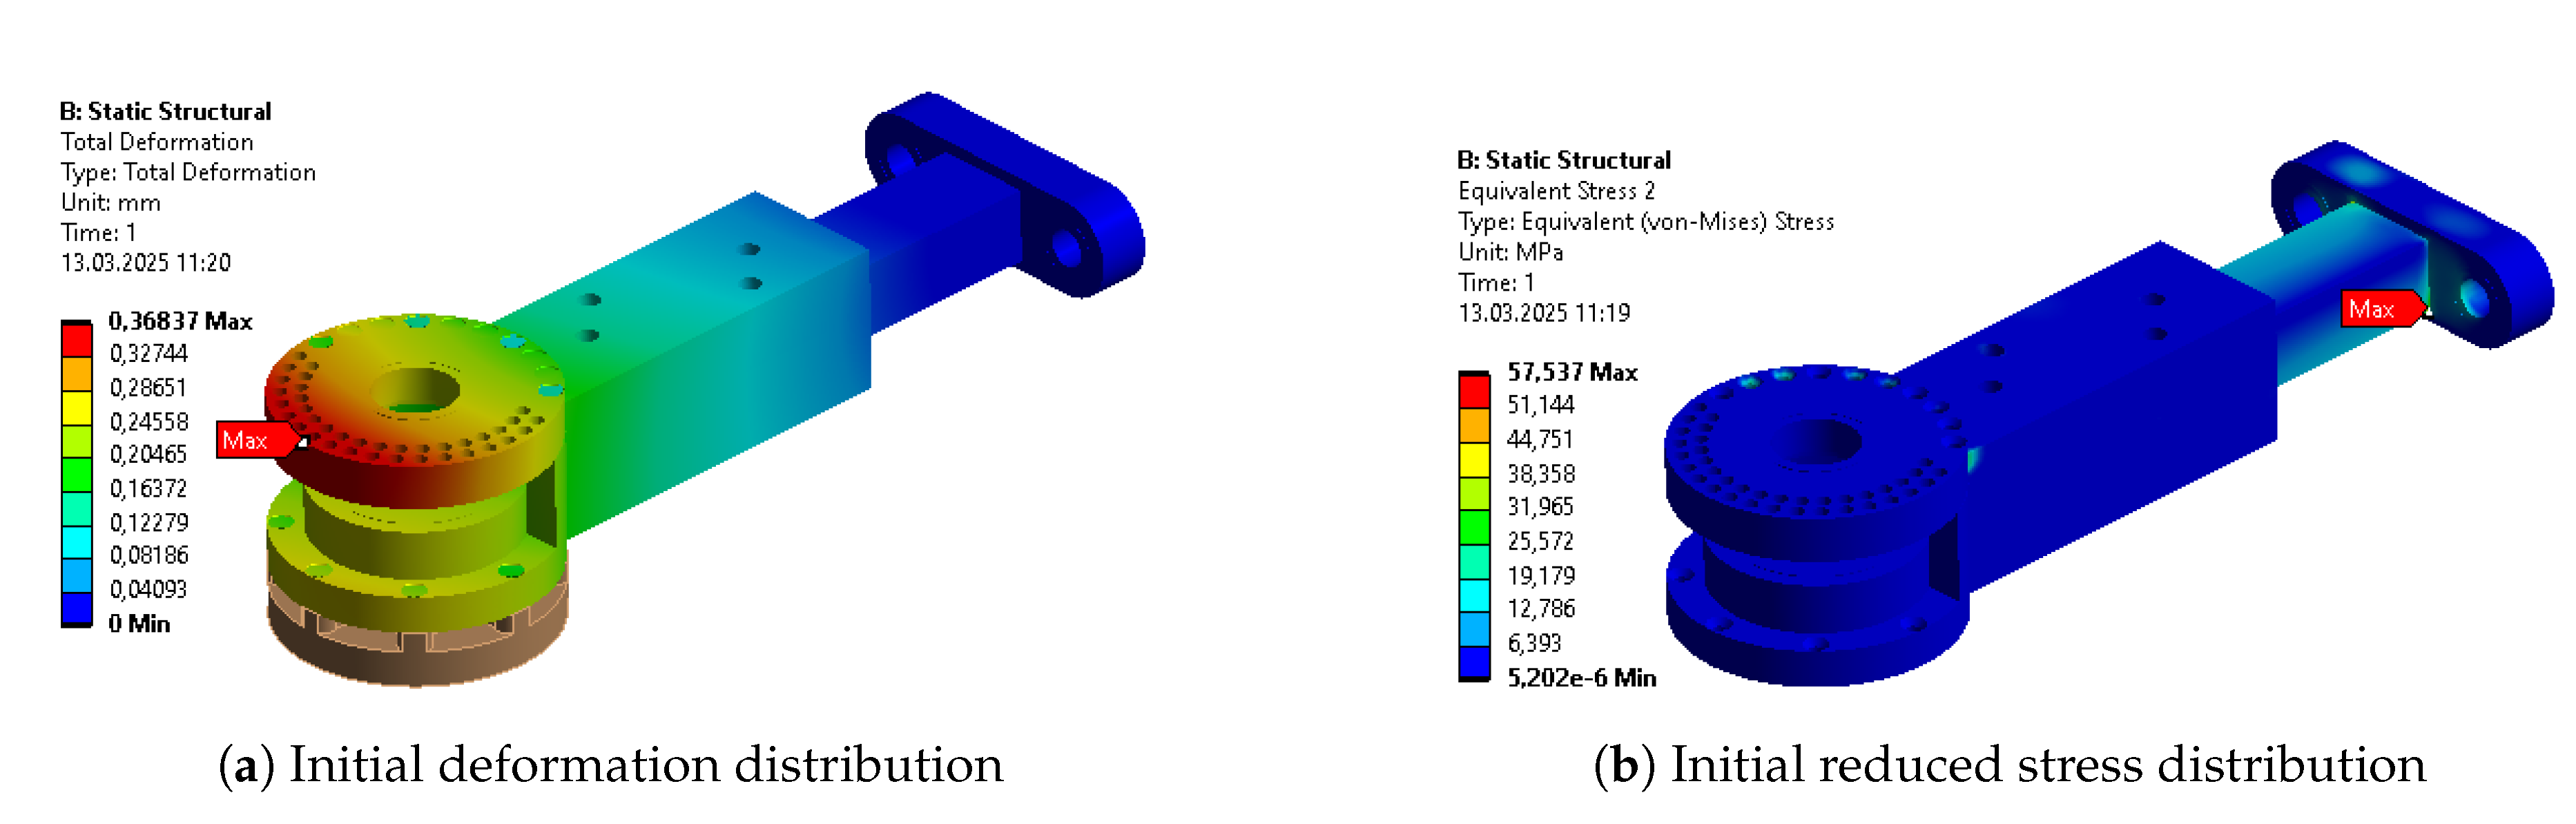
Figure A21.
Results of static analysis for Body 4.
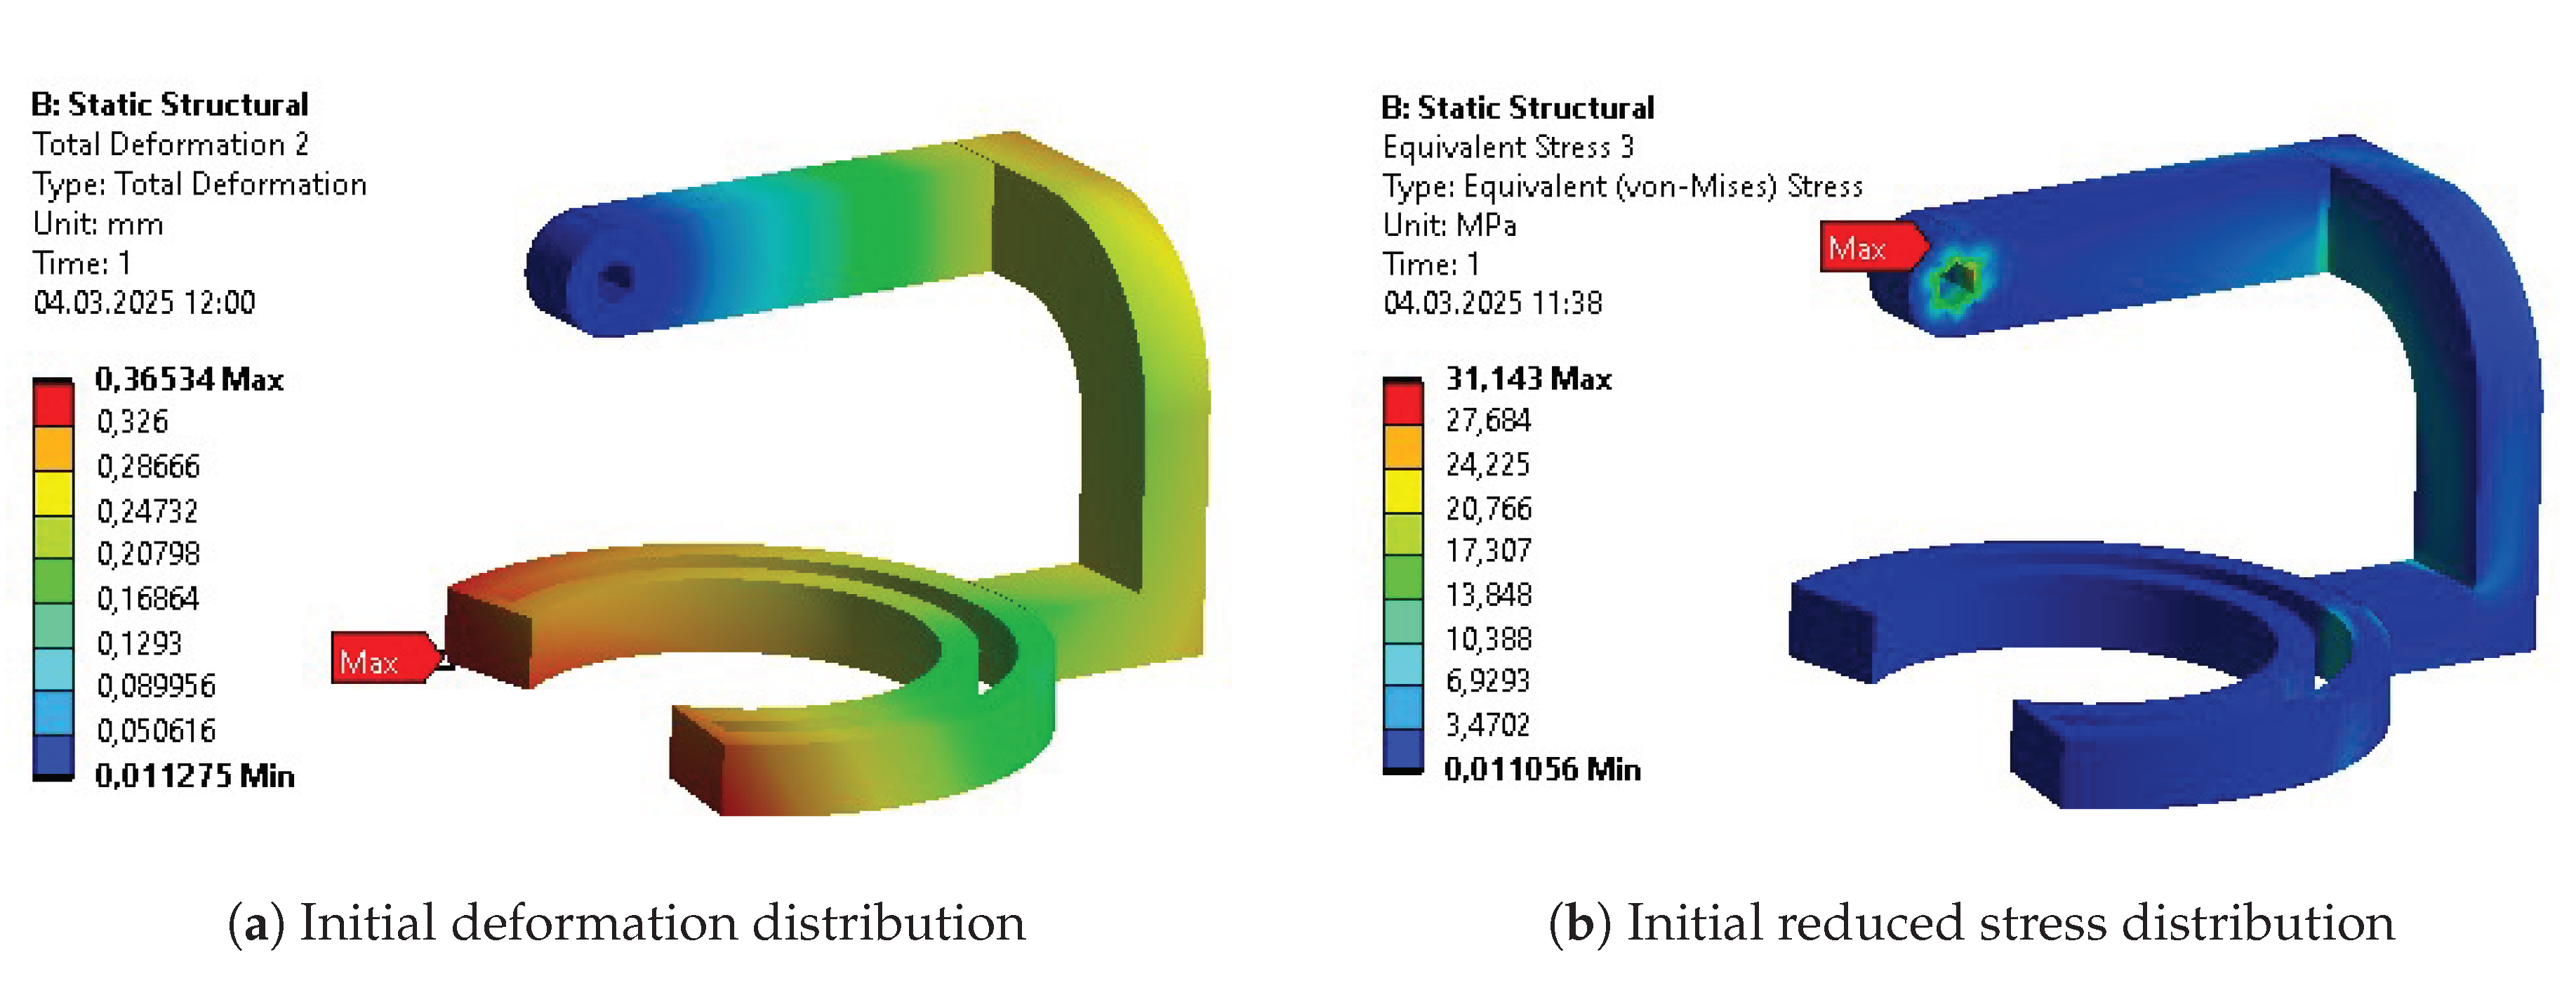
Figure A22.
Results of static analysis for Body 5.
Appendix E.2. Initial Parametric Optimization
Figure A23.
Results after initial parametric optimization of Body 1.
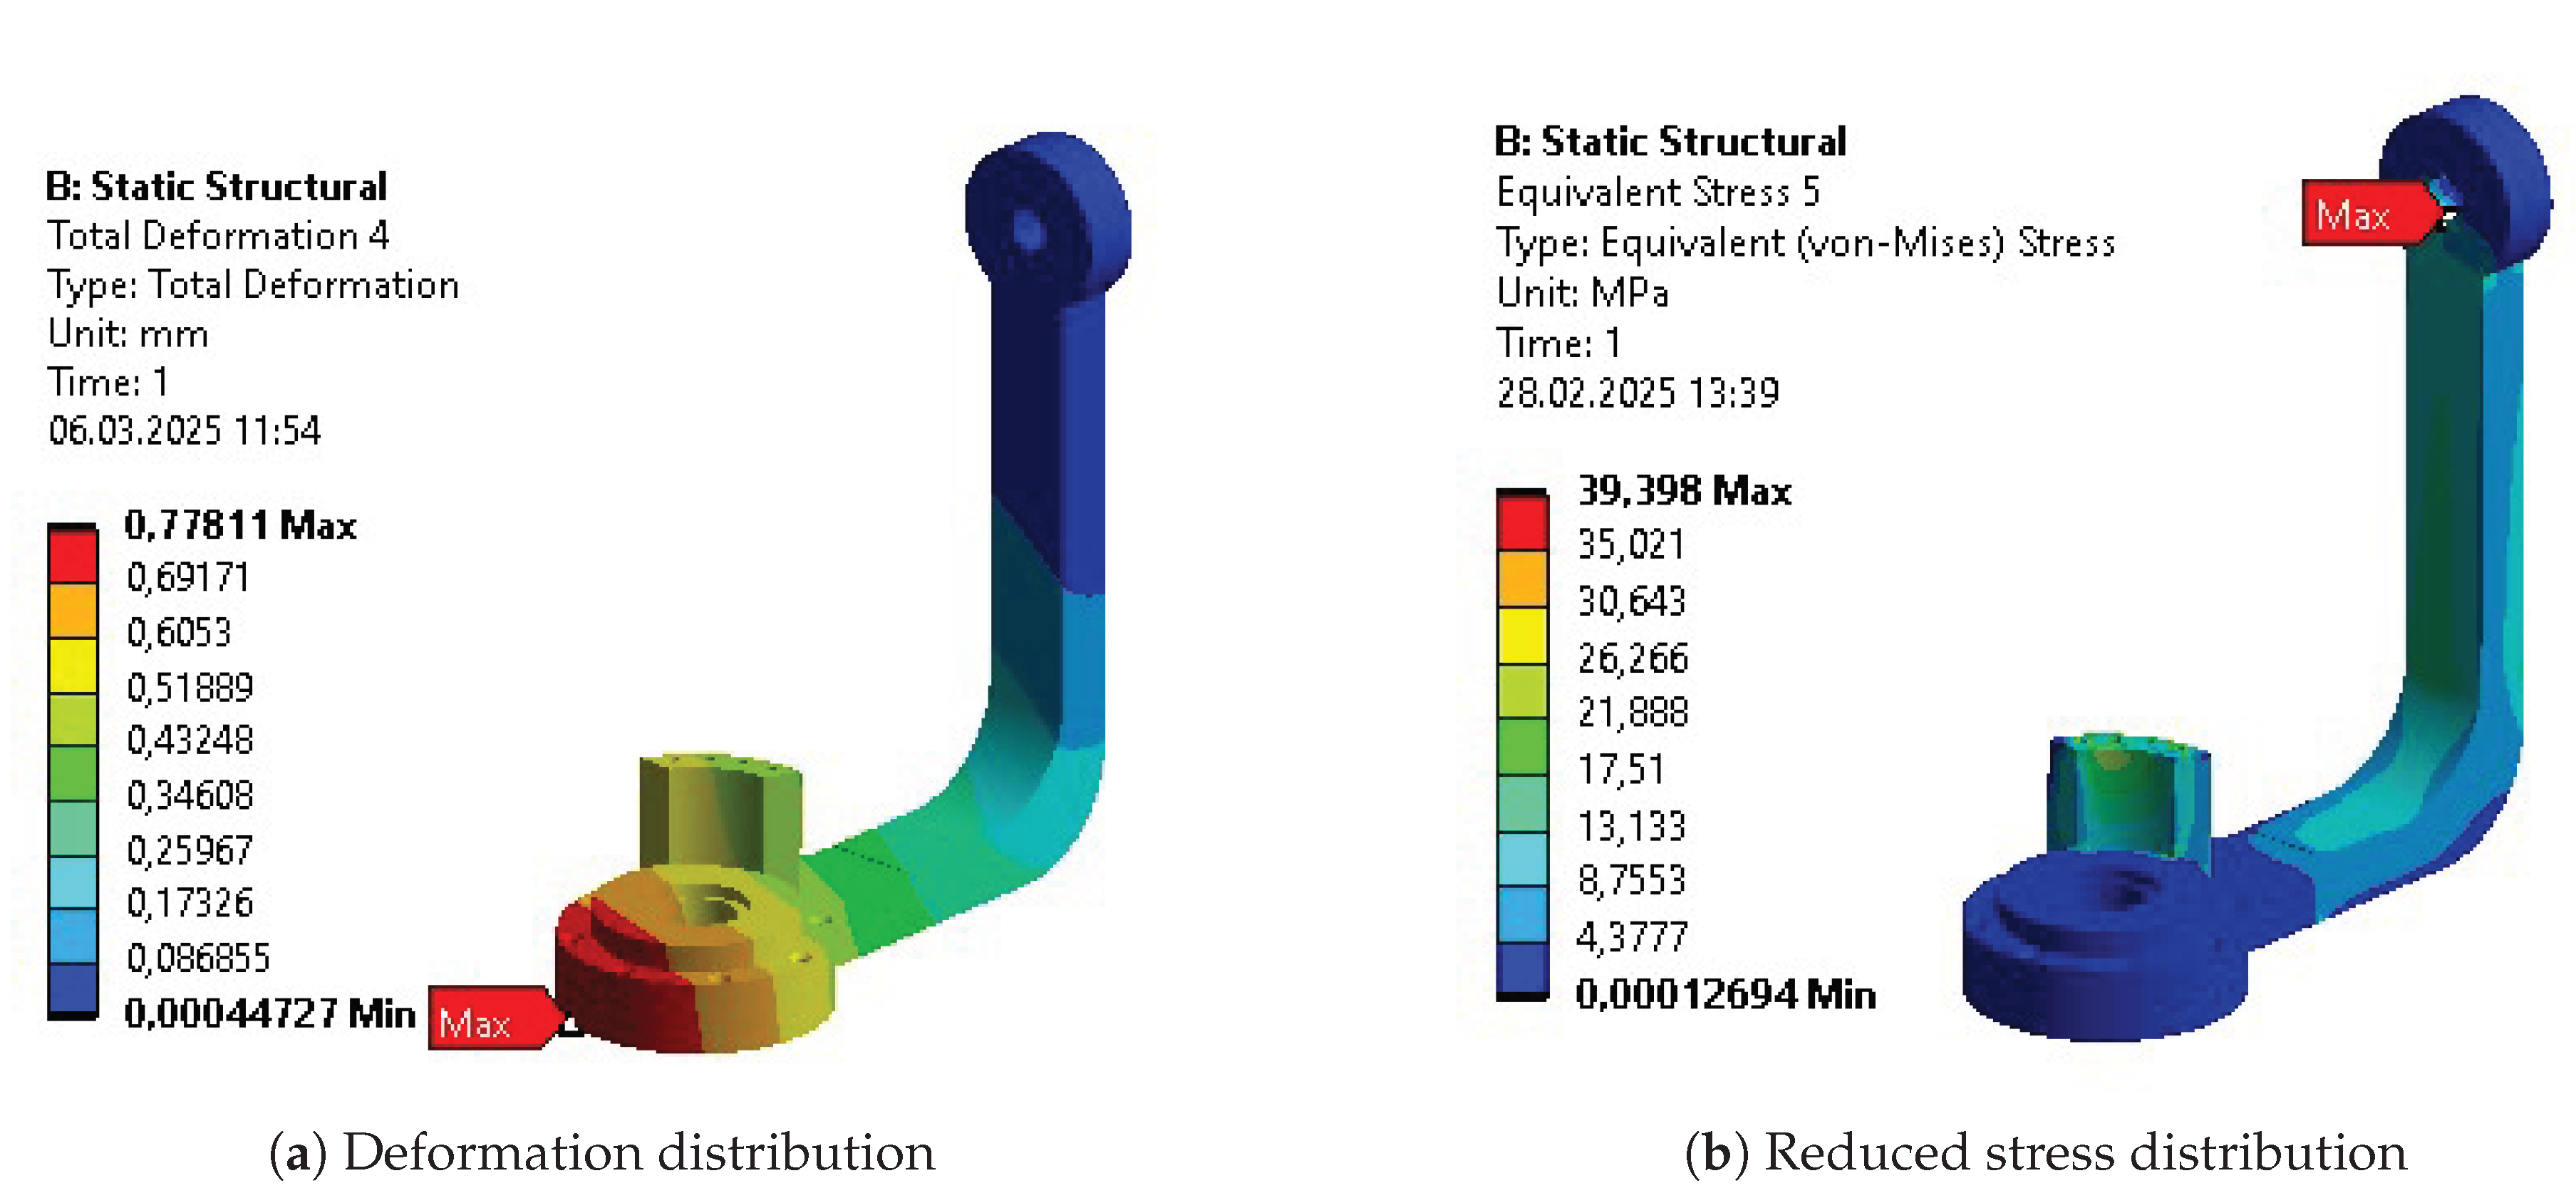
Figure A24.
Results after initial parametric optimization of Body 2.
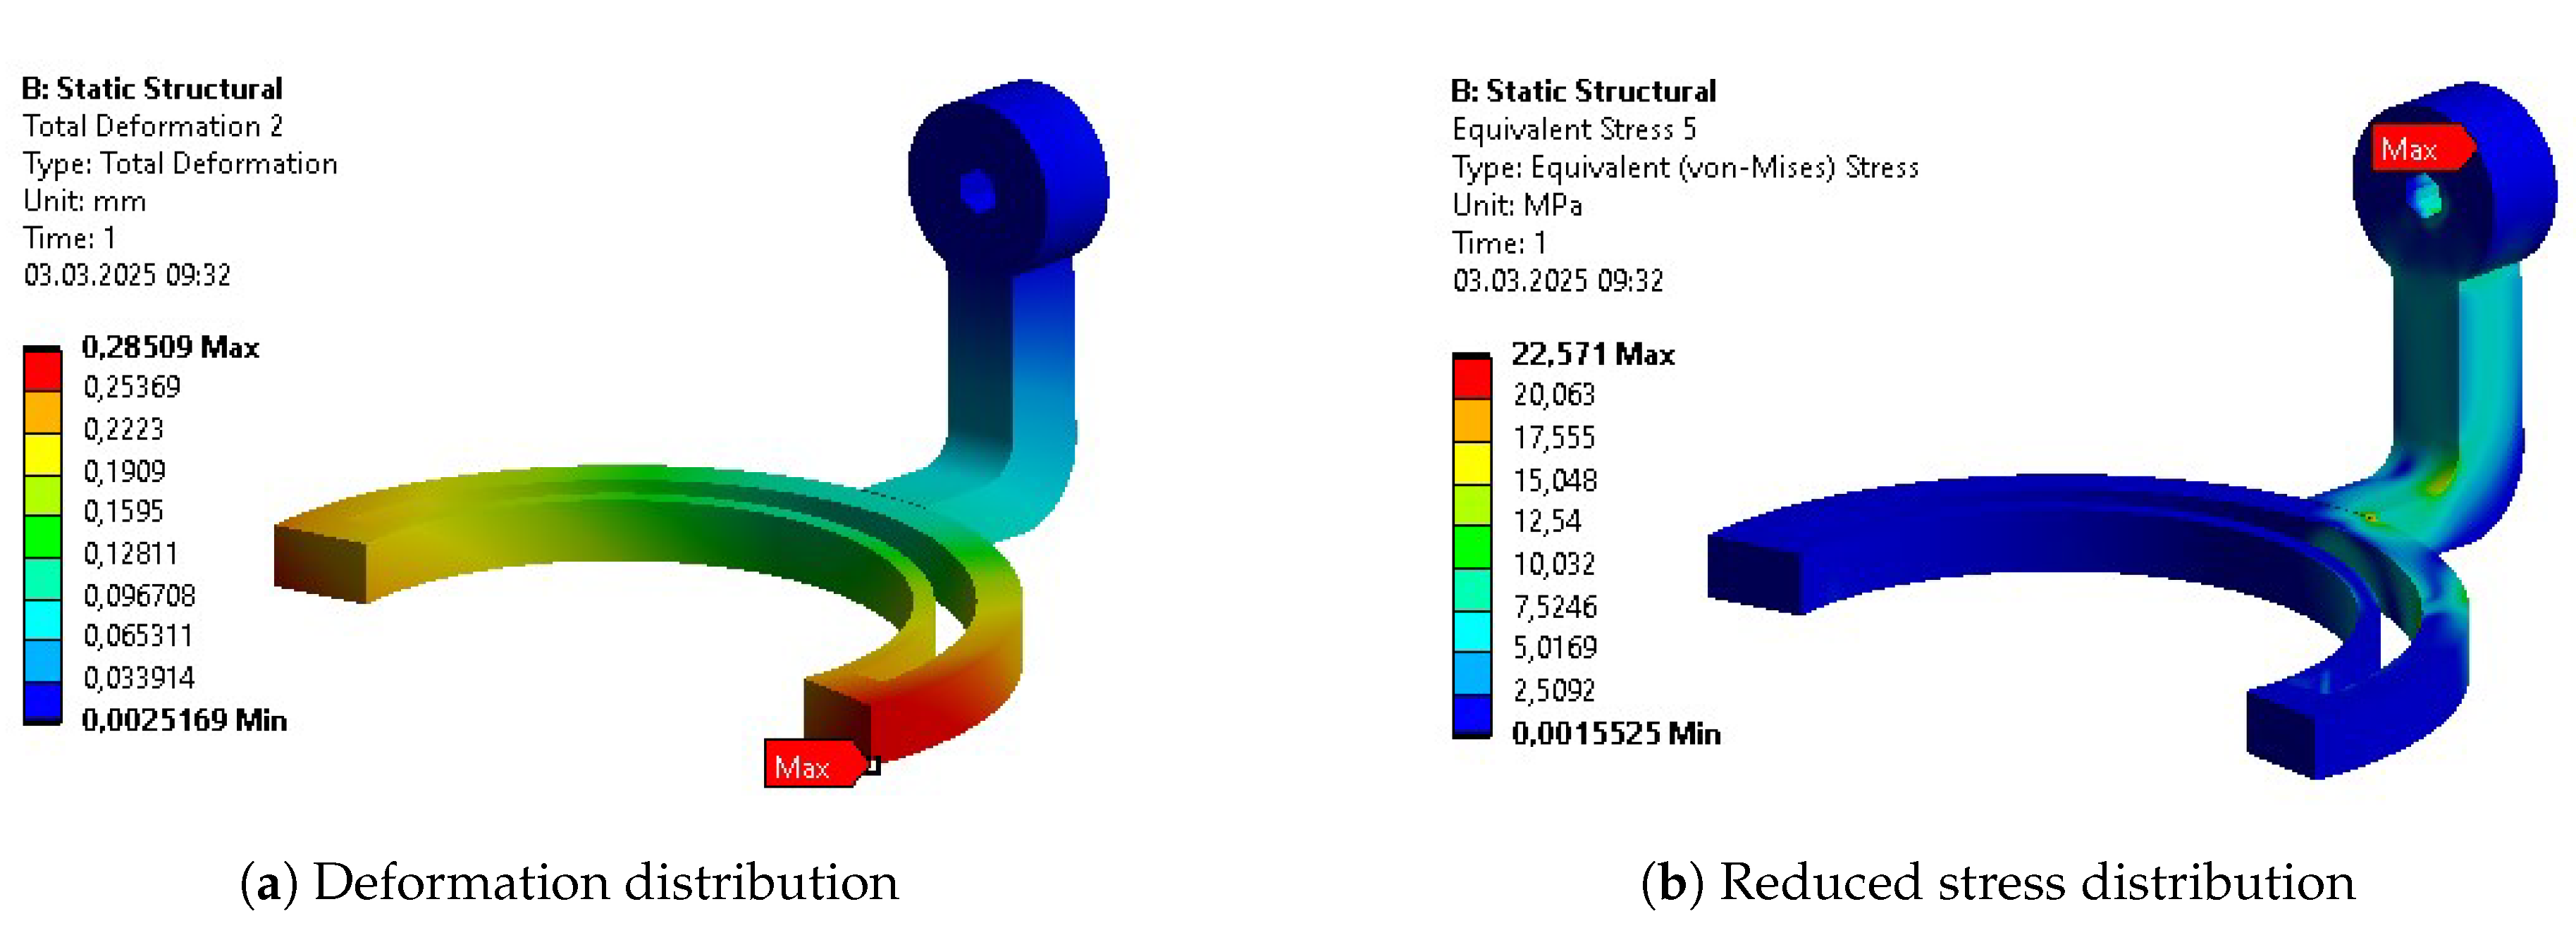
Figure A25.
Results after initial parametric optimization of Body 3.
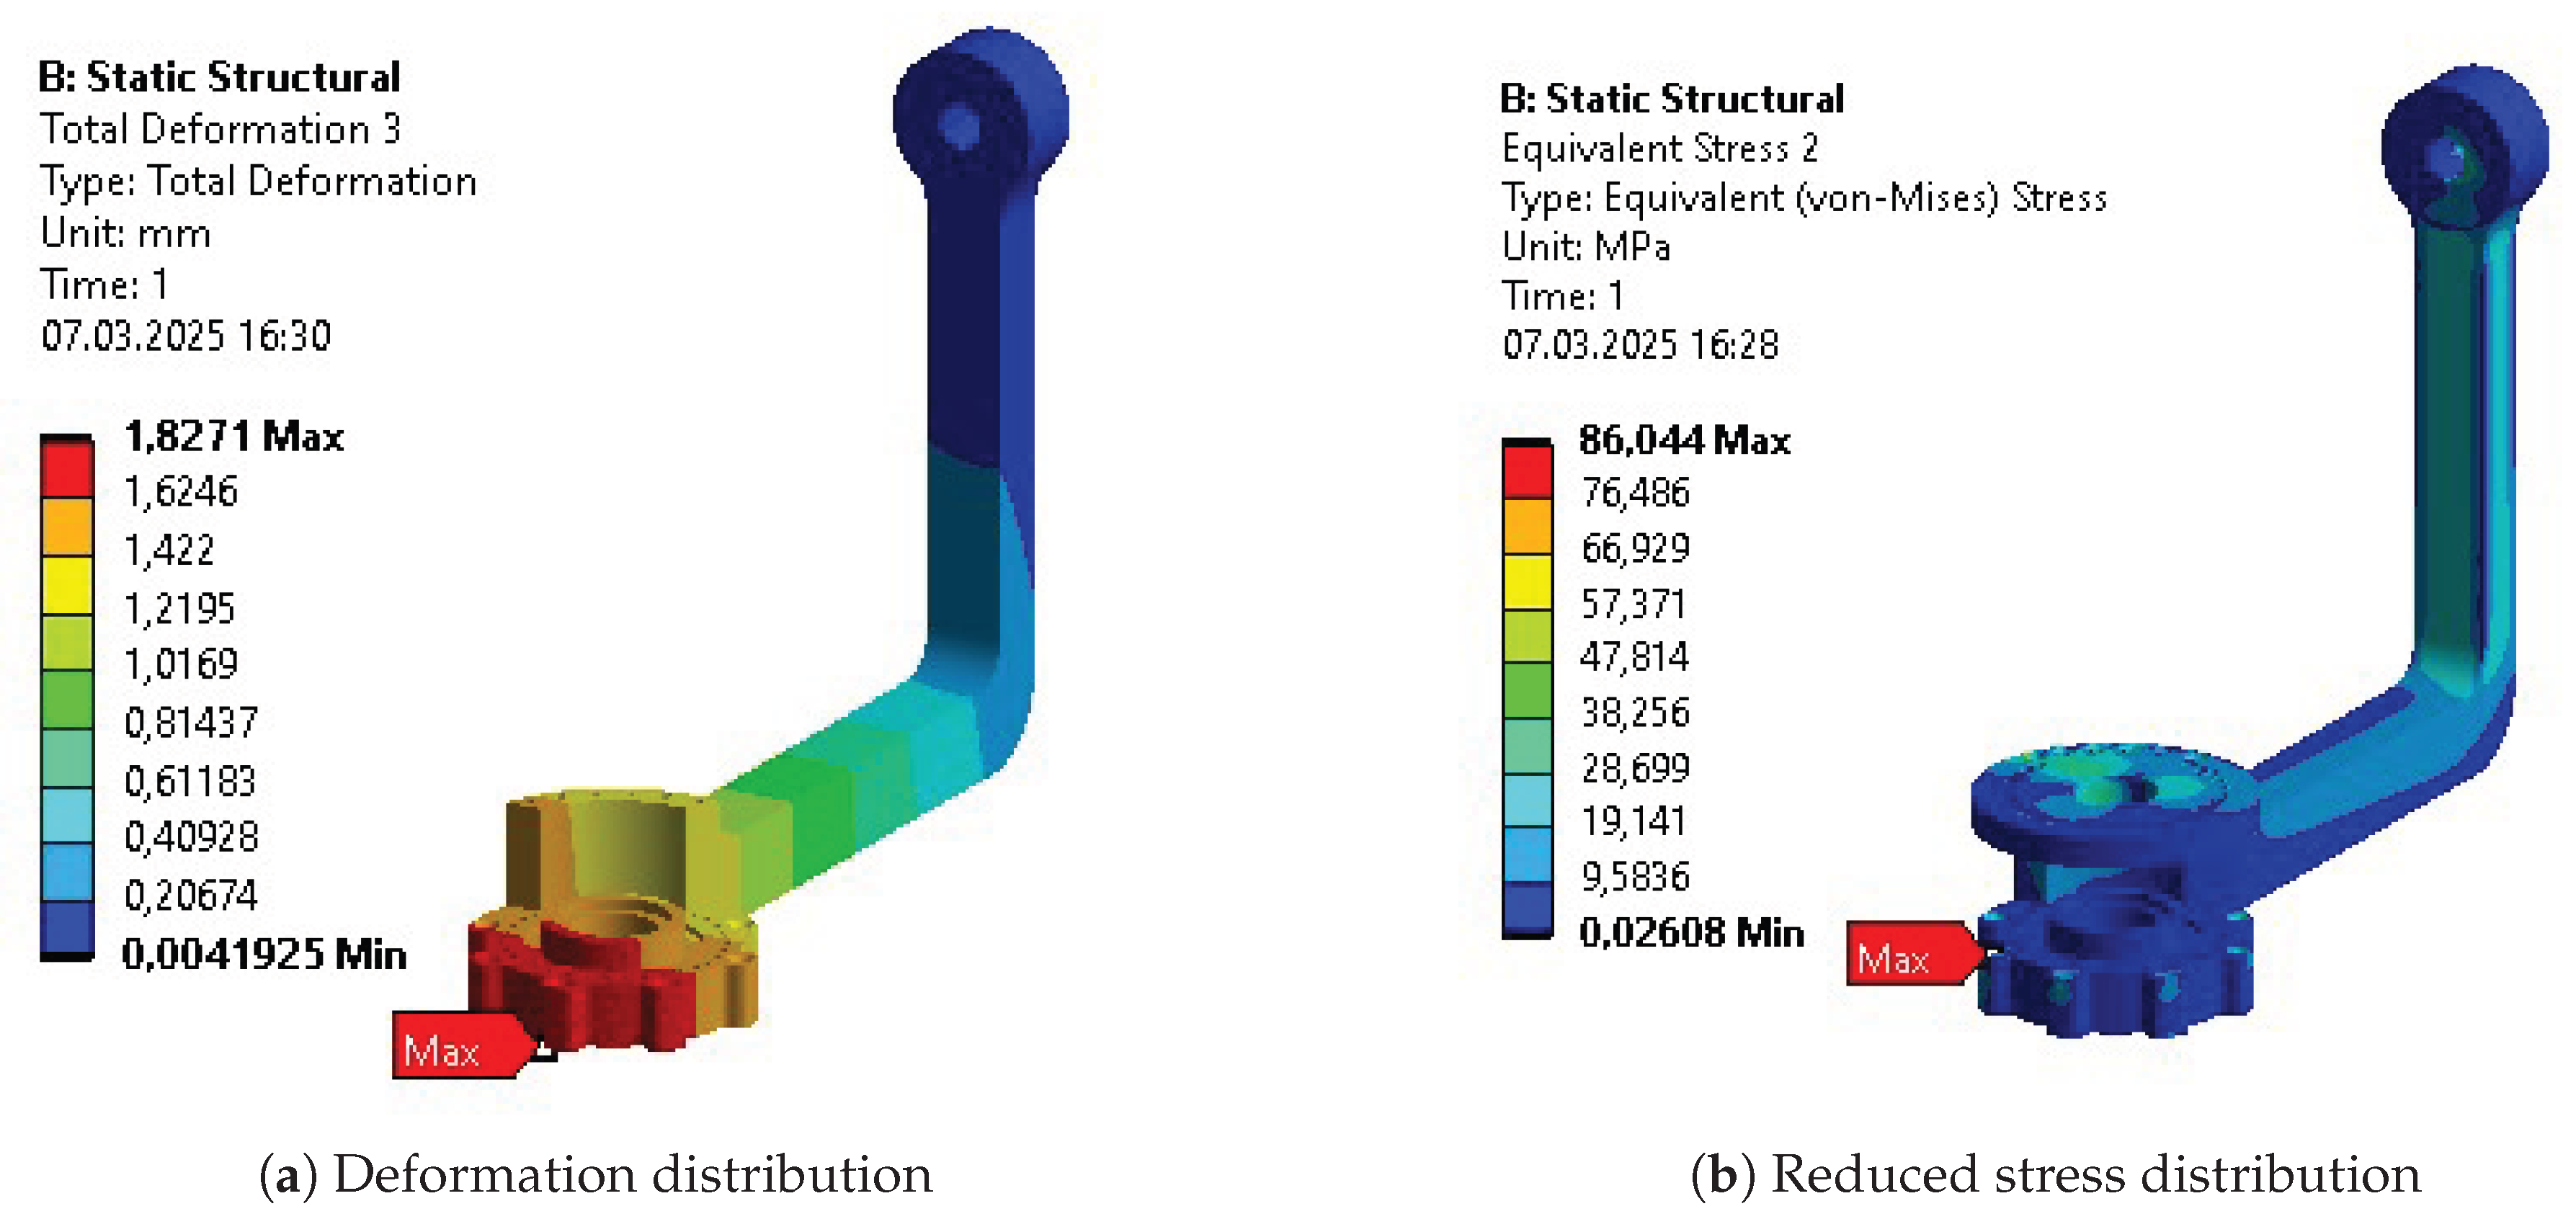
Figure A26.
Results after initial parametric optimization of Body 4.
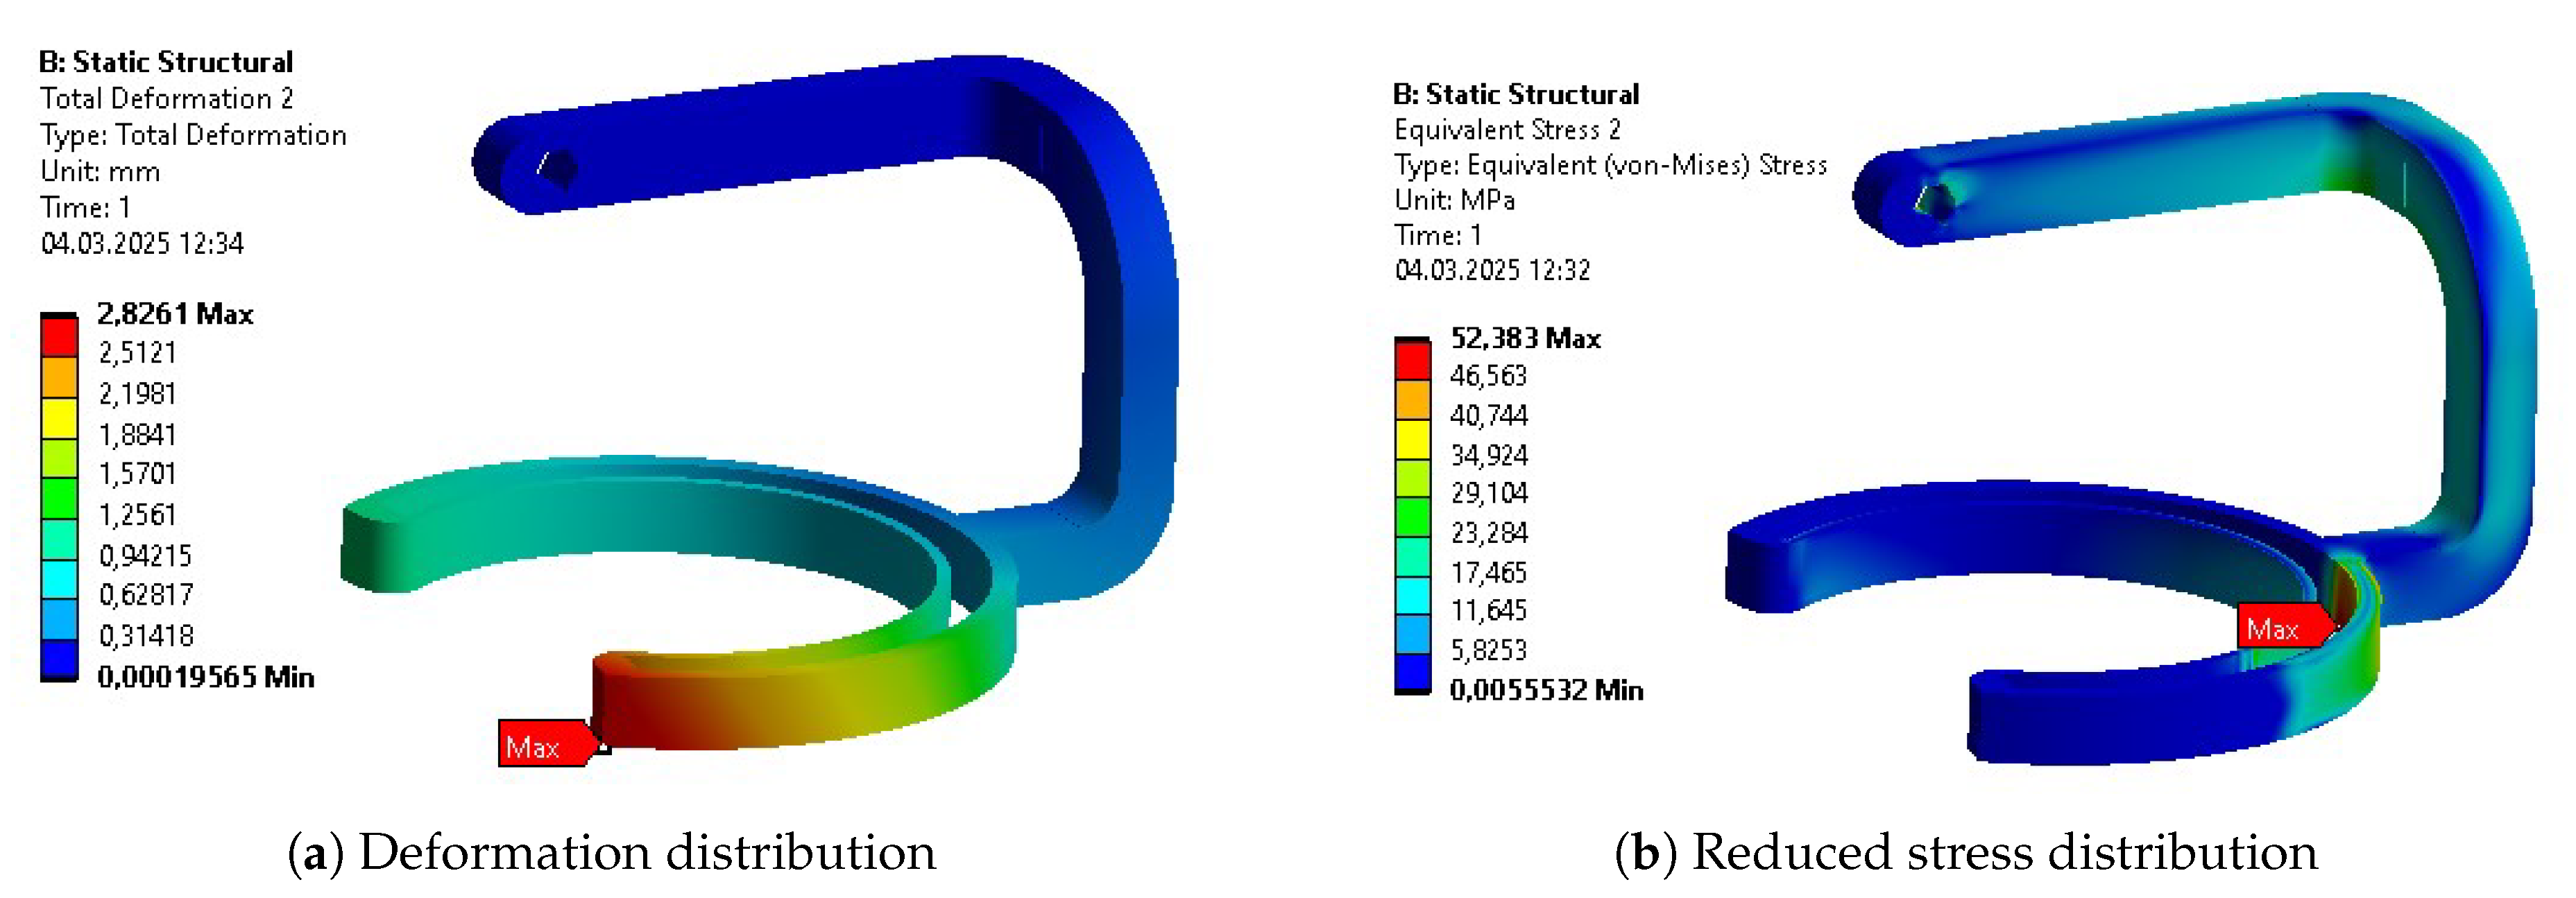
Figure A27.
Results after initial parametric optimization of Body 5.
Appendix E.3. Topology Optimization
Figure A28.
Validation of topology optimization resultant geometry of Body 1.
Figure A29.
Validation of topology optimization resultant geometry of Body 2.
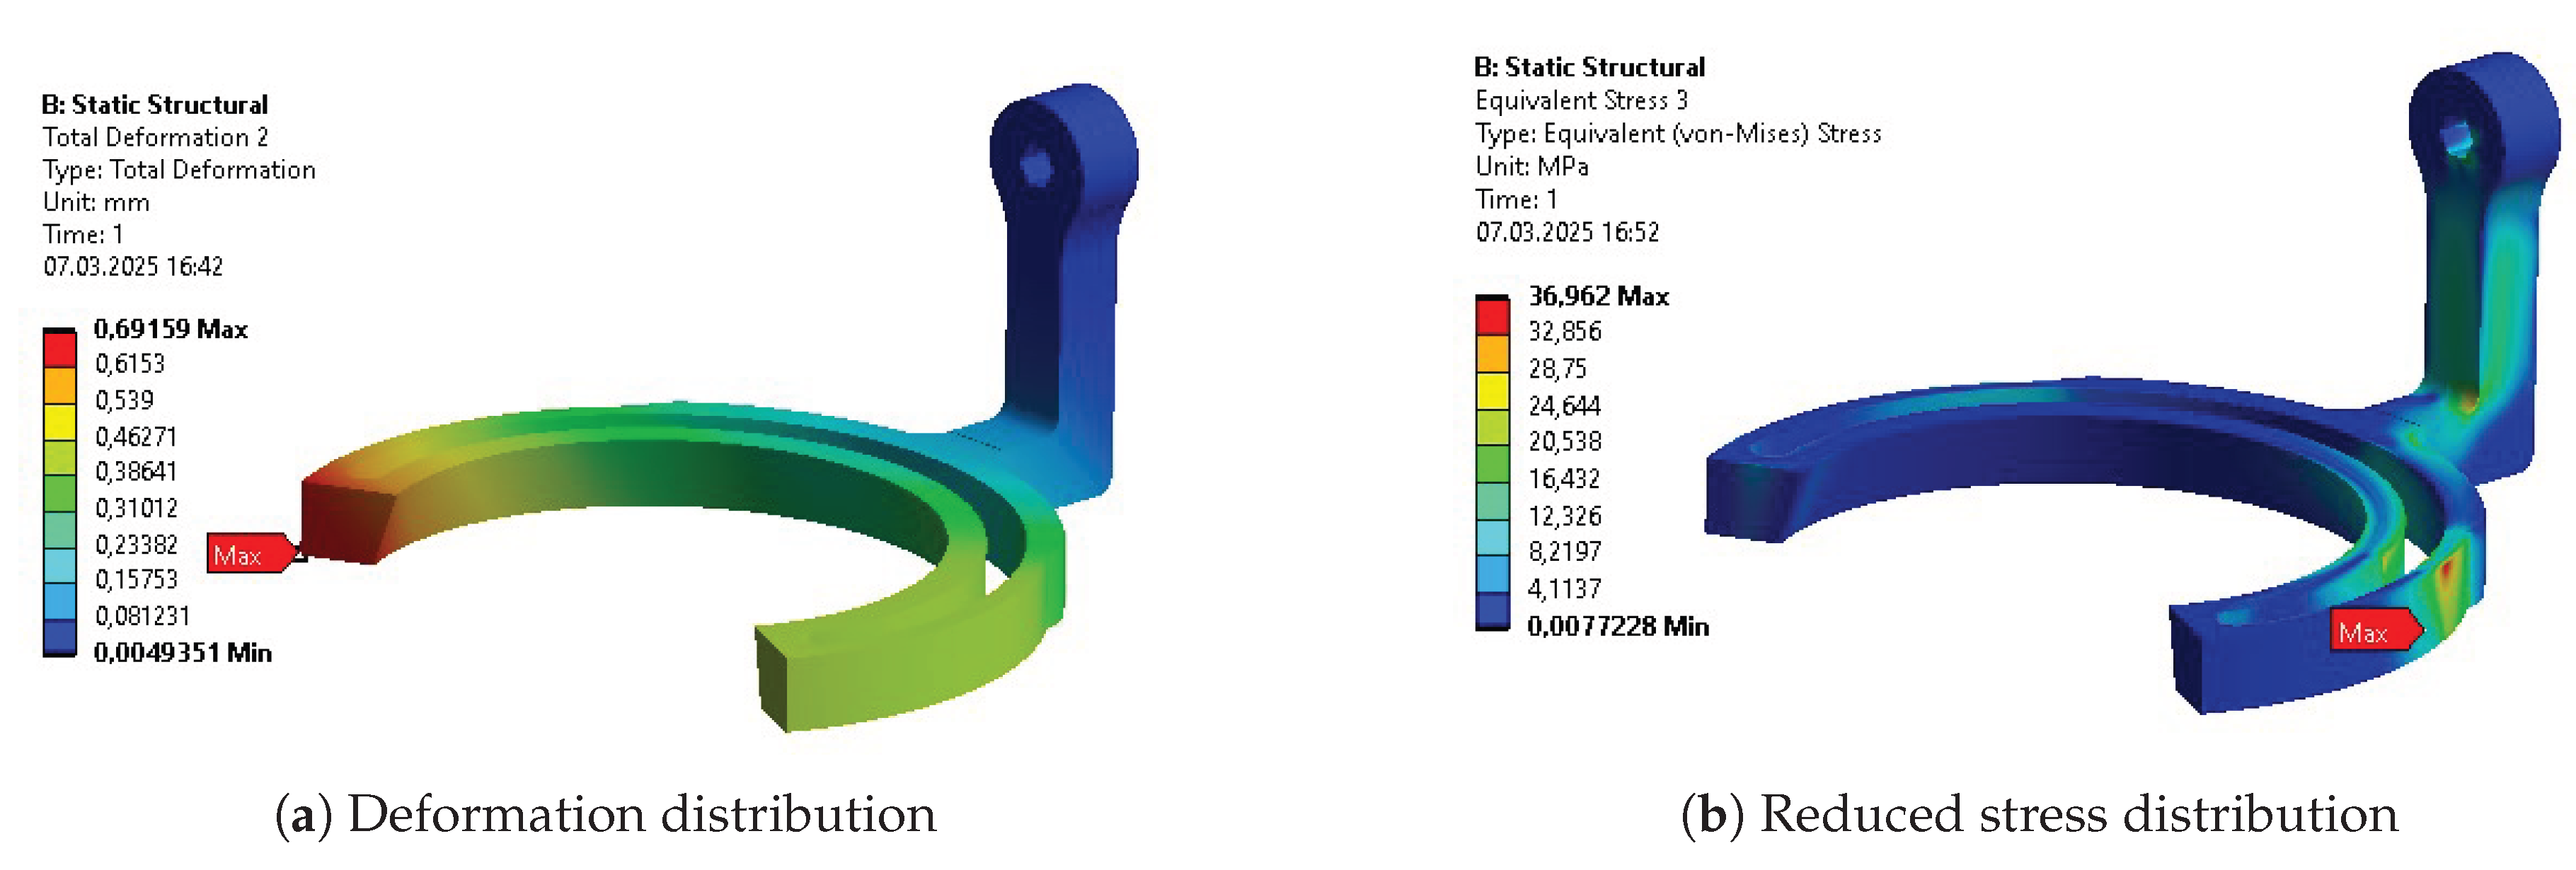
Figure A30.
Validation of topology optimization resultant geometry of Body 3.
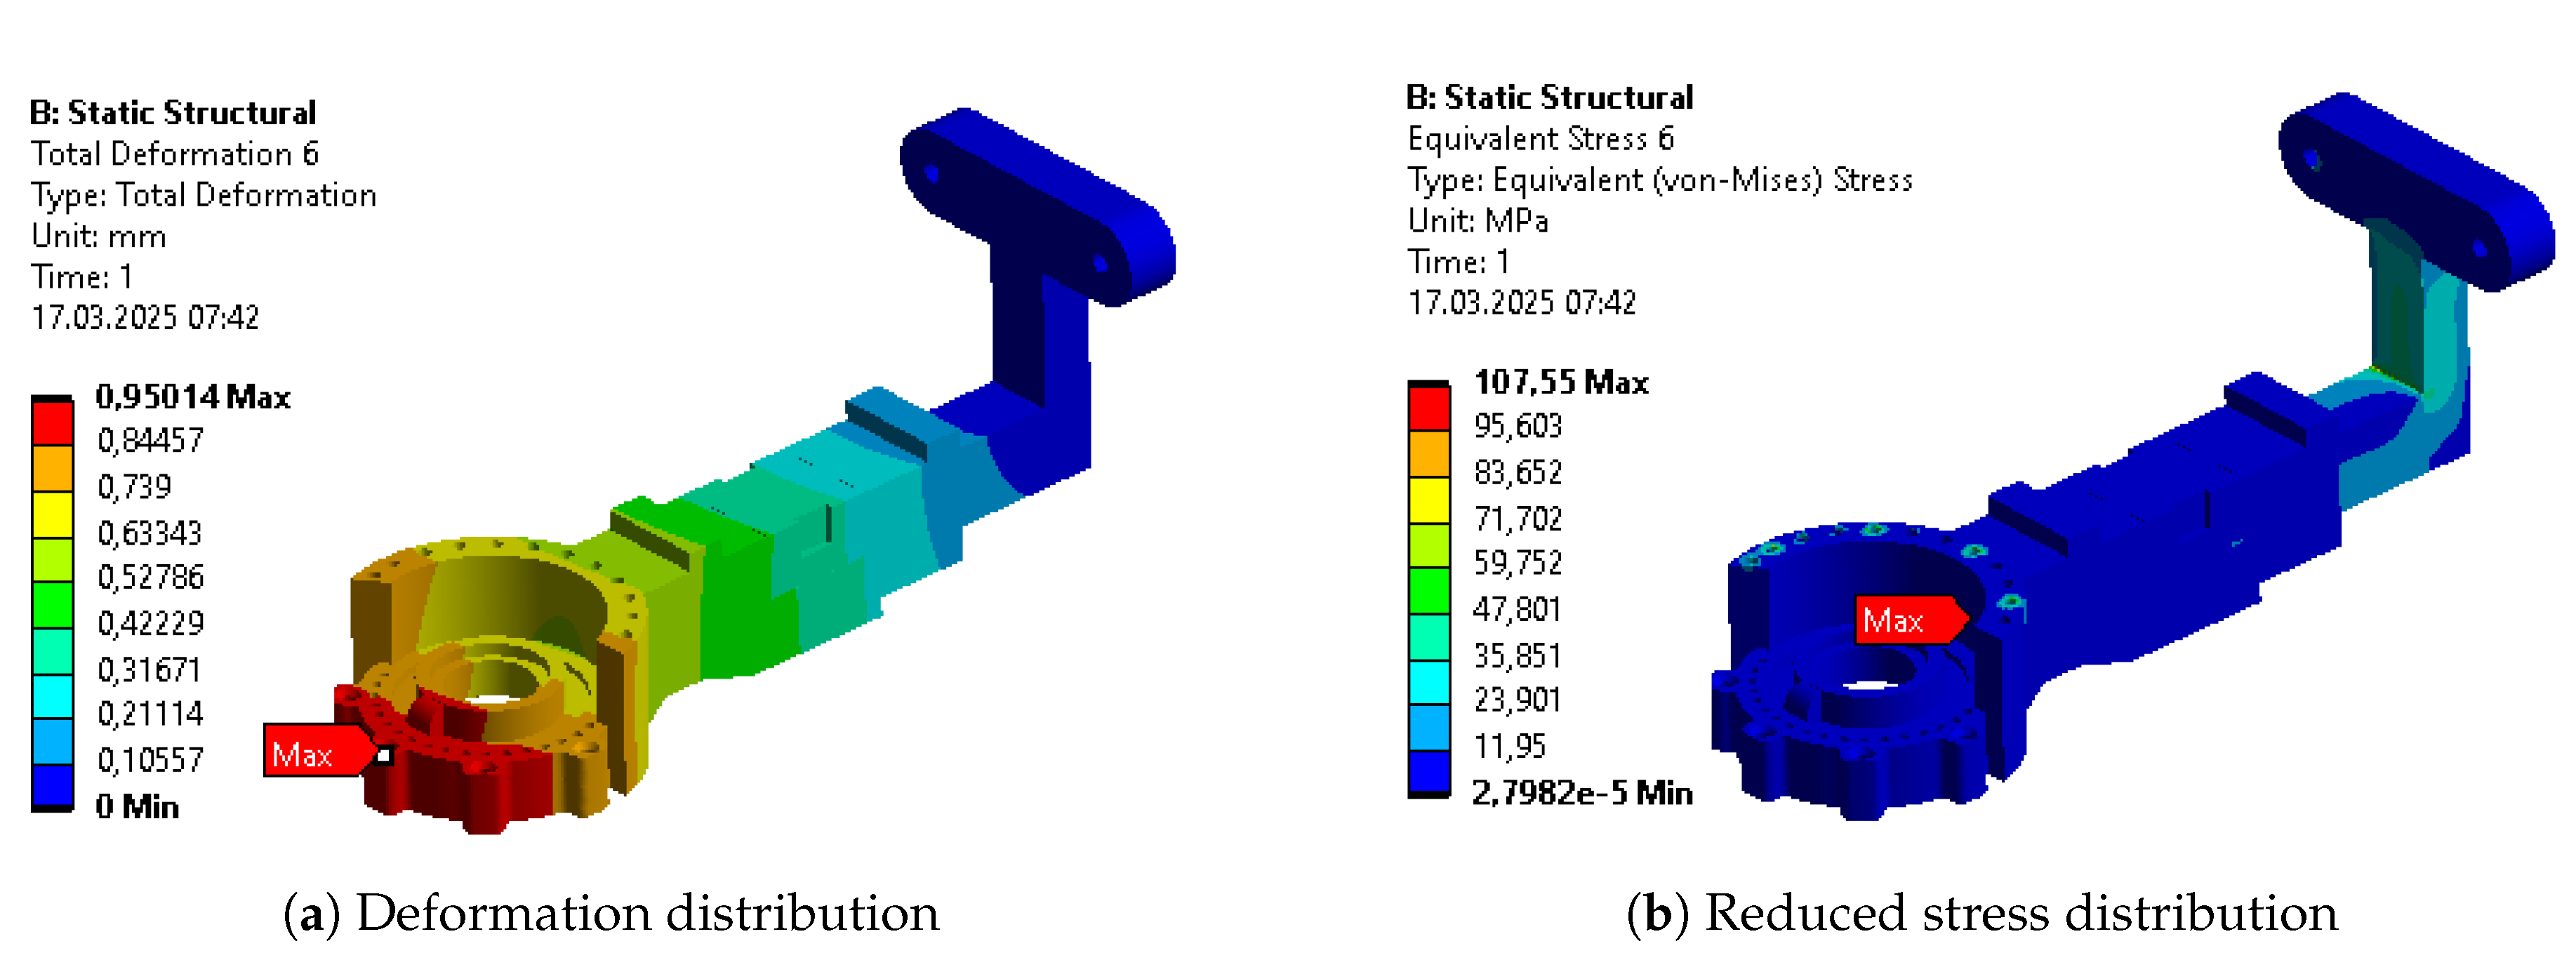
Figure A31.
Validation of topology optimization resultant geometry of Body 4.
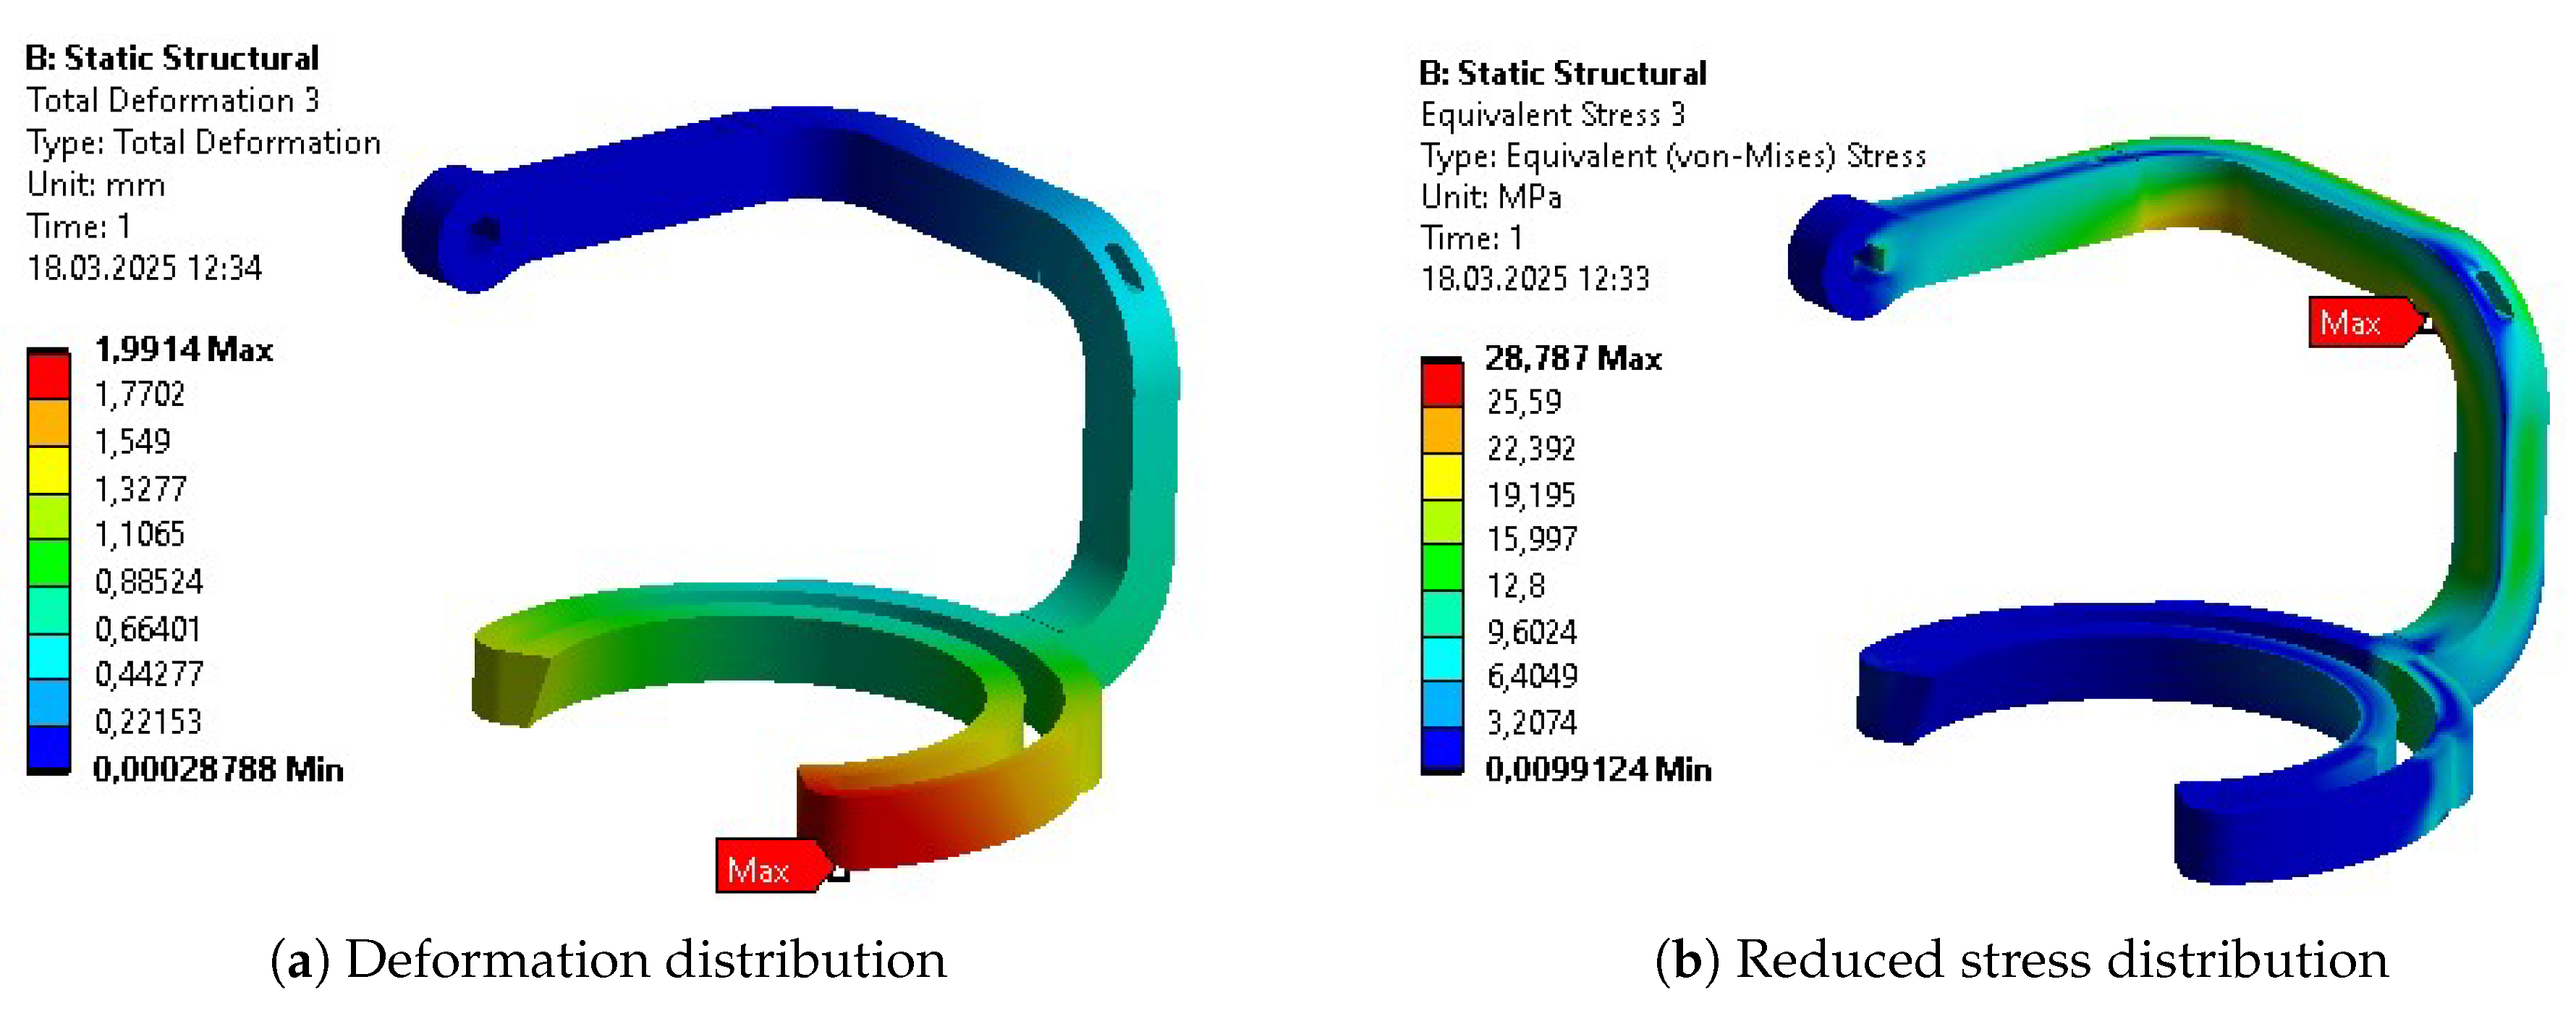
Figure A32.
Validation of topology optimization resultant geometry of Body 5.
Appendix E.4. Final Parametric Optimization
Figure A33.
Results after final parametric optimization of Body 1.
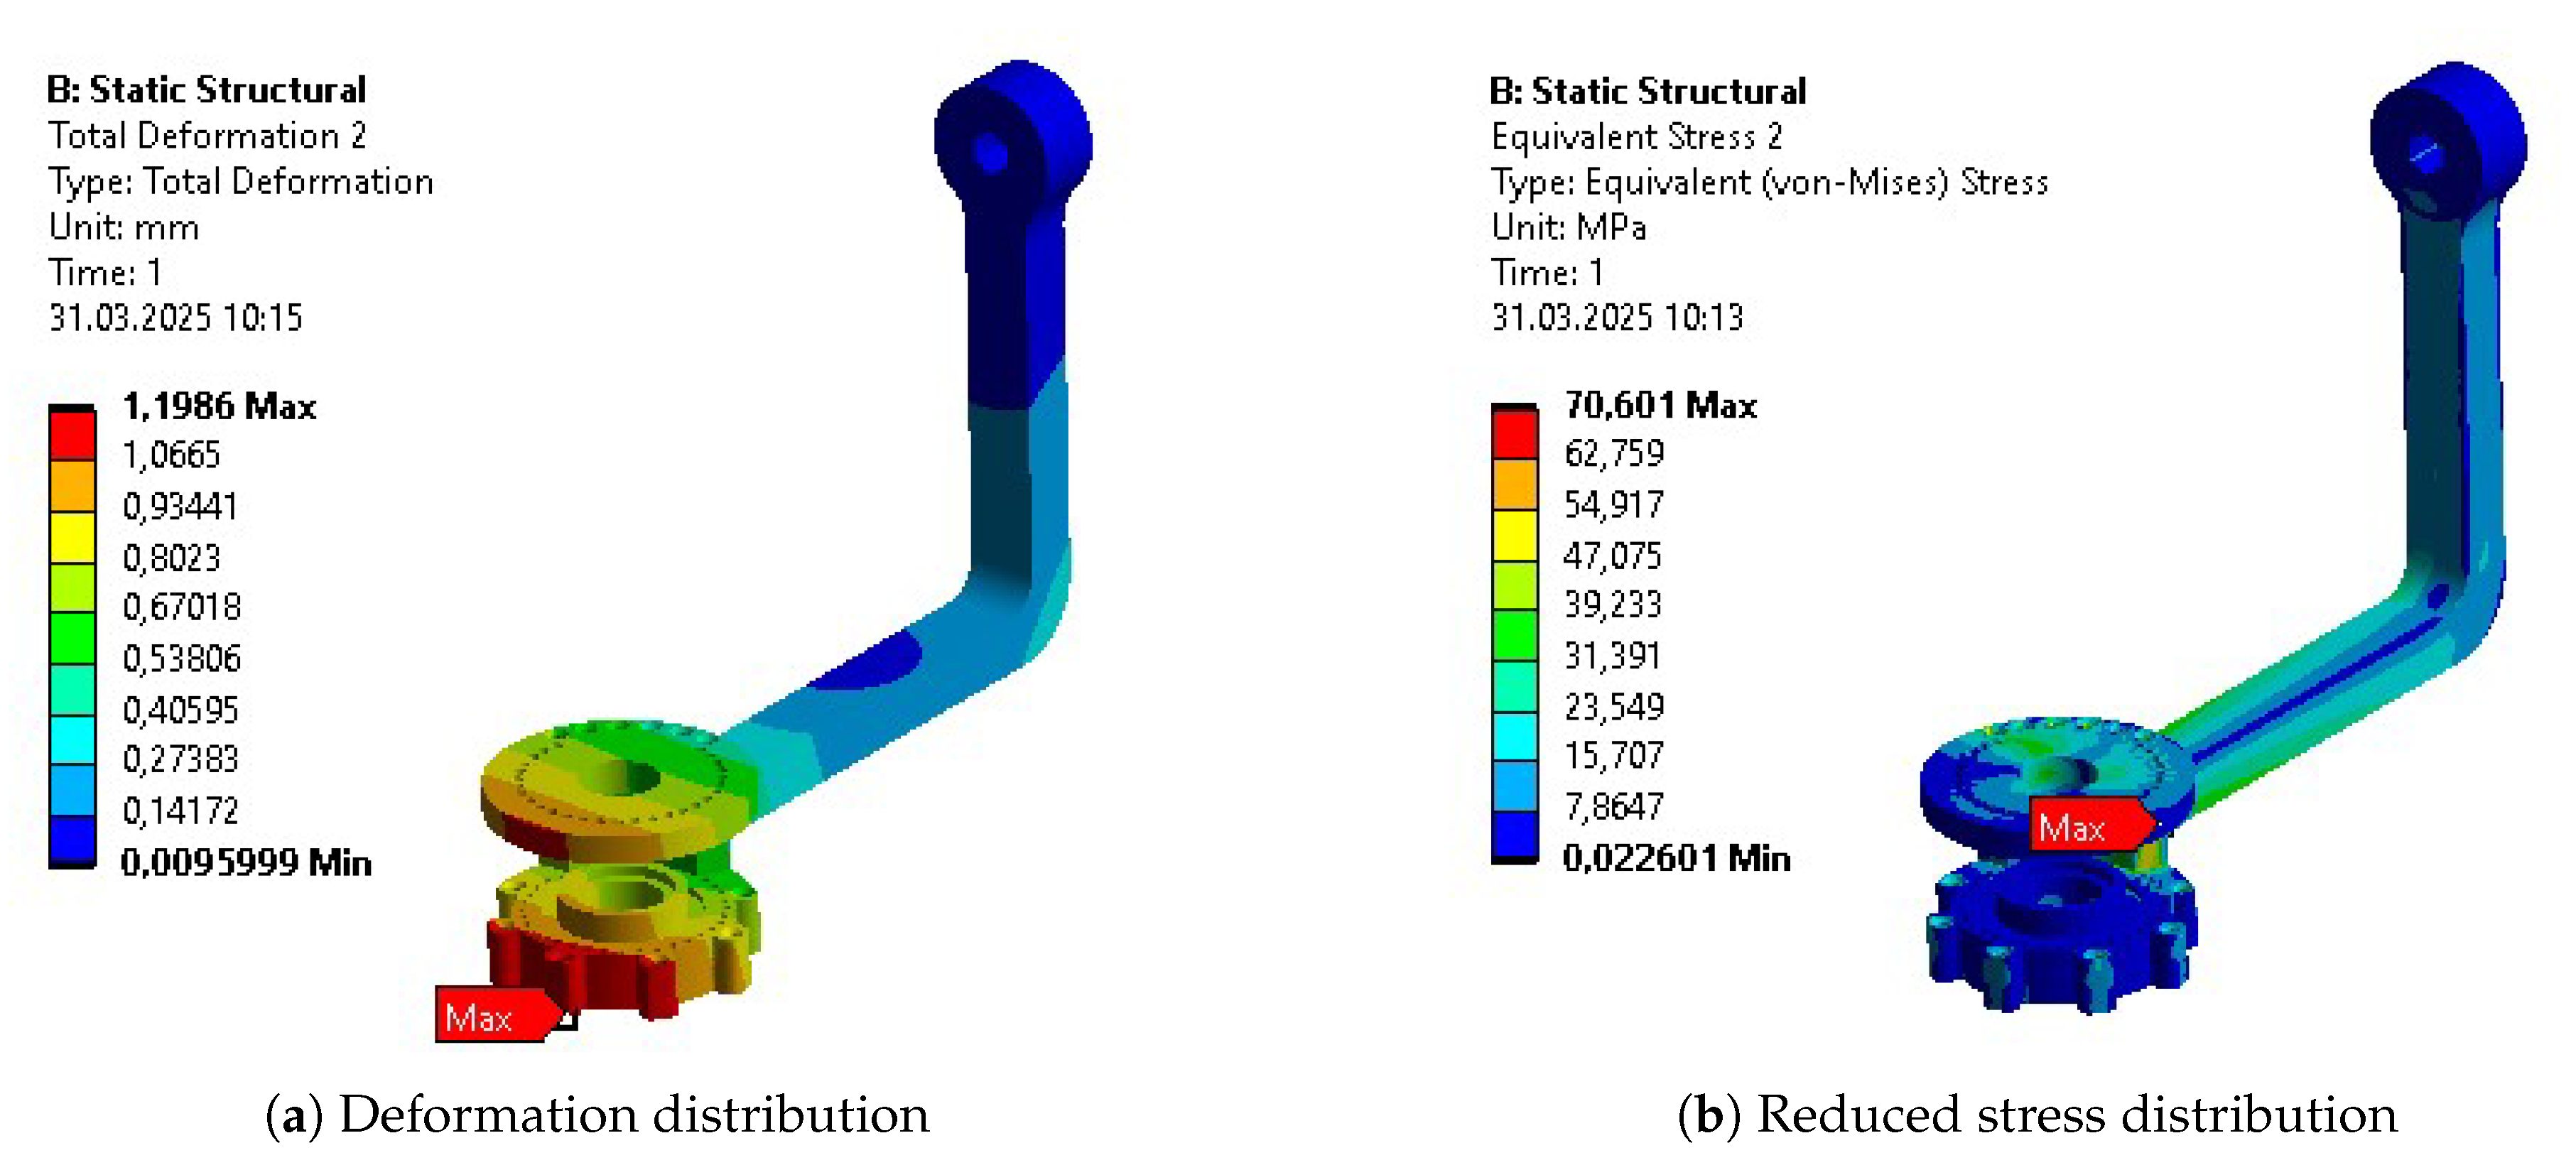
Figure A34.
Results after final parametric optimization of Body 2.
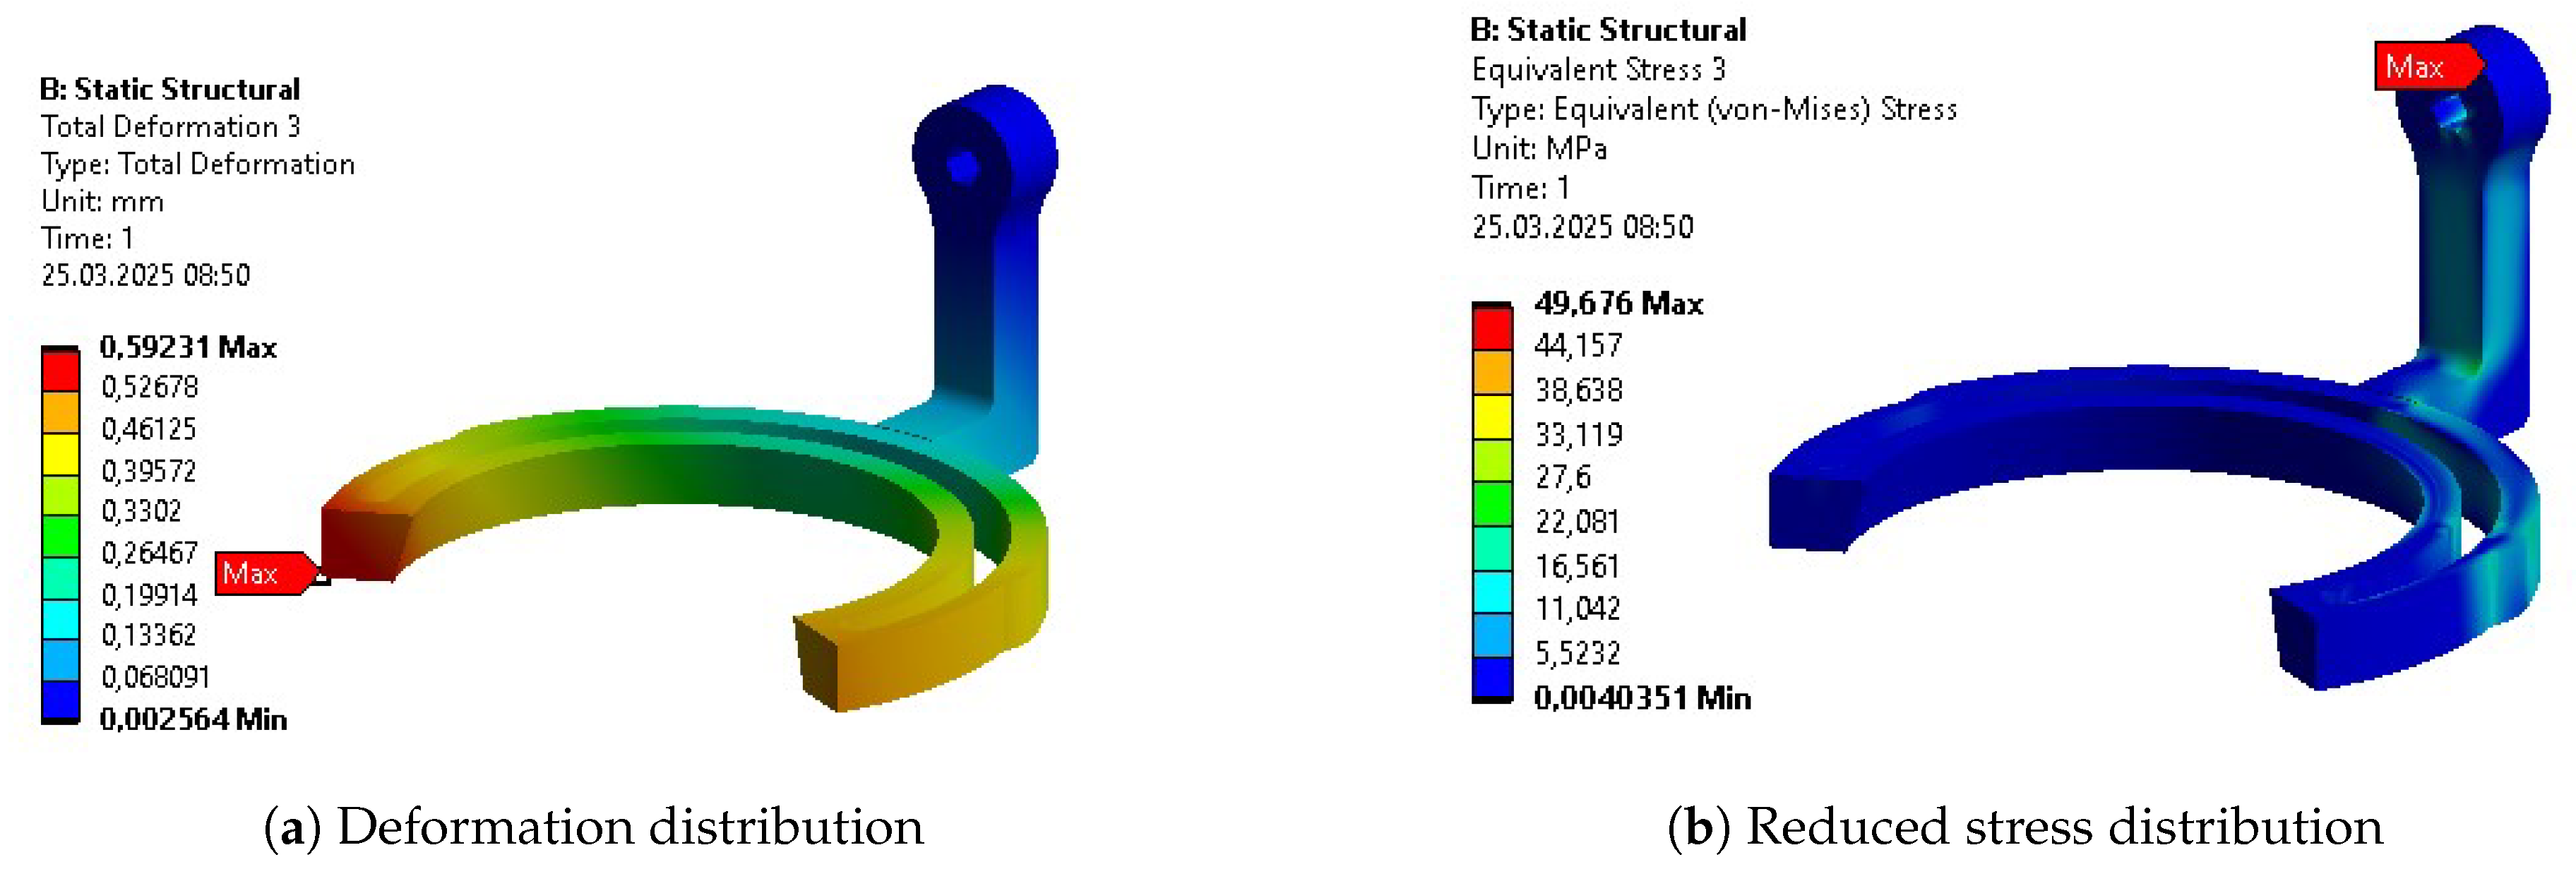
Figure A35.
Results after final parametric optimization of Body 3.
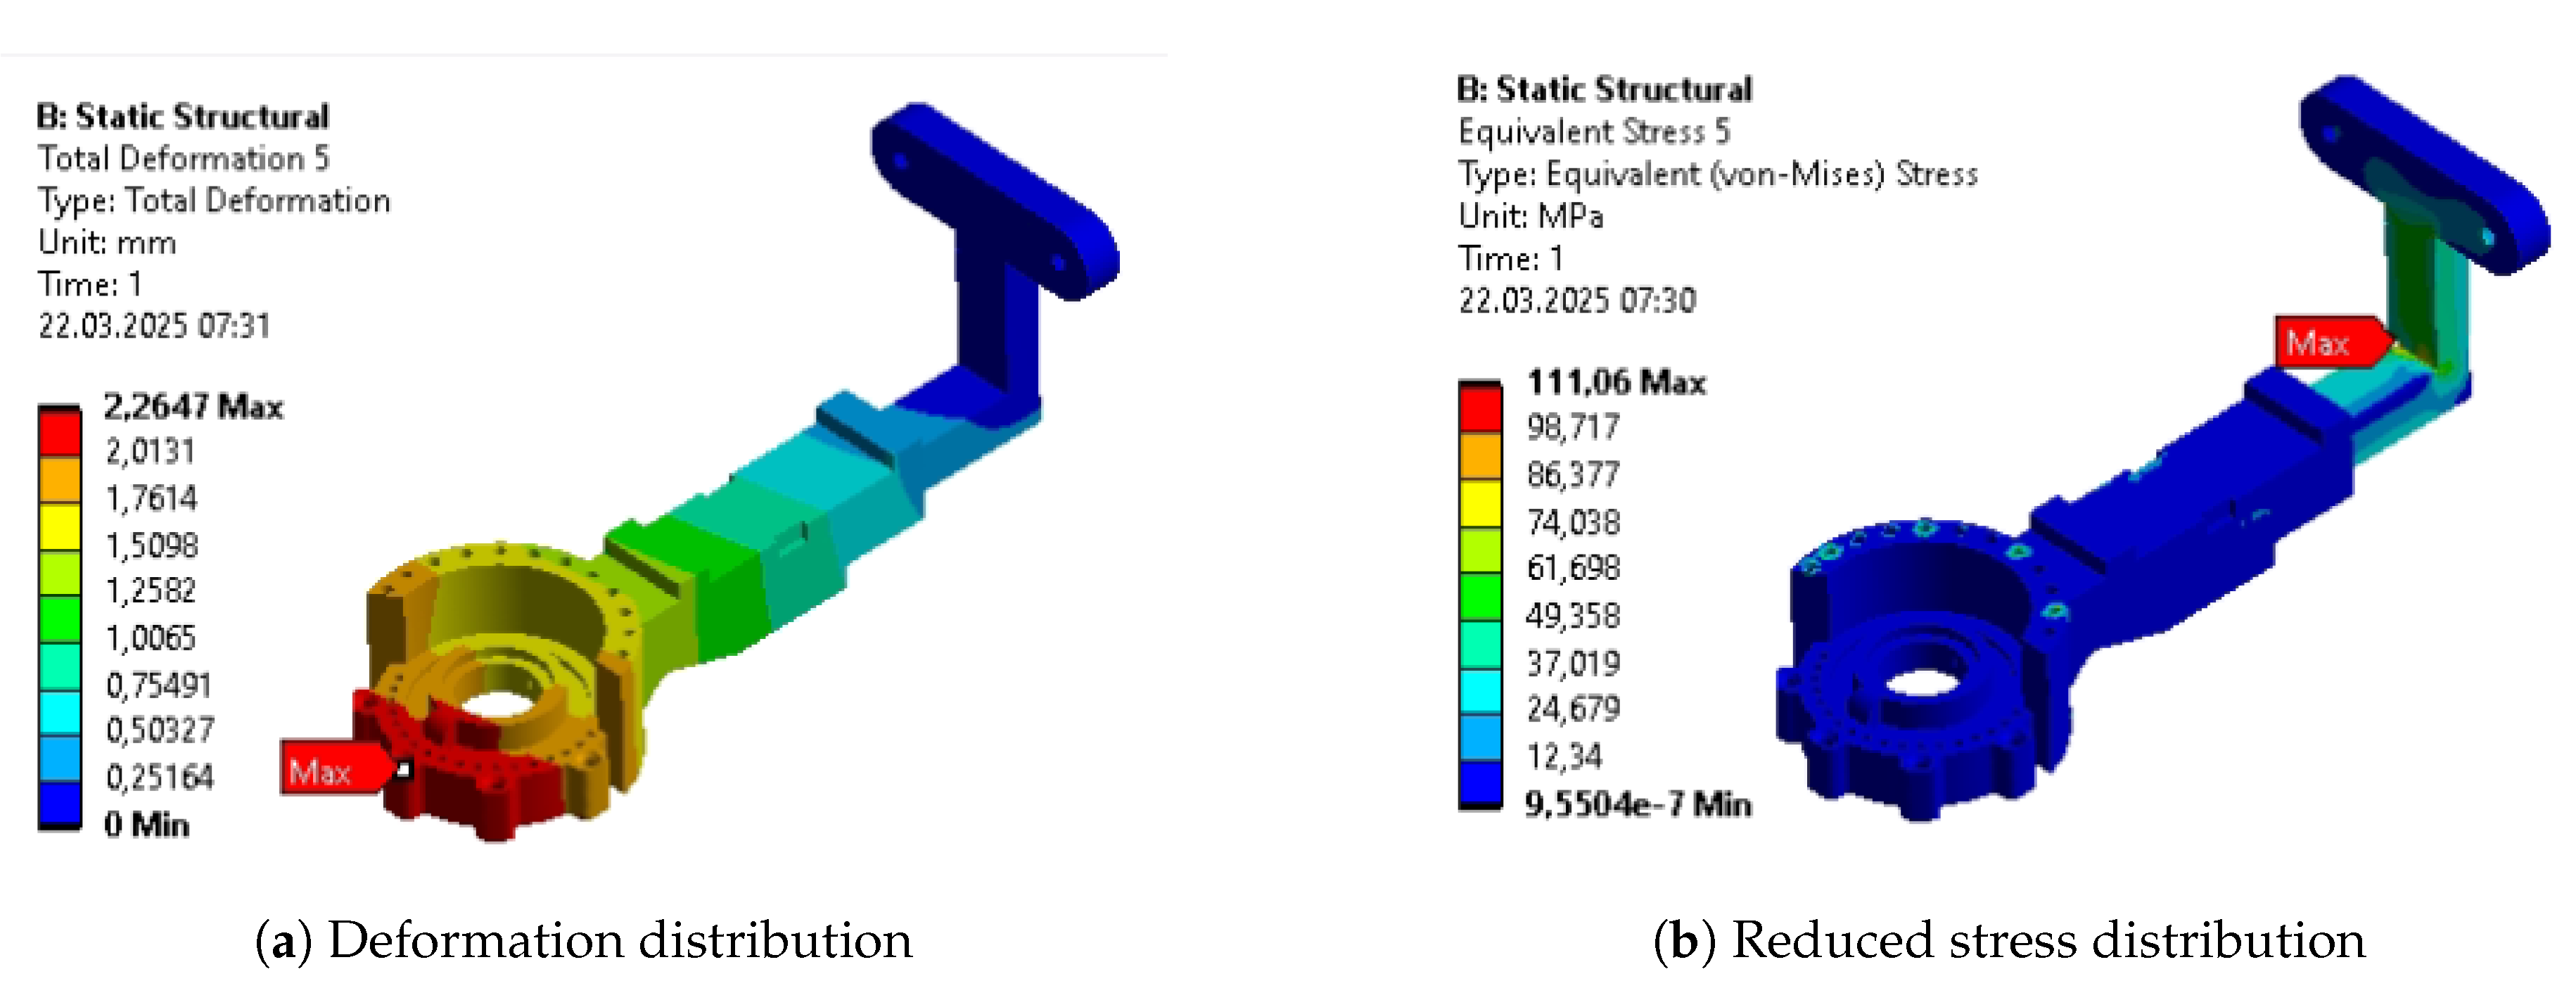
Figure A36.
Results after final parametric optimization of Body 4.
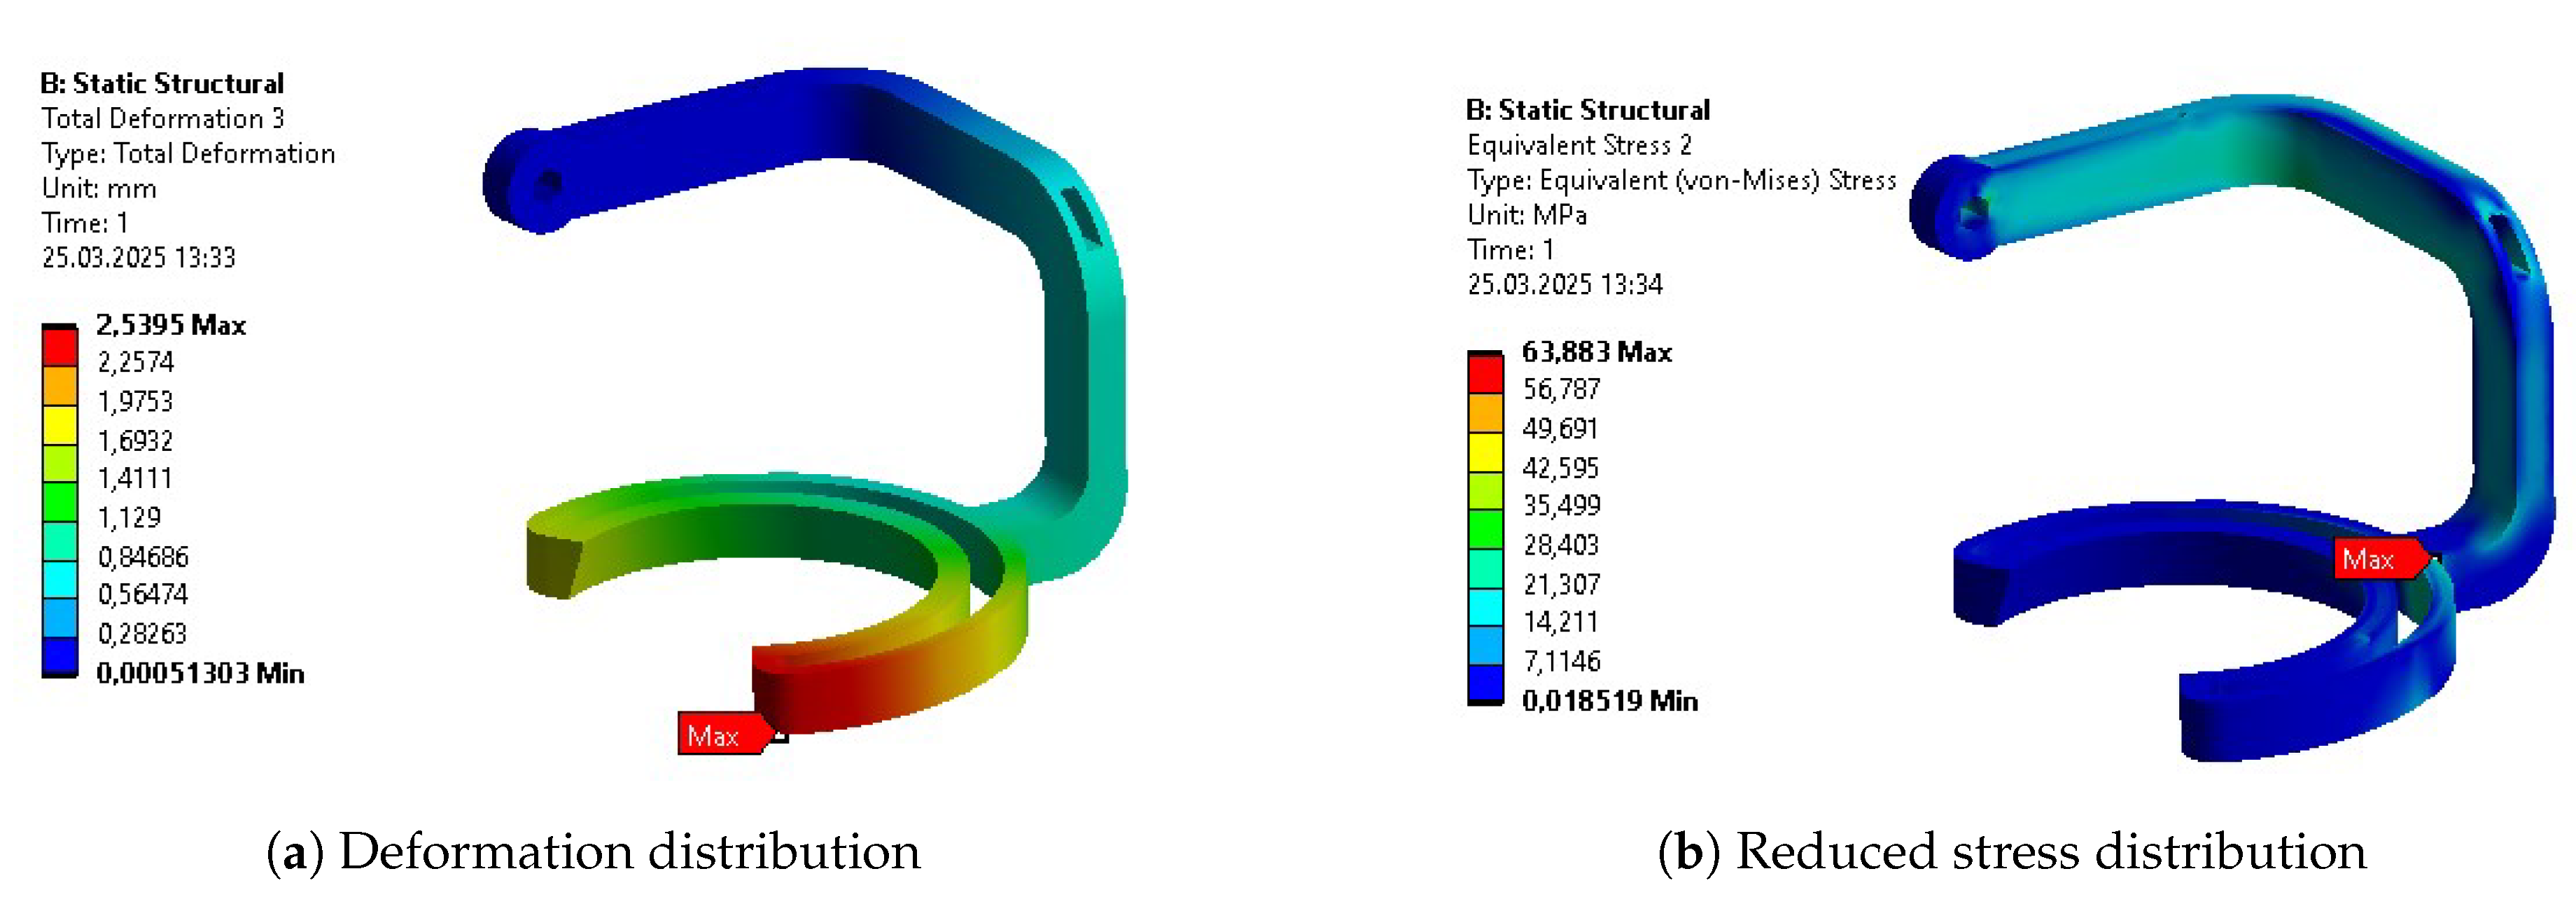
Figure A37.
Results after final parametric optimization of Body 5.
Appendix F. Optimization Stages Summary for Each Body
Table A3.
Summary of Body 1.
| Parameter | INITIAL | PO 1 | TO | PO 2 |
|---|---|---|---|---|
| Mass [kg] | 0.998 | 0.572 | 0.469 | 0.402 |
| Max. Deformation [mm] | 0.17 | 0.78 | 1.82 | 1.19 |
| Avg. Deformation [mm] | 0.09 | 0.39 | 0.94 | 0.52 |
| Max. Stress [MPa] | 32.43 | 39.40 | 86.04 | 70.60 |
| Avg. Stress [MPa] | 1.25 | 2.90 | 6.78 | 8.37 |
| Max. Strain [‰] | 0.4635 | 0.6097 | 2.529 | 1.462 |
| Avg. Strain [‰] | 0.0181 | 0.0418 | 0.1102 | 0.126 |
| Min. Safety Factor | 7.44 | 5.24 | 2.67 | 3.25 |
Table A4.
Summary of Body 2.
| Parameter | INITIAL | PO 1 | TO | PO 2 |
|---|---|---|---|---|
| Mass [kg] | 0.786 | 0.523 | 0.443 | 0.472 |
| Max. Deformation [mm] | 0.30 | 0.29 | 0.69 | 0.59 |
| Avg. Deformation [mm] | 0.13 | 0.13 | 0.28 | 0.26 |
| Max. Stress [MPa] | 22.70 | 22.57 | 36.96 | 49.68 |
| Avg. Stress [MPa] | 1.77 | 1.86 | 3.69 | 2.93 |
| Max. Strain [‰] | 0.3527 | 0.3543 | 0.5303 | 0.801 |
| Avg. Strain [‰] | 0.02591 | 0.0271 | 0.0540 | 0.0433 |
| Min. Safety Factor | 11.48 | 11.48 | 6.22 | 5.03 |
Table A5.
Summary of Body 3.
| Parameter | INITIAL | PO 1 | TO | PO 2 |
|---|---|---|---|---|
| Mass [kg] | 0.808 | 0.740 | 0.552 | 0.465 |
| Max. Deformation [mm] | 0.36 | 0.48 | 0.95 | 2.62 |
| Avg. Deformation [mm] | 0.12 | 0.18 | 0.39 | 1.03 |
| Max. Stress [MPa] | 57.54 | 31.04 | 107.55 | 111.06 |
| Avg. Stress [MPa] | 1.66 | 1.75 | 3.67 | 5.65 |
| Max. Strain [‰] | 0.8339 | 0.4833 | 1.8078 | 1.881 |
| Avg. Strain [‰] | 0.02439 | 0.0261 | 0.0554 | 0.0851 |
| Min. Safety Factor | 4.50 | 8.35 | 2.60 | 2.52 |
Table A6.
Summary of Body 4.
| Parameter | INITIAL | PO 1 | TO | PO 2 |
|---|---|---|---|---|
| Mass [kg] | 0.879 | 0.420 | 0.483 | 0.451 |
| Max. Deformation [mm] | 0.36 | 2.82 | 1.99 | 2.54 |
| Avg. Deformation [mm] | 0.23 | 0.55 | 0.70 | 1.00 |
| Max. Stress [MPa] | 31.14 | 52.38 | 28.78 | 63.88 |
| Avg. Stress [MPa] | 1.79 | 6.20 | 4.52 | 5.61 |
| Max. Strain [‰] | 0.5146 | 0.7724 | 0.4113 | 0.942 |
| Avg. Strain [‰] | 0.02639 | 0.0911 | 0.0655 | 0.0850 |
| Min. Safety Factor | 12.9 | 4.94 | 7.98 | 3.60 |
Table A7.
Summary of Body 5.
| Parameter | INITIAL | PO 1 | TO | PO 2 |
|---|---|---|---|---|
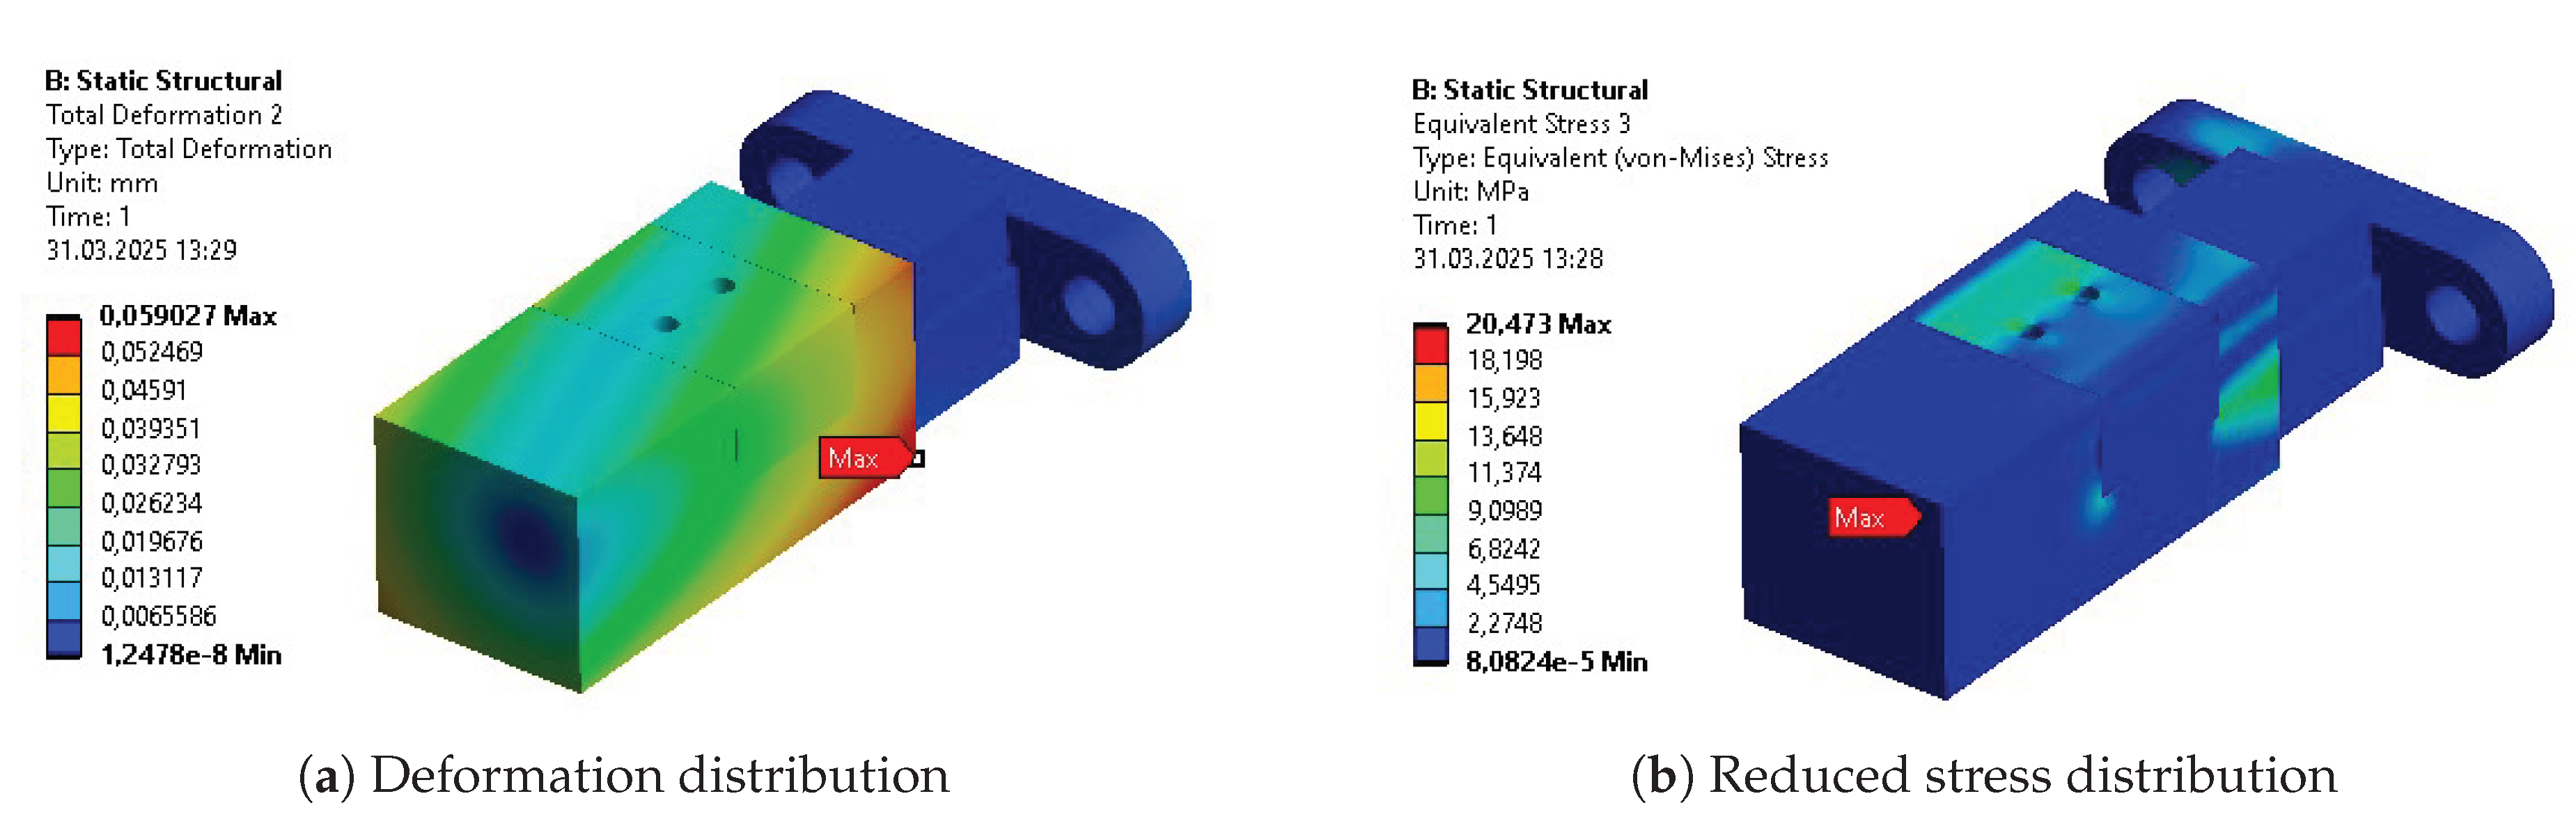
| Mass [kg] | 0.436 | 0.393 | 0.252 | 0.200 |
| Max. Deformation [mm] | 0.018 | 0.06 | 0.15 | 0.37 |
| Avg. Deformation [mm] | 0.007 | 0.02 | 0.07 | 0.15 |
| Max. Stress [MPa] | 23.79 | 20.47 | 17.27 | 37.41 |
| Avg. Stress [MPa] | 0.97 | 0.85 | 0.70 | 1.78 |
| Max. Strain [‰] | 0.65 | 0.2998 | 0.2502 | 0.535 |
| Avg. Strain [‰] | 0.01782 | 0.0134 | 0.0113 | 0.026 |
| Min. Safety Factor | 6.17 | 11.24 | 15.0 | 6.68 |
Figure A38.
Comparison of initial design (left) and post-optimization cycle design (right) of the exoskeleton.
Figure A38.
Comparison of initial design (left) and post-optimization cycle design (right) of the exoskeleton.
References
- Yamamoto, H.; Takeda, K.; Koyama, S.; Morishima, K.; Hirakawa, Y.; Motoya, I.; Sakurai, H.; Kanada, Y.; Kawamura, N.; Kawamura, M.; et al. The relationship between upper limb function and activities of daily living without the effects of lower limb function: A cross-sectional study. British Journal of Occupational Therapy 2022, 85, 360–366. [Google Scholar] [CrossRef] [PubMed]
- Park, H.; Choi, J.Y.; Yi, S.h.; Park, E.S.; Shim, D.; Choi, T.Y.; Rha, D.w. Relationship between the more-affected upper limb function and daily activity performance in children with cerebral palsy: a cross-sectional study. BMC pediatrics 2021, 21, 1–8. [Google Scholar] [CrossRef]
- Almomani, F.; Alghwiri, A.A.; Alghadir, A.H.; Al-Momani, A.; Iqbal, A. Prevalence of upper limb pain and disability and its correlates with demographic and personal factors. Journal of Pain Research 2019, 2691–2700. [Google Scholar] [CrossRef]
- Burridge, J.; Alt Murphy, M.; Buurke, J.; Feys, P.; Keller, T.; Klamroth-Marganska, V.; Lamers, I.; McNicholas, L.; Prange, G.; Tarkka, I.; et al. A systematic review of international clinical guidelines for rehabilitation of people with neurological conditions: what recommendations are made for upper limb assessment? Frontiers in neurology 2019, 10, 567. [Google Scholar] [CrossRef]
- Tsao, C.W.; Aday, A.W.; Almarzooq, Z.I.; Anderson, C.A.; Arora, P.; Avery, C.L.; Baker-Smith, C.M.; Beaton, A.Z.; Boehme, A.K.; Buxton, A.E.; et al. Heart disease and stroke statistics—2023 update: a report from the American Heart Association. Circulation 2023, 147, e93–e621. [Google Scholar] [CrossRef]
- Martin, S.S.; Aday, A.W.; Almarzooq, Z.I.; Anderson, C.A.; Arora, P.; Avery, C.L.; Baker-Smith, C.M.; Barone Gibbs, B.; Beaton, A.Z.; Boehme, A.K.; et al. 2024 heart disease and stroke statistics: a report of US and global data from the American Heart Association. Circulation 2024, 149, e347–e913. [Google Scholar] [CrossRef]
- Forbrigger, S.; DePaul, V.G.; Davies, T.C.; Morin, E.; Hashtrudi-Zaad, K. Home-based upper limb stroke rehabilitation mechatronics: challenges and opportunities. BioMedical Engineering OnLine 2023, 22, 67. [Google Scholar] [CrossRef]
- Walton, C.; King, R.; Rechtman, L.; Kaye, W.; Leray, E.; Marrie, R.A.; Robertson, N.; La Rocca, N.; Uitdehaag, B.; van Der Mei, I.; et al. Rising prevalence of multiple sclerosis worldwide: Insights from the Atlas of MS. Multiple Sclerosis Journal 2020, 26, 1816–1821. [Google Scholar] [CrossRef]
- Stepien, A.; Osiak, T.; Rekowski, W.; Wit, A. Neck and trunk muscle strength in children with spinal muscular atrophy is lower than in healthy controls and depends on disease type. Frontiers in Neurology 2021, 12, 628414. [Google Scholar] [CrossRef] [PubMed]
- Tseng, K.C.; Wang, L.; Hsieh, C.; Wong, A.M. Portable robots for upper-limb rehabilitation after stroke: a systematic review and meta-analysis. Annals of medicine 2024, 56, 2337735. [Google Scholar] [CrossRef] [PubMed]
- Falkowski, P.; Zawalski, K.; Oleksiuk, J.; Leczkowski, B.; Pilat, Z.; Aktan, M.E.; Akdogan, E.; Niedbalski, P.; Omurlu, V.E.; Jarek, M.; et al. Systematic review of mechanical designs of rehabilitation exoskeletons for lower-extremity. Archive of Mechanical Engineering 2024, 621–644. [Google Scholar] [CrossRef]
- Falkowski, P.; Rzymkowski, C.; Pilat, Z. Analyzis of rehabilitation systems in regards to requirements towards remote home rehabilitation devices. Journal of Automation, Mobile Robotics and Intelligent Systems 2023, 17, 61–73. [Google Scholar]
- Oña, E.D.; Garcia-Haro, J.M.; Jardón, A.; Balaguer, C. Robotics in health care: Perspectives of robot-aided interventions in clinical practice for rehabilitation of upper limbs. Applied sciences 2019, 9, 2586. [Google Scholar] [CrossRef]
- Cornejo, J.; Huamanchahua, D.; Huamán-Vizconde, S.; Terrazas-Rodas, D.; Sierra-Huertas, J.; Janampa-Espinoza, A.; Gonzáles, J.; Cardona, M. Mechatronic exoskeleton systems for supporting the biomechanics of shoulder-elbow-wrist: An innovative review. In Proceedings of the 2021 IEEE International IOT, Electronics and Mechatronics Conference (IEMTRONICS), 2021; IEEE; pp. 1–9. [Google Scholar]
- Wang, T.; Zhang, B.; Liu, C.; Liu, T.; Han, Y.; Wang, S.; Ferreira, J.P.; Dong, W.; Zhang, X. A Review on the Rehabilitation Exoskeletons for the Lower Limbs of the Elderly and the Disabled. Electronics 2022, 11, 388. [Google Scholar] [CrossRef]
- Falkowski, P.; Mohammadi, M.; Andreasen Struijk, L.N.; Rzymkowski, C.; Pilat, Z. Optimising a driving mechanism mechanical design of EXOTIC exoskeleton—a review on upper limb exoskeletons driving systems and a case study. Multibody System Dynamics 2025, 1–24. [Google Scholar] [CrossRef]
- He, Y.; Xu, Y.; Hai, M.; Feng, Y.; Liu, P.; Chen, Z.; Duan, W. Exoskeleton-assisted rehabilitation and neuroplasticity in spinal cord injury. World Neurosurgery 2024. [Google Scholar] [CrossRef]
- Tyflopoulos, E.; Steinert, M. Topology and parametric optimization-based design processes for lightweight structures. Applied Sciences 2020, 10, 4496. [Google Scholar] [CrossRef]
- Saltelli, A. Global Sensitivity Analysis: the Primer; John Wiley & Sons, 2008. [Google Scholar]
- Jihong, Z.; Han, Z.; Chuang, W.; Lu, Z.; Shangqin, Y.; Zhang, W. A review of topology optimization for additive manufacturing: Status and challenges. Chinese Journal of Aeronautics 2021, 34, 91–110. [Google Scholar] [CrossRef]
- Rosinha, I.P.; Gernaey, K.V.; Woodley, J.M.; Krühne, U. Topology optimization for biocatalytic microreactor configurations. In 12th International Symposium on Process Systems Engineering and 25th European Symposium on Computer Aided Process Engineering; Gernaey, K.V., Huusom, J.K., Gani, R., Eds.; Elsevier, 2015; Vol. 37, Computer Aided Chemical Engineering, pp. 1463–1468. [Google Scholar] [CrossRef]
- Pei, Y.; Pichon, L.; Le Bihan, Y.; Bensetti, M. SIMP-method topology optimization of ferrite structures in inductive power transfer systems. IEEE Transactions on Electromagnetic Compatibility, 2023. [Google Scholar]
- Sosa Méndez, D.; García Cena, C.E.; Bedolla-Martínez, D.; Martín González, A. Innovative metaheuristic optimization approach with a bi-triad for rehabilitation exoskeletons. Sensors 2024, 24, 2231. [Google Scholar] [CrossRef]
- Mojiri, S.; Shafiei, A.; Nourollahi, A. Topological optimization of structures with thermomechanical loading under compliance constraints for 3D printing applications. Journal of Materials Research and Technology 2024, 30, 4192–4211. [Google Scholar] [CrossRef]
- Xie, Y.M.; Steven, G.P. A simple evolutionary procedure for structural optimization. Computers & structures 1993, 49, 885–896. [Google Scholar]
- Wang, S.Y.; Tai, K. Structural topology design optimization using genetic algorithms with a bit-array representation. Computer methods in applied mechanics and engineering 2005, 194, 3749–3770. [Google Scholar] [CrossRef]
- Plocher, J.; Panesar, A. Review on design and structural optimisation in additive manufacturing: Towards next-generation lightweight structures. Materials & Design 2019, 183, 108164. [Google Scholar] [CrossRef]
- Wang, X.; Zhang, D.; Zhao, C.; Zhang, P.; Zhang, Y.; Cai, Y. Optimal design of lightweight serial robots by integrating topology optimization and parametric system optimization. Mechanism and Machine Theory 2019, 132, 48–65. [Google Scholar] [CrossRef]
- Tokarski, T. Atlas miar człowieka. In Centralny Instytut Ochrony Pracy – Państwowy Instytut Badawczy; 2023. [Google Scholar]
- Falkowski, P.; Pikuliński, M.; Osiak, T.; Jeznach, K.; Zawalski, K.; Kołodziejski, P.; Zakręcki, A.; Oleksiuk, J.; Śliż, D.; Osiak, N. Similarity Analysis of Upper Extremity’s Trajectories in Activities of Daily Living for Use in an Intelligent Control System of a Rehabilitation Exoskeleton. Proceedings of the Actuators. MDPI 2025, Vol. 14, 324. [Google Scholar] [CrossRef]
- Falkowski, P.; Zawalski, K. Multibody Dynamics Simulation of Upper Extremity Rehabilitation Exoskeleton During Task-Oriented Exercises. Actuators 2025, 14. [Google Scholar] [CrossRef]
- Thøgersen, M.B.; Mohammadi, M.; Gull, M.A.; Bengtson, S.H.; Kobbelgaard, F.V.; Bentsen, B.; Khan, B.Y.A.; Severinsen, K.E.; Bai, S.; Bak, T.; et al. User based development and test of the exotic exoskeleton: empowering individuals with tetraplegia using a compact, versatile, 5-dof upper limb exoskeleton controlled through intelligent semi-automated shared tongue control. Sensors 2022, 22, 6919. [Google Scholar] [CrossRef]
- Falkowski, P. A numerical algorithm for optimal selection of the driving mechanisms for ExoReha exoskeleton. In Proceedings of the 2024 10th International Conference on Mechatronics and Robotics Engineering (ICMRE), 2024; IEEE; pp. 149–154. [Google Scholar]
- Panda, B.K.; Sahoo, S. Thermo-mechanical modeling and validation of stress field during laser powder bed fusion of AlSi10Mg built part. Results in Physics 2019, 12, 1372–1381. [Google Scholar] [CrossRef]
- Olakanmi, E.O.; Cochrane, R.F.; Dalgarno, K.W. A review on selective laser sintering/melting (SLS/SLM) of aluminium alloy powders: Processing, microstructure, and properties. Progress in materials science 2015, 74, 401–477. [Google Scholar] [CrossRef]
- Liu, B.; Sha, L.; Huang, K.; Zhang, W.; Yang, H. A topology optimization method for collaborative robot lightweight design based on orthogonal experiment and its applications. International Journal of Advanced Robotic Systems 2022, 19, 17298814211056143. [Google Scholar] [CrossRef]
- Liu, F.; Chen, M.; Wang, L.; Wang, X.; Lo, C.H. Custom-Fit and Lightweight Optimization Design of Exoskeletons Using Parametric Conformal Lattice. In Proceedings of the The International Conference on Computational Design and Robotic Fabrication, Springer Singapore Singapore, 2021; pp. 129–138. [Google Scholar]
- Herraiz, R. Design Modeling and Optimization of a Passive Lower-Limb Exoskeleton. In Proceedings of the The 10th Student Symposium on Mechanical and Manufacturing Engineering, 2022. [Google Scholar]
- Orban, M.; Guo, K.; Luo, C.; Yang, H.; Badr, K.; Elsamanty, M. Development and evaluation of a soft pneumatic muscle for elbow joint rehabilitation. Frontiers in Bioengineering and Biotechnology 2024, 12, 1401686. [Google Scholar] [CrossRef] [PubMed]
- Zeiaee, A.; Zarrin, R.S.; Eib, A.; Langari, R.; Tafreshi, R. CLEVERarm: A lightweight and compact exoskeleton for upper-limb rehabilitation. IEEE Robotics and Automation Letters 2021, 7, 1880–1887. [Google Scholar] [CrossRef]
- Aboulkhair, N.T.; Simonelli, M.; Parry, L.; Ashcroft, I.; Tuck, C.; Hague, R. 3D printing of Aluminium alloys: Additive Manufacturing of Aluminium alloys using selective laser melting. Progress in materials science 2019, 106, 100578. [Google Scholar] [CrossRef]
- Zhang, N.; Bahsoon, R.; Tziritas, N.; Theodoropoulos, G. Explainable human-in-the-loop dynamic data-driven digital twins. In Proceedings of the International Conference on Dynamic Data Driven Applications Systems, 2022; Springer; pp. 233–243. [Google Scholar]
- Chiriatti, G.; Palmieri, G.; Palpacelli, M.C. A framework for the study of human-robot collaboration in rehabilitation practices. In Proceedings of the International Conference on Robotics in Alpe-Adria Danube Region, 2020; Springer; pp. 190–198. [Google Scholar]
- Raj, R.; Kos, A. Study of Human–Robot Interactions for Assistive Robots Using Machine Learning and Sensor Fusion Technologies. Electronics 2024, 13, 3285. [Google Scholar] [CrossRef]
- Hentout, A.; Aouache, M.; Maoudj, A.; Akli, I. Human–robot interaction in industrial collaborative robotics: a literature review of the decade 2008–2017. Advanced Robotics 2019, 33, 764–799. [Google Scholar] [CrossRef]
Figure 1.
Visual of the SmartEx-Home exoskeleton assembled to the chair.
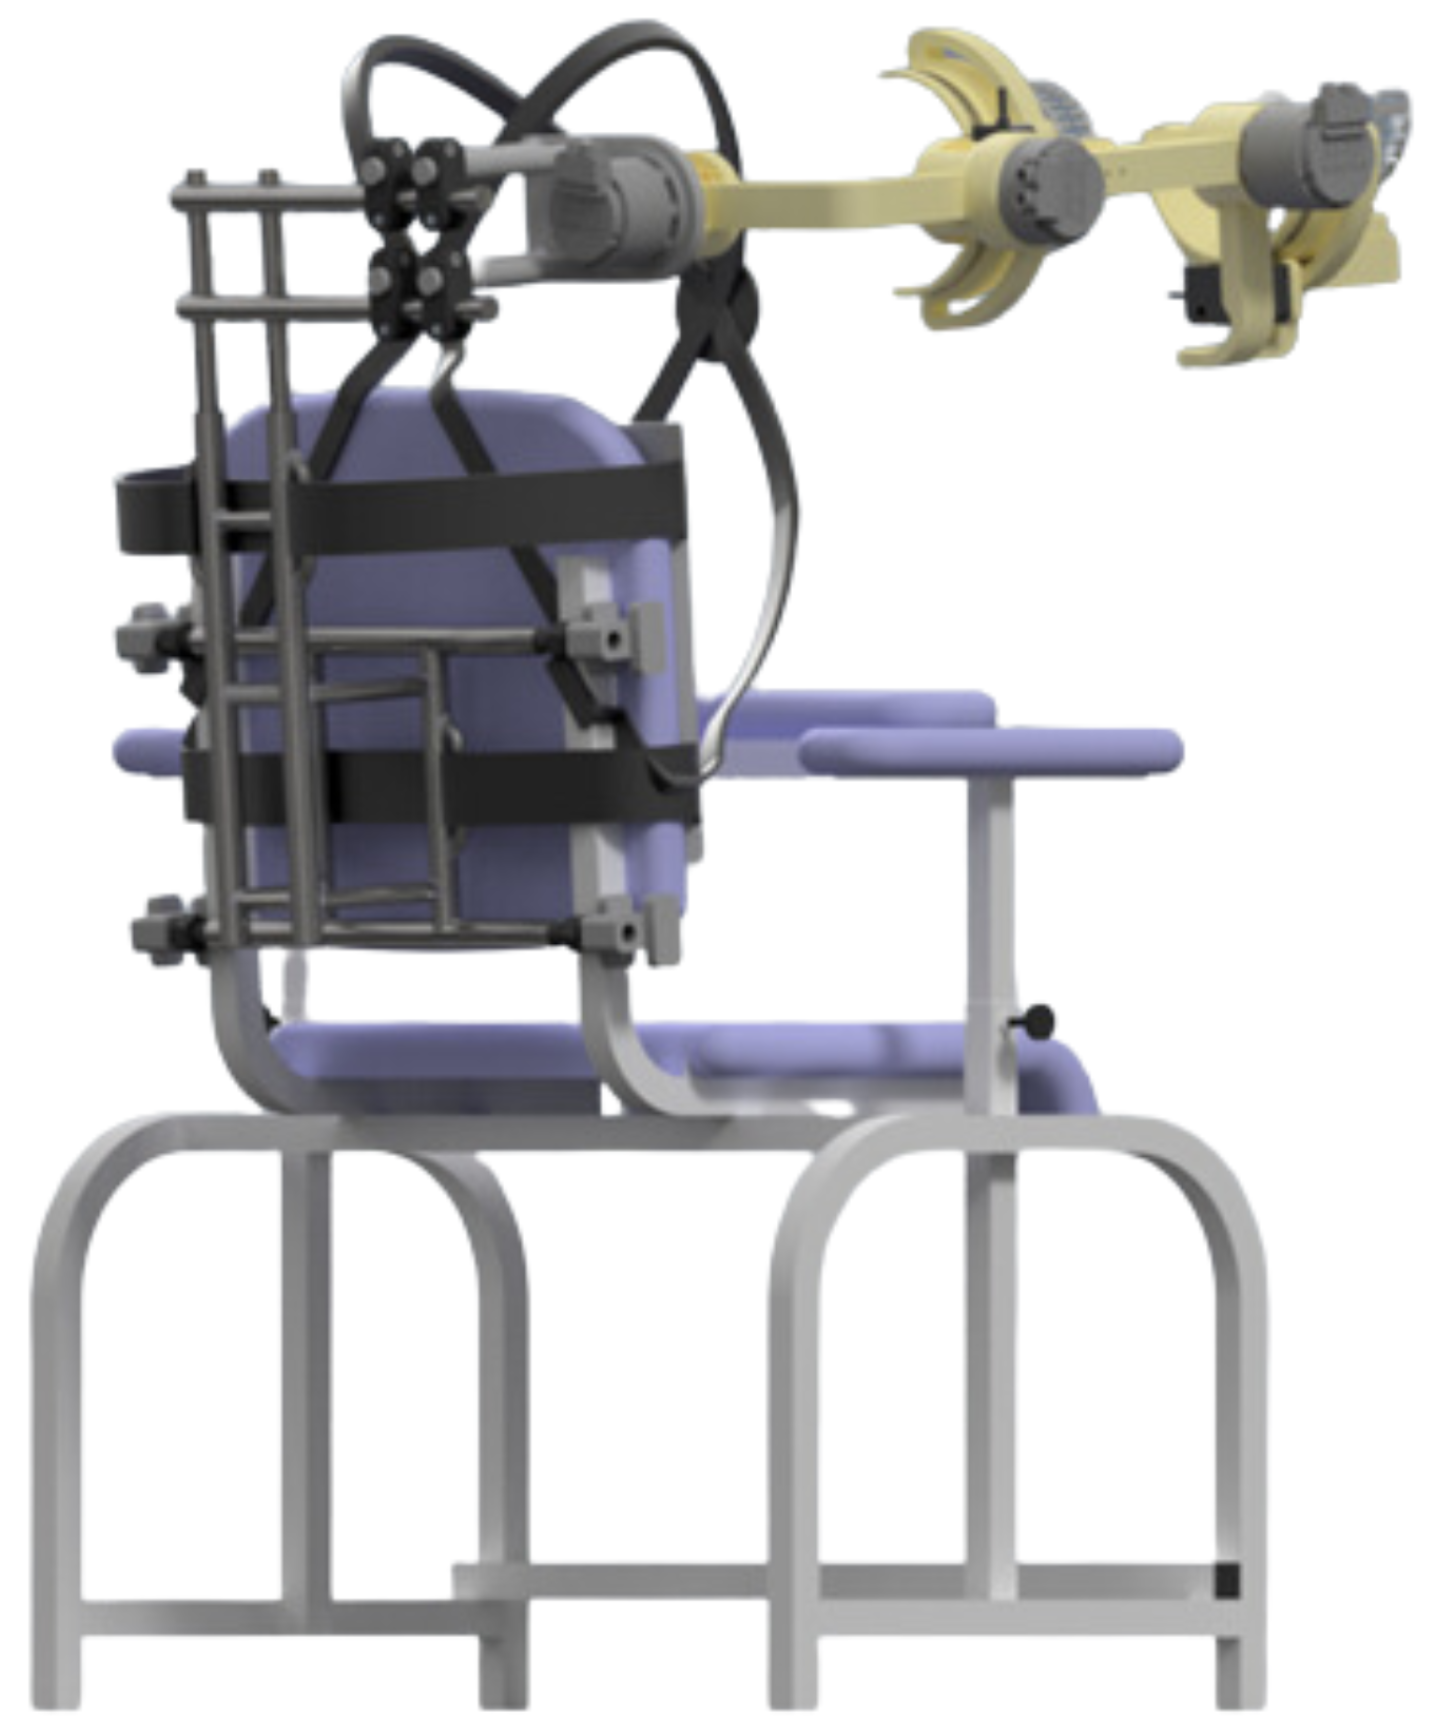
Figure 2.
The graphical visual of the used MBS model in its initial configuration with bodies (B) and joints (J) enumeration.
Figure 2.
The graphical visual of the used MBS model in its initial configuration with bodies (B) and joints (J) enumeration.
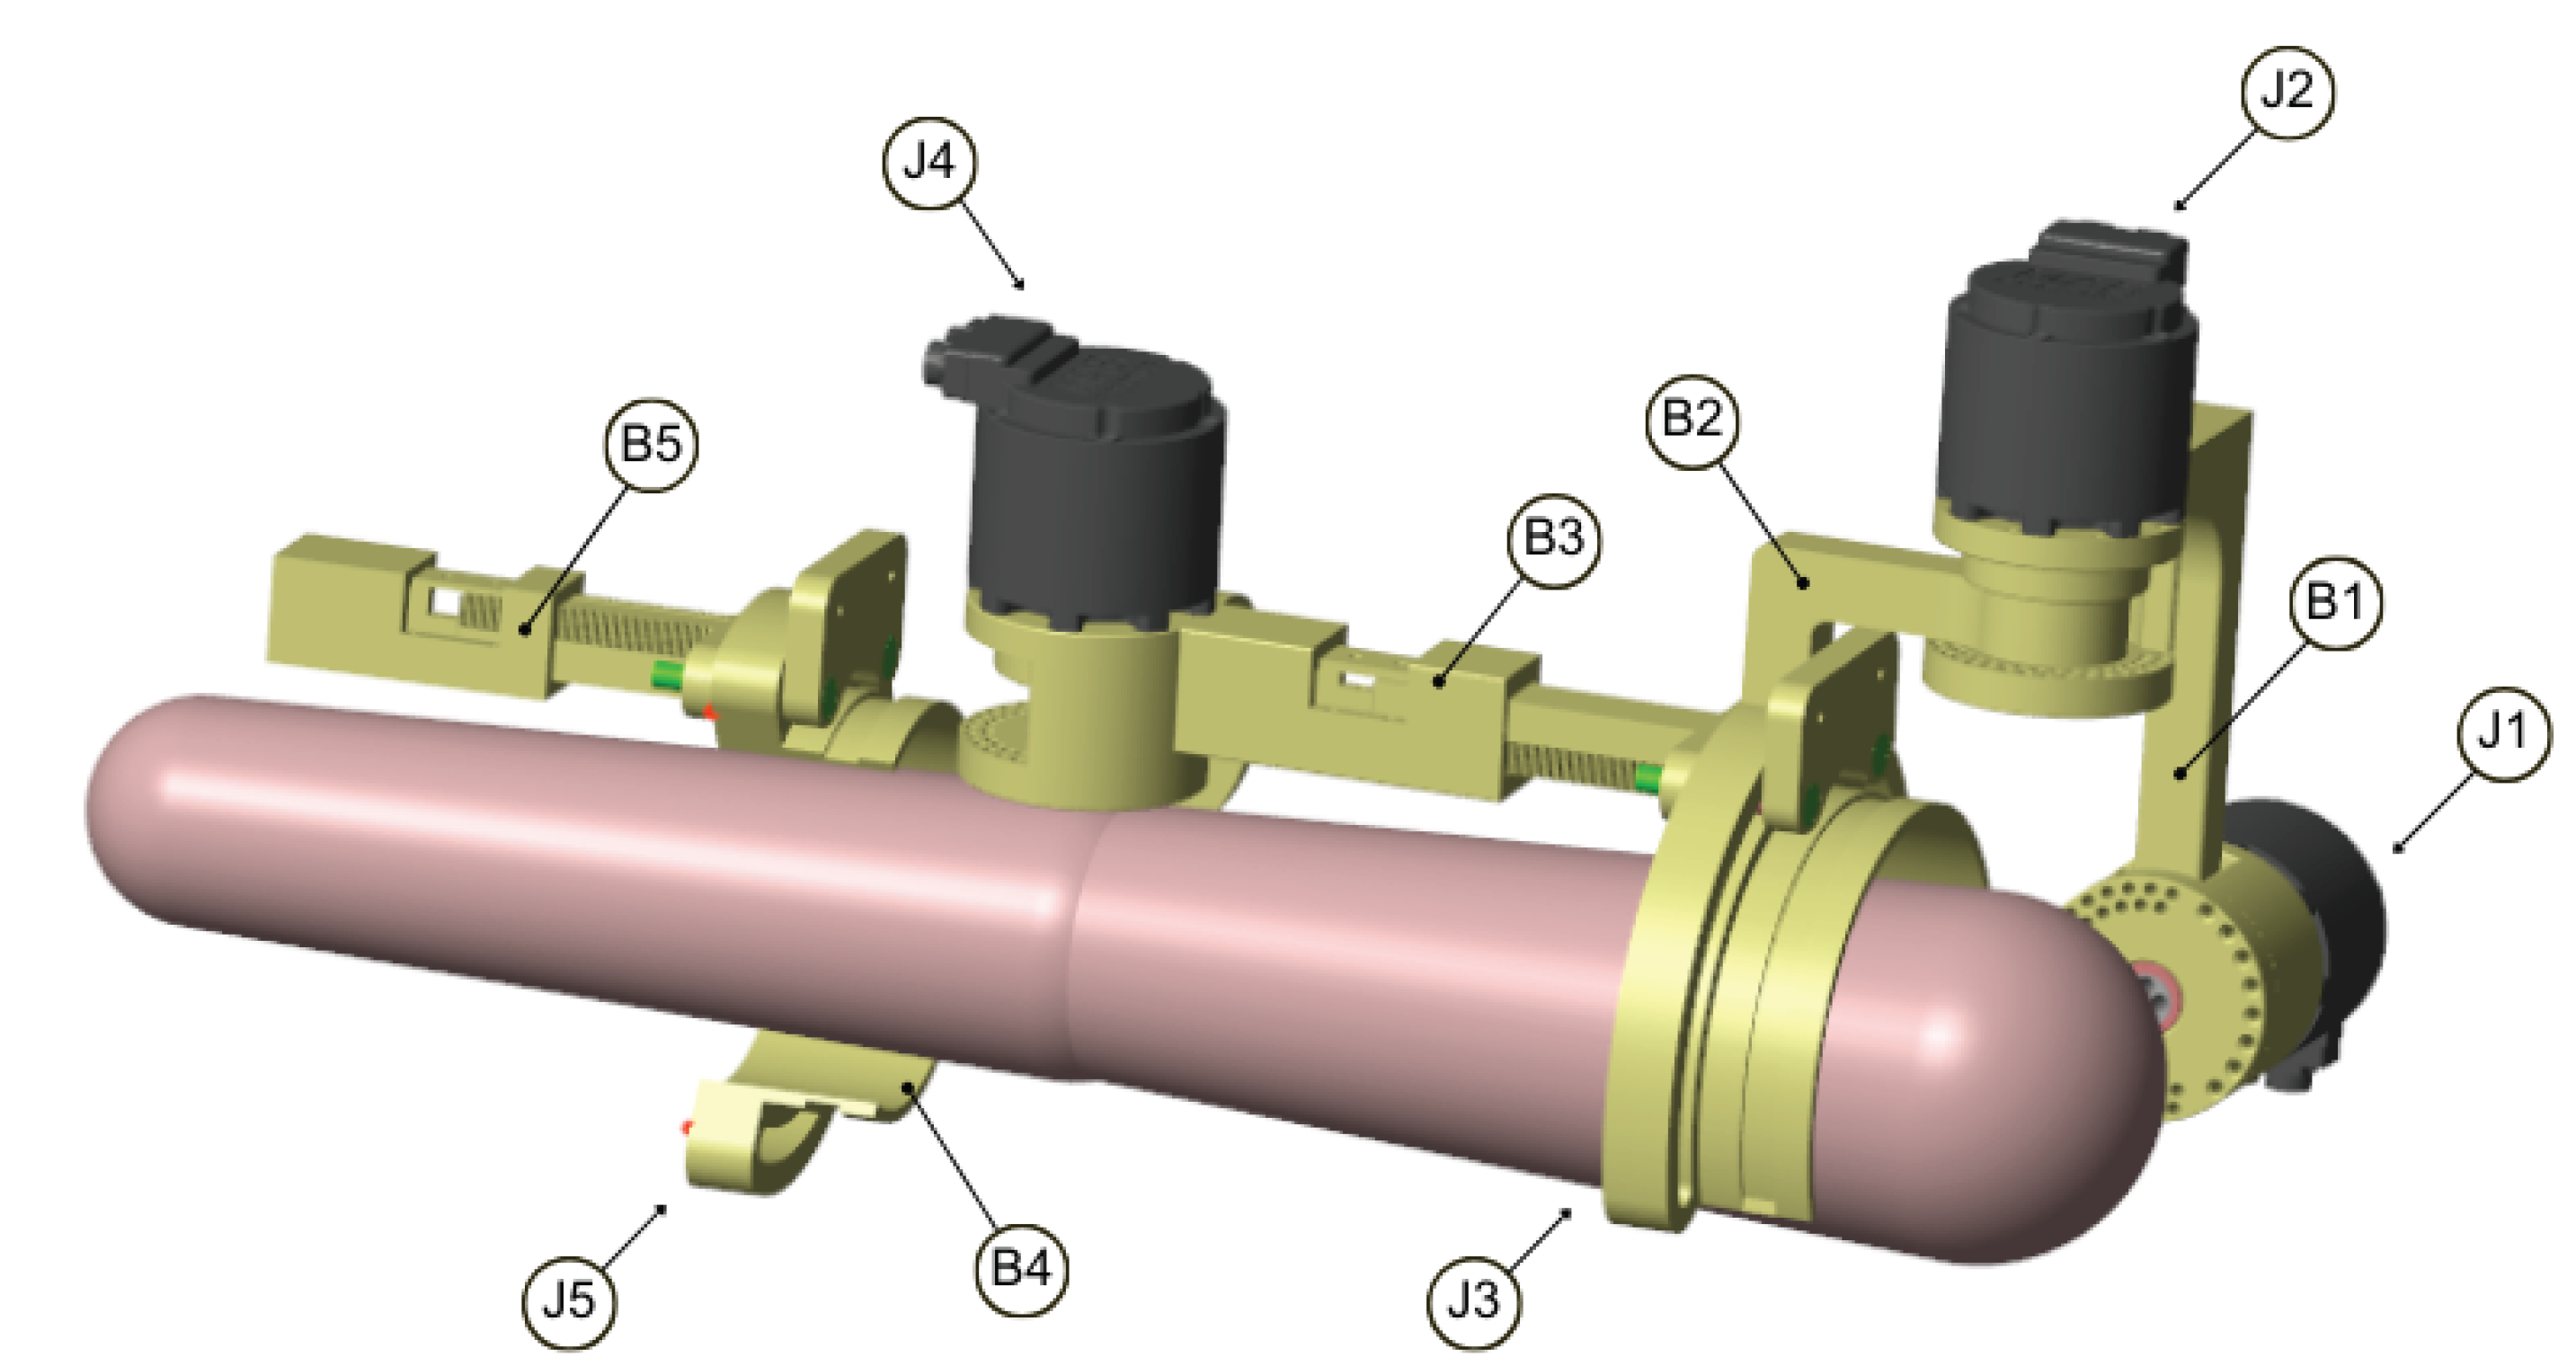
Figure 3.
Time history of force and torque in body 1, connection 2, trial 14, subject A (part of the total time series)
Figure 3.
Time history of force and torque in body 1, connection 2, trial 14, subject A (part of the total time series)
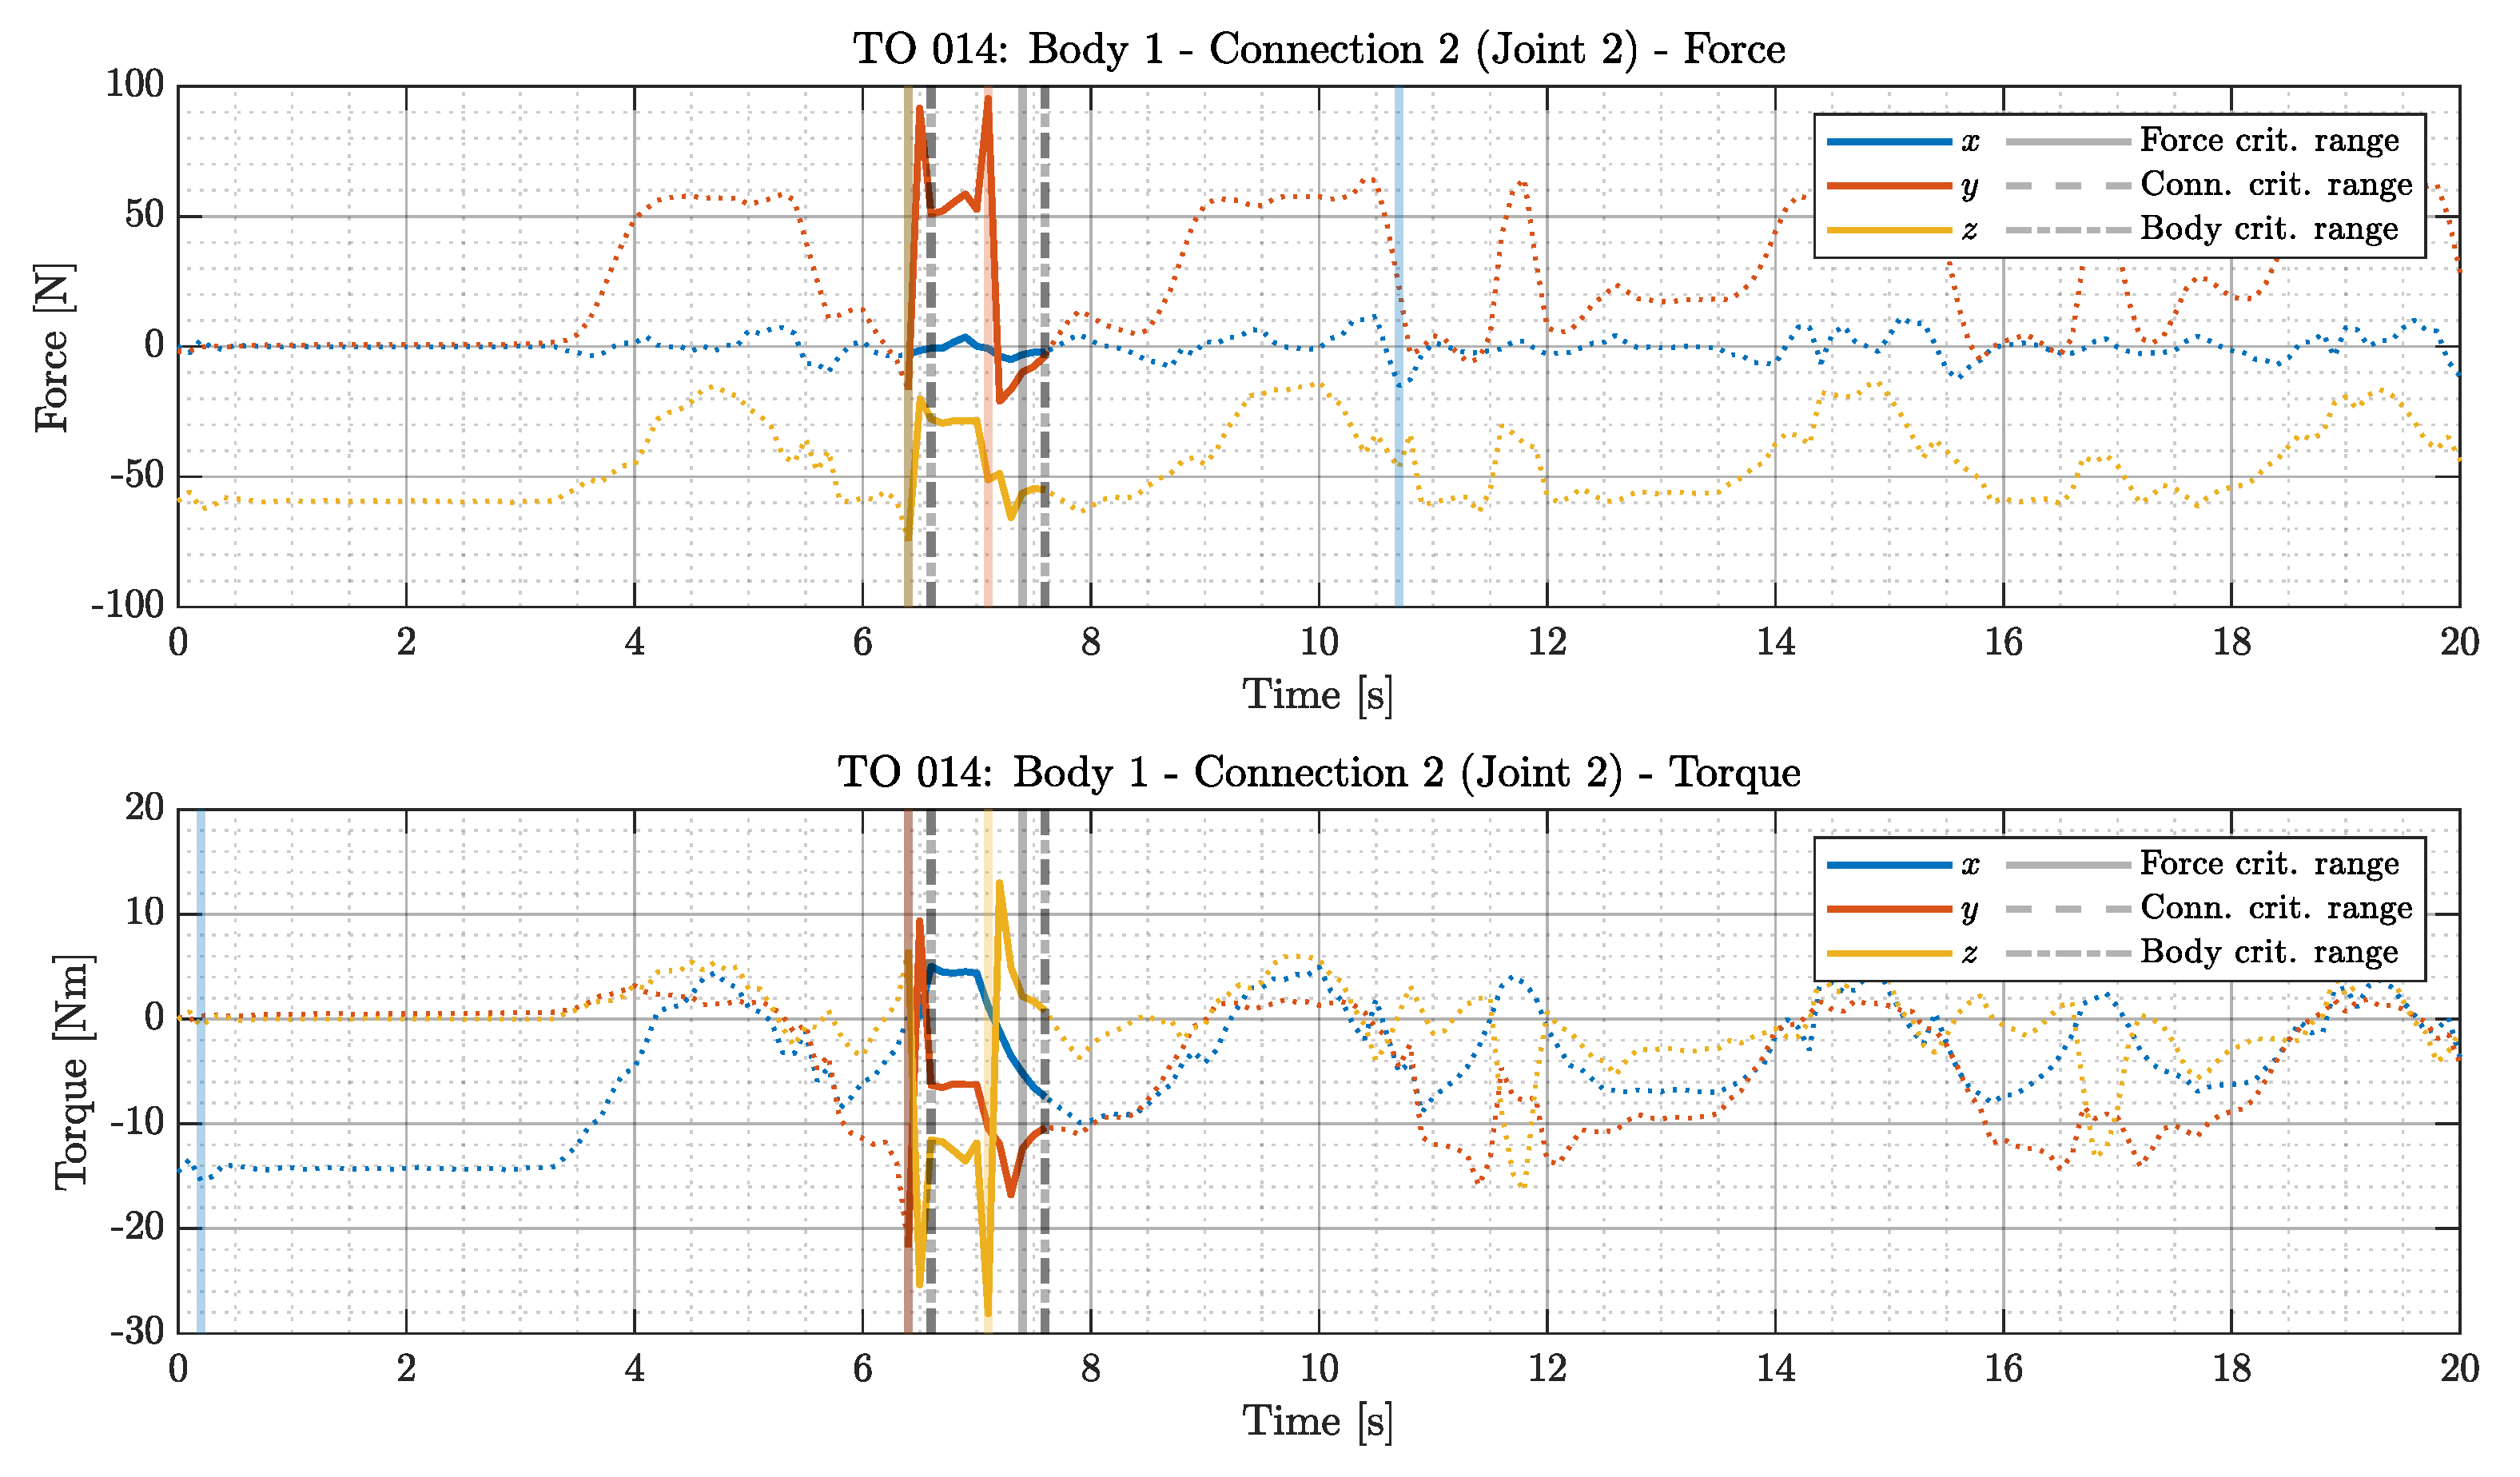
Figure 4.
Body 3 regulation part (A) and regulation lock (B).
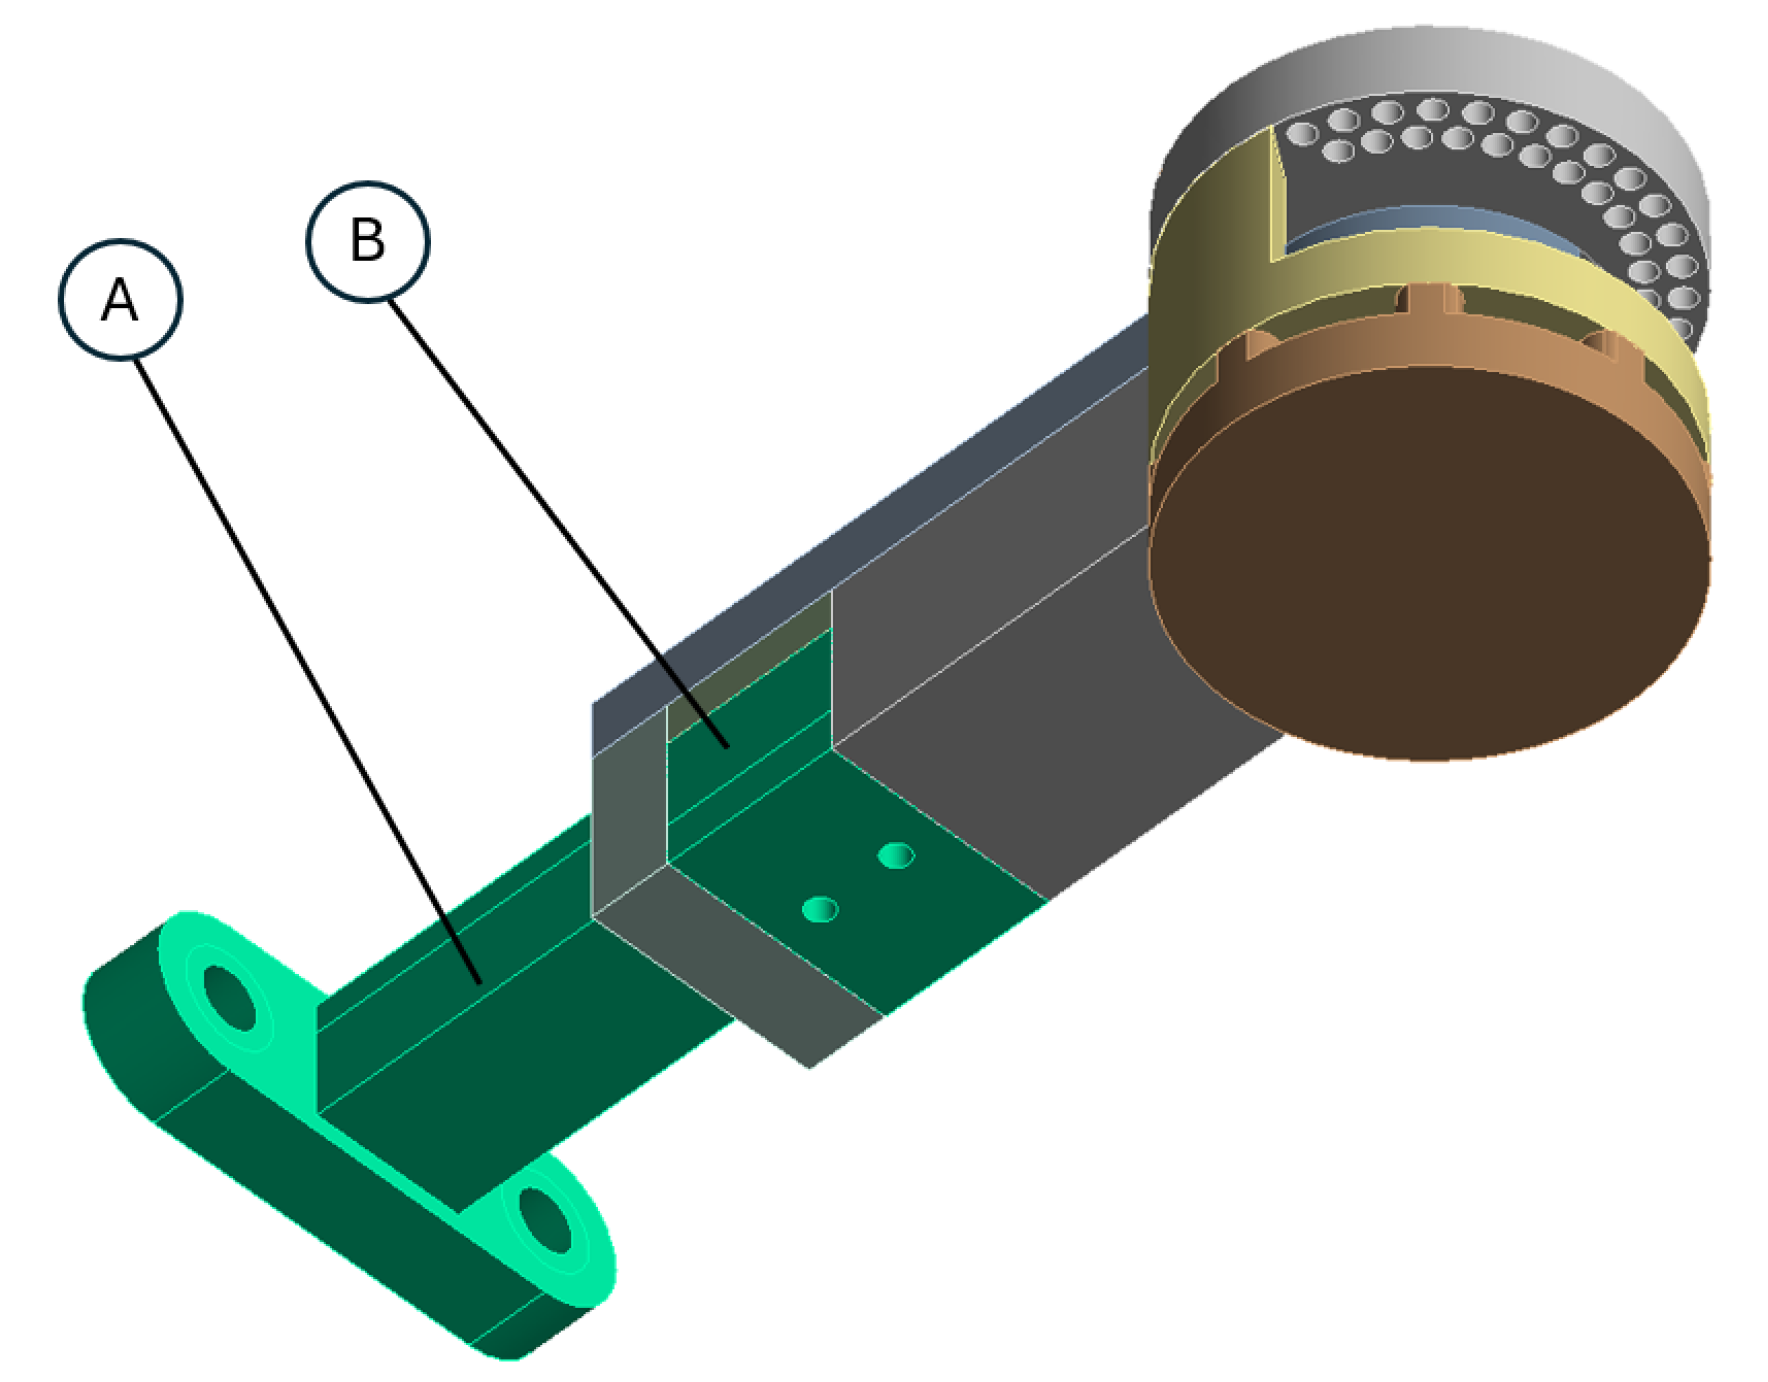
Figure 5.
Reduced stress distribution for the bolted connection in the rotational joint.
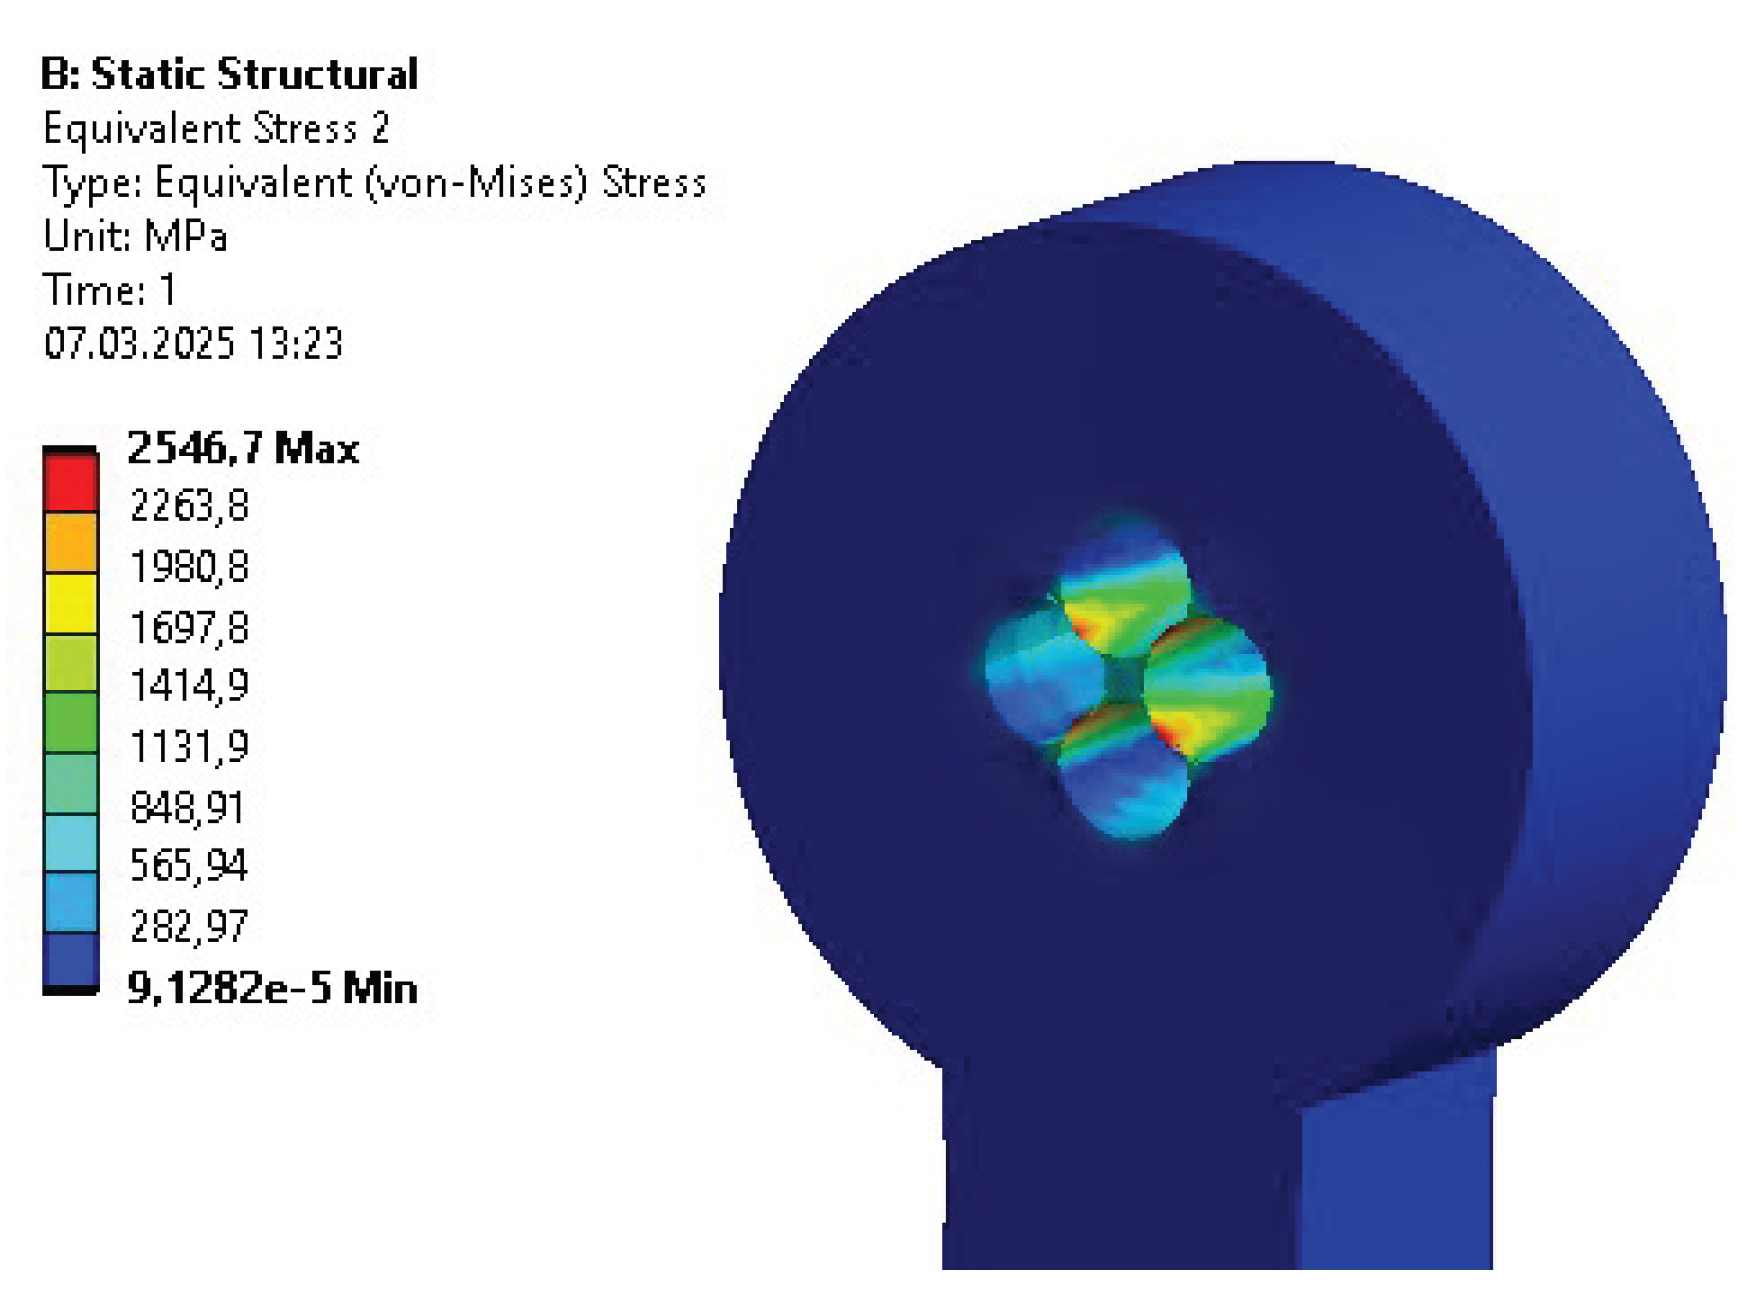
Figure 6.
Reduced stress distribution for key connection in rotational joint.
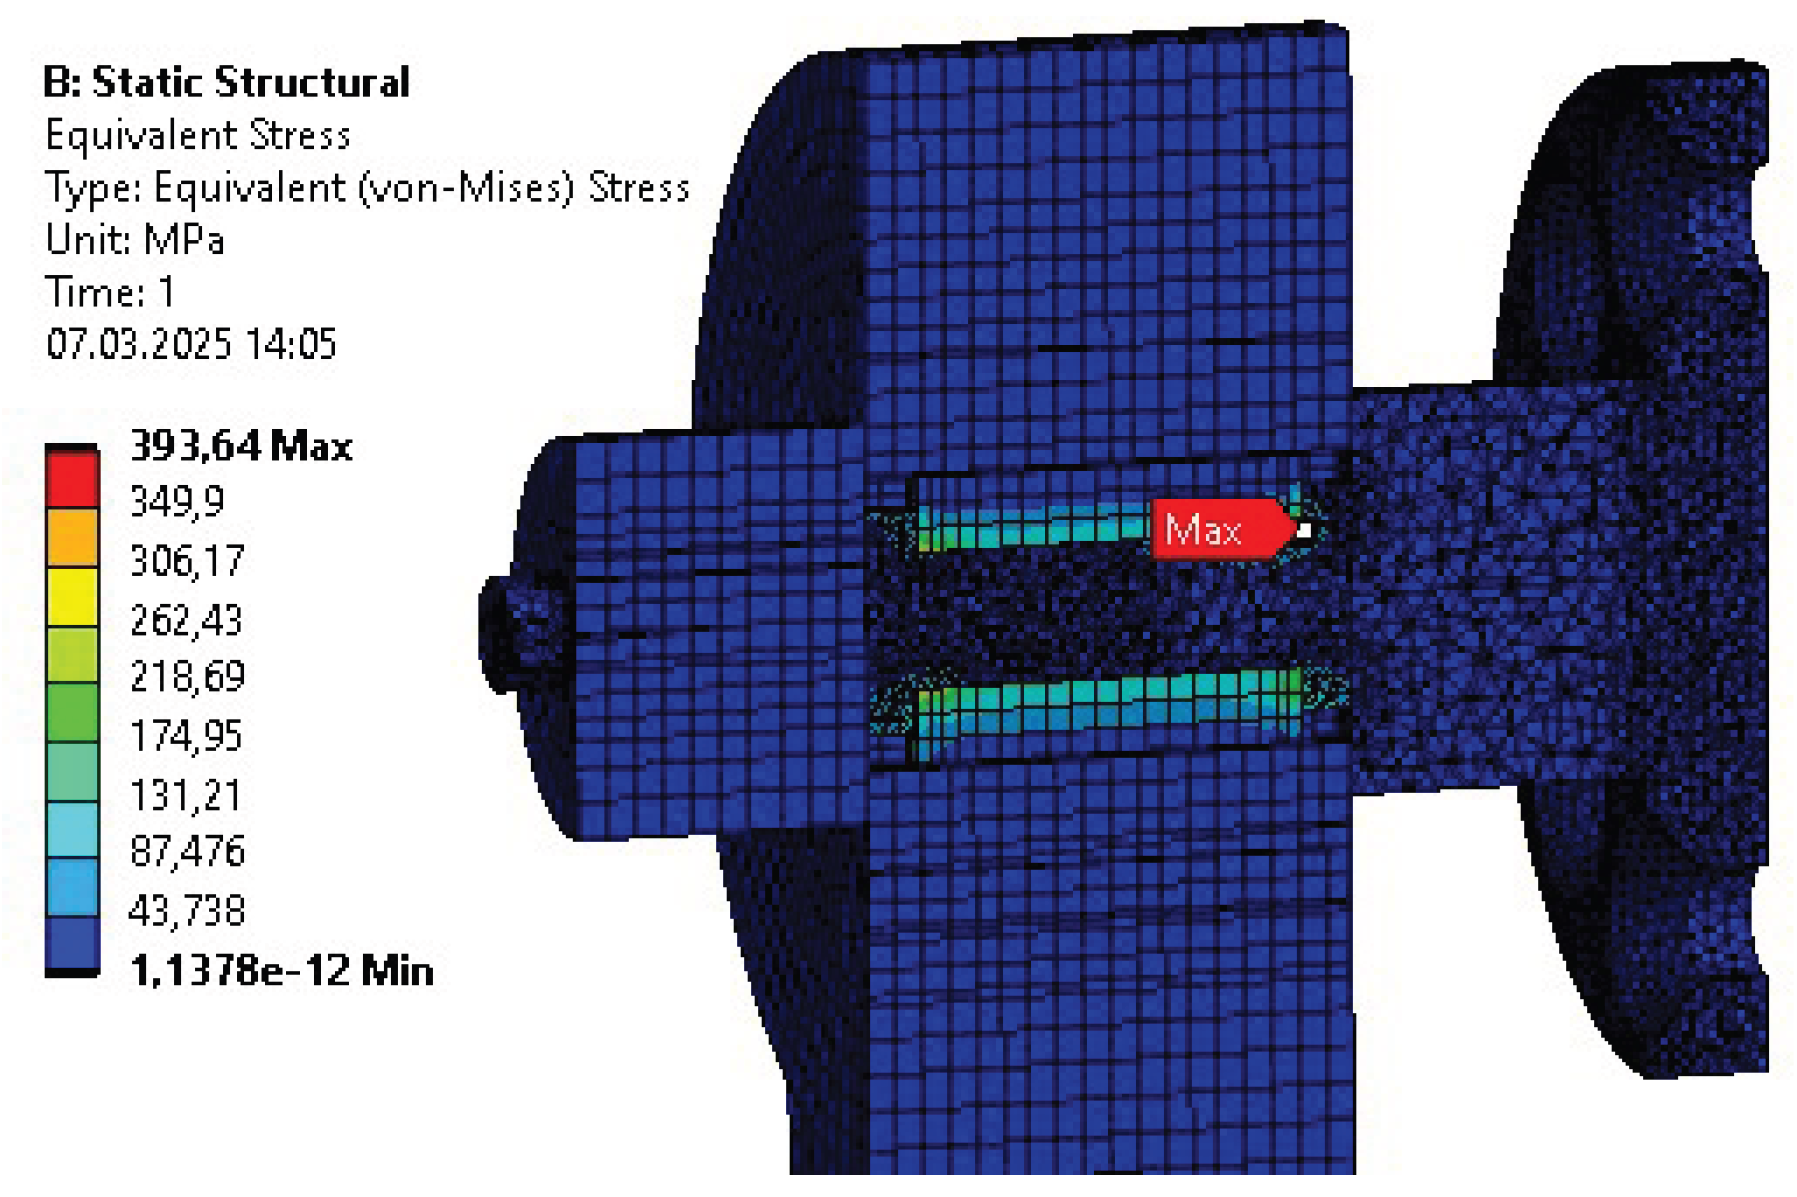
Figure 7.
Deformation distribution within a polymer body for the initial design.
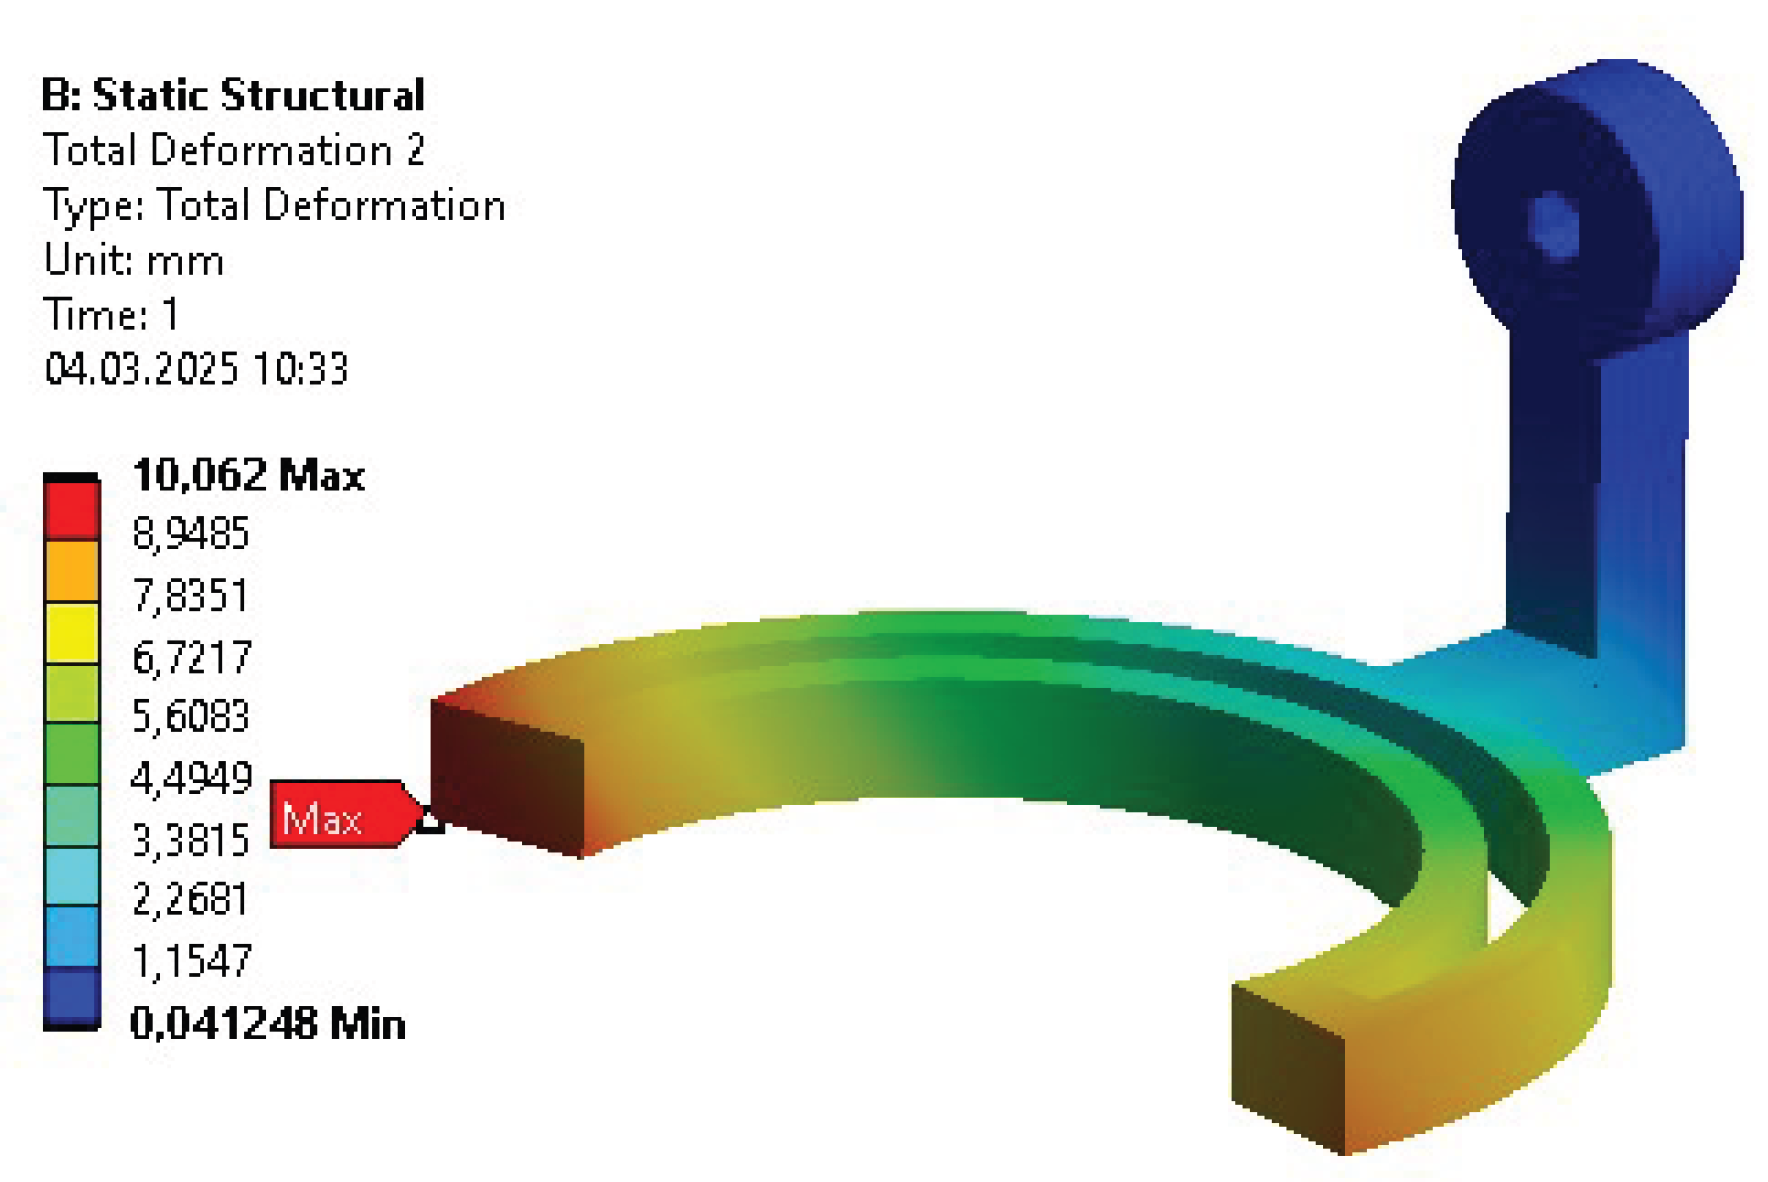
Figure 8.
Features extracted from the results of topology optimization
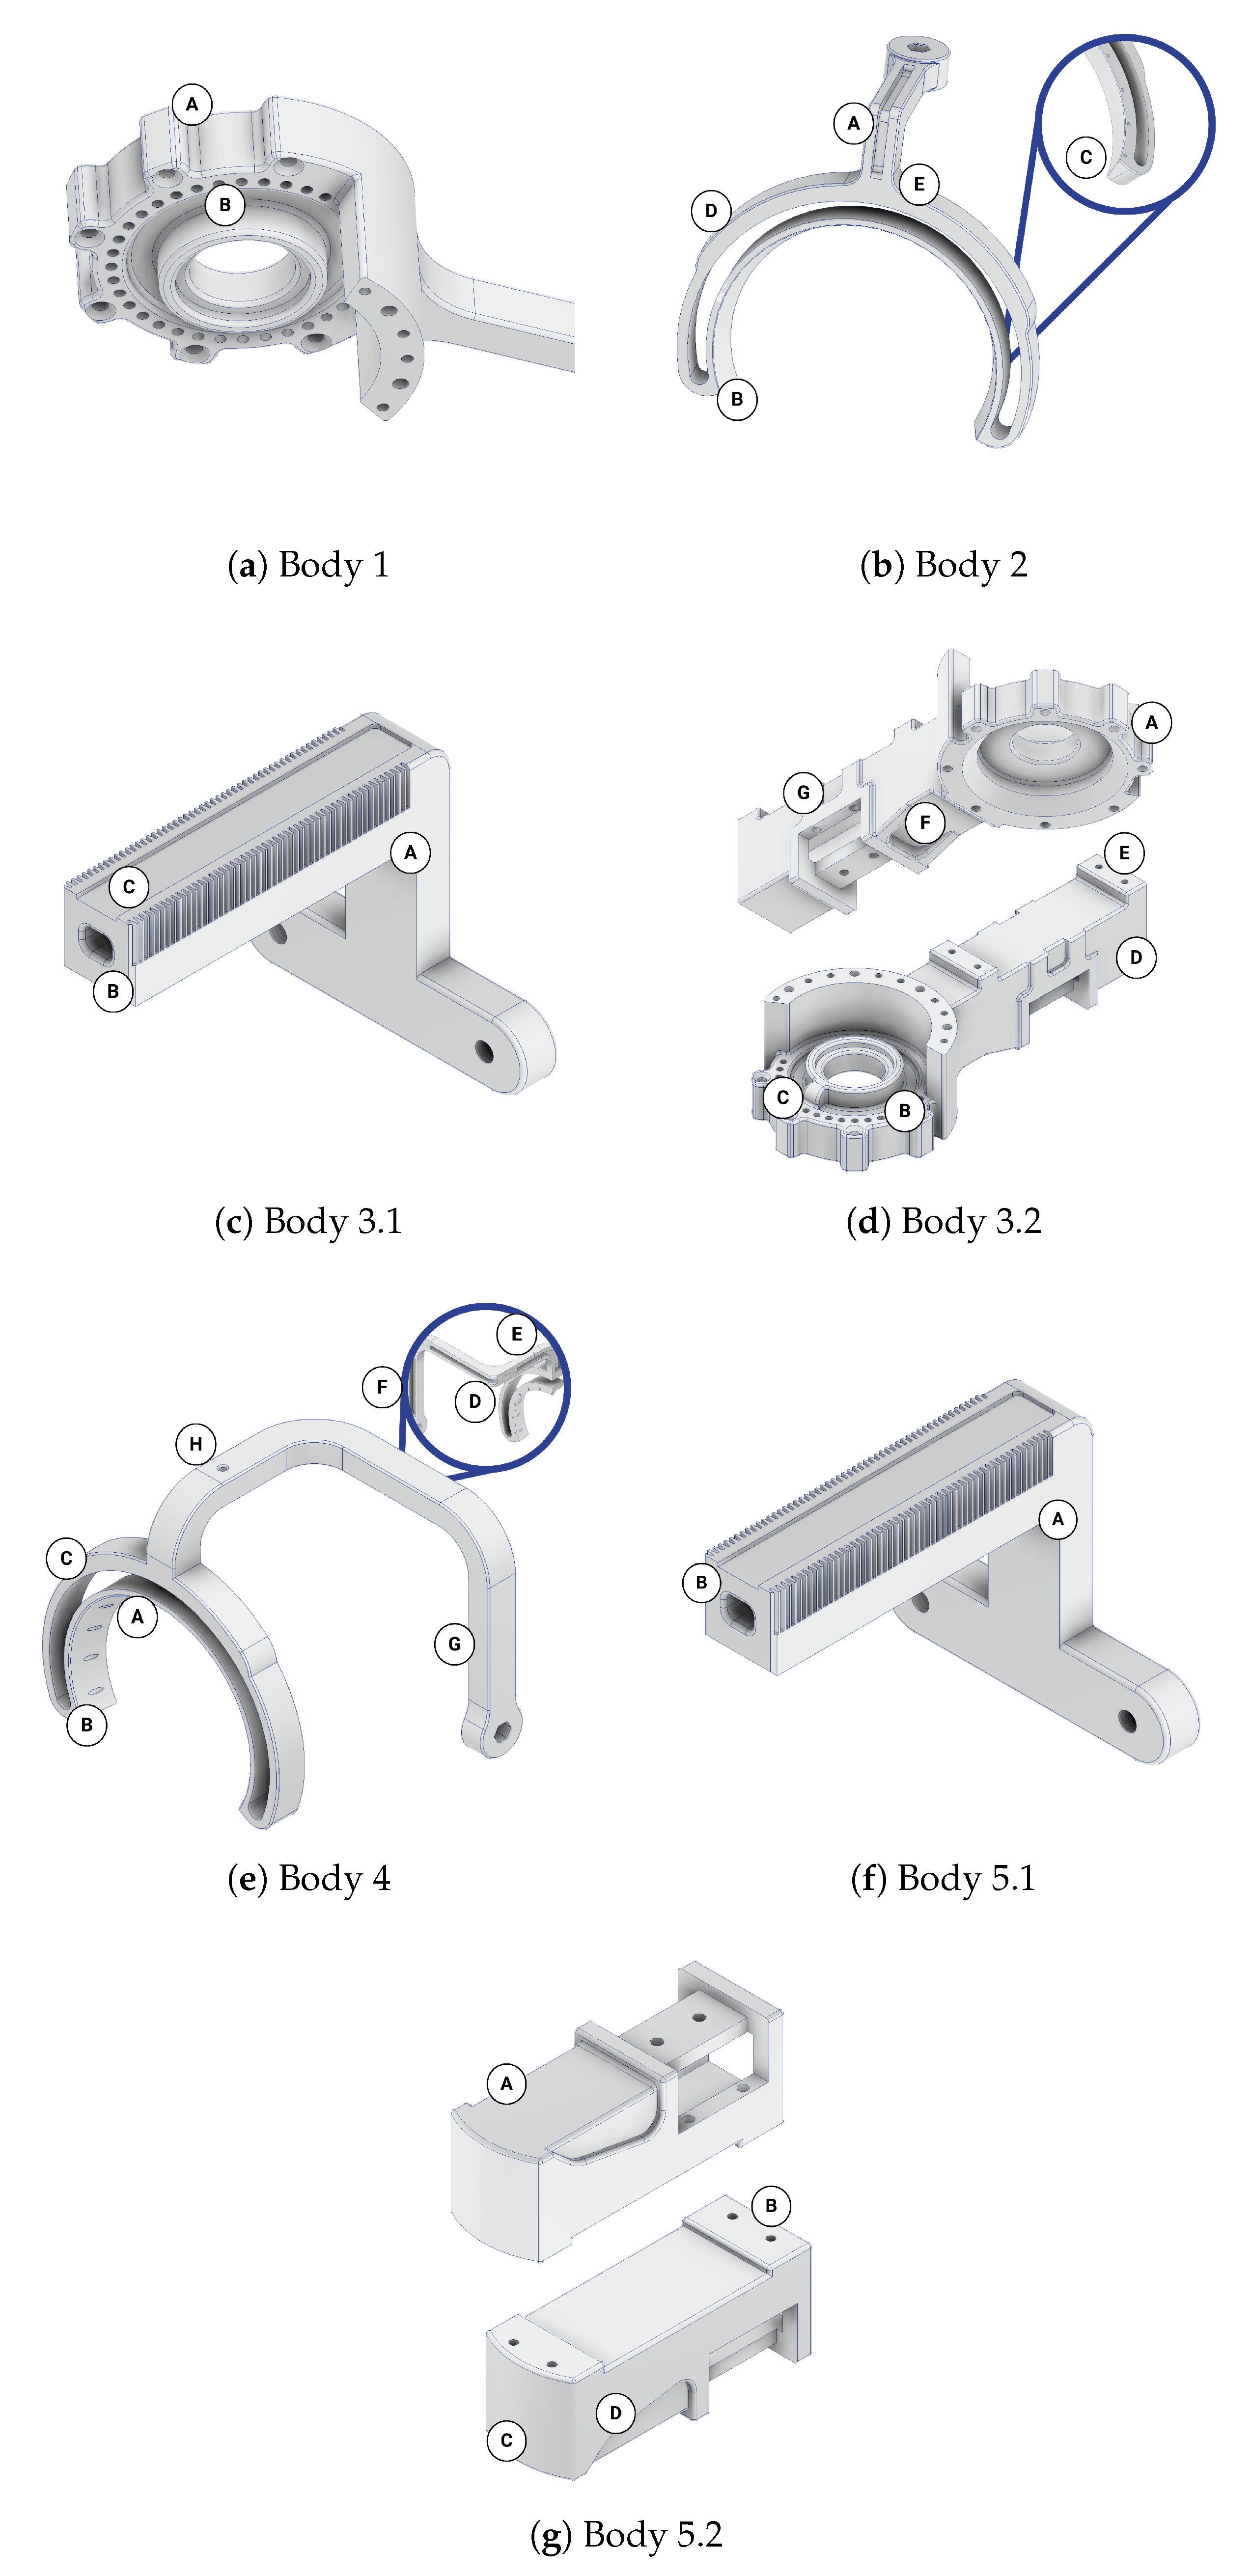
Table 1.
Stages of the complete simulation-based design.
| No. | Stage | Purpose |
|---|---|---|
| 1 | Initial design | Creating geometry to compute mass parameters for MBD simulations. |
| 2 | Motions modeling | Gathering real-life motions for MBD simulations (control inputs). |
| 3 | Inverse dynamics | Computing torques and forces in characteristic points of the model for FEM simulations (loads). |
| 4 | Initial parametric optimization | Adjusting general overall dimensions and selecting material before topology optimization. |
| 5 | Topology optimization | Extracting new features to decrease the mass of the structure. |
| 6 | Final parametric optimization | Adjusting dimensions of the extracted features for the final design. |
Table 2.
Selected critical forces and torques.
| Body | Connection | Trial | Subject | Force [N] | Torque [Nm] | ||||
|---|---|---|---|---|---|---|---|---|---|
| x | y | z | x | y | z | ||||
| 1 | 1 | 14 | A | -68.34 | -102.58 | 5.00 | -41.83 | 26.69 | 13.15 [t] |
| 2 | -5.00 | 95.31 | -65.70 | -7.41 | -16.76 | -28.13 [b] | |||
| 2 | 1 | 13 | B | 50.74 | -77.85 | 113.97 | 28.94 | -4.16 | 15.30 [t] |
| 2 | 0.00 | 0.00 | 0.00 | 0.00 | -14.42 | 0.00 | |||
| 3 | 0.00 | 0.00 | 0.00 | -24.01 | 0.00 | 0.00 | |||
| 4 | 48.31 | -112.69 | 73.65 | 5.24 | 4.15 | 0.00 [b] | |||
| 3 | 1 | 20 | B | -147.43 | 51.46 | 20.50 | 9.37 | 4.05 | 0.00 [t] |
| 2 | 44.08 | -126.28 | 20.73 | 4.05 | -9.37 | 0.00 | |||
| 3 | 21.39 | 38.69 | -21.97 | -1.84 | 2.41 | -1.64 | |||
| 4 | 18.01 | -43.04 | 22.35 | -2.65 | -4.64 | -4.87 [b] | |||
| 4 | 1 | 13 | B | -27.93 | 40.68 | 77.32 | 1.81 | -9.43 | 5.16 [t] |
| 2 | 0.00 | 0.00 | 0.00 | 0.00 | -2.41 | 0.00 | |||
| 3 | 0.00 | 0.00 | 0.00 | 1.84 | 0.00 | 0.00 | |||
| 4 | -68.09 | 35.66 | 23.73 | 1.55 | -0.59 | 0.00 [b] | |||
| 5 | 1 | 5 | A | -51.80 | 22.42 | 12.24 | 0.58 | 1.08 | 0.00 [t] |
| 2 | 14.03 | -32.41 | 12.21 | 1.08 | -0.58 | 0.00 | |||
| 3 | 21.85 | 17.44 | 32.71 | -2.10 | 3.69 | 1.19 [b] | |||
Table 3.
Mesh metric - Initial division.
| Parameter | Body 1 | Body 2 | Body 3 | Body 4 | Body 5 |
|---|---|---|---|---|---|
| Number of Elements | 233 864 | 103 152 | 472 256 | 176 331 | 124 071 |
| Number of Nodes | 513 462 | 85 132 | 260 157 | 64 793 | 230 626 |
| Avg. Element Quality | 0.81225 | 0.912 | 0.800 | 0.856 | 0.799 |
| Avg. Skewness | 0.24487 | 0.148 | 0.251 | 0.208 | 0.226 |
Table 4.
Results of initial strength analyses.
| Parameter | Body 1 | Body 2 | Body 3 | Body 4 | Body 5 |
|---|---|---|---|---|---|
| Mass [kg] | 0.998 | 0.786 | 0.808 | 0.879 | 0.436 |
| Max. Deformation [mm] | 0.17 | 0.30 | 0.36 | 0.36 | 0.018 |
| Avg. Deformation [mm] | 0.09 | 0.13 | 0.12 | 0.23 | 0.007 |
| Max. Stress [MPa] | 32.43 | 22.70 | 57.54 | 31.14 | 23.79 |
| Avg. Stress [MPa] | 1.25 | 1.77 | 1.66 | 1.79 | 0.97 |
| Max. Strain [‰] | 0.4635 | 0.3527 | 0.8339 | 0.5146 | 0.6500 |
| Avg. Strain [‰] | 0.0181 | 0.0259 | 0.0244 | 0.0264 | 0.0178 |
| Min. Safety Factor | 7.44 | 11.48 | 4.50 | 12.9 | 6.17 |
Table 5.
Output parameters after initial parametric optimization (validation analysis).
| Parameter | Body 1 | Body 2 | Body 3 | Body 4 | Body 5 |
|---|---|---|---|---|---|
| Mass [kg] | 0.572 | 0.523 | 0.740 | 0.420 | 0.393 |
| Max. Deformation [mm] | 0.78 | 0.29 | 0.48 | 2.82 | 0.06 |
| Avg. Deformation [mm] | 0.39 | 0.13 | 0.18 | 0.55 | 0.02 |
| Max. Stress [MPa] | 39.40 | 22.57 | 31.04 | 52.38 | 20.47 |
| Avg. Stress [MPa] | 2.90 | 1.86 | 1.75 | 6.20 | 0.85 |
| Max. Strain [‰] | 0.6097 | 0.3543 | 0.4833 | 0.7724 | 0.2998 |
| Avg. Strain [‰] | 0.0418 | 0.0271 | 0.0261 | 0.0911 | 0.0134 |
| Min. Safety Factor | 5.24 | 11.48 | 8.35 | 4.94 | 11.24 |
Table 6.
Mesh metric for topology optimization.
| Parameter | Body 1 | Body 2 | Body 3 | Body 4 | Body 5 |
|---|---|---|---|---|---|
| Number of Elements | 1 926 246 | 457 250 | 1 329 921 | 785 036 | 1 034 802 |
| Number of Nodes | 363 706 | 667 675 | 321 296 | 1 156 409 | 216 277 |
| Avg. Element Quality | 0.850 | 0.846 | 0.841 | 0.847 | 0.816 |
| Avg. Skewness | 0.210 | 0.216 | 0.224 | 0.214 | 0.245 |
Table 8.
Mesh metrics for final parametric optimization.
| Parameter | Body 1 | Body 2 | Body 3 | Body 4 | Body 5 |
|---|---|---|---|---|---|
| Number of Elements | 254 400 | 206 301 | 117 562 | 228 195 | 645 907 |
| Number of Nodes | 402 625 | 331 080 | 426 507 | 368 397 | 990 991 |
| Avg. Element Quality | 0.801 | 0.837 | 0.834 | 0.840 | 0.837 |
| Avg. Skewness | 0.267 | 0.231 | 0.232 | 0.23 | 0.227 |
Table 9.
Validation of final parametric optimization results.
| Parameter | Body 1 | Body 2 | Body 3 | Body 4 | Body 5 |
|---|---|---|---|---|---|
| Mass [kg] | 0.402 | 0.472 | 0.465 | 0.451 | 0.200 |
| Max. Deformation [mm] | 1.19 | 0.59 | 2.62 | 2.54 | 0.37 |
| Avg. Deformation [mm] | 0.52 | 0.26 | 1.03 | 1.00 | 0.15 |
| Max. Stress [MPa] | 70.60 | 49.68 | 111.06 | 63.88 | 37.41 |
| Avg. Stress [MPa] | 8.37 | 2.93 | 5.65 | 5.61 | 1.78 |
| Max. Strain [‰] | 1.462 | 0.801 | 1.881 | 0.942 | 0.535 |
| Avg. Strain [‰] | 0.126 | 0.0433 | 0.0851 | 0.0850 | 0.026 |
| Min. Safety Factor | 3.25 | 5.03 | 2.52 | 3.60 | 6.68 |
Table 10.
Exoskeleton Summary.
| Parameter | INITIAL | PO 1 | TO | PO 2 |
|---|---|---|---|---|
| Mass [kg] | 3.907 | 2.648 | 2.199 | 1.990 |
| Max. Deformation [mm] | 0.36 | 2.82 | 1.99 | 2.62 |
| Avg. Deformation [mm] | 0.13 | 0.25 | 0.43 | 0.48 |
| Max. Stress [MPa] | 57.54 | 52.38 | 107.55 | 111.06 |
| Avg. Stress [MPa] | 1.52 | 2.59 | 3.47 | 3.88 |
| Max. Strain [‰] | 0.8339 | 0.7724 | 1.8078 | 1.881 |
| Avg. Strain [‰] | 0.0228 | 0.03811 | 0.0531 | 0.0582 |
| Min. Safety Factor | 4.50 | 4.94 | 2.60 | 2.52 |
Disclaimer/Publisher’s Note: The statements, opinions and data contained in all publications are solely those of the individual author(s) and contributor(s) and not of MDPI and/or the editor(s). MDPI and/or the editor(s) disclaim responsibility for any injury to people or property resulting from any ideas, methods, instructions or products referred to in the content. |
© 2025 by the authors. Licensee MDPI, Basel, Switzerland. This article is an open access article distributed under the terms and conditions of the Creative Commons Attribution (CC BY) license.
Copyright: This open access article is published under a Creative Commons CC BY 4.0 license, which permit the free download, distribution, and reuse, provided that the author and preprint are cited in any reuse.


