
Submitted:
10 January 2026
Posted:
12 January 2026
You are already at the latest version
Abstract
Diabetes Mellitus (DM) favors kidney remodeling, leading to diabetic kidney disease (DKD). Kidney histological alterations are identified after DKD installation, but have not been studied in the early stage of DM. We studied renal remodeling in Wistar rats at the early stage of DM, before DKD development, investigating alterations indicating a poor prognosis and whether age is an impact factor. Diabetes was induced with Alloxan. Groups: adult diabetic (DMA), elderly diabetic (DMI), adult sham control (CSA), and elderly sham control (CSI). After 30 days of confirmed diabetes, blood, urine, and kidney were collected. Both diabetic groups presented normal renal function. DMA and DMI showed tubular infiltration and hypertrophy, decreased Bowman's space, and reduced glomerular area. A decrease in the glomeruli number was observed in the DMI. An inverse correlation between the glomeruli number and the ApoB/ApoA ratio was observed on DMA. We conclude that histological changes characteristic of DKD can be observed in the early stages of DM, and age can have a role in the injury intensity. Tubular and glomerular alterations occur during DM installation and continue to evolve as DKD develops. Therefore, targeting the prevention of kidney remodeling could be a good therapeutic approach to prevent DKD.
Keywords:
diabetes mellitus
; diabetic kidney disease
; inflammation
; histology
1. Introduction
The progressive loss of pancreatic β-cells is a common characteristic of type 1 and type 2 Diabetes Mellitus (DM2), which will lead to less insulin availability and sustained hyperglycemia [1]. During hyperglycemia, increased formation of advanced glycation end products (AGEs) leads to greater generation of reactive oxygen species (ROS) [2,4]. ROS promotes the formation of free radicals, which induce oxidative stress and inflammation, leading to micro and macrovascular damage in target organs like the kidney [2,3]. Moreover, hyperglycemia stimulates greater extracellular matrix (ECM) formation, favoring tissue remodeling and diabetic kidney disease (DKD) development [5]. During aging, this pathophysiological process may develop more prominently due to cellular senescence. Therefore, it is expected that the tissue damage may be more evident in advanced ages [6,7].
DKD is characterized by albuminuria and progressive decline in glomerular filtration rate (GFR), as well as morphological changes in renal tissue [8,9]. A study conducted in diabetic rats observed that after 6 weeks, the kidneys showed decreased renal function, along with glomerular and tubular damage. This was evidenced by expansion and thickening of Bowman's space, as well as tubular dilation and atrophy of tubular cells, respectively [8]. Glomerular and tubular lesions play a crucial role in the pathophysiology of DKD, leading to apoptosis, fibrosis development, and progressive loss of renal function [5,9]. Another study, also conducted in rats, observed that 15 days after diabetes induction, the animals exhibited mesangial expansion, acute tubular necrosis, thickening of the glomerular basement membrane, and inflammatory cell infiltration [10].
Inflammation involves the release of leukotrienes, which are chemotactic and stimulate immune cell infiltration, thereby increasing cytokine release. This promotes and initiates the inflammatory and fibrotic processes [11,12]. In a study conducted in diabetic mice, infiltration of T lymphocytes and macrophages, along with increased expression of pro-inflammatory factors, was observed in renal tissue after 8 weeks [11].
The harmful hyperglycemic stimulus also stimulates differentiation of pericytes into myofibroblasts, which migrate to the interstitium and increase collagen production. Collagen is the main component of the extracellular matrix (ECM) [13,14]. Therefore, increased formation of AGEs in the diabetic kidney is also associated with increased collagen deposition, triggering tissue remodeling and fibrosis [15,16]. A study with mice induced into diabetes observed that after 12 weeks, the animals showed changes in renal function, as well as increased glomerular deposition of collagen types 1, 4, and 6 [15]. Another study conducted in diabetic mice observed that after 16 weeks, the animals exhibited increased collagen deposition and higher expression of collagen types 1, 3, and 4 in the kidney [13].
Some studies suggest that in the early stages of renal injury, tubular changes precede glomerular changes, and both play independent roles in the progressive development of early renal function decline [9,17]. In obese rats induced into pre-diabetes, it was observed after 21 days that there were no histological changes in the kidney, despite increased tubular expression of the renal injury molecule NGAL and increased glomerular deposition of collagen 4 [18].
Most studies demonstrate renal histological changes alongside alterations in renal function parameters, reflecting the onset of DKD [8,9,11,15]. However, it is also important to elucidate at what point during diabetes onset the renal tissue remodeling begins, to provide more information about the early stages of DKD, before the loss of cellular function. Therefore, this study aimed to determine whether, in the early phase of diabetes onset, before the development of DKD, there are already renal morphological changes that may indicate a poor prognosis. Additionally, the study aimed to determine whether age is a factor impacting these alterations.
2. Results
The biochemical parameters show an increase in glycemia and HbA1c, demonstrating the installation of DM. All renal parameters are within the reference values, but there was a statistical difference between the DM groups when compared to their respective controls, for urea and plasmatic and urinary creatinine (Table 1).
Histological analysis confirmed the validity of the experimental model by revealing significant morphological alterations in the pancreas of both the DMA and DMI groups. In the DMA group (Figure 1A), the exocrine parenchyma shows moderate inflammatory infiltrate and islet atrophy, when compared to the CSA group (Figure 1B), which exhibited preserved exocrine parenchyma, with large and well-defined islets. Similarly, pancreatic sections from the DMI group (Figure 1C) show in the exocrine parenchyma a moderate inflammatory infiltrate and islet atrophy, in contrast to the CSI group, where the exocrine parenchyma is preserved and the islet are preserved (Figure 1D).
In the morphological analysis of DMA renal tissue, 20 fields were analyzed, and 92% showed intense inflammatory infiltrate. The same was observed in the DMI group in 82% of the 20 analyzed fields. Additionally, the analyzed fields of the DMA and DMI groups presented tubular hypertrophy (Figure 2A and 2C), which is characterized by the expansion of the cytoplasmic volume and, consequently, enlargement of the tubule. The respective controls were used for the comparison (Figure 2B and 2D). 26% of the 20 analyzed fields in the DMA group, both tubular hypertrophy and tubular lesions were observed. The tubular lesions were evidenced by the tubules with big tubular lumens with thin tubular epithelium. The same was noted in 10% of the 20 analyzed fields in the DMI group (Figure 2E and 2G) compared to their respective controls (Figure 2F and 2H), where renal tissue with preserved parenchyma and tubules, and glomeruli showed regular size.
A 19. of the 20 analyzed fields in the DMA group compared to the CSA group (Figure 3A, 3B). The same alteration was observed in 32% of the 20 analyzed fields in the DMI group (Figure 3C) when compared to the CSI group (Figure 3D). This observation is characterized by limited visualization of the region between the glomerular capillary tuft and Bowman’s capsule (Bowman’s urinary space). Due to the intense inflammatory infiltrate in certain field regions, the observation of tubular structure is considerably impaired. This was more pronounced in the analyzed fields of the DMA group (Figure 3E) compared to its control (Figure 3F).
Glomerulus counting, performed per field and per slide, revealed a numerical decrease only in the DMI group compared to the CSI group (Table 2)
We also observed in the correlation analysis with biochemical parameters that there was an inverse correlation between the number of glomeruli and the ApoB/ApoA ratio in the DMA group compared to the CSA group (Table 3)
The evaluation of glomerular area demonstrated a decrease in both diabetic groups compared to their respective controls (DMA 3884 ± 113.4, n = 188 vs CSA 4201 ± 74.9, n = 263, p = 0.0003; DMI 3751 ± 85.3, n = 204 vs CSI 4370 ± 79.9, n = 280, p < 0.0001) (Figure 4A and B). In the renal tubule area analysis, the histological observation of tubular hypertrophy was confirmed. Both DMA and DMI groups showed an increase in tubular area compared to their respective control groups. This alteration was observed in the diameter (μm) of both longitudinal (CSA 29.6 ± 4, n = 263 vs DMA 42.2 ± 9.3, n = 242, p < 0.0001; CSI 26.4 ± 4, n = 250 vs DMI 35 ± 5.1, n = 237, p < 0.0001) and transverse (CSA 29.7 ± 3.3 / 33.4 ± 4.3, n = 227 vs DMA 36.1 ± 6 / 40.4 ± 6.5, n = 242, p < 0.0001; CSI 27.2 ± 3.4 / 29.8 ± 3.6, n = 242 vs DMI 34 ± 4 / 37.6 ± 4.6, n = 237) tubules (Figure 4C and D).
3. Discussion
In this study, we showed in diabetic rats that before DKD installation, the kidney already presents marked signs of tissue remodeling. As we can see in the renal biochemical parameters, although there is some significant increase in plasmatic creatinine, creatinine clearance, proteinuria, and urea/creatinine ratio in diabetic rats, all renal parameters are within the reference values described in the literature [49,50,51,52,53,54]. Therefore, according to the biochemical parameters used in the medical clinics nowadays, the diabetic rats used in this study had not developed DKD yet.
In the pathophysiology of diabetes mellitus, the decrease in insulin secretion by the pancreas is one of the mechanisms of hyperglycemia. Thus, the injury to the Langerhans islets and β-cells is a histological alteration frequently reported [24]. The lesions on the Langerhans islets are a common characteristic between DM types 1 and 2, although they appear more frequent in type 1. In this case, it is necessary to introduce the insulin therapy [25]. As confirmation of the experimental model of diabetes with alloxan, besides the hyperglycemia, we also observed in the pancreas of diabetic rats the atrophy of the Langerhans islets with reduced cellular density.
We also showed that there are some differences between the kidneys of adult and elderly mice in the early stages of DM. The aging demonstrated some calcification in the pancreas from CSI rats, which has already been related in human biopsies [53]. Also, the CSI kidneys showed a few inflammatory infiltrations that are also associated with the aging process [54]. Only the DMI group presented a decrease in the glomeruli number in comparison with CSI. This data indicate that elderly diabetic rats may exhibit greater susceptibility to glomerular injury and loss in the early stages of DM, and corroborate with the knowledge that there is a negative correlation between aging and the number of glomeruli [41,42].
The histology alterations were present in both diabetic groups, being more prominent in the DMA group. One of the characteristics of nephropathy is the infiltration of macrophages into the tubular epithelium, due to the inflammatory hyperglycemic stimulus and the release of leukotrienes that have chemotactic action. Activated macrophages release pro-inflammatory cytokines, which stimulate apoptosis [26,27]. In our study, we observed excessive cellular infiltration in the tubules of adult and elderly diabetic rats even before any renal function changes. In some fields of the DMA group, the infiltration was so massive that there was a loss of visual delineation of the tubules. Studies in diabetic mice have noted intense tubular infiltration of macrophages after 3 to 4 months of diabetes induction, but by then, the animals already exhibited renal function changes [26,28].
Another morphological finding in this study was that in the diabetic groups DMA and DMI, there was hypertrophy of the tubules in the analyzed fields compared to the respective controls, which was confirmed by the tubular measurements. In some fields, both tubular hypertrophy and atrophy were observed, always accompanied by intense cellular infiltration. It is known that tubular hypertrophy occurs in the early stages of nephropathy due to tubular dilation [29]. Hyperglycemic stress stimulates epidermal growth factor (EGF), insulin-like growth factor 1 (IGF-1), and activates the renin-angiotensin-aldosterone system. Additionally, the induction of the p27Kip1 protein, which modulates cell cycle transition, leads to a G1 phase arrest and triggers cellular hypertrophy [30,31]. Initially, hypertrophy is compensatory; however, with time, it will lead to tubular atrophy and fibrosis [32]. Hyperglycemia-induced apoptosis also stimulates hypertrophy and accumulation of ECM, being an important factor in renal remodeling [33]. Therefore, our model demonstrated that in the early stages of diabetes mellitus, even before the onset of nephropathy, significant renal alterations are already underway.
Regarding glomerular morphology, we observed a reduction in Bowman's space in some fields of the DMA and DMI groups compared to the CSA and CSI controls, respectively. Most studies report Bowman’s space enlargement as a characteristic of the onset and progression of nephropathy [34,36]. In a study conducted in rats induced to diabetes mellitus with streptozotocin, a reduction in Bowman's space was observed [36]. However, in our study, the animals did not exhibit the onset of nephropathy. It is possible that in the early stages of diabetes mellitus, there is initially capillary hypertrophy. After the onset of nephropathy, it is known that inflammatory and fibrotic processes eventually trigger glomerular capillary atrophy, leading to an increase in Bowman's space37. However, further experiments would be needed to confirm this observation.
Initial cellular injuries caused by hyperglycemic harmful stimuli disrupt cellular autophagy and activate apoptosis and fibrosis mechanisms, leading to various complications (Gupta et al. 2023). The injury will trigger primary homeostatic responses (coagulation) as well as the attraction of immune system cells, such as macrophages and monocytes [38]. Persistent monocyte activation leads to continuously higher production of cytokines, triggering tissue damage [39]. Indeed, our histological findings indicate intense cellular infiltration in both diabetic groups compared to their respective controls. Further studies would be necessary to differentiate the cells from the immune infiltrate.
The glomerular area in both diabetic groups showed a reduction compared to their respective controls. Most studies report an increase in glomerular area in diabetic animals; however, in all cases, the animals already had established nephropathy [34,36,43]. As nephropathy progresses, atrophy of glomerular capillaries due to inflammation and fibrosis triggers an increase in Bowman's space, causing glomerular distension [37]. Studies show that during the onset of nephropathy, there is a progressive loss of the podocyte barrier, which also stimulates hypertrophy [44,45]. However, as in our model, the animals did not present installed DKD, it is possible that in the very early stages of diabetes mellitus, there is initially a transient reduction in glomerular area.
Additionally, the DMA group showed an inverse correlation between the number of glomeruli and the ApoB/A ratio. This ratio represents the balance between atherogenic (ApoB) and anti-atherogenic (ApoA) circulating cholesterol and is related to carotid atherosclerosis in diabetic patients46. In general, there is a relationship between a lower number of nephrons and hypertension, as well as an increased cardiovascular and renal risk [47,48]. To our knowledge, this is the first study to relate that the number of nephrons correlates with ApoB/ApoA ratio, revealing an important pathway for cardiovascular risk in diabetic adults with a lower number of nephrons. However, further studies are needed to validate this hypothesis.
The limitations of this study include the induction of the disease only in male rats, which restricts the generalizability of the results. It is recommended to use both male and female animals in the methodology for assessing DM in laboratory animal experiments. Even so, our study was able to show, for the first time, strong evidence that the histological changes characteristic of DKD can already be observed in the early stages of DM, making the present data valuable for future studies targeting DKD prevention. However, to deeper understand the impact of the histology alterations described in the present study, further studies using podocyte markers and other techniques like immunohistochemistry and immunofluorescence would strengthen the hypotheses proposed in this work.
4. Material and Methods
- Animals and experimental models
Male Rattus norvegicus Wistar were housed in the Animal Facility of the Centro Universitário FMABC under the following conditions: a) 12-hour light/dark cycle; b) ambient temperature of 21 ± 2 ºC; c) ad libitum access to water and rodent chow. Before experiments, animals underwent a minimum of five days of acclimatization. The animals were divided into the following experimental groups: DMA: adult animals approximately 3 months old, evaluated 30 days after induction of diabetes mellitus (DM) with alloxan. DME elderly animals, approximately 7 months old, were evaluated 30 days after induction of DM with alloxan. CSA: adult animals approximately 3 months old, evaluated 30 days after injection of physiological saline solution. CSI: elderly animals approximately 7 months old, evaluated 30 days after injection of physiological saline solution.
This research project was approved by the Ethics Committee on Animal Use (CEUA) at the Centro Universitário FMABC, under protocol number 20/2018. All experimental procedures were conducted in strict accordance with the guidelines outlined in the Manual of Good Laboratory Practices. The handling of Wistar rats adhered rigorously to the standards established by the Ethics Committee on Animal Use.
- Induction of DM and glycemic monitoring
After the animal’s adaptation period, an intraperitoneal injection of alloxan at a dose of 120 mg/kg was administered [19,20]. Animals with blood glucose levels above 250 mg/dL were selected 7 days after induction of diabetes mellitus (DM). They were monitored for 30 days without treatment, during which their weight and glucose levels were measured every 7 days using a commercial glucometer via tail vein puncture (Accu-chek Advantage, Roche Diagnostics, Indiana, USA). Alloxan specifically exhibits cytotoxicity towards pancreatic β-cells, causing damage to pancreatic islets, blood vessels, and cell death. The effectiveness of alloxan in inducing DM depends on dosage, infusion rate, administration route, diets, fasting time, and animal weight [21,22].
- Metabolic cage
Following a 30-day monitoring period, the animals were housed individually in metabolic cages for 24 hours to facilitate the collection of urine for biochemical analyses.
Urine collection was performed using recipients containing RNA later, which were positioned in the conical outlet located below the cage. Animals underwent a fasting period of 12 hours before collection to minimize urine contamination by the feed. Water intake (mL) and urine excretion (mL) were quantified. Before collection at 24 hours, animals underwent 2 days of habituation in which they remained 12 hours in the metabolic cages.
- Collection and Preparation of Tissues for Histological and Histochemical Analysis
After the 24-hour urine collection, the animals were euthanized using thiopental. Following euthanasia, the left kidneys of each animal were collected and fixed in 10% buffered formalin for 24 hours. Subsequently, the kidneys were processed in a 70% ethyl alcohol solution, dehydrated in increasing ethanol series, diaphanized in xylol, and embedded in paraffin. The material is sectioned at a thickness of 5 µm using a rotary microtome (Luptec MRP 2015 model), and the sections were transferred to standard and salinized slides for morphological evaluations using Hematoxylin and Eosin (HE) staining.
HE Staining was performed according to Paulete & Beçak (1976). This technique involves the use of Hematoxylin, a basophilic reagent that stains the cell nucleus blue, and Eosin, an acidophilic reagent that stains the cell cytoplasm pink. To perform this technique, the slides were submerged in xylene to remove the paraffin, then hydrated in a series of alcohol solutions (100°, 95°, and 70° GL), followed by distilled water for 1 minute, stained with hematoxylin for 5 minutes, rinsed in running water for 4 minutes, stained with eosin for 1 minute, and finally dehydrated in a series of alcohol solutions (70°, 90°, and 100° GL) and xylene [23].
A total of 20 slices were examined: 5 slices from each of the 4 groups, where 20 fields were analyzed per kidney section. Morphological analyses of renal tissue were performed using light microscopy (Nikon Eclipse E200 microscope at 100x magnification). Further evaluations, including the analysis of the number of glomeruli and glomerular area, were performed utilizing ImageJ software (version 1.47, National Institutes of Health).
- Determination of biochemical and renal function evaluations
- Glycemia and HbA1c
Blood glucose was determined weekly using the photometric method and confirmed using fluoridated plasma by the automated enzymatic-colorimetric method, BioSystems Glucose Ref. COD 12503. HbA1c was determined using the immunoturbidimetry method, BioSystems Hemoglobin A1C-Turbi kit Ref. COD 13044. Dosages were performed using a COBAS 8.000 apparatus.
- Plasma urea
Urea was determined by the enzymatic/colorimetric method using the Urea UV SL Elitech kit Cat. nº URSL - 0500 (Elitech Group Clinical Systems, France) according to the manufacturer's protocol, in a COBAS 8,000 device at an absorbance of 600 nm.
- Serum and urine creatinine
Biochemical analyses of serum and urine creatinine were determined using the kinetic-colorimetric Jaffé alkaline picric method, Creatinine Jaffe Elitech Cat. nº CRCO-0600 (Elitech Group Clinical Systems, France), according to the manufacturer's protocol, in a COBAS 8,000 device at an absorbance of 510 nm. Urine was previously homogenized and centrifuged at 2500 rpm for 5 minutes at room temperature to precipitate the sediment. The supernatant was diluted (1:25) in distilled water using glass tubes.
- Creatinine clearance
Creatinine clearance was calculated using the formula Ccr = (Ucr x Vu / Pcr) x Ma. Where: Ucr = urine creatinine concentration (mg/dl); Uv = urine volume (ml/min); Pcr = plasma creatinine concentration (mg/dl); Ma = animal weight (kg).
- Proteinuria
Determination of urinary protein excretion was performed through the reaction with copper (II) ions in an alkaline medium, resulting in a colored complex whose intensity was quantified in a COBAS 8,000 device at an absorbance of 545 nm. The kit used was Protein (Total) BioSystems (BioSystems S.A., Spain) Cat. No. COD 12500.
- ApoA, ApoB in plasma and urine
Determination of ApoB/ApoA was performed using the turbidimetry method, with BioSystems reagents Apolipoprotein B Turbidimetry Ref. COD 31099 and BioSystems Apolipoprotein A-I Turbidimetry Ref. COD 31096, respectively. All dosages were determined using a COBAS 8000 device, using control sera to verify assay performance.
- Cystatin C
Cystatin C was quantified using the Enzyme-Linked Immunosorbent Assay (ELISA) method, Kit Cystatin C, catalog ALX-850-292, brand Enzo Life Sciences. The test is based on the identification of antigens by antibodies marked with an enzyme, which acts on its substrate and causes a change in the color of the chromogen (a colorless substance that changes color when oxidized by the enzyme).
- Statistical analysis
The biochemical values were expressed as mean ± standard deviation (SD). A Student's t-test was performed for the CSA versus (vs) DMA group and between the CSI vs DMI group for parametric data, and the Mann-Whitney test was used for non-parametric data. Spearman correlation analysis was conducted in the DMJ and DMI groups, assessing the relationship between the number of glomeruli and the biochemical measurements. For multivariate comparison analysis across all studied groups, a one-way Kruskal-Wallis analysis of variance test and Tukey's Multiple Comparison Test were used. All analyses were performed using the GraphPad Prism software (GraphPad, version 7.0, USA). The level of significance was set at 5% (p < 0.05), with a 95% confidence interval (CI).
5. Conclusion
In this article, we bring new evidence that early histological changes, including the tubular and glomerular damage, are present already in the initial stages of DM, before renal dysfunction becomes evident. This represents a promising therapeutic target strategy to delay and/or prevent the progression to DKD. Interventions targeting the kidney remodeling associated with DKD have the potential to preserve renal function and mitigate long-term complications of the disease.
Author Contributions
JRSR and GLV: formal analysis, data curation, writing the main manuscript, preparation of the figures, review and editing; BCAA and FLAF: data curation, review and editing; JFAE: data curation and review; NAD and GP: collaboration with all immunohistochemistry techniques and analysis; IDRT, ACFO: data curation; BFP, LBMM: technical support for evaluation and analysis. All authors wrote the main manuscript text and reviewed the manuscript.
Funding
This study was funded by Fundação de Amparo à Pesquisa do Estado de São Paulo – FAPESP (Process: 2018/24808-0).
Acknowledgments
We thank the entire team from the Clinical Analysis Laboratory and the Molecular Biology Laboratory at the Centro Universitário FMABC.
Personal Acknowledgments:
To Dr. Monica Akemi Sato from the Physiology Laboratory at the Centro Universitário FMABC, for providing her facilities for morphological analyses.
Disclosure
The Generative AI tool ChatGPT was used for English review.
Conflicts of Interest
The authors declare no competing interests.
References
- Poznyak A, Grechko AV, Poggio P, Myasoedova VA, Alfieri V, Orekhov AN. (2020) The Diabetes Mellitus-Atherosclerosis Connection: The Role of Lipid and Glucose Metabolism and Chronic Inflammation. Int J Mol Sci. 21(5). [CrossRef]
- Mirza AC, Panchal SS, Allam AA, Othman SI, Satia M, Mandhane SN. (2022) Syringic Acid Ameliorates Cardiac, Hepatic, Renal and Neuronal Damage Induced by Chronic Hyperglycaemia in Wistar Rats: A Behavioural, Biochemical and Histological Analysis. Molecules. 27(19). [CrossRef]
- Forbes JM, Cooper ME. (2013) Mechanisms of diabetic complications. Physiol Rev. 93(1):137-88. [CrossRef]
- Barbosa JH, Oliveira SL, Seara LT. (2008) [The role of advanced glycation end-products (AGEs) in the development of vascular diabetic complications]. Arq Bras Endocrinol Metabol. 52(6):940-50. [CrossRef]
- Han Y, Xu X, Tang C, Gao P, Chen X, Xiong X, et al. (2018) Reactive oxygen species promote tubular injury in diabetic nephropathy: The role of the mitochondrial ros-txnip-nlrp3 biological axis. Redox Biol. 16:32-46. [CrossRef]
- Yanase T, Yanagita I, Muta K, Nawata H. (2018) Frailty in elderly diabetes patients. Endocr J. 65(1):1-11. [CrossRef]
- Wu Y, Wang Y, Zhang J, Zhang R, Zhao L, Ren H, et al. (2021) Early-onset of type 2 diabetes mellitus is a risk factor for diabetic nephropathy progression: a biopsy-based study. Aging (Albany NY). 13(6):8146-54. [CrossRef]
- Dugbartey GJ, Alornyo KK, Diaba DE, Adams I. (2022) Activation of renal CSE/H. Biomed Pharmacother. 153:113386. [CrossRef]
- Song P, Chen Y, Liu Z, Liu H, Xiao L, Sun L, et al. (2022) LncRNA MALAT1 Aggravates Renal Tubular Injury. Front Endocrinol (Lausanne). 13:895360. [CrossRef]
- Carmona M, Paco-Meza LM, Ortega R, Cañadillas S, Caballero-Villarraso J, Blanco A, et al. (2022) Hypoxia preconditioning increases the ability of healthy but not diabetic rat-derived adipose stromal/stem cells (ASC) to improve histological lesions of streptozotocin-induced diabetic nephropathy. Pathol Res Pract. 230:153756. [CrossRef]
- Huang S, Wang J, Zhang L, Tian S, Wang Y, Shao X, et al. (2022) Ras guanine nucleotide-releasing protein-4 promotes renal inflammatory injury in type 2 diabetes mellitus. Metabolism. 131:155177. [CrossRef]
- van Aanhold CCL, Koudijs A, Dijkstra KL, Wolterbeek R, Bruijn JA, van Kooten C, et al. (2022) The VEGF Inhibitor Soluble Fms-like Tyrosine Kinase 1 Does Not Promote AKI-to-CKD Transition. Int J Mol Sci. 23(17). [CrossRef]
- Tian D, Li J, Zou L, Lin M, Shi X, Hu Y, et al. (2021) Adenosine A1 Receptor Deficiency Aggravates Extracellular Matrix Accumulation in Diabetic Nephropathy through Disturbance of Peritubular Microenvironment. J Diabetes Res. 2021:5584871. [CrossRef]
- da Luz MJ, da Costa VAA, Balbi APC, Bispo-da-Silva LB. (2022) Effects of Disodium Cromoglycate Treatment in the Early Stage of Diabetic Nephropathy: Focus on Collagen Deposition. Biol Pharm Bull. 45(3):245-9. [CrossRef]
- Zhuang A, Yap FYT, Borg DJ, McCarthy D, Fotheringham A, Leung S, et al. (2021) The AGE receptor, OST48 drives podocyte foot process effacement and basement membrane expansion (alters structural composition). Endocrinol Diabetes Metab. 4(3):e00278. [CrossRef]
- Fujii A, Sunatani Y, Furuichi K, Fujimoto K, Adachi H, Iwabuchi K, et al. (2020) DNA damage in human glomerular endothelial cells induces nodular glomerulosclerosis via an ATR and ANXA2 pathway. Sci Rep. 10(1):22206. [CrossRef]
- Nowak N, Skupien J, Niewczas MA, Yamanouchi M, Major M, Croall S, et al. (2016) Increased plasma kidney injury molecule-1 suggests early progressive renal decline in non-proteinuric patients with type 1 diabetes. Kidney Int. 89(2):459-67. [CrossRef]
- Bukosza EN, Kaucsár T, Godó M, Lajtár E, Tod P, Koncsos G, et al. (2019) Glomerular Collagen Deposition and Lipocalin-2 Expression Are Early Signs of Renal Injury in Prediabetic Obese Rats. Int J Mol Sci. 20(17). [CrossRef]
- Federiuk IF, Casey HM, Quinn MJ, Wood MD, Ward WK. (2004) Induction of type-1 diabetes mellitus in laboratory rats by use of alloxan: route of administration, pitfalls, and insulin treatment. Comp Med. 54(3):252-7.
- Silva VDd, Nogueira RMB. (2015) Diabetes mellitus experimental induzido com aloxana em ratos Wistar [ Experimental diabetes mellitus induced with alloxan in Wistar rats]. Revista de Ciências Farmacêuticas Básica e Aplicada [Journal of Basic and Applied Pharmaceutical Sciences]. 36(1):8.
- Lerco MM, Spadella CT, Machado JLM, Schellini SA, Padovani CR. (2003) Caracterização de um modelo experimental de Diabetes Mellitus, induzido pela aloxana em ratos: estudo clínico e laboratorial. Acta Cirúrgica Brasileira. 18:132-42. [CrossRef]
- Lenzen S. (2008) The mechanisms of alloxan- and streptozotocin-induced diabetes. Diabetologia. 51(2):216-26. [CrossRef]
- Beçak W, Paulete J. (1976) Técnicas de Citologia e Histologia. Rio de Janeiro.
- Suhariningsih S, Astuti SD, Husen SA, Winarni D, Rahmawati DA, Mukti AT, et al. (2020) The combined effect of magnetic and electric fields using on/off infrared light on the blood sugar level and the diameter of Langerhans islets of diabetic mice. Vet World. 13(10):2286-93. [CrossRef]
- Kahn SE, Chen YC, Esser N, Taylor AJ, van Raalte DH, Zraika S, et al. (2021) The β Cell in Diabetes: Integrating Biomarkers With Functional Measures. Endocr Rev. 42(5):528-83. [CrossRef]
- Jiang WJ, Xu CT, Du CL, Dong JH, Xu SB, Hu BF, et al. (2022) Tubular epithelial cell-to-macrophage communication forms a negative feedback loop via extracellular vesicle transfer to promote renal inflammation and apoptosis in diabetic nephropathy. Theranostics. 12(1):324-39. [CrossRef]
- Palau V, Jarrín J, Villanueva S, Benito D, Márquez E, Rodríguez E, et al. (2021) Endothelial ADAM17 Expression in the Progression of Kidney Injury in an Obese Mouse Model of Pre-Diabetes. Int J Mol Sci. 23(1). [CrossRef]
- Liang G, Song L, Chen Z, Qian Y, Xie J, Zhao L, et al. (2018) Fibroblast growth factor 1 ameliorates diabetic nephropathy by an anti-inflammatory mechanism. Kidney Int. 93(1):95-109. [CrossRef]
- Kamli-Salino SEJ, Brown PAJ, Haschler TN, Liang L, Feliers D, Wilson HM, et al. (2023) Induction of experimental diabetes and diabetic nephropathy using anomer-equilibrated streptozotocin in male C57Bl/6J mice. Biochem Biophys Res Commun. 650:109-16. [CrossRef]
- Uehara-Watanabe N, Okuno-Ozeki N, Minamida A, Nakamura I, Nakata T, Nakai K, et al. (2022) Direct evidence of proximal tubular proliferation in early diabetic nephropathy. Sci Rep. 12(1):778. [CrossRef]
- Russo GL, Stampone E, Cervellera C, Borriello A. (2020) Regulation of p27. Biomolecules. 10(9).
- Ma Z, Li L, Livingston MJ, Zhang D, Mi Q, Zhang M, et al. (2020) p53/microRNA-214/ULK1 axis impairs renal tubular autophagy in diabetic kidney disease. J Clin Invest. 130(9):5011-26. [CrossRef]
- Zheng GS, Tan YM, Shang YY, Liu YP, Hu BA, Wang D, et al. (2021) CIDEC silencing attenuates diabetic nephropathy via inhibiting apoptosis and promoting autophagy. J Diabetes Investig. 12(8):1336-45. [CrossRef]
- Cui Y, Shi Y, Bao Y, Wang S, Hua Q, Liu Y. (2018) Zingerone attenuates diabetic nephropathy through inhibition of nicotinamide adenine dinucleotide phosphate oxidase 4. Biomed Pharmacother. 99:422-30. [CrossRef]
- Elsaed WM, Mohamed HA. (2017) Dietary zinc modifies diabetic-induced renal pathology in rats. Ren Fail. 39(1):246-57. [CrossRef]
- Mohammad HMF, Galal Gouda S, Eladl MA, Elkazaz AY, Elbayoumi KS, Farag NE, et al. (2023) Metformin suppresses LRG1 and TGFβ1/ALK1-induced angiogenesis and protects against ultrastructural changes in rat diabetic nephropathy. Biomed Pharmacother. 158:114128. [CrossRef]
- Babelova A, Burckhardt BC, Wegner W, Burckhardt G, Henjakovic M. (2015) Sex-differences in renal expression of selected transporters and transcription factors in lean and obese Zucker spontaneously hypertensive fatty rats. J Diabetes Res. 2015:483238. [CrossRef]
- Gupta M, Pandey S, Rumman M, Singh B, Mahdi AA. (2023) Molecular mechanisms underlying hyperglycemia associated cognitive decline. IBRO Neurosci Rep. 14:57-63. [CrossRef]
- Sagar RC, Ajjan RA, Naseem KM. (2022) Non-Traditional Pathways for Platelet Pathophysiology in Diabetes: Implications for Future Therapeutic Targets. Int J Mol Sci. 2022;23(9). [CrossRef]
- Wu T, Ding L, Andoh V, Zhang J, Chen L. (2023) The Mechanism of Hyperglycemia-Induced Renal Cell Injury in Diabetic Nephropathy Disease: An Update. Life (Basel). 13(2). [CrossRef]
- Wang J, Feng Y, Zhang Y, Liu J, Gong L, Zhang X, et al. (2022) TNF-α and IL-1β Promote Renal Podocyte Injury in T2DM Rats by Decreasing Glomerular VEGF/eNOS Expression Levels and Altering Hemodynamic Parameters. J Inflamm Res. 15:6657-73. [CrossRef]
- Rowland J, Akbarov A, Maan A, Eales J, Dormer J, Tomaszewski M. (2018) Tick-Tock Chimes the Kidney Clock - from Biology of Renal Ageing to Clinical Applications. Kidney Blood Press Res. 43(1):55-67. [CrossRef]
- Matsui T, Nakashima S, Nishino Y, Ojima A, Nakamura N, Arima K, et al. (2015) Dipeptidyl peptidase-4 deficiency protects against experimental diabetic nephropathy partly by blocking the advanced glycation end products-receptor axis. Lab Invest. 95(5):525-33. [CrossRef]
- Nishizono R, Kikuchi M, Wang SQ, Chowdhury M, Nair V, Hartman J, et al. (2017) FSGS as an Adaptive Response to Growth-Induced Podocyte Stress. J Am Soc Nephrol. 28(10):2931-45. [CrossRef]
- Hu Z, Fang W, Liu Y, Liang H, Chen W, Wang H. (2021) Acute glucose fluctuation promotes RAGE expression via reactive oxygen species-mediated NF-κB activation in rat podocytes. Mol Med Rep. 3(5). [CrossRef]
- Jun JE, Choi YJ, Lee YH, Kim DJ, Park SW, Huh BW, et al. (2018) ApoB/ApoA-I ratio is independently associated with carotid atherosclerosis in type 2 diabetes mellitus with well-controlled LDL cholesterol levels. Korean J Intern Med. 33(1):138-47. [CrossRef]
- Abitbol CL, Ingelfinger JR. (2009) Nephron mass and cardiovascular and renal disease risks. Semin Nephrol. 29(4):445-54. [CrossRef]
- Bertram JF, Cullen-McEwen LA, Egan GF, Gretz N, Baldelomar E, Beeman SC, et al. (2014) Why and how we determine nephron number. Pediatr Nephrol. 29(4):575-80. [CrossRef]
- Conte M, Martucci M, Sandri M, Franceschi C, Salvioli S. (2019) The Dual Role of the Pervasive "Fattish" Tissue Remodeling With Age. Front Endocrinol (Lausanne). 10:114. [CrossRef]
- Wei Q, Qiu W, Liu Q, Jiang Y. (2022) Relationship Between Risk Factors and Macular Thickness in Patients with Early Diabetic Retinopathy. Int J Gen Med. 15:6021-9. [CrossRef]
- Zhang J, Liu J, Qin X. (2018) Advances in early biomarkers of diabetic nephropathy. Rev Assoc Med Bras (1992). 64(1):85-92. [CrossRef]
- Xu T, Xu X, Zhang L, Zhang K, Wei Q, Zhu L, et al. (2021) Lipidomics Reveals Serum Specific Lipid Alterations in Diabetic Nephropathy. Front Endocrinol (Lausanne). 12:781417. [CrossRef]
- Boddana P, Caskey F, Casula A, Ansell D. (2009) UK Renal Registry 11th Annual Report (December 2008): Chapter 14 UK Renal Registry and international comparisons. Nephron Clin Pract. 111 Suppl 1:c269-76. [CrossRef]
- Nayak BK, Shanmugasundaram K, Friedrichs WE, Cavaglierii RC, Patel M, Barnes J, et al. (2016) HIF-1 Mediates Renal Fibrosis in OVE26 Type 1 Diabetic Mice. Diabetes. 65(5):1387-97. [CrossRef]
- Kreel L, Sandin B. (1973) Changes in pancreatic morphology associated with aging. Gut. 14(12):962-70. [CrossRef]
- Kimura T, Isaka Y, Yoshimori T. (2017) Autophagy and kidney inflammation. Autophagy. 13(6):997-1003. [CrossRef]
Figure 1.
The black arrows indicate the islets of Langerhans. It is possible to note the lesion of the islets of Langerhans and a reduction in cellular density in the DMA group (A) compared to the CSA group (B). The same lesion is observed in the DMI group (C) when compared to the CSI group (D). Photos were captured using a Nikon Eclipse E200 microscope at 100x magnification.
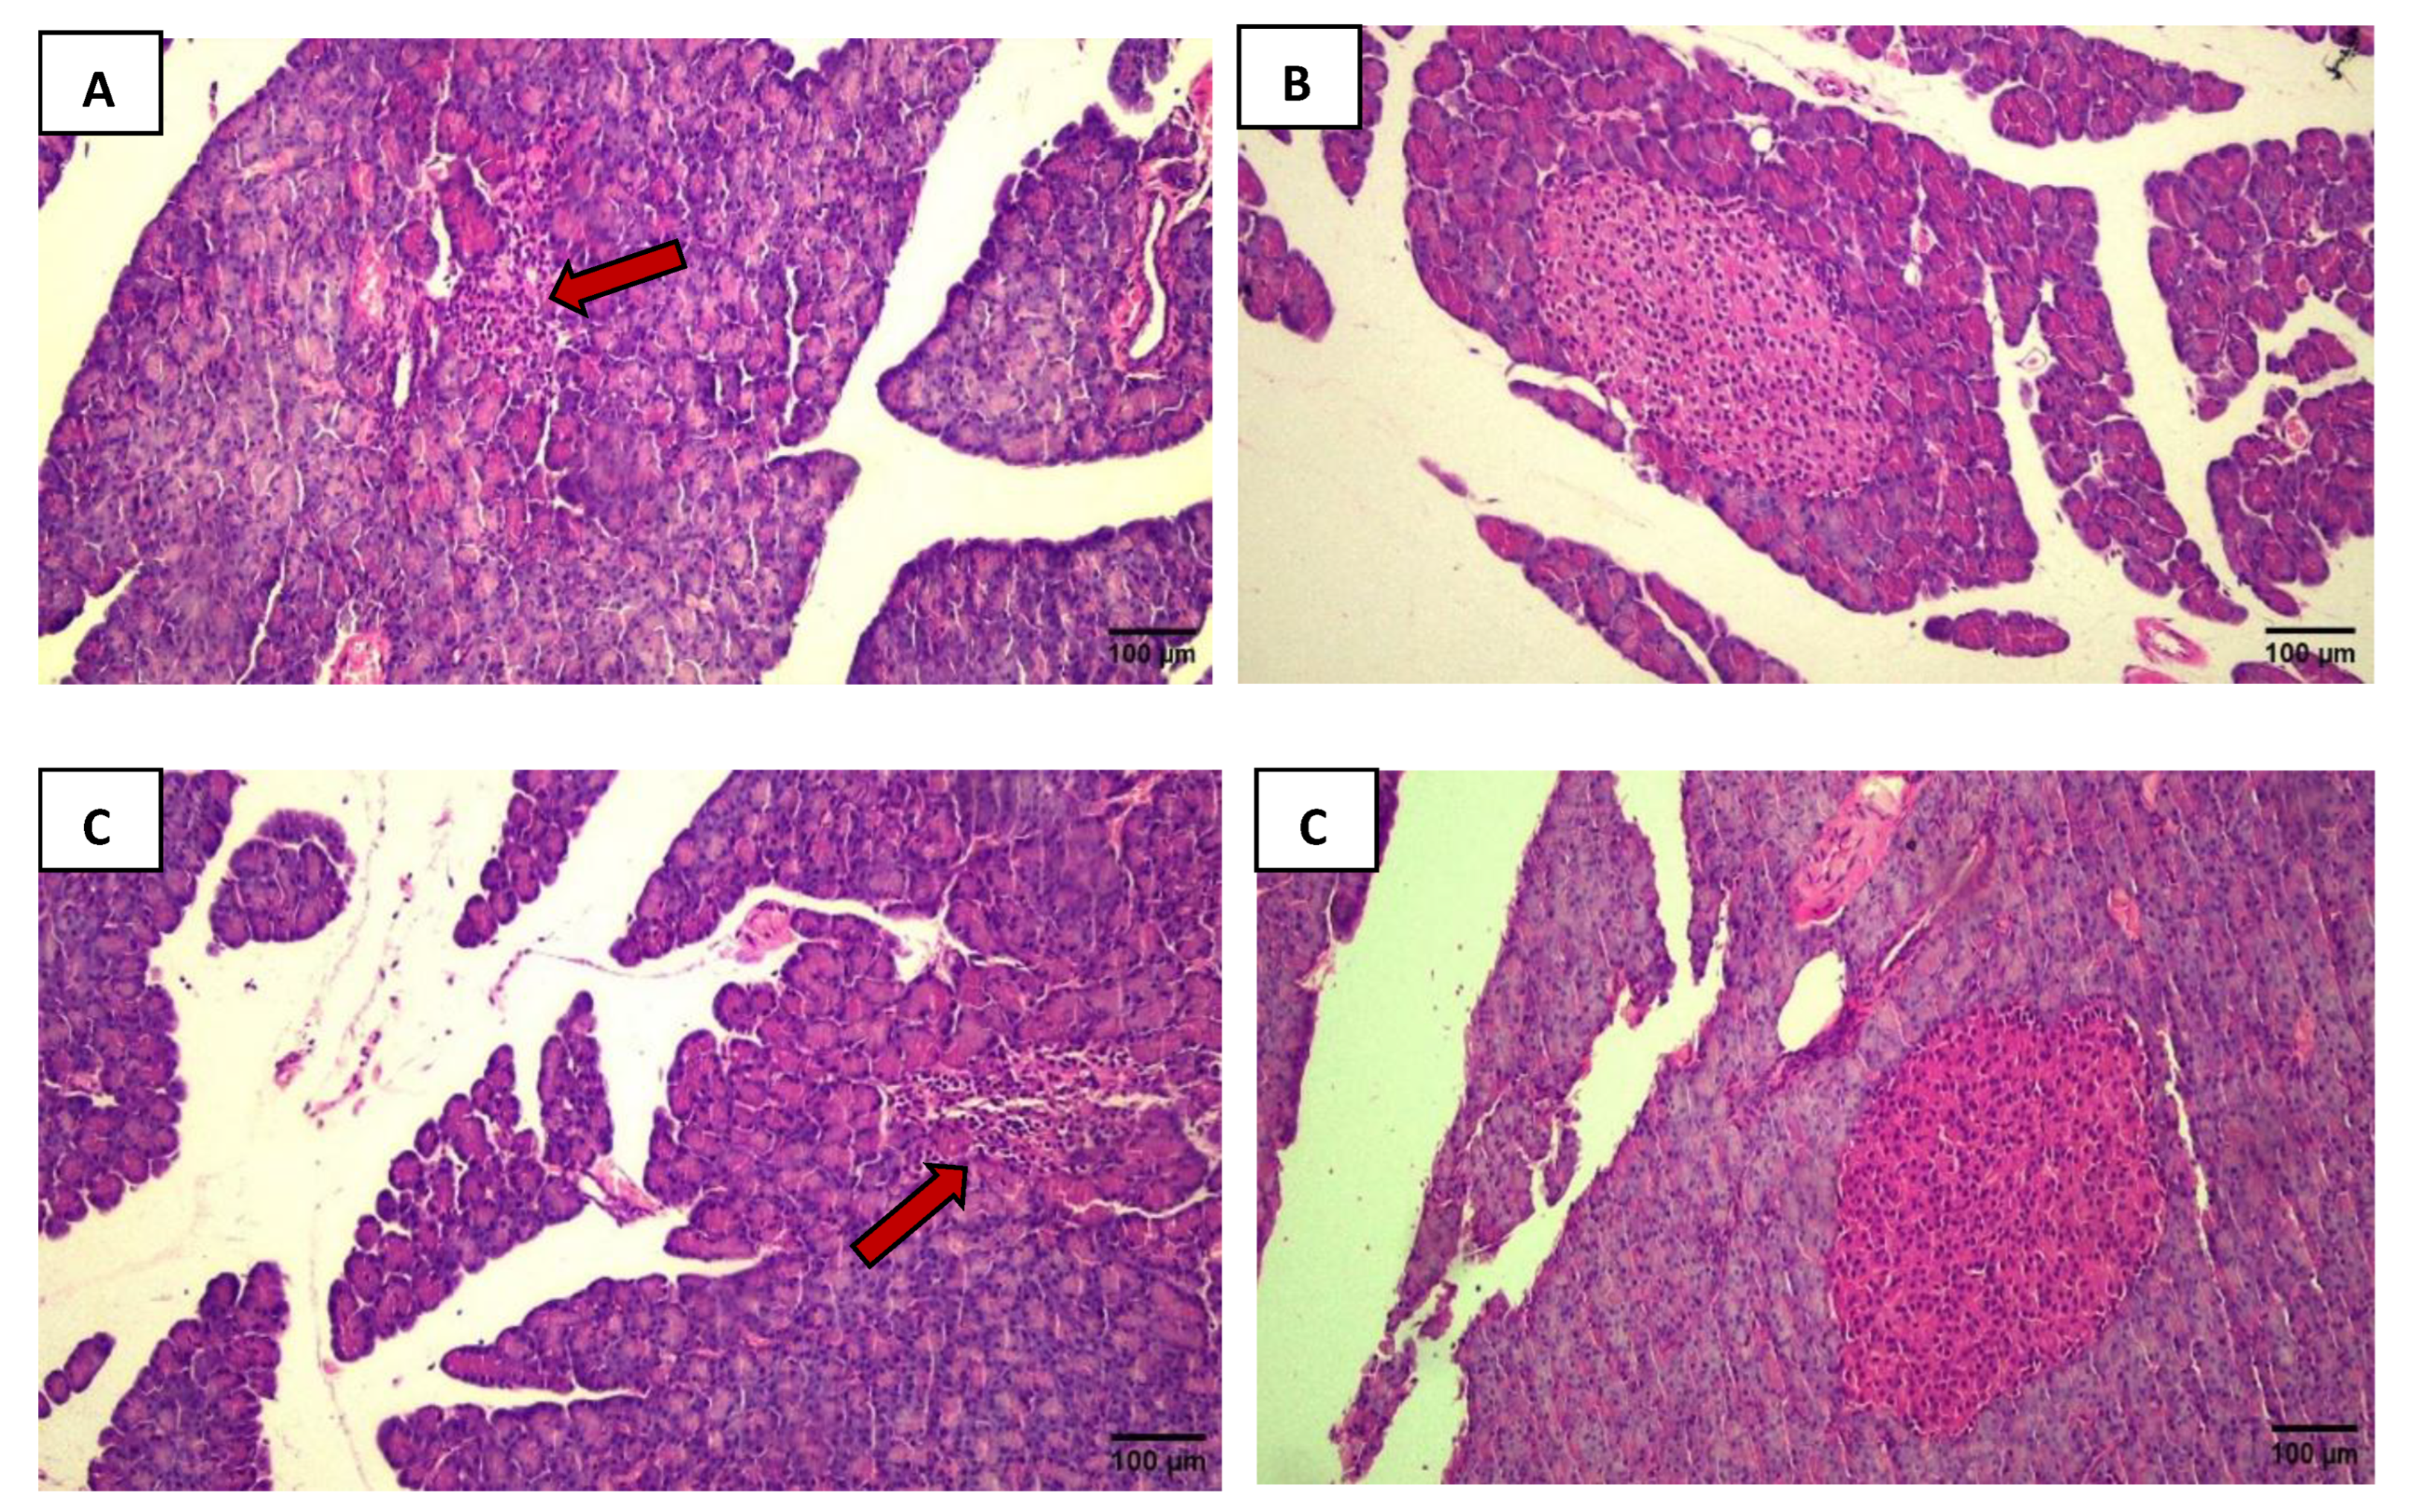
Figure 2.
The black arrows indicate inflammatory infiltration. The yellow arrows show hypertrophied tubules with size enlargement. The blue arrows point to areas of tubular damage, where it is possible to see tubules with big tubular lumens with thin tubular epithelium. Intense cellular infiltration and tubular hypertrophy are visible in the DMA group (A) compared to the CSA group (B). The same observations were made in the DMI group (C) compared to the CSI group (D). In panels E and G: In addition to cellular infiltration and tubular hypertrophy, it is possible to observe in the DMA and DMI groups that some tubules exhibit atrophic characteristics compared to their respective controls (F and H). Photos were captured using a Nikon Eclipse E200 microscope at 100x magnification.
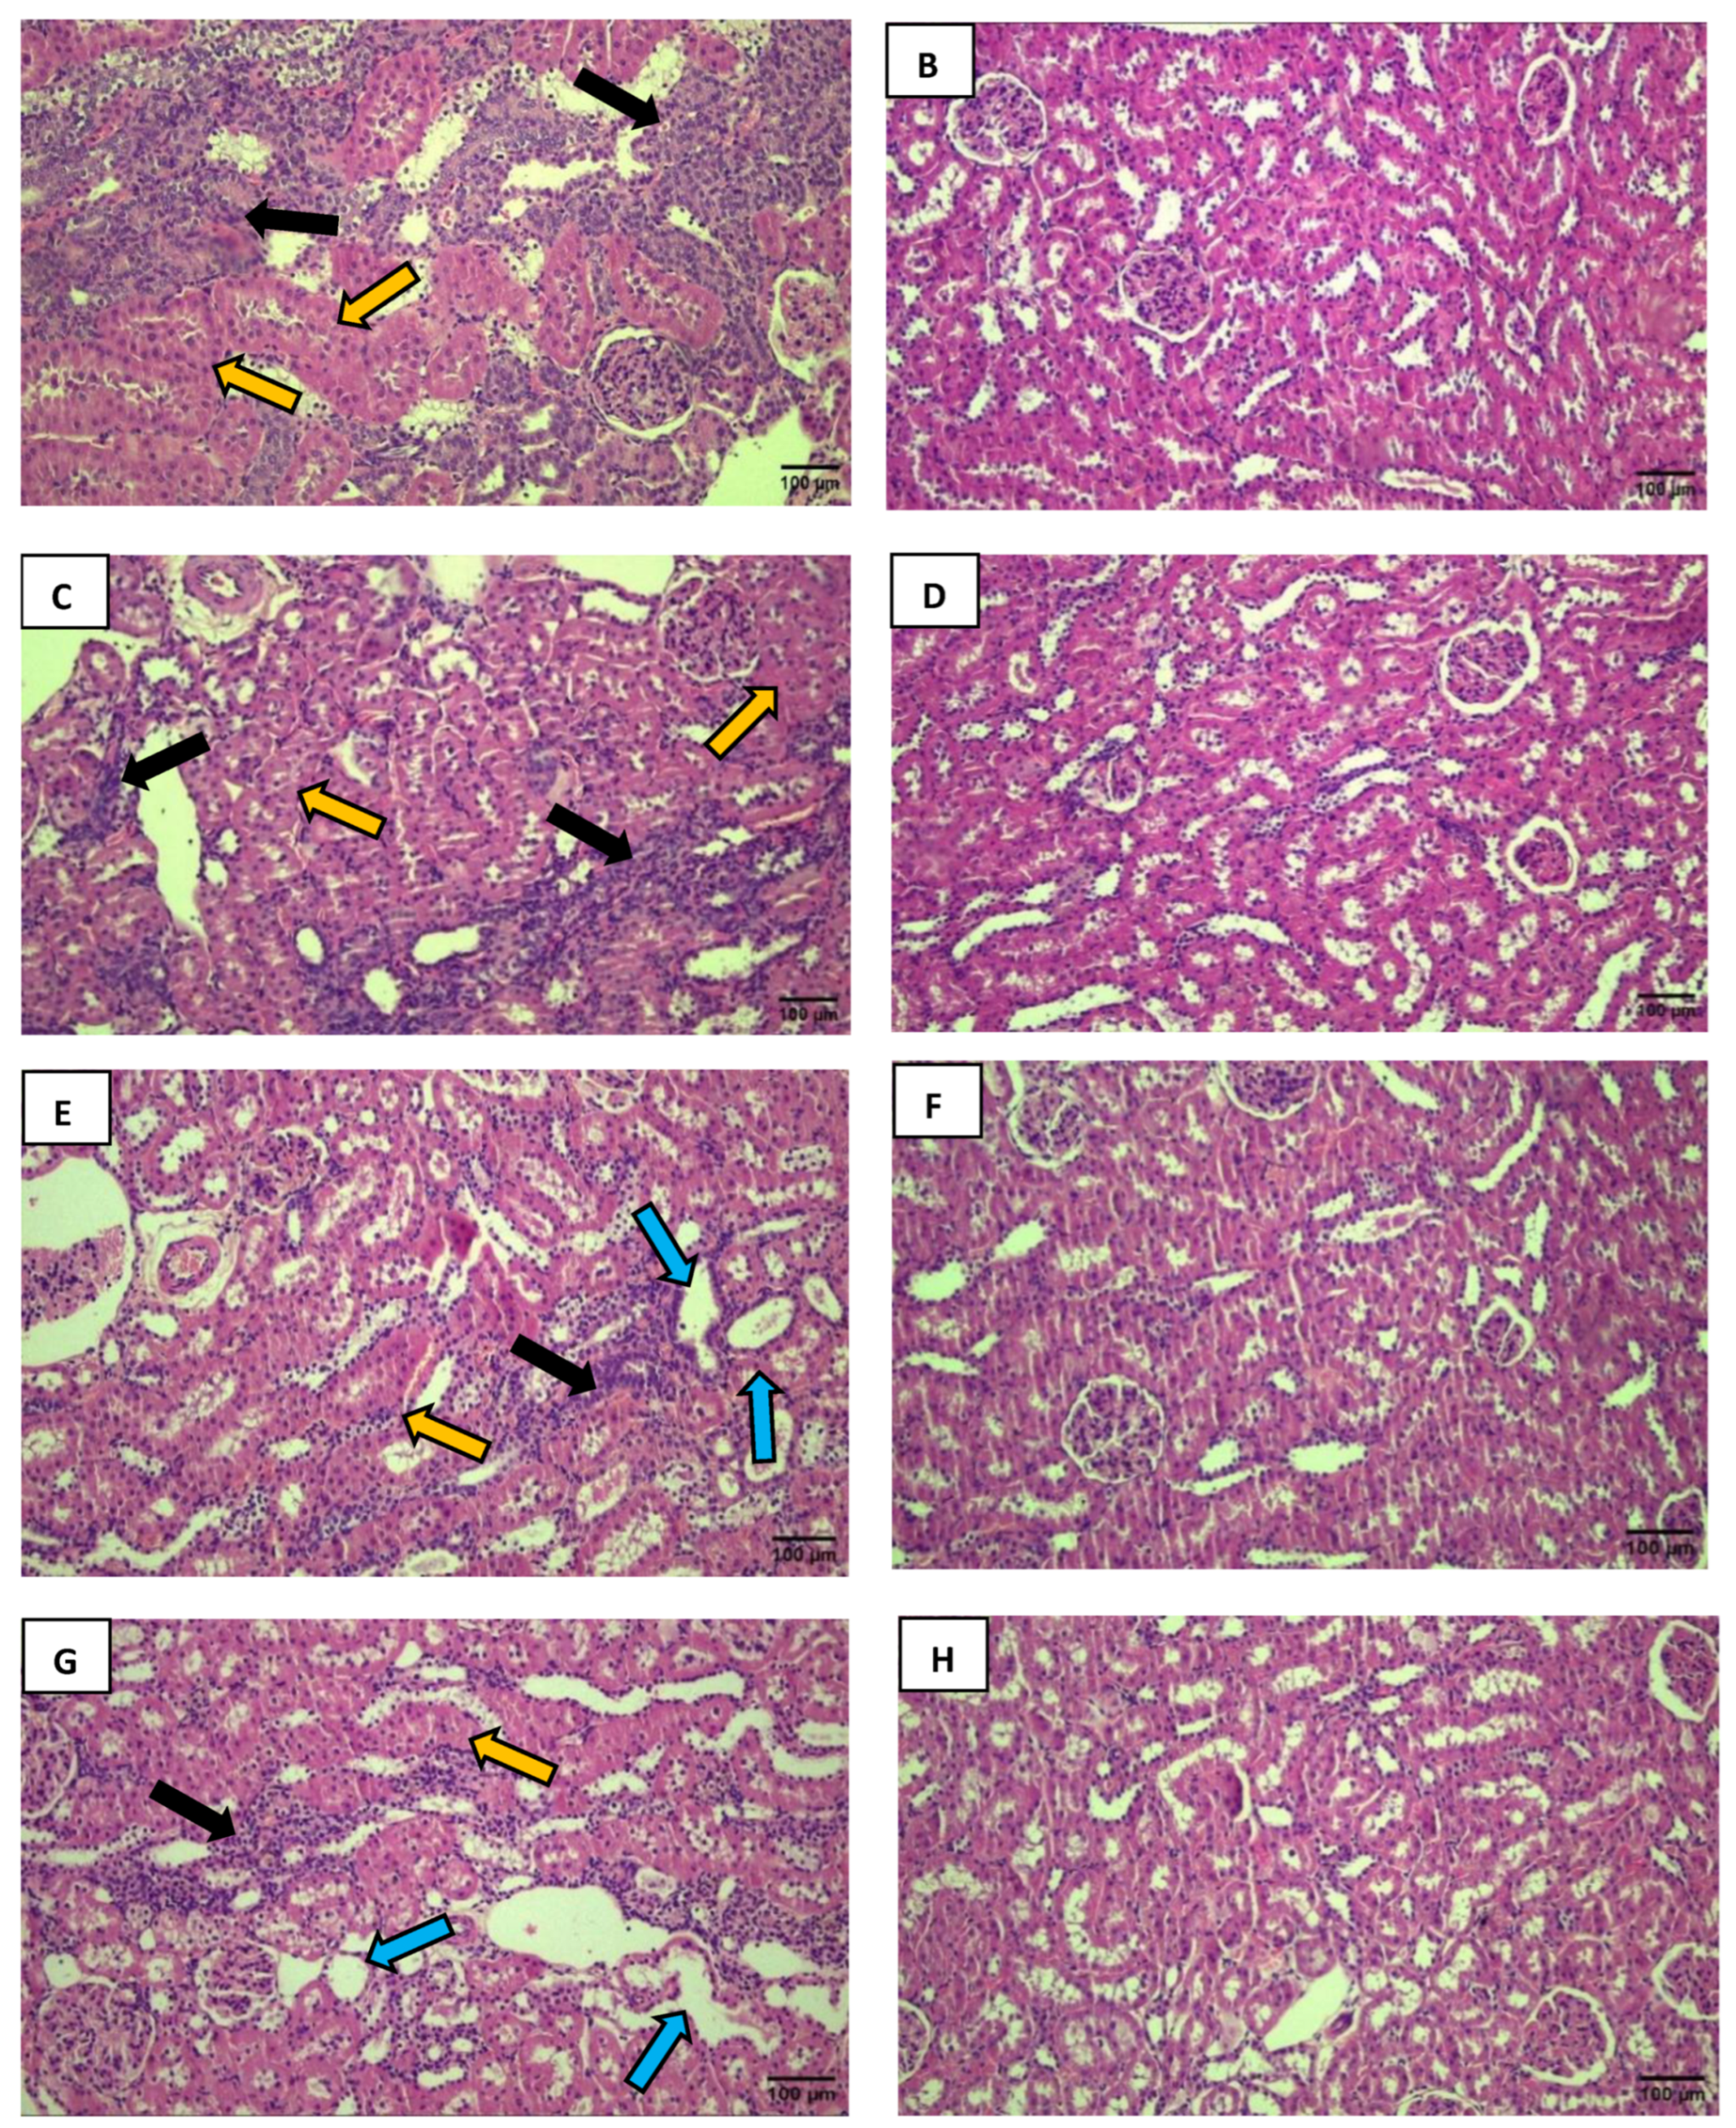
Figure 3.
The black arrows indicate a reduction in Bowman's space. The yellow arrows show the loss of visual delineation of the tubules. A decrease in Bowman's space is visible in the DMA group (A) compared to the CSA group (B). The same observation was made in the DMI group (C) compared to the CSI group (D). Excessive cellular infiltration with a loss of visual delineation of the tubules is observed in the DMA group (E) compared to the CSA group (F). Photos were captured using a Nikon Eclipse E200 microscope at 100x magnification.
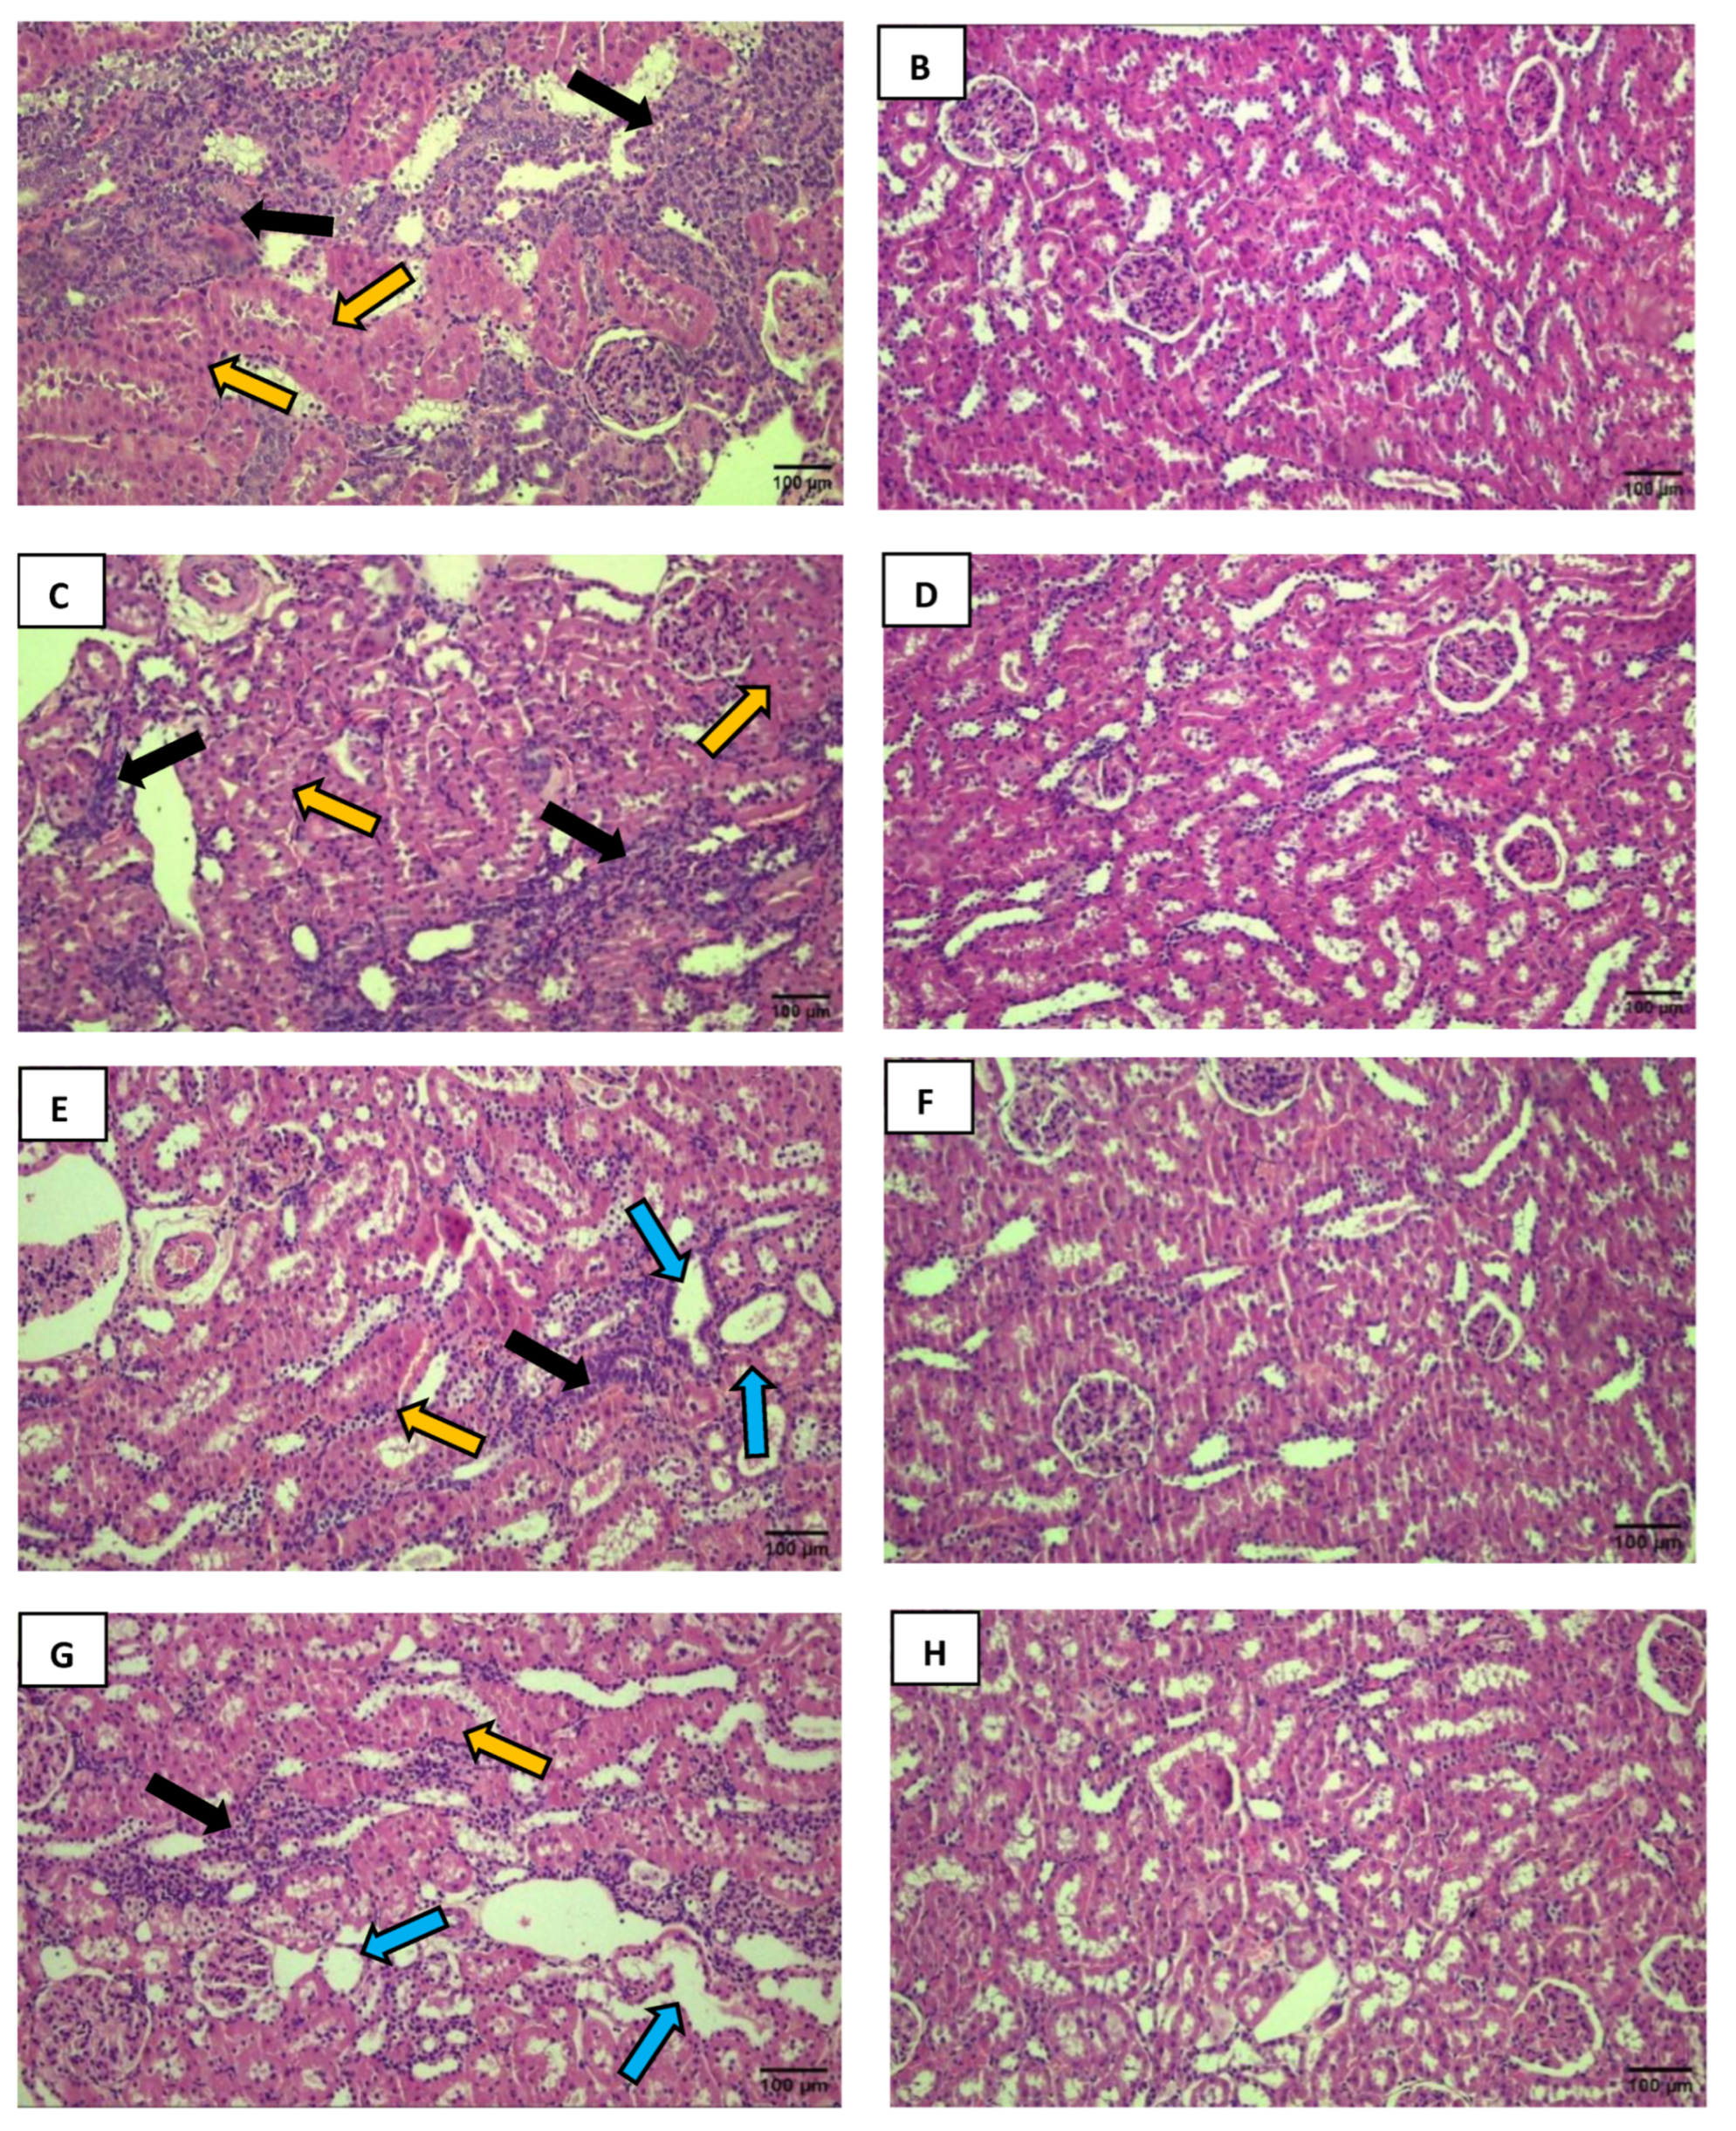
Figure 4.
Comparative graph of glomerular area between the CSA and DMA groups (A) and between the CSI and DMI groups (B). Mann-Whitney test *P < 0.05, 95% CI. Comparative representation of the mean diameter of longitudinal (C) and transverse (D) tubules between the studied groups. Tukey's Multiple Comparison Test *P < 0.0001, 95% CI.
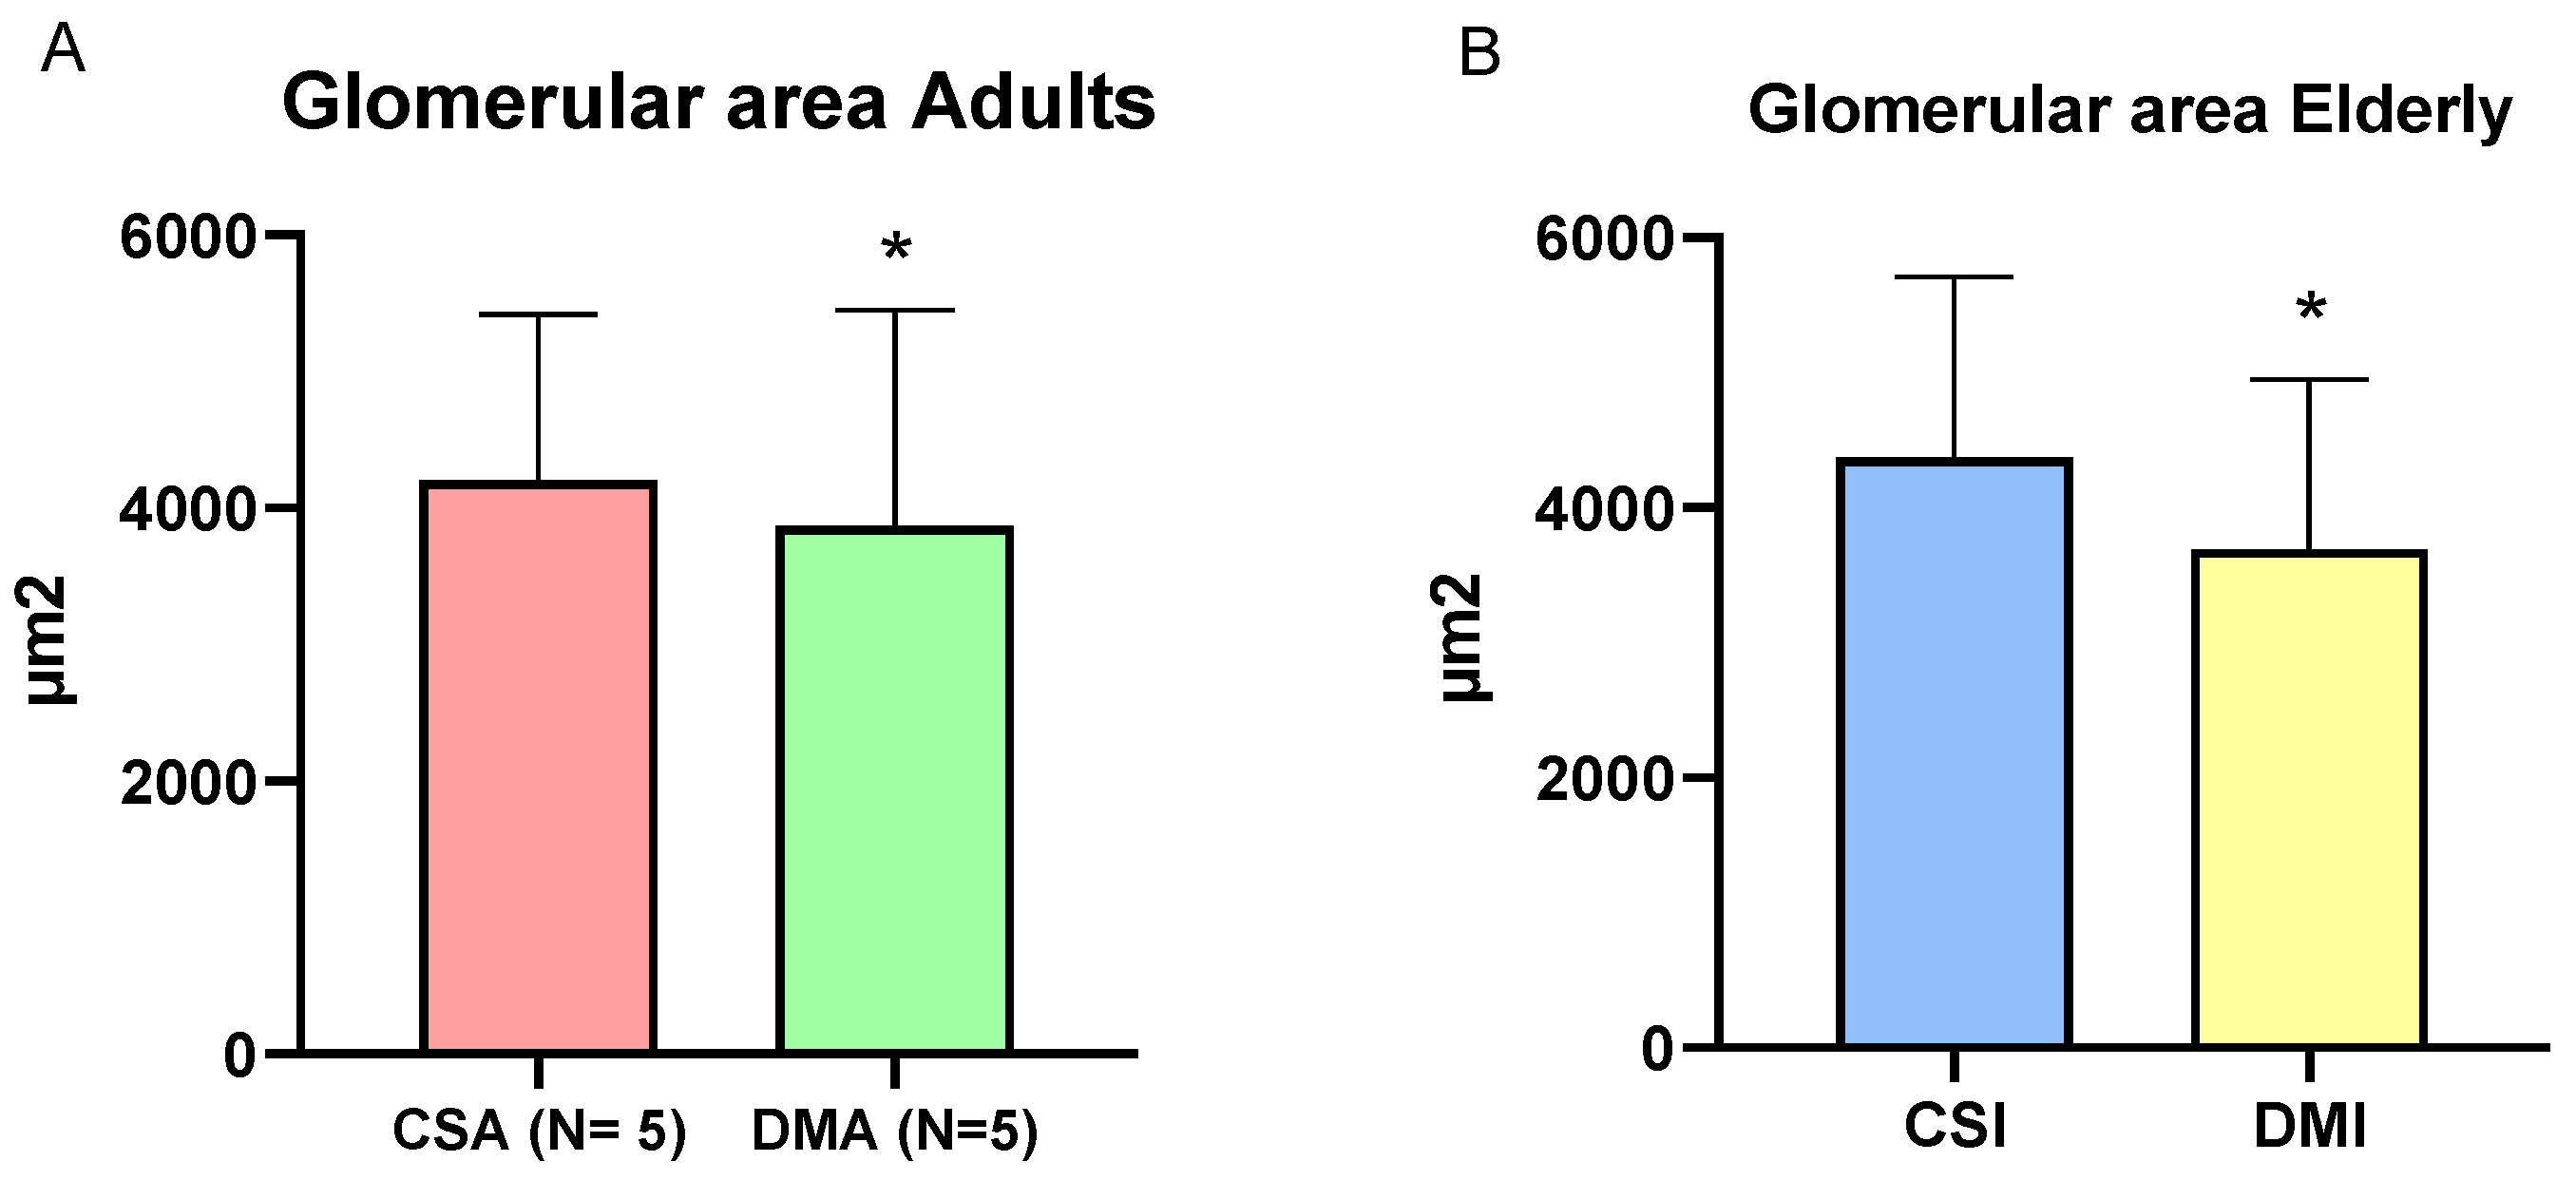
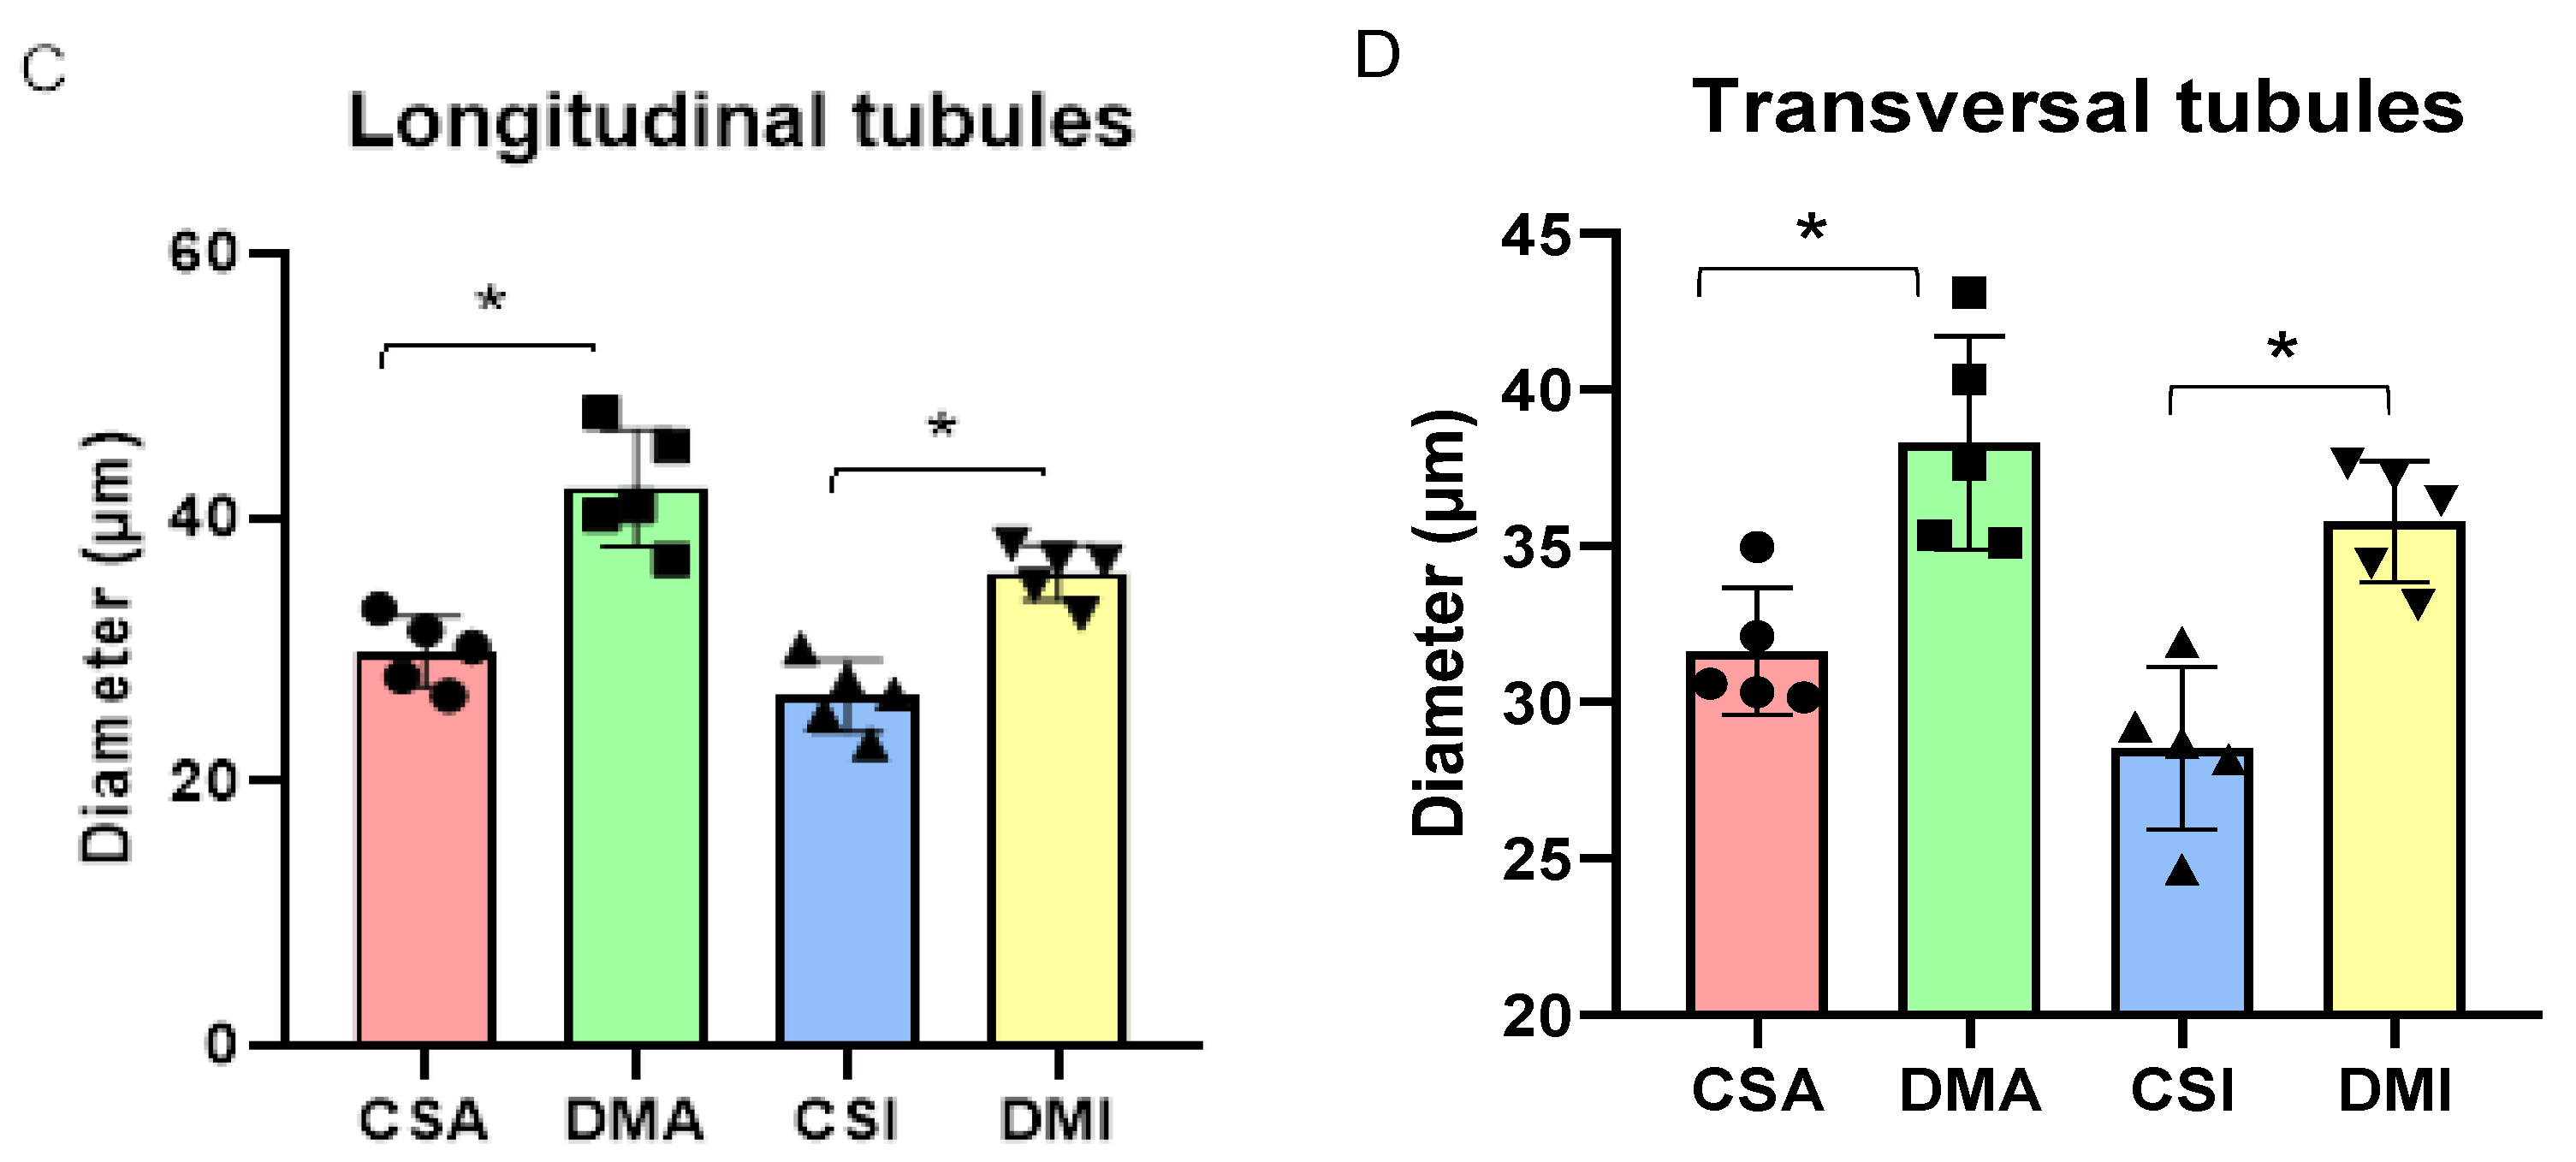

Table 1.
Biochemical paramathers in serum, plasma and urine. Values presented as mean ± DSVP and number of samples. Mann-Whitney and Student’s t-test *P <0.05. 95% CI. Reference values for Wistar rats: Glycemia: 72 – 193 mg/dL; HbA1c: 4 – 6%; Urea: 45 - 80 mg/dL; Plasma Crea.: 0.24 – 1.20 mg/dL; Urine Crea.: 32 – 97.4 mg/dL; Creatinine clearance: 0.2 – 1.8 mL/min; Proteinuria: 8.8 – 33.2 mg/dL; Apo B/A Ratio: 0.7 – 1.2 [49,50,51,52,53,54].
| Parameters | CSA | DMA | *p | CSI | DMI | *p |
|---|---|---|---|---|---|---|
| Glycemia (mg/dl) | 132,4 ± 45, n= 5 | 462,7 ± 98, n= 9 | 0,001* | 106,8 ± 9,2, n= 9 | 447,4 ± 125,7, n= 7 | 0,0002* |
| HbA1c(%) | 4,5 ± 0,2, n= 5 | 9,0 ± 2, n=8 | 0,0016* | 4,6 ± 0,05, n= 5 | 9,3 ± 1,3, n= 4 | 0,008* |
| Urea ( mg/dL) | 48,5 ± 6,9, n= 5 | 135,5 ± 38,3, n= 6 | 0,0043* | 45,4 ± 9,1, n= 9 | 93,2 ± 53,8, n= 7 | 0,023* |
|
Plasmatic Crea. (mg/dL) |
0,6 ± 0,1, n= 5 | 0,7 ± 0,1, n= 6 | 0,0065* | 0,5 ± 0,1, n= 9 | 0,7 ± 0,1, n= 7 | 0,01* |
| Urinary Crea. (mg/dL) | 60,7 ± 11,2, n=5 | 21,7 ± 10,3, n= 9 | 0,001* | 63,2 ± 40,8, n= 9 | 26,4 ± 14,5, n= 6 | 0,0360* |
|
Creatine clearance |
0,3 ± 0,2, n= 5 | 0,2 ± 0,0, n= 4 | 0,1 | 0,6 ± 0,2, n= 5 | 0,3 ± 0,1, n= 4 | 0,0317* |
|
Proteinuria (mg/dl) |
16 ± 3,1, n= 5 | 12,5 ± 2,3, n= 9 | 0,0460* | 28,3 ± 15,7, n= 9 | 19,5 ± 11,4, n= 6 | 0,11 |
| Apo B/A ratio | 1,2 ± 0,7, n= 5 | 0,8 ± 0,2, n= 6 | 0,6623 | 0,8 ± 0,3, n= 9 | 0,4 ± 0,2, n= 6 | 0,1 |
|
Ureia/creatinine ratio |
33,6 ± 4,6, n= 5 | 63 ± 20, n= 4 | 0,0145* | 63,5 ± 23,8, n= 5 | 43,7 ± 24, n= 5 | 0,54 |
Table 2.
Number of glomeruli per field and per slide and glomerular area of the studied groups. Mann-Whitney test and Student's t-test. *P < 0.05. 95% CI.
Table 2.
Number of glomeruli per field and per slide and glomerular area of the studied groups. Mann-Whitney test and Student's t-test. *P < 0.05. 95% CI.
| Age | Number of Glomeruli ± SD | P value | Variations | ||
|---|---|---|---|---|---|
| Sham Control | Diabetics | ||||
| Glomeruli per field | Adult | 49,5 ± 13; n= 5 | 40,1 ± 8,8; n= 5 | 0,0619 | - |
| Elderly | 60,5 ± 11,7; n= 5 | 44,7 ± 10,9; n= 5 | 0,0071* | ↓ | |
| Glomeruli per slide | Adult | 2,4 ± 0,6; n= 5 | 2 ± 0,4; n= 5 | 0,0619 | - |
| Elderly | 3 ± 0,6; n= 5 | 2,2 ± 0,5; n= 5 | 0,0071* | ↓ | |
Table 3.
Correlations between glomerulus count and ApoB/ApoA ratio. Spearman correlation test. *P < 0.05.
Table 3.
Correlations between glomerulus count and ApoB/ApoA ratio. Spearman correlation test. *P < 0.05.
| Group | Correlation | R value | P value |
|---|---|---|---|
| Adult | Glomeruli per slide X ApoB/ApoA, n= 5 Glomeruli per field X ApoB/ApoA, n= 5 |
-0,9750 -0,9750 |
0,0047* 0,0047* |
Disclaimer/Publisher’s Note: The statements, opinions and data contained in all publications are solely those of the individual author(s) and contributor(s) and not of MDPI and/or the editor(s). MDPI and/or the editor(s) disclaim responsibility for any injury to people or property resulting from any ideas, methods, instructions or products referred to in the content. |
© 2026 by the authors. Licensee MDPI, Basel, Switzerland. This article is an open access article distributed under the terms and conditions of the Creative Commons Attribution (CC BY) license.
Copyright: This open access article is published under a Creative Commons CC BY 4.0 license, which permit the free download, distribution, and reuse, provided that the author and preprint are cited in any reuse.


